survey design features influencing response rates in web ... · 1 survey design features...
TRANSCRIPT
1
Survey Design Features Influencing Response Rates in Web Surveys
Katja Lozar Manfreda and Vasja Vehovar
Faculty of Social Sciences, University of Ljubljana
Contact: [email protected]
In this paper we present an overview of several Web surveys. The aim of this research is to study Web
survey design characteristics that may influence participation in Web surveys (Lozar Manfreda, 2001;
Vehovar et al., 2002). Except for a few studies (whose results we present below), the previous research
has mainly studied the effect of a single factor, or a group of related factors on the response rate, while
attempting to hold all other potential factors constant. However, there may be interaction among the
factors. In addition, authors rarely define which stage of the Web survey process (Lozar Manfreda,
2001; Vehovar et al., 2002) they refer to. However, different factors may have an impact at different
stages.
Here, we propose a review of several Web surveys where distinct stages of the Web survey process are
identified. In addition, characteristics of the design of these surveys are studied simultaneously. First,
we present previous studies which draw conclusions from reviews of several Web surveys. Then, we
present the methodology used for this study, called the WebSM study. We continue by presenting
results of the WebSM study. There, several outcome rates are modelled separately.
1 PREVIOUS STUDIES
In the literature, several overviews of surveys aimed at studying factors influencing their response
rates can be found. For traditional survey modes, such reviews were done, for instance, by Baruch
(1999), Dillman (1978: 20-29), Heberlein and Baumgartner (1978), and Yu and Cooper (1983). Some
reviews were also done of Internet surveys and in this chapter we will summarize their findings.
Although the paper refers to Web surveys only, here we also include reviews of email surveys. We
believe that their findings can also be useful for Web surveys. In addition, some of the studies (e.g.,
Cook et al., 2000; Tuten et al., 2002) did not distinguish between email and Web surveys.
An extensive review of response rates in email surveys was given by Sheehan (2001). She studied the
influence of five factors (the year the study was undertaken, the number of questions in the survey, the
number of pre-notification contacts, the number of follow-up contacts and survey topic salience) on
2
response rates in 31 email surveys undertaken since 1986. Published studies utilizing email surveys
were located using online databases and examining their references. She showed that the year the
survey was undertaken and the number of follow-up contacts had the most influence on response rates:
response rates decrease with time and increase with the number of follow-ups.
Another extensive review including email and Web surveys was done by Cook et al. (2000). In the
literature they identified 68 studies with sufficient information on reported email and Web surveys.
They excluded unrestricted self-selected, intercept and other surveys for which insufficient
information with regard to the target populations and response rates was available. They showed that
the number of contacts, personalized contacts, and pre-contacts were the dominant factors positively
affecting response rates.
An overview of response rates in Web and email surveys was also done by Tuten et al. (2002);
however they did not systematically study factors influencing response rates.
Two papers report on a review of studies done by the research organization of the authors; therefore,
their analyses are rather limited. Nevertheless, their findings are interesting. Knapp and Heidingsfelder
(2001) reviewed nine unrestricted self-selected surveys done by Internet Rogator (Germany) in order
to identify factors influencing drop-out rates. They found that longer surveys, sensitive topics and lack
of incentives lead to higher drop-out rates. MacElroy (2000) reviewed 19 studies done by Modalis
Research Technology (USA) involving business-to-business technology related decisions. As in the
above study, he found that drop-out rates decrease with incentives and increase with questionnaire
length.
The above studies are rather limited. They mostly refer to some of the Web (or email) survey design
characteristics and not to the whole variety (Vehovar et al., 2002). In addition, they refer to only one
outcome rate, whether drop-out rate (Knapp and Heidingsfelder, 2001; MacElroy, 2000) or response
rate defined as a percentage of respondents among the target population (Cook et al., 2000). However,
the Web survey response process has several distinct stages and several outcome rates can be defined
(Lozar Manfreda, 2001; Lozar Manfreda et al., 2002b; Vehovar et al., 2002). The proposed study
described below overcomes these limitations. A larger variety of independent variables influencing
response is used and several outcome rates are modelled separately.
2 METHODOLOGY OF WEBSM STUDY
Usually, a meta-analysis is used to study the effect of different factors on survey response rates. The
meta-analysis is a coherent set of quantitative methods for reviewing research literature. With this

3
analysis we combine quantitative findings from known research on a particular, well-defined question
using statistical analysis. The typical steps in such research are: a precise definition of the research
problem, data collection (i.e., collection of relevant articles or papers), coding of the variables of
interest, and statistical analysis. Cases (rows) in the prepared data matrix are the research studies of
interest to which statistical methods are applied. This distinguishes meta-analysis from the more
traditional, narrative forms of literature review (de Leeuw and van der Zouwen, 1983: 284). Another
important aspect of meta-analysis is that there is no element of quality evaluation of the studies
examined (Baruch, 1999).
A more strict approach to meta-analysis also requires examined studies to use experiments, therefore
some associations measured (Glass et al., 1981: 21). However, the studies of factors influencing
response rates usually examine other studies, which do not necessarily conduct experiments on
response rates. They do not utilize a group that controls a particular influence and a group that tests the
influence in order to measure the magnitude of the effect (experimental and control group). Such
studies are therefore called ‘metacontent-analysis’ by Baruch (1999), since they do not examine
associations but rather individual numbers, e.g., response rates in this case1.
Metacontent approaches to studying factors influencing survey (non)response, therefore, traditionally
starts with a collection of relevant papers using online databases and references of collected papers.
Individual studies are then extracted from these papers. No attempt to evaluate the quality of these
studies is made. Usually, papers report on one study; however several studies can also be reported
simultaneously. Individual studies are then taken as cases of interest. Next, coding of dependent
variables (i.e., response rate) and several independent variables (i.e., factors influencing response
rates) is done. In addition, background variables, such as year of publication and source of publication
are usually coded. Usually, regression analysis is done with response rate as the dependent variable
and factors influencing this rate as predictor (independent) variables.
The study proposed here closely follows the described procedure of the metacontent approach with
one distinct difference: individual Web surveys of interest were not identified through the literature
search; instead, a questionnaire among professionals conducting Web surveys was used. This approach
– i.e., a survey about other surveys – is not new in the research literature. For example, Christianson
and Tortora (1995: 239) report on a survey of twenty-one statistical agencies, a project which was
aimed at obtaining information regarding several broad topics concerning the business surveys and
censuses they conducted. For Web surveys too, this approach has already been used: Göritz et al.
1 The authors nevertheless call their approaches ‘meta-analysis’ (for example, Heberlein and Baumgartner, 1978 or Cook et al., 2000). On the other hand, at least two authors of studies on factors influencing survey response, e.g., Sheehan (2001) and Baruch (1999), admit not using a strict meta-analytical approach.

4
(2002) interviewed Web panel administrators (n=64) in order to find out response rates in their panel
Web surveys and also other characteristics of their panels. However, while these studies were asking
about surveys in general, in our questionnaire we asked survey professionals to report on specific Web
surveys.
We decided not to use the traditional literature search for identifying Web surveys of interest owing to
limited information on response rates, limited information regarding individual stages of the Web
survey process, and limited description of the Web survey design characteristic that can be obtained
from the literature.
The habit of reporting on response rates as a measure of data quality when using data for Web surveys
has not yet been accepted as a standard, and response rates are therefore not always reported. When
response rates are reported, only rarely are explicit definitions of outcome categories used to calculate
them given. When explicit definitions are given, a comparison across authors shows that they often use
different terms for the same measures, or even worse, the same terms for different measures. The
obtained measures of response rates in Web surveys from the literature are therefore rather limited.
In addition, the Web survey process is complex with several distinct stages for different types of Web
surveys. Non-response occurs at all of these stages and different factors influence it. However, in the
literature, the authors rarely refer to the distinct stages of this process (except for Deutschmann and
Faulbaum, 2001; Bosnjak, 2001; Bosnjak and Bandilla, 2000; Bosnjak and Tuten, 2001; Lozar
Manfreda et al., 2002b; Vehovar et al., 2002: 235; Wiebe et al., 2001) further limiting the available
range of studies.
Additional limitation stems from scarce descriptions of the Web survey design characteristics and
countries of respondents’ origin (which could suggest some possible characteristics of the social and
technological environment).
Of course, not all papers on Web surveys offer limited information on response and design of Web
surveys. Therefore some limited traditional type of metacontent analysis could be performed.
However, using a questionnaire among professionals conducting Web surveys was convenient. Of
course, a Web questionnaire was used, thus keeping the costs of data collection at a minimum.
Professionals (hereafter called reporters) were invited to the survey using email or through invitations
on some discussion lists. The study was presented as the WebSM study relating to the well-known
WebSM site (www.websm.org) as a resource on Web survey methodology regularly visited by
professionals conducting Web surveys. Therefore a level of cooperation from them was expected
sufficient to perform the desired analysis. In addition, use of a survey questionnaire prepared
5
specifically for this purpose allows the collection of far more detailed information on Web survey
design and response at distinct stages of the Web survey process. This enables a richer analysis of
factors influencing response rates in Web surveys than would be obtained through a literature review.
2.1 Research problem
The aim of the WebSM study is to identify factors influencing response rates in Web surveys by
studying the survey design of several surveys where a questionnaire on the Web was used. The
following research questions is asked: What kind of Web surveys gain high response rates and/or
which aspects of their implementation are crucial?
The information needed to calculate the following outcome rates was asked in the WebSM
questionnaire: 1. Co-operation rate at the pre-recruitment stage, for pre-recruited Web surveys: the percentage of
respondents providing contact information in the pre-recruitment telephone survey among all asked to
provide this information.
2. Failure rate for Web surveys with individual invitations: the percentage of undeliverable invitations among
all invitations.
3. Click-through rate for all types of Web surveys: the percentage of units accessing the Web questionnaire
among all invited or exposed to invitations.
4. Overall completion rate for all types of Web surveys: the percentage of all (partial and complete)
respondents among all invited or exposed to invitations. If only the number of complete respondents was
reported, it was assumed that the distinction among partial and complete respondents was not made. In these
cases, only complete respondents were included in overall completion rate.
5. Drop-out rate for all types of Web surveys: the percentage of those who prematurely abandoned the
questionnaire, i.e., the percentage of partial respondents among all respondents.
The characteristics of the survey design are used as explanatory variables in predicting these outcome
rates.
2.2 Data collection
As has already been established, a questionnaire on the Web was used to survey researchers using
Web surveys in their everyday work. The survey is associated with the Web Survey Methodology
(WebSM) Web site (www.websm.org) maintained by the Faculty of Social Sciences, University of

6
Ljubljana. The WebSM site’s mission is to collect and link all relevant information on Web survey
methodology. The site thus relates to all surveys where a Web questionnaire is used, regardless of the
type. It links other Web sites offering content related to surveys on the Web: information on
conferences, papers, software, solutions, panels, and discussions. Over the last few years the site has
been presented at some of the largest international conferences on survey methodology and/or
statistical analysis. Response from visitors has been positive, particularly owing to the extensive
bibliographic references, which constitute the largest source of references in this field. During the
period from September 2000 to October 2001 around a thousand unique visitors were recorded
monthly. We receive roughly 10-20 email messages from visitors every month, requesting additional
information, giving information that might be included, informing us of changes regarding referenced
subjects, or simply offering congratulations on the usefulness of the site. Because of all this, sufficient
cooperation from Web survey professionals was expected to perform this WebSM study.
In the WebSM Web questionnaire, researchers - respondents - were asked to report on a particular
Web survey that they performed. They were asked detailed questions on the survey design (sample
selection, solicitation methods, incentives, non-response conversion, identification of respondents,
survey topic, target population, research organization, questionnaire design, etcetera) and on the
response for the different stages of the Web survey process.
The WebSM study was first announced among survey researchers at the International Conference on
Social Science Methodology in Cologne, Germany, in October 2000. The official announcement at the
WebSM site started in February 2001. The study was presented and visitors were invited to register for
the study by sending us an email message. In August 2001 the study officially started. Data collection
was finished by mid November 2001.
We invited potential participants to the WebSM study in several ways: 1. Email invitations (with two follow-ups for non-respondents) were sent to companies offering panels or
solutions for Web surveys that are listed on the WebSM site. The email address of the contact person was
either obtained from their Web site, or known from their email messages directed to us as the WebSM site
editors in the last two years. Invitations were therefore sent to 135 companies and their sub-offices2.
2. Email invitations (with two follow-ups for non-respondents) were sent to 394 individuals for whom we
assumed that they conduct Web surveys. Their email addresses were obtained in several ways:
− 178 email addresses for authors of papers on Web surveys that are listed on the WebSM site were obtained
by following hypertext links to Web sites including information on the papers, searching the Web sites of
2 In some cases, several email invitations were sent to an individual office, since the email address of the person responsible for Web surveys was not known. Therefore more than 135 email invitations were actually sent.
7
the institutions of authors’ origin, checking authors’ contact information from conference publications,
etcetera;
− 14 participants registered for the WebSM study following the link on the WebSM site and left their email
address;
− Email addresses of other individuals were collected by following discussions on Web surveys in online
discussion lists listed at the WebSM site. In addition, some people contacted us as the WebSM site editors
through email in the last two years. Altogether 207 email addresses were collected in this way.
3. A general announcement of the study was published in some online discussion lists (ELMAR3, GIR-L4,
EVALTALK5, PsychResearch Online6, Air-l mailing list7) potentially visited by people conducting surveys
using Web questionnaires.
4. Some participants decided to participate themselves after noticing the invitation at the WebSM site.
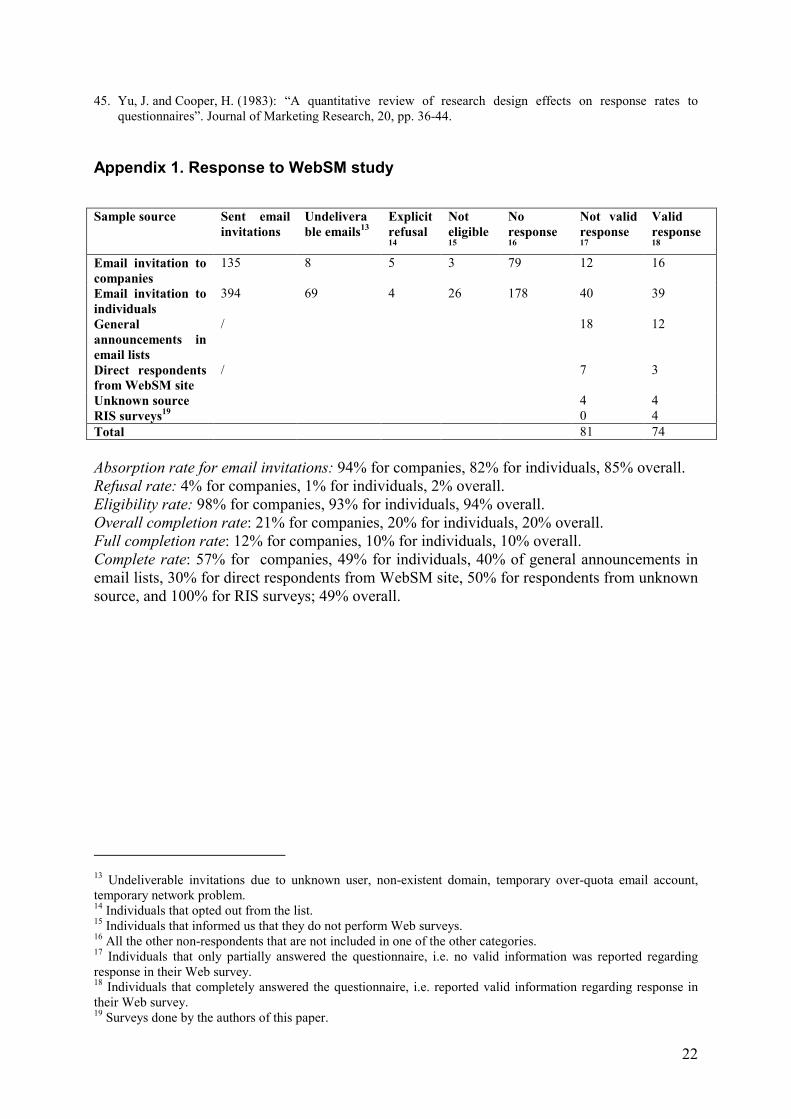
Response was obtained from 155 individuals. Detailed analysis of response is presented in Appendix
1. In over half of these cases response was only partial, i.e., information on response rates in reported
Web surveys was not obtained. Data from 74 reporters were finally included in the analysis. In some
of the cases the reported Web surveys were a combination of several types, with different invitation
methods used for respondents. Where reporters were able to report on response for each individual
method, a Web survey with each individual invitation method was counted as a case for analysis.
Therefore 102 cases – counted as individual Web surveys – (5 of them conducted by the authors of this
paper, called the RIS surveys) are finally analysed.
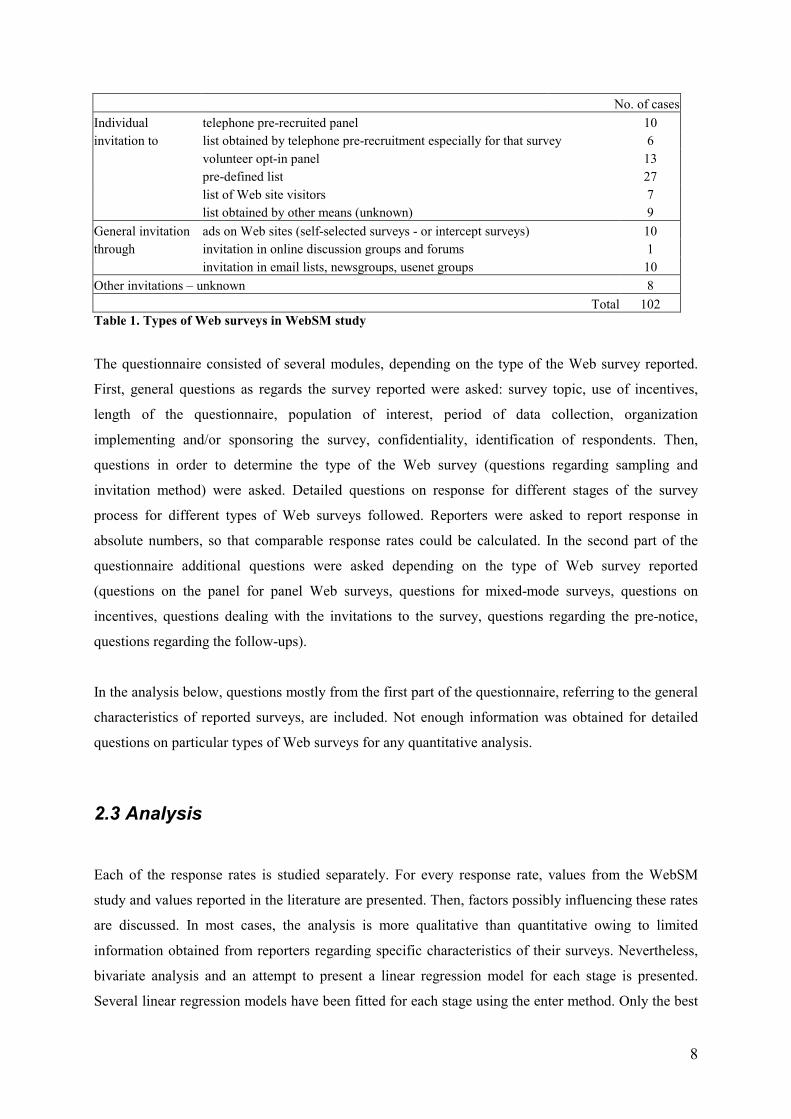
Table 1 presents the number of cases for each type of Web surveys as regards the type of solicitation
used. For some cases, the type could not be exactly defined. 40% of reported surveys were
implemented within a mixed-mode design. Reporters were asked to report only on that part of the
sample which was administered the Web mode, as if this was an individual survey.
3 ELMAR is a moderated electronic mail network for marketing academics, owned by American Marketing Association. See www.marketingpower.com for more information. 4 GIR-L is a German Internet Research Mailing list, an unmoderated mailing list on all aspects of Internet-based studies operated by the German Society for Online Research. See www.online-forschung.de/index.htm/gir-l/ (note: Websiteand Mailingslist in German only) for more information. 5 EVALTALK is an open, unmoderated list for general discussion of evaluation and associated issues sponsored by the American Evaluation Association. For more information, see www.eval.org/ListsLinks/ElectronicLists/evaltalk.html. 6 PsychResearch Online is a mailing list related to psychology of the Internet. It can include topics such as: how to conduct psychological research via the Internet, the theory behind virtual support groups, online psychotherapy (e-therapy), Internet addiction disorder’, psychology of various online phenomena, such as flame wars, relationships, etcetera. For more information, see groups.yahoo.com/group/psy-internet. 7 Air-l mailing list is maintained by the Association of Internet Researchers, e.g., an international academic association dedicated to the advancement of the cross-disciplinary field of Internet studies. See www.aoir.org/mailman/listinfo/air-l for more information.
8
No. of casesIndividual telephone pre-recruited panel 10 invitation to list obtained by telephone pre-recruitment especially for that survey 6 volunteer opt-in panel 13 pre-defined list 27 list of Web site visitors 7 list obtained by other means (unknown) 9 General invitation ads on Web sites (self-selected surveys - or intercept surveys) 10 through invitation in online discussion groups and forums 1 invitation in email lists, newsgroups, usenet groups 10 Other invitations – unknown 8
Total 102 Table 1. Types of Web surveys in WebSM study The questionnaire consisted of several modules, depending on the type of the Web survey reported.
First, general questions as regards the survey reported were asked: survey topic, use of incentives,
length of the questionnaire, population of interest, period of data collection, organization
implementing and/or sponsoring the survey, confidentiality, identification of respondents. Then,
questions in order to determine the type of the Web survey (questions regarding sampling and
invitation method) were asked. Detailed questions on response for different stages of the survey
process for different types of Web surveys followed. Reporters were asked to report response in
absolute numbers, so that comparable response rates could be calculated. In the second part of the
questionnaire additional questions were asked depending on the type of Web survey reported
(questions on the panel for panel Web surveys, questions for mixed-mode surveys, questions on
incentives, questions dealing with the invitations to the survey, questions regarding the pre-notice,
questions regarding the follow-ups).
In the analysis below, questions mostly from the first part of the questionnaire, referring to the general
characteristics of reported surveys, are included. Not enough information was obtained for detailed
questions on particular types of Web surveys for any quantitative analysis.
2.3 Analysis
Each of the response rates is studied separately. For every response rate, values from the WebSM
study and values reported in the literature are presented. Then, factors possibly influencing these rates
are discussed. In most cases, the analysis is more qualitative than quantitative owing to limited
information obtained from reporters regarding specific characteristics of their surveys. Nevertheless,
bivariate analysis and an attempt to present a linear regression model for each stage is presented.
Several linear regression models have been fitted for each stage using the enter method. Only the best
9
fitted model (in terms of explained variance, significance of the model and interpretability) is finally
presented. For each model, actual values and valued obtained from the model are compared in order to
additionally evaluate the fit of the model.
3 NON-RESPONSE IN WEB SURVEYS
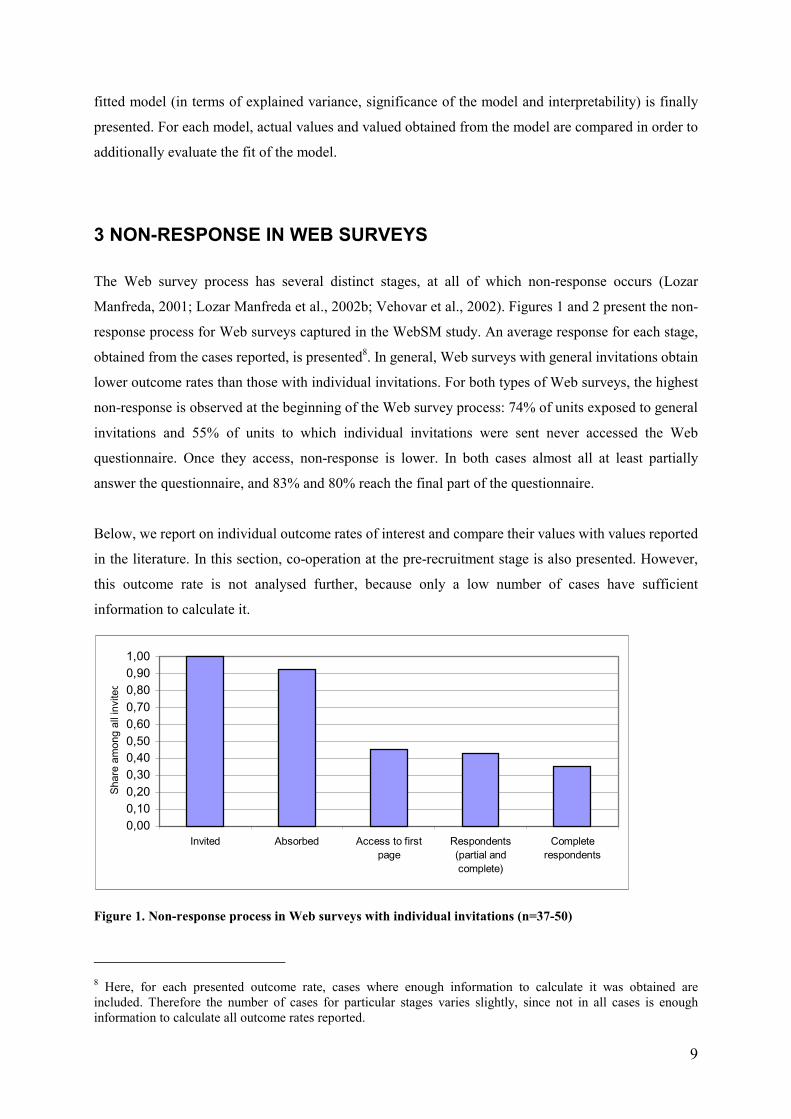
The Web survey process has several distinct stages, at all of which non-response occurs (Lozar
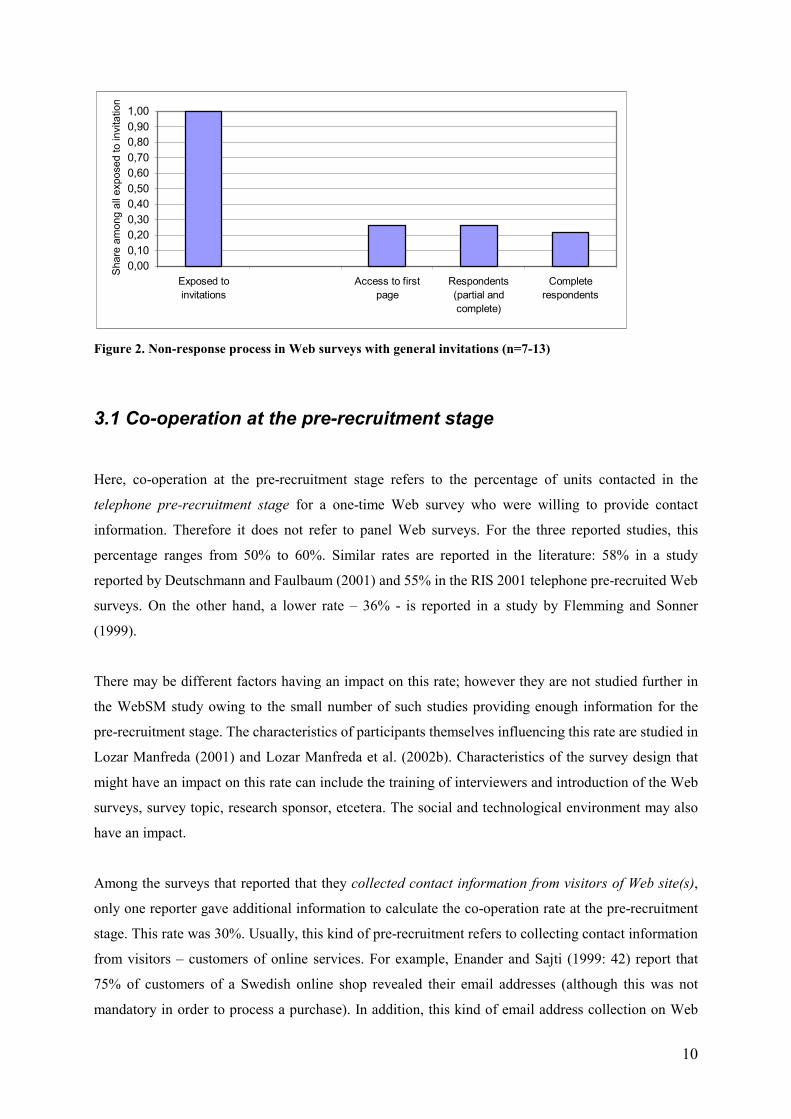
Manfreda, 2001; Lozar Manfreda et al., 2002b; Vehovar et al., 2002). Figures 1 and 2 present the non-
response process for Web surveys captured in the WebSM study. An average response for each stage,
obtained from the cases reported, is presented8. In general, Web surveys with general invitations obtain
lower outcome rates than those with individual invitations. For both types of Web surveys, the highest
non-response is observed at the beginning of the Web survey process: 74% of units exposed to general
invitations and 55% of units to which individual invitations were sent never accessed the Web
questionnaire. Once they access, non-response is lower. In both cases almost all at least partially
answer the questionnaire, and 83% and 80% reach the final part of the questionnaire.
Below, we report on individual outcome rates of interest and compare their values with values reported
in the literature. In this section, co-operation at the pre-recruitment stage is also presented. However,
this outcome rate is not analysed further, because only a low number of cases have sufficient
information to calculate it.
Figure 1. Non-response process in Web surveys with individual invitations (n=37-50)
8 Here, for each presented outcome rate, cases where enough information to calculate it was obtained are included. Therefore the number of cases for particular stages varies slightly, since not in all cases is enough information to calculate all outcome rates reported.
0,000,100,200,300,400,500,600,700,800,901,00
Invited Absorbed Access to firstpage
Respondents(partial andcomplete)
Completerespondents
Shar
e am
ong
all i
nvite
d
10
Figure 2. Non-response process in Web surveys with general invitations (n=7-13)
3.1 Co-operation at the pre-recruitment stage
Here, co-operation at the pre-recruitment stage refers to the percentage of units contacted in the
telephone pre-recruitment stage for a one-time Web survey who were willing to provide contact
information. Therefore it does not refer to panel Web surveys. For the three reported studies, this
percentage ranges from 50% to 60%. Similar rates are reported in the literature: 58% in a study
reported by Deutschmann and Faulbaum (2001) and 55% in the RIS 2001 telephone pre-recruited Web
surveys. On the other hand, a lower rate – 36% - is reported in a study by Flemming and Sonner
(1999).
There may be different factors having an impact on this rate; however they are not studied further in
the WebSM study owing to the small number of such studies providing enough information for the
pre-recruitment stage. The characteristics of participants themselves influencing this rate are studied in
Lozar Manfreda (2001) and Lozar Manfreda et al. (2002b). Characteristics of the survey design that
might have an impact on this rate can include the training of interviewers and introduction of the Web
surveys, survey topic, research sponsor, etcetera. The social and technological environment may also
have an impact.
Among the surveys that reported that they collected contact information from visitors of Web site(s),
only one reporter gave additional information to calculate the co-operation rate at the pre-recruitment
stage. This rate was 30%. Usually, this kind of pre-recruitment refers to collecting contact information
from visitors – customers of online services. For example, Enander and Sajti (1999: 42) report that
75% of customers of a Swedish online shop revealed their email addresses (although this was not
mandatory in order to process a purchase). In addition, this kind of email address collection on Web
0,000,100,200,300,400,500,600,700,800,901,00
Exposed toinvitations
Access to firstpage
Respondents(partial andcomplete)
Completerespondents
Shar
e am
ong
all e
xpos
ed to
invi
tatio
n

11
sites is also used in Web surveys conducted in two phases. At the first phase, a self-selected Web
survey is done using general invitations on a Web site. There, email addresses of respondents are
collected for the second phase of the survey. In the literature, authors report such an email collection
rate to range from 32% (Kottler, 1997) to 62% (Flemming and Sonner, 1999). Similarly, in the RIS
2001 self-selected Web survey, 63% of respondents were willing to provide their email addresses for
future participation.
3.2 Failure rate
Failure rate was calculated for 38 Web surveys with individual invitations where sufficient
information was obtained. For these cases, it ranges from 0% to 33%, with an average of 6%. As
would be expected, this rate is higher for email (32 cases) than for mail invitations (6 cases) (7%
versus 2%)9 since errors in the email address spelling are fatal, while errors in mail address may not
necessarily prevent the invitation from being delivered to the right person.
Failure rates of email invitations reported in the literature similarly range from 1% to 5% for well-
defined samples (students in Kwak and Radler, 1999; university staff in Jones and Pitt, 1999: 557;
Lesser and Newton, 2001), to somewhat higher rates of 7% to 17% in less well-defined samples (when
email addresses are collected from Web sites or in first phase Web survey, Enander and Sajti, 1999:
41; Flemming and Sonner, 1999; Schillewaert et al., 1998; or in telephone pre-recruitment for one-
time Web survey; Vehovar et al., 2000).
When email invitations are used, the failure rate shows the quality of the sampling frame. For surveys
in the WebSM study, this rate is on average the highest (16%) for the 5 cases where email addresses
were obtained by participants themselves typing them in. When interviewers typed them down in a
pre-recruitment stage (10 cases) or when they were taken from an already existing list (13 cases), this
rate was on average only 5% and 7%, respectively10.
Bivariate analyses show a significant correlation between the technical experience of the research
organization and the failure rate (Pearson correlation coefficient r=0.354, p=0.035, n=36): the larger
the technical experience of the research organization (as estimated by reporters themselves), the
smaller the failure rate.
9 The difference is not statistically significant. 10 Here, the difference between the 1st and the 2nd group (16% vs. 5%) is statistically significant at p=0.093. The difference for the other two pairs is not statistically significant.
12
Other variables, such as type of target population, their home country, type of research organization,
its methodological experience, and whether the reported survey is a panel survey or not did not show
statistically significant correlations with the failure rate. However, when correlations among these
predictors are taken into account, e.g., by including them into a linear regression model, some of the
categories become important, as presented further on.
3.3 Click-through rates
Click-through rates referring to the percentage of participants accessing the Web questionnaire among
all sent invitations or those exposed to invitations was calculated for all types of Web surveys in the
WebSM study. For the cases with sufficient information obtained in the WebSM study (54 cases), this
rate is highly variable, ranging from 1% to 96%, with an average of 48%. Telephone pre-recruited
samples seem to obtain the highest click-through rates (75% for 3 one-time telephone pre-recruited
surveys and 69% for 4 panels), following the 52% click-through rate for 16 reported pre-defined
samples. The lowest click-through rates are characteristic of 7 reported Web surveys with general
invitations such as banner ads, pop-up windows or textual hyperlinks (18%).
In general, bivariate analyses show statistically significant click-through rates between Web surveys
with general (7 cases) and Web surveys with individual invitations (43 cases). The first obtained an
average click-through rate of 25%, while the others 49% (difference significant at p=0.055). Since
only 7 reported Web surveys with general invitations revealed enough information to calculate the
click-through rates, further analysis is done only for surveys with individual invitations.
For Web surveys with individual invitations, additional bivariate analyses show that pre-notice is an
important predictor of click-through rate. Surveys with pre-notice (19 cases) on average obtained a
click-through rate of 62%, while those without the pre-notice (20 cases) only 35% (difference is
statistically significant at p=0.005). Other bivariate analyses do not show significant correlations;
however additional factors become important when the interactions among them are taken into account
in a multivariate analysis presented below.
Similarly variable are click-through rates reported in the literature. They range from only few percents
in self-selected Web surveys (Schillewaert et al., 1998; Tuten et al., 1999/2000: 19; Venter and
Prinsloo, 1999: 221) to somewhat higher rates (over 20%) when more targeted invitations are used
(Bauman et al., 2000; Bosnjak, 2001: 201; De Angelis, 2001; Dillman, 2000: 374; Vehovar et al.,
2000; Vehovar et al., 2002: 231; Venter and Prinsloo, 1999:219; Weible and Wallace, 1998).

13
3.4 Completion rates
Overall completion rates, referring to partial and complete respondents, range from 1% to 95%
(average 42%) for 89 reported cases. This extreme variability is due to many factors, some of which
are suggested below. As with the click-through rates, the highest completion rates are characteristics of
telephone pre-recruited samples (63-67% in 9 cases) and the lowest for volunteer opt-in panels (26%
in 13 cases) and Web surveys with general invitations (25%-28% in 14 cases).
Full completion rates referring to complete respondents only (those who reached the final part of the
questionnaire) among all sent invitations or exposed to invitations are, of course, somewhat lower,
however also highly variable (for 89 cases they range from 1% to 90%, with an average of 39%). Full
completion rates may be influenced not only by factors influencing response in general, but also by
specific factors influencing drop-outs from the questionnaire. Since drop-out rates are modelled
separately, only overall (and not full) completion rates are discussed here.
Bivariate analysis shows that 69 Web surveys with individual invitations obtain significantly higher
overall completion rates than 14 surveys with general invitations (45% vs. 26%, p=0.037). For Web
surveys with individual invitations, the use of pre-notice again significantly increase response: 27
surveys with pre-notice obtained on average an overall completion rate of 55% while 36 surveys
without pre-notice only 37%. Bivariate analysis does not show any other variable as influencing
overall completion rates.
In the literature, authors often speak about response rates; however they do not define how these were
calculated. We assume that most often they actually refer to completion rates including partial and
complete respondents. Response rates taking into account eligibility of units, are actually difficult or
even impossible to calculate in Web surveys. Completion rates reported in the literature thus vary from
less than 1% to just a few percents for very general self-selected Web surveys (Schillewaert et al.,
1998; Venter and Prinsloo, 1999: 221) to higher percentages, even as high as 78% in the case of
telephone pre-recruited panels11 (Wiebe et al., 2001). When authors report on average response rates
obtained by their survey organizations, they usually stress that response rates are variable, depending
on several survey design characteristics (Comley, 2000: 329; Göritz et al., 2002: 48; Hollis, 1999: 46;
Terhanian 2000; Venter and Prinsloo, 1999: 219).
11 Pre-recruitment response rates are not accounted for here.
14
In the studies where a distinction between partial and complete respondents is reported, the difference
between overall and full completion rates ranges from 2% to 8% (Couper et al., 1999; Elder and
Incalcatera, 2000: 162; Liu et al., 2001: 10-23; Venter and Prinsloo, 1999: 219), suggesting that drop-
out rates also need consideration.
3.5 Drop-out rates
For the 68 Web surveys with sufficient information obtained in the WebSM study the drop-out rates
referring to partial respondents among all respondents (complete and partial) range from 0% to 73%,
with an average of 16%. Again, 13 Web surveys with general invitation experience higher drop-out
rates than 50 Web surveys with individual invitations (28% versus 14%, p=0.018).
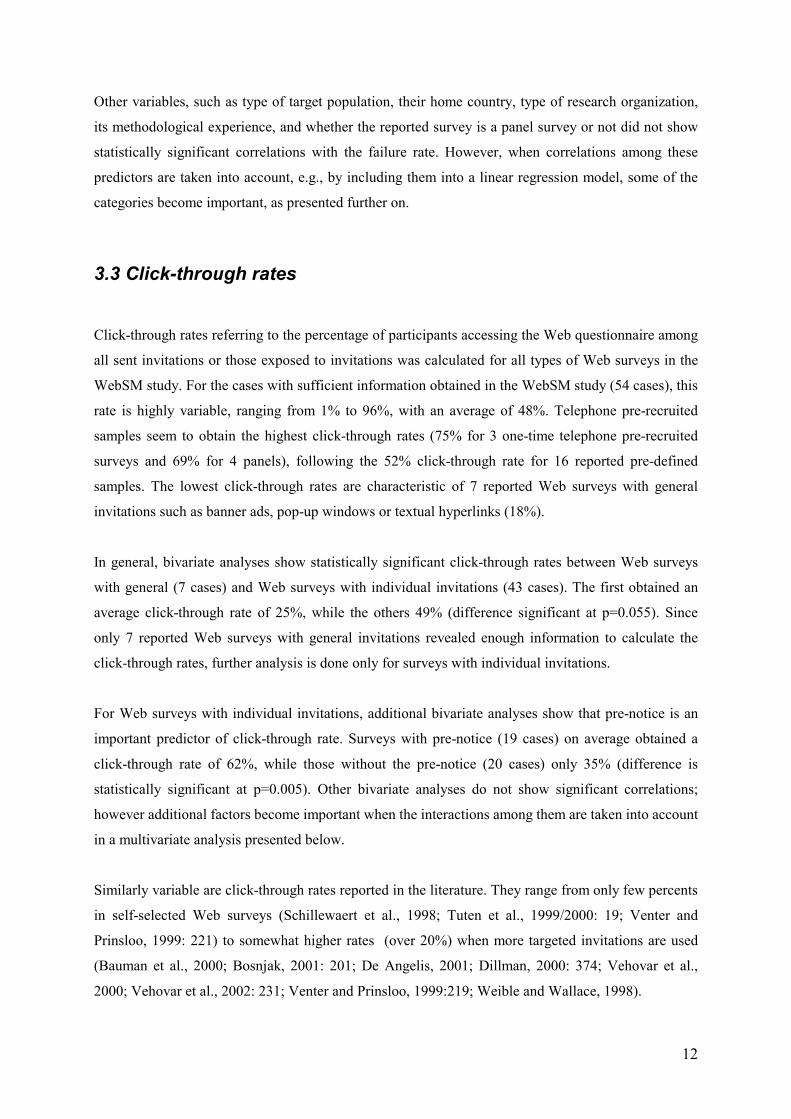
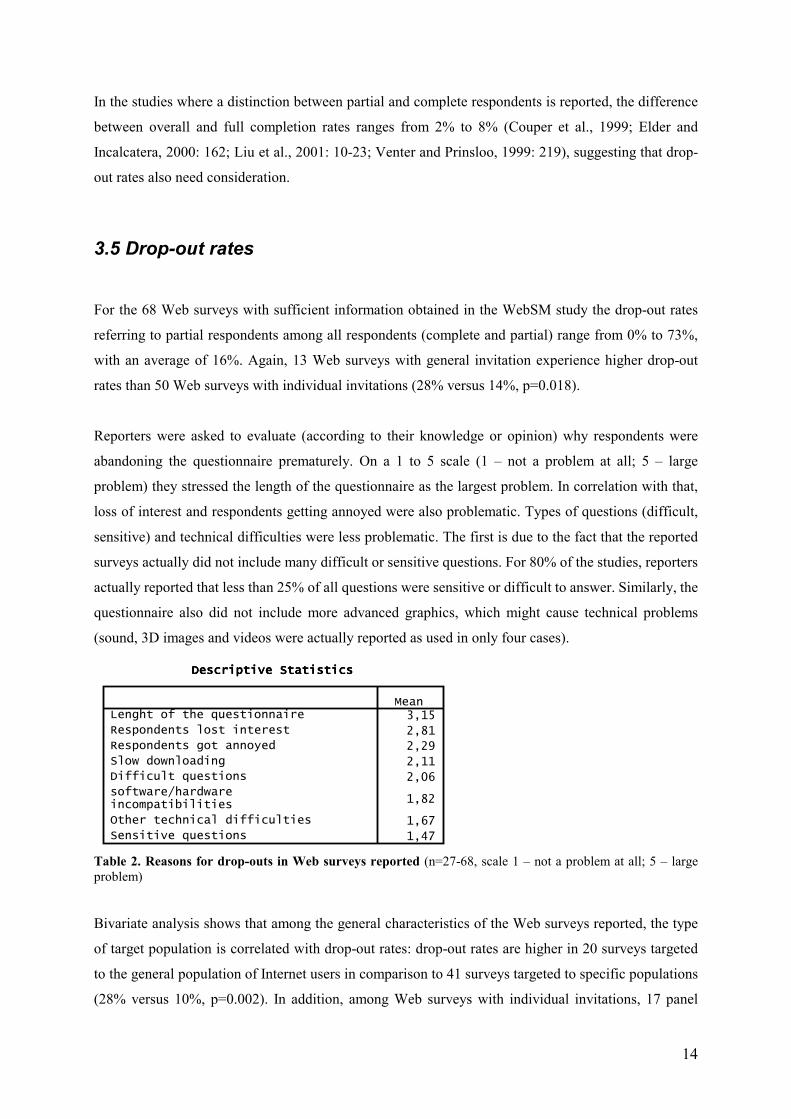
Reporters were asked to evaluate (according to their knowledge or opinion) why respondents were
abandoning the questionnaire prematurely. On a 1 to 5 scale (1 – not a problem at all; 5 – large
problem) they stressed the length of the questionnaire as the largest problem. In correlation with that,
loss of interest and respondents getting annoyed were also problematic. Types of questions (difficult,
sensitive) and technical difficulties were less problematic. The first is due to the fact that the reported
surveys actually did not include many difficult or sensitive questions. For 80% of the studies, reporters
actually reported that less than 25% of all questions were sensitive or difficult to answer. Similarly, the
questionnaire also did not include more advanced graphics, which might cause technical problems
(sound, 3D images and videos were actually reported as used in only four cases).
Descriptive StatisticsDescriptive StatisticsDescriptive StatisticsDescriptive Statistics
3,15
2,81
2,29
2,11
2,06
1,82
1,67
1,47
Lenght of the questionnaire
Respondents lost interest
Respondents got annoyed
Slow downloading
Difficult questions
software/hardwareincompatibilities
Other technical difficulties
Sensitive questions
Mean
Table 2. Reasons for drop-outs in Web surveys reported (n=27-68, scale 1 – not a problem at all; 5 – large problem) Bivariate analysis shows that among the general characteristics of the Web surveys reported, the type
of target population is correlated with drop-out rates: drop-out rates are higher in 20 surveys targeted
to the general population of Internet users in comparison to 41 surveys targeted to specific populations
(28% versus 10%, p=0.002). In addition, among Web surveys with individual invitations, 17 panel

15
Web surveys experience higher drop-out rates than 33 one-time Web surveys (20% vs. 10%, p=0.060).
As shown below, these two factors are actually correlated with other design characteristics.
In addition to the general characteristics of the Web surveys, there are several factors in the design of
the Web questionnaire that might influence drop-out. Bivariate analysis shows only that the higher the
share of open-ended questions, the higher the drop-out rate (r=0.27, p=0.037, n=62). However, the
multivariate analysis below shows that other factors are also important.
Similar findings are reported in the literature. While drop-out rates in very general self-selected Web
surveys range from 37% (Batagelj et al., 1998) to 64% (Bosnjak and Tuten, 2001), they are somewhat
lower (from 1% to 23%) when more targeted groups are surveyed (Abraham et al. 1998: 836; Aoki
and Elasmar, 2000; Elder and Incalcatera, 2000; Enander and Sajti, 1999: 47; Kottler, 1997; Liu et al.,
2001; Vehovar et al., 2000; Venter and Prinsloo, 1999: 219). In addition to the population targeted,
there may be several survey questionnaire design factors influencing drop-out rates, as shown by
Dillman (2000), Elder and Incalcatera (2000), Knapp and Heidingsfelder (2001), and Lozar Manfreda
et al. (2002a).
4 EXPLAINING (NON)RESPONSE
4.1 Explaining undeliverable invitations to Web surveys
Table 3 presents the results from the best-fitting linear regression model explaining failure rates in
Web surveys with individual invitations. More specifically, this model was done only for Web surveys
using email invitations since there were only 6 cases with mail invitations, a figure which was not
enough to allow their inclusion in the model.
The model was fitted on 26 Web surveys with email invitations for which enough information on the
selected predictor variables and for calculating failure rates was obtained. The model is statistically
significant and the selected predictor variables explain 52% of the variance in email failure rates. The
fit between predicted failure rates from the model and actual failure rates is relatively good: the highest
residual is 13% and 90% of the residuals fall into an interval of –0,09 to 0.09, suggesting that in 90%
of the cases, the predicted failure rate differs from the actual failure rate for less then 9%.
Nevertheless, owing to the small sample size, the email failure rate can be predicted only with
a standard error of 6%. Therefore the 90% confidence intervals for predicted email failure
16
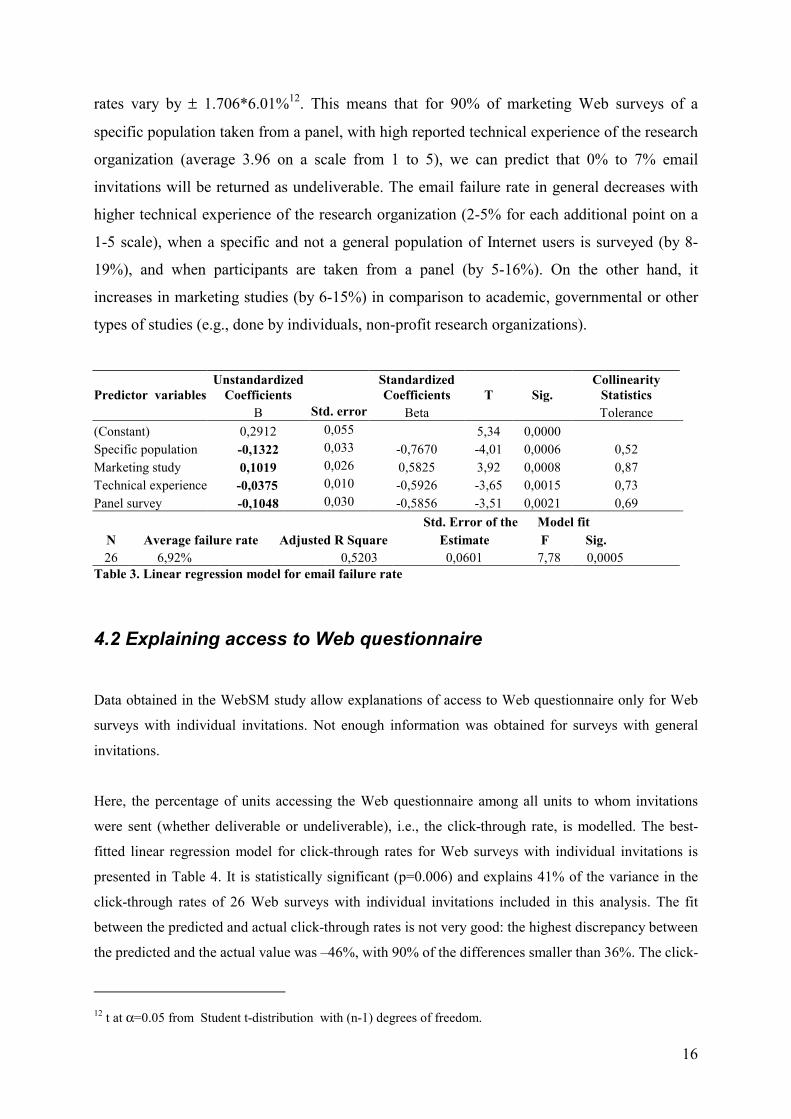
rates vary by ± 1.706*6.01%12. This means that for 90% of marketing Web surveys of a
specific population taken from a panel, with high reported technical experience of the research
organization (average 3.96 on a scale from 1 to 5), we can predict that 0% to 7% email
invitations will be returned as undeliverable. The email failure rate in general decreases with
higher technical experience of the research organization (2-5% for each additional point on a
1-5 scale), when a specific and not a general population of Internet users is surveyed (by 8-
19%), and when participants are taken from a panel (by 5-16%). On the other hand, it
increases in marketing studies (by 6-15%) in comparison to academic, governmental or other
types of studies (e.g., done by individuals, non-profit research organizations).
Predictor variables Unstandardized
Coefficients Standardized
Coefficients T Sig. Collinearity
Statistics B Std. error Beta Tolerance (Constant) 0,2912 0,055 5,34 0,0000 Specific population -0,1322 0,033 -0,7670 -4,01 0,0006 0,52 Marketing study 0,1019 0,026 0,5825 3,92 0,0008 0,87 Technical experience -0,0375 0,010 -0,5926 -3,65 0,0015 0,73 Panel survey -0,1048 0,030 -0,5856 -3,51 0,0021 0,69
Std. Error of the Model fit N Average failure rate Adjusted R Square Estimate F Sig. 26 6,92% 0,5203 0,0601 7,78 0,0005
Table 3. Linear regression model for email failure rate
4.2 Explaining access to Web questionnaire
Data obtained in the WebSM study allow explanations of access to Web questionnaire only for Web
surveys with individual invitations. Not enough information was obtained for surveys with general
invitations.
Here, the percentage of units accessing the Web questionnaire among all units to whom invitations
were sent (whether deliverable or undeliverable), i.e., the click-through rate, is modelled. The best-
fitted linear regression model for click-through rates for Web surveys with individual invitations is
presented in Table 4. It is statistically significant (p=0.006) and explains 41% of the variance in the
click-through rates of 26 Web surveys with individual invitations included in this analysis. The fit
between the predicted and actual click-through rates is not very good: the highest discrepancy between
the predicted and the actual value was –46%, with 90% of the differences smaller than 36%. The click-
12 t at α=0.05 from Student t-distribution with (n-1) degrees of freedom.
17
through rate for Web surveys with individual invitations can therefore be predicted with a standard
error of 23%.
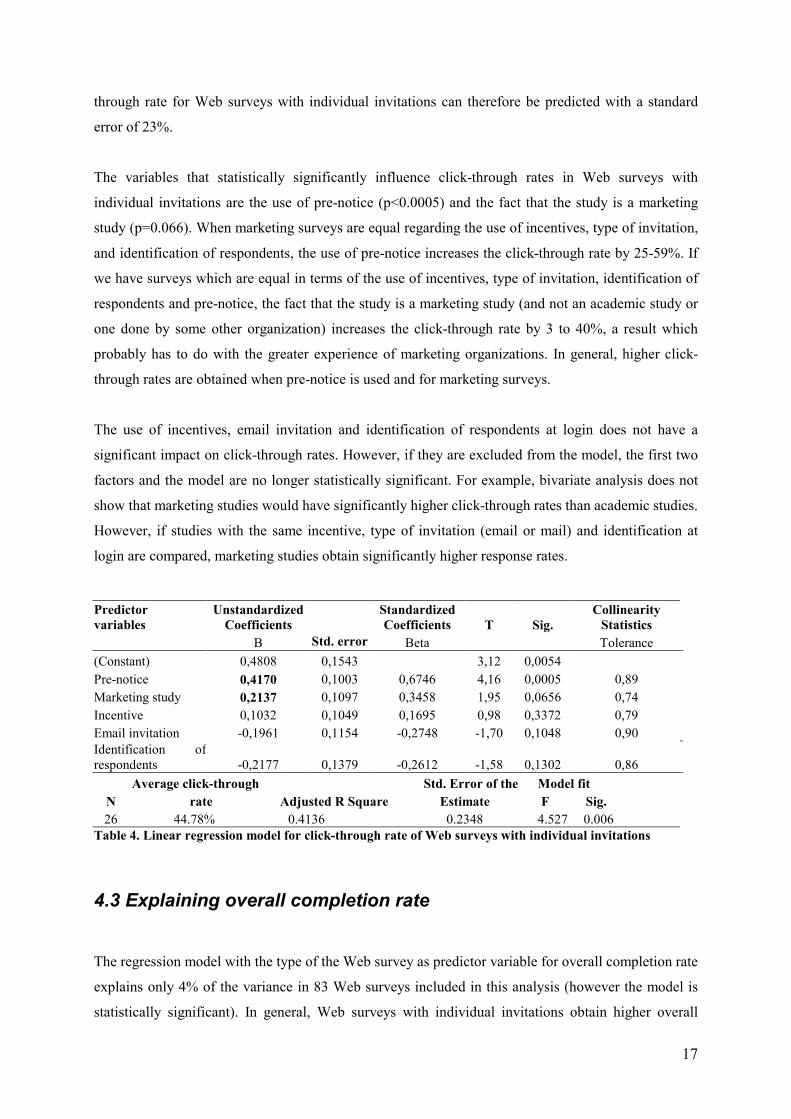
The variables that statistically significantly influence click-through rates in Web surveys with
individual invitations are the use of pre-notice (p<0.0005) and the fact that the study is a marketing
study (p=0.066). When marketing surveys are equal regarding the use of incentives, type of invitation,
and identification of respondents, the use of pre-notice increases the click-through rate by 25-59%. If
we have surveys which are equal in terms of the use of incentives, type of invitation, identification of
respondents and pre-notice, the fact that the study is a marketing study (and not an academic study or
one done by some other organization) increases the click-through rate by 3 to 40%, a result which
probably has to do with the greater experience of marketing organizations. In general, higher click-
through rates are obtained when pre-notice is used and for marketing surveys.
The use of incentives, email invitation and identification of respondents at login does not have a
significant impact on click-through rates. However, if they are excluded from the model, the first two
factors and the model are no longer statistically significant. For example, bivariate analysis does not
show that marketing studies would have significantly higher click-through rates than academic studies.
However, if studies with the same incentive, type of invitation (email or mail) and identification at
login are compared, marketing studies obtain significantly higher response rates.
Predictor variables
Unstandardized Coefficients
Standardized Coefficients T Sig.
Collinearity Statistics
B Std. error Beta Tolerance (Constant) 0,4808 0,1543 3,12 0,0054 Pre-notice 0,4170 0,1003 0,6746 4,16 0,0005 0,89 Marketing study 0,2137 0,1097 0,3458 1,95 0,0656 0,74 Incentive 0,1032 0,1049 0,1695 0,98 0,3372 0,79 Email invitation -0,1961 0,1154 -0,2748 -1,70 0,1048 0,90 Identification of respondents -0,2177 0,1379 -0,2612 -1,58 0,1302 0,86
Average click-through Std. Error of the Model fit N rate Adjusted R Square Estimate F Sig. 26 44.78% 0.4136 0.2348 4.527 0.006
Table 4. Linear regression model for click-through rate of Web surveys with individual invitations
4.3 Explaining overall completion rate
The regression model with the type of the Web survey as predictor variable for overall completion rate
explains only 4% of the variance in 83 Web surveys included in this analysis (however the model is
statistically significant). In general, Web surveys with individual invitations obtain higher overall

18
completion rates by 17% ± 1.96*8%. When other variables are taken into account, a better regression
model with a higher percentage of explained variance can be obtained. The best-fitted model includes
survey topic and length of the questionnaire. Such a model explains 21% of the variance and is
statistically significant at p=0.014. However, when these two variables are included (therefore when
comparing surveys of the same length and with the same topic of information and communication
technology, and not Internet related or some other topic), the type of the Web survey no longer has a
significant impact. For surveys of the same type and length, the topic matters: surveys on information
and communication technology issues obtain lower overall completion rates (by 23% ± 1.96*10%)
than surveys on Internet related issues or some other topic.
Again, we constructed separate model for Web surveys with individual invitations only. We did not,
however, do this for Web surveys with general invitations, since not enough information was obtained
for these.
The variables available actually do not predict the overall completion rate very well. The best-fitted
regression model explain only 11% of the variance and is statistically significant only at p=0.089.
Variables included in this model are the use of pre-notice and follow-ups. Similarly to the click-
through rates, the overall completion rate is influenced only by the use of pre-notice (p=0.098): using
pre-notice increases the overall completion rate by 15% ± 1.96*9%).
Predictor variables Unstandardized
Coefficients Standardized
Coefficients T Sig. Collinearity
Statistics B Std. error Beta Tolerance (Constant) 0.160 0.136 1.174 0.251 Pre-notice 0.150 0.087 0.309 1.717 0.098 0.986 Follow-up 0.105 0.079 0.239 1.326 0.196 0.986
Average overall Std. Error of the Model fit N completion rate Adjusted R Square Estimate F Sig. 29 39.67% 10.6% 23.27% 2.655 0.089
Table 5. Linear regression model for overall completion rate of Web surveys with individual invitations
4.4 Explaining drop-outs
The best-fitted regression model for explaining drop-outs includes three statistically significant
predictive variables: type of the target population, use of incentives and share of ‘difficult to answer’
questions within the questionnaire. The model explains 31% of the variance, and the standard error of
the estimate is 15.9%. Drop-out is higher in surveys with general than in those with specific
populations (by 23% ± 1.96*5%). It is also higher when ‘difficult to answer’ questions are used: drop-
out increases by 4% ± 1.96*2% for every higher point on a scale from 1 (not included at all) to 6 (all
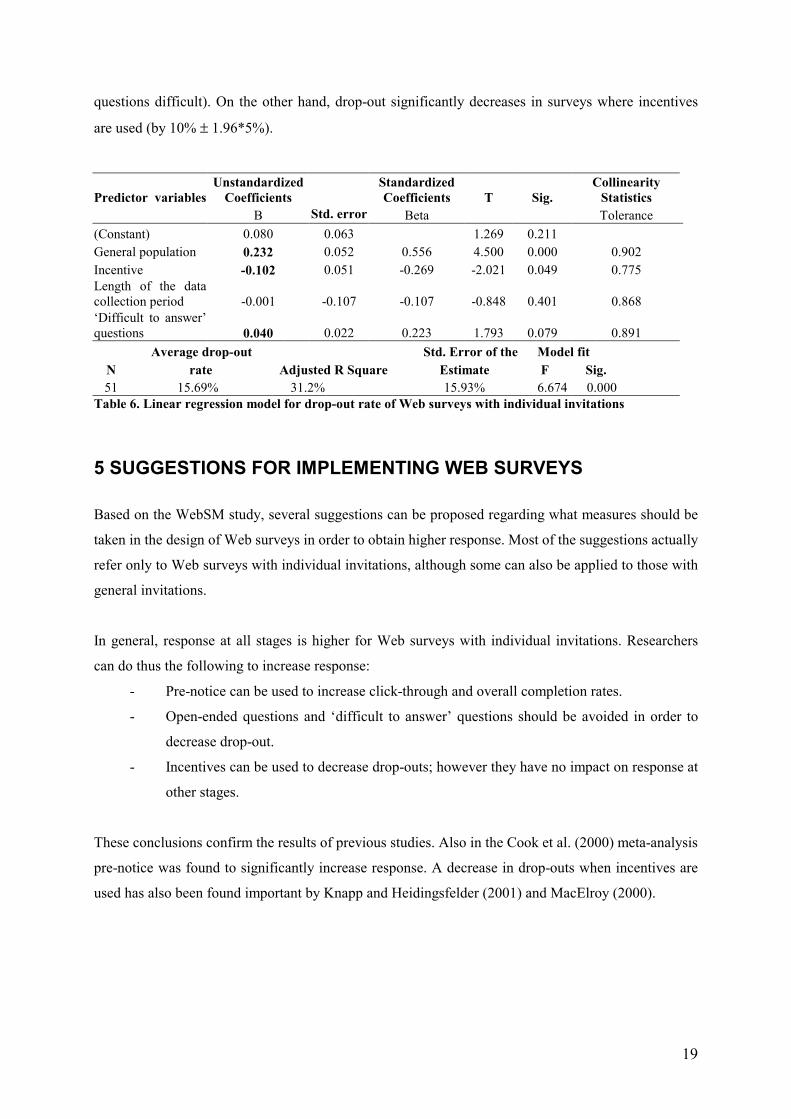
19
questions difficult). On the other hand, drop-out significantly decreases in surveys where incentives
are used (by 10% ± 1.96*5%).
Predictor variables Unstandardized
Coefficients Standardized
Coefficients T Sig. Collinearity
Statistics B Std. error Beta Tolerance (Constant) 0.080 0.063 1.269 0.211 General population 0.232 0.052 0.556 4.500 0.000 0.902 Incentive -0.102 0.051 -0.269 -2.021 0.049 0.775 Length of the data collection period -0.001 -0.107 -0.107 -0.848 0.401 0.868 ‘Difficult to answer’ questions 0.040 0.022 0.223 1.793 0.079 0.891
Average drop-out Std. Error of the Model fit N rate Adjusted R Square Estimate F Sig. 51 15.69% 31.2% 15.93% 6.674 0.000
Table 6. Linear regression model for drop-out rate of Web surveys with individual invitations
5 SUGGESTIONS FOR IMPLEMENTING WEB SURVEYS
Based on the WebSM study, several suggestions can be proposed regarding what measures should be
taken in the design of Web surveys in order to obtain higher response. Most of the suggestions actually
refer only to Web surveys with individual invitations, although some can also be applied to those with
general invitations.
In general, response at all stages is higher for Web surveys with individual invitations. Researchers
can do thus the following to increase response:
- Pre-notice can be used to increase click-through and overall completion rates.
- Open-ended questions and ‘difficult to answer’ questions should be avoided in order to
decrease drop-out.
- Incentives can be used to decrease drop-outs; however they have no impact on response at
other stages.
These conclusions confirm the results of previous studies. Also in the Cook et al. (2000) meta-analysis
pre-notice was found to significantly increase response. A decrease in drop-outs when incentives are
used has also been found important by Knapp and Heidingsfelder (2001) and MacElroy (2000).
20
6 REFERENCES 1. Abraham, S.Y., Miller S., Darby, and Sullivan, C. (1998): "Electronic and mail self-administered
questionnaires: A comparative assessment of use among elite oopulations". 1998 Proceedings of the Section on Survey Research Methods. American Statistical Association, Alexandria, pp. 833-841.
2. Aoki, K. and Elasmar, M. (2000): "Opportunities and challenges of a Web survey: A field experiment". Paper presented at the 55th Annual Conference of American Association for Public Opinion Research. Portland, Oregon, May 18-21, 2000.
3. Baruch, Y. (1999): "Response rates in academic studies - a comparative analysis". Human Relations, 52, pp. 421-434.
4. Batagelj, Z., Lozar, K., and Vehovar, V. (1998): "Respondent's satisfaction in WWW surveys". Paper presented at International Conference on Methodology and Statistics, Preddvor, Slovenia, 7-9 September 1998.
5. Bauman, S., Jobity, N., Airey, J., and Atak, H. (2000): "Invites, intros and incentives: Lessons from a Web survey". Paper presented at the 55th Annual Conference of American Association for Public Opinion Research. Portland, Oregon, May 18-21, 2000. Available from Wintellitech. http://www.wintellitech.com/ (November 21, 2001).
6. Bosnjak, M. (2001): "Participation in non-restricted Web-surveys. A typology and explanatory model for item-nonresponse". In: U.-D. Reips, and M. Bosnjak (Eds.): Dimensions of Internet science. Lengerich: Pabst Science Publishers, pp. 193-208.
7. Bosnjak, M. and Bandilla, W. (2000): "Participation in non-restricted Web surveys - A typology and further suggestions". Paper presented at Fifth International Conference on Social Science Methodology, Cologne, 3-6 October 2000.
8. Bosnjak, M. and Tuten, T.L. (2001): "Classifying response behaviors in Web-based surveys". Journal of Computer Mediated Communication, 6, 3. http://www.ascusc.org/jcmc/vol6/issue3/boznjak.html (November 21, 2001).
9. Christianson, A. and Tortora, R.D. (1995): "Issues in surveying businesses: An international survey". In: B.G. Cox et al. (Eds.): Business survey methods. New York: John Wiley & Sons, pp. 237-256.
10. Comley, P. (2000): "Pop-up surveys. What works, what doesn’t work and what will work in the future". Proceedings of the ESOMAR Worldwide Internet Conference Net Effects 3. April 10-12, 2000, Dublin, ESOMAR, Amsterdam Publication Series - Volume 237. http://www.virtualsurveys.com/papers/popup_paper.htm (November 21, 2001).
11. Cook, C., Heath, F., and Thompson, R.L. (2000): "A meta-analysis of response rates in Web- or Internet-based surveys". Educational and Psychological Measurement, 60, 6, pp. 821-836.
12. Couper, M.P., Traugott, M., and Lamias, M. (1999): "Effective survey administration on the Web". Paper presented at 1999 Annual Research Conference, organized by Midwest Association for Public Opinion Research, Chicago, Illinois, November 19-20, 1999.
13. De Angelis, C. (2001): "Sampling for Web-based surveys". Paper presented at 22nd Annual Marketing Research Conference. Marketing Research as a Competitive Advantage. Organized by AMA. Atlanta, Georgia, September 23-26, 2001.
14. de Leeuw, E.D. and van der Zouwen, J. (1983): "Data quality in telephone and face to face surveys: A comparative meta-analysis". In: R.M. Groves et al. (Eds.): Telephone survey methodology. New York: John Wiley & Sons, pp. 283-299.
15. Deutschmann, M. and Faulbaum, F. (2001): "The recruitment of online samples by CATI-screening: Problems of non-response". In: A. Westlake et al. (Eds.): The challenge of the Internet. Association for Survey Computing. (Proceedings from the 'The Challenge of the Internet' conference, organized by Association for Survey Computing, Latimer Conference Centre, UK, May 11-12, 2001).
16. Dillman, D.A. (1978): Mail and telephone surveys. The Total Design Method. New York: John Wiley & Sons.
17. Dillman, D.A. (2000): Mail and Internet surveys. The Tailored Design Method. New York: John Wiley & Sons.
18. Elder, A. and Incalcatera, T. (2000): "Pushing the envelope. Moving a major syndicated study to the Web". Proceedings of the The Worldwide Internet conference Net Effects 3, Dublin (Ireland), 10-12 April 2000. ESOMAR Publication Series - Volume 237.
19. Enander, J. and Sajti, A. (1999): "Online survey of online customers. Value-added market research through data collection on the Internet". Proceedings of the ESOMAR Worldwide Internet Conference Net Effects 2. London, 21-23 February 1999, pp. 35-51.
21
20. Flemming, G. and Sonner, M. (1999): "Can Internet polling work? Strategies for conducting public opinion surveys online". Paper presented at The 54th Annual Conference of American Association for Public Opinion Research, St. Petersburg, Florida, May 13-16, 1999.
21. Glass, G.V., McGaw, B., and Smith, M.L. (1981): Meta-analysis in social research. London: Sage. 22. Göritz, A.S., Reinhold, N., and Batinic, B. (2002): "Online panels". In: B. Batinic et al. (Eds.): Online Social
Sciences. Seattle: Hogrefe & Huber, pp. 29-51. (Forthcoming) 23. Heberlein, T.A. and Baumgartner, R. (1978): "Factors affecting response rates to mailed questionnaires: A
quantitative analysis of the published literature". American Sociological Review, 43, pp. 447 - 462. 24. Hollis, N. (1999): "Can a picture save 1,000 words? Augmenting telephone tracking with online ad
recognition". ARF's Online Research Day - Towards Validation. New York: Advertising Research Foundation, pp. 41-49.
25. Jones, R., and Pitt, N. (1999): “Health surveys in the workplace: comparison of postal, email and World Wide Web methods”. Occupational Medicine, 49, 8, pp. 556-558.
26. Knapp, F. and Heidingsfelder, M. (2001): "Drop-out analysis: Effects of the survey design". In U.-D. Reips and Bosnjak, M. (Eds.): Dimensions of Internet science. Lengerich: Pabst Science Publishers, pp. 221-230.
27. Kottler, R.E. (1997): "Exploiting the research potential of the World Wide Web". Paper presented at Research '97, London, October, 1997. http://www.spss.com/spssmr/web_bureau/knowledge/r97a.htm (November 21, 2001).
28. Kwak, N. and Radler, B.T. (1999): "A comparison between mail and Web-based surveys: Response pattern, data quality, and characteristics of respondents". Paper presented at 1999 Annual Research Conference, organized by Midwest Association for Public Opinion Research, Chicago, Illinois, 19-20 November 1999.
29. Lesser, V.M. and Newton, L. (2001): "Mail, email and Web surveys: A cost and response rate comparison in a study of undergraduate research activity". Paper presented at 2001 AAPOR Annual Conference, Montreal, Quebec, 17-20 May, 2001.
30. Liu, K., Rosen, J., and Stewart, E. (2001): "Validity issues in Web derived survey data". Poster presented at 2001 AAPOR Annual Conference, Montreal, Quebec, 17-20 May, 2001.
31. Lozar Manfreda, K. (2001): "Web survey errors". Doctoral dissertation. Ljubljana: Faculty of Social Sciences, University of Ljubljana.
32. Lozar Manfreda, K., Batagelj, Z., and Vehovar, V. (2002a ): “Design of Web survey questionnaires: Three basic experiments”. Journal of Computer Mediated Communication, 7,3. http://www.ascusc.org/jcmc/vol7/issue3/vehovar.html (October 30, 2002).
33. Lozar Manfreda, K., Biffignandi, S., Pratesi, M., and Vehovar, V. (2002b):”Participation in telephone pre-recruited Web surveys”. Paper presented at the American Association for Public Opinion Research 57th Annual Conference, St. Pete Beach, Florida, USA, May 16-19, 2002.
34. MacElroy, B. (2000): "Variables influencing dropout rates in Web-based surveys". Quirk's Marketing Research Review, July/August 2000. Paper. http://www.quirks.com/ (November 21, 2001).
35. Schillewaert, N., Langerak, F., and Duhamel, T. (1998): "Non probability sampling for WWW surveys: A comparison of methods". Journal of the Market Research Society, 40, 4, pp. 307-313.
36. Sheehan, K.B. (2001): "E-mail survey response rates: A review". Journal of Computer Mediated Communication, 6, 2. http://www.ascusc.org/jcmc/vol6/issue2/sheehan.html (November 21, 2001).
37. Terhanian, G. (2000): "How to produce credible, trustworthy information through Internet-based survey research". Paper presented at the 55th Annual Conference of American Association for Public Opinion Research. Portland, Oregon, 18-21 May 2000.
38. Tuten, T.L., Bosnjak, M., and Bandilla, W. (1999/2000): "Banner-advertised Web-surveys". Marketing Research, 11, 4, pp. 16-21.
39. Tuten, T.L., Urban, D.J., and Bosnjak, M. (2002): "Internet surveys and data quality - A review". In: B. Batinic et al. (Eds.): Online social sciences. Seattle: Hogrefe & Huber, pp. 7-27. (Forthcoming)
40. Vehovar, V., Batagelj, Z., Lozar Manfreda, K., and Zaletel, M. (2002): "Nonresponse in Web surveys". In: R.M. Groves et al. (Eds.): Survey nonresponse. New York: John Wiley & Sons, pp. 229-242.
41. Vehovar, V., Lozar Manfreda, K., and Batagelj, Z. (2000): "Participation in solicited Web surveys: Who comes farthest?" Paper presented at Fifth International Conference on Social Science Methodology, Cologne, 3-6 October 2000.
42. Venter, P. and Prinsloo, M. (1999): "The Internet and the changing role of market research". Proceedings of the ESOMAR Worldwide Internet Conference Net Effects. 21 -23 February 1999, London, pp. 215-227.
43. Weible, R. and Wallace, J. (1998): "Cyber research: The impact of the Internet on data collection". Marketing Research 10, 3, pp.19-23.
44. Wiebe, E.F., Eyerman, J., and Loft, J.D. (2001): "Evaluating nonresponse in a Web-enabled survey on health and aging". Paper presented at 2001 AAPOR Annual Conference, Montreal, Quebec, 17-20 May 2001.
22
45. Yu, J. and Cooper, H. (1983): “A quantitative review of research design effects on response rates to questionnaires”. Journal of Marketing Research, 20, pp. 36-44.
Appendix 1. Response to WebSM study
Sample source Sent email
invitations Undeliverable emails13
Explicit refusal14
Not eligible15
No response16
Not valid response17
Valid response18
Email invitation to companies
135 8 5 3 79 12 16
Email invitation to individuals
394 69 4 26 178 40 39
General announcements in email lists
/ 18 12
Direct respondents from WebSM site
/ 7 3
Unknown source 4 4 RIS surveys19 0 4 Total 81 74 Absorption rate for email invitations: 94% for companies, 82% for individuals, 85% overall. Refusal rate: 4% for companies, 1% for individuals, 2% overall. Eligibility rate: 98% for companies, 93% for individuals, 94% overall. Overall completion rate: 21% for companies, 20% for individuals, 20% overall. Full completion rate: 12% for companies, 10% for individuals, 10% overall. Complete rate: 57% for companies, 49% for individuals, 40% of general announcements in email lists, 30% for direct respondents from WebSM site, 50% for respondents from unknown source, and 100% for RIS surveys; 49% overall.
13 Undeliverable invitations due to unknown user, non-existent domain, temporary over-quota email account, temporary network problem. 14 Individuals that opted out from the list. 15 Individuals that informed us that they do not perform Web surveys. 16 All the other non-respondents that are not included in one of the other categories. 17 Individuals that only partially answered the questionnaire, i.e. no valid information was reported regarding response in their Web survey. 18 Individuals that completely answered the questionnaire, i.e. reported valid information regarding response in their Web survey. 19 Surveys done by the authors of this paper.