survey methods for educators: analysis and … methods for educators: analysis and reporting of...
TRANSCRIPT

U . S . D e p a r t m e n t o f E d u c a t i o n
August 2016
Applied Research Methods
Survey methods for educators: Analysis and reporting of survey data (part 3 of 3)
Angela M. PazzagliaErin T. Stafford
Sheila M. Rodriguez Education Development Center, Inc.
At Education Development Center, Inc. At Education Development Center, Inc.

U.S. Department of Education John B. King, Jr., Secretary
Institute of Education Sciences Ruth Neild, Deputy Director for Policy and Research Delegated Duties of the Director
National Center for Education Evaluation and Regional Assistance Joy Lesnick, Acting Commissioner Amy Johnson, Action Editor Elizabeth Eisner, Project Officer
REL 2016–164
The National Center for Education Evaluation and Regional Assistance (NCEE) conducts unbiased large-scale evaluations of education programs and practices supported by federal funds; provides research-based technical assistance to educators and policymakers; and supports the synthesis and the widespread dissemination of the results of research and evaluation throughout the United States.
August 2016
This report was prepared for the Institute of Education Sciences (IES) under Contract ED-IES-12-C-0009 by Regional Educational Laboratory Northeast & Islands administered by Education Development Center, Inc. The content of the publication does not necessarily reflect the views or policies of IES or the U.S. Department of Education, nor does mention of trade names, commercial products, or organizations imply endorsement by the U.S. Government.
This REL report is in the public domain. While permission to reprint this publication is not necessary, it should be cited as:
Pazzaglia, A. M., Stafford, E. T., & Rodriguez, S. M. (2016). Survey methods for educators: Analysis and reporting of survey data (part 3 of 3) (REL 2016–164). Washington, DC: U.S. Department of Education, Institute of Education Sciences, National Center for Education Evaluation and Regional Assistance, Regional Educational Laboratory Northeast & Islands. Retrieved from http://ies.ed.gov/ncee/edlabs.
This report is available on the Regional Educational Laboratory website at http://ies.ed.gov/ ncee/edlabs.

Summary
This guide describes a five-step process that educators can use to analyze survey data and report the results in a way that is accessible and useful to interested stakeholders. When conducted appropriately, these analysis and reporting procedures can provide accurate and timely information about a large population that may be otherwise unavailable, which can help stakeholders make decisions about policy or practice in schools and local or state education agencies. Examples from a Regional Educational Laboratory Northeast & Islands survey project illustrate each step.
The five-step survey analysis and reporting process is: • Step 1: Review the analysis plan. • Step 2: Prepare and check data files. • Step 3: Calculate response rates. • Step 4: Calculate summary statistics. • Step 5: Present the results in tables or figures.
This guide is the third in a three-part series of survey method guides for educators. The first guide in the series covers survey development, and the second guide in the series covers sample selection and survey administration.
i

Contents
Summary i
Why this guide? 1 Survey research process 1 Analysis and reporting of survey data 2
Step 1: Review the analysis plan 5
Step 2: Prepare and check data files 6
Step 3: Calculate response rates 8
Step 4: Calculate summary statistics 10
Step 5: Present the results in tables or figures 12
Using this guide 13
Limitations of this guide 13
Appendix A. Additional resources for analyzing and reporting survey data A-1
Appendix B. Using SPSS to code data B-1
Appendix C. Sample response rate table C-1
Appendix D. Using SPSS to calculate summary statistics D-1
Appendix E. Sample figures and tables E-1
Appendix F. Sample infographic F-1
References Ref-1
Boxes 1 Overview of a survey project from the Northeast Rural Districts Research Alliance 2 2 Definitions of key terms 3 3 Step 1 in practice: Reviewing and updating the online course use survey analysis plan 6 4 Step 2 in practice: Preparing and checking the online course use survey data file 7 5 Step 3 in practice: Calculating response rates for the online course use survey 9 6 Step 4 in practice: Calculating summary statistics for the online course use survey 12 7 Step 5 in practice: Presenting the results of the online course use survey 12
Figures 1 Three stages in the survey research process 1 2 Five steps in the collaborative survey development process 3 3 Decision tree for making claims about the target population 9
ii

E1 Sample stacked bar graph displaying responses to the survey question, “How important were the following reasons for having online courses in your school in 2012/13?” E-1
E2 Sample pie chart displaying responses to the survey question, “How important were the following reasons for having online courses in your school in 2012/13?” (percent of respondents) E-1
F1 Sample infographic from the online course use survey project F-1
Tables 1 Original analysis plan for online course use survey, Northeast Rural Districts Research
Alliance 5 2 Summary statistics, calculations, and considerations 11 C1 Checking for survey nonresponse bias by comparing target population and respondent
characteristics C-2 E1 Sample results table displaying responses to the survey question, “How important were
the following reasons for having online courses in your school in 2012/13?” (percent, unless otherwise noted) E-2
E2 Sample results table displaying responses to the survey question, “Report the number of online course enrollments in school year 2012/13 in each of the following academic areas.” E-2
iii

Why this guide?
Increasingly, state and local educators are using data to inform policy decisions (Hamilton et al., 2009; Knapp, Swinnerton, Copland, & Monpas-Huber, 2006; U.S. Department of Education, 2010). Educators need access to a wide variety of data, some of which may not be in their data systems. Survey data can be particularly useful for educators by offering a relatively inexpensive and flexible way to describe the characteristics of a population. To obtain such information, educators may need to conduct their own survey research.
Survey research process
The survey research process includes survey development, sample selection and survey administration, and data analysis and reporting (figure 1). The activities undertaken in each stage may vary depending on the type of information being collected (Fink, 2013). For example, if educators want to conduct a survey on a topic that has been widely surveyed in similar settings, they may be able to use an existing survey instrument and skip the survey development stage altogether. Or they may decide to use an existing survey but add survey items of particular interest in their context. If no surveys exist for the topic, educators will need to develop a new survey in stage 1 (see figure 1).
The three guides in this series correspond to the three stages in figure 1 and provide an overview of survey methodologies for a nontechnical audience of educators. However, the resources needed to complete some of the activities may make the series most relevant to larger school districts, state departments of education, and other large agencies. The first guide in the series covers survey development (Irwin & Stafford, 2016), the second guide in the series covers sample selection and survey administration (Pazzaglia, Stafford, & Rodriguez, 2016), and this third guide in the series covers data analysis and reporting.
These guides are intended to lead to the use of survey findings in decisions about policy and practice in schools and local or state education agencies; however, offering guidance on how decisionmakers can use the results is not the focus.
Because this series is an overview, readers seeking a comprehensive guide to survey methods or to complex analyses of survey items are encouraged to explore other resources, such as textbooks, journal articles, and websites dedicated to these topics or to engage consultants who have this type of expertise. For useful references on analyzing and reporting survey data, see appendix A.
Figure 1. Three stages in the survey research process
Sample selection and survey administration Survey development Data analysis
and reporting
Source: Authors’ construction.
1

In providing guidance on data analysis and reporting, this guide draws on examples from a survey project conducted with educators in the Northeast Rural Districts Research Alliance of the Regional Educational Laboratory (REL) Northeast & Islands (Clements, Pazzaglia, & Zweig, 2015; Clements, Zweig, & Pazzaglia, 2015). See box 1 for an overview of that project.
Analysis and reporting of survey data
Educators engaged in survey research should develop a detailed analysis plan during the survey development stage, which is covered in part 1 of this series (Irwin & Stafford, 2016). It provides the structure for the statistical analysis of the survey data that will be presented in reports or presentations. The analysis plan ensures that the survey results will address the topics of interest. The analysis plan maps survey questions (items) to the topics of interest and proposes the type of analysis and presentation (such as a table or graph) for each result.
For data analysis, educators can calculate common summary statistics, such as frequencies and means, for each survey item using specialized statistical software, such as IBM SPSS Statistics, or spreadsheet software, such as Microsoft Excel. In drawing conclusions from the survey data, educators must consider the size of the sample, the sampling procedures used, and the response rates (U.S. Department of Education, 2012). The final step is presenting the results to stakeholders.
Research literature and textbooks often provide technical descriptions of complex issues rather than simple explanations of analysis and reporting procedures. This guide explains the basic procedures for analyzing and reporting survey data using a five-step process: reviewing the analysis plan, preparing and checking data files, calculating response rates, calculating summary statistics, and presenting results in tables or figures (figure 2). See box 2 for definitions of key terms.
Box 1. Overview of a survey project from the Northeast Rural Districts Research Alliance
A partnership of education stakeholders in New York wanted to know whether they should
encourage state leaders to invest in initiatives designed to support online learning. Because
the state’s existing longitudinal data system did not distinguish online courses from face-to
face courses, stakeholders had no data on the extent to which online courses were being used
and for what purposes. The stakeholders wanted to administer a survey to schools to collect
basic information on online course use, such as the number of online course enrollments by
course type (Advanced Placement, core, credit recovery, dual credit, or elective), the reasons
schools were using online courses, and the challenges they faced in offering online courses to
their students.
2

Figure 2. Five steps in the collaborative survey development process
1
2
3
4
5
Review the analysis plan
Prepare and check data files
Calculate response rates
Calculate summary statistics
Present the results in tables or figures
Source: Authors’ construction.
Box 2. Definitions of key terms
Analysis plan. A preparatory survey tool that maps topics of interest to survey items and sug
gests types of data analyses and results presentation.
Data coding. The process of categorizing data for the purposes of analysis, such as assigning
numeric codes or category labels to individual responses.
Generalize. The extension of results from a survey or other study conducted on a sample to
the larger target population.
Infographic. Visual presentation of data or other information that is intended to attract a read
er’s attention and quickly and clearly convey meaning.
Item. A question on a survey; see survey items.
Item nonresponse. When those selected for survey administration respond to some survey
items but not others, or stop taking the survey before responding to all items.
Item nonresponse bias. Occurs when those who respond to an individual item are different in
meaningful ways from those who do not respond to that item. For example, teachers in more
affluent districts might be more likely to complete certain school climate survey items. Item
nonresponse bias can result in survey statistics that do not provide valid approximations of the
population (that is, the statistics from the survey respondents do not match the statistics that
would have resulted if the entire population had responded to the survey).
Item response rate. The percentage of respondents who responded to each survey item.
Missing data. Occurs when survey responses are not available for a particular item or indi
vidual. In survey research, missing data can be caused by item nonresponse as well as data
collection errors.
Multiple-choice response option. A type of survey response option in which a respondent is
presented with a set of possible responses and is asked to choose one or more of them.
Nonrespondents. People selected for survey administration who do not respond to the survey.
(continued)
3
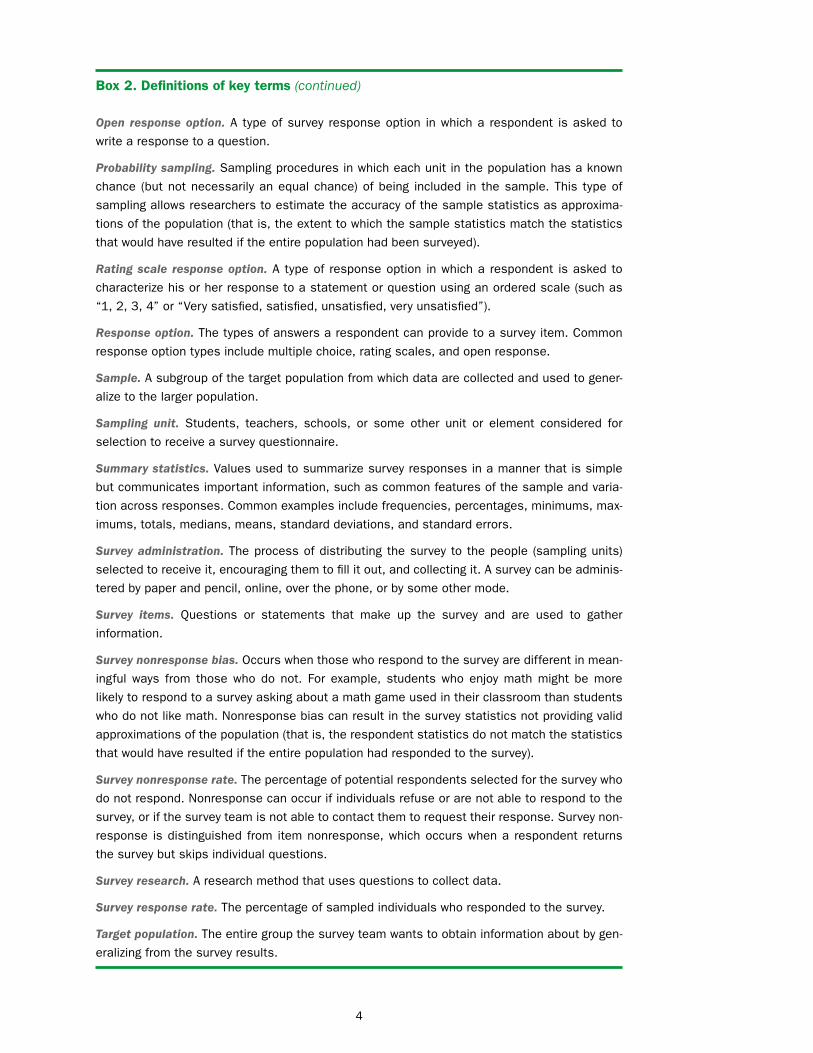
Box 2. Definitions of key terms (continued)
Open response option. A type of survey response option in which a respondent is asked to
write a response to a question.
Probability sampling. Sampling procedures in which each unit in the population has a known
chance (but not necessarily an equal chance) of being included in the sample. This type of
sampling allows researchers to estimate the accuracy of the sample statistics as approxima
tions of the population (that is, the extent to which the sample statistics match the statistics
that would have resulted if the entire population had been surveyed).
Rating scale response option. A type of response option in which a respondent is asked to
characterize his or her response to a statement or question using an ordered scale (such as
“1, 2, 3, 4” or “Very satisfied, satisfied, unsatisfied, very unsatisfied”).
Response option. The types of answers a respondent can provide to a survey item. Common
response option types include multiple choice, rating scales, and open response.
Sample. A subgroup of the target population from which data are collected and used to gener
alize to the larger population.
Sampling unit. Students, teachers, schools, or some other unit or element considered for
selection to receive a survey questionnaire.
Summary statistics. Values used to summarize survey responses in a manner that is simple
but communicates important information, such as common features of the sample and varia
tion across responses. Common examples include frequencies, percentages, minimums, max
imums, totals, medians, means, standard deviations, and standard errors.
Survey administration. The process of distributing the survey to the people (sampling units)
selected to receive it, encouraging them to fill it out, and collecting it. A survey can be adminis
tered by paper and pencil, online, over the phone, or by some other mode.
Survey items. Questions or statements that make up the survey and are used to gather
information.
Survey nonresponse bias. Occurs when those who respond to the survey are different in mean
ingful ways from those who do not. For example, students who enjoy math might be more
likely to respond to a survey asking about a math game used in their classroom than students
who do not like math. Nonresponse bias can result in the survey statistics not providing valid
approximations of the population (that is, the respondent statistics do not match the statistics
that would have resulted if the entire population had responded to the survey).
Survey nonresponse rate. The percentage of potential respondents selected for the survey who
do not respond. Nonresponse can occur if individuals refuse or are not able to respond to the
survey, or if the survey team is not able to contact them to request their response. Survey non
response is distinguished from item nonresponse, which occurs when a respondent returns
the survey but skips individual questions.
Survey research. A research method that uses questions to collect data.
Survey response rate. The percentage of sampled individuals who responded to the survey.
Target population. The entire group the survey team wants to obtain information about by gen
eralizing from the survey results.
4

Step 1: Review the analysis plan
A survey analysis plan, which maps survey questions (items) to the topics of interest and suggests types of analysis and presentation, should be prepared during survey development as described in part 1 of this survey methods series (Irwin & Stafford, 2016). Once the survey has been administered, the first step is to review the analysis plan and update it to ensure that the survey analysis will address the topics of interest in the analysis plan. The original analysis plan from the Northeast Rural Districts Research Alliance’s survey project is shown in table 1, and a description of how this plan was reviewed and updated to guide the calculation of summary statistics for the project is given in box 3. This section describes how to complete this task.
• Update the original analysis plan as necessary based on problematic responses or missing data identified in checks of data during survey administration (see box 3 for an example of an update to an analysis plan). For example, if respondents skipped certain items or provided responses that did not make sense for an item, the survey team may decide to exclude these items from the results. Updating the plan ensures that the survey results address the original questions of interest and can inform policy and practice as intended.
Table 1. Original analysis plan for online course use survey, Northeast Rural Districts Research Alliance
Research question Survey item Potential analysis methods
Potential method of presentation
1a: How are rural and nonrural high schools in the Greater Capital Region of New York using online learning in the 2012/13 school year? Specifically, what is the number of student enrollments?
Items 1–4
Example item: For school year 2012/13, report the number of students in your school who were enrolled in online courses.
Mean; standard error
Table
1b: What percentage of students successfully complete the online courses?
Item 5
Example item: Of these enrollments, how many resulted in successful course completions with a passing grade?
Mean; standard error
Table
1c: What are the academic domains for which online courses are being utilized (for example, math, science, foreign language)?
Item 6
Example item: For each box, report the number of online course enrollments in school year 2012/13 in each of the following academic areas.
Mean; standard error
Table; stacked bar graph
1d: What is the academic purpose for which students are taking these courses (for example, to recover credit, access advanced placement courses)?
Items 8–9
Example item: For each box, report the number of online course enrollments in school year 2012/13 in each of the following course categories.
Mean; standard error
Table; stacked bar graph
2: Why are rural and nonrural schools Item 7 Mean; Table; pie chart using online course options? standard error Example item: How important were the
following reasons for having online courses in your school in 2012/13? (Check one on each line.)
3: What are the policies and practices Items 11–18 Mean; Table these schools employ to monitor students standard error Example item: In 2011/12, did your school enrolled in online courses? monitor student progress in online courses
in any of the following ways (check one on each line.)
Source: Irwin & Stafford, 2016.
5

Box 3. Step 1 in practice: Reviewing and updating the online course use survey analysis plan
Prior to analyzing the survey data, the Northeast Rural Districts Research Alliance survey team
met to review the analysis plan it had created during the survey development phase of the
project (see table 1). The team discussed which summary statistics would be calculated for
each survey item, including any changes needed based on an early check of data during survey
administration. For example, the team compared the reported number of online course enroll
ments to the total number of student enrollments at each school. In some cases, schools
were reporting more online course enrollments than their entire student population, so there
was reason to believe that respondents were estimating their enrollments in an online course
rather than providing exact enrollments based on their school records. In response, the team
decided that the percentage of schools that reported at least one enrollment in an online
course might be a more accurate representation of the prevalence of online learning in the
region than the minimum, maximum, total, and mean number of enrollments, as was initially
laid out in the analysis plan.
• Update the analysis plan to guide the types of statistical calculations (such as total, mean, and standard deviation) that will be performed for each survey item (see step 4 for more on summary statistics).
• Update the analysis plan to designate the types of tables and figures that will appear in reports and presentations to best communicate the results to stakeholders (see step 5 for more on tables and figures).
Step 2: Prepare and check data files
Preparing and checking the survey data files includes compiling paper surveys in an electronic file, merging data files, checking for data entry errors, and coding the data. See box 4 for a description of the process for preparing and checking the Northeast Rural Districts Research Alliance online course use survey data file. This section describes the tasks involved.
• If the survey collected demographic information, respondent names, emails, or other unique identifiers, respondents could be identified by their answers. In this case, it is important to securely transfer and store data files to prevent the disclosure of personally identifiable information through security breaches. School districts often have security procedures that need to be followed. Other recommended protections include restricting data access to the survey team, replacing identifying variables with new ID numbers, storing data on encrypted hard drives or in locked filing cabinets, and avoiding nonsecure email for transferring data files.
• If multiple data files exist (for example, a demographic data file used to select the sample and a survey response data file), merge the files. • Use a consistent linking variable across files, such as student or teacher ID
numbers or names. Merging can then be accomplished using Microsoft Excel or a number of other statistical packages, as long as the linking variables match exactly across files.
• After merging the files, look at the data in the new file to ensure that the files merged correctly (for example, did the survey data match up with the correct
6

Box 4. Step 2 in practice: Preparing and checking the online course use survey data file
Prior to calculating summary statistics, the Northeast Rural Districts Research Alliance survey
team merged the survey data files with data files from the Common Core of Data (U.S. Depart
ment of Education, 2011) containing school information such as locale (city/suburban, town,
or rural). The survey team used “school name” as the linking variable, which required first
comparing responses to the survey item that asked respondents for their school name with
the school names in the Common Core of Data file. The survey team assigned unique ID
numbers to each school name to address any inconsistencies in school names across files (for
example, if one file used “Mansfield High School” and the other used “Mansfield HS”).
After merging the data files and conducting a spot check to ensure that the files merged
correctly, the survey team coded data from several survey items. For example, several of the
multiple-choice options in the survey had an “other” option that prompted respondents to
enter information. The survey team reviewed these responses to see if any fit in an existing
category or if multiple responses fell into a new category.
demographic data?). Check the total number of respondents in the old and new files to make sure all data are included.
• Check for data entry errors. Look through the data file and run frequencies to examine the responses for each item (see step 4 for how to run frequencies). For example, when compiling paper survey responses into an electronic file, a value may have been entered that does not make sense for a particular survey question (for example, 100 years of teaching experience rather than 10). Responses that appear to be entered in error should be flagged, reviewed more closely, and either replaced with the correct response if it is available or considered for deletion if the team agrees that the response was an error.
• To prepare for analysis, code data to make the results easier to understand. For example: • Rather than reporting the mean and standard deviation for a variable such as
years of teaching experience, you might break the responses into categories (for example, less than 2 years, 2–5 years, 6–10 years, and more than 10 years) and present the frequency of each response category. This approach requires coding the data into a new variable (see appendix B for screenshots depicting the recoding procedure in SPSS).
• With open response options, respondents often write the same information in different ways that are difficult to combine in analysis. For example, teachers asked to specify the age of the oldest child in their classroom may write “three,” “3,” “3-yrs-old,” “three years old,” and so on. The survey team must code all data in a consistent format to allow for calculation of the desired summary statistics (for example, changing all of these values to “3” will allow calculation of summary statistics).
• Open response options may be coded into categories of responses (see Jansen, 2010, for information about coding and analyzing this type of qualitative data). For example, a survey item asking teachers to list the subjects they teach could later be coded into categories such as English, science, social studies, and math.
7

Step 3: Calculate response rates
Prior to calculating summary statistics, the survey team should determine whether the survey results will generalize to the target population, not just to those who responded to the survey. For nonprobability samples, survey results cannot generalize to a target population, so this step can be skipped. For probability sampling procedures, calculating two types of response rates—survey response rates and item response rates—provides information about the likelihood of what is called survey and item nonresponse bias, which can limit generalizability. Nonresponse bias occurs when survey respondents are different from nonrespondents in meaningful ways. If nonresponse bias is likely, the survey statistics may not provide valid approximations of the population (that is, the respondent statistics may not match the statistics that would have resulted if the entire population had responded to the survey).
If nonresponse bias is found, the survey team may consider extending the survey administration period to increase response rates. Otherwise, it should not draw conclusions about the larger target population from the survey results; however, it can still make claims about the respondents. A decision tree to determine whether results from the survey can be used to make claims about the target population is shown in figure 3.
This guide uses the National Center for Education Statistics guideline that adequate response rates are greater than or equal to 85 percent (U.S. Department of Education, 2012). The statistics literature gives differing standards for response rates, some of which are lower in some situations.
A description of how the Northeast Rural Districts Research Alliance online course use survey team calculated response rates is shown in box 5, and directions are given below.
• To calculate the survey response rate, divide the number of individuals who responded to the survey by the number of individuals to whom the survey was administered (the sample size). • If the survey response rate is greater than or equal to 85 percent, it is not necessary
to complete any further steps to assess potential nonresponse bias, though it is still advisable to check the characteristics of the respondents and nonrespondents.
• If the survey response rate is less than 85 percent, survey nonresponse bias may be present, and the conclusions drawn from the respondents may not represent or reflect the traits or views of the target population (U.S. Department of Education, 2012). Survey nonresponse bias might be present if particular types of respondents are more likely to complete the survey. In this case, caution must be taken in drawing conclusions about the target population as a whole.
• To calculate the item response rate for each item in the survey, divide the number of individuals who responded to an item by the total number of survey respondents. This calculation measures the extent to which individuals skipped items or terminated the survey before responding to all items. • For items with response rates greater than or equal to 85 percent, it is not
necessary to complete any further steps to assess potential nonresponse bias. • Items with response rates lower than 85 percent are subject to concerns about
nonresponse bias. Particular types of respondents might be more likely to respond to specific items, while other types of respondents might skip those items. Caution must be taken in drawing conclusions about the target population as a whole based on these items.
8
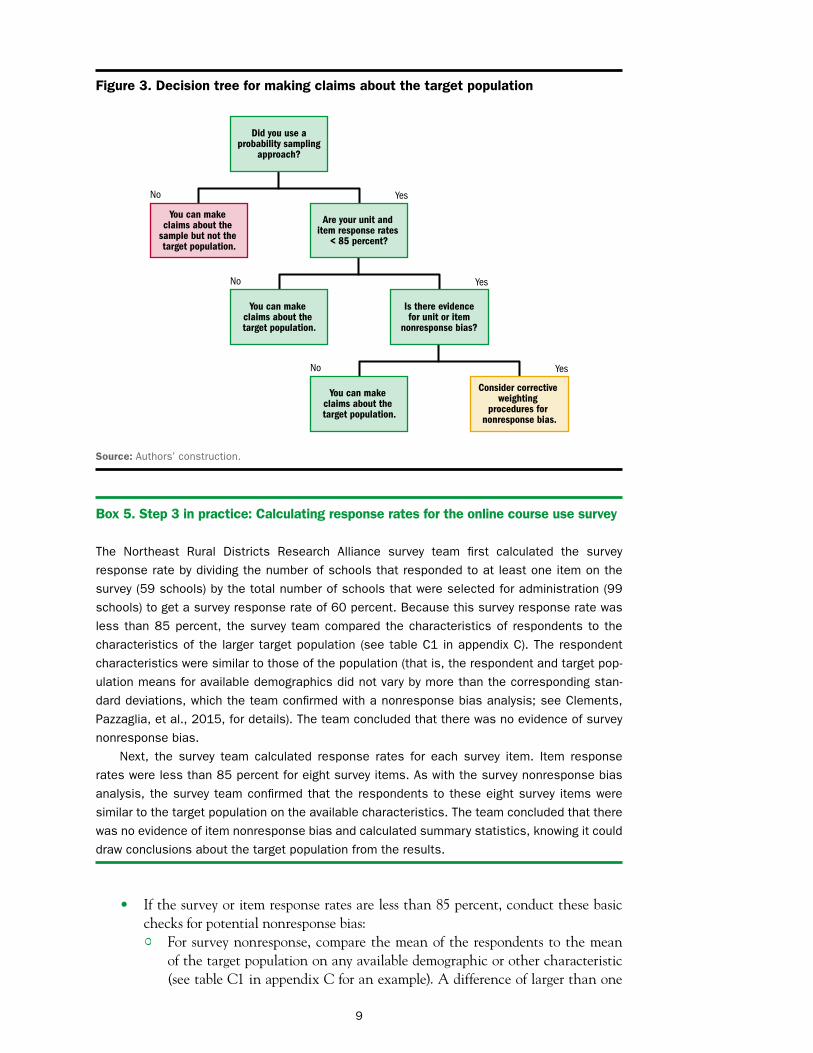
Figure 3. Decision tree for making claims about the target population
Did you use a probability sampling
approach?
You can make claims about the
sample but not the target population.
Are your unit and item response rates
< 85 percent?
You can make claims about the target population.
You can make claims about the target population.
Consider corrective weighting
procedures for nonresponse bias.
Is there evidence for unit or item
nonresponse bias?
Yes
Yes
Yes No
No
No
Source: Authors’ construction.
Box 5. Step 3 in practice: Calculating response rates for the online course use survey
The Northeast Rural Districts Research Alliance survey team first calculated the survey
response rate by dividing the number of schools that responded to at least one item on the
survey (59 schools) by the total number of schools that were selected for administration (99
schools) to get a survey response rate of 60 percent. Because this survey response rate was
less than 85 percent, the survey team compared the characteristics of respondents to the
characteristics of the larger target population (see table C1 in appendix C). The respondent
characteristics were similar to those of the population (that is, the respondent and target pop
ulation means for available demographics did not vary by more than the corresponding stan
dard deviations, which the team confirmed with a nonresponse bias analysis; see Clements,
Pazzaglia, et al., 2015, for details). The team concluded that there was no evidence of survey
nonresponse bias.
Next, the survey team calculated response rates for each survey item. Item response
rates were less than 85 percent for eight survey items. As with the survey nonresponse bias
analysis, the survey team confirmed that the respondents to these eight survey items were
similar to the target population on the available characteristics. The team concluded that there
was no evidence of item nonresponse bias and calculated summary statistics, knowing it could
draw conclusions about the target population from the results.
• If the survey or item response rates are less than 85 percent, conduct these basic checks for potential nonresponse bias:
For survey nonresponse, compare the mean of the respondents to the mean of the target population on any available demographic or other characteristic (see table C1 in appendix C for an example). A difference of larger than one
•
9

standard deviation in the means of respondents and the target population may be indicative of nonresponse bias. For example, the mean student enrollment for respondent schools could be compared with the mean student enrollment for target population schools, and the size of the difference compared with the standard deviation of student enrollment in the target population. If the target population statistics are not available, compare the characteristics of the individuals in the selected sample with those of the respondents.
• For item nonresponse, for each item, compare any available demographic or other characteristic of the respondents with the same characteristic of the target population. Use the same process as used for survey nonresponse to determine whether there is a difference between characteristic means, which may indicate the presence of nonresponse bias.
• If these simple preliminary tests show potential nonresponse bias, consult technical resources for further analysis, possibly using corrective weighting procedures (see Fowler, 2008; Groves, Dillman, Eltinge, & Little, 2002; U.S. Department of Education, 2012).
• If there is evidence of item nonresponse bias and corrective weighting procedures are not used, consider excluding those items.
• Consider these approaches for handling missing data resulting from nonresponse: • If some respondents skipped a particular survey item, calculate summary sta
tistics using only the available data (for example, calculate the percentage of schools that provided online credit recovery courses out of the schools that answered that item). This approach is appropriate if the item response rate is above 85 percent or if there is limited evidence of nonresponse bias.
• Consider imputation approaches to replace missing values (see Brick and Kalton, 1996, or Schafer and Graham, 2002, for more information). Rather than discarding respondents with missing data, imputation approaches replace missing data with values that are predicted from other information in the dataset.
Step 4: Calculate summary statistics
The survey team should calculate the summary statistics that will be most useful in answering the topics of interest, are appropriate for the type of survey response option (multiple-choice, rating scale, or open response; see box 2 for definitions), and are understandable to multiple audiences. Descriptions and considerations for each summary statistic are given in table 2, and a description of how summary statistics were calculated for the Northeast Rural Districts Research Alliance survey project is shown in box 6. Calculating summary statistics is described below.
• Use either specialized statistical software or spreadsheet software to calculate summary statistics (see appendix D for screenshots depicting the procedure for using SPSS to calculate each summary statistic described in table 2).
• For open response items with text responses, consult additional resources for qualitative analysis procedures (Jansen, 2010).
• Review the summary statistics to ensure that the statistics were computed correctly (for example, are all calculated percentages between 0 and 100 percent?).
• Discuss what the results tell you about the topics of interest. Remember that whether you can draw conclusions about the target population depends on the sampling procedures used (see part 2 of this series, Pazzaglia et al., 2016) and whether there is evidence of nonresponse bias.
10

Table 2. Summary statistics, calculations, and considerations
Statistic Calculation Considerations
Frequency A count of the respondents who selected a Frequencies are more meaningful when reported with the survey response. corresponding percentages of respondents. They are most often
reported for multiple-choice and rating scale survey response options.
Percentage A count of the respondents who selected a Percentages provide a straightforward summary statistic that can survey response divided by the total number of be easily understood by multiple audiences. They are most often respondents. used for multiple-choice and rating scale survey response options.
They are often more meaningful if reported with the corresponding frequencies of respondents.
Minimum The smallest value reported for a survey item. Minimums are usually presented along with the maximum to provide information about the range of survey responses. They are most often used for open response options that ask respondents to enter a numeric value (for example, years of teaching experience).
Maximum The largest value reported for a survey item. Maximums are usually presented along with the minimum to provide information about the range of survey responses. They are most often used for open response options that ask respondents to enter a numeric value.
Total The sum of the values reported for a survey item across respondents.
Totals may be of interest In some situations (for example, the total number of students enrolled in online courses across the state), though medians and means are more frequently reported. Totals are most often used for open response options that ask respondents to enter a numeric value.
Median The middle value (or average of the two middle values for an even number of values) when the values are listed from smallest to largest.
Medians are especially useful when there are extreme values, resulting in a mean that is not a good representation of a typical value. They are most often used for open response options that ask respondents to enter a numeric value. Nontechnical audiences may not be familiar with medians, so means may be preferable if the data are appropriate (see below).
Mean (average)
The sum of the values reported for a survey item divided by the total number of respondents.
The mean is the average of the item values. If the responses include outliers or extreme values (for example, one teacher in the sample has 50 years of teaching experience while all others have less than 5), the mean will not be a good representation of a typical value. In this case, the median is more appropriate. The mean is used for open response options that ask respondents to enter a numeric value.
Standard deviationa
Standard errora
A measure of how much individual values differ from the sample mean, calculated as the square root of the average of the squared deviations of each value from the mean. Smaller standard deviations (close to zero) imply that most values are close to the mean.
A measure of how close the sample mean is likely to be to the target population mean, calculated as the standard deviation divided by the square root of the sample size.
Standard deviations provide information about the variation within the sample. They are often presented along with the mean for open response options that ask respondents to enter a numeric value. Standard deviations may be more appropriate for technical audiences.
Standard errors provide information about the accuracy of the sample mean in estimating the target population mean. They are often presented along with the mean for open response options that ask respondents to enter a numeric value. Standard errors may be more appropriate for technical audiences.
a. Further information about the distinction between standard deviations and standard errors and when to use each can be found in Streiner (1996).
Source: Authors’ construction.
11
Box 6. Step 4 in practice: Calculating summary statistics for the online course use survey
The Northeast Rural Districts Research Alliance survey team calculated summary statistics
using statistical software. As outlined in the analysis plan, they calculated the percentage
of respondents who selected each option and the associated standard errors for the mul
tiple-choice and rating scale items. For open response items that asked for the number of
students enrolled in online courses, the survey team calculated the minimum, maximum, total,
mean, and standard error.
Step 5: Present the results in tables or figures
Next the survey team should consider how to present the results in a way that will help the audience understand and interpret the findings and their implications. The Northeast Rural Districts Research Alliance survey team’s approach to presenting the results of the online course use survey is described in box 7, and examples of different types of tables and figures using data from the survey are shown in appendix E. Considerations in deciding how to present the findings are given below:
• Select the overall message and presentation format with the target audience in mind. • Multiple reports for different audiences may be necessary depending on how
each audience needs to use the information. For example, a summary of survey results in a parent newsletter may focus on the survey questions of interest to parents, while a report for administrators may include data from all survey questions.
• Different statistics and presentation formats are appropriate for different audiences (for example, figures that focus on percentages, frequencies, or means may be ideal for less technical audiences, while tables that include both means and standard deviations may be appropriate for more technical audiences).
Box 7. Step 5 in practice: Presenting the results of the online course use survey
Guided by the analysis plan, the Northeast Rural Districts Research Alliance survey team pre
pared tables and figures for each survey item using templates in Microsoft Word (see appendix
E for examples). Tables included multiple summary statistics, such as both means and stan
dard errors or percentages and standard errors. Stacked bar graphs and pie charts provid
ed visually appealing and accessible summaries of percentages. Since these figures did not
include standard errors, notes referred interested readers to the tables in the appendix of the
report for additional statistical information.
To ensure that the survey results were understandable to stakeholders, the survey team
presented preliminary summary statistics in tables and figures to New York stakeholders who
advised the survey project. These stakeholders provided helpful information about the key
takeaways, which were then highlighted in the written report. The stakeholders also posed
questions that had not been included in the original analysis plan for the survey team to con
sider addressing with additional summary statistics or future research.
12
• Be thoughtful about the best way to present data in tables and figures. • Take advantage of table and figure templates available in spreadsheet, word
processing, and statistical software packages to ensure consistent formatting throughout reports.
• Consider using visually appealing figures, such as bar graphs (see figure E1 in appendix E) and pie charts (see figure E2 in appendix E). Figures attract readers’ attention and present information in a more easily digested form than tables. (For example, compare figure E1 and table E1, which present the same data in different ways.)
• Ensure that tables and figures include enough information to be understood on their own without reference to the report text (for example, include the survey question that resulted in the data, label the response options, and tell how many respondents completed the survey item; see tables E1 and E2 in appendix E).
• Though it is important to include enough information, do not clutter the figures or tables with unnecessary information that may detract from the message or confuse the reader.
• Infographics are visual presentations of data or other information that attract attention and quickly and clearly convey meaning (see figure F1 in appendix F for a sample infographic from the Northeast Rural Districts Research Alliance online course use survey). This type of presentation is particularly useful for highlighting key takeaways in websites or newsletters.
• Consider asking individuals from several stakeholder groups (for example, teachers, parent groups, and school administrators) to review the preliminary survey findings and their presentation to ensure that the presentation is clear and complete.
Using this guide
This guide (the third in a three-part series) provides educators with an overview of commonly used analysis and reporting procedures for surveys conducted in practical education contexts. Educators can use it to review their analysis plans, prepare and check data files, calculate response rates, calculate summary statistics, and present their survey results. When conducted appropriately, these procedures can lead to the use of survey findings to make decisions about policy or practice at schools and local or state education agencies. The first guide in the series covers survey development, and the second guide in the series covers sample selection and survey administration.
Limitations of this guide
This guide has two limitations. First, it does not discuss more complex analysis procedures (for example, multiple regression analysis) or the assessment of survey reliability and validity. Educators and policymakers interested in these topics should seek additional resources (see appendix A).
Second, the process for analyzing and reporting survey data shown in this guide can be time and resource intensive. Some of the activities may require additional resources such as specialized statistical software, though the summary statistics can be calculated using spreadsheet software such as Microsoft Excel.
13
Appendix A. Additional resources for analyzing and reporting survey data
Additional resources for analyzing and reporting survey data include textbooks, journal articles, and professional organizations with expertise in these topics.
Potentially useful texts
Brick, J. M., & Kalton, G. (1996). Handling missing data in survey research. Statistical Methods in Medical Research, 5, 215–238.
Fuller, W. A. (2009). Sampling statistics. Hoboken, NJ: Wiley.
Groves, R. M., Dillman, D. A., Eltinge, J. L., & Little, R. J. A. (Eds.). (2002). Survey nonresponse. Hoboken, NJ: Wiley.
Kelley, K., Clark, B., Brown, V., & Sitzia, J. (2003). Good practice in the conduct and reporting of survey research. International Journal for Quality in Health Care, 15(3), 261–266.
Lee, E. S., and Forthofer, R. N. (2006). Analyzing complex survey data (2nd ed.). Thousand Oaks, CA: Sage.
Osborne, J. W. (2013). Best practices in data cleaning. Thousand Oaks, CA: Sage.
Pfeffermann, D. (1996). The use of sampling weights for survey data analysis. Statistical Methods in Medical Research, 5, 239–261.
Schafer, J. L., & Graham, J. W. (2002). Missing data: Our view of the state of the art. Psychological Methods, 7(2), 147–177.
Tufte, E. (2006). Beautiful evidence. Cheshire, CT: Graphics Press.
Other potentially useful resources
Center for Teaching and Learning http://ctl.utexas.edu/teaching/professional-development/assess-teaching/resources
University of Wisconsin-Extension Cooperative: Using Excel for Analyzing Survey Questionnaires
https://learningstore.uwex.edu/assets/pdfs/G3658–14.pdf
A-1
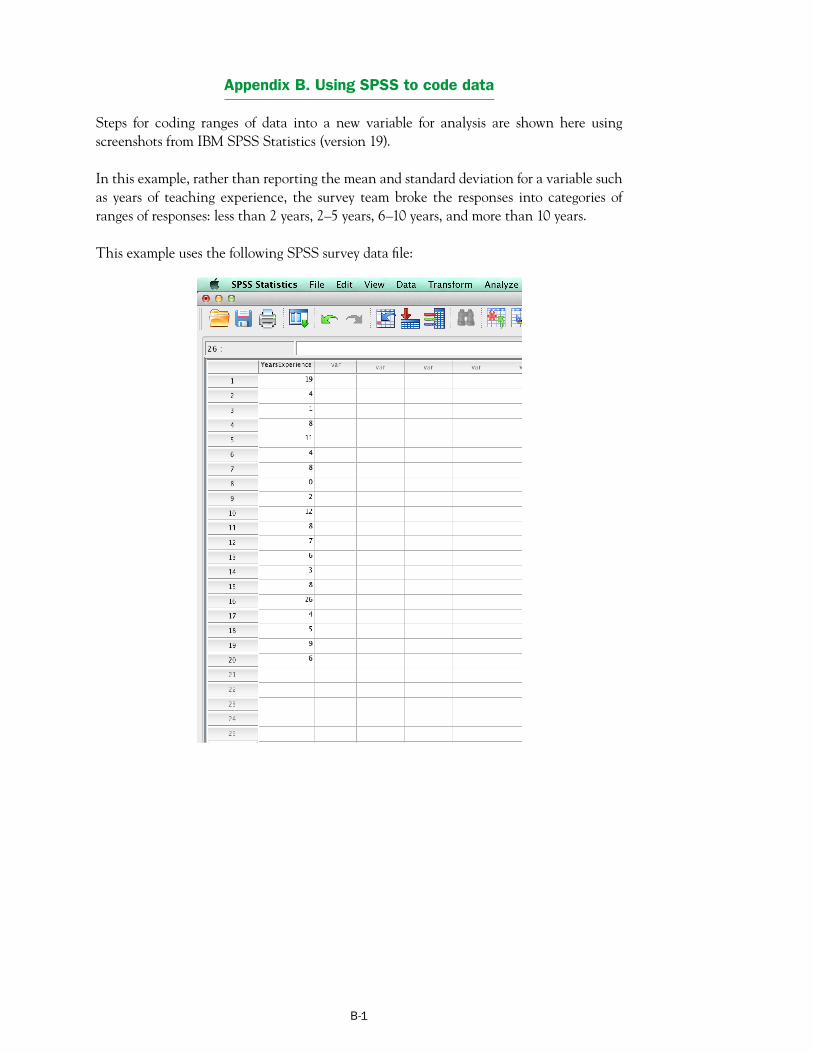
Appendix B. Using SPSS to code data
Steps for coding ranges of data into a new variable for analysis are shown here using screenshots from IBM SPSS Statistics (version 19).
In this example, rather than reporting the mean and standard deviation for a variable such as years of teaching experience, the survey team broke the responses into categories of ranges of responses: less than 2 years, 2–5 years, 6–10 years, and more than 10 years.
This example uses the following SPSS survey data file:
B-1
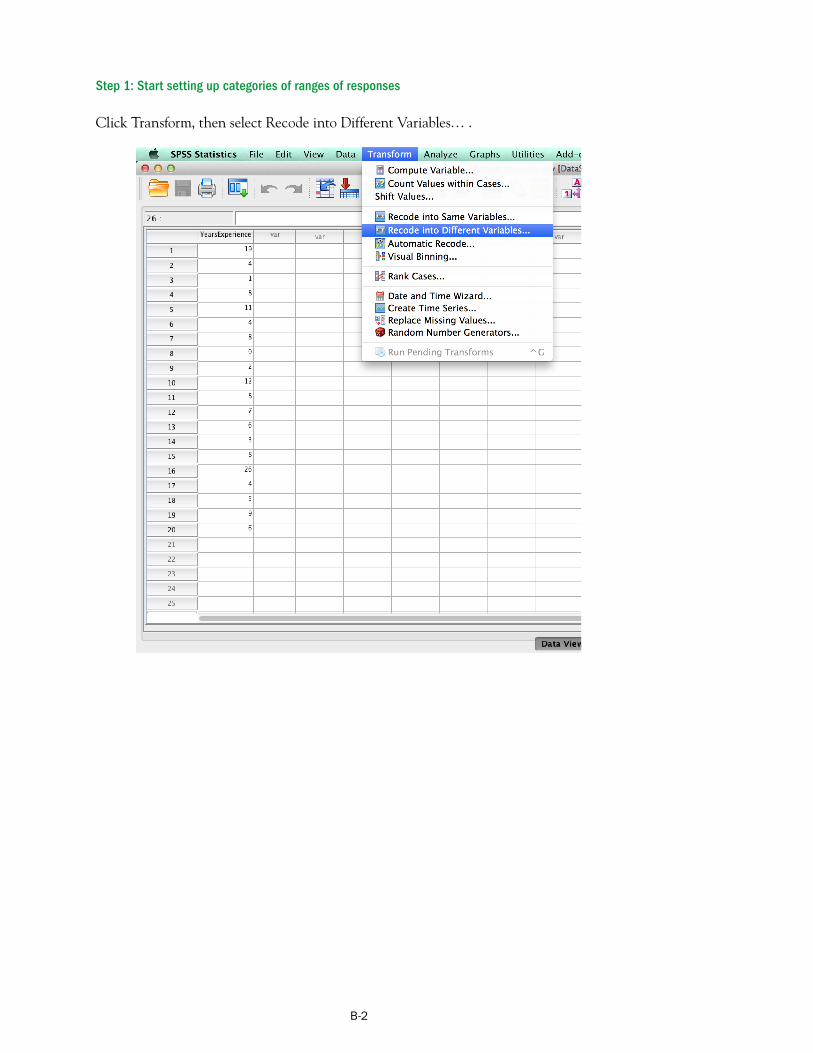
Step 1: Start setting up categories of ranges of responses
Click Transform, then select Recode into Different Variables… .
B-2
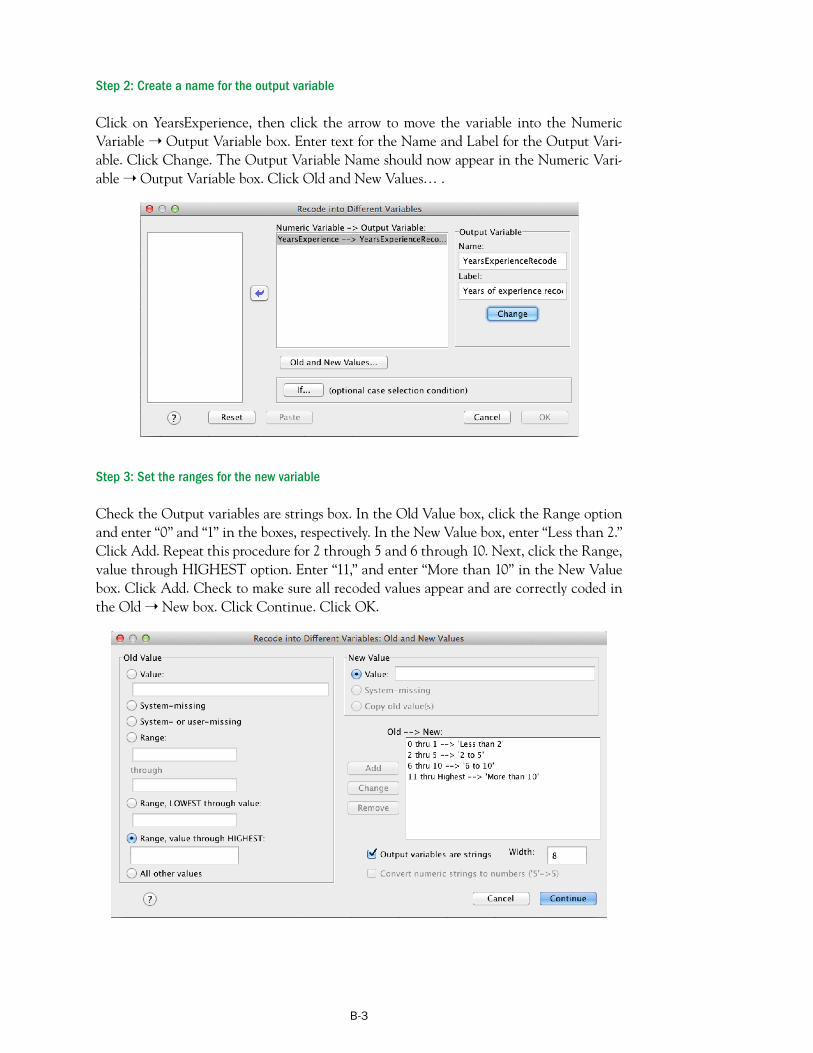
Step 2: Create a name for the output variable
Click on YearsExperience, then click the arrow to move the variable into the Numeric Variable ➝ Output Variable box. Enter text for the Name and Label for the Output Variable. Click Change. The Output Variable Name should now appear in the Numeric Variable ➝ Output Variable box. Click Old and New Values… .
Step 3: Set the ranges for the new variable
Check the Output variables are strings box. In the Old Value box, click the Range option and enter “0” and “1” in the boxes, respectively. In the New Value box, enter “Less than 2.” Click Add. Repeat this procedure for 2 through 5 and 6 through 10. Next, click the Range, value through HIGHEST option. Enter “11,” and enter “More than 10” in the New Value box. Click Add. Check to make sure all recoded values appear and are correctly coded in the Old ➝ New box. Click Continue. Click OK.
B-3
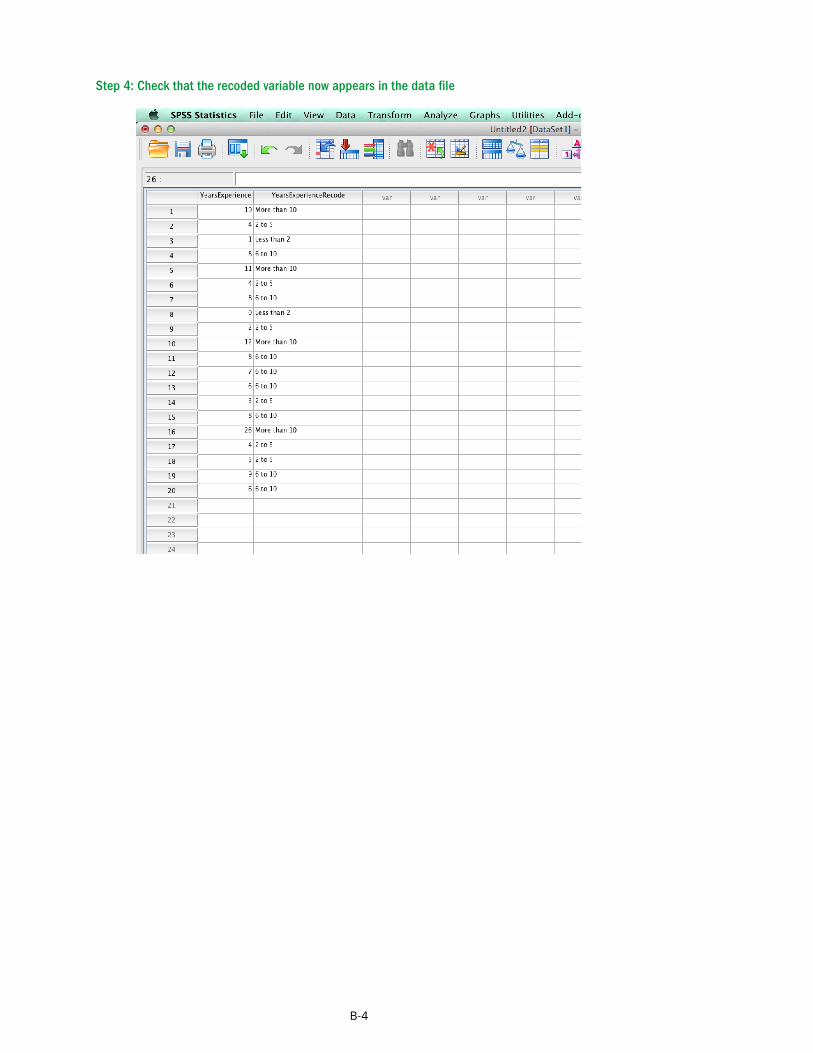
Step 4: Check that the recoded variable now appears in the data file
B-4

Appendix C. Sample response rate table
The survey team for the Northeast Rural Districts Research Alliance online course use survey did a preliminary check for survey nonresponse bias by comparing the characteristics of the target population and respondents. The average (mean) characteristics of these two groups are shown in table C1. A difference in the means between respondents and the target population for a given characteristic may be meaningful if it is larger than the target population’s standard deviation. For example, the mean student enrollment for respondent schools (751) is compared to the mean student enrollment for target population schools (655), and the size of the difference (96) is compared to the standard deviation of student enrollment in the target population (555). In this case, the difference is smaller than the standard deviation. Thus, there does not appear to be a meaningful difference between the schools that responded to the survey and those that did not.
Survey teams that find evidence of nonresponse bias should consult additional resources for information about nonresponse bias analysis and corrective weighting procedures (for example, Fowler, 2008; Groves et al., 2002; U.S. Department of Education, 2012).
C-1

Table C1. Checking for survey nonresponse bias by comparing target population and respondent characteristics
School characteristic
Target population Respondents
Number of schools Percent Mean
Standard deviation
Number of schools Percent Mean
Standard deviation
All schools 98 100 59 60
Locale
City/suburban 26 27 20 34
Town 17 17 9 15
Rural 55 56 30 51
Pre-K/K–12 16 16 9 15
7–12 22 22 13 22
Grade span
9–12 54 55 34 58
Other 6 6 3 5
Eligible 88 90 51 86
Not eligible 9 9 7 12
Title 1 eligibility
Race/ethnicity (percent of students)
American Indian or Alaskan Native 0 0 0 0
Asian 2 3 2 3
Black 4 8 5 11
White 91 15 88 18
Hawaiian Native or Pacific Islander 0 0 0 0
Hispanic 3 6 3 7
Two or more races 0 1 1 1
Percent of students eligible for free lunch 22 12 21 13
Total enrollment 655 555 751 604
Other characteristics
Full-time teachers 52 38 57 39
Pupil–teacher ratio 12 3 13 2
Note: Percentages may not sum to 100 because of rounding. Demographic data were not available for one school from the total of 99 that received the survey invitation, so it is excluded from these calculations.
Source: Clements, Pazzaglia, et al., 2015.
C-2
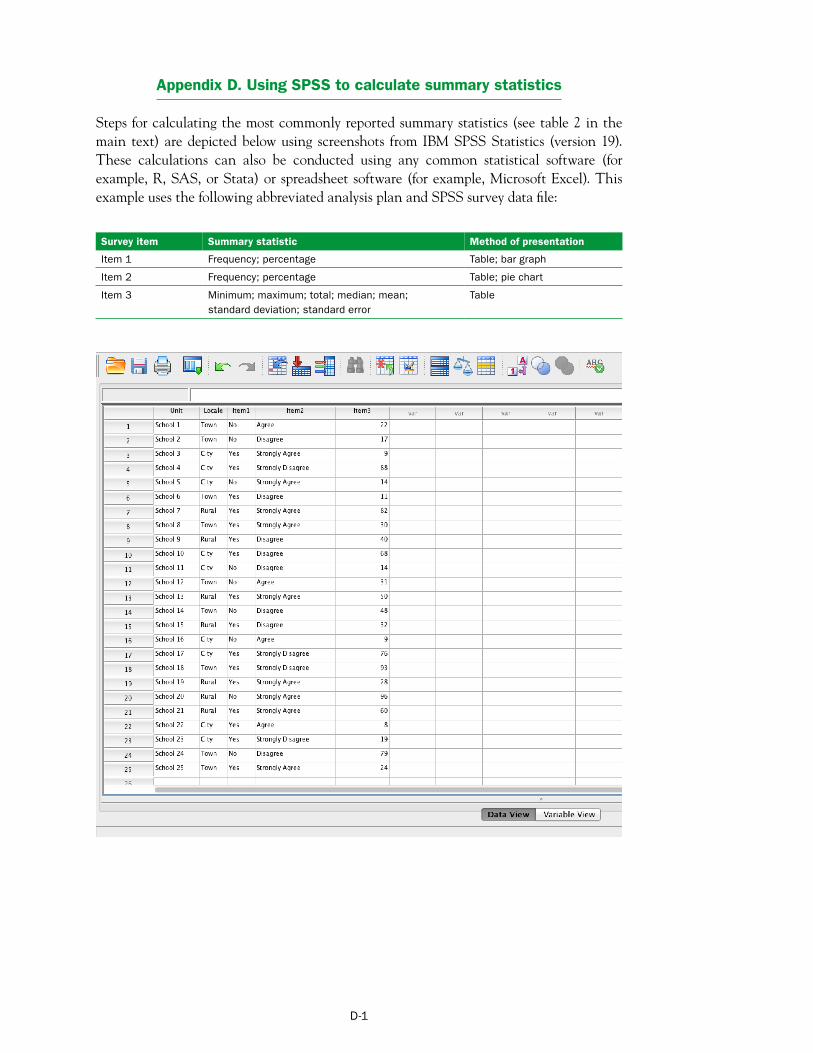
Appendix D. Using SPSS to calculate summary statistics
Steps for calculating the most commonly reported summary statistics (see table 2 in the main text) are depicted below using screenshots from IBM SPSS Statistics (version 19). These calculations can also be conducted using any common statistical software (for example, R, SAS, or Stata) or spreadsheet software (for example, Microsoft Excel). This example uses the following abbreviated analysis plan and SPSS survey data file:
Survey item Summary statistic Method of presentation
Item 1 Frequency; percentage Table; bar graph
Item 2 Frequency; percentage Table; pie chart
Item 3 Minimum; maximum; total; median; mean; Table standard deviation; standard error
D-1
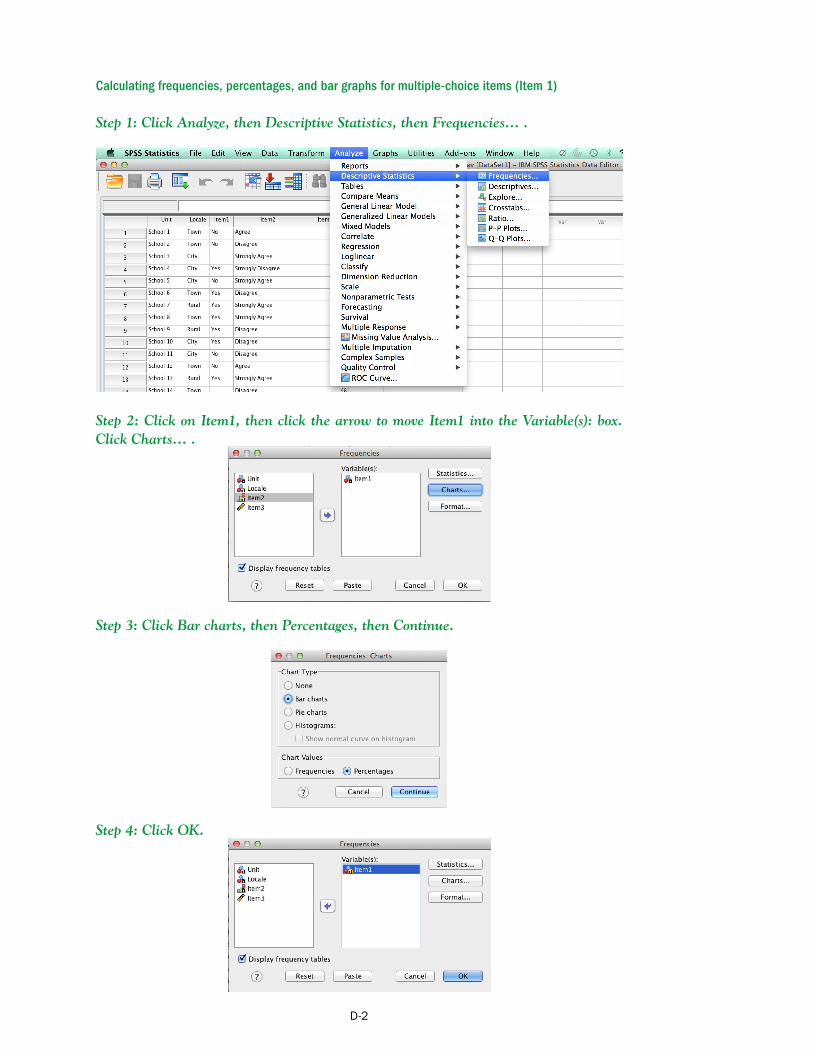
Calculating frequencies, percentages, and bar graphs for multiple-choice items (Item 1)
Step 1: Click Analyze, then Descriptive Statistics, then Frequencies… .
Step 2: Click on Item1, then click the arrow to move Item1 into the Variable(s): box. Click Charts… .
Step 3: Click Bar charts, then Percentages, then Continue.
Step 4: Click OK.
D-2
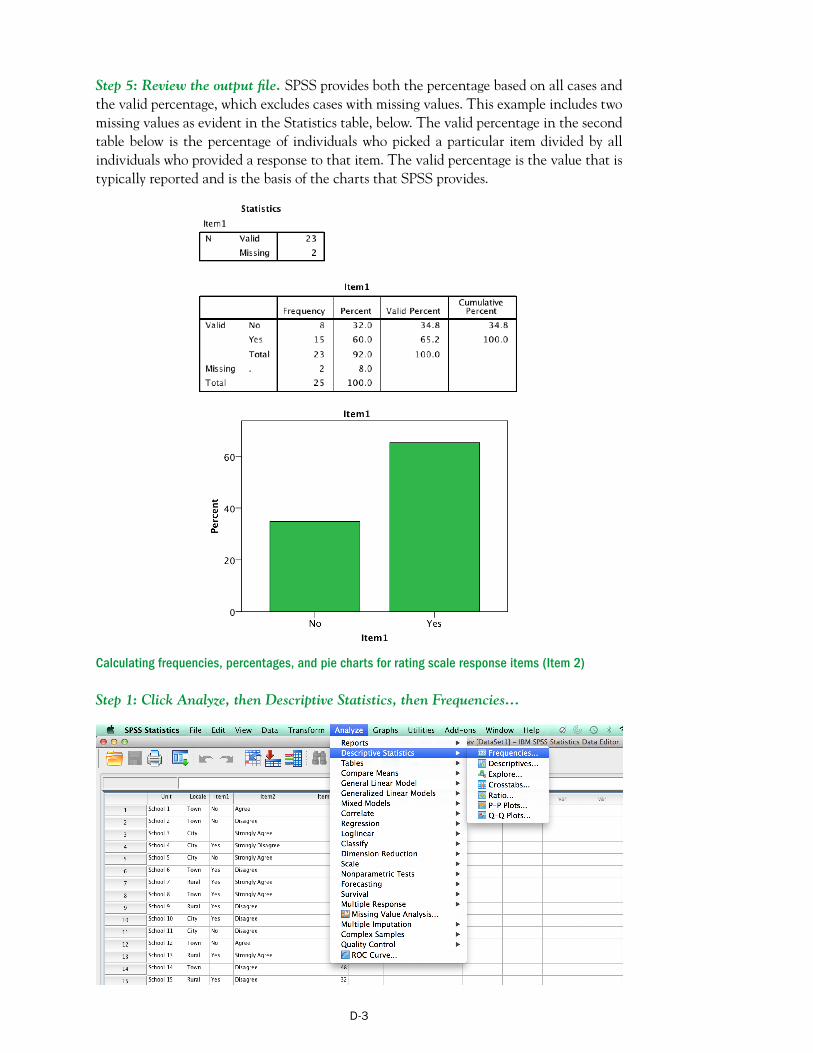
Step 5: Review the output file. SPSS provides both the percentage based on all cases and the valid percentage, which excludes cases with missing values. This example includes two missing values as evident in the Statistics table, below. The valid percentage in the second table below is the percentage of individuals who picked a particular item divided by all individuals who provided a response to that item. The valid percentage is the value that is typically reported and is the basis of the charts that SPSS provides.
Calculating frequencies, percentages, and pie charts for rating scale response items (Item 2)
Step 1: Click Analyze, then Descriptive Statistics, then Frequencies…
D-3
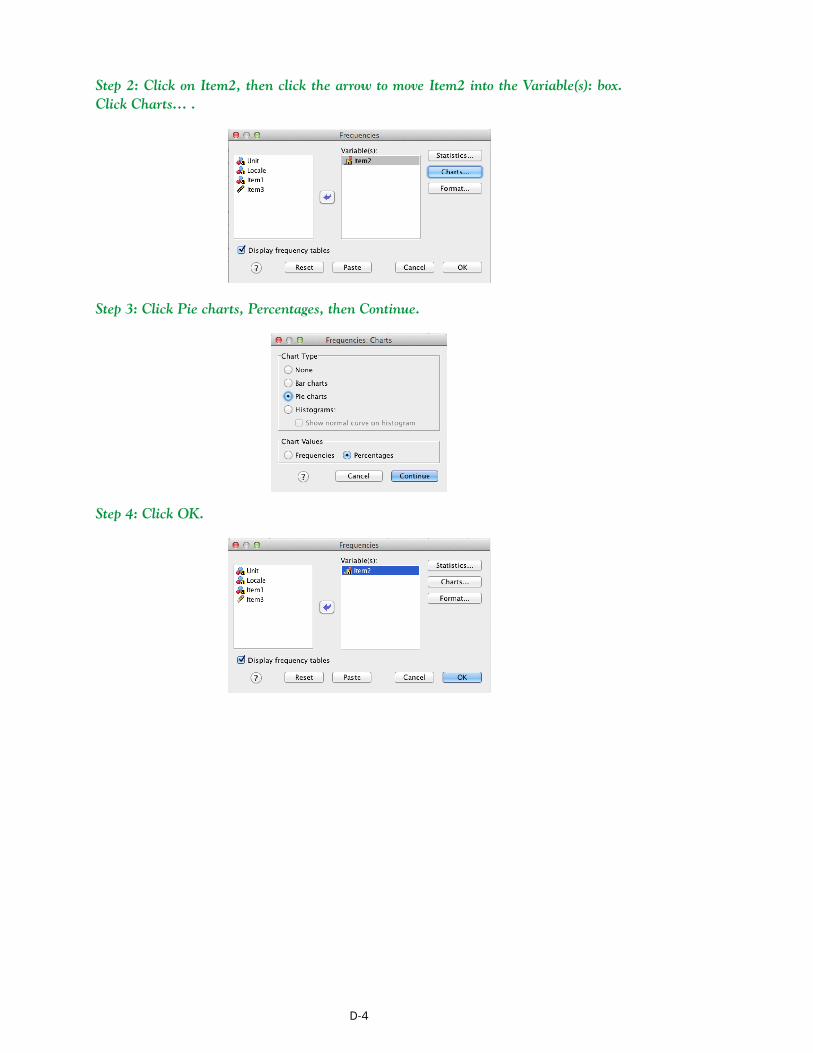
Step 2: Click on Item2, then click the arrow to move Item2 into the Variable(s): box. Click Charts… .
Step 3: Click Pie charts, Percentages, then Continue.
Step 4: Click OK.
D-4

Step 5: Review the output file. SPSS provides both the percentage based on all cases and the valid percentage, which excludes cases with missing values.
Calculating minimums, maximums, totals, medians, means, standard deviations, and standard errors for open response items (Item 3)
Step 1: Click Analyze, then Descriptive Statistics, then Descriptives…
Step 2: Click on Item3, then click the arrow to move Item3 into the Variable(s): box. Click Options… .
D-5
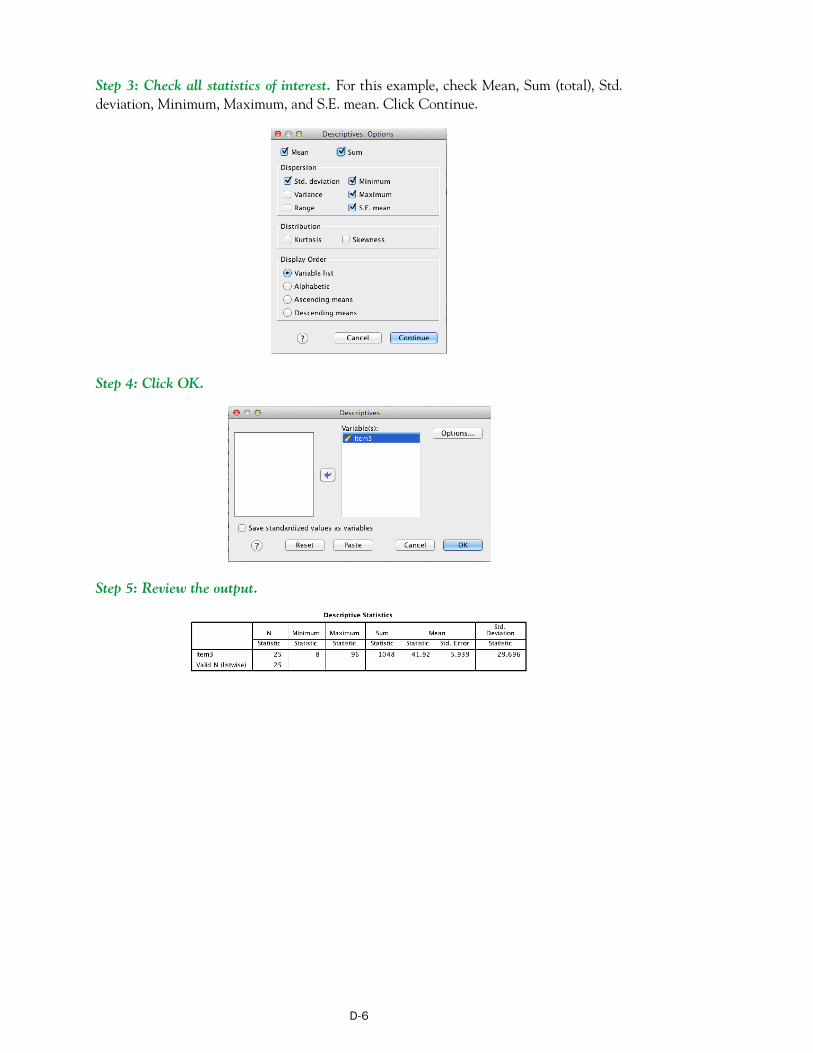
Step 3: Check all statistics of interest. For this example, check Mean, Sum (total), Std. deviation, Minimum, Maximum, and S.E. mean. Click Continue.
Step 4: Click OK.
Step 5: Review the output.
D-6

Appendix E. Sample figures and tables
This appendix provides examples of figures and tables commonly used to report survey data, including a stacked bar graph (figure E1), pie chart (figure E2), a table reporting percentages (table E1), and a table reporting percentages and standard errors (table E2). Stacked bar graphs or pie charts are appropriate for reporting percentages for multiple-choice or scale response items. Bar graphs are appropriate for comparing percentages or means of two subgroups of respondents (for example, males and females) for multiple-choice, scale, or open response items. Tables are appropriate for reporting the minimum, maximum, total, mean, standard deviation, and/or standard error for open response items.
Figure E1. Sample stacked bar graph displaying responses to the survey question, “How important were the following reasons for having online courses in your school in 2012/13?”
Credit recovery
Alternative learning environment
Scheduling conflicts
Students unable to attend school
Personalized student learning
Courses not available at the school
Early graduation
Cost reduction
College credit
Advanced Placement or college-level course
Certified teacher not available
Expanding teacher coverage
School space limitations
Not important Somewhat important Very important Don’t know
0 25 50
Percent
75 100
Note: N= 28 high schools responded.
Source: Adapted from Clements, Pazzaglia, et al. (2015).
Figure E2. Sample pie chart displaying responses to the survey question, “How important were the following reasons for having online courses in your school in 2012/13?” (percent of respondents)
a. To personalize student learning:
Not important
39%
Very important
32%
Somewhat important
21%
Don’t know 7%
Note: N = 28 high schools responded. Percentages do not sum to 100 because of rounding
Source: Adapted from Clements, Pazzaglia, et al. (2015).
E-1
’
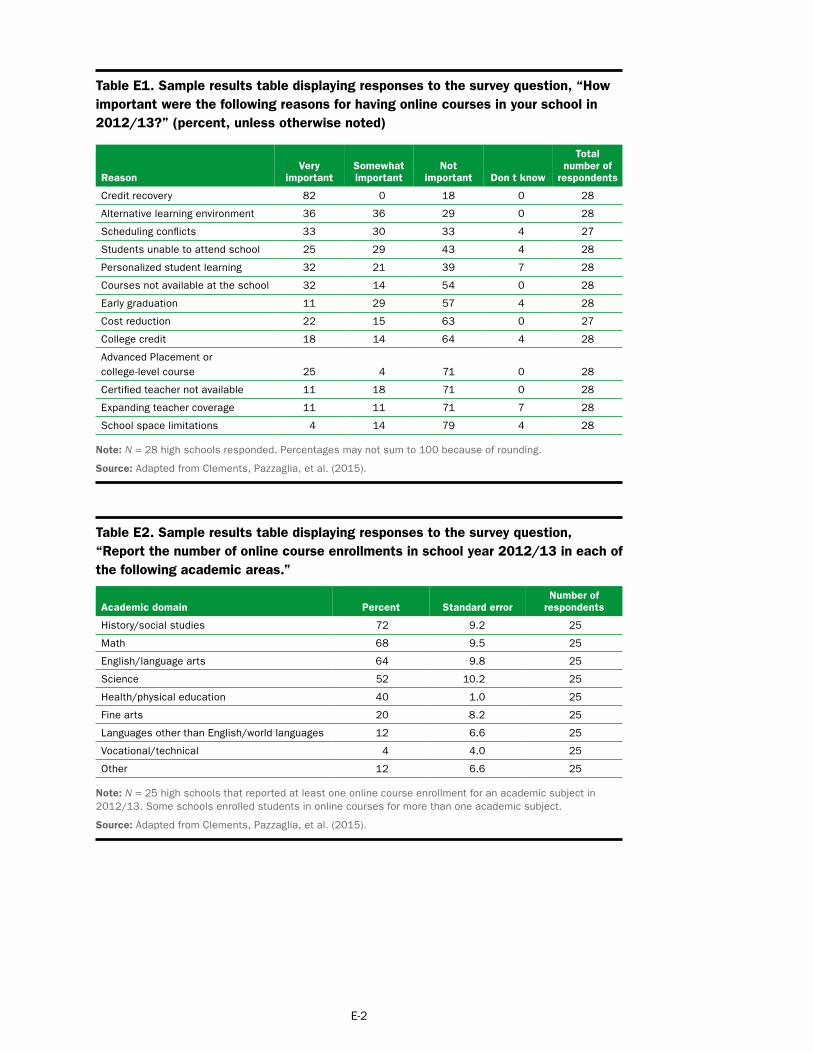
Table E1. Sample results table displaying responses to the survey question, “How important were the following reasons for having online courses in your school in 2012/13?” (percent, unless otherwise noted)
Reason Very
important Somewhat important
Not important Don t know
Total number of
respondents
Credit recovery 82 0 18 0 28
Alternative learning environment 36 36 29 0 28
Scheduling conflicts 33 30 33 4 27
Students unable to attend school 25 29 43 4 28
Personalized student learning 32 21 39 7 28
Courses not available at the school 32 14 54 0 28
Early graduation 11 29 57 4 28
Cost reduction 22 15 63 0 27
College credit 18 14 64 4 28
Advanced Placement or college-level course 25 4 71 0 28
Certified teacher not available 11 18 71 0 28
Expanding teacher coverage 11 11 71 7 28
School space limitations 4 14 79 4 28
Note: N = 28 high schools responded. Percentages may not sum to 100 because of rounding.
Source: Adapted from Clements, Pazzaglia, et al. (2015).
Table E2. Sample results table displaying responses to the survey question, “Report the number of online course enrollments in school year 2012/13 in each of the following academic areas.”
Academic domain Percent Standard error Number of
respondents
History/social studies 72 9.2 25
Math 68 9.5 25
English/language arts 64 9.8 25
Science 52 10.2 25
Health/physical education 40 1.0 25
Fine arts 20 8.2 25
Languages other than English/world languages 12 6.6 25
Vocational/technical 4 4.0 25
Other 12 6.6 25
Note: N = 25 high schools that reported at least one online course enrollment for an academic subject in 2012/13. Some schools enrolled students in online courses for more than one academic subject.
Source: Adapted from Clements, Pazzaglia, et al. (2015).
E-2
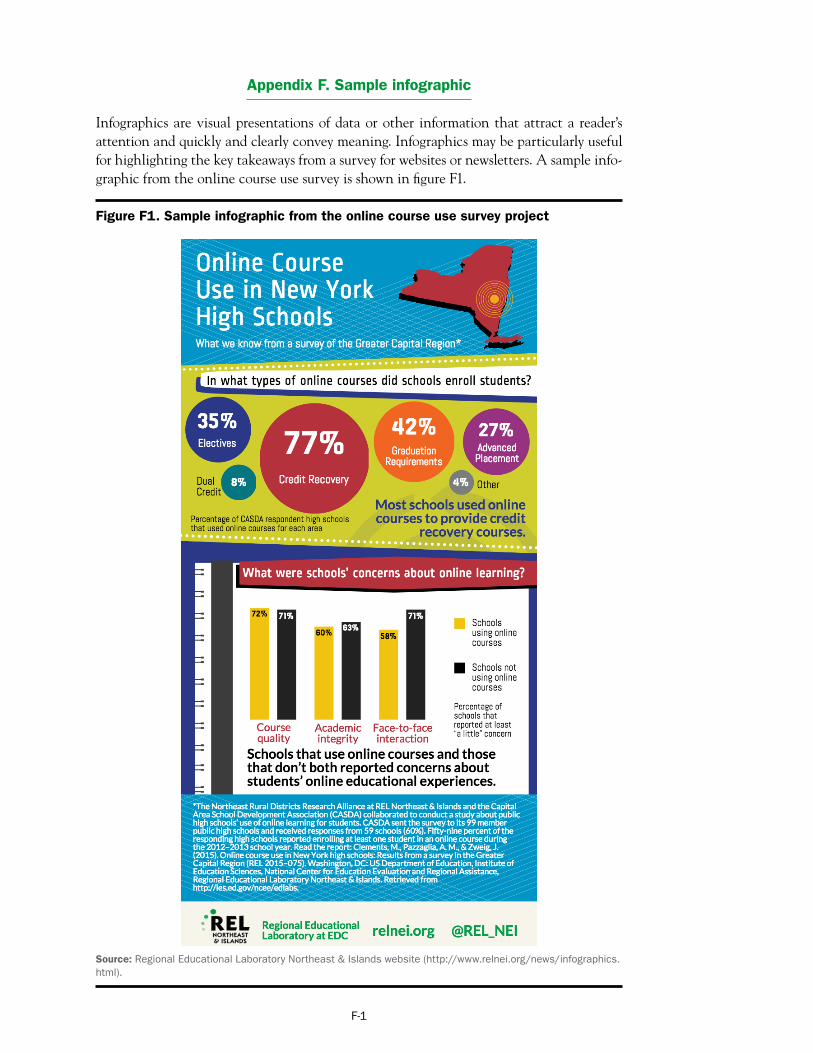
Appendix F. Sample infographic
Infographics are visual presentations of data or other information that attract a reader’s attention and quickly and clearly convey meaning. Infographics may be particularly useful for highlighting the key takeaways from a survey for websites or newsletters. A sample info-graphic from the online course use survey is shown in figure F1.
Figure F1. Sample infographic from the online course use survey project
Source: Regional Educational Laboratory Northeast & Islands website (http://www.relnei.org/news/infographics. html).
F-1
References
Brick, J. M., & Kalton, G. (1996). Handling missing data in survey research. Statistical Methods in Medical Research, 5, 215–238.
Clements, M., Pazzaglia, A. M., & Zweig, J. (2015). Online course use in New York high schools: Results from a survey in the Greater Capital Region (REL 2015–075). Washington, DC: U.S. Department of Education, Institute of Education Sciences, National Center for Education Evaluation and Regional Assistance, Regional Educational Laboratory Northeast & Islands. http://eric.ed.gov/?id=ED555633
Clements, M., Zweig, J., & Pazzaglia, A. M. (2015). Stated Briefly: Online course use in New York high schools: Results from a survey in the Greater Capital Region (REL 2015–074). Washington, DC: U.S. Department of Education, Institute of Education Sciences, National Center for Education Evaluation and Regional Assistance, Regional Educational Laboratory Northeast & Islands. http://eric.ed.gov/?id=ED555634
Fink, A. (2013). How to conduct surveys: A step-by-step guide (5th ed.). Thousand Oaks, CA: Sage.
Fowler, Jr., F. J. (2009). Survey Research Methods (4th ed.). Thousand Oaks, CA: Sage.
Groves, R. M., Dillman, D. A., Eltinge, J. L., & Little, R. J. A. (Eds.). (2002). Survey nonresponse. Hoboken, NJ: Wiley.
Hamilton, L., Halverson, R., Jackson, S., Mandinach, E., Supovitz, J., & Wayman, J. (2009). Using student achievement data to support instructional decision making (NCEE 2009–4067). Washington, DC: U.S. Department of Education, Institute of Education Sciences, National Center for Education Evaluation and Regional Assistance. http:// eric.ed.gov/?id=ED506645
Irwin, C. W., & Stafford, E. T. (2016). Survey methods for educators: Collaborative survey development (part 1 of 3) (REL 2016–163). Washington, DC: U.S. Department of Education, Institute of Education Sciences, National Center for Education Evaluation and Regional Assistance, Regional Educational Laboratory Northeast & Islands.
Jansen, H. (2010). The logic of qualitative survey research and its position in the field of social research methods. Qualitative Social Research, 11(2), 26. Retrieved August 3, 2015, from http://www.qualitative-research.net/index.php/fqs/article/view/1450/2946.
Knapp, M. S., Swinnerton, J. A., Copland, M. A., & Monpas-Huber, J. (2006). Data-informed leadership in education. Seattle, WA: University of Washington, Center for the Study of Teaching and Policy. http://eric.ed.gov/?id=ED494198
Pazzaglia, A. M., Stafford, E. T., & Rodriguez, S. (2016). Survey methods for educators: Selecting samples and administering surveys (part 2 of 3) (REL 2016–160). Washington, DC: U.S. Department of Education, Institute of Education Sciences, National Center for Education Evaluation and Regional Assistance, Regional Educational Laboratory Northeast & Islands.
Ref-1

Schafer, J. L., & Graham, J. W. (2002). Missing data: Our view of the state of the art. Psychological Methods, 7(2), 147–177.
Streiner, D. L. (1996). Maintaining standards: Differences between the standard deviation and standard error, and when to use each. Canadian Journal of Psychiatry, 41(8), 498– 502. Retrieved August 21, 2015, from http://ww1.cpa-apc.org/Publications/Archives/ PDF/1996/Oct/strein2.pdf.
U.S. Department of Education, National Center for Education Statistics. (2011). Common Core of Data. Public Elementary/Secondary School Universe Survey, 2010–2011. Retrieved April 1, 2012, from http://nces.ed.gov/ccd/pubschuniv.asp.
U.S. Department of Education, National Center for Education Statistics. (2012). NCES statistical standards. Retrieved February 9, 2015, from http://nces.ed.gov/statprog/2012.
U.S. Department of Education, Office of Planning, Evaluation, and Policy Development. (2010). Use of education data at the local level from accountability to instructional improvement. http://eric.ed.gov/?id=ED511656
Ref-2

The Regional Educational Laboratory Program produces 7 types of reports
Making Connections Studies of correlational relationships
Making an Impact Studies of cause and effect
What’s Happening Descriptions of policies, programs, implementation status, or data trends
What’s Known Summaries of previous research
Stated Briefly Summaries of research findings for specific audiences
Applied Research Methods Research methods for educational settings
Tools Help for planning, gathering, analyzing, or reporting data or research