survey of agricultural production methods - home - · pdf filethe survey of agricultural p...
TRANSCRIPT

Introduction
The Survey of Agricultural Production Methods (SAPM) was carried out on a sample of 40,000 farm holdings in
September 2010 as part of the EU Farm Structure Survey. The survey covered farm practices relating to crop
rotation and soil conservation, manure and slurry storage and usage, grazing levels, and livestock housing.
The results of this survey will be used in the development of EU and national policies on agriculture and the
environment.
As this was the first time this survey was carried out, there is no previous data available for comparisons. Of the
40,000 holdings sampled, 25,885 responses were received, giving a response rate of 65%. The sample was
stratified based on the size of the holding and whether or not the farm was involved in specialist pig or poultry
production. The results presented below have been grossed to the population of farm holdings resulting from
the COA 2010. A copy of the SAPM questionnaire is provided in Appendix 5.
Principal Results
1. Crop Rotation
In 2010 approximately one million hectares of land were considered to be arable land (i.e. excludes permanent
grassland, rough grazing and crops under cover). The survey asked respondents about various farm practices
relating to crop rotation and soil conservation.
Crop rotation is the practice of alternating annual crops grown on a specific field in a planned pattern or
sequence in successive crop years so that crops of the same species are not grown without interruption on the
same field (mono-cropping). Figure 1 shows the distribution of farm holdings that had arable land, according to
the share of arable land with crop rotation. The majority of farms (86.1%) employed crop rotation on all of their
arable land.
89
Survey of Agricultural
Production Methods

2. Soil Conservation
The survey also asked about the type of soil cover used on arable land during Winter 2009/2010. Various farm
practices can be used in order to reduce soil degradation over the winter months. Maintaining soil cover is one
practice which reduces soil erosion and the loss of particular pollutants (i.e. those attached to soil). This
practice also increases soil organic matter.
Over half of the arable land (57%) was reported to be covered with crop residues (stubble or other plant parts
remaining after previous harvest). Standard winter crops (winter barley, wheat and oats) accounted for 34% of
the soil cover, cover crops (or intermediate crop sown and ploughed before new Spring planting) accounted for
5% and the remaining 4% was bare, ploughed soil.
Soil conditions can be affected by different tillage techniques; conventional ploughing (or inversion tillage)
leaves low levels of crop residues resulting in increased soil erosion. Reduced tillage (where at least 30% of
stubble and crop residue remain on the surface after cultivation) has advantages in terms of managing soil
erosion and potentially improving soil structure through the build up of soil organic matter.
Figure 3 shows the percentage of arable land by tillage method employed in the 12 months prior to September
2010. The majority (93%) of arable land was being tilled by conventional ploughing. Reduced tillage was
employed on 5% and zero tillage on 2% of arable land.
90

Manure and Slurry - Storage and Movement
Respondents were asked to indicate if constructed storage facilities were used for slurry or solid manure during
the previous 12 months, and whether these facilities were covered or uncovered. Almost half of all farms
(47.5%) had a slurry tank. 44.3% of farms had a covered slurry lagoon and only 2.1% had an uncovered slurry
lagoon. It should be noted that farms can have more than one type of of storage facility.
Almost 85% of farms did not export any manure or slurry from their holding and 5.2% of farms reported that they
exported between 75-100% of the manure and slurry produced on the holding.
Almost 94% of holdings reported that they did not import any manure or slurry during the previous 12 months.
3.4% of holdings imported between 1-24% of the manure and slurry spread on the farm.
91

Slurry and Manure Application
Immediate incorporation of slurry and manure following application onto the ground is an efficient way of
reducing ammonia emissions and preserving nitrogen in the soil. The SAPM questionnaire asked respondents
what area of their land was applied with manure and with slurry, and on what area immediate incorporation was
used. Just over 70% of all farms reported that they spread slurry and/or manure on part or all of their land.
1. Solid Manure
Almost 45% of farms applied solid manure to at least part of their land (see Figure 7).
Of the farms that spread manure, 7.6% used immediate incorporation methods (i.e. ploughed into the land
within 4 hours of application) on at least some of their land.
Area with manure applied using
immediate incorporation
Number of
holdings (‘000)
% of
holdings
0% 58.0 92.4%
1-24% 4.3 6.8%
25-49% 0.3 0.5%
50-74% 0.1 0.2%
75%-100% 0.1 0.2%
2. Slurry
Almost 54% of farms applied slurry to at least part of their land (see Figure 8).
92
Of the farms that spread slurry, only 1.1% used immediate incorporation methods (i.e. injected or ploughed into
the soil within 4 hours of application) on at least some of their land.
Area with slurry applied using
immediateincorporation
Number of
holdings (‘000)
% of
holdings
0% 74.0 98.9%
1-24% 0.5 0.7%
25-49% 0.2 0.2%
50-74% 0.1 0.1%
75-100% 0.1 0.1%
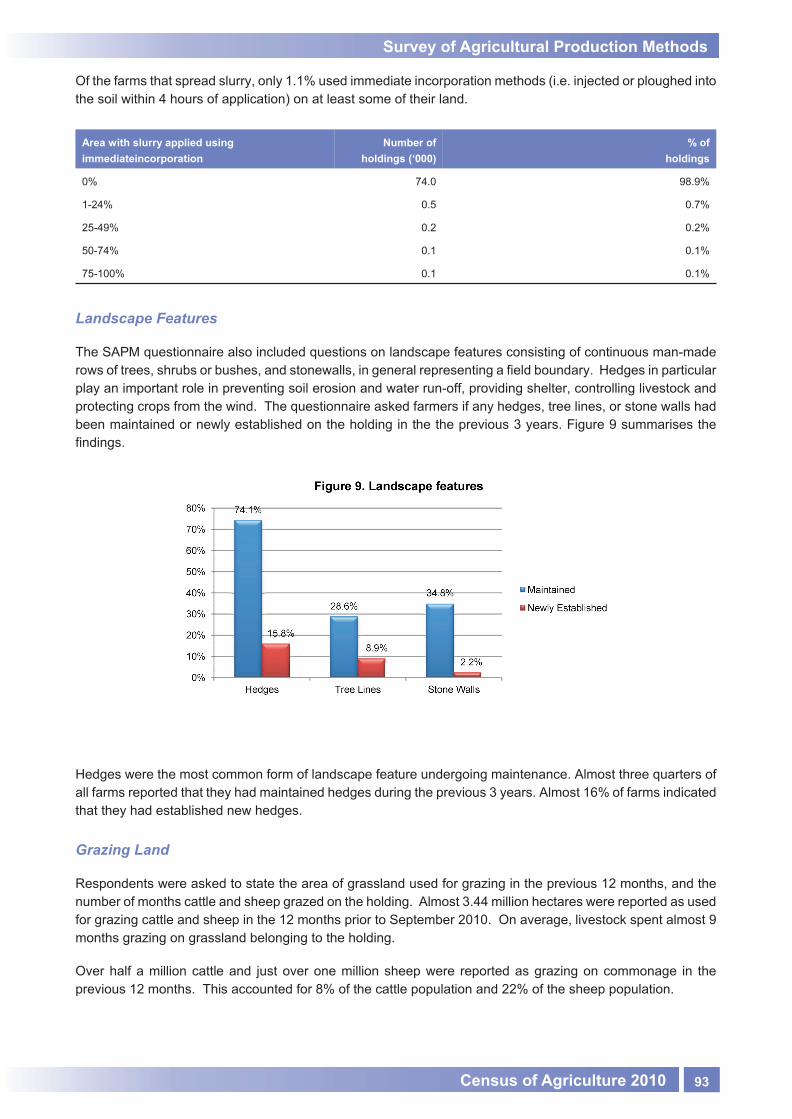
Landscape Features
The SAPM questionnaire also included questions on landscape features consisting of continuous man-made
rows of trees, shrubs or bushes, and stonewalls, in general representing a field boundary. Hedges in particular
play an important role in preventing soil erosion and water run-off, providing shelter, controlling livestock and
protecting crops from the wind. The questionnaire asked farmers if any hedges, tree lines, or stone walls had
been maintained or newly established on the holding in the the previous 3 years. Figure 9 summarises the
findings.
Hedges were the most common form of landscape feature undergoing maintenance. Almost three quarters of
all farms reported that they had maintained hedges during the previous 3 years. Almost 16% of farms indicated
that they had established new hedges.
Grazing Land
Respondents were asked to state the area of grassland used for grazing in the previous 12 months, and the
number of months cattle and sheep grazed on the holding. Almost 3.44 million hectares were reported as used
for grazing cattle and sheep in the 12 months prior to September 2010. On average, livestock spent almost 9
months grazing on grassland belonging to the holding.
Over half a million cattle and just over one million sheep were reported as grazing on commonage in the
previous 12 months. This accounted for 8% of the cattle population and 22% of the sheep population.
93

Livestock Housing
Cattle
Almost 70% of farms reported that they had some form of housing for cattle. The table below gives the total
number of places available for housing cattle over winter 2009/2010 along with the number of holdings that
reported each system of housing.
Type of cattle
housing
Number of
places (‘000)
Numberof
holdings (‘000)
Cubicle housing - solid floor 1,086.3 26.8
Cubicle housing - slatted floor 1,274.7 29.7
Loose housing - solid floor 1,087.6 45.3
Loose housing - slatted floor 2,096.5 43.7
Other indoor housing 256.0 13.9
Total number of places 5,801.1
Sheep
Almost 18% of farms reported that they had some form of housing for sheep. The table below gives the total
number of places available for housing sheep over winter 2009/2010 along with the number of holdings that
reported each system of housing.
Type of sheep
housing
Number
of places ('000)
Number of
holdings (‘000)
Straw beds 1,216.1 19.4
Slatted housing 215.8 2.8
Other indoor housing 149.8 5.6
Total number of places 1,581.7
Pigs
Just over 1% of farms reported that they had some form of housing for pigs. The table below gives the total
number of places available for housing pigs over winter 2009/2010 along with the number of holdings that
reported each system of housing.
Type of pig
housing
Number
of places ('000)
Number of
holdings (‘000)
Partially slatted housing 264.5 0.3
Completely slatted housing 937.7 0.4
Straw beds 6.6 0.5
Other 3.9 0.7
Total number of places 1,212.7
94

Poultry
Just over 4% of farms reported that they had some form of housing for laying hens. The table below gives the
total number of places available for housing laying hens over winter 2009/2010 along with the number of
holdings that reported each system of housing.
Type of poultry
housing
Number
of places ('000)
Number of
holdings (‘000)
Cages 634.2 0.7
Deep pit (210.2) (0.2)
Stilt house (2.5) (0.3)
Manure belt (421.5) (0.2)
Straw beds 1,734.5 0.8
Other 1,437.5 4.6
Total number of places 4,440.3
95
