survey of beam optics solutions for the mls lattice · survey of beam optics solutions for the mls...
TRANSCRIPT
SURVEY OF BEAM OPTICS SOLUTIONS FOR THE MLS LATTICE
M. Ries, J. Feikes, T. Goetsch, G. Wustefeld, HZB, Berlin, Germany
AbstractThe Metrology Light Source (MLS) is an electron stor-
age ring containing 24 quadrupole magnets which can be
powered individually. Fully exploring the capabilities of
the machine optics by tracking or experiment would be
very time consuming. Therefore the quadrupoles were
combined in five families and a numerical brute force ap-
proach was used to scan for areas of stable solutions in the
scope of linear beam optics. In order to get information
on the expected beam lifetimes for each generated optics, a
model for the Touschek lifetime was implemented. Simula-
tion results as well as experimental tests of selected optics
will be presented.
INTRODUCTIONThe Metrology Light Source owned by the Physikalisch-
Technische Bundesanstalt (PTB) is used as a radiation
source standard from the infrared to the soft X-ray regime
[1, 2]. It is a ramped machine with an injection energy
of 105 MeV and an operation energy of 630 MeV. The
magnet lattice is characterized by a 4-fold symmetry. Long
(LS) and short (SS) straight sections are separated by dou-
ble bend achromat (DBA) segments in the setup: SS, DBA,
LS, -DBA, SS, DBA, LS, -DBA. The standard operation of
the machine is to power the quadrupoles in five different
families as shown in Fig. 1. To study the overall optics ca-
Figure 1: DBA segment of the MLS containing dipole (yel-
low), quadrupole (red), sextupole (green) magnets and an
octupole magnet (black) in the center. [3].
pabilities in this setup, a database containing linearly stable
solutions as well as corresponding performance parameters
was generated.
ALGORITHMFollowing the scheme of [4], as a first approach a Fortran
algorithm was written to scan for solutions while indepen-
dently varying the strengths of the five quadrupole families:
Q1, Q2L, Q2S, Q3L, Q3S (Fig. 1). To save computation
time the model was restricted to a vertically decoupled mo-
tion. A sketch of the algorithm with nested loops over all
five quadrupole family strengths looks like:
1. check vertical transfer matrix for stability criterion
2. check horizontal transfer matrix for stability criterion
3. apply feasibility filters
• maximum beta functions: βx,y < 20 m
• maximum dispersion: |D| < 2 m
4. calculate optics quantities of interest
5. calculate Touschek lifetime
In a first scan the quadrupole strengths were varied over the
full design range including polarity reversal. A constant
step size for all quadrupoles was used. A total number
of 1012 combinations was checked generating a database
of approximately 2 · 106 solutions. The runtime of the
code on a 2.66 GHz single core was about 200 h. Figure 2
xQ2 3 4 5 6
yQ
0
1
2
3
4
norm
aliz
ed s
olut
ions
-610
-510
-410
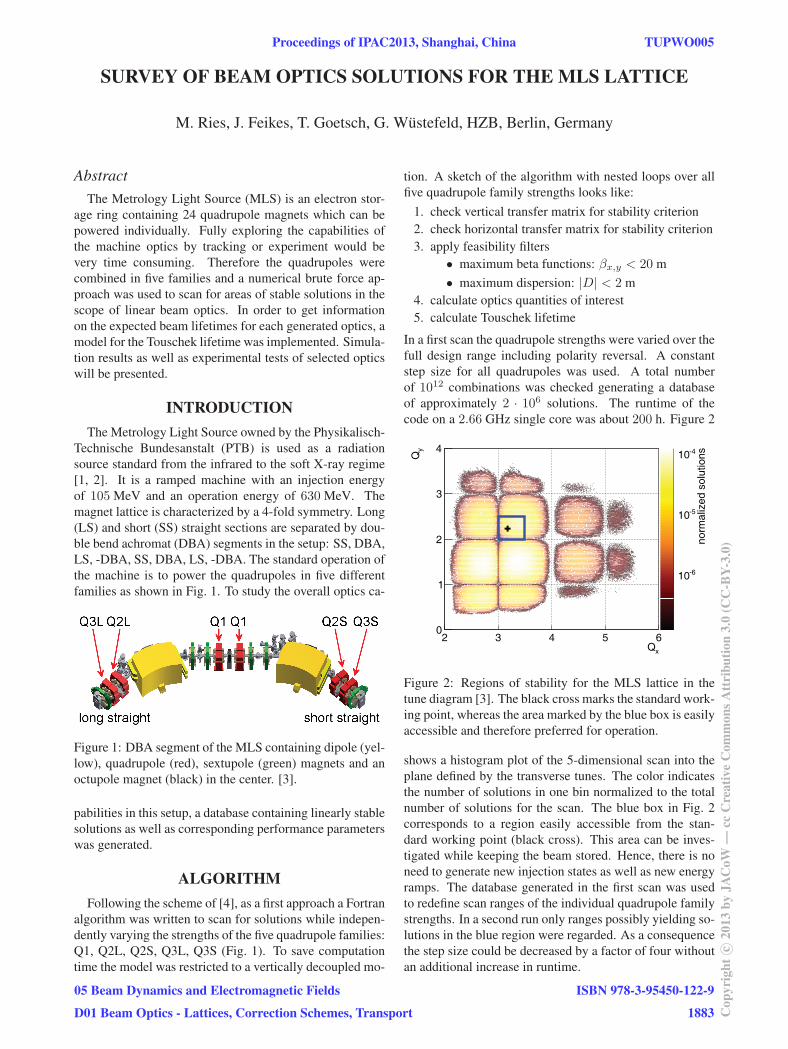
Figure 2: Regions of stability for the MLS lattice in the
tune diagram [3]. The black cross marks the standard work-
ing point, whereas the area marked by the blue box is easily
accessible and therefore preferred for operation.
shows a histogram plot of the 5-dimensional scan into the
plane defined by the transverse tunes. The color indicates
the number of solutions in one bin normalized to the total
number of solutions for the scan. The blue box in Fig. 2
corresponds to a region easily accessible from the stan-
dard working point (black cross). This area can be inves-
tigated while keeping the beam stored. Hence, there is no
need to generate new injection states as well as new energy
ramps. The database generated in the first scan was used
to redefine scan ranges of the individual quadrupole family
strengths. In a second run only ranges possibly yielding so-
lutions in the blue region were regarded. As a consequence
the step size could be decreased by a factor of four without
an additional increase in runtime.
Proceedings of IPAC2013, Shanghai, China TUPWO005
05 Beam Dynamics and Electromagnetic Fields
D01 Beam Optics - Lattices, Correction Schemes, Transport
ISBN 978-3-95450-122-9
1883 Cop
yrig
htc ○
2013
byJA
CoW
—cc
Cre
ativ
eC
omm
onsA
ttri
butio
n3.
0(C
C-B
Y-3.
0)

TOUSCHEK IMPLEMENTATIONAs measurements show, the lifetime at the MLS is Tou-
schek limited [5]. To find optics with an increased Tou-
schek lifetime a Touschek module was implemented into
the Fortran code. The Touschek lifetime depends on the
acceptance of the accelerator. Two major effects may limit
the momentum acceptance δacc:
• RF-acceptance
• geometrical acceptance.
The RF-acceptance is calculated following [6]. The geo-
metrical acceptance for the MLS can be calculated in a first
order approximation as
δacc ≈ min
[ax(s)
2Dx(s)
], (1)
with ax(s) being the horizontal aperture in each element
and Dx(s) the corresponding horizontal dispersion func-
tion. The maximum Touschek lifetime can be expected
where RF-acceptance and geometrical acceptance are equal
[5].
The Touschek lifetime is calculated according to the so-
lution presented by [7], including horizontal dispersion:
τT =8πσyσs
√σ2xβ + σ2
xD · γ2δ3acc
D(ξ)Nr2ec, (2)
with the vertical bunch size σy , the bunch length σs and
the Lorentz factor γ. The horizontal bunch size has two
contributions: σxβ =√βxεx being the contribution due
to emittance and σxD =√
Dx2σE
2 being the contribution
due to dispersion. D(ξ) is a function of acceptance δacc,
the optical functions, their derivatives and the electron en-
ergy. N is the number of particles in the bunch (calcula-
tions for 1 mA at the MLS: N = 1 · 109) and re is the
classical electron radius. For the vertical beam size, it was
assumed that the ratio of vertical to horizontal emittance
equals 1 %. Therefore, the vertical beam size was calcu-
lated as σy =√0.01εxβy .
The algorithm calculating the Touschek lifetime looks
like:
1. Find the minimum of δacc,geom following Eq. 1
→ set geometrical acceptance = RF-acceptance to
find optimum cavity voltage corresponding to
maximum achievable acceptance
→ calculate bunch length for the optimum cavity
voltage
2. Calculate Touschek lifetime with maximum accep-
tance following Eq. 2 for each element
3. Calculate the total Touschek lifetime by weighting the
single element Touschek lifetimes with the lengths of
the elements
The calculated Touschek lifetimes have been checked for
plausibility with the Touschek module offered by MADX.
For the settings of the standard user operation in 2012
at the MLS the Touschek lifetime was calculated with
the implemented Touschek module of the Fortran code:
τT,mod = 12.64 h for a cavity voltage of 408 kV; the Tou-
schek module offered by MADX calculates a correspond-
ing Touschek lifetime of τT,MADX = 12.47 h.
RESULTSBased on the results yielded by the scan, various optics
have been investigated experimentally. Dynamic aperture
was neglected in the first runs, as it is not usually a lim-
iting parameter at the MLS. Conversion from calculated
k-parameters to quadrupole currents to fit the predicted
transverse tunes was better than 1%. Selected test optics
in the blue region of Fig. 2 were set up by changing
the quadrupole strengths while keeping the beam stored.
Afterwards a LOCO characterization of the optics was
conducted [8].
At first a low emittance (ε) optics was set up as shown
in Fig. 3. The emittance in standard user operation is
about 100 nm rad. A tuning of the optics while keeping
the working point fixed promised an emittance reduction
by a factor of 2.2, whereas allowing the working point to
change within the blue area yielded a predicted emittance
reduction by 3.7. We chose to try the latter concept.
xQ2 3 4 5 6
yQ
0
1
2
3
4
/ nm
rad
min
ε
10
210
310
Figure 3: Minimum emittance of the MLS [3]. The black
cross marks the standard working point. A recently estab-
lished low-ε mode is marked by the white cross.
Emittance reduction was measured by two source point
imaging systems yielding a factor of 3.9, which was
reinforced by lifetime measurements. This optics is now
operational up to 180 mA and was already applied in user
operation.
In addition, the correlation between emittance and
momentum compaction factor α has been investigated. As
both quantities depend on the dispersion in the dipole mag-
TUPWO005 Proceedings of IPAC2013, Shanghai, China
ISBN 978-3-95450-122-9
1884Cop
yrig
htc ○
2013
byJA
CoW
—cc
Cre
ativ
eC
omm
onsA
ttri
butio
n3.
0(C
C-B
Y-3.
0)
05 Beam Dynamics and Electromagnetic Fields
D01 Beam Optics - Lattices, Correction Schemes, Transport
nets, arbitrary combinations of α and ε are not possible.
In the low-α operation mode applied for users at the MLS
an increased emittance is observed worsening the user
conditions for users interested in short pulsed synchrotron
radiation. On the other hand, users interested in coherent
synchrotron radiation in the THz regime would benefit
from larger emittances as it substantially increases lifetime
without reducing the brilliance at these wavelengths. One
emittance / nm rad210 310
α
-0.1
-0.05
0
0.05
0.1
0.15
0.2
norm
aliz
ed s
olut
ions
-710
-610
-510
-410
norm
aliz
ed s
olut
ions
-710
-610
-510
-410
Figure 4: Momentum compaction - emittance correlation
[3]. A global scan (yellow) as well as a subset of states
within the currently used tune quadrant (blue) is shown.
The black cross marks standard user operation, the red
cross marks low-α operation.
finding of the brute force scan is, that there is no opera-
tional mode that delivers low-α at the design emittance of
100 nm rad as shown in Fig. 4 (blue). However, there are
operational modes for low-α at lower emittances. These
optics are all situated outside of the currently used tune
quadrant. An optics setup featuring an increased emittance
of 300 nm rad at low-α was experimentally verified but
not yet tested in user operation.
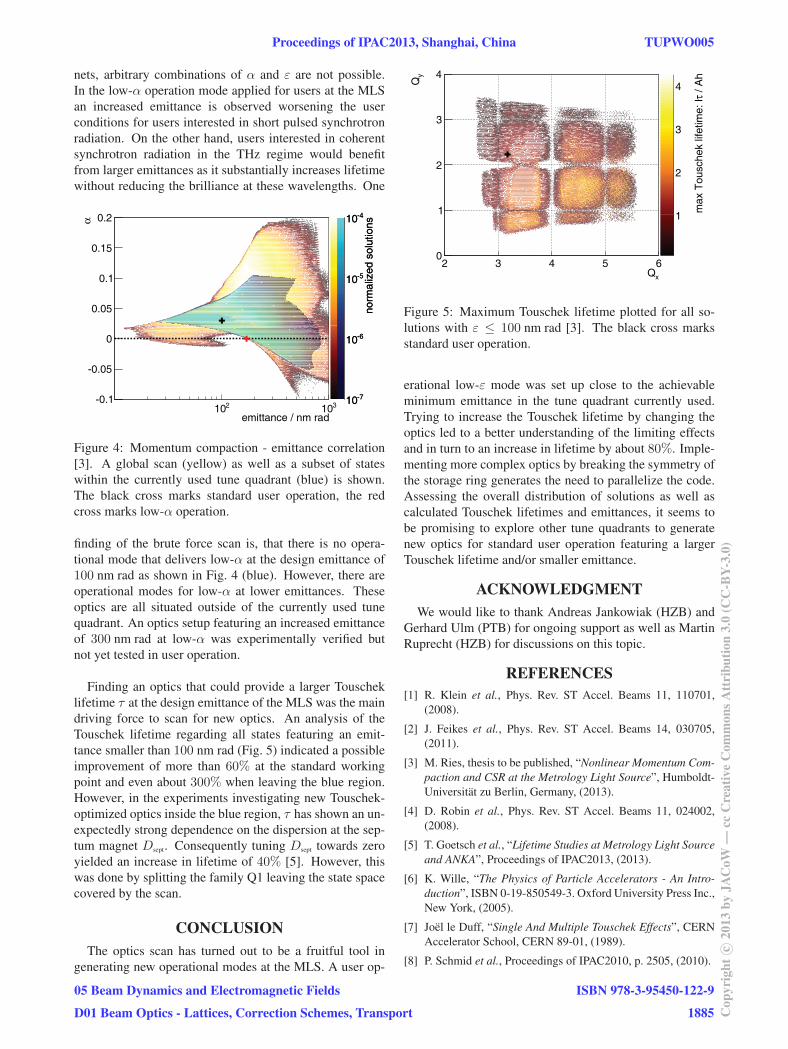
Finding an optics that could provide a larger Touschek
lifetime τ at the design emittance of the MLS was the main
driving force to scan for new optics. An analysis of the
Touschek lifetime regarding all states featuring an emit-
tance smaller than 100 nm rad (Fig. 5) indicated a possible
improvement of more than 60% at the standard working
point and even about 300% when leaving the blue region.
However, in the experiments investigating new Touschek-
optimized optics inside the blue region, τ has shown an un-
expectedly strong dependence on the dispersion at the sep-
tum magnet Dsept. Consequently tuning Dsept towards zero
yielded an increase in lifetime of 40% [5]. However, this
was done by splitting the family Q1 leaving the state space
covered by the scan.
CONCLUSIONThe optics scan has turned out to be a fruitful tool in
generating new operational modes at the MLS. A user op-
xQ2 3 4 5 6
yQ
0
1
2
3
4
/ A
hτ
max
Tou
sche
k lif
etim
e: I
1
2
3
4
Figure 5: Maximum Touschek lifetime plotted for all so-
lutions with ε ≤ 100 nm rad [3]. The black cross marks
standard user operation.
erational low-ε mode was set up close to the achievable
minimum emittance in the tune quadrant currently used.
Trying to increase the Touschek lifetime by changing the
optics led to a better understanding of the limiting effects
and in turn to an increase in lifetime by about 80%. Imple-
menting more complex optics by breaking the symmetry of
the storage ring generates the need to parallelize the code.
Assessing the overall distribution of solutions as well as
calculated Touschek lifetimes and emittances, it seems to
be promising to explore other tune quadrants to generate
new optics for standard user operation featuring a larger
Touschek lifetime and/or smaller emittance.
ACKNOWLEDGMENTWe would like to thank Andreas Jankowiak (HZB) and
Gerhard Ulm (PTB) for ongoing support as well as Martin
Ruprecht (HZB) for discussions on this topic.
REFERENCES[1] R. Klein et al., Phys. Rev. ST Accel. Beams 11, 110701,
(2008).
[2] J. Feikes et al., Phys. Rev. ST Accel. Beams 14, 030705,
(2011).
[3] M. Ries, thesis to be published, “Nonlinear Momentum Com-paction and CSR at the Metrology Light Source”, Humboldt-
Universitat zu Berlin, Germany, (2013).
[4] D. Robin et al., Phys. Rev. ST Accel. Beams 11, 024002,
(2008).
[5] T. Goetsch et al., “Lifetime Studies at Metrology Light Sourceand ANKA”, Proceedings of IPAC2013, (2013).
[6] K. Wille, “The Physics of Particle Accelerators - An Intro-duction”, ISBN 0-19-850549-3. Oxford University Press Inc.,
New York, (2005).
[7] Joel le Duff, “Single And Multiple Touschek Effects”, CERN
Accelerator School, CERN 89-01, (1989).
[8] P. Schmid et al., Proceedings of IPAC2010, p. 2505, (2010).
Proceedings of IPAC2013, Shanghai, China TUPWO005
05 Beam Dynamics and Electromagnetic Fields
D01 Beam Optics - Lattices, Correction Schemes, Transport
ISBN 978-3-95450-122-9
1885 Cop
yrig
htc ○
2013
byJA
CoW
—cc
Cre
ativ
eC
omm
onsA
ttri
butio
n3.
0(C
C-B
Y-3.
0)