survey of current business april 1924 - bureau of … of current business april, 1924 no. 32...
TRANSCRIPT

MONTHLY SUPPLEMENT TO COMMERCE REPORTS
UNITED STATES DEPARTMENT OF COMMERCE
WASHINGTON
SURVEY OF CURRENT BUSINESS
APRIL, 1924
No. 32
COMPILED BY
BUREAU OF THE CENSUS BUREAU OF FOREIGN AND DOMESTIC COMMERCE
BUREAU OF STANDARDS
In addition to figures given from Government sources, there are also i,ncorporated for completeness of 'service the figures from other sources generally accepted by
the trades, the authority and responsibility for which are noted in the text
Subscription price of the SuRVEY OF CuRRENT BusiNESS is ~1 a year; single copies, 10 cents. Foreign subscriptions, $1.50; single copies, including postage, 20 cents. Subscription price of CoMMEltCB REPORTS is $3 a year; with the Survey, $4 a year. Make remittances only to Superintendent of Documents, Washington, D. C., by postal money order, express order, or New York draft. Currency at sender's risk. Poatagc stamp• or foreign money not accepted
WA.SHINQT()fl :GOVERNMENT PRINTING OFPIC. : ltl4

DEPARTMENT OF COMMERCE. HERBERT HOOVER, Secretary of Commerce.
BUREAU OI<' THE CENSUS. WrLLlAM l\1. ST>JUAnT, Director.
Chief junctions. The taking of the decennial census covering population, agri
culture, manufactures, mines and quarries, and forest products. Decennial report on wealth, public debt, and taxation, includ
ing principal financial statistic~ on Federal, State, county, city, and township government".
Annual financial :.;tatistie5 of Htate and municipal govcrnwents-Source8 of revenue, objects of payments, debt, tax levies.
Decennial statistics relating to inmates of institutions, in-· eluding paupers, insane, prisoners, and juvenile delinquents.
A census of agriculture in each middecennial year, a biennial cenous of manufactures, a quinquennial census of electrical public utilities, statistics of marriage and divorce.
Annual statistics of births, deaths, causes of death, etc., in the registration area of the United States.
Quarterly statistics of leaf tobacco stocks and of production, stocks, and consumption of fats and oils.
Monthly or Bemimonthly statistic::! of cotton ginning; cotton stocks and consumption; the production, stocks, and consumption of hides and leather; the production of shoes; and statistics of active textile machinery and of movements in an increasing number of other industries.
The compilation and publication, in the "Survey of Current Business," of monthly commercial and industrial statistics.
BUREAU OF FOREIGN AND DOMESTIC COMMERCE. ·JuLIUS KLEIN, Director.
Chief functions. The compilation of timely information concerning world
market conditions and openings for American products in foreign countries secured through commercial attaches and trade commissioner,; of the Department of Commerce and the foreign service of the Department. of ~tate. The distribution of such information to American business through weekly "Commerce reports," special bulletins, confidential circulars, the news and trade press, correspondence, and personal contact. Approximately 3,000 trade inquiries are answered daily by the bureau and its nine district offices.
The maintenance of commodity, technical, and geographical divisions to afford special service to American export industries.
The compilation and distribution of names of possible buyers and agents for American prod11cts in all parts of the world and publication of weekly lists of specific sales opportunities abroad.
The maintenance of district all<! cooperative offices in 33 cities in the United ~tates to expedite delivery of market information to business men and to keep the department advised as to the urgent requirements of American trades and industries.
The publication of official statistics on imports and exports. The study of the proces~cs of domestic trade and commerce,
with a view to their improvement and the dissemination of information obtained for the benefit of the public, as well as of those directly conecrned.
BUREAU OF STANDARDS. GEOHGFJ K. BuRGESS, Director.
Chief functions. Custody of standards of measurement, quality, performance,
or practice adopted or reeognizect by the Government. Development and construction of such standards when necessary. Testing and calibration of apparatus and compariRon of standards u~cd by scientific or other institutions with those in the custody of the bureau.
Determination of physica I constants and properties of materials.
The testing of materials and establishment of standards and procesHcs in cooperation with commercial firms or organizations.
Industrial researches covering structural, engineering, and miscellaneous materials, radio, radium, mechanical appliances, sugar technology, leather, paper, rubber, and textiles; clay products, glass, and refractories, llletals and metallurgy, and similar groups of ,;ubject~.
The collection and cti~semina.tion of information showing approved methods in building, planning, and construction, including building materials and co<ies and ::<nch other matters as may encourage, improve, and cheapen con.~truction and housing.
Studies on simplified conunereial practices and establishment of such practice» through cooperative business organizations.
The Bureau publishes six series of scientific and technical publications, reporting the results of its researches and giving technical data fundamental to iudustry.
The Director has supervision of the preparation of technical specifications through the Federal Specifications Board.
BUREAU OF FISHERIES. HENRY O'MALI,EY, Commissioner.
Chief functions.
The propagation of useful food fi::lhes, including lobstei'f' oysters, and other ~hclltish, and their distribution to suitabl, waters.
Invest,igations of fish culture, fish diseases, and for the con 1 servation of fishery resources and the development of commer
cial ti::ihcries. The study of the methods of the fisheries and fishery industrie
and the utilization of fishery products. The collection of statistics of fisheries. The administration of the Alaska salmon fisheries, the fur-sea
herd on the Pribilof Islands, and the law for the protection o sponges off the coast of Florida.
BUREAU OF LIGHTHOUSES. GEOUGE R. PuTNAM, Commissioner.
Chief junctions.
The establishment and maintenance of lighthouses, light ships, buoys, and other aids to navigation on the sea and th· lake coast and on the rivers of the United States, includin, Alaska, Hawaiian Islands, and Porto Rico.
The publication of Light Lists, Buoy Lists, and Notices t1 Mariners, including information regarding all aids to navigatioJ maintained by the Lighthouse Service.
COAST AND GEODETIC SURVEY. E. LESTER JoNEs, Director.
Chief junctions.
The survey of the coasts of the United States and the publi cation of charts needed for the navigation of the adjacen waters, including Alaska, the Philippine Islands, Hawaii, Port. Rico, the Virgin Islands, and the Canal Zone.
A comprehensive geodetic system, extending into the interi01 connects and coordinates the surveys of the coast.~, and is de signed to furnish accurately determined points and elevation in all parts of the country. These are availal>le a:i a basis fo Federal, State, and municipal surveys, and engineering project of every kind. The magnetic declination has been determine• at a large number of stations throughout the country, and th results are available for the use of surveyors and engineers.
The technical operations include base measun'H, triangula tion, traverse, prcciHe leveling, the determ!nation of latitude an1 azimuth, the determination of difference of longitude by tele graph or radio, magnetie observations and researches, th preparation of magnetic maps, the determination of the fore of gravity, topography, hydrography, deep-sea soundingE water temperatures, tidal and current observat.ions.
The results nrc published in the form of charts on variou scales, annual reports, coast pilots, tide tables (published annu ally in advance), current tables, digests of geodetic publieationt and ,.;pecial publications.
BUREAU OF NAVIGATION. D. B. CARSON, Commissioner.
Chief junctions.
General superintendence of commercial marine and mereha.u seamen.
Supervision of registering, enrolling, licensing, numbering etc., of Yessels 11ncler the United States flag, and the annua publication of a list of such vessels.
The enforcement of the navigation and st.eamboat inspectio laws and the laws governing radio co,mnunicatiou, as well a duties connected with feeo, fines, tonnage taxes, refunds, etc originating under such laws.
STEAMBOAT INSPECTION SERVICE. GEORGE UuLEH, Supervising Inspector General.
Chief functions.
The inspection of vessels, the licensing of the officers of Vel;
sels, and the administration of laws relating to such YeRsels an· their officers. The certification of able seamen who form th crews of merchant vessels.
The inspection of vessels, including the types of boilers; th testing of all materials subject to tensile strain in marine boilen the inspection of hulls and of life-saving equipment.

•
MONTHLY SUPPLEMENT TO COMMERCE REPORTS
UNITED STATES DEPARTMENT OF COMMERCE WASHINGTON
SURVEY OF CURRENT BUSINESS
COMPILED BY
BUREAU OF THE CENSUS . • BUREAU OF FOREIGN AND DOMESTIC COMMERCE BUREAU OF STANDARDS
No. 32 . APRIL 1924
CONTENTS Pap.
Summary for FebruarY------------------------------- 1 Business indicators (diagrams and tables) _______________ 2, 3 Comparison of wholesale prices (diagram and table) ______ 4, 5 Wholesale and retail food prices (diagram)_. ___ .________ 6 Course of business in February-------------~----______ 7 Cotton stocks in northern and southern mills and ware-
houses (diagram) __________________ • ________ .______ 10 Pig iron production and unfilled steel orders (diagram)___ 12 Employment in selected industries (diagrams)-----------, 21 Wholesale prices, bank clearings, and pig-iron production
since 1840 (diagram) _______________ -----__________ 25 Commodity stocks-a study in seasonal movements.____ 27 ~archdata----------------------------------------- 29 Indexes of business (production, prices, sales, etc.) ______ . 31 Trend of business movements:
Textiles_________________________________________ 35 ~etaffi----------------------------------------- 37 Fuel and power _________________________ .________ 38 Automobiles and rubber__________________________ 39 Hides and leather __________ . ____ . __ • __________ • _. 39 Paper and printing. _______ • ____ . __ .. __ . ________ . _ 40 Butions.---·----------------------------------- 40
I Pap.
Trend of business movements-Continued. Glass and optical ~oods. ______ • ___ . _ •. _____ . _ .. _ _ _ 41 Building and construction __________ ._.____________ 41 Chemicals, naval stores, and oils. __ ._______________ 43 Foodstuffs.------------------------------------- 44 Tobacco ... ----------------l-------------------- 46 Transportation and public utilities _______________ 46,47 Employment------------------------------------ 47 Distribution movement. _____ • __ .____________ _ _ _ _ _ 4 7 Public finance and banking and finance.__________ _ 48 Foreign exchange and trade·---------------------- 50 Trade and industry of foreign countries._ _ _ _ _ _ _ _ _ _ _ 51
Detailed tables: Automobiles. ________ ._.________________________ 52 Machine tools _______________ -- ____ . _________ ---. 55 Life insurance sales by districts _____________ • _. __ . . 56
Business failures and bank failures. ____ . ______ • __ .___ 57, 59 Sugar·--------------------------------------------- 60 Steelingots _________________________________________ 61 Hosiery_____________________________________________ 61 World production of principal crops. _____ • _______ ._ •• __ 62 Sources of data. ____________ ---- ___ • __ • ________ --._.. 64
SUMMARY FOR FEBRUARY (See note at bottom of opposite cover page)
Industrial activity in general showed little change from the previous month but was· on a higher level than a year ago. The principal indicators of the iron and steel industry registered increased productivity in February over both the preoeding month and February, 1923, while the production of such basic commodities as bituminous coal, petroleum, copper, and zinc, although below January, was larger than a year ago. Tin consumption was larger in February than either the previous month or February, 1923, while mill consumption of cotton, wool, and silk was lower in February than in either of these comparative periods. The output of automobiles, both passenger and truck, in<~reased in February over January and a year ago, while new lettings for building construction declined in February but were well above a year ago. Unfilled steel orders continued to accumulate, while the index I of unfilled orders for basic commodities, based on
1 1920 as 100, increased to 63.4 on February 29 from 1
62.9 c~>n January 31 and may be compared with 93.2 ,. for a year ago. . Retail sales of 10-cent chain store systems increased "i m February, while sales by mail-order houses and I
~24-1
department stores declined, each, however, recording larger sales than a year ago. Wholesale trade in general declined in February but was larger than a year ago. Check transactions throughout the country declined in February from the previous month but were larger than a year ago, while interest rates softened in February.
Wholesale prices at 152 for February may be compared with 151 for January and 157 a year ago, while the cost of living index in February at 64 per cent above July, 1914, compares with 65 per cent in Jan~ary and 58 per cent a year ago. Employment m 1,428 representative factories showe~ no chang_e fro~ the previous month while business failures declmed m February. Prices of industrial stocks averaged lower in February, while railroad stocks registered a slight increase over January.
Weekly car loadings in February averaged 908,404 cars, as against 858,863 in January and 848,269 a year ago, while the net available daily surplus of freight cars averaged 130,282 cars for the last week of February, compared with 164,438 cars for the same period in January and a net shortage of 64,814 cars a year ago.

2
BUSINESS INDICATORS (1913 montnly nernge-100. Bee explanation on Inside front cover. Except Cor "net freight ton-mtles" latest month plotted ls F&bruary, 1924)
PIG-IRON PRODUCTION BITUMINOUS COAL P'QODUCfiON
1920 1821 1822 1823 1924
I
I I I
I~,.,..,~ .. A r """'\J ~
AI i vv I I I I
/ I I ··~~----~ ---,
I I J ! I •• ~---"----.;__ __ _c_ ___ j__~
I I
0
NET FREIGHT TON-MILES EXPORTS (VALUES)
1920 1921 . 1922 1923 1924
~M - '
\ 0
~'r-" ~ ~
0
DEFAULTED LIABILITIES (VALUES) WHOLESALE PRICES
1920 1921 1922 1923 1924
~
" ~'... I
I
,.L_~ ______ ...!._ ___ !___! I I
I
COTTON CONSUMPTION
1920 1921 1922 1923 1924
300
~ :2 ...... ~ ..... J'I ~~ "' ::E 8 • 'J z"' X
"' c .. :!:
.. 0
.. 0
,
BANK CLEARINGS OUTSIDE NEW YORK CITY (VALUES)
1920 1921 1922 1923 1924
0~ .,-..J'~ ...,_r' 30
... Ul a: bJIOO
"' ::080
" z e 0 X
"' c .. !
Ul a:
0
... 800
200
~100 ::Eeo ::> z,. )(
"' ~ ..
.. ••
....
>A ~
PRICE OF 25 INDUSTRIAL STOCKS
1920 1921 1922 1923 1924
"""\. ~ -~
I

3
BUSINESS INDICATORS Th.e followi~g table gives comparatiye index numbers for a selected list of important business movements. It is believed
that th1s table Wlll prove useful, because 1t separates out from the large mass of material a comparatively small number of items which are often regarded as indicative of business in general.
The table has been divided into tw_? p~rts, the firs~ containing those items for which index numbers can be calculated, using ~913 as a base .. The second part C_?ntams 1tems for whtch comparable data back to 1913 arc not available. This latter group of mdex numbers 1s calculated by lettmg the 1919 monthly average equal 100. Care should therefore be exorcised in comparing the absolute value of the two sets of data. In either group, however, the upward or downward trend of the index numbers compared to previous months, does reflect the present tendency in each item and will give a basis for business judgment. '
llli!-1
COlUIODlTY MONTHLY AVERAGE 1----~--~----~--~----~---10~2-3--------~-
1020 11921 11022,1023 Jan. I Feb., Mar., Apr., May I June IJu~ I Aug., ~cp;,, ~~; .. , N~v: -~-D~. -~an.- ~~;~: 1913 monthly average-too
Production: l---.-.--~-;------;--~-....-.....__,----,---....,------,,-------,---..,-----....,.--···-----···--·---
~1 Pig iron • ---··--·----------- 119 Steel ingots................. 135 Copper...................... 99 Cement (shipments).----··· 108 Anthracite coal.............. 97 Bituminous coal............ 116 Electrical energy (gross rev-
enue sales)................ 283 Crude petroleum............ 178 Cotton (consumption)...... 105 Beef......................... 121 Pork........................ 111
Unlllled orders: U.S. Steel Corporation..... 170
Stocks: Crude petroleum............ 127 Cotton (total) • ••••••••••••• 155
Prices: Wholesale index; all com·
modlties (Dept. Labor)... 226 Retail food (Dept. Labor)... 203 Retail coal, bitum.-U. B.
average (Dept. Labor).... 207 Farm crops (Dept .Agr) I, • 238 Farm livestock (Dept. Agr.) I 168
Business finances: Defaulted liabilities......... 108 Price 251ndustrlal stocks • •• 184 Price 25 railroad stocks •. ••• 67
Banking: Clearings, N. Y. City....... 257 Clearings, outside N.Y. City 275 Commercial paper Int. rate.. 127
Distribution: Imports (value)............. 294 Exports (value)............. 331 Sales, mail-order houses..... 264
Transportation: Freight, net ton-miles....... 137
39 107 99 87
312 189 97
109 116
90
152 198
147 1D3
197 109 107
230 136 64
205 212 113
140 181 188
~05
87 114 81
131 58 85
349 224 109 121 129
234 153
149 142
188 113 111
227 169 75
230 231 76
177 154 .204
114
130 143 121 1D3 104 114
407 292 117 125 159
102
285 125
154 146
1110 136 103
198 170 72
226 265 86
211 201 259
139
126 151 110 76
114 126
411 251 131 125 188
117
256 177
156 144
206 126 106
217 190 74
25f 289 80
220 162 243
138
117 137 101 82
102 106
432 232 122 107 156
123
256 156
157 142
205 130 107
179 198 79
213 230 80
203 148 232
119
138 160 119 140 117 117
402 273 134 117 177
125
259 143
159 142
203 134 100
213 199 78
251, 271 87
266 165 290
143
139 156 116 175 106 107
401 283 124 119 1D3
123
264 125
159 143
192 139 107
2ZT 195 76
228 261 89
244 157 272
140
151 166 123 193 112 116
304 299 133 129 153
118
271 104
156 143
186 140 105
181 186 73
244 .271
89
249 1D3 260
146
143 149 123 180 114 114
381 301 116 122 156
lOS
281 83
1D3 144
185 139 100
126 182 73
237 267 86
214 155 221
139
144 139 124 186.
109 113
381 316 99
119 146
100
290 66
151 147
185 136 102
157 176 70
211 256 86
192 146 199
H1
134 122 146 131 129 122 203 185 116 38 123 116
375 370 318 312 106 lOt 133 129 134 115
92 85
296 302 64 95
150 154 146 149
183 . 184 136 138 102 109
151 126 177 177 68 69
187 191 242 242 88 89
184 170 150 184 198 231
148 144.
123 141 129 193 114 123
398 323 116 151 148
79
310 149
153 150
186 139 100
349 175 69
225 285 89
206 194 335
154
1~ 114 lR 1~
123 113 143 lW 125 127 131 126 139 87 70 bO 102 105 104 100 108 101 127 115
420 452 4f>6 485 313 284 273 2M 114 99 ~4 100 135 120 133 111 182 203 203 175
74 75 81 83
318 321 321 322 169 167 149 132
152 151 151 152 151 150 149 147
IS.~ 183 180 180 137 137 140 141 97 94 97 98
221 2ZT 236 11>8 181 IS7 193 192 70 70 73 73
229 263 88
195 193 306
HO
247 277 86
193 206 318
122
262 ' 230 281 256 84 I 83
I 198 221 191 i 177 271 2i0 '
126 ! 135 i I !--~--~~--~~--~~--~~----~~--~~--~--------
1919 monthly average-100
1----------~----~------~~--~--~~--~--.--.---.--.------Production:
Lumber'···-·-··········-·· 100 Bldg. contracts (tloor space). 72
Stocks: Beef......................... 66 Pork........................ 98
Business nuances: Bond prices Index ( 40 issues) • 86
Banking: Debits to individual ac
counts, outside N.Y. City. 114 Fed. Res., bills discounted.. 132 Fed. Res., total reserves..... 97 Fed. Res. ratio.............. 87
85 114 69 102
42 29 83 70
87 107
91 97 91 28
126 106
32 91
104
107 39
146 152
109 88
48 81
107
112 31
147 153
99 89
42 92
106
96 31
H6 152
131 139
38 101
104
112 36
H5 150
130 135 138 129
33 27 111 108
11Xl 104
107 116 33 38
145 146 1D3 152
136 99
24 112
104
111 40
146 1D3
126 90
19 110
11Xl
104 39
146 156
138 85
19 95
104
99 42
146 154
131 88
tro
98 45
145 152
137 116
27 59
102
113 46
146 152
132 111
39 67
100
106 41
146 152
107 113 125 102 107 11Xl
45 43 41 82 93 103
116 111 100 44 27 27
143 149 147 146 162 161 122 1144
122 154 ·-----------------~_L~----~_L~ ____ L__L~ ____ L---L~---~~~---~~-----
0 Monthly statistics on the movements since January, 1913, or as far back as available, aro given on pages 4749 of the December, 1922, Survey (No. 16). 1 Monthly prices are for the 15th of the month indicated. 1' ·I · · 1 Be.sed on the total computed production reported by 5 associations Includes southern pine, Douglas fir, western_pine, North Caro 1na P ne, and MIChigan bard
and soft woods. The total production of these associations in 1919 was equal to 11,190,000,000 board feet, compared With a total lumber production for the country o! 34,552,000,000 board feet reported by the census.

4
COMPARISON OF PRESENT WHOLESALE PRICES WITH PEAK AND PRE-WAR
WHEAT
CORN
POTATOES_
COTTON
COTTON SEED
CATTLE, BEEF
HOGS
LAMBS
WHEAT, SPRING
WHEAt,.WINTER
CORN· N0.2.
OATS
BARLEY
RYE•N0.2
TOBACCO. BURLEY
COTTON
WOOL 1~ GREASE !BOSTON>
CATTLE STEERS
HOGS, HEAVY
SHEEP, EWES
SHEEP. LAMBS
FLOUR, SPRING
FLOUR, WINTER
SUGAR, RAW
SUGAR, GRANULATED
COTTONSEED OIL
BEEf, CARCASS
BEEF, STEER ROUNDS
HAMS, SMOKED' (CHICAGO)
COTTON YARN
COTTON, PRINT CLOTH
COTTON, SHEETING
WORSTED YARN
WOMEN'S DRESS GOODS
SUITINGS
SILK. RAW
HIDES, PACKER'S
'HIDES. CALFSKINS
LEATHER, CHROME (BOSTON)
L£ATHER, SOLE OAK
0
BOOTS AND SHOES (BOSTONt
BOOTS AND SHOES <ST. LOUIS)
-cOAL. BITUMINOUS
COAL. ANTHRACITE
COKE
PETROLEUM
'PIG IRON, FOUNDRY
PIG IRON, BASIC
STEEL BILLETS, BESSEMER
COPPER
(Relative prices 1913=100)
INDEX NUMBERS
100 200 300 400 500
FARM PRODUCTS. AVERAGE PRICE TO PRODUCER
FARM PRODUCTS. MARKET PRICE
FOODS
CLOTHING
LU
~ c:: LU > .., Oi
FUELS
METALS
600
LEAD
TIN
~PEAK PRICE
-PRICE IN FEBRUARY
ZINC
LUMBER,PINE.SOUTHER~ ~~~~~~~BiU~I~LO~~IN~G~MfA~T~E~R~IA~LS~!:::~~~~!ZI3 LUMBER, DOUGLAS FIR
BRICK, COMMON (NEW' YORK)
·CEMENT •
STEEL BEAMS
'RUBBER, CRUDE MISCELLANEOUS
-SULPHURIC ACID I
700

5
WHOLESALE PRICE COMPARISON8-MAXIMUM PRICE COMPARED TO PRICE IN RECENT MONTHS . NOTE.-l'rlces to the producer on farm products and market price or wool are from u. 8. Department of AgricuUurt Bureau of ..4 ricuUural Economlc4 All u. :;~~ from U. 8. Department of Labor[ Bureau of Labor Stati&tiu. As far as possible all quotations represent prices to the produce~ or at the mill. see ·dl~ ~
COMMODITIES
Farm products-Average price to producers: Wheat ._ w- • • • • • "'• • •••••• • • • ••w .... ••• • •• ••• • ••• • •••• • .... ~ .... • ...... -• •• • •• ••- • • ••••• • • ••• •••
Corn --------- .. ------ ....... -------------------------------------------------------------Potatoes ----------------- ...... -------------------------- ................ ----- --· ... -·.-- --~~ .. -Cotton ----------------------- .. --- ~- --- .... --·- ------------------ ..... ----- .. --- .. --- -·----Cottonseed -............... -- ... ---- .. ---- .. ---- .. ----·---- --- .. ---- --· ........ ----------- ------ ..... ------Cattle, beeL •••• _ •••••••• ____ • __ .... _. ___ ••• ____ ------- _____ ••• ____ • ___ • __ --·· ___ •••
!logs ••• ············- •••••••••••• ------ ••• -.. --- •. -- •. -----.---- ··- -·-- ---- •.. ------. Lambs ••• ---~---·-· ............................... -- .... --- ........... ---- .. -------------- --- ..... ---------- ........
Farm products-Market price: Wheat, No. l, northern, spring (Chicago)_. __ ------------------··--·----·--········· Wheat, No.2, red, winter (Chicago).·-······---·----·-----------------------·------Corn, contract grades, No.2, cash (Chicago). ___ .-··---------------···--·--·--------Oats, contract grades, cash (Chicago) ••••• -------------------------------------·-----Barley, fair to good, malting (Chicago).-----------------·----------------··---------Rye, No.2, cash (Chicago) ••••••••••••.••••••••.•••••••••• __________________________
Tobacco, burley, good leaf, dark red (Louisville) .• _---------------------------------Cotton, middling upland (New York)----------------------------·------------------Wool, i blood combing, Ohio and Pennsylvania :lleeces (Boston) •• _ .•• -----·-------· Cattle, steers, good to choice, corn fed (Chicago). ___________________________________
Hogs, heavy (Chicago) •• ····-------------------·--·---·--··---·------··· ___ : ________ Sheep, ewes (Chicago) ••••••• ·-------·---------------··------·--··------··--·-------Sheep, lambs (Chicago)_ ••• ··------------.-·----··-···-······ •••••••••••• ------.----
Food: Flour, standard patents (Minneapolis) •• _-···-·····---··---------! ........... ------· Flour, winter straights (Kansas City) ••• ------------··--·---------------------------Sugar, 96• centrifugal (New York) •••••• -·---------·---------------- ___ ----------·-Sugar, granulated, In barrels (New Yorkl----·······--······------------------------Cottonseed oil, prime summer yellow (New York>------··--------------------------Beel, fresh carcass good native steers (Chicago) •• ------··---------------·--·-·-----·-Beet, fresh steer rounds No.2 (Chicago) ••••••.••..••••••.•••••••• -------------------Pork, smoked hams (Chicago) •• ·-·-.------------------------------------------·--·-
Clothing: Cotton yarns, carded, white, northern, mule spun, 22-1 cones (Boston) •• ----------·-Cotton, print cloth, 27inches, 64 x 6D-7.60 yards to pound (Boston>---------···--·---Cotton, sheeting, brown, 4/4 Ware Shoals L. L. (New York).-----·-----------·-----Worsted yarns, 2/32's crossbred stock, white, In skein (Boston>-------------········-Women's dress goods, storm serge, all-wool. double warp, 60 Inches (New York) •.••• Suitlngs, wool, dyed blue, 55-56 Inches, HI-ounce Middlesex (New York) •• __ ------· Silk, raw Japanese, Kansaf No.1 (New York>------------···--····-···--------------Hides, green salted, packer's, heavy native steers (Chicago) ••••••••••••.•••••••...•• Hides, calfskins, No.1, country, 8 to 15 pounds (Chicago)-----·---------------------Leather, chrome calf, dull or bright "B" grades (Boston) •••••• ---------------------Leather, sole, oak, scoured backs, heavy (Boston).··--------·~--------·----··'·---·-Boots and shoes, men's black calf, blucher (Massachusetts) •••••••.••..•••..••••••.. Boots and shoes, men's dress welt tan calf (St. Louis>---------·--····--·-··---·---··
Fuels: Coal, bituminous, Pittsburgh, mine run-Kanawha (Cincinnati)····-------------·--Coal, anthracite, chestnut (New York tidewater>---········---·----·-------------·· Coke, Connellsville (range of prompt and future) furnace-at ovem •••• -------------Petroleum, crude, Kansas-Oklahoma-at wells •••••••••••••• -•• ·-··-·---···---------
1\letals: Pig Iron, foundry No.2, northern (l'Jttsburgh) ______________________________________
Pig Iron, basic, valley furnace •• ··········--------------·--·····-----------------·--· Steel billets, Bessemer (Pittsburgh)-·-···--·--·--······------------------·-··------· Copper Ingots, electrolytic, early delivery (New York) •••• ------·--·-------------··· Lead, pig, desUvered, for early delivery (New York) ••• ·-------------------------··· Tin, pig, for early delivery (New York) •••. --------------------------·--····--------Zinc, slab, western, early delivery (New York).·---·-··--·---·-···---------·--····-·
BUilding materials and miscellaneous: Lumber, pine, southern, yellow Jiooring,l x 4, "B" and better (Hattiesburg district). Lumber, Douglas fir, No 1, common, s 1 s, 1 x 8 x 10 (State or Washington) ••••••••• Brick, common red, domestic building (New York)-·-······-······-··········-····· Cement, Portland, net without bags to trade, f. o. b plant (Chicago district) ••••.•••• Steel beams, mill (Pittsburgh) ••••• --------------------·-··----·------···--·---·--·-Rubber, Para Island, line (New York) .•. ------·----------·------------··--·--·--··-Sulphuric acid, 66° (New York>-----··-·----------·---~--------··--·----------------
Date and maximum relative price
December,
1923 1924 1924 ercent - Increase l Januaey,!Februaey, p
1--------~------~~------t<+)ord~ crease(-)
I------------------~-------R-~ __ a_u_v_e_p_d_c_e _________ 1b1Fi!~•r.r ' January (1913 average-100)
li June, 1920 326 il 119 122 124 +1.6 July, 1920 300 :' 117 119 124 +4.2 June, 1920 706 p 137 145 148 +2.1 July, 1920 312
I' 268 271 262 -3.3
May, 1920 321 209 204 199 -2.5 May, 1919 183
II 89 01 93 +2.2
July, 1919 256 85 88 87 -1.1 Apr., 1920 239 I 166 167 173 +3.6
May, 1920 354 I 122 124 129 +4.0 May, 1920 302 ' 110 112 114 +1.8 I Sept., 1917 331 ' 117 121 128 +5.8 June, 1920 296 120 126 131 +~O Mar., 1918 325 110 113 118 +4.4 Mar., 1918 451 uo 114 113 -0.9 Mar., 1910 352 212 212 212 0.0 Apr., 1920 331 280 271 250 -7.7 Apr., 1918 308 204 208 216 +3.8 Mar., 1910 218 115 lll 114 +2. 7 July, 1919 266 84 86 85 -1.2 Apr., 1918 319 137 lS3 180 +17.6 Feb., 1920 263 160 171 187 +9.4
May, 1920 328 133 135 138 +2.2 May, 1917 363 133 137 139 +1.5 May, 1920 598 209 192 'lJ)7 +7.8 May, 1920 526 207 196 204 +4.1 July, 1919 374 151 162 139 -&6 Sept., 1920 201 132 131 131 0.0 July, 1920 211 103 106 Ill +4.7
July, 1919 231 123 116 Ill -4.3
May, 1920 348 228 223 211 -5.4 Apr., 1920 478 236 223 205 -&1 May, 1920 427 217 220 204 -7.3
Jan., 1920 280 212 210 219 0.0
Oct., 11118 292 184 184 184 0.0
July, 1920 291 239 239 239 0.0
Jan., 1920 466 213 202 189 -6.4
Aug., 1019 283 74 78 86 +10.3 Aug., 1919 490 80 83 96 +15.7
Nov., 1919 473 163 163 163 0.0 Aug, 1919 230 95 98 98 o.o Mar., 1920 308 201 201 201 0.0
Aug., 1919 292 163 163 163 0.0
Sept., 1922 336 154 166 166 0.0
Oct., 1921 201 216 216 216 o.o Aug., 1920 637 164 165 172 +4.2 Mar., 1920 375 109 133 162 +21.8
July, 1917 346 148 151 lM +2.6
Sept., 1920 330 143 144 150 +4.2 July, 1917 388 155 165 156 0.0 Mar., 1917 230 82 80 81 +1.2 June, 1917 261 173 188 203 +8.0 May, 1918 224 105 108 us +•• j June, 1915 386 113 116
123 +G.O Feb., 1920 455 183 192 193 +0.5 Jan., 1920 401 190 212 212 o.o I Feb., 1920 381 290 305 305 o.o Sept., 1920 105 163 170 173 +1.8
I I
June, 1917 331 166 166 166 0.0
I Jan., 1913 124 25 25 24 -4.0 Feb., 1916 250 75 75 73 -2.7

1916
COMPARISON OF WHOLESALE AND RETAIL FOOD PRICE INDEX NUMBERS
1917
WITH INDEX OF ALL COMMODITIES AT WHOLESALE
(U.S. Department or Labor Index numbers. Relative prices 11113-100)
1918 1919 1920 1921 1922 1923 1924

7
BUSINESS SUMMARY (Index numbers based on the 1919 monthly average as 100--except lllllllled ord h" h b d th
dition of the several phases of business The use of inde ers w 10 are 1!56 on e 1920 average-enable comparisons to be made or the ]relative con• table entitled "Indexes of Business," beginning on p. 31.) x nu:nbers is more fully explamed on the inside front cover, and details of this summary aro given In the
I
1923 1921 -·
January I February November December January February
PRODUCTION: Manufacturing (65 commodities)----------------- 115 10s. I 1 112 1 104 1 114 1 117 Raw materials, totaL~------------------------- 116 88 1 141 129 108 100 Minerals _____ --------- ____ .:.·_! _____________ 124 110 I 136 125 128 128 Animal products _______ ---- ________________ 113 95 123 129 I
119 105
~~~r:t~y================================== 115 73 i 158 133 I 39 87 107 96 I 119 103 108 115 Electric power _________________________________ 147 133 149 153 160 150 Building construction (contracts awarded) ________ 83 89 I 111 102 107 103
STOCKS OF COMMODITIES---------------------------- 126 130 132 136 r, 132 140 UNFILLED ORDERS (relative to 1920)------------------ 85 93 53 58 II 63 63 SALES (based on value): II
Mail-order houses (4) ------ _ --- _________________ 89 84 122 118 'I 99 96 Ten-cent chains (5 chains)---------------------- 116 118 177 331 : 126 141 Wholesale trade ___________________________ -- __ 77 74 84 72 I 78 76 Department stores (333 stores) __________________ 101 90 142 203 i 109 101
' PRICES (recomputed to 1919 base): i
Wholesale, all commodities ______________________ 76 76 I
74 73 I 73 74
CosTR~;,a~~~~~~-(;e-c-;;mp~te~ftoi9i9-t)~;e):::::::::::: 77 76 81 81 I 80 79 92 92 ! 96 96 I 96 95
FACTORY EMPLOYMENT (recomputed to 1919 base)------ 95 98 I 99 98 I 99 99 I
TRANSPORTATION: i I Net freight ton-mile operation ___________________ 114 99 I 116 101 ! 104 109 Average weekly carloadings _____________________ 106 106 122 103
I 107 113
Net available car surplus (end of month)---------- -28 -39 I 92 189 100 79 I
1 Partly estimated.
COURSE OF BUSINESS IN FEBRUARY
. The following pages contain a review, by principal mdustries, of the more important statistics shown in the table on "Trend of Business Movements" (p. 35). Summaries of production, stocks, sales, and price changes are also shown, taken from the data in tables of "Indexes of Business" (p. 31).
PRODUCTION
February production, after due allowance for the ~hort month, was in general on about the same level as m the previous month but registered increased activity over a year ago. The output of manufactures in February as seen from the revised index of manufacturing production stood at 117, based on 1919 as 100, and may be compared with 114 for January and 108 a year ago.
February production, by major groups, shows food~ stuffs at 105 against 111 in January and 92 a year ago; textiles at 106 against 117 and 119; iron and ste~l at 128 against 124 and 121; lumber at 131 aga~st 124 and 112; leather and its products at 84 agamst 87 and 97; paper and printing at 102 against 112 and 100; chemicals at 135 against 144 and 124; stone, clay, and .glass at 104 against 101 and 96;
metals, other than iron and steel, at 167 against 166 and 134; and tobacco at 97 against 111 and 94.
The output of minerals in February as measured by the combined index on 1919 as a base stood at 121 as compared with 128 in January and 110 a year ago. Except for the output of silver, which increased over the previous month, the production of all products of the mine for which comparable data are available registered decreases from January, while with the exception of gold and anthracite coal the increased output of minerals over a year ago was general.
Marketings of animal products declined seasonally in February, the combined index for that month, based on 1919 as 100, being 105 as compared with 119 in January and 95 a year ago. Increases over a year ago were registered in the marketings of all classes of animal products except wool and eggs. Crop market~ ings on the same base were computed at 121 for Feb~ ruary as against 94 in the previous month and 104 a year ago. Increased marketings over both the pre~ vious month and a year ago were registered in corn, oats, and barley, while February marketings of rice were larger th~n a year ago and smaller marketings were recorded m rye.

8
STOCKS BusiNESS INDlCATOns-CoMPARISON oF FEnnu.,nT
FEBRUARY, 1923 WITH
The course of commodity stocks as seen from the PRODUCTION
PIQ IAOH
aTEIL--INQOT~
LOCOMOTIVE&
ZINC
AlrtTHAACI'U: COA'-
BITUMINOUS COAL
CII1.1D! PETROLEUM
COTTON I CONitJMPTION J
ITEIL CORP. C UNF'lLLED ORCEASJ
PRICES WH0L£SALE INOf.X.
ALL CO-..MOOITiU ( OCrt. L.AIOII)
F'AAM CAOPI l Dl!JI .&OIIIICUlTuUJ
FARM L.IVE ITOCK I t«.n. AGIIIIC.\Ii,.T\Ifl
BANKING AND FINANCE DI.FAULT'£D LIA81LI1'11S
f>RIC£ 24 INOUITRr.i.L ltOCK8
tAICI U RAILACAD 11'UCKS
DANK CLEARINGS. OUTJIOIE tltEW YOR"- CITY
IHT~Rt:tT RATES C COMMERCIAL J
DISTRIBUTION 'MPORTS C VALUE J
(XPO'Ui f VALUt: J
$ALES, MAIL- ORDER HOUSES
IALES. TEN - CENT STCA(S
FREIGHT, NET YON- MU .. EI
0
...
•
60
I
INDEX NUMBERS 100 160 :200
I I
j \
;;~
~ f:zml
I I
I
' I
,,
•• !
260
I I
i I
"
'""I I
300 weighted index of 45 commodities on a 1919 base trended upward in February, the index at the end of February being 140 as compared with 132 at the end of January and 130 a year ago. The following group comparisons for these comparative periods may be noted: Raw foodstuffs at 186 for the end of February against 149 for January 31 and 201 a year ago; raw materials for ma~ufacture at 119 against 134 and 107; manufactured foodstuffs at 77 against 76 and 75; and manufactured commodities at 156 against 156 and 122. On page 28 is given the results of a special study, by major groups, showing the trend of commodity stocks after due allowance for seasonal conditions have been made.
I
I
'
SALES
Manufacturers' sales in February were generally less than in either the previous month or a year ago. Increases over January, however, occurred in the sales of structural steel and other building equipment, steel castings, and clay fire brick, while new sales of freight cars were greater in February than in either the previous month or a year ago. The index of unfilled orders on manufacturers' books, based on the 1920 average as 100, stood at 63.4 as against 62.9 for January and 93.2 a year ago.
Wholesale trade in general declined seasonally in February, the lines not sharing in this general decline being hardware, which remained stationary, and dry goods, which increased. Based on the value of sales in 1919 as 100, the general index of wholesale trade
- ..... u.Rv ,... ~··aRuARv uno , stood at 76 as against 78 for January and 74 a year ago. * ..IANUAAY
.,.,
....
140
1:10
120
110
IDO
90
:o
..
RELATIH.: PRODUCTION, STOCI(S, AND UNFILLED ORDERS IN BASIC INDUSTRIES
l i l I
I I
I I
.J~""' /
''" ,
'N.I \.. r\ ~If ~, ~l\ I \
r--r~';;--· 1--..-'i\\
-+---~~ I I_
I ! « > > >
(~Ionthly m·erage 1920= 100)
1 , ·' i\
}1~~ I \ ,,. \ ... 'f-STOCKS 4& COMMODITIES
I ' ,, I / f ,,, ' ,' \ \
' .. .. ,. \ I : \,' \ ,-, .. ~ 1\ ; \ , I I
\ l J~J ' ' 1 if\ J A -I I V\ A If v ~ ........ , rv 1920 MONTHLY AVERAGE
I lrJ {~\_ I I
.-~hi'~" I . I •
' I ~ I --
~ I ~ v-1~ PRODUCTION 8a COMMODITIES I J.J/ \
\ • -1', -,
~ I
ti
..... ~ .....
~- .... ·-r--. .. ~
19'JI
l ~---
~ I
l..- ./
_rtNFILLED ORDERS 8 COMMODITIES
•
.. ! I
1\ -~. I
/
~--
-
~ I
I
I l
~ • 1924
>

9
Retail trade by 10-cent chains stood at 140 for Feb- 1
ruary, based on 1919 as 100, as. against 126 for January and 117 a year ago, while sales of mail-order houses on the . same base were computed at 96 for February as compared with 99 for January and 84 a year ago. Sales of music and drug chain-store systems were larger in February than in either the previous month or February, 1923, while for grocery and shoe chains increased sales over a year ago alone were registered' in Febmary. Sales of department stores declined seasot\ally in February, but were 12 per cent larger than a year ago.
PRICES
Prices received by producers for their crops at 41 per cent above pre-war may be compared with 40 per cent for January and 30 per cent a year ago, while the livestock index, based on 1913 as 100, stood at 98 for February as against 97 ~or January and,107 a year ago.
Wholesale prices as compiled by the Department of Labor, based on 1913 average prices as 100, stood at 152 for February as against 151 for January and 157 for a yenr ago. Prices of the metal and metal products, buil~ing materials, and fuel and lighting groupings registered increases in February, while farm products, cloths and clotliing, and chemicals declined. As regrouped by the Federal Reserve Board this index shows an increase in raw products, due to increased prices for animal products, forest products, and mineral products, against which a deline in agricultural products is shown. As between producers' goods and <Jonsumers' goods, the former grouping registered an increase over January and the latter a decrease. Dun's index of wholesale prices at 58 per cent above 1913 showed no change from either the previous month or a year ago, while Bradstreet's index at 40 per cent above pre-war may be compared with 43 per <lent in January and 51 per cent a year ago. ·
The Federal Reserve Bourd's wholesale price index ior international comparison at 163 showed no change from the prices prevailing during the five preceding months, while British and French prices continued to .advance, the increase in British prices over the previous month amounting to slightly more than 1 per <lent and the increase in French prices to 5 per cent.
Retail food prices as compiled by the Department of Labor stood at 147, based on 1913 as 100, as against 149 in January and 142 a year ago. The cost-of-living index at 64 per cent over July, 1914, may be compared with 65 per cent for January and 58 per cent for Febmary, 1923.
TEXTILES
more than 60 per cent less than in February, 19:!:~. this decline being lnrgely due to snuLller foreign receipts. Consumption of wool by textile mills in February declined 6 por cent from tho preceding month, while the hourly machinery activity showed relatively little change as respects looms but an increnso in the activity of cards, combs, and spindles. both woolen and worsted. Imports of wool incroll.Sed 28 per cent over January, but were 31 per cent below Fobruury, 1923. Prices of raw wool in February tweraged more than 3 per cent higher thun in tho previous month, while worsted yarns and woolen goods showed no ehnngo.
(I)
0
100
90
80
70
z 60 ~ 0 II. II. 05Q
~ 0 :::i ..J 40 i
30
20
10
\VooL CoN::>UMI'TION AND hn•ou1·s
(Consumption computed to 100 per ceot of industry)
I _l
~ jl il I
11 " I
_lj
II I I
I I I I . I
' \ ~
j ~~ ~
i\ ~ .,.
P\ 1 n r~
CONSUIII:PTION
~I I I
I
\ I
I ~- I • • i ,, ,_
'l
~, I
)
.. I
. ,. a: ..J ... II. :I 0 <( ., 0
1922
I 'I J~~ J I~
, ' \
I~ IMPORTS
t
i I ' ' ' ' ;
\. J ·o~
. ,. . >
ToTAL CoTTON GINXrxas FROM EAcn CaoP: 1913-192:)
0 182 3
2
I
0
182
1112
1112
1.111
Ill
1111
II
8
7
I IIIII
1111 6
11114
'
'
MILLIONS OF BALES
tO
'
. .
' '
" 14
'
.
I l I
Receipts of wool at Boston declined both from the previous month and from a year ago, being in February
93345-24-2
l 1013 i1 ' I I 11112 '
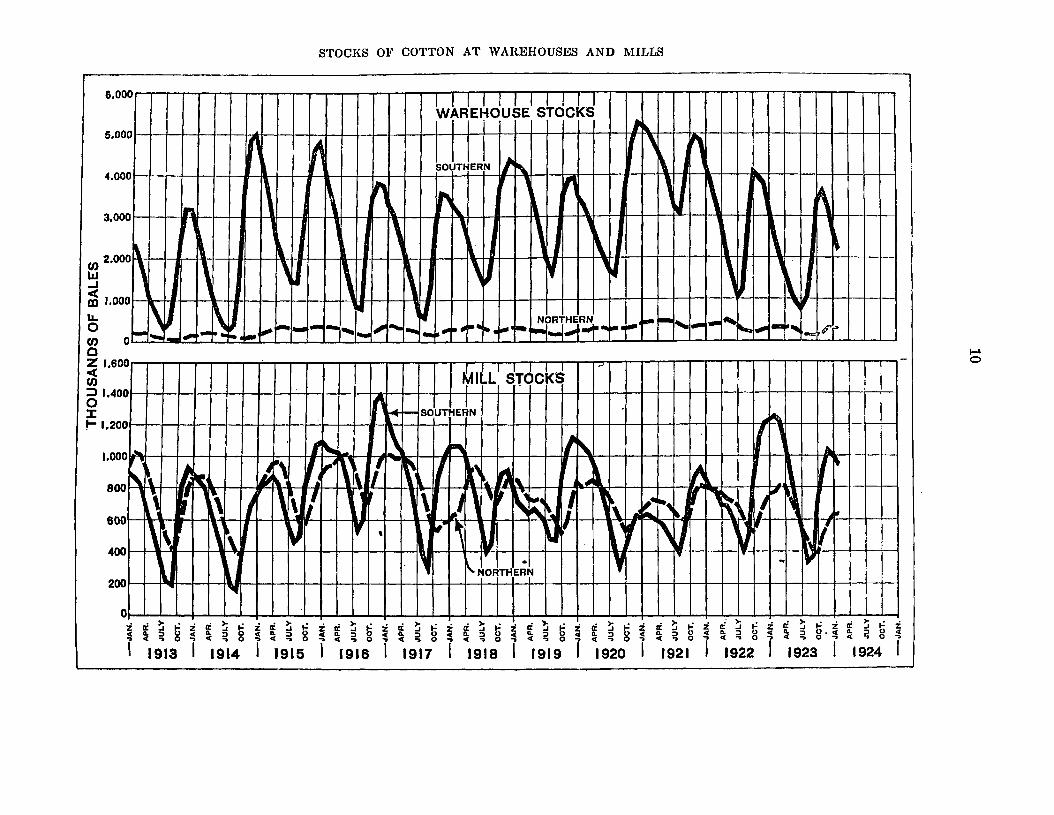
STOCKS OF COTTON AT WARE HOUSES AND 1\'UJ~LS
e.ooor-r--r--r-r...,.--r-r...,.--.,.---r-...,.---r--r---.--..---r--.--..---r~.....,-lr-~-r-·E.,.~.....,dr-u 1-r-SE.,.J's~r-J-rc•k.....,~;--r-·..,...-r--r..,...-r--r--r-r--r..,...-r--,-....,-r--,---~,..-,
~~ s.ooo '- -1-+-+---+-~1---hinH-+-1-1-1 ~...J.-I--l-l-l-...J.--+.-1--11--1-+-+-l--lf-l---+-+--+-1-H,~,H-f----lr"+-t----l-1:-f-+-+--j--jl--+-+-!--1 r 1 SOUTHERN 11"' 1\ r ,
4.oooi--+--J--+-----j:ftH-+--~-~~-+--+-~-~\>--l--+-l---l-f1 ~--1--+-Jc:..::.+f'~~,l-+.:l1ll--\ -~-+n:a~-\-+---t---.~,~--tt--.-\+---+-A:~+-+-+-1-~+-~----t--l-1
a.ooo H--1---•r• 1~-~---~---~--~--~~-~~ -11-+-\l----1-1--~l' ---1--1--f-'+---' l--1--1--+--+~-, ~,t--t-\ -tt-+--t---t-t--t--.-•-Ht-1-\-t-+-1---tl-, ~ +--+-+--~
r•oo\ ' '~ \ \ 1,~ ~ ,~ ' . \j m J.ooo~~-1-J.i-+-'-~+1-t--1---1--l-J---I--~1--1-+-+--111-J~ 4--t--1---1--l~-+-l-+-+-+-+-t-+-+-+-t-lr-t---f-1-+-Hri'~'--t-it-t--t-1-l
~ .~~L~.-~·-·' -- ~·-'·--~-~······~-·~~~~··--~,~-'~-·-~·-·~' 0 z 1,600 cc fJ)
:ll.400 0 X !- 1.200
1.000
800
800
400
200
0
-""' ~ \ ~ ~~
\' ; ,l, \\ \ \
lJ ~~ ....
n ~ -I --.. i\
ill ~' '· ,.~ \ l -t \
I \ \ l; ,
~ ' '
~ILLT lr6c1<$ " ·r .
SOUTHEJN ~ r-- -
I ~ , ,
~ A. , k'
, ~ ~ , ' ~ .. ... .\. "~
\ .I '' , ~ ~ ! , \ (J r ., ~ I
, \..j ~
.. , ~. \. • ., ...
~ u ,- ~, , \J , ~
~~ { l lJ " ,
~NORTHE~N ~ .. .,
~ i ~ t ~ ~ ~ t ~ f ~ ~ ~ f ~ t i i ~ t i i ~ t i ~ ~ t i ~ ~ t ~ f ~ t ~ ~ ~ t ~ f ~ t.~ f ~ t ~ ~ c , 0 ~ c ~ 0 ~ c , 0 , c ~ 0 ~ c ~ 0 ~ c ~ 0 ~ ~ ~ 0 ~ c ~ 0 ~ • ~ 0 ~ c , 0 ? ~ , 0 ~ < ~ 0 ~
I 1913 I 1914 I 1915 I 1916 I 1917 I 1918 I 1919 I 1920 I 1921 I 1922 I 1923 I 1924 I
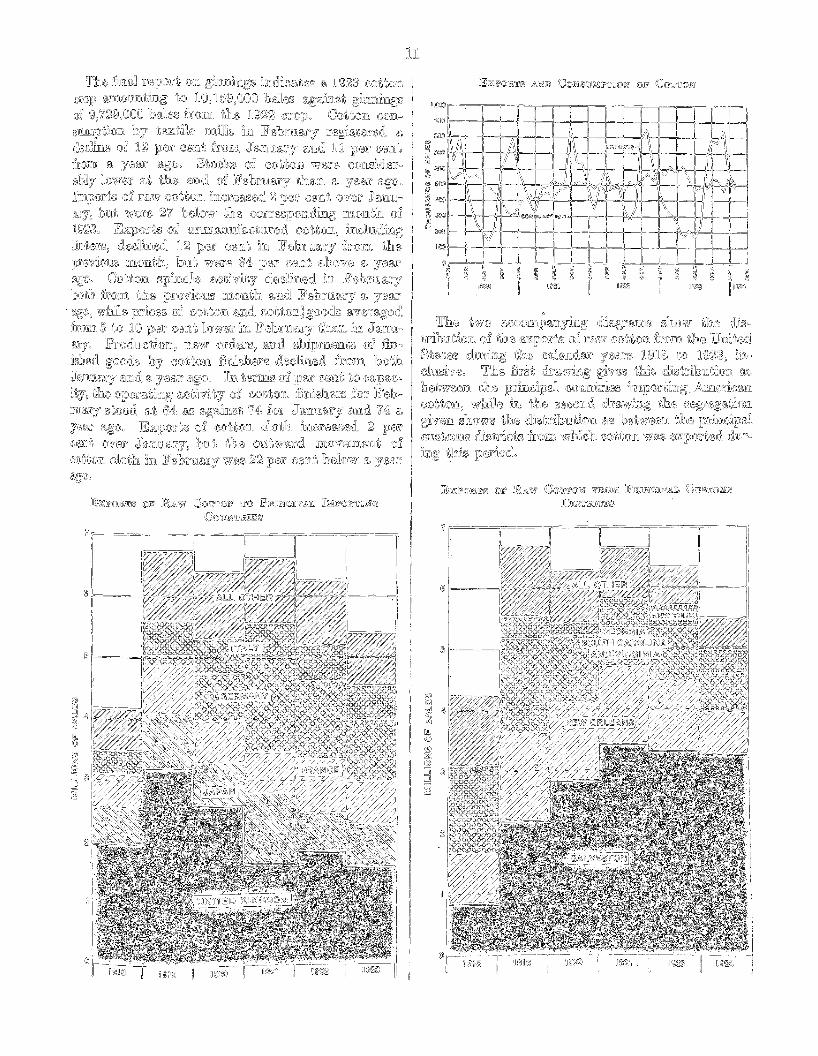
Jii;ll,TI'!i111i«'IT'8 l!liW lF:L&W CrDJ'lP!r!QlN CJriDl lP'IRSTINCCITlF.hlL li:ll£1F'CUllil'JriTNClli
CcCD1rJN7rRIT]ll;l1\
u
E%lP'I!lllRlTl11 !Ql:& RAw C©'M:CQJN ll'lRl©ll£ lP'lRlTINC\lrrws,& Cui<l~!QJM~ Drrl§'~L11TII!Jj!"i:l\
@ lj
19iiF'~~.

"' z
128
l:lO
112
04
96
88
60
1913 J M M ., 8
~ II.. 0
"'-"' 0 72 z < ., :I
!fa 1-II.. 0
j36
4
8 Ill 0: 0 z :I 4 X
8
4 0
3 2
1\i
1\ 1
' ~ 1\
... ~ -.~...
PIG-ffiON PRODUCTION AND UNFILLED ORDERS AT THE END OF EACH MONTH (UNFJLLED ORDERS FROM UNITED STATES STEEL CORPORATION)
1914 191!1 1916 1917 1918 1919 1920 1921 1922 1923 1924 N J M M ~ 8 N J M M.J S N J M M ~ 8 N J M M J S H J M M J 8 N J M M J 8 N ~ M M ~ 8 N J M M J 8 N J M M J S N J M M J • N J M M J
Ia ,l
If 1\ I'\
' ' STEEL UNFILLED ORDERS ~'I. \ Ill 1.- J , ,
II~ ,
J l I• 1/ 1\ ' , M
I I l 1.-.~
~ [{ 1 ...
r ~
l 11 1 \ II II l J I' rJ ,
" ~'if'
J ~ , \
u 11 " II " ~
7 , ~ !' l] ~
~ ~~ 1'-1-~ II ..jt\,
PIG IRON PRODUCTION
I' II--- ""'
.. ,.., ....~ lA. J"" r1
" "'~ LJ ~ 1.1 1\.4 ,.. Ill" ., liN ~ ... ... ,., ,, , : j 1\ ~ IJ I" " II ,.
" J~ IJ l"'l ,IJ ~ " I.J .r "" .. ~ ~~ lJ ,, I' 1- lj I\'
ll ~ '- l..ol,.
"~ 8
0

13
Silk deliveries to consuming establishments in February declined from both the preceding month and February a year ago, while stocks of silk at the end of February were 9 and 10 per cent less, respectively, than on January 31 and at the end of the corresponding month a year ago. Imports of silk declined in February, the decrease from the previous month amounting to 21 per cent and from a year ago 18 per cent. The wholesale price of raw silk at New York averaged 7 per cent lower than in January and 22 per cent lower than a year ago.
Imports of burlap increased in February, being ~ per cent greater than in the previous month and 21 per cent greater than a year ago. Imports of unmanufactured fibers declined in February, being 2 per cent less than m January and 6 per cent lower than a year ago.
IRON AND STEEL
Pig-iron production increased in February, being 2 per cent greater than the output in January and about 3 per cent greater than a year ago. Consumption of iron ore made correspontling increases over January/ I and a year ago, while stocks of ore at furnaces and Lake Erie docks at the end of February declined 14 per cent from January and 4 per cent from a year ago. Production, sales, and unfilled orders of merchant pig iron declined in February from both the previous month and a year ago, while shipments registered an increase over those two comparative periods. The production of castings by Ohio gray-iron foundries increased 13 per cent over January, while foundry stocks at the end of February, registered an increase of 4 per cent over January inventories and 2 per cent over a year ago. February average :wholesale prices of iron, though below a year ago, increased over January from 3 to 5 per cent.
The February production of steel ingots increased S per cent over January and 9 per cent over a year ago. Unfilled orders of the United States Steel Corporation at the end of February increased 2 per cent over the previous month but were 33 per cent below a Year ago. The output of steel sheets by independent :tnills increased over both the previous month and February a year ago. In terms of perc~ntage to plant capacity the February output was eqUivalent to 96.5 per cent as against 87.2 in Janua? and 89.0. a year ago. Shipments of sheets . also mcreased m February, but new sales, unfilled orders, and stocks declined. New bookings for steel castings in Feb~ary, although 21 per cent less than a year ago, ;egIstered an increase of 44 per cent over the pre~wus :month this increase being in great measure, attributable t~ larger bookings for' railroad special tie~. While new bookings for fabricated structural steelmcreased 3 per cent over January, wholesale prices of ~teel showed practically no change from the prevtous :tnonth.
The follo\Ving table shows statistics of fabricated structural steel reported to the Department of Commerce by 180 identical firms with a present capacity of 234,505 tons per month and total statistics computed to a capacity of 250,000 tons per month in 1922 and 260,000 tons per month in 1923 and 1924 prorated from the percentage figures.
FABRICATED STRUCTURAL STEEL
BOOIUNOS 5111PMENTB
-- --~--,-Per I Per
Actual ton· cent of
1
Computed cent or Computed YEAR AND MONTH
l nage ca· tonnage ca· tonnage
-~-~ -· _ __ paclty
1
____ -·- pacity I---
ApriL--'-···---·········-··· 201,800 87 217,500 .................. . MBY-·-·-·---··-----·-·····- 185,847 80 200,000 June........................ 169,991 73 182,500 JulY----·-·-----··--·---····- 158,828 68 170,000 August...................... 157,559 68 · 170,000 September·-·-··---·-·-··---, 147,004 64 160,000 October ______ •...•....•....• 133,737 58 145,000 November .•........ ----····· U3,13S 49 122,500 December................... 139,547 60 150,000
1928 January •••.•• ----···----·--- 174,100 73! 189,800 February.................... 185,763 ~ 202,800 March •••.•• ----·--·--···-.. 221,342 241,800 April.---··········-··---·-·· 187,271 ~ 205;400 May........................ 132,873
50 145,600
June •••••• ----··-·--·--···-· 119,086 130,000 JulY---···-··-·--·-·······--- 118,386 50
57 130,000
August •..... ····-·--·-····-- 135,914 62
148,200 September.................. 122,401 .
48 135,200 October ________________ ..... '113,636
63. 124,800
November................... '126,482 I 137,800 December................... •1~ 762 79
1 205,400
-----79' ···-~;400 69 179,400 66 171,600
~~~~;,·.:=;;:2
:}~~~:=:=~=~: ~~~~ ---~1--~~~ I
64 60
166,.00 1:16,000
I Reported by 1751lrms with a capacity of 238, 005 tons. • Reported by 174 firms with a capacity or 237,755 tons. · 1 Reported by 1681lrms with a capacity or 232,195 to!lll. • Reported by 158 firms with a capacity or 228,155 tons.
LocoMOTIVE SHIPMENTS AND UNFILLED ORDERS
:z.ow ""' ,.
1<2.2110 r~ II I \ 0 i I ' ~
" ~t.O(Xl =400 ~MKA ON UNFfU.I!D ORDI:R ~ \ ~ i
' z 0
~ = 1.760 300
"\ I ~
l~U z ,., \.
1..6()( 300 I
' M I
A ' ' I \ '"'~ 1160 ; n,_, ' ' ~ ' ' I ' ~HUMBER aH PPED
I J ' I ' 1.000 l2llO T
\~v ~ J \
' 7~ ·~ ~ 1\ I
100 'l \ • .. ,
' IOC \ ,, t l~ t I \
' ' I, IV 260 eo ...
11 r" 0
> li • ~ . • • ~ f .. c 11024

February locomotive shipments by principal manufacturers declined 34 per cent from the previous month and 52 per cent from a year ago. Unfilled locomotive orders at the end of February were 33 per cent larger than on January 31, the number of locomotives on order at the end of February being 499 as against 376 for January 31 and 2,220 a year ago. New orders for freight cars increased 350 per cent over January and 430 per cent over a year ago. The number of mechanical stokers sold in February increased over January, while the horsepower equivalent declined. The value of steel furniture shipments increased in February over both the previous month and a year ago.
NONFERROUS METALS
Copper production declined 4 per cent in February, but was 25 per cent greater than a year ago. Exports of copper increased 30 per cent over January and 79 per cent· over February, 1923. Wholesale prices of electrolytic copper averaged 2 per cent higher in February, while sales of tubular plumbing goods, although greater than a year ago, declined markedly from January.
Zinc prod~ction declined 12 per cent from January, ·but was 4 per cent greater than a year ago, while stocks of zinc at the end of February, although 242 per cent above a year ago, declined 9 per cent from the previous month. Receipts of zinc at St. Louis declined, while shipments from St. Louis increased over the previous month. The wholesale price of prime western zinc, in slabs, increased 4 per cent during the month. , Stocks of tin at New York increased 17 per cent ~ut the world visible supply at the end of February 4eclined 10 per cent and 13 per cent, respectively, froi;n the previous month and a year ago. ConSu£?-pti?n of tin increased 81 per cent over January, while ~ports registered an increase in February, amountmg to 59 per cent over the previous month, and the wholesale price of pig tin averaged 9 per cent liigher P1 February than in January.
FUELS
The output of bituminous coal declined 10 per cent in February, while exports increased 21 per cent over the previous month and the wholesale price of bituminous coal showed little change from January. The production of anthracite coal declined 4 per cent in February, while exports increased 14 per cent and the retail price of chestnut at New York averaged 3 per cent lower than in the previous month.
The production of petroleum declined 3 per cent in February but was 14 per cent larger than a year ago, while stocks continued to accumulate and the wholesale price averaged 22 per cent higher during the month. Reports from the American Petroleum Institute indicate a consumption of 57,641,233 barrels
14
of fuel oil in the year 1923 by locomotives of the principal railroads in the United States as compared with 46,628.556 barrels in 1922.
PRODUCTION OF BEEHIVE AND BY-PRODUCT COKE
,. ~ i'-17 rv -
BY-::."UCT 1 II ~I A I
\ .. v tv v .r ~ lA. .I
6
" V"" ,, ' .. I 1\ .. ,; ~
0 \ \ 8!!EHIVE-+/ \ ,"' . ,, \
"' .. ... --v' >
~~~8~.! ~ 8 I 1121 l 1122
~ ! Jllll4.
AUTOMOBILES. AND TIRES
Automobile production increased in February, the passenger-car output totaling 336,363 cars, as against 287,302 in January, and trucks 31,072, as compared with 28,846 in January. Shipments of automobiles in February increased correspondingly over the previous month.
The first diagram on page 15 gives, by geographic distribution, the percentage increase in automobile registrations at the end of 1923 over comparative periods. The increase of registrations at the end of 1922 over 1921 is also given. The data upon which this chart is based were compiled by the Bureau of Public Roads, United States Department of Agriculture, and include passenger cars and trucks, both gasoline 'and electric. On page 15 is also given a drawing showing the comparison of automobile registrations and concrete highway mileage at the end of 1923 by geographic divisions, and on this diagram will be found a map of the United States showing the geographic divisions which have been used in each instance. . Product~on of pneumatic tires, tubes, and solid ti~es mcreased 1n February. Except for inner tubes, t1re shipments increased, while stocks of all classes of automobile _tires continued to accumulate. The·diagr~m below gives the course of production, shipments, and stocks of pneumatic tires since January, 1921.. In this drawing the excess production over current shipments is indicated by the shaded area, while the excess shipments over current production is indicated by the black area.
Imports of crude rubber increased 44 per cent over January, while the wholesale price of rubber averaged 4 per cent lower, being in February 76 per cent beloW' the average prices of rubber in 1913.

15
TOTAL AUTOMOBILE REGISTRATIONS AT THE END OF 1923- PRODUCTION, SHIPMENTS, AND STOCKS OF PNEUlllATIC TmE:
PER CENT INCREASE OvER CoMPARATIVE PERIODS
... z ~ a: w a.,
.J
" 5 .... 0 z c( a: c:J
0 i= z j ....
0 < ;;: X 0 1-
::l
a: 0
"'
HIDES
1922 OVER 1921
1923 OVER 1922
1923 OVER 1921
..J 0 .J .J .J ot ot < < ~ a: a: a: a: z .... .... 0 ....
1- < z z z z z .J 11.1 w < w w
~ 0 0 0 0 .J z
CJ ;s 0 0 11.1 g 0 z z ... z "' .J w z 0 t; t; ....
!:! .... :e ::l
"' w "' w c( w 0 < :e ~ w :::! w z :!
AND LEATHER
Imports of all classes of hides and skins increased in February, the total being, however, 41 per cent below the inward movement of February, 1923. Exports of sole leather and upper leather exports increased over the previous month. Wholesale prices of hides and skins averaged higher in February, while prices of leather showed no change from the preceding month.
Boot and shoe production increased slightly in February, while exports registered an increase of 32 per cent and wholesale prices of boots and shoes showed no change from January except for quotations for women's· shoes at St. Louis, which declined. The following table shows the number of leather gloves and mittens cut in January and February as reported to the Department of Commerce by 235 identical establishments.
., "' ~ 4~-+~~-4--~--~~--+--+--+--4--4-~~~ ... 0 .. IZ 0
3 3r--+--~-4--~--~ah~+-~~~~--,_~~~~ :E
~ 11121
~ I
z ·~ ~ " I
~ ~ .. " 1 1112•
LEATHER GLovEs AND MITTENS CuT (IN DozEN PAms)
IANI1ABY
Men's and
boy's
Women's and chi!·
dren's
FEBRUARY
Men's and
boy's
Women's
BD<l chll·
dren's -----------1--------------Dress and street gloves, etc.:
b~~:::~~:::::::::::::::::::::::::::: Work gloves, mittens, etc ••••••••••••••••
21,408 31,457
138,990
5,598 2,106
349
23,934 35,084
145,0H
PAPER AND PAPER PRODUCTS
7,316 2,227 '2\ll
Imports of mechanical wood pulp declined slightly from January, while chemical pulp imports in February increased 40 per cent over the previous month. Total pulp imports in February aggregated 141,815 tons, as against 125,540 tons a year ago. Production and shipments of newsprint paper decreased in February but were above a year ago, while stocks of newsprint continued to accumulate, being at the end of February 31 per cent larger than a year ago. Imports of newsprint paper declined 4 per cent in February but were 15 per cent larger than a year ago.
Production of paper boxes increased, being in February 7 per cent larger than the output of the previous month and 4 per cent greater than a year ago. The operating time of paper-box manufacturers was com~ puted at 78 per cent of normal, as against 72 in Jan-

16
uary and 7 5 a year ago, while prices of finished boxes ' were about 10 per cent lower than a year ago. Sales of abrasive paper and cloth in February increased over both the previous month and a year ago.
BUTTONS AND GLASSWARE
'l'he productive activity of manufacturers of freshwater pearl buttons increased from 38.4 per cent in January to 43.5 per cent in February, which may be compared with 53.4 per cent for a year ago. Stocks of buttons continued to decline, but at the end of February were 6 per cent greater than a year ago.
Production and new orders for illuminating glassware increased in February, but were 5 and 26 per cent less, respectively, than a year ago, while shipments increased over both the previous month and a year ago.
BUILDING CONSTRUCTION
Construction. costs in general increased in February, while fire losses in the United States and Canada declined from both the previous month and February a year ago.
Contracts awarded for building construction in 27 northeastern States called for an expenditure of $259,264,000, as against $261,320,000 in January and lettings amounting to $229,938,000 a year ago. Residential construction represented 50 per cent of the , February awards, as against 61 per cent in January and 39 per cent a year ago, while the February lettings for the construction of business buildings represented 16 per cent of the total, as compared with 13 per cent in January and 12 per cent a year ago.·
Below are given comparative monthly statistics covering the awards for construction in 36 States, representing seven-eighths of the total construction of the United States.
Co~STRUCTION CoNTRACTS AwARDED IN 36 STATEs 1
~="y-~o=.==o==- -- • ~-=c=
I 1924 ~ 1 -~ February, ; 1923 1 January February I
Orand total: ~~ -- -----~~---
CHARJ..CTER OF CONSTRUCTION
Value ......... thousands of dollars .• [ 301,952 299,929 ij 281,140 Floor space ..... thousandso(sq. ft .. , 56,624 54,879 i; 49,553 Numberofprolects ................. i 8,111· 8,057 I 7,030
Business: i I Value ............... thousands of dollars .. 1 38,393 47,124 Floorspace .......... thousandsofsq. ft .• I 7, 778 9,420 I Number of projects....................... 1,057 1,124
Industrial: i Vnlue--------·--·---thousands of dollars.. 24,769 19,060 i Floorspace .......... thousnndsofsq. ft.. 3,795 4,096; Number of projects....................... 2SO 303
Residential: Value ............... thousands of dollars.. 170,186 Floorspace __________ thousands of sq. ft.. 37,945 Number of projects....................... 5,977
Educational: Value._ _____________ thousands of dollars.. 18,519 Floor space ••.•...•.•• tbousands of sq. ft..1 3,114 Number of projects ............... : .••••.. I' 149
Other public and semipublic: 2 Value. ______________ thousands of dollnrs •• Floor space ........... thousands of sq. ft .• Number of projects.-----------------·----
Public works and utilities: Value ............... thousands of dollars •.
1 Number or projects-----------------··-·--
21,705 a,:ns
287
28,381 361
U2,079 31,348 6,683
31,155 5,839
233
22,556 3, 706
319
37,956 395
34,698 8,185 1,023
40,275 6,580
349
113,902 25,658 4,653
27,668 5,268
220
25,706 a,: 38,893
536
1 As compiled from data furnished by the F. W. Dod~e Corporation. ·
un• !~eludes hospi~ and instltu~ions, public buildmgs, social and recreational b dings, and rellgtous and memorial buildings. ·
The diagram on page 17 gives a quarterly comparison, since the beginning of 1920, of new awards for public and semipublic const,ruction in 27 northeastern States and new issues of long-term municipal bonds.
VOLUME OF BUILDING CONTRACTS AWARDED, BY CLASSES

17
CONTRACTS A WARDED FOR PUBLIC AND SEMIPUBLIC CONSTRUCTION AND NEW ISSUES OF LONG-TERM MUNICIPAL BONDS
600r-----------------------------------------------------------------------------------~
1920 1921
BUILDING MATERIALS
Total production of 10 important species of lumber, representing over 70 per cent of the total cut of lumber in the United States, increased in February over both the preceding month and February, 1923. Corresponding shipments of lumber increased over January, while stocks of lumber, except for southern pine and Michigan hardwoods and softwoods, were larger at the end of February than a year ago. Exports of lumber in February, although 20 per cent greater than a year ago, registered a ·decline of 27 per cent from January, while prices of lumber in general averaged higher during the month.
Production and shipments of oak flooring declined in February, while maple flooring shipments increased and production declined from the previous month . .As compared with a year ago, the February production and shipments of oak flooring were 19 and 22 per cent greater, respectively, while the output and shipments of maple flooring were 14 and 23 per cent lower. Stocks of oak flooring at the end of February were 51 per cent greater than a year ago, while stoc:;ks of maple flooring were 11 per cent less than those held at the end of February, 1923. New orders for both classes of flooring were considerably below a .Jear ago.
Production and shipments of refractory bricks in February increased over the preceding month and a .Year ago. New orders and unfilled orders for clay fire brick also increased in February, new orders being about 1 per cent larger than a year ago. Stocks of clay fire brick at the end. of February were 23 per .cent larger than a year ago, while the silica brick in-
93345-24-3
NEW LONG-TERM MUNICIPAL BONO ISSUES
1922 1923
ventory indicated a decrease in stocks from a year ago, amounting to 9 per cent. Production and shipments of face brick increased over both the previous month and February, 1923, while unfilled orders for face brick on manufacturers' books at the end of February were 21 per cent less than a year ago, and stocks continued to accumulate. Production and shipments declined while new orders and unfilled orders for paving brick increased in February, the production of No.1 and No. 2 brick being in terms of percentage to normal plant capacity 45 per cent as against 37 in January. Wholesale prices of common brick at New York showed no change from those prevailing in January. The production of Portland cement declined 2 per cent in February, while shipments increased 14 per cent and stocks continued to increase, the inventory at the end of February being 24 per cent larger than a year ago. Wholesale prices of cement showed relatively no change in February. New awards for concrete pavements were 14 per cent larger than the lettings in January, but were 27 per cent smaller than the awards in February, 1923.
The first diagram on page 18 shows by geographic divisions a comparison of concrete highway mileage and automobile registrations at the end of 1923. It should be noted that, for the purposes of this chart, concrete highway mileage alone is given, no other hard-surfaced highways being included.
New orders, shipments, stocks, and unfilled orders for all classes of enamel sanitary ware increased in February. The production of roofing felt in February increased over both the preceding month and a year ago.

d
~ © I p
© !? [co ~ !!! © lQ1 !!! B
Hm;w Ol!ilrr»l!i;J?;B lJi'(QliTi :]\A'li'JHI!} ANID ilJ!QJNTl!i\A<\J'li'!l AwAITiED:iillrr» :li©m Nm:w ilJ~D~NB'EL~J!JC'li'IT'!:IN
[n®n~ m©:m~lbJiy av@c$\~-nooJ

48 per cent larger than a year ago, and the wholesale price of oil in New York averaged 8 per cent lower than that which prevailed in January. Consumption of oleomargarine declined 1 per cent in February, but was 20 per cent larger than a year ago.
Except for shipments from Duluth, which increased over January, receipts, shipments, and stocks of flaxseed at Minneapolis and Duluth decreased in February from the previous month.
CEREALS
Receipts of wheat at the principal primary markets increased 25 per cent in February, but were 8 per cent below a year ago, while shipments of wheat declined 5 per cent from January and 1 per cent from a year ago. The visible supply of wheat in the United States- and Canada east of the Rocky Mountains at the end of February was 43 per cent greater than at the end of the corresponding month of 1923, while exports of wheat, including flour, declined 18 per cent from both January and a year ago. Wholesale prices of wheat at Chicago averaged higher in February, while prices of flour likewise increased over the previous month.
The following table shows the output of wheat flour reported by over 1,000 mills each month, which made about 84 per cen_t of the flour produced in 1921, according to the census of manufactures.
WHEAT FLOUR PRODUCTION ·
·--- . . .. Wheat Flour Grain otral Per cent
YEAR AND l!ONTH ground produced produced or (thous. of (thous. of (thous. or capacity bushels) bushels) pounds) operated
--.. ____ 36,871 7,805 633,324 48.0 ------ 44,179 9 642 772,774 M.7 -·--- 44,969 9:760 796,325 62.1 --·-- 50,810 10,983 908,311 62.0
----- 43,606 9,403 783,669 68.8 ----· 37,799 8,137 678,576 49.3
1928 iuly -----------· -----------August ___________________ _
September .............. .. October .................. . ~ovember ----------------
ecember ............... ..
----- 41,833 8,970 746,040 51.9 ........... 38,812 8,353 698,6311 53.3
1 1924
F:~:::::::::::::::::: . Receipts of corn at the primary markets increased
42 per cent over January and 39 per cent over a year ago, while shipments in February increased 8 per cent over the previous month and 28 per cent over February, 1923. The visible supply of corn at the end of February was 31 per cent below a year ago, while exports of corn and cornmeal increased 14 per cent over January but were 60 per cent' below a year ago. Corn grindings for gl'!lcose and starch manufacture increased over both 1the previous month and February, 1923 .. The wholesale price of corn averaged 5 per cent higher than in January.
Receipts of barley, oats, and rye increased corre~ spondingly over the previous month and a year ago, except for rye, which declined 59 per cent from February, 1923. The visible supply of oats at the end of February was 36 per cent 1ess than a year ago, while
19~
the exports of oats and barley were only about one-half as large as a year ago. Wholesale prices of. oats and barley averaged higher in February, while the price of rye declined. Receipts and shipments of rice from mills declined from January but were 48 and 65 per cent larger, respectively, than a year ago. Exports of rice declined, 42 per cent in February and were only about one-half as .large as. a year ago, while imports of rice in February registered a decline of 29 per cent from the previous month and 20 per cent from a year ago.
Car-lot shipments of fruits and vegetables increased in February over the corresponding month of 1923, while hay receipts at 11 principal markets increased 4 per cent over January and 51 per cent over a year ago.
MEATS AND DAIRY PRODUCTS
Receipts, shipments, and slaughter of cattle declined seasonally in February but, except for shipments, were larger than a year ago. Receipts, shipments, and slaughter of hogs also declined seasonally but were considerably above their respective move~ ments in February, 1923. Receipts and slaughter of sheep also increased over February, 1923, but shipments from primary markets in February were less than a year ago.
Exports of beef pl'oducts increased 18 per cent over the previous month and 2 per cent over a year ago, while the cold-storage holdings of beef products at the end of February were 3 per cent less than a year ago, and prices of cattle and beef averaged higher during the month. Exports of pork products declined 15 per cent from February but were 16 per cent larger than a year ago, while storage holdings of pork at the end of February were 12 per cent larger than a year ago and prices of hogs and pork declined during the month. Storage holdings of lamb and mutton at the end of February were 62 per cent lower than a
. year ago, while prices of sheep and lamb averaged · considerably higher in February. Cold-storage hold. ings of fish at the middle of February were 50 per cent ; larger than a year ago and the receipts of poultry ' were also larger than a year ago.
Receipts of butter, cheese, and eggs at the prin~ipal markets increased in February over the prevtous month and a year ago, except for eggs, . while coldstorage holdings of these products were larger at the end of February than a year ago. Wholesale prices of butter and cheese averaged lower than in January.
TOBACCO
The consumption of cigars, cigarettes, and tobacco as measured 'by February tax-paid withdrawals de~ clined from the previous month, but, except for a decline in cigars, the February consumption was larger than a year ago. Exports of unmanufactured to-

bacco declined in February from January, but was 59 per cent larger than a year ago. Sales of tobacco at loose-leaf warehouses declined in February, but were 37 per cent larger than the sales in February, 1923.
WATER TRANSPORTATION
The tonnage of vessels engaged in foreign trade, entering American ports, was less in February than in January, due to a decrease in the tonnage of incoming American vessels, while clearances from American ports were also less in February, the decline being attributable to decreased tonnage of outgoing foreign vessels. Freight rates to the United Kingdom and all Europe from Atlantic ports increased in Febmary, but were 70 and 75 per cent, respectively, below the rates prevailing in January, 1920.
RAILROADS
20
of ore, although greater than in January, were below Febmary a year ago. Freight cars in need of heavy repairs increased in February, but at the end of the month were 22 per cent below. a year ago. Locomotives in bad order, both freight and passenger, also increased, but at the end of Febmary were 28 per cent below the corresponding period of 1923.
EMPLOYMENT
Factory employment in the aggregate, as shown by reports from 1,428 representative factories, remained stationary in Febmary, but, as compared with a year ago, an increase of one-half of 1 per cent was registered. Of the 14 major groups into which these factories have been divided, seven recorded increases over the previous month, viz, iron and steel, lumber, paper and printing, chemical, stone, clay and glass, metals other than iron and steel, and vehicles, ranging from one-
The net available daily average surplus of freight half of 1 per cent in the vehicle and iron and steel incars for the last week of February totaled 130,282 cars dustries to 2 per cent in the lumber industry. Seven against 164,438 cars for the same period in January groups recorded declines in industrial employment and a net shortage of. 64,814 a year ago. February . from the previous month, viz, food products, textiles, car loadings ~veraged .908,404 cars per week as against !leather, beverages, tobacco products, railway repair 858,863 cars m January and 848,269 a year ago. I shops, and miscellaneous, ranging from two-tenths of
S · 8 B 0 T L , 1 per cent in employment in miscellaneous factories to llORTAGE, URPLUS1 AD• RDER, AND OTAL OADINGS , • •
oF FnEIGilT CARs more than 3 per cent In factones producmg tobacco
18ll0 11121 1822 ·lm i ~ ,.: i ~ ~ a: ~ ~ IE ~ .. u ~ ~ ~ ~ l! .. c 0 .. 0 .. 0 c
_rl
:f' ~ / \ 'lr
\ l
/ \ )I\ A r l \.J .,
',' \ l.r 1: I/ r ••• 1( . c"..., :u'"
\
... c:
"' ()
... 0
800 ~
600
400
...... ~ .. · tv'' '""-~
tnll
:I ~ r
..,
{\ 1/ ) ''~~ L/ ~
\
.R OHC
K:.R IUR"' ,uo
,.. ~-.. ·"l'-, -•o•• COR:
~ \ ~ ...... ~-...
['. \
I I '\
'""
111124_ z ~ .. ~ ~ c
\ t/
•
~
Except lor livestock and coal, which declined from January, the increase in weekly loadings in February over the previous month was general, while loadings
manufactures. Of the industries reporting increases over January, five also recorded increases over a year ago as follows, lumber, paper and printing, stone, clay and glass, metals other than iron and steel, and vehicles, while of the seven which recorded decreases from January employment in two was above a year ago, viz, beverages and miscellaneous.
Employment in New York State, Wisconsin, and Illinois increased in Febmary. Average weekly earnings in New York declined in February, while for Wisconsin factories weekly e<J.rnings in February averaged higher than in January. The following monthly figures, reported by the United States Civil Service Commission, give a comparative summary of the operations of the civil-service system:
CIVIL-SERVICE APPLICATIONS, EXAMINATIONS, APPOINTMENTS, AND SEPARATIONS 1
NUJlBER OF NUJlBER OF NUJlDER or NUJIBER Or APPUCATIONS PERSONS PERSONS PEBSONS
YEAR ANI> RECEIVED EXAJIWED APPOINTED SEPAILA'J:ED
JlONTH Depart- Field Depart· Field Depart· Field Depart- Field mental service mental service mental service mental &ervice service service service service
·--~------ -----------191!3 June ••••••••• 3,930 9,898 3, 615 11,051 5011 5,629 876 6,990 July---·----- 4,176 13,948 2,3211 12,660 599 6, 787 623 8,373 August •• _____ 3,875 15,218 1,817 11,770 6111 6, 791 545 6,1511 September ___ 2,1180 18,538 1, 793 16,8~ 702 7,514 937 7,743 October •••••• 2,415 19,263 3,038 16,893 552 6,612 823 6,338 November-·- 2,953 15,511 2,478 15,1164 509 8,059 604 6,V60 December •••• 2,410 12,887 1.397 9, 71(1 366 6,021 475 • 5, 747
1924 15,4111 January _____ 8,129 15,304 3,120 13,534 212 16,789 240
February·--- .... -............
1 BY departmental service is meant service in W ashlngton, D. 0., exclusive or the jurlsdicti<Jn or the fourth civil-service district with otnces In Wash!ngtoncl. l~ field serv1ce Is meant all service outside or the District of Columbia and In u the service in Washington under the jurisdiction or the fourth civil-service district.
s Subject to revision.

...
... "' "
. , .. •
FOOD AND KINDRED PRODUCTS
~
'TTT . . ~ .
·, l ~ : IT u H ! d d ~ r ... t• 1 .. '·-
•• ... ... I
... "' ... ,,
...
... .. ...
'" .. . .. I...
CHEMICALS
I'
rrr I
LUMBER AND ITS MANUFACTURE
v I--
i"TT
.
. . . . ~1 HHHHI~HSE '"' I ,., I •• I••
21
EMPLOYMENT IN SELECTED INDUSTRIES 1
(Relative employment 1921-100)
t:EXTILES AND THEm PRODUCTS
...
.. .
f- lrf-..
. '"i"'il' 1--,.,
"
METALS AND METAL PRODUCTS (Other lhan iron and sleel)
.. . .. ..
.. I
.. '"
~
v • i'"'iT
...
• ! i i i s a i i a i. ~ t ~ '"' 1 •r.a tt21 T lt24
PAPERlAND PRINTING
'"H+H-++-IH--1-H--t-H
ooaH+H++-11-+-t-H-+H
•oo..H+-1-1-+-!--ci-++H+H
, .. H++-1+~1-++H+H
.. ! 5 i 3 ! .! i i ! ! i i ! ! i I '"' I "'' I ,., I'*"
IRON AND STEEL AND THEm PRODUCTS
...
. "' ;· il "' 1:1 ~ .•
... " ..
v i'
1\ 1/
l"v "iTI
!!iijliHii~Hi I •a• ,,.. I •• l••
TOBACCO MANUFACTURES
.. I
"
"
k ~-·"1:
" .. I .. .
I i . ' !nHn ... 3 • I ~ , .. I •• I •• l•t~t
RAILWAY REP Am SHOPS
.. "' ...
Ill\ 1/ .. ~ ~··rn . . .. . .
LEATHER AND FINISHED GOODS
...
...
... "' 110
I-- t\ L-- j..l!-1' ' TTl v " .. . !!aP1 ldHlHii • "" ... r •• J ...
..
. " .. "
IJ
VEHICLES FOR LAND TRANSPORTATION
J
•"-
111\1-J
r- 1 ~ Til
> >
• .. j. ! i I I ! H I ! ~ i ! I •. ... ' ·- ·- ....
...
...
.
'"
TOTAL, ALL INDUSTRIES (1,428 !aetorlu)
1!1 ' '
' ! t ' : i i I I
i l I I I I
J v~
Ti-l .a i
k: I I I
I I . .
I Detailed data, on which these charts are based, covering the 14 major industrl~ as grouped according to classification ln the eeiiSUS of manufactures will be found on pages 172 and 173 otthe February Issue (No. 30) orthe Survey of Current Business.

22
IMMIGRATION, EMIGRATION, AND IMMIGRATION QuOTA
120
100
80 .. 0 z ~60 ~ J: 1-
40
I J
I lk ~ \
1/
A
I ., ,,,
~ "' \ .MMIQAATIOJ..d__ l ·~ II \ I n J \ I
I ~1 'l MONTHLY V"' QUOTA . ., -· .. 1 07. ;./ I\ r-··r-\-'-20
t-:.1 EMIQAA-:;;~
0 Zci~~Zf!itZf~t; i ~ .!a. 0 i " .!. 0 1 " .!z 0
l'h
\I
.. ··- -· I\
~ ... ,
Operations of State and municipal. ~mployme~t agencies in February recorded less actiVIty than m either the previous month or a year ago as respects registration of workers, jobs, and placements. The 'ratio of applicants per job stood at 1.45 for February as compared with 1.61 for January and 1.05 a year ago.
DISTRIBUTION MOVEMENT
Sales of two leading retail mail- order houses declined slightly in February but were 16 per cent larger than a year ago. Sales of four 10-cent chain systems increased 11 per cent over January and 20 per cent over a year ago. Two large restaurant chains registered a decline in sales· amounting to 5 per cent, but the February business was 8 per cent greater than a year ago.
Candy sales by manufacturers in January, as measured by internal-revenue tax collections during the month of February, declined from both December and a year ago. Advertising in March magazines increased 14 per cent over the previous month and was 11 per cent larger than in the magazines for March, 1923. Newspaper advertising in the principal cities of the United States declined in February, but was 7 per cent larger than a year ago.
Postal receipts in 50 selected cities declined in February, but were 10 per cent larger than for the corresponding month of 1923. Internal-revenue taxes collected in February covering theater admissions and jewelry sales in January declined from the col-
lections in January, but were larger than those of a year ago.
SALES oF MAIL-ORDER HousEs AND CHAIN TEN-CENT SToRES
l il •
ct<AIN IToREa-1_ il
..
1'\ .. 1 " j I , A I• JJ /1 I
~ J. 11 A I I ~-: ~A 1 j ,. I"" ~J .I J~ t ""'· kJ_ I ~ I
t r--1-' 1 r~ rz_ f1' '~AIC·OR EFt HOUSU·
I"' 0
I
0 . . . . 8 ! !
1920_ 1121 l1t24
PUBLIC FINANCE
The gross debt of the United States Government was reduced three-tenths of 1 per cent in Fe~ruary, standing at $21,520,000,000 on February 29, 1924. At the end of February the short-dated debt, i.e., the debt' maturing within five years, stood at $8,490,000,-000 as against $5,730,000,000 a year ago. Customs receipts increased 26 per cent in February, while the total for the eight months ending February 29, amounting to $359,985,000, was 5 per cent larger than the collections in the corresponding period ending February 28, 1923. Ordinary receipts in· creased over both the previous month and February a year ago, while the total receipts for the eight months of the fiscal year 1924, amounting to $2,359,361,000, registered an increase of about 3! per cent over the corresponding period of last year. Expenditures chargeable to ordinary receipts declined both .as respects the previous month and a year ago, w~ile for the fiscal year thus far the expenditures, amountmg to $2,344,512,000, were about 1 per cent less than a year ago.
The per capita distribution of money held outside the Federal reserve system and the United Sta.tes Treasury increased 3 per cent in' February, amounting to $42.85 at the end of the month compared with $41.61 on February 28, 1923.

23
DEBITS TO INDIVIDUAL ACCOUNTS AT PRINCIPAL CLEARING-HOUSE ·CENTERS
GROUPED BY FEDERAL RESERVE DISTRiCTS lndex numbers relatioe to l9lfl monthly aoerage
DlllTRICT
UNITED STATEs, 141 clearing-bouse centers •• ~.
BOSTON<DISTRICT! · · . Total, 11 eenters.: ........... · ... ·.~----~---
Boston •••••••• ; .................... .. Hartford ............................ . Providence ......................... .. New Haven ......................... .
NEW YORK DlllTRICT: . . Totali 7 centers .......................... .
§~a.a~::::::::::::::::::::::::::::::: Rochester ....... ~ ......... .' ......... . New York ..................... ~ •• ; .. .
l'BILA.DEU'IDA. DISTRICT; Total, 10 centers ................... --~---·
Philadelphia ......................... . Scranton ••••••••••••••••••••••••.•••• Trenton ............................. .
CLEVELAND DISTRICT: Total, 13 centers .......................... .
Akron ................ ~---······---··-1 Cincinnati.. •••• ·················--·--i Cleveland ........................... .
fg~~~====~===~~~==~=====~==~== -Columbus •••••••••• : •••• : .......... .. Dayton .............................. .
RICHMOND DISTRICT! Total, 7 centers ............. ~ ....... ;: .... .
Baltimore ••••• .' ...... ~-- ••• ~ ••••••• -. Norfolk ....................... ;~ ..... . Richmond ........................... . Charleston .......................... .
ATLANTA DISTRICT: Total, 15 centers ........................ ..
Atlanta .............................. . Birmingham ........................ .. New Orleans ........................ . 18Cksonville ......................... . Nashville ............................ . Augusta ............................. .
I Revised.
1924.
February March
99.9
ll1.5 115.0 118.5 99.3
ll3.0
98.1 124.1 104.2 111.7 97.7
106.0 102.5 145.3 148.0
102.2 70.0
116.6 89.4
105.7 . 06.0
148.3 104.3' 126.0
. 90.11 84.0 78.5
107.8 67.6
102.2 104.9 174.6 112.5 118.7 72.0 75.7
108.8
121.4 125.8 133.7 104.1 132.0
106.3 134.4 111.4 126.7 105.0
114.9 112.2 143.4 144.2
110.7 77.8
128.4 95.8
.. 115.8 . 101.7
156.9 '117.2 142.0
. '97.4 95.8 79.7
·106.9 62.2
106.4 114.6 194.9 111.2 127.1 82.8 67.6
BANKING AND FINANCE
1923
.March
112.7
125.6 133.3 115.2 104.8 115.3
111.1 132.1 I 111.8
~~~:~ l 118.5 117.0 145.3 130.3
112.4 83.3
148.6 96.3
115.1 100.0 157.8 125.0 158.0
102.7 97.3 92.8
112.11' 83.8
106.9 119.5 179.7 104.6 125.0 82.6
110.0
February check transactions both in New York City and for the rest of the country as measured by bank debits and clearings declined from.January, but were larger than a year ago.
•'
BtLLS DISCOUNTED AND ToTAL INVESTMENTS OF FEDERAL
.. a: j
8
.l..t--" II·
,g 20
:s ., ~I
3 ~I .. 0
:3 .. a: Q
~ . z
8
2
8 .. 4
0
lLI t"'-
.... ..
RESERVE BANKS
'' \
~BILU Ct8COUNTEO
1\
' 1\.
\
1'\ -~J':rAL INVE8TM~NT8 I ,
8 ~ I
~ .. -- ,. "'
-~ --r-..
~ ... .. ..:. /' v -... ~ .
' '1-·•,
... ~ 8
11123
19U 19!1 DlllTRICT
February March March
OmcAGO DlllTRICT: Total, 21 centers •••••••••••••••••••••••••• 98.6 113.3 113.8
~~~~:::::::::::::::::::::::::::::: 92.2 108.7 10!1.11 126.3 139.4 130.3
Indianapolis •••••••••••••••••••••••••• 108.1 111.0 116.-l Milwaukee ••••••••.••.••••••••••••••• lll.O 116.4 117.8 Des Moines •••••••••••••••• · ••••••••••
1
79.5 94.0 116.7 Orand Rapids ........................ 77.3 89.3 02.0 Sioux City ............................ 117.4 134.9 136.5
ST. LOUIS DISTRICT: Total, 5 centers ........................... 101.7 110.1 115.2
Louisville ............................ , 102.6 107.7 106.4 St. Louis ............................. 98.6 10!1. 6 109.6 Memphis ............................. 94.9 05.6 129.4 Little Rock ........................... · 158.3 166.7 175.0
MINNEJ.l'OIJS DISTRICT: --Total, 9 centers ........................... 79.3 88.7 01.2
Duluth •••..••.••.••••••••••••••••••.• 60.0 64.4 68.11 Mlnn~olls ••••••..••••••••••••.••••• 79.4 89.3 86.7 St. Pa .............................. 90.1 103.1 111.7 Helena •••••••• : ••••••••.••••••••••••• 81.8 81.8 81.8 Billings ............................... 77.8 55.6 100.0
KANSAS .CITY DISTRICT: Total, 14 centers .......................... 76.2 99.3 97.4
· Denver ............................... 100.0 121.2 1UI.t Kansas City, Mo ..................... 70.7 73.1 86.11 Omaha ............................... 62.1 71.6 86.0 St. Joseph, Mo ....................... 65.9 70.6 78.8 Oklahoma City ....................... 115.6 9S.6 133.0 Tulsa ................................. 84.1 92.6 121.3
DALLAS DISTRICT: Total, 11 centers .......................... 94.8 94.6 105.0
Dallas ................................ 104.3 102.5 104.3 Houston .............................. 82.6 81.9 Sl.1 Fort Worth ........................... 69.6 69.6 121.7
SAN FRANCISCO DISTRICT: Total, 18 centers .......................... 129.4 139.4 138.2
Los Angeles .......................... 251.0 276.1 23S.G Portland, Oreg ....................... 84.5 90.6 82.0 San Francisco ........................ 107.1 111.5 1111.5 Seattle .......................... - •• --- 75.2 95.6 87.4 Oakland, Calif. ...................... 193.6 212.7 217.4
LOANS, DISCOUNTS, AND ToTAL INVESTMENTS OF FEDERAL
RESERVE MEMBER BANKS
ffiil btH+WH I~ I§ ! ,. ' . ~~ I : .1--l--l--1--+-J+-+-++,+ __ -t-_-__ t.,;:;-.f..;:;_j_::_:±:::r-_-::+t_:±_._=t_=l ~·J_~~--~·~~~·~~~~md~~~·~~~t--r-t~--t-i--t-1--~ 3 I -- --J-..;.., .. __ ... -- --i •
i. I I.
. I i . i ! 1 .... 111:24 i .... 1 .. 1,
· Bills discounted and total investments of Federal reserVe banks, although below a year ago, were 2 and 7 per cent, larger, respectiv~ly, at the end of February than on January 31. Note circulation, total reserves, total deposits, and the.reserve ratio declined in February but, except for note circulation, were larger than a year ago. Loans and discounts of member banks declined slightly in February, but were larger than a year ago, while investments made a slight increase and net demand deposits decreased from the previous

IGIL!!Ml~:lL:;l,,lilUJJIJI!j ])ill
!ffilillrdl 25 JllllE;Jr !00lill~ (IJ)W®lf ~ Y®~lf
y®IBklf,
loJrnw lBliD'i!illNlE:I!I!I TIN OlRIIDENi~ntlr lLITWllil liNill\DilR\AN©lEl~§ll 'Y'Lvmn".i>H''
NulllimrnB~ @!P lBl1t!r:JITNI!l®ill lF'LhliR,\DilRlllilr:l A~m AlllirDJ1!1N'lr (IJ)W JDill'JIFk1!1IUK'l!llll>
lLTit'JlilTIILTI'lrKJB!I

co c.:! COMPARISON.IOF WHOLESALE PRICES, c.:! .;.
PIG-IRON PRODUCTION, AND BANK CLEARINGS IN NEW YORK CITY SINCE 1840
I 266 61 230
I 240 48 220
226 46 210
210 . 42 200
C/) a: :5 196 39 190 ...I 0 0 c ... •so ~ 36 180 0 0 C/)
a: C/) 1- Ul. 5166~ 33 ~ 170 ...... C/) :::1 = z z m 160 Q 30 )( 180
I ;;! Ul c WHOLESALE PRICE --+
~ z
~--~----~----4-----+---~1.---~----c+------!-----1-------------~---+----~----~-----ffiH~~~~~~ w ~ 136 I 27 -160
I 0 z C/)
~ 120g Ul
24 g 140 0 0 a: )- :::1 II.
3106 c
21~ 130 0 Ul a: < z II. (/)
\ PIG IRON PRODUCTION --+ ~ n \
C/) z Ul
C) 90 0 18SI20 z !!: J: a: C) 3 < Ul 76li: 16 110 ...I 0
"' z 60 12 < m
46 9
80 ~ow,o• \ j , IW ~_.;LcP""' )IV BANK CLEARINGS-NEW YORK CITY___,./ ._,-o ....-.. 'I I Y'h"'
. . ~ ... 30 8
70 I I ~ ..411/ ,...~
l--JL~J_~~~~~~~~~~~~o~~~~~~~~~~=:t~~~bn-,~~~M>-.J:=-..!~~~---~n-.J~-.Jn..-.J 0 (] 60 1840 1846 1860 1866 1880 1666 1870 1876 1880 1886 1890 1896 1900 1906 1910 1916 1920 1926
3 16

Below is given a comparative summary ~f the loaning operations of the 12 Federal Intermediate Credit Banks since October, 1923.
LOANS AND Rf:OISCOUNTS OF THE FEDERAL lNTEn:l\1EDIATE CnEDIT BANKS 1 AT THE END oF MoNTH
~ ------ -.. 1923 1924
I
October November December lanulll'Y J February --
$32, 295,4251$28, 849, 239 Direct loans -------· $21, 257, 477 $27. 863, 360 $30, 577, 492 Rediscounts .•••••••. 6, 786,077 8,687,009 9,10f, 938 11, 139, 060 12, 560, 129
I There are 12 intermediate credit banks located in tbe same cities as tbe 12 Fed· eral Land Danks, as follows: Springfield, Dnltimore, Colombia, Louisville, New Orleans, St. Loui~, St. Paul, Omaha, Wichita, Houston, Berkeley, and Spokane.
26
Prices of industrial stocks in February averaged three-tenths of 1 per cent less than in January and 3 per cent less than a year ago, while prices of railroad stocks increased two-tenths of 1 per cent over January but were 7 per cent less than a year ago. Sales of stock on the New York Stock Exchange declined 26 per cent in February from the preceding month and 9 per cent from a year ago, while February bond sales declined 33 per cent from January and 6 per cent from a year ago. Prices of highest-grade rail bonds and industrial bonds declined 1 per cent in February, while second-grade rails and public utility bonds made a slight increase. The municipal bond yield increased in February to 4.36 per cent at the end of the month, as against 4.11 per cent a year ago.
GOLD AND SILVER
Domestic gold receipts at the mint increased in January both over the previous month and a· year ago. Imports of gold declined in February, but were more than four times as large as a year ago, while gold exports increased in February, being, however, less than one-half as large as a year ago. Silver production increased 4 per cent in February, while· both imports and exports of silver increased over both the previous month and a year ago. Prices of silver at New York and London increased in February.
FOREIGN EXCHANGE AND TRADE
Foreign exchange rates were in general widely divergent in their movements in February, advances being recorded in the exchange on England, Italy, Switzerland, Japan, Argentina, and Brazil ranging
from six-tenths of 1 per cent for Switzerland to 10 per cent for Brazil, and declines in the exchange on France, Belgium, India, Canada, and Chile, ranging from 1 per cent for India to almost 10 per cent for Belgium. The general index at 58 may be compared with 59 for January and 67 a year ago.
EXPORTS FROM THE UNITED STATES AND THE UNITED KINGDOM
400
A N '\ JIYI
I ~~" l\-f.UNfTED s'rATEI I 1'./ I
r \ l \ •' .. ' \ ' I\; )(\. /' I i' ,_ r- "'A
I 1-fl' .... v ~ " , ... --;. ,, UNITEO KINQDOM-I~t. I
I ..., 1113 A.VEAAOi
300
., ffi til
~ z 200
l:l 0 ~
!00
l . > ~ ... .. :> c ,
1821
Imports into the United States totaling $3.33,500,000 in February represent an increase of 13 per cent over January and 10 per cent over a year ago. Imports from Europe, North America, and Asia and Oceania increased correspondingly over the previous month and a year ago, while· merchandise imports from South America and Africa were less in February than in either the preceding month or a year ago. The total inward movement of merchandise during the eight-month period ended February, aggregating $2,333,619,000, was three-tenths of 1 per _cent larger than in the corresponding period ended February, '1923.· Exports of merchandise, including -reexports, declined 7 per cent in February, but were 19 per cent above a year ago. Exports to Europe, North America, Africa, and Asia and Oceania declined fro:m January, but, except for North ,America, were larger than a year ago, while exports to South America were larger in February than in either the previous month or a year ago. The total outward movement of merchandise during the eight-month period ended February, aggregating $2,983,239,000, was 12 per cent greater than the exports during the same period ended February, 1923.

27
COMMODITY STOCKS-. A.STUDY IN SEASONAL MOVEMENTS
In order to comprehend more clearly the trend of basic movements in commerce and industry, ·it is very often necessary to adjust statistical data to account for factors, among other things~ which are distinctly seasonal in their nature. This is especially true of commodity stocks.
That the business man may have a knowledge of the course of commodity stocks, and this after due compensation for seasonal conditions, the Department of Commerce here publishes the results of a study designed to show, by four major groups, the trend of stocks after-such adjustments have been made. This study was based upon· the statistics published in the February "Survey" (No. 30), pages 30 and 31. The adjustment for the seasonal tendencies, peculiar to each commodity, was first made according to the method outlined on page 24 of that number. This done, the combination of the several commodities into respective group totals was effected. Monthly stocks of brick, flooring, and zinc were estimated for the year 1919 for the purposes of this study, while no ad-
justment for seasonal conditions as respects zinc was necessary, stocks of this commodity moving free from seasonal conditions. In the table below arc given the indexes of seasonal tendencies for each commodity for which adjustment was made. The relative differences in the inventories of important commodities at different times of the year as computed from observations covering the five-year period 1919-1923 can be clearly seen from this table. On the following page are given the group total indexes since January, 1919, derived from these data, after the effect of seasonal conditions has been eliminated. For purposes of comparison the unadjusted group indexes are also shown. It is hoped that this study ~ill constitute a useful supplement to the index numbers of commodity stocks published in the February number and which have currently been carried forward, particularly since it is of as much importance to know the course of commodity stocks as to have knowledge of the way production, sales, shipments, and prices are trending to establish a better basis for business judgment.
COMMODITY STOCK8-INDEXES OF SEASONAL TENDENCIES -
RAW FOODSTUFFS I !lAW :MATERIAL FOR :MANUFACTURE
I -- -MONTH
Wheat I Com Sugar Oats Eggs Poul· Fish Apples Cotfee Cotton Cotton- Flax· Rosin Tur· Petro- Tin try seed seed pen tine leum
--------------------------January ........... 61.8 140.0 115.9 131.3 4.1 182.8 127.1 178.6 94.7 128.0 169.6 81.9 112.3 168.2 87.6 00.4 February---------- . 80.2 129.7 160.9 115.6 0.6 165.7 99.3 123.8 102.4 125.0 116.8 78.8 102.2 131.3 88.11 88.4 March ............. 132.5 111.7 184.9 105.1 17.1 134.2 69.5 72.5 111.6 110.9 67.0 79.0 89.9 89.6 111.9 109.6 _ApriL ............. 158.5 92.9 147.2 93.4 84.7 100.5 51.0 34.4 108.5 97.8 35.8 78.1 85.5 71.6 94.8 92.7
ti~!::::::::::::::: 153.1 57.6 . 93.6 80.4 154.1 76.7 - 60.3 10.9 98.4 84.7 19.6 82.8 85.0 61.2 97.6 . 105. 1 147.7 41:4 106.2 74.2 . 190.1 65.4 65.9 . 0.3 95.2 71.0 13.3 93.1 89.9 61.2 100.9 86-G
July·-·------------ 127.3 39.7 75.3 70.1 194.9 55.1 84.6 0.2 98.2 68.7 11.1 89.0 96.9 79.1 103.8 81.5 August ____________
117.5 58.0 44.3 89.1 184.6 48.1 103.3 0.6 96.8 55.8 22.5 85.1 100.0 83.6 104.3 93.5
September _________ 96.2 168.9 48.8 37.3 76.8 97.6 127.8 . I
104.5 105.7 85.2 90.3 93.4 56.3 122.7 99.6 ~~g I October __ --------- 55.7 138.2 67.0 116.6 116.3 58.7 142.0 194.1 97.1 126.6 205.4 156.2 110.4 106.8 165.2 November ••••.•••• 47.5 160.1 61.0 116.1 67.3 100.3 145.4 280.9 98.7 135.6 233.6 137.7 112.3/ 119.4 108.0 104.6 December--------- 38.0 147.1 88.3 111.5 27.5 163.8 139.4 266.4 98.6 129.3 007.9 110.6 120.1 I 132.8 109.81 107.2
MANUFACTURED FOODSTUFFS liANUFACTUilED COMMODITIES
MONTH Cotton· Floor- I Lumber Enamel Pig News-Meats Wheat Butter Cheese Rice Refined seed Cement Brick
flour oils oil ing I wo.re Iron print
---------------;;~I~ ------
~F~~~~~~~~~~~~~~~~~~~~~~~~~~~~~~ 106.5 106.8 60.4 73.7 149.0 92.9 162.6 116.5 106.5 86.8 9U 115.7 107.3 38.0 64.2 141.0 97.5 157.8 131.8 99.9 96.9, 95.2 115.2 91.8 117.11 118.5 101.0 19.1 . 38.9 123.3 100.5 139.7 133.1 101.2 97. 1 94.0 127.4 97.6 122.8 117.8 96.6 11.5 34.3 108.6 104.6 105.0 132.4 99.9. 93.7 92.3 126.8 103.3 112.3
w~~i~~~~ ~ ~ ~ ~ ~ ~~ ~ ~ ~ ~ ~ ~ ~ ~ ~ ~ ~ ~ ~ ~~ ~~ ~~~ 116.3 86.1 31.4 42.9 85.4 105.1 69.6 126.9 99.4! 92.0 91.9 117.0 104.1 104.0 119.1 77.2 120.6 96.0 63.1 104.8 40.4 112.9 100.3/ 96.3 98.1 106.5 106.1 98.1 112.6 82.5 184.7 143.7 43.2 102.8 18.5 95.9 100.1 I 101.4 100.8 05.8 108.4 97.0 98.7 97.1 199.6 167.7 39.2 98.5 12.9 76.2 100.7 I 103.7 104.6 89.0 100.6 100.9
~e~ttmber ___ •• ___ • __ • ___ •• __ • __ ••• ___ 79.5 105.3 186.5 163.; 49.6 96.6 M.O 60.3 98.71 103.9 103.9 78.8 96.6 9.\7 65.4 117.6 155.1 146.9 86.5 95.4 121.3 48.6 99.2 103.4 108.8 72.4 95.7 84.8
~~e:~!:::::::::::::::::::::::::::: 67.2. 116.8 114.5 127.7 144.1 98.5 161.0 67.2 100.. ' 1115.2 106.7 77.4 99.3 84.0 82.6 106.4 78.6 110.5 166.9 102.9 160.0 98.3 101.91 111.3 106.9 87.1 109.8 87.7

28
COURSE OF COMMODITY STOCKS, BY MAJOR GROUPS
YF.AR
19W ••••••••••••••••••••••••••••••••••••••••••• 11120 •••••••• ··- •••••••••••••••••••••• - ••••••••• 11121 •.•••..• ···--.- •• - .•••• -•..•.••• ·- •• -....•• 1922 ••••••••••••••••••••••••••••••••••••••.•••• ~~---······························-·--······
19111 •••••••••••••••••••••••.•••.•••••••.••••••• 11120 •••. - ••••••••••••••• -•••• -•••..•.• -•••••• -· 1021 •••••••••••••••••••••••••••••••. ·········-· 1022 ••••••••••••••••••.••....•••...•.••.•••••.• lll'l3 •••••• ···-·· ••••••••••••••.••••.••• --· .••.•
~~::zJI ;an. I Feb. I Mar. I Apr. I· May I June I July I Aug. I Sept. I Oet. I Nnv. I D".
I 100 I 98'
138' 126 I 118 1
I
103 99
124 131 121
100 1 125 97 101 174 1 121
192 I 191 142 165
103 96
134 131 116
120 91
147 195 157
100 91
141 131 117
99 73
164 206 161
SEASONAL VARIATIONS ELIMINATED
104 93
136 127 117
101 82
147 203 169
TOTAL INDEX
102 93
139 133 111
97 93
145 130 115
97 95
145 128 114
lU W FOODSTUFFS
89 85
164 233 143
86 86
171 220 146
96 95
148 119 125
~~I "1981 174 133
RAW MATERIALS FOR MANUFACTURE
1(}1 96
138 13'1 118
108 103 184 190 119
I 100 107 137 116 ns
94 135 212 150 113
100 106 132 119 122
99 114 205 163 122
97 109 131 117 125
87 104 209 163 141
11119........................................... 100 106 105 107 18191 II 110 I 100 100 85 85 95 98 II 98 1920........................................... 104 96 97 94 95 98 99 103 102 109 123 139 1021........................................... ISS 1M 166 171 1761 178 184 189 176 151 124 118 llO
l:L:::::::::::::::::: ::::::::::::::::::::::::\__~_::_,_ __ ~-~~--'----~~_7_c__~_g_~ -'-----1~____,1 __ 1~~--1-~_..!_ __ :.....!. __ ~_~_1.l.--~-r~_._ __ ~_;g_..!_ __ ~~_6...:1 __ l_U
1919 ••••• ··-·········· ••••••••• ••••••••••• ••••• 111::0 •• ·-- •• ·- •• ··- .•.•••••••• ·- •••••••••••••••• 1921 •••. - •• - ••• --··.-. •••••• .•• -.-- ·-----· .• ---11122 •••• -. --· -- ••••• ··-···.- •••••••• ------ ••••• 1923 •• ·-- •••••••••••• - •••.•• -.- ••••• ·-· ---.- -·-
1919 ••••••• ----- ······- ••. •••••••• •••• ·---····· 11120 •••••.••• ··- •••••••• - ·····.- •••••• ••••••••• 1921 •••••••••••••••••• -· ••••••••• - ••.••• ••••••• 1922 ••••••• ••••••••••··•• •••.•••• -•• ••••••••• •• 1923 •••••.•••• ········- ····--. ·--·· •.•...•..•••
1111!1 •••..••. ·······-················· ------··-· JU20 •• ·-· •• --·· •••• •••••••••• ··-·· ··-······ •• --1!121 •...•••••••.••.•.••......••..•.••.•.•.•...• 1u·•> 1m:::::::::::::::::::::::::::::::::::::::::::
100 95 79 72 80
98 113 78 66 70
93 114 80 68 71
90 115 82 63 76
MANUFACTURED FOODSTUFFS
94 113 80 58 76
100 99 81 66 79
88 95 81 75 88
93 85 7B 80 85
MANUFACTURED COMMODITIES
107 82 76 77 83
114 78 78 75 80
114 79 74 76 82
121 78 71 75 81
~~ I ~ ~ 1 1: I 1~~ i 1~~ 1
:: 1g~ ~~ i 1~ ~: ~n 1~:
118 138 135 I 130 ' 123 I 115 110 108 108 i 111 112 112 111 1361 141 U2 144 I 143 i 144 145 141 140 I 133 124 120 120
___ 129 ___ 1_24 ___ 12_1 / ····-t-17_;_/ __ 11_a__,_l __ t_1_7 .!.___1_2I..L.. __ I28...J. ___ 1_36_:__~ __ 1_40..L--1-4t..L..--14_7..L.--l-46
100 96
132 126 119
129 100 129 137 126
110 99
139 149 130
UNADJUSTED FOR THE SEASONAL ELEMENT
103 95
147 151 132
101 91
137 137 123
TOTAL INDEX
i 921 841
1261 124 104
I
90 1 85
136' 1261 103 !
RAW FOODSTUFFS
871
1~ I 101 I 105
I
94 89
121 111 114
107 109 136 120 127
110 I 114 132 121 I 1321
105 118 137 125 136
UH9___________________________________________ 100 140 129 109 104 85 83 75 s
77
1 I 95 103 105 89 1920 •••••••••••••••••••••..•.••.•.••••.••..••.• , 89 91 88 88 86 70 77 85 83 117 105 102 ~g~----·--···--·---------------------··-··-···J ~~ ~A ~ : m 144 176 137 128 139 178 171 :
1923::::::::::::::::::::::::::::::::: ::::::::::i--14-4-"----17-5-L--20_1 -'-----2-15RA~:.:W:-:-~7:-A:-':T::E::R::::::-LLS_F_O_i~_tg..1M_A_N_;_~J.A_C_T_:-:-· E_t_I __ ~_~_L __ ~~-o_L __ ~~-~.L--1-47
135 167 160 155 161
128 175 141 143 149
~~::~===~~=~=~=~~~~~~= ~:::: : = ::~::::::=: m ! ~~ I rn ~ I ,~1, 1~83;11 ~ ,~ ,g 1~ m 1
1
1923 ..•.•..•••••••••.•••.•••.....•.•..•.•..••.• 1
111 I 1231 101 os , 89 82 78 83 114 168
1----_L----~--~----~---L--__ L_ __ _L ____ L_ __ _L ____ L_ __ ~----~---
MANUFACTURED FOODSTUFFS
100 !I 99 : 87 86 91 100 j 101 113 ! u6
!~J~s~~s~~~~~j~~j;~~~~~~~~JI~-~r='~~Lr __ \~~..l... __ }_:~l __ 1_1_ . .l.-_~_~~~--r_i~ __ t_1 ~--~~~--~-~..L..--t_;~ __ l_!~f __ ~_,_!~--~-!
1919 •••••••••••••••• ···- .. - •.•.• - .•.•.•• -- ·-- .• 1920 •••••••.••••••••••••.•.•..••.••.••.••••••.• 1921 ••.•• ••••·•··•••·. -··- .. -.-- ...••....••••.• 1922 •.••.••••••••.••••..•••.•.•••.•..•••••••.•• 1923 ••••••.••.•••••••.••••.•••••.••.••.••••••••
100 9S
135 118 130
90 93
140 135 121
99 93
145 134 122
lOS 90
148 131 118
MANUFACTURED COMMODITIES
Wl 92
H4 124 114
107 92
141 114 116
103 91
140 110 122
99 89
136 107 129
95 t' 89
130. i 102JI 132
93 92
126 105 135
98 105 123 113 141
98 117 123 116 153
99 l'D 129 120 JM

ITBJL
29
MARCH DATA l'he follorDin11 tcble •ir>e• eueh March doto a• ha11e been receioed to and includtn11 .tpril 10, JIZI
l!U
February March
March 11128 ITBU:
. --1
1924
Febru· Dr )I
I March 1
Mar~h 111~3
----------------:---------~~-----------------1-- -·--- ..
TEXTILES Silk: , ~ r 1 nsump IOU •••••••••••••••• --------- ____ bales •• ! Stocks ••• ---- .•••• __ •••• __ ••••.• ____ •••• __ bales._
IRON .U,""D STEEL I Pig Iron, produetion ••.••.••••••• tbous. of long tons •• Steel Ingots, production ••••••••• thous. o! long wns •• Unfilled orders, U.s. Steel ~rp., .
end of month •••.•••••••••••••• thous. o! long U>ns •• Wholesale frlee, composite fin-
Ished stee ······-----------·-----dllils. per 100 lbs •• Wholesale price: I
Composite pig iron .•••••••••••••• dolls. per ton •• Iron and steel. ••.••••••••••••...• dolls. per U>n •• Composite steeL •••••••••••••• dolls. per 100 lbs ••
Locomotives: Shipments-
Total •••••••• __ • ___ ••••••• _ •••••••• number. ·I Do~estlc •••• __ •••••••••••••••••••. number ••. Fore1gn •••••••••..••••••• : ..••••••• number ··j
Unt!J!~tJ~~~~::-: •••••.••••••••..••••••• numbcr •• Domestic •• ------··------- •••••••.. number ··1
F . Foreign •••••••••••••••••••..••••••• number •• re1ght cars, orders, domestic •••••••••••••. number ..
NONFERROUS li:ETAIS ~= '
Re!Jeipts at St. Louls •••..••••••••• thous. of lbs .. j Shipments from St. Louis •..•••••• thous. of lbs ••
1 Lead: 1 Receipts at St. Louls ••.•••..•••••• thous. of lbs ••
1
' Shipments from St. Louis ••••••••• thous. o!lbs ••
BUILDING AND CONSTRUCTION I Contracts awarded, lloor space (27 States): ,
Business huildings •.•........•.• thous. of sq. rt..i ~dustrial buildings •••••••.•••.• thous. o! sq. ft •• l E~ide~tial b~dl~gs ............ thous. of sq. CL
0 ucat10nal bulldmgs ........... thous. of sq. ft ••
ther Jlublic and semipublic G bull ings .••..•••••••••••.••••. thous. of sq. ft..
C rand total. ••••••••••••.••••••• thous of sq. ft..
on tracts awarded, value (27 States): fn~ines~ buil!fl~gs ............... thous. or dolls ••
ustr1al buildings ••••••••••••• thous. of dolls •• ~~side~tial bu~di~gs •••••••••••• thous. or dolls •• I 0 h
ucatlonal buildmgs ••••.•••••• thous. of dolls •• t er public and semipublic
G bulldings •••••••••••••••••.•••• thous. of dolls ••
C rand totaL •••••••..•••••••.•.• thous. of dolls •• !
onstructlon relative to 1918, Engineering New& Record:
Volume ••••.• -------- -·-·-------·Index number ••
N Chost (l~t ortollowing month)._ .• index number ••
ort ern pme: I Lumber-Production •••••••••.••••••••.•.• M ft. b. m ••
Lat:~pments •••••••••••••••••••••• M ft. b. m ••
Production •••••••••••••.•••••••• M ft. b. m ••
C Shipments •••••••••••••••••••••• M ft. b. m ••
omposlte lumber prices (1st or following month)~ardwoods .••••••••••••••• dolls. perM ft. b. m .•
oftwoods ••••..••••••••••• dolls. perM ft. b. m •• I
C&HENT I r~~duction. __________________________ tbous. or bbls •• l St 1P~ents •••••••••••••••••••.••••••• tbous. of bbls ••
c:creie"i>iiviiii:contracts"awarded:·thous. of bhls •• ~ott·----············-------thous. of sq. yds ••
oa ---·······-···--~---·····thous. or sq. yds ••
FOODSTUFFS
GCroalrn grlndlngs ...................... thous. of bush ••
nmovement: Receipts-
~heat ...................... tbous. of bush •• 0 orn •••••••••••••••••••••••• thous. or bush ••
Ship~!~iS..::··-············-----thous. of bush ••
~heat •• ------··-·-·-····--·thous. of bush •• Vlsibl~~uppiy::-----··----------thous. or bush ••
~·heat. ••••••••••••••••••••• thous. of bush .•
0 orn •••••••••••••••••••••••• thous. of bush ••
.Areentlneai:atn:··-············------thous. of bush .• Visible supply-
~-hcat ••••••••••.•••••••••.• thous. of bush •• Ffrn •.••••••••.••...•••••••. thous. o! bush •• 1
axseed. __ ------------·----thous. or bush •• ·
29,804 40,226
3,0i5 3, 781
4,913
2.78
24.13 43.45 3.03
!19 112
7
499 466 33
41,346
22,834 19,168
11,301 7, 688
7,961 3, 787
28,037 4,838
3,152 48,036
40,550 17,007
129,795 26,735
19,825 259,264
128 225
36,347 46,406
8,899 12,105
45.30 32.36
8,588 5,933
16,815
4,562 3,421
7,152
19,803 43,442 18,778
10,616 21,213
194,500 20,534 17,741
9,~ 5,200
26,543 33,515 30,375 39,436
3,436 3,521 4,146 4,047
4, 783 7,403
2.73 2. 72
23.83 30.30 43.24 45.04 3.00 2.83
132 28:1 128 269
4 13
534 2,311\ 494 2,214 40 102
13,145 42,500
26,322 35,366 27,480 22,506
15,184 14,828 9,125 7,939
10,000 9,8M 4,2'.!5 7,673
44,389 39,286 4, 615 4,092
4,893 3,981 68,425 64,920
.58,600 44,076 19,437 37,034
206,089 164,267 29,567 22, 5liO
34,859 22,797 386,483 323,518
134 195 220 214
36,638 38,714 49,905 52,720
8, 905 10,607 12,968 17,241
44.40 50.19 32.52 39.96
10,370 9,880 8,995 10,326
18,190 13,045
8,009 5,684 s, 798 3, 737
7,835 5,946
17,617 21,746 29,876 26,222 16,356 18,568
11,661 13,621 16,832 16,090
184,363 128,085 27,314 31,266 16,115 24,044
10,730 7,400 1,400 1,200 6.400 4,000
FOOD8TOFF8-<lOntlnued Rice:
Receipts at mUis ••••••••••••••••• thous. of bbls Shipments from mllls .••••••••••.•• thous. of lbs:: Stocks, domestlc .................. thous. or lbs ..
Sugar, raw: ~~ngs •••••••••.•••••.••..•••••••• Jon11: tons ••
sat rellnerles •.•...•••••.•••••• Jonc tons •• Sugar, Cuban movement:
Receipts, Cuban ports ................ loDI: tons •• :tx~rts ••••••••••••.•...•.••••••••••• long tons ••
oc s, end of month ................ Jong tons ••
CBEli:ICAL.q ~ND DRUGS
Wholesale prices: Drugs and rarmaceutlcals .•••• .lndex number • Essential o ••••••••••••••.•••• .Index number:. Crude drugs ••.••••••••.•••••••• .lndex numb~r ••
TRANSPORTATION
Index of ocean rates, .Atlantic ports to: United Kingdom •••••• weighted Index number •• .All Europe ............ weighted Index number ••
Freight-car movement: Car loadings (weekly average)-
Total •••••••••••••••••••••••••• _ ••••••• ears .• Grain and graln products •••••••••••••• cars ••
~~v::~~::::::::::::::::::::::::::::::~~:: ' ~orest products ....... ----· ••••••. __ •.• cars ••
re •••••.••••••••••••••• __ •.••••••..••• cars •• Merchandise and mlscellaneous •••••••• cars .•
DISTRIBUTION
Mail-order houses, total sales ••••.••• thous. of dolls •. Sears, Roebuck & Co •••••••••••• thous. of dolls .• Montgomery Ward & Co ..•••••• thous. of dolls ••
Ten-cent stores, total sales ••••.•••••• tbous. of dolls •• }', W. Woolworth Co ••.••••••••• tbouo. of dolls •• s. S. Kresge Co .••••••••••••••••• thous. of dolls .• S. H. Kress Co •••..•••.••••••••• thous. of dolls •• McCrory Stores Corp •..•.•••••• thous. or dolls ••
lmports ••••••••••••••••••••••••• thous. of dolls •• Exports •••••••••••.••••••••••••• thous. of dolls ••
I U. S. foreign trade:
, PRICE INDEX NOloiHERS
Dun's (1st or following mo.) ••••••••• price index no •• Brasdtreet's (1st o! following mo.) ••• price index no ••
WBOLES~LE PRICES
Te:tilt1 Wool:
Worsted yarn •••••••••••••••••••••• dolls. per lb •• Wool dress goods •••••••••••••••••• dolls. per yd •• Men's sultings •••••••••••••••••••• dolls. per yd ••
Cotton: Raw, N. Y •••••••••••••••••••••••• dolls. per lb .• Yarn •••••••••••••••••••••••••••••• dolls. per lb •• Print cloth ••.••••••••••••••••••••• dolls. per yd •• Sheeting •••••••••••••.••••••••••• dolls. per yd ••
Raw, Japanese, N. Y •••••••••••••• dolls. per lb ••
I Silk: -..
Metalt . Pig Iron: · Foundry No.2, northern .••• dolls. per long ton ••
Basic Valles, rurnace ••••.••• dolls. per long ton •• Steel billets, Bessemcr ••••.•••••• dolls. per long ton •• Structural steel beams •.•••.••..••. dolls. per 100 lbs .• Copper, electrolytic •••••••••••••••••••• dolls. per lb •• Zinc, slab, prime Western ••••••••••••• dolls. per lb .• Tin, pig. ---·-··--------··-···--···-··-dolls. per lb •• Lead, desilverized .••••••••.•••••••••.• dolls. per lb ••
I Fuel Coal:
Bituminous, Kanawha, f. o. b. CincinnatL •••••••••••••• dolls. per short ton ..
.Anthracite, chestnut •••.•••• dolls. per long ton .. Coke, Connellsville ••••••.•••••• dolls. per short ton •. Petroleum, Kansas·Oklahoma .••••••• ilolls. per bt>L
Rubber
Para, N. Y ··-·-·------·---··--····-·-·dolls. per lh ..
Lumbtr
Southern pine flooring, " B " and better •••••••••••••••••• dolls. per l\1 ft. b. m. _
Douglas fir, No.1 common .... dolls. per~~ rt. b. m ..
Brick Common red, N. Y •••••.•••••••••• dolls. per thous ••
{Jb(J !170 ~2. 655 bi,HiO
168;037 118, 197
426,927 (55, 001 131,61>~ 237, lUI
136.~ 1121,n1 52i, 741 5()f,l!lll 43i, U~>ll 000, :IIlli
1:.3 155 131 139 1~[) 180
29.9 29.6 25.1 24.8
90S,4M 916,840 49, 129 41,252 32,931 30,600
189,991 164,944 79,698 81,182 9,466 II,G72
534,305 57:!, 70:!
30,468 31,<150 17,878 17,381 12, &"JO 14,069 23,i0G 27,344 13,431 15,903 6,019 6,875 2,3« 2, 731 1,612 l,tsar,
333,ro<l . 319,000 36G,1~
1M; 140
1.700 1-~ 3. GOO
.319
.522
.Oil
.125
e.sw
2i. 76 22.00 40.00
2:~2& I .071 .529
.090 I
3.G4 I 11.47 : 4.19 1
1.513. I
·"' i 44.54 I 19.50
20.00 l
341,000
154 137
1.1lW 1.035 :!.6!JO
• Zb!' . 4K:l ,(J(i(j
.121
G. 22:1
24. iO 21.114 40.00 2.!10 .137 .oou . [J.'i1 • 0\13
3.39 I 11.4~
I 4.18 1.67
.171 l I
43.1111 18.!10
20.00
311e ~.us
174, 31rl
610,&>3 2M,WO
861,738 647,00H M3,&~2
133 128 2~
23.1 21.9
916,4~2 41,008 31,145
185,414 74,UW 1a,aan
5!Jr,,2GJ
32,730 Ill, 775 12, ~7~, 27,1~~ 1.~. j)o,()
G. vr.o 2, G!ill I, 772
397, ~28 341,377
1W 151
1.750 1.035 3.MO
.307
.!m
.0!>2
. 12!1
8. G24
32.27 30.13 44.38 2.20 .169 .0!12 .4bY .08~
4.89 10. r,3
7. 31 1.8W
• 290
52.95 2l.W
20.00

30
MARCH DATA-Continued
ITEK ITEM i ..... : .. ·,.~., -::~~II ary ____ II_·-------·--
---------------------------~-----WHOLESALE PRICES-cOntinued
Portla!ld cement
Chicago district. ---------------------dolls. per bbl.. Lehigh Vlll!ey mills.-----------------dolls. per bbL
Leather
Green salted peeker's heavy native steers •• -----------------------·------dolls. per }b ••
Caltskin, country No. !. ..........•.... dolls. per b •• Sole, oak, scoured backs, Boston ••••••• dolls. per lb •• Chrome calf, "ll" grade, Boston ••• dolls. per sq. ft ••
Boo~:~~ t~~ calf blucber ••••••••• dolls. per pair-Men's dress welt, tan calf1 St. L ••. dolls. per pair •• Women's black kid Gooayear, St. Louls •• ____________________ dolls. per pelt ••
Sulphuric acid, oo• N. Y ---------.-dolls. per 100lbs ••
Foolhlv.J!a
Cottonseed oil, New York ••••••••••••• dolls. per lb •• Wheat:
No. 1 northern, Chicago •••.••••••. dolls. per bu •• No. 2 red winter, Chieago ••••••••• dolls. per bu •• Flour, standard patents,
Minneapolls ••••••••••..•••••••• dolls. per bbl.. Flour, winter straights, Kansas
·other ~~)n.;;·------------------------dolls. per bbl..
Corn, contract grades No. 2, Ch1cago ••••••••••••••••••••.•••• dolls. per bu ••
Oats, contract grades, Chicago •.•• dolls. per bu •• Darley, fair to good malting,
Chlcago ••••••••••••••••••••••••• dolls. per bu •• Rye, No.2, Chlcago .••••••••••••• dolls. per bu ••
Cattle and beef: Cattle, corn fed ••••••••••••••• dolls. per 100 lbs •• Beef, fresh native steors ••••.•• dolls. per 100 lbs •• Beef, steer rounds No. 2 ••••.•• dolls. per 100 lbs ••
Bogs and pork: Pork, smoked hams, Chicago •• dolls. per 100 lbs •• Bogs, heavy, Chleago •....•••• doils. per 100 lbs ••
Sheep and mutton: Sheep, ewes, Chlcago ••••.•.••• dolls. per 100 lbs •• Sheep, lambs, Chicago •••••••• dolls. per 100 lbs ••
Sugar: Wholesale, 96" centrl!ugal, N. Y .••• dolls. per lb •• ReftDed, N. Y ..................... dolls. per lb ••
Tobacco
Burley, good lear, dark red, Loulsville ....................... dolls. per 100 lbs ••
1. 75 1. 75
.108 ,182 .440 .440
6.25 4.85
3.85 • 73
.101
1.174 1.127
6. 306
6.350
• 797 .493
.740
.720
9. 706 17.00 14.50
18.40 7.075
8.425 14.550
.072
.088
28.00
1 No quotation.
1. 75 1. 75
.139
.188
.460
.460
6.25 4.85
3.85 .70
.098
1.165 1.088
6.300
5.330
• 796 .481
• 753 .685
10.065 17.00 16.00
18.90 7.345
9.975 15.775
• 069 .085
28.00
1. 75 1.90
.193
.165
.540 (I)
6.50 4.85
4.25 • 70
.118
1. 216 1.321
6.625
6.600
• 740 .462
.663
.827
9.263 14.50 14.50
20.60 8.163
7.150 14.250
.073
.086
27.50
PUBLIC FINANCE
U.S. interest-bearing debt .•••••••••• mills. of dolls •• Gross debt. •• ·------------------·-··-mills. or dolls •• Customs receipts •••••••••••••••••••• thous. of dolls •• Ordinary receipts •••••••••••••••••••• thous. of dolls •• Total expenditures chargeable against
ordinary receipts ••••••••••••••...• thous. of dolls ••
BANKING AND FINANCE
Bank clearings: New York CltY-----···--·-----·-mills. of dolls •• Outside New York City ---·------mills. of dolls ••
Federal reserve banks: Totalinvestments ••••••••••••.••• mllls. of dolls •• Bills discounted ••••••••••••••.•.• mills. of dolls •• Notes In circulatlon •••••••••••••. mllls. of dolls ••
·Total reserves ••••••••••••••• _____ mills. of dolls •• Total deposits •••••••••••••••••••. mills. or dolls .• Reserve ratlo •••••••••••••••..••••••••• per cent ••
Member banks: . Total loans and discounts •..••.•• mills. of dolls .. Total investments ••.•••••.••••••• mills. of dolls •• Net demand deposits ••••••••••••• mills. or dolls ••
Interest rates: New York cllllloans •••••••••••.••.•••• per cent ••
Business fllllures: Firms ••• ---------------------·------- •• number __ Liabilltles ••••••••••••••••••••••• thous. of dolls ..
Stock sales •••• ---------------------thous. of shares •• Stock prices:
25 lndustrials •••.•.••••..••••••• dolls. per share •• 25 railroads ••••••••••••••••••••• dolls. per share ••
Silver: Price at New York •••••••••••• dolls. per fine oz •. Price at London ••••••.•. pence per standard oz .•
Europe: FOREIGN EXC1UNGE
England ••••••••••••••••••• dolls. ptlr £sterling •• France ••••••••••••••••.•••••••• dolls. per franc .. Italy -----------------------------dolls. per lira •• Belgium ________________________ dolls. per franc ••
I Netherlands ••.••••••••••••••• dolls. per guilder •• Sweden •••••••••••••••••••••••• dolls. per krona ••
Asla~witzerland. ------·-·······----dolls. per franc ..
I Japan •••• ·-----·-··----------·---dolls. per yen •• It!ala ••••••••••••••••••••••••••• dolls. per rupee ••
America: Canada •••••••..•••••••••••• dolls. per Can. doll .. Argentina •.•••••••••••••••• dolls. per gold peso •• Brazil.. ••••••.••••• ___________ dollS. per milreis •• Chile. --------------------dolls. per paper peso •.
General index of foreign exchange •••• Index number •.
• Preliminary.
192!
February
21,520 I 21,782 50,207
206,607
208,432
18,120 14,713
419 532
2,022 3,230 1,986 80.6
11,874 4,496
11, 165
4.50
1, 730 35,942 20,637
111.83 60.47
.644 33.565
4. 31 • ()t4 .044 .038 .374 .262 .174
.454
.303
.969 • 765 .120 .101
08
March
21,356 21,624 51,459
646,389
291,026
19,650 16, 118
460 482
1,983 3,223 2,007 80.8
12,065 4,515
11,171
4.00
1,817 97,651 18,206
109.82 61.09
.642 33.483
4.29 .047 .043 .039 .371 .263 .173
,429 .299
.970 • 756 .115 .098
58
March 1923
22,390 22,723
' 62,172 641,082
341,935
19,768 16,361
504 700
2,232 3,176 1,976 75.5
11,783 4, 714
11,082
5.23
1, 682 48,393 25,855
116.03 65.06
.676 32.310
4. 70 .063 .049 .055 .395 .266 .186
.485
.316
• 981 .841 .111 .127
67
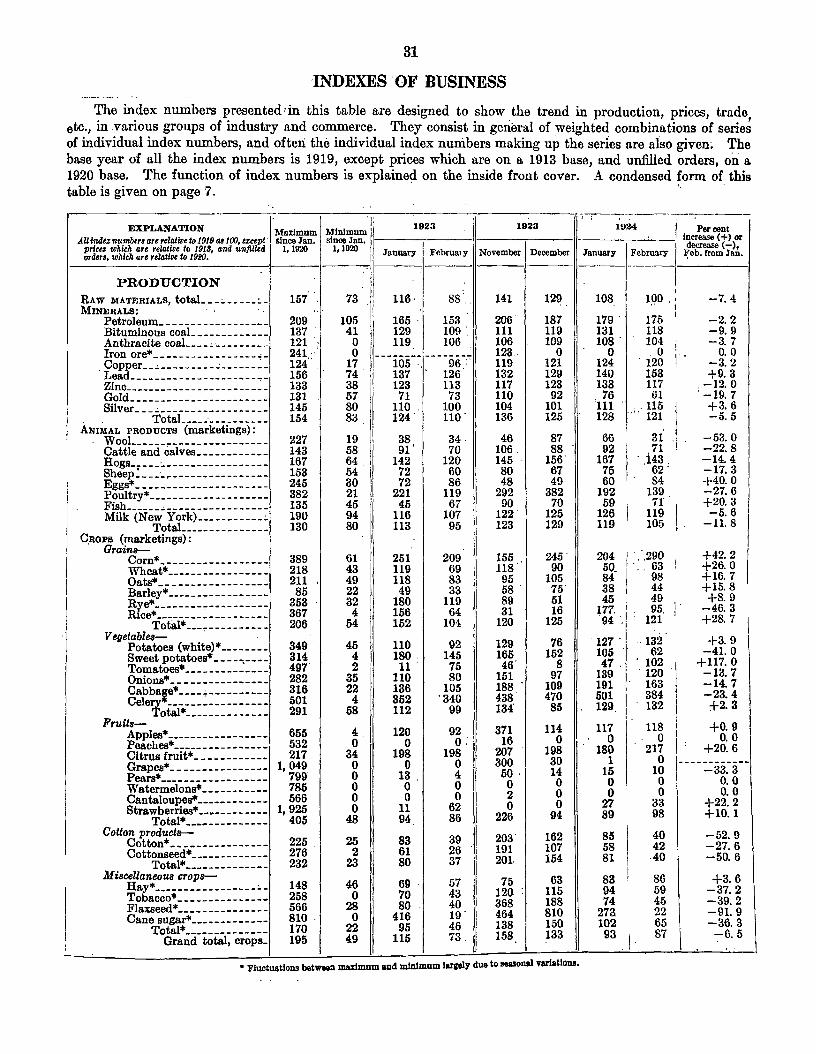
31
INDEXES . OF BUSINESS
The index numbers presented,in this table are designed to show the trend in production, prices, trade . , etc., in various groups of industry and commerce. They consist in general of weighted combinations of.series of individual index numbers, and often: the individual index numbers making up the series are also given~ The base year of all the index numbers is 1919, except prices which are on a 1913 base, and un1illed orders, oii a 1920 base. The function of index numbers is explained on the inside front cover. A condensed form of this table is given on page 7.
·-----------·----:-------,------:----,-·-----,--------·---,--;-, -,,--·-·--·------Minimum. r 1923 1923 19:W I Per cent EXPLANATION Maximum
AU fnde:z: number~ arHelative to 1919118100, e:z:cep! · since Jan. prieta which are relative to 1918, and unfilled 1, 1920
since Jan. /1---..----11----,,.----·11----,--'---; Increase(+) or 9 decrCIISe (-), 1•1 20 January Februa•y November December January February }_'eb. rrom Jan. ordera, which are relative to 1920. !
1------~---I---I------:-.
11---I---II---J---11----- -·--·
PRODUCTION . II R S t t 1 157. . 73 ! 116 . 88 .. AW MATERIAL, o a ___ :, _____ :._ .II MINERALS: . "·
Petroleum------------------ 209 105 1 165 · 153. Bituminous coaL____________ 137 ·, 41 j 129 109 . Anthracite coaL---~·--------- 121 ': 10~ ~· ___ 1i
019
5_. ~ ____ 1
9
°_
6
6 __ :_·. Iron ore*-----------------•- 241 .. c . 124" · opper __ .;. _________ .;________ 156 74 ·
1 137 '· 126 ·
Lead---------------------..,- 38 1
123 113 Zinc________________________ 133
Silver---~------------------ 145 80 110 100 Gold_______________________ 131 57 I 71 73
. . TotaL---·---------- 154 83 , 124 110 · j ANIMAL PRODUCTS (marketings):
VVool------~---------------- 227 Cattle and calves____________ 143 Ilogs-----~----------------- 167 Sheep: ___ ·-~---------------- 153
I Eggs*_--------------------- 245 Poultry*-------------------- 382
I
[ Fish------"------------------ 135 Milk (New York) ___________ ;. 190 TotaL_____________ 130
C.ROPB (marketings): 1
Grain8- j Corn*------------------
1 VVheat*-----------------1 Oats*_-----------------
Barley*-----------------ltye*--------~---------Rice* -------------------
Total*--------------Vegetable8- · ·
Potatoes (white)*-------Sweet potatoes*---------Tomatoes*----- ____ _: ___ _ Onions*----------------Cabbage*----~----------
I Celery*-----------------
Total* --------------Fruits-
Apples*-----------------Peaches*----------------Citrus fruit* ___ ---------Grapes* __ --------------Pears*------------------VVatermelons* ----------Cantaloupes*-----------Strawberries*------------
1
Total*--------------Couocc!tt~~t;~~-= ___________ _
Cottonseed*------------Total*--------------
Miscellaneous crops-
1
Ilay*-----------------~Tobacco*--------------Flaxseed*---------------
1 Cane sugar* ____________ _
I To~~:nCi-iOt8t~-c~oi>8:
389 218 211 85
353 367 206
349 314 497 282 316 501 291
655 532 217
1, 049 799' 785 566
1,925 405
225 . 276 232
148 258 566 810 . 170 195
19 58 64 54 I 30 I 21
45 I 94 80
61 43 49 22 32 4
54
45 4 2
35 22 4
58
4. 0
34 0 0 0 0 0
48
25 2
23
46 0
28 0
22 49
38 91'
142 72 72
221 45
116 113
251 119 118 49
180 156 152
110 180 . 11'
110 136 352 112
120 0
198 0
13 . 0 0
11 94
83 61 80
69 70 80
416 95
115
34 70
120 60 86
119 67
107 95
209 69 83 33
119 64
104
92 145 75 80
105 '340
99
92 o:
198 0 4 0 0
62 86
39 26 1 37
57 43 40 19 46 73.
141 129
206' 187 111 119 106 109 123 . 0 119 121 132 129 117 123 110 92 104 101 136 125
46 87 106. 88 145 156.
80 67' 48 49
292 382 90 70
122' 125 123 129
155 245-118 90 95 105 58. 75 89 51 31 16
120 125
129 76 165 152 46' 8
151 97 188 109 438' 470 134 85
371 114 16 0
207 198 300 30 50. 14 0 0 2 0 0 0
226 94
203 162 191 107 201 154
75 63 120 115 368 188 464 810 138 150 158 133
• Fluctuations between maximum and minimum lareel:Y due to seasonal variatious.
108
179. 131 108.
0 124 140 133 76
1
111 128
66 92
167 75 60
192 59
126 119
' I
I
100 , I •. j
175 I
118 104 !
· 128 I 153 117
61
.... 121 .. 115 l'
I . ~~ ·:
- .i43. - 62 . 84
139 n· I ~~~ [.
204 .. 290 50. . : :. 63 ! 84 98 38 44 45 . 49
~11. 1 95. 1· 94 ·.f 121.
. 127 ·I .. 132 105 .... 62 47 . 102
139 . 120 191 I 163 501 384
I I
1
-7.4
-2.2 -9.9 -3.7
0. 0 -3.2 +9.3
'-12. 0 -19.7 +3.6 -5.5
-53.0 -22.8 -14.4 -17.3 +40. 0 -27.6 +20. 3 -5.6
-11.8
+42. 2 +26. 0 +16. 7 +15. 8 +8.9
-46.3 +28. 1 I +3.9
-41.0 +117. 0 -13.7 -14.7 -23.4 +2.3
129 II·. 132 117 118
0 0 i +0.9
I +2g:g 18~ I 21b 15 10 0 0 0 0
27 33 89 98
85 I 58 81
83 94 74
40 42
.40
86 59 45
j------------1 -33.3 . 0.0 ' 0. 0
+22.2 +10.1
-52.9 -27.6 -50.6
+3.6 -37.2 -39.2
273. 102
93 .I· ~~ II 87
-91.9 -36.3 -6.5

32
INDEXES OF BUSINESS-Continued.
EXPLANATION 1923 1923 1924 Percent Mulmum Minimum 11---......----11·------,.----·11----.----J increase<+> or Alllnda numbm a:!relatwe to 1919 cu 100, uccpt since J'an. since J'an. decrease(-),
prlcu whlcla are relatiDe to 191~, and unfilled 1 l""" 1 1020 J'anu•- February November December J'anuary February Feb. from len. ardm, whicla are relatiDt to 1920. • ~•u • -•
PRODUCTION-Continued FOREST PRODUCTS:
Lutnber---------------------Pulpwood _____ ---------------Gutn (rosin and turpentine) ___ _ Distilled wood .• :.-------------
Total ____ -----------MANUPACTUBINO:
Foodstuffs-Meats ___________________ _
Wheat flour---------------Sugar ___________________ _
Ice creaiD-----------------Butter ----- ___ ------- ____ _ Cheese-------------------Condensed IDilk __ ,:. _______ _ Glucose and starch---------Oleomargarine ____________ _ JUce.--------------------Total ____ -- ______ - __
T e:ttile.-Cotton (consUmJ?tion) _____ _ Wool (consumption) ______ _
Total ____ . __________ _
I ron !'~ steel- . ~gtton------------------Steel ingots--------------Locomotives. __ -----------Total ______________ _
Lumber-Lumber------------------F1ooring _________________ _
Total ______________ _
Leather-Sole leather--------------Boots and shoes._---------
TotaL ___ ----------_
Paper and.j~:f~~----------Chemicals, etc.-Coke ____________________ _
Petroleum products _______ _ Cottonseed oil*-----------Turpentine and rosin*------Wood distillation _________ _ Total ______________ _
Stone, clay, and glass-Brick ____________________ _
Cetnent*------------------Total ______ ----- ___ _
Metals, excepting iron and steelCopper smelting and refin-ing ___________________ _
Zinc smelting and refining., Enatnel ware ______________ , Lead---------------------1 TotaL ____________ -I
Tobacco- : Manufactured tobacco and
1 snuff-------------------· Cigars ____________________ ,
Cigarettes.------------- -- 1 TotaL •• ----------- 1 M iacellaneouB- i
Shipbuilding ___ ----------- 1
Automobiles. __ -----------; Rubber tires--------------! Prepared roofing ___________
1 TotaL ___ -----------: Grand total, 65 cotnmodities. _ .
1
ELJ:CTBICAL POWEB--------------' BUILDING CONSTRUCTION (total)*--~
133 135 267 151 135
132 126 178 260 207 169 122 135 122 233 116
127 138 130
152 149 150 147
135 232 150
95 130 115
121
140 163 188 269 118 157
124 200 126
126 130 275 156 176
119 128 147 125
79 239 221 163 145 133
153 139
59 51 20 24 61
75 64 40 41 64 41 20 38 29 35 77
60 42 54
34 33 9
32
59 51 57
63 82 63
69
40 96 4
21 21 92
53 61 69
23 38 86 79 71
50 75 64 70
2 29 20 58 37 68
98 so
108 98 98
151 107
128 91 77 49
104 54 63
102 66
166 103
124 138 129
127 136 103 133
108 207 125
88 111 102
111
124 155 122 102 118 142
111 115 100
84 121 212 137 148
105 95
121 107
4 148 159 92 96
115
147 83
98 91 64
123 96
107 85
105 46 97 55 62 99 61 92 92
115 126 119
118 123 93
121
98 178 112
77 110
97 I 100
117 140 84 67 96
124
94 121 96
r
76 I 111 I 190 126 134
92 86
104 94
6 168 159 94
104 108
133 89
119 90
185 116 119
128 104 89
165 '100 '100
I 60 103 73
202 1109
108 109 108 .
114 111 134 ll3
119 211 136
73 98 88
105
110 162 152 107 100· 147
78 188
t 109
98 116 228 132 157
95 91
147 113
2 190 107 124 99
t 112
149 111
100 102 201 98
103
132 97 61
I 55 1}02
I 86 I 62 105 62
134 1106
94 99 95
115 101 148 106
100 187 115
69 82 77
103
110 168 108 204 82
150
67 149 t 94
99
122 I 223 129 156
74 83
100 88
11 184 115 98
101 '104
153 102
1 Eatlmated. • Fluctuations between muimum and minimum largely due to seasonal variations.
1 Partly estimated. 1 J'anuary, 1020; no other ligures for 1020 anUabla
108 121 94
114 108
137 99 70
1 56 I 105
1 90 1 68 125 72
181 t 111
117 117 117
119 128 68
124
108 200 124
73 96 87
112
115 168 102 96 93
144
79 131 101
100 130 239 140 166
108 86
141 111
3 192 115 115 101
t 114
160 107
117 I 105
87 106
2 115
118 93
131 1 55
I 108 195 1 65 132 171 152
t 105
103 110 106
121 135 44
128
117 193 131
65 96 84
102
114 159 84 88 88
135
. 87 128 ~04
102 115 247 153 167
100 85
110 97
1 223 155 140 123
1117
150 103
+8.3 -13.2 -7.4 -7.0 +6.5
-13.9 -6.1
+87.1 -1.8 +2.9 +5.6 -4.4 +5.6 -1.4
-16.0 -5.4
-12.0 -6.0 -9.4
+1. 7 +5.5
-35.3 +3.2
+8.3 -3.5 +5.6
-11.0 0.0
-3.4
-8.9
-0.9 -5.4
-17.6 -8.3 +5.4 -6.3
+10.1 -2.3 +3.0
+2.0 -11.5 +3.3 +9.3 +0.6
-7.4 -1.2
-22.0 -12.6
-66.7 +16.1 +34. 8 +21. 7
+tot. s +2.6
-6.2 -3.7

33
INDEX OF BUSINESS-Continued
EXPLANATION I . I I I Per ccn~--. . : Maximum Minimum : 1923 1!123 1024 Alla~dex nu.mber~ are rel!Jtwe to 1919 as100, except i since Jan. since Jan.
I ''""""-~I Fobmm'
--·--·--- ----- Increase <t> or pnces which are relatwe to 1913, and unfilled 1 1920 1 1920
November I ~ccci~l~r decrease -), orders, which are relative to 1920. . ' 1 ' Jnnunry February Feb. from Jnn.
! !
STOCKS 1 1 ------ ---------
TotaL __________________________ 1 152 .t 84 126 130 132 136 132 140 +6.1 Raw foodstuffs ________________ ! 282 70 175 201 133 147 149 186 +24. 8 Uaw materials for manufacture __ i 175 68 123 107 161 149 134 119 -11.2 Manufactured foodstuffs ________ ! 115 56 73 75 77 76 76 77 +1.3 Manufactured commodities _____ 159 89 122 122 153 159 156 156 0.0 I ! I
UNFILLED ORDERS .
Total (based on 1920=100) _____ . 116 40 85
I 93 53 58 63 63 0. 0
WHOLESALE TRADE i· (Value)
Hardware ________ ~ _____________ -j 117 .,
58 89 83 101 90 90 90 0. 0 Shoes ________ . __________________ 78 39 57 57 59 48 48 47 I -2.1 Dry goods. ____________________ .! 123 64 101 95 90 66 98 100 I +2.0 Groceries. ______________________ ! 99 62 75 74 93 75 79 75 -5.1 Drugs ______ --- ________ :. _______ ·j 129 88 113 1'07 111 102 116 110 -5.2 Meat packing ___________________ 73 43 I 58 55 62 62 66 62 -6.1
TotaL ___ -----------1 98 62 . f 77 74 84 71 78 76 -2.6 i
RETAIL TRADE
I
(Value)
MAIL-ORDER HOUSES ( 4 houses)-- .I 134. 49 89 84 122 118 99 96 -3.0 CHAIN STORES: 1
Ten-cent (5 chains)-~-------- 331 84 115 117 176 331 126 140 +11.1 Music (4 chains) _____________ 214 55 95 88 149 214 84 97 +15. 5 Grocery (32 chains)----------' 190 117 1.65 159 187 187 191 186 -2.6 Drug (10 chains)------------~ 185 109 129 126 141 185 141 143 .. 1 +1.4 Cigar (3 chains)------------- 192 106 116 110 134 192 119 124 +4.2 Shoe (6 chains) _____ -- __ -- ___ 171 72 86 72 131 171
I
99 93 -6.1 DEPARTMENT STORES: i
Sales (333 stores) _________ ---~ 202 80 101 90 142 203 109 101 -7.3 Stocks (286 stores)----------- 154 101 107 118 149 123 116 125 +7.8
PRICE INDEX NUMBERS I (All price Index numbers relative to 1913; .
FARM PRICES: I Crops (15th of month)-------\ 309 97 126 130 137 137 140 141 +O. 7 Livestock (15th of month) ____ 1 181 91 106 107 97 94 97 98 +1. 0
WHOLESALE PRICES: ! I
Department of Labor- I 143 I
-0.7 Farm products __________ 1
243 114 143 142 146 145 144 Food, etC---~----------- 248 131 141 141 148 147 143 143 0.0 Cloths and clothing _____ -1 346 171 I 196 199 201 203 200 196 -2.0 Fuel and lighting ________ 281 178 I 218 212 167 162 169 180 +6.5 Metals and metal products, 203 109
) 133 139 141 142 142 143 +0. 7
Building materiaL-------! 300 155 188 192 181 178 181 182 +0.6
Chemicals. __ ----------- 213 121 131 132 130 130 132 13'1 -0.8
House-furnishing goods ___ i 275 173 ! 184 184 176 176 176 176 0.0 Miscellaneous __ -- ___ ---_ 208 114 I 124 126 118 116 117 113 I -3.4
All commodities--------- 248 138
I 156 157 152 151 151 152 I +0.7
FederaL Reserve Board (Depart- I I I
ment of Labor prices)- I I
I 153 155 156 I +0.6 Total raw products ______ ! 249 135 I 168 167 154 I
Agricultural products_ I 311 122 164 170 179 181 182 177 I -2.7
I 115 115 I 115 116 I +0.9 Animal products __ --- i 218 103 125 123
I Forest products.-----1 375 152
f
215 I 220 196 191 194 195 +0.5
Mineral products- ---I 272 168 213 I 207 165 165 170 177 +4. 1 Producers' goods _________ l 244 118 136 141 138 136 I 136 139 +2.2
Consumers' goods ___ ----_ i 249 146 I
155 155 159 I
158 ! 156 !55 -0.6
All commodities.------- -1 247 138 156 157 152 151 151 152 +O. 7
Federal Reserve Board Index- : I 148 143 148 +3. 5 Goods imported _________ : 246 102 I 139 145 147 Goods exported ___ -------! 272 125 I 180 I 187 196 199 196 189 -3.0
All commodities._------_; 267 142 166 166 163
I 163 163 163 0.0
Dun's (1st of following mo.) ___ 1 218 134 I 154 158 158 157 158 158 0. 0
Bradstreet's (1st of following / I month) _______________ - _ -j 227 115 I
149 151 146 I 144 143 140 -2. 1 I I I
93345-24-5

34
INDEX OF BUSINESS-Continued
EXPLANATION 1923 1923 I 19%4 Maximum Minimum
1
Per cent increase ( +) or decrease (-),
Feb. from Jan.
All indtx numbers are rtlatlce to 1919 as tOO, except since Jan. since Jan. 11-------,..------ -------.,------- ----,----order&, which are relatire to 19£0. ' _ -p-ri-ce_' _w_hl-ch_a_re-re-la-tlr_e _to_/_91_11_, _an_d_u_nfi_l_le_d ·I--1,-19-20-·I--1,_19-20-II-J-a_m_m_r~_· I-Fe_b_ru_a_ry-l November Decembrr I January February
PRICE INDEX NUMBERSContinued
RETAIL PRICES, FOOD-------------
CosT OF LIVING, National Industrial Conference Board: Food ______________________ _
Shelter ____ --------- _______ _ Clothing ___________________ _ Fuel and light ______________ _ Sundries ___________________ _
All items weighted-----------FOREIGN WHOLESALE PRICEs:
United l~ingdom-British Board Trade ____ _ London Economist ______ _ U.S. Fed. Res. Bd .• ____ _
France-Gen. Stat. Bureau. _____ _ U.S. Fed. Res. Bd ______ _
Italy (Bachi). -- __ -----------Sweden ____________________ _
Switzerland_--------_------Canada-
Canadian Dept. Labor __ _ U. S. Fed. Res. Bd ______ _
Australia __________________ _
India (Calcutta)------------Japan-
Bank of Japan ___ -------U. S. Fed. Res. Bd ______ _
219
219 175 288 200 192 205
333 310 340
588 537 670 366
2 326
263 279 236 218
'321 313
139
139 143 153 149 171 155
154 155 163
306 283 504 154 160
162 144 146 ' 170 i
i 183 i 171 I
I
144
144 167 160 187 171 158
157 161 165
387 346 I 575 I 156 175
165 148 163 179
184
1
.
176
142
142 J 167 162 187 171 158
158 164 168
422 380 582 158 181
166 152 161 180
192 183
151
151 180 174 176 174 165
161 169 171 443 416 571 151 183
164 145 173 177
209 199
150
150 li
180 175 j
m !I jl 163
170 177
459 426 577 15o I 183 i 164 144 174 179
210 205 I
149
149 180 176 175 174 I 165
165 173 178 495 443 571 152 183
164 146 174 172
211 205
147
147 180 177 175 174 164
167 173 180
-1.3
-1.3 0. 0
+O. 6 0.0 0. 0
-0.6
+1.2 0. 0
+1.1
+5. 0 +0.4 +O. 7 -1.6
166 +I. 2 148 +1. 4
---i 78--1-- .. ··- +3~5 --1
' 208 -1.4 200 -2.4

35
TREND OF BUSINESS MOVEMENTS
The following table contains a summary of the monthly figures, designed to show the trend in important industrial and commercial movements. The numerical data for the latest months arc given and in addition index numbers for the last four months and for two corresponding months of a year ago. In many lines the figures do not lend themselves readily tostatisticaluniformitv, due to lateness bf their publication or publication at other than monthly intervals; therefore the following explanations of uic various headings are offered to make clear such distinctions and in general to facilitate the usc of the table:
January, 1924.-This column gives the January figures corresponding to those for January shown in the next column-in other words, cover the previous month.
February, 1924.-In this column are given the figures covering the month of February, or, as in the case of stocks, etc., the situation on February 29 or March 1.
Corresponding month, January,1923, or February, 1928.-The figures in this column present the situation exactly a ~car previous to those in the "February;1924," column (that is, generally February, 1923), but where no figures arc available for February, 1924, the January, 1923, figures have been inserted in this column for comparison with the December, 1923, figures.
Cumulative total from July 1 through latest month.-These columns set forth, for those items that properly can be cumulated, the cumulative totals for the eight months ending February, 1923 and 1924, respectively, except where the Fchrunry, 1924, figures are lacking in which case the cumulative totals for the last six months of 1922 and 1923 are given. .
Percentage increase ( +) or decrease (-) cumulative, 1923-24 from 1922-23.-This column shows the per cent by which the cumulated total for the eight months ending February, 1924, is greater ( +) or less (-) than the total for the correspond-ing period ended February, 1923. '
Base year or period.-For purposes of comparison with a previous more or less normal period, all items, so far as possible, arc related to such a period by index numbers. The period taken for each item, called the base, is the monthly average of the year or period stated in this column. Wherever possible, the year 1913 is taken as a base, and if no pre-war figures are available, 1919 is usually taken to avoid using a war year as a basis. In some cases it will be noted that figures were not available prior to 1920 or even 1921, and that sometimes a month, or an average of a few months, has to be used rather than a year's average. Also, for some industries, 1919 would not be a proper base on account of extraordinary conditions in the industry and therefore some more representative year has been chosen.
Index numbers.-In order to visualize the trend of each movement, index or relative numbers are given for the last four months and for two corresponding months of a year ago. These index numbers are computed by allowing the monthly average for the base period, usually 1913 or 1919, to equal 100. If the movement for a current month is greater than the base the index number will be greater than 100. If the converse is true the index number will be less than 100. The difference between 100 and any index number gives at once the per cent increase or decrease compared with the base period. Index numbers may also be used to compute the approximate per cent increase or decrease from one month to the next.
Percentage increase ( +) or decrease (-) January from December.-The last column shows the per cent increase or decrease of the figure for the last month compared with the preceding month.
NoTE.-Items marked with an asterisk (*) NUMERICAL DA'r A Per ct. II I INDEX NUMBERS P:r have not been published previously in the in~~)sei ---------,----II fn: SURVEY or are repeated for special reasons; 1-------.,.,.....----;-;---------11 or de· 1 : cren.<e !lctailedtablcscoverlngbackftguresforthese Corre- cUMULATIVE TOTAL crease 1 RASE ,. C+> ltemswillbefoundattheendofthisbulletin. sponding FROl! 1l'LY 1 (-) 1 YEAR 1923 1924 orde-ror detailed tables covering other items, see !92, month, THROUGH LATEST cumu-1 OR crease ast quarterly issue of the SURVEY (No. 30). January l!ONTH lative PERIOD ,
1
1 (-)
available and mag be found in the special J Feb· ruary, 1922_23 1928-24 from : Jan. Fcn.l No,·. I Dec. Jan. Fch. from In many cmes March ligures are now -·---;,----11 or Feb- 1923-24) · I ' 1 Jan.
table on page 29 anuary ~ ~I----I ----·li-19_22_-_2_311 ! 1 I i Dec.
TEXTILES
Wool
Receipts at Boston: Domestic ................. : .. thous. of lbs .. Foreign _____________________ thous. of lbs ••
1 TotaL ______________________ thous. orlbs .•
11,823 18,336 30,159 30,786 em ports, unmanufactured ...• _ •• thous. of lbs ..
onsumption by textile mills, ,1t:rease equivalenL ............ thous. of lbs.. 53,845
"' achinery activity hourly: Looms, wide .•.•••• per ct. of hours active •. Looms, narrow __ •• per ct. of hours active .. Looms,
carpet and rug ••• per ct. of hours active •• Sets of cards •••••.. per ct. of hours active .• Combs •• __________ per ct. of hours active .. Spinning spindles-
Woolen ........ per ct. of hours active .. l\1 . Worsted •..•.•• per ct. of hours active .•
achinery activity (percentage of total): I Woolen wJ'~~es ••.••••• per ct. of activo to totaL\
,. ~pindles ••.•••.. per ct. of active to totaL.
N,;vlde looms ...... per ct. of active to totaL.
arrow looms •..• per ct. of active to totaL. 1
P . Carpet looms •••. per ct. or active to totaL.! nces: Rawi Ohio,
Rib ood unwashed .••••••••• dolls. per lb •• aw, territory fine, I
Wscoured ••••••••••.•••••••.• dolls. per lb __ wo1ted yarn ________________ dolls. per lb •• \ M~~·s ~~~~~ goods •••••..•••• dolls. per~~--~
mgs •••••••••••••• dolls. per> -·
Cotton '
72.8 67.3
75.0 87.1 89.6
86.4 72.8
81
73 73 81 82
.52
1. 37 I. 700 1.035 3. 000
~inn.ings!---·---------·-------thous. of bales •• --------·· 1~cc1pts 1nto sight •.••••..•••. thous. of bales.. 696 Expor;s, unmanufactured •••••••••••••• bales.. 47,693 (~r1 s, ?"manufactured
Consc nd tnlg linters)_ __________________ ,bales.. M6,253 · ump on by textile mills. .bales.. 576, M!
5,458 12,642 18,100 39,487
50,633
71.4 66.5
76.1 94.5 94.0
89.6 76.9
82
78 71 81 83
.54
1.41 I. 700 1.035 3.690
I 10,159 421
48,601
482,146 507,876
1 Oinnings are crop-year totals for 1922 and 1923, resp~ctively.
5,990 40,885 46,875 57, Ill
57,916
79.7 74.3
81.9 95.0 93.3
94.6 95.8
67
91 83 86 85
.53
1.44 1. 750 .993
3.510
19,729 410
66,329
359,657 566,805
I '1-:-~--r-- -,~---, ;. fl
I i 109, 839 99, 624 -9 4 i 1913 212,689 57,260 -73:1 ! II 1913 322, 529 156, 78-l -51. 4 . 1913 307,434 133,045,-56. 7 i I 1913
461, 239 393, 220 -14. 7 : 1 1921
1921 ::::::::::: ::::::::::: ::::::::,I 1921
1921 1921
·--------·- ·-···------ --------1 I I
::::::::::: ::::::::::: ::::::::1 I
------------1 i ----------- ----------- ------·-1
----------- ----------- --------1
1921
1921 1921
1913
1913 1913 1913 1913
50 740 244 445
144
126 131
168 133 116
127 116
I llO
122 109 118 126
44,
7751 250 451
131
116 116
160 133 105
132 117
113
123 112 118 125
61 66 62 78
114
112 116
165 130 96
123 101
106
Ill 104 110 126
115 • 88 9-1 347
109 IG1 93 243
103
103 103
139 122
113
112 91
105
101 99
108 126
122
106 105
146 122 101
120 89
105
99 99
lll 121
40 240
96 312
115
1M 104
148 132 105
125 94
106
-5.3.8 -31.1 -40.0 +28.3
-6.0
-!.II -1.2
+I. +8. +4. +3. +5.
+1.2
105 +6.8 96 -2.7
111 I o. o 122 +1.2
----------- _______ M ___ -------- I
:::::::::::::::::::::: :::::::: i ;;;; I ;, ~ I ;, ;, ~I ;; I :;; ::::::::::: ::::::::::: ::::::::. 1~g 1 ~i ~~ ~~ k~ k~ 1 ~~ 8:&
-· ""9;6i3" ---·-u;845" 344,735 172,458
4, 112,887 4,531,023 4,297, 782 4,057,646
: I ~ Jl~; ;---~~~r-~--~tr --;~r --i~r ··Ht-~r -;~r ~-::~:~ +to. 2 · l•t913 I os 49 106 116 75 66 -u. 1 -5. 6 ' 1913 131 122 114 99 124 109 -11. 9
s Twelve months' average, July to Jun~, inclusive, ending tho year indicated.

36
TREND OF BUSINESS MOVEMENTS-Continued
N-o-,-~-.-11;~-~s~m~a=rk=e~d==wi~t=b==an==~=t~e=rl~sk=-7-c=•J=TI====-=-=-=~-~~=================-=-~======~I~P~~=c=.t~.i,=====~~==~==r=N~~-~E=X==N==u=~=-=n~~=R=s==·~-~~~-~P~e==r A 1 th NU~ERICAL DATA Increase ct. have not been published previously n e C+l !----------:---·--- in· SURVEY or are repeated for special reasons; ------·-.-----..-,--------1 or de- 1
1 crea8e
detnl!cd tablcscovcr!ngbackflgurcsforthese : Corre- I CVMULA:riVE TOTAL crease BASE . 1
(+) Items will bofound at thecndofthis bulletin. 1924 . spending FROM IU'LY 1 (-) YEAR 1923 1924 't
0orredac•:
J."or detailed tables covering other Items, see 1 month THROUGH LATEST cumu- OR ·" J~t quarterly Issue or tho SURVEY (No. 30). J anuacy MONTH lat!ve PERIOD 1 ( _)
In many cases March figurelf are now ------- ·;;b·-; or Feb- 1 1923-24 Jan. a~ailable and may be found in the 11pecial January c - , ruary, t 1922-23 1023-U from ----1 . Jan._ Feb. Nov. Dec. Jan. Feb. !rom _ta_b_Tc_o~ P_~o_e_:s____ _ ___ mary 1_1923 I- 1922-23 __ _ ___ D...:_e._
1 I TEXTILE&-Cont!Dl;ted '
! I Cotton-Continued
Stocks, end of month: I Total domestic ginned •• __ thous. off bb~CS-- 51,206323 1· 454780 ~· ~ -------·--- ----------- -·------ ~~~: ~~~ ~~ I i~ m ~llls. ____________________ thous. o ... cs.. , • ..,v• ~----------- ----------- -------- 1621'
;~~!~~~~~~comiiiiie.ii:~Jg~~;: ~~ g~J~:: 2' ~~ 2
' :~ :z.~og ----------- ----------- -------- m~ ~~ 47 2~ 2~
Fabric consumption by tire manu!acturers. _ .•• thous. oflbs.. 11,706 11,447 i 11,834 81, 166 69,580 -14.3 1921 164 177 119 I 125
101 120 172 34
98
77
86 116 144 23
90
78
1751 17
-14.6 -3.4
-16.2 -32.2
-8.1
+1.5
-2.2
Ma;i~~~l~~~;;;~~~~;~::~·r :~~:::: ~: ::: ~: ::~ ] ·a::~:: ,:::~;~~:: :::~~~~~~: :~;~~;: 1 ~:~: ~= : ~~~~ ~: 1~~ Fine cotton goods: I 1 Production ________________________ picccs . .l 46-1,408 409,377 399,024 3,m, 702 3,467,130 +7.6 I 1919 105 104 I 120 117 121 107 -11.8
Salcs ______________________________ picccs •• l 250,360 191,278 383,818 3,382, 777 2,537,405 -25.0 i 1919 1125 86 1 88 61 56 43 -23.6 Cotton finishing: J I
Orders received, grey ynrdnge- ! White goods ____________ thous. or yds •. _
1
32,569 30,950 36,655 298,797 267,425 -10.5 ! 11921 117 109 ! 110 103 97 92 -4.9 Dyed goods •. ___________ thous. of yds. 37, 143 34,466 42,203 318,627 275, M9 -13. 5 1 a 1921 1M 144
1
124 lot 127 118 -7.2 Printed goods. _________ thous. or yds.. 9, 30S 8, 438 J 14,180 110,359 66,649 -39.6 1 11921 103 91 59 47 60 54 -9.9 'l'otaL. ••••••••••.•••••• thous. of yds.. 86,888 81,680 102,827 811,695 li78, 514 -16.4 !, a 1921 123 114 I 102 90 • 96 91 -6.0
Billln~:s, tlnlshe<l goods (as produccd)-Whitcgoods .••••••••••• thous.ofyds.. 36,735 33,172 34,251 301,371 269,909 -10.41 11921 119 105 111 118 113 102 -9.7 Dyedgoods ...•••••••••• thous.o!yds.. 35,389 33,003 37,865 280,712 279,098 -0.61 11921 140 143 1M 139 133 127 -5.0 Printcdgoods __________ thous.ofyds.. S,OS2 8,239 15,189 109,141 68,760 -37.0, 11921 123 116 77 71 66 63 -5.1 TotnL. _________________ thous. or yds.. 92,714 85,823 99,442 787,018 698,732 -11.2 1 a 1921 124 116 ' 114 111 109 101 -7. ~
Shipments, finished goods-White goods-------------------·cases.. 19,651 19, 22.'i 16,852 135,610 130,790 -3.61 11921 114 109 105 Dyed goods----------·---------cnscs__ 9,411 8,458 12,135 89,882 64,828 -27.9 11921 159 153 108 Printedgoods __________________ cascs.. 1,830 1,5&1 2, 729 21,174 13,465 -36.4 11921 74 94 77 Totnl ••••••••••••••.••••.•.•.••. eases.. 54,2111 47,856 55,092 419,314 360,976 -13.9 ,! 11921 128 123 101
Stocks finished goods-White goods.---------------·---cases.. 11,551 10,555 8, 283 --- • • , I 11921 124 113 I 172
Opc~~~~~~~ff~~~~~~~~~~i=~~~~~E~~~ J~f 4t~ 4~JH ~~~~~~~~~~~ :~~~~~~~] m~~~~~il ~iii! ;~ ;!i II, ;u
109 107 59
104
162 212 80
137 97
127 119 63
121
158 214 80
133 114
124 107 M
107
145 221 iS
127 98
~nch1nery activity or spindles: 1 · I Active spindlcs ________________ thousands.. 33,340 32,684 35,304 ----------- ·----------1 .•• : .•.. 1 1913 115 116 , 112 111 109 107 Totnl activ!ty •. _________ millions of hours.. 8,448 7,301 8,449 ·---------- ·----------1--------' 1922 120 109 ! lot 92
1
109 95 Actiyity per spindle •• -------------hours__ 224 194 2'J:T ~- 1922 119 109 1 102 91 107 93
Prl~!:v~::t:~ ::~:~;~~~;~~~~~;;l;:.c~;;::_ .~:~: .~:~: ~~~ ~:~~~~~~~~~ ::::::::J ~::~~~::! ---;~~;--- --~~~- 231 --~~- --~- --~;~- 262 Rawcotton,NcwYork •••••• dolls.perlb ••• 3!7 .319 290 I '11913 215 226 274 280 271 249 Cotton :rnm _________________ dolls. per lb.. • 552 • 522 :_ 4
08870
:::·:::::~:: ::::::::::: ::::::::11 11991
133
~ 23197
2 222918 2
23286
223223
22.~51 Print cloth ___________ ~------dolls. per yd.. . Oi7 • 071 ""' '" Shcct!ng ____________________ dolls. per yd ••
1 • 135 .125 , • 126 ::::::::::: ::::::::::: ::::::::1, 1913 197 206 208 :m 220 204
Clo!j;{~K;s and boys' garments cut- II I II • Men's suits;"wooL •••..••••• number.. 700,896 757,447 858,207 I 'II I
~~~;=:;_;;=; ; ; ;;, ;~ :~~~~-~-~:: ::-:-__ :~~r-:-:-/::~:=:-_~ ~~--;=: ·~~:::::: -:::~-~-:=:-~ B~:~~vercoats-andreeiers::~~:::g:~:: 6I~:m r~:m ~·g~ ----------- -----------~--------~---------- ------ ~------ ------------
-2.2 -10.1 -13.6 -11.9
-8.6 +3.6 -1.9 -4.4
-13.5
-2.0 -13.5 -13.4 -7.1
-3.4 -8.1 -5.4 -7.8 -7.4
+8.1 -9.0
+1.2
+42-2 -19.0
+7.1 -6.8
-8.3 -16.6 -8.9 +7.2 ::.§i~:~~;~::::::~~~~~J§= l§ ~in ~~~::~=~:: iiii~::ii;~ ii~~;~;:j ::;~:] 1i~ii:~i:fiiiii l;iiiii :;i;ii iiiii~
Production _______________________ dozens.. 756,000 730,800 626,400 4,897,800 ~. 795,100 i +18 3 I 1D20 107 1
06 IJ 132 121 128 124 -3.3 Ordersrecelved ••••••• thous. of dozen.. 758 528 501' 7,119 6,~ll -1i9j' 11920 1, 157 497 625 1,029 751 523 -30.3 Shipments ____________________ dozens.. 767,700 681,300 837,000 5, 779,800 ~. 786,100 +0.1
1 ,
1920 185 182 156 144 167 148 -11.3
Cancellations ••••••••• ________ dozens.. 4,500 12,600 9,900 104,400 164,700: +57.8 1
, 1920 46 20 J 45 70 9 25 +180.0 Unfilled orders, end of
month _____________ thous. or dozens •• 2, 376,900 2, 224,800 12 567 700 ]' I' . 1920 511 '
451 570 473 443 -6 4
Raw SDk I ' ' -----------~------·----~, -------- • 587 I . Im~rts. ________________________ thous. oflbs.. 6,3ot 4,200
1
1 5,133 44,000 41,626 -5.4 I 1913 197 180 212 1
79 186 147 -20.8 De iveries (consumption). ______________ bales.. 32,925 29,804 36,231 268,871 226,194 -15.
9!
11920 195 203 141 131 185 167 -9.6
Stocks, end or month ___________________ bo.lcs.. 44, 3!l8 40,226 44 615 I I 920
78 -9 4
:~i::~pancs;0:~:~~~-;~~dolls. per lb.. 7.350 6.860 I S:m :::~:::::::
1/::::::::::·: ::::::::
1
, ~913 j J~ ~I 2~~ 2~g ~~ 189 -6.7
B!lrlap ______________________ thous. of lhs.. 56,049 57 882 47 914 355 06" 389 937
+9
' 171 +3 3
F1ber (nnmanuractured) ________ long tons.. 25,422 24' 812 26• 367 226•323' • .8 1909-13 ~~180 141 151 143 165 '4 • • ' 1i9, 612 -15.8 . 1909-13 165 92 120 116 89 87 -2.
Pyroxylln~~::d~~-~~~~-~~~!~:S. of lbs. 2, 912 2,861 ------·--· ------·--·1---------· ~--------_./jJ·---·- !,------ ----·- ----·- -1.8 Shipments billed: Light goods·-------·-··--------Hnear yds.. 688,589 535,379 ---------· ---------· - - II 1------ ------ -----· -22. 8
Un~:'Jr!~ds. eiid--oimo_n_t_h--•. -----linear yds •• 1, 384,688 1, 457,660 --·-----·- --·-----·- ---------- I :::::.:.1 ::::::::::: 1:::::: ,------ ------ ------ +5.3
----------1--.-----11----------1------ '1------ ------ -----· +2L 1 Light goods·--·--··-----------Hnear yds.. 420,461 511,563 ---------- ----------Heavy goods------------------linear yds •• 1, 946,670 2, 103, 6!l8 --··---·-- --··---·-- --··------I ·-··---- 1--··------ ------ --··-- ------ -----· +S.l
1 Twelve mont bs' average, J'uly to Jun~~ Inclusive, ending the year Indicated. 1 Eleven months' average, Janu~ to l'Oovember inclusive • As ottbe 16th orthe month. Figures prior to lanW117 are a5 of the flrllt of following month,
'Relative to six months' average, July to December, inclusive. • Relative to eleven months' average, February to December, fnclaslve.

37
TREND OF BUSINESS MOVEMENTS-Continued
NOTB. Items marked with an asterisk {*) Per ct. haveTnot been published previously In the NUMERICAL DATA Increase BUBVBY or are repeated tor special reasons; 1-------..-------,,..---------ll C+l detailed tables covering back figures for these or de-ltemswillbefoundattheendofthisbulletin.
1924 sp~~r:~g cu~~tTIJ~:01TAL crease
For detailed tables covering other Items, see th THROUGH LATEST (-) last quarterly issue of the SURVEY (No. 30). Jr:~arY KONTlJ cumu· In manu eaaea March figures are now 1----r----11 or Feb- 11----.---- lative
INDEX NUMBERS Per t't. In•
BASE crease
y~!R 1928 1924 0~~~ P.£RIOD crease
11---.--.. --.---1·--.---11 (-) a11atlable and mau be found in the special January Feb- mary, 11122_23 1823-2~ 1~24
~-~n ~ ~ ~ --- Jan. Feb. Nov .. Dec. Jan. Feb. ~C::,
I
Jan.
METALS·
Iron Ore and Pig Iron Iron ore:
Stocks-Total •••••••••••••••••• tho us. of tons •• At furnaces ............ thous. of tons ••
. On Lake Erie doeks .... thous. of tons .. Consumptlon .............. thous. of tons ••
Pig Iron, productlon ....... thous. of long tons •• Furnaces In blast:
Furnace •••• J .................... number •• Capaclty ............... Jong tons per day ..
Merch8nt pig Iron: Production •••••••••••• thous. of long tons •• Sales .................. thous. of long tons .. Shipments ............ thous. of long tons •• Unfilled orders ........ thous. of long tons .. Stock, merchant
furnaces ............. thous. of long tons .. Stocks, steel plants .... thous. of long tons ••
Ohio gray-iron foundries; MeltingS ....................... long tons •. Meltings .... : ......... per cent of normal •• Stocks ••••••••••••••••••••••••.• long tons •• Receipts of iron •••••••••••••••• long tons ..
Wholesale prices: Foundry No.2,
Northem ............ dolls. per long ton •• Baslo Valley furnace ..• dolls. per long ton •• Composite pig iron .... dolls. per long ton ••
Malleable castings: Production •••••••••••••••••••.•..••• tons •• Shipments .......................... tons •. Orders booked ...................... tons •• Operating activity .... per. ct. of capacity •.
Cast-Iron pipe: Productton .......................... tons .. Shipments .•••••••••••••••.••••••.•• tons •• New orders ...................... : ••. tons •.
Crude Steel
Steel ingots, production ... thous. of long tons •• Steel castings:
Total bookings ................ short tons .. Railroad specialtles ............ short tons .•
U Miscellaneous bookings ........ short tons •• nftlled orders, U. S. Steel Corp., end of month ............ thous. of long tons ••
Finished Iron and Steel
Sheets, blue, black, and galvanized: Production (actual) ........... "short tons •• Production ............ per ct. of capacity •• Shipments ..................... short tons •• Sales .......................... short tons .. Unfilled orders ................ sbort tons •• Stockll- , .
Total .......... ~ ........... short tons •• Whoi~en~~!s;········--···-----short tons ••
Steel billets, Bessemer .dolls. per long ton .. Iron and steel .......... dolls. per long ton .. Composite steel ......... dolls. per 100 Ibs •• Composite finished steel. dolls. per 100 Jbs •• Structural steel beams ••• dolls. per 100 lbs ••
Iron and Steel Products
Locomotives: Shlpments-
Total ........................ number .. Domestic .................... number ••
Unflb~~~d"ers::: ................ number ••
Total ........................ number •• Domestic .................... number ••
F 1
h Forelgn ...................... number ••
Fre gdt cars: Orders, domestlc ....... number .. ou~ ry equipment:
8~1es .............................. dollars .. U Pments ........................ dollars ..
nfllled orders ................... dollars ..
• Revised.
33,991 26,453
7,638 4,688 3,019
248 101,435
429 613 433
1,297
918 161
20,620 74.40
23,478 15,780
24.16 21.20 23.18
56,278 53,504 64,053
58.0
81,431 63,987
204,547
3,600
• 49,046 18,970
a 30,076
4, 798
274,097 87.2
228,660 234,858 471,053
117,069 37,541
40.00 43.35
3.03 2. 79 2.50
151 147
4
376 344 32
9,170
419,164 317,931 569,137
29,258 22,232 7,026 4,783 3,075
264 108,100
422 355 4~
1,242
888 147
23,137 74.10
24,413 18,578
24.76 22.00 24.13
58,793 52,918 56,828
62.0
78,962 69,399
222,164
3, 781
70,829 34,901 35,928
4, 913
275,1l8 96.5
249,859 189,081 434,145
113,020 30,658
40.00 43.49
3.03 2.78 2.50
99 92 7
499 466 33
41,346
378,265 3~,641 614,679 I
30,519 22,601 7,918 4,671 2,994
278 l10,055
437 689 433
1,516
279 73
19,800 67.80
23,992 29,044
2,676 3,071 2,S36
117,011
3,663 3,222 3,240
161,742
+36.9 +4.9
+H.2
+38.2
····94;299· --·m;ooo· -+2i:v· 1 .............................. I
11919-20 71919-20 '1919-20 11919-20
1913
1913 1913
1914 1914 1914 1914
1914 11921
1922 1922 1922 1922
115 120 104 124 126
97 125
121 152 127 95
36 40
110 llli 91
132
100 101 97
116 117
103 131
115 209 130 116
37 38
163 131 108 363
140 153 108 110 113
86 112
114 297 110 97
118 so
165 136 106 168
127 138 98
111 114
86 112
112 00
121 86
121 85
120 111 107 140
111 119 93
117 118
92 121
113 166 130 99
121 85
168 I« 105 192
96 100 86
1111 120
-13.0 -16.0 -6.8 +2.0 +1.9
98 I +6.6 12\l +11.11
111 -1.11 108 -42.1
1~~ I :r~ 117 -3.3 78 -8.7
190 143 110 226
+12.8 -0.( +4.0
+17.7
29.27 .............................. J 1913 tso tsa 148 148 151 tM +2. a 26.25 ----------- ................... I 1913 176 179 142 142 144 1W +3.8 ,,_,, ;~ :~ ~;~~:~~ ;~~; ;~;~~~: ....... ·~::;;:;;:: ::; ~l~;: "' "' 'w :'~:I -~ i
~~ ;~:;;;;;: ~~~~~~~~;;; ::: ~~: ~ ~~~~ ~~~:~:I~~~-~~ I·· ··· . ::::: i: i i 3,455
90,152 39,845 50,307
7,284
237,919 89.0
217,808 253,197 547,897
148,360 29,123
39.63 42.61 2. 72 2. 61 2.10
?l1l 196 11
! I
25,819 21,407 +6.1 I 1913 t5I 137 123 113 143 1ro : +5. o I
623,755 283,398 340,357
388,048 148,567 239,211
-37.8 -47.6 -29.7
.................................................. ---!'"'"'"'"'
1, 799, 814 1, 712, 901 -4. 8
"i;723;2i3" ·i;730;295" ""+ii~4-1, 794, 921 1, 556, 559 -13. 3
.......... '1' ............................................. ..
:::::~~~:~: :~~:::~:::~ ::~:~J ---------------------- I ::::::::::: ::::::::::: :::::::: i
I· ................................ ,. .... ,.,. ................... I
' 1,3~ 2, 034 +50. 9 ' 1, 249 1, 892 +51. 5 i
99 142 +43.4
1913 1913 1913
1913
1920 1020 1020 1920 1920
1920 1920
1913 1913 1913 1913 1913
1913 1920 1920
1020 1920 1920 1913
1922 1922 1922
I
199 202 197
117
152 127 1 .. 179 74
117 577
U5 156 151 149 132
I 75 ! 197 13
lllli 100
21 128
1M 111 176
179 168 188
123
. 139 122 127 ISO 79
132 521
154 162 158 167 139
68 178 12
168 239
18 74
148 146 187
'Twelve months' average, June, 1919, to :\lay, 1920.
78 54
100
110 92
116 117 41
100 815
155 163 176 167 166
98 245 33
81 64 97
75
91 81
110 248 65
93 7110
155 163 176 167 166
108 277 27
52 29 73 41 8 ' 6
48 \ 101
1~· m 118 I t39
97 80
113
81
100 120 133 167 68
106 672
155 155 176 168 166
49 134
4
28 38 7
87
152 124 154
140 I +44.4 u1 1 +84.o 134 ' +19.5
' S3 I +2.4 I i
I 160 I +0.4 133 ' +tO. 7 145 ' +9.3 134 I -19.5
63 : -7.8
101 1. -3.s
548 ' -18.3
155 165 I m: 166 i
0.0 +0.3
0.0 -0.4
0.0
32 : -34.4 84 . -37.4 8 1 +76.0
38 I +32. 7 52 : +~.6 81 +3.1
394 '+350.0
137 l -9.8 136 i +9. 7 166 +8. 0

38
TREND OF BUSINESS MOVEMENT8-Continued.
;~i~:i~Ti~~~~fls~~~iei::}f~~~~~~ ~,-.,-_-_~_--____ N_u_M"E-:-R __ rc_A_L---cD;-A-T_A ___ -:--::- i:~f;e SURVEY or are repented !or special reasons; ,.
1
or de-
a~~~~fr~%~~~c;i~t~~~ ~mr: ~~~~t~ro~ s~~~Jr~g CUl:~!~T~~ti1TAL c(:_)e For detailed tables covering otber items, see 19!-i month, THROUGH LATEST cumu-l:lSt quarterly Issue or tho SURVEY (No. 30). '~---,----I January ___ M_o-;-Nm ____ 11 ltiJ~~4 Jn many ca&es ~larch ligures are now ,.
1
or Feb- from aiJallable and may be found In the special_ J Feb· runry, 11122-23 1923-2!
1922_23 table on page %9 ' anunry ruary __ 19_23--11----1----1 ---
lUETAL8-Contlnued
Iron and Steel Products-Contillued
Vessel construction:
Com/~f!J~-~~~i~~~-~~~~: •••• gross tons •• , Steel seagoing •••••••••••••• gross tons ••
Building or under contract, end or mo.Merchant vcssels •• thous. o! gross tons ••
Structural steel, fabricated: Snlt·s (prorated) ••••••••••••••• short tC?ns •• Sale; ••••••••••••••••• per ct. of capaCity •• Shlpmcnts ••••••••••••• per ct. or capacity ••
Steel furniture, shlpments ••••• thous. of dolls ••
1\lacblnerr
Stoki~~-- •••••••••••••••••••••••••• number ··I . Sales ••. _ ••••••••••••••••••••• horsepower ••
Agricultural pump shipments: 1 Totnl ••••••••••••••••••• ~ •• thous. of dolls •• ! Pitcher, hand, ctc ••••••••••••••• number .•
1 Power pumps •••••••••••••••••••• number •• StCIIW, power, 110d centrifugal pumps: I
New orders ••••.••••••••••• thous. of dolls •• Sh!pments ••••••••••••••••• thous. of dolls ••
1 Unfilled orders ••••••••••••• thous. of dolls ••
Patents issued: · I Totnl, all classes ••••••••••••••••• number •• Agriculturalimplemcnts ••••••••• number ··I Internal-combustion cngines ••••• number ··J
NONFERROUS 1\IETALS
Copper and Brass Cojlper:
Productlon •••••••••••••••••• thous. of lbs •• Exports ..................... thous. of lbs •• Wholesale price, elcctrolytlc.dolls. per lb ••
Brass faucets: Orders reccived ••••••••• number of pieces •• Orders shipped ••••••••• number of pieces ••
Tubular plumbmg sales: .
'
10,780 3, 719
146
184,600 71 64
1,592
91 66,492
538 52,844 2, 798
1,071 1,081 2, 706
3,380 42 42
133,356 68,888
.126
496,535 362,433
3, 950 1,849
196 i
21,392 16,224
280
204,622 65,541
134, 5119 :3421·. 32 51,576
-------· .. ............................................. .. 189, soo 1 202, soo 1, 310, 100 1, 2ss, 800 -4. 1
73· 78 ............................. . 60 ! ................................ ••••••·•
1,605 ' 1,307 ••••••••••• .................. .
110 62,113
576 50,056 3,065
2,1180 42 51
128,260 89,278
.128
515,521 3W,316
I
129 66, 619
537 54,322 2,676
b 1, 506 b 1,112 b4,849
3,226 48 48
102,735 49,751
.155
645,306 481,740
1,188 574,608
4,600 428,996 25,501
775 3M,636
4,649 341,753 25,550
-34.8 -31.3
-1.1 -20.3 +0.2
9,467 7,914 -16.4 7, 882 10, 814 +37. 2
25,809 373 388
24,1195 351 461
-3.2 -5.9
+18.8
812, 842 1, 033, 504 +27. 1 468, 078 582, 743 +24. 5
1923 1924
Per . ct. ill-
crease (+)
or de· crease
BASE YEAR
OR PERIOD
·Jan. I Feb. I Nov. Dec. Jan. Feb. !rom 1 , I 1-.. ~,~-u 12.
I Dec. --1-i_i __ , __
,, -1
1916 1916
1916
31
1~
18
24
:g 1 ~ 1- ro 231 13 13
23 14.
12
9 7
16
1916 199" 2121 144 216 193 '199 1916 146 156 106 158 142 146
.. ....................................................... ------ ------ -----~ ........... ... 1919 150 144 I 148 . -160 169 177
-63.4 -50.3
+.34.0
+2.8 +2.8 -6.2 +0.8
' i .I
1919 ·62j ss 1 21 I 31 39 47 +20. \) 1919 158 , 126 , 31 I 62 126 118 -6.6
:::: :::~~:1::;~=1 :: :~:1 =; = ~~ =, = = = ~ = 94 ~H 1919 86 96 109 106 84 •••••• .. 1919 81 92 591 47 45 ••••••••
1913 121 n4 111 I 109 120 1os -n. 8 1913 91 61 61 58 53 53 o. 0 1913 179 112 144 I 112 9s 119 +21.4
1913 110 101 125 127 131 126 1913 107 71 102 108 98 127 wm w 98 ~ ~ ~ ~
. ......... ::::::1:::::: ...... ······ ...... ··-·-·
-3.8 +29.6 +1.6
+3.8 +8.8
Quantity ............... number of p1eces •• Valuc ............................. dollnrs ••
540,768 425,776
269,112 260,548
I 254,593 238,690 ::::::::::: ::::::::::: ::::::::1 ·········· ·····- ...... ···--· ·····- ...... -····- -50.2
-38.8
Zlnc
Retorts In operation, end of mo •••••• number •• Production ...................... thous. of lbs •• l Stocks, end or montb •••••••••••• thous. or lbs •• Receipts, St. Louls .............. thous. orlbs •• Shipments, St. Louis ............ thous. of lbs •• Price, slab, prime westem ••••••• dolls. per lb ••
Tin
Stocks, end of month: United Statcs ................. .long tons .. World visible SUP_PlY ••••••••• .long tons ••
Deliveries (consumpt1on) .......... .long tons •• lmports ••••••••••••••••••••••••• thous. or lbs •• , Wholesale price, pig till •••••••••• dolls. per lb ••
Lead
78,768 99,418 81,3M 25,974 17,022
.068
2,812 24,372 4,895
12,925 .485
79,232 87,866 74,384 22,834 19,168
.071
3,302 21,835 8,845
20,599 .529
86,931 84,886 21,728 11,096 14,171
.076
2,054 25,157 6,185
12,429 .423
577,743 653,008 +13. 0 616,430 700,600 +13. 7
···i20;oos· ·--i69;iiii. ·=Ho:9· 135, 718 139, 681 +2. 8
.. ................................. :.. ............................ ..
Prodnction •••••••••••••••••••• index number ............................................................. . Rceipts, St. Louls ............... thous. of lbs.. 12,150 11,301 11,7112 121.250 72,365 -40.3 Shipments, St. Louls ••.•••••••.• thous. oflbs.. 7, 451 7, 688 6, 402 72,852 65, 027· -10.7 Wholesale price, pig, desilverlzed.dolls. per lb.. • 083 • 090 • 082 ............................. .
FUEL AND POWER
Coal and Coke Bituminous:
Froduction ••••••••••• thous. of short tons •• Exports ••••••••••••••• thous. of long tons •• Prices-
Mine average, spot. dolls. per short ton •• Wholesale, K110awha, f. o. b.
Cinclnnatl.. •••• dolls. per short ton •• Retail, Chicngo ••• dolls. per short ton ••
Anthracite: Productlon ........... thous. of short tons •• Stocks, dlstrlb. points .thous. of long tons •• Exports ............... thous. of long tons •• Prices-
Coke:
Wholesale, chestnut N. Y •••••••••••• dolls. per long ton ••
Retail, chestnut N. Y ........... dolls. per short ton ••
Production, beehlve •• thou.,. of short tons .. Production,
by product ......... thous. or short tons •• Exports •••••••••••••• thous. of long tons •• Price, furnace,
Connellsville ....... dolls. per short ton ••
50,~1 1,046
2.23
3.64 8. 7l
7,924 1,494
272
11.47
14.50
1,154
3,0114 A3
4..03
45,725 1,263
2.25
3.641 8. 73 I
7,621 I 1,660
310
11.47 I 14.13 I
1. 211 'II 2. 981 1
56!1 4.19 ;I
42,160 806
3.1i9
4..89 10.79
10.63
14..90
1,481
2,810 71
7.13
309,518 368,646 +19.1 8, 681 12, 293 +41. 6
.........................................................................
...........................................................................
.......................................................................
....................................................................... 7,802
21,228 438
10,265 +31.6
24,736 +16. 5 535 +22-1
..................... ~ .............................. --------bJIIDuary, 1923.
1913 1913 1913 1913 1913 1913
1913 1913 1913 11113 1913
1921 1913 1913 1913
1913 1909-13
1913
1913 1913
1913 1921
1909-13
1913
1913
1913
1913 1909-13
1913
so 160 41 43 48
125
82 147 27 40 50
130
174 106 208 203 181 1611 138 130 88 94
140 130 255 215 78 62
178 185
1~g 11~ a54 I 292
2561 222 228 1 224
1141 102 4 . 4 124 115
~ 153 76 49 43
115
82 161 92
106 64
113
56 86 158 170 185 131 1111 132
911 105
142 140 141 196 123 106 157 173
108 114
181
177 182
102 47
128
100 98
176
154 181
105 54
114
200 200 216 216
208
38
283
207 214 209
53
293 107
338
39
62
164
75 75 172 152 100 91 94 83 6() 68
116 . 123
+0.6 -11.6 -8.6
-12.1 +12.6 +4.4
146 171 +17· 4 197 176 -10.4 134 242 +SO. 7 135 215 +511. 4 108 118 +9.1
139 152 +9.4 222 206 -7.0 85 88 +3.2
188 203 +8.4
127 95
181
166 181
104 56 94
216
208
41
292 73
165
115 115
183
166 181
100 62
108
216
203
43
281 77
172
-10.0 +20.7
+0.9
o.o +0.2
-3.8 +11.1 +14.0
o.o -2.6
+4.9
-3.7 +5.7
+4-0

39
TREND OF BUSINESS MOVEMENTS-Continued
have not been published previously In the incrcllSe tT--·----
INDEX NUMBERS NotE.-Items marked with an asterisk (•) NUMERICAL DATA I Per ct. ·
SURVEY or are repeated for special reasons; 1-------,..-----;;;---------ll <+> ' detailed tables covering back figures for these ·1 or de· 1
: 1'cr ' ct.
--------.-----' In· I crease Items wlll be found at the end or this bulletin. : sp~oniJr~g cuMULATIVE TOTAL crc!ISe !
For detailed tables covering other items, see' 11124 FROM IULY 1 ( _) last quarterly Issue of the SURVEY (No. 30). ·,, J:~~!~y TRRO~~~Tt;ttEST ¥~t~~-In manu cases March figures are now 1----.----- or Jo'cb· 1923-24
BASE YEAR
01, i PERIOD
1923 1924
I I
I (+) 1 or de·
CrCilSO
, Jan. Feb. Nov. Dec. Jnn. i Feb. aDallable and mau be found in the special January Feb- I ruary, 11122_28 192s-2,t !rom 1 ~~~n . ~~~ ~~ ------..,..-------11------ ---t---:1--- --I
(-) Jan. !rom Dec. .---- .. ----~--
1 FUEL AND POWER-Continued 1
1
,
1
I 1
Petroleum
.Crude petroleum: ! . , 497
, 926
1
i +2
8. 6
I Production.--- ----···-·---thous. of bbls.. 66,455 55,027 48,130 387,148
1 1913 251 232 313 284 273 200 : -2.5
Stocks, end of month-1
, 1 Total (comparable) •••• thous. ofbblll.. 3'37,419 338,262 258,1).1,6' ........... ···--------1........ 1913 256 256 318 321 321 322, +0.2 Days' supply •••••••••••••••• number.. · 162 160 141 1 1919 : 128 122 141 141 140 138 f -1.2
T'ifn~~~~~~-~~~~---thous. of bblll.. 333,742 334,585 260.026 :_: __ :·_- -__ :_;;:_;; ;;;_:_::_:_-_- -_- -_.:_1
':_:_:_:_:_;:_:_ 1
1
.. ' 1 +0.3
Rellneries ••..••••••••••••.• thous. of bbls.. 33,873 37,324 28,113 __ __ ___ _ ·i9iii--- !"2oo· 188 ··22i· "223' ··m· ··2ro· +10. 2 lmports .................... thous. of bbls.. 6, 303 6, 511 6,199 63,767 54 657 1 -14.3 1913 1 402 418 410 567 425 439 +3. 3 Consumtion ••••••••••.••••• thous. of bbls.. 62,262 59,008 51,681 434,304 495;414 +14.1 I 1913 ; 247 237 277 290 286 271 -5.2 ShipmentsfromMexico •••• thous.ofbbls.. 9,911 11,809 10,175 102,752 95,206 1 -7.3 1913
1
. 554 471 555 628 459 547, +19.2 Price, Kansas-Oklahoma ••• dolls. per bbL. 1. 244 1. 513 1· 725 1913 145 185 112 109 133 162 +21. 6 Oil wells completed .••••••••••••• number.. 774 904 I 1, 094 ---·ii;4i6" ·····9;i88" :·::i9~5- 1913 76 69 53 56 49 57 , +16. 8
Oasollne: ' 1 , Productlon ................. thous. of gals.. 695,323 677,740 568,652 4, 566,966 5, 218,451 + 14.3 1919 189 172 187 200 211 205 1 -2.5 Exports •••••••••••••••••••• thous. or gals.. 85,946 101,597 66,968 396,512 623,971 +57. 4 1919 191 218 175 230 280 331 \ +IS. 2 Domesticconsumption ••••• thous.ofgals •• 498,161 407,710 \lSO,Oil3 3,S91,1S<l 4,00;,629 +18.4 1919 100 1~ ISS lSI 174 14l -18 0 St~cks, end of month .•••••• thous. of gals •• 1, 202,547 1, 347,222 1,130, 341 ••••••••••• -···------- ........ 1919 212 239 209 228 255 285 + 1i 5 Pnce,motor,N. Y ••••••••• dolls.pergal.. .165 .200 .231 ---·······-···-------- ........ 1919 131 137 101 92 98 110 +21.2
Kerosene oil; 1 I Production •••••••••.••••••• thous. olgals.. 217,768 196,826 180,375 1,643,943 1,629,805 -0.0 I 1919 I' 109 92 113 120 112 101 -II 6 Domestic consumptiou ••••• thous. of gals •• -------------------- -·-------- ----~----·· ·---·---·-- •••••••• 1919 , 106 104 114 103 •••••• .• • Stocks .••••••••••••..••••••• thous. of gals.. 314, 181 316,750 272,783 ••••••••••• ••••••••••• •••••••• 1919 II 92 91 80 94 165 105 +C. 8 Price,l50°waterwhite ••••• dolls.pergaL .220 .220 .220 ---------------------·-------- 11119 1
156
10 110 110 110 110 110 0.0 Oas and fuel oil:
Productiou ••••••••••••••••• thous. of gals •• 1, 062,892 1,025,422 902, 5ll3 7, 498,422 8, 385,875 +11. 8 1919 142 166 168 167 161 -3.5 Domestlcconsumption ..... thous. of gals •• --------·------·----···------- ---····---- ---------·- 11119 :1 11~~ 145 160 1
19005
•• 1•9•6 ••.
199 +
1•5 St~cks •••••••••••••••••••••• thous. ofgals •• 1,527,M7 1,550,503 1,276,876 ----------- ---------·· 1919 "" 164 193
Pnce, Pa., 36-40 at reiin •.•• dolls. per gaL • 057 • 060 • 064 ••••••••••• ----------- 11119 117 123 113 108 110 · 115 +5.2 Lu bricatlng oil: ·
Production ................. thous. of gals.. 94,535 93,824 77,498 693,569 738,625 I +6. 5 1919 DQmestic consumption ••••• tbous. or gals •• ---------------·---- ····----·· --·-------- ----------- -·---···! 1919 St~cks ...................... thous. of gals.. 244,756 255,688 238,859 ---·------- -----·-----~---····· 1919 Pnce, Pa., 600° 111., "D"
at reiine~~;~~~;;;.~dolls. per gal.. • 283 • 293 . 246 ••••••••••• -----------~1---·---- ~ 1919
Production: Passenger cars ••••••••••••••••••• number.. 287,302 336,383 254,773 1, 781,792 2,429, 664 +36. 4
"hi Trucks .......................... uumber.. 28,846 31,072 22,161 172, 179 236,027 +37.1 <> pments:
By reilroads ••• ······-----------carloads •• Driveaways ••••••••• number of machines ••
I By boat ••••••••••••• number of machines ••
nternal revenue taxes collected on: Passenger automobiles and
46,359 40,976 1,018
motor cycles ............. thous. of dolls.. 11,457 Automobile trucks and A:t~~~ii(iaccessori.ii""""thous. of dolls ••
and parts •••••••••••••••. thous. of dolls ••
.Crude: RUBBER
lmports _____________________ thous. of lbs •• Consumption by tire mlrs~ •• thous. ollbs ••
P Wholesale price, Para, N. Y •• dolls. per lb ••
neumatlc tires: :rcductlon •••••••••••••••••••• thousands •• sl:Jcks, end of month •••••••••• thousands ••
Inner tE~:~ts, domestic •••••••••• thousands ••
§:'otctlon •••••••••••••••••••• thousands ••
8~c , end of month •••••••••• thousands •• Solid tl~::ents, domestic •••••••••• thousands ••
~otction •••••••••••••••••••• thousands ••
8~c , end ofmonth •••••••••• thousands •• pments, domestlc •••••••••• thousauds ••
fiDES AND LE.&.TBEB
Imports: · mdes
6°fC~es and sldns ••••••• thous. oflbs •• C a 1 ·······-----·-------thous. oflbs •• 0
att e hides ••••••••••••••••• thous. orlbs •• s~atskins.- ---------------•• thous. of lbs.-
St ckseepskins •••••••••.•••••••• thous. or lbs ••
o , end of month: 6ott/ hides and sldns ••••••• thous. orlbs .• c:u e hides ••••••••••••••••• thous. oflbs •• Sh and kip sklns ••••••••••• thous. or Jbs ••
Prices:eep and lamb sldns ••••••• thous. of lbs ••
Oree~ salted, packer's heavy c~t~ve steers •••••••••••••.• dolls. per lb ••
s ins, country No. L •••• dolls. per lb ••
1,258
2,877
49,080 37, 7Sll
.199
3,220 4,808 2, 785
3,888 6, 720 3,476
48 152 37
22,486 2,610
10,528 3,291 4,006
302,899 253,454 33,473 15,872
.143 ,158
49,219 48,300 1,100
6,839
887
2,130
70,589 33,466
.191
3,279 5,265 2,801
4,068 7,339 3,330
55 161 43
29,049 3,655
13,048 5,113 5,370
297,287 250,823 31,798 14,666
.158
.182
36, 165 43,613
882
5,887
710
3,476
60,379 34,235
.307
3,218 5,224 2,589
4,1X19 6,772 3,002
75
241,237 258,011 40,844
55,398
6, 787
27,331
499,498 Z46,766
317,859 320,138 48,841
73,619
7,655
23,361
373,841
+31.8 +24.1 +19.6 '
+32.9
+12.8
-14.6
-25.2
22,297 20,076 -10.1 i ----2i~7i3" ----2i;436" ··:.:i:6"! ,,
29, 418 28, 009 -4.9 . : ----28,"482" ---·29;25i" •":ti"6- i
645 327 I -49.5 :I 27~ ----·--siB· ---·-··a65· ·::29:r
49,033' 3,332
30,535 5,832 6,608
401,165 330,260 48,259 22,646
.199
.167
451,063 47,643
271,206 54,176 52, 165
242,983 28,073
117,787 44,347 38,317
-46.1 -41.1 -56.6 -18.1
i -26.5
~~=~~==~=~= ::::::::::: !':::::::: ........................ -·------------····--· •···•···••• ,--·----·j
::::::::::: ::::::::::: !::::::::1
1919 1919
1920 1920 1920
1920
1920
1920
1913 1921 1913
1921 1921 1921
1921 1921 1921
1921 1921 1921
1909-13 1909-13 1909-13 1909-13 1909-13
1921 1921 1921 1921
11H3 1913
123 104 149
83
76
826 191 34
I 112 \111
I 157
175
1
128 164
236 114
I 138
138 67
173 108 178
87 91 72 70
109 86
110 120 148
68
184 84
173 111
19
84
66
82
625 191 38
177 124 136
179 148 131
213 117 144
114 49
159 71
125
93 97 83 69
108 88
136 128 143
58
139 112 150
50
~I~~ 182 84
137
137
62
67
361 129
25
132 111 129
153 147 149
77 77 99
83 45 76 50 71
73 75 70 59
77 79
167 70 85
137
64
62
690 138
25
134 103 137
146 138 153
90 64
127
64 43 62 72 77
73 75 66 56
74 80
134
72
208 109
222 104 22
164
100
68
508 211
25
177 114 146
172 147 152
136 66 85
52 38 55 40 76
70 75 57 4S
78 ss
133
80
2431 118
235 123 23
98
70
50
-0.8
+11.1
+17.1 +7.7
+6.2 +17.9 +8.1
-40.3
-29.5
-26.0
731 +43.8
~~ ··::n 180 125 147
180 161 14S
+D.6 +11.5 -L9
+3.7 +11.4 -6.0
155 +12. 5 70 +10.5 98 +13.5
68 54 68 62.
102
69 74 5i 45
86 96
+29.2 +40.0 +23.11 +55.4 +34.0
-1.9 -1.0 -5.0 -7.6
+10.5 +15. 2

40
TREND OF BUSINESS MOVEMENTS-Continued
OTE.-ltems marked with an asterisk (•) NUMERICAL DATA j Per ct. I: Increase
have not been published previously In the <+> SURVEY or are repeated !or ~cia! reasons; or de-detailed tables covering back gUres !or these CUMULATIVE TOTAL crease
N
Corre-j items wlll be round at the end of this bulletin. 11124 sponding PROM ~ULY 1 (-) For detailed tables covering other items, see THROUGH LATEST month, last quarterly Issue or the SuRvEY (No. 30). In manu ciUie• JJiarch figuru are now
railable and mag be found in the apecial a t able on page Z9
January
----HIDES AND LEATHER-Continued
Leather p roductlon:
Sole 1eather ••• thous. of bks., bends, sides •• Skh·ers •••••••••••••••••••••••••••••• doz •• Oak and union harness •••••• stufJed sides •• Finished sole and beltlng •••• thous. o! lbs •• Finished upper ••••••••••• tbous. o! sq. ft ••
Stocks, end of month: Sole and belting •••.••••••••• thous. oCJbs •• Upper._ •••••••••••••••••• thous. o! sq. ft ••
Stocks In process of tanning: sole and belting ••••••••••••• thous. oflbs •• Upper •••••••••••••••••••• thous. or sq. ft ••
Exports: Sole ......................... thous. or lbs •• Upper __ .................. thous. o! sq. ft ••
Prices: Sole, oak, scoured backs,
hea'<'Y Boston ••••••••••••• dolls. per lb •• Chrome calf, "B" grades.do1Js. per sq. ft ••
Leather Produets
Belting sales: ~uallty •••••••.•••••••••.••• thous. ollbs ••
alue ....................... thous. or dolls Boots and shoes:
Production •••••••••••••••• thous. o! pairs •• Exports ................... thous. of pairs •• Wliolesale grtees--
Mea's Jack call, blucher .............. dolls. per pair ••
Men's dress welt, tan calf St. Louis ••••••.. dolls. per pair ••
Women's black kid, Goodyear welt, St. Louis •••••• dolls. per pair ••
PAPER AND PRINTING
Wood-pulp Imports
l\[echaniral.. ••••••••••••••••• -----short tons •• Chemical. ......................... short tons ••
Newsprint Paper
l'roduction ........................ short tons •• Shlpments •••••••••••••••••••••• - •• short tons •• mports •••••••••••••••••••••••• _ •• short tons.: I
E s xports •• ····················-····short tTII8 ••
tocks, end or month: At mills ••• short tons ••
Prlntlnr;
B ook publication: American manuracture •••••••••• editions •• Imported ••••••••••••••••••••••.• editions ••
Paper Boxes
roduction: p T otal. -------·····-·-----·····thous. of sq. !L.
Corrugated ••••••••••••••• thous. or SQ. tt __ Solid l!ber •••••••• _ ••••••.• thous. or sq. ft ••
peratlng activity: Total •••••••••••••.••• per cent of normal._
Corrugated ............ per cent or normal._ Solid l!ber ••••••••••.•• per cent or normaL
rice index numbers:
0
p Finished board-
1,373 34,597
129,736 23,819 76,340
172,898 387,500
92,907 149,(00
1,350 5,429
4.40 4.40
441 757
26,(51 381
6.25
4.85
4.25
17,660 88,565
128,772 123,253 107,594
1,682 28,417
456 178
295,168 211,686 83,482
72 68 85
Corrugated ••• _. ______ Jndex number •• Solld fiber ···-····-····----index number __
........................ raw materials-
85 test liners. __________ index number .. Chip ••••.••••••••••••• Index number •• Straw- •••••••••••••••• Index number __
Otber Paper Produets
oldlng boxes, orders •••• per cent of capacity .. bels, orders ............ per cent of capacity ••
F La R A
ope paper sacks, shipments •• index number •• brasive paper and cloth: ~ojest1c sales _____ ••••••• _________ reams ••
ore gn sales •• ·········-···--·----reams ••
BUTTONS
re sh-water pearl buttons: Production ••••••••••• _per ct. or capacity •• Stocks, end o! month ••• - .. thous. of gross ••
F
• No quotation.
64.2 108.2
.......................
89,961 8,384
38.4 14,495
cumu-January :MONTH latlve or Feb- 1923-24
Feb- ruary, 1922-23 1923-24 from ruary 1923 1922-23 ---
1,449 12,004 11,536 -3.9 1, :na 29,863 36,948 ................... --------··· -----·--
124,001 139,365 ···:mB46. '"203;338' ··+o:2·1 21,006 25,496 74,009 78,209 615,871 593,486 -3.6
171,247 154,270 ---------·- ........................ ........ , 381,722 390,357 ----------- ...................... ................
110,065 111,239 ---------------------- .................. 146,095 154,878 ----------- ....................... ................
1,695 1, 796 9,511 11,493 +20.8 5,958 4,002 52,263 46,(18 -11.2
(.40 5.25 ...................... ----------- --------4.40 (I) ...................... ----------- .................
us 442 3,933 3,318 -15.6 711 822 6,767 6,037 -10.8
26,591 30,301 227,990 216,208 -5.2 504 548 3,836 4,356 +13.6
:::::Ji 6.25 6.55 ----------- -----------4.85 4.85 ----------- -----------
II 3.85 4.25 ----------- ----------- ···-····i i
17,637 27,766 193,955 195,746 +0.9 124,178 97,774 851,430 786,485 -1.6
I
117,322 114,611 999,609 974,258 -2.5 115,427 ll4,415 999,778 961,311 -3.8 103,337 89,495 739,789 878,394 +18. 7
1,407 1,194 13,106 10,588 -19.2 30,288 23,197 ............................ ---··------ --------
I 529 638 5,184 4,672 -9.9 142 88 1,000 1,108 +10.8
315,376 301,870 2,328, 091 2,296,075 -1.4 229,575 213,177 1,593,609 1,682, 672 I +5.6 85,801 88,693 734,482 613,403 -16.5
78 751,·----·-··-· ......................... 75 76 -·······---87 75 -····--···· ---~-------.........................
....................... --··------/-----··---· ......................... ---------- ------·---- .......................... I
········--~--········· .. ....................... ·······---~---········ ........................... ..................... ------·---- ........................ ····--··I
81.0 10.1 I 83.0 92.0 -·----·---- ----------- -·----~------------ ...................... --------...................... ......................... ......................... ----·------ ......................
93,011 87,804 635,438 636,306 +0.1 8,529 10,352 85,795 84,661 -1.3
43) 53.4 14,237 I 13,399 ·---------- ·······----1--·-----1
1 .................. .,., .......................................... I
BABE YEAR
OR PERIOD
Jan.
--- --
1919 88 1919 157 1919 121 19.21 110 1921 145
1921 87 1921 93
1921 96 1921 98
1913 • 36 1913 79
1913 117 1913 (8)
1919 73 1919 68
1919 111 1913 57
1913 210
1913 153
1913 142
1909--13 197 1909--13 456
1919 111 1919 108 1913 584 1913 30 1919 96
1913 68 1913 39
1922 138 1922 146 1922 123
----·----- .............. ---------- .............. ---------- ..............
1922 111 1922 118
1922 1141 1922 130
1922 125
1921 121 1921 223
1921-22 91
1919 136 1919 98 I
; 1922 111 ' 1922 108 I
INDEX NUMBERS
1923 1921
Feb. Nov. Dec. Jan. Feb.
--,_ ~- ~---
77 73 69 73 65 169 186 158 150 129 117 113 99 108 104 99 92 88 93 85
135 124 124 132 128
85 93 93 89 88 92 90 91 92 110
' 100 88 86 84 81 100 92 91 91 89
69 88 44 52 65 56 63 69 61 67
117 101 95 98 98 (I) 163 163 163 163
62 49 45 62 59 60 47 41 55 52
110 98 82 96 96 65 75 63 45 60
210 201 201 201 201
153 153 153 153 153
142 142 142 142 142
169 186 215 107 107 383 455 382 347 487
100 105 103 112 102 100 102 102 107 100 489 592 630 587 564 33 36 52 47 39 97 100 99 119 127
78 88 72 56 65 43 58 89 86 69
133 126 113 130 139 143 139 137 142 154 115 101 67 108 111
............. ............. ------ .............. ... ............
................ ------ .............. ............. ............. ------ ------ ------ .............. ----..
I I
115 103 1161 105 104 121 103 102 99 97
122 106 105 97 94 134 110 97 91 91 125 105 119 108 Ill
146 142 132 134 142 208 121 146 191 146 105 118 112 89 109
129 114 89 132 136 113 115 100 91 93
83 94 116 99 85 113 117 115 116 115
Per ct. in ..
crease <+>
or de-crease (-) Jan. !rom Dec.
-11. -13. -4. -8. -3.
-1. -1.
-3. -2.
+25 . +9.
0. 0.
-5. -6.
+0. +32.
0.
0.
-9.
-0. +40.
-8. -6. -4.
-16. +6.
+16. -20.
+6. +B. +2.
+S.
7 7 4 0 1
0 5
1 2
6 7
0 0
2 1
5 3
0
0
4
1 2
9 3 0 3 6
0 2
8 . 5 2
3 +10.3 +2.4
-1.0 -2.0
-3.1 o.o
+2.8
+26.2 -23.3 +22.6
+3.4 +1.7
+!3.3 -1.8

TREND OF BUSINESS MOVEMENTS-Continued -
NoTE. Items marked with an asterisk (•) NUMERICAL DATA Per ct.J
have not been published previously In the Increase; SURVEY or are repeated for special reasons; (+} I
detalled tables coverin~ back figures for these Carre- CUliULATIVE TOTAL orde- ! BABE Items will be found at t e end ortbls bulletin. creaso I For detailed tables covering other items, see 192-l sponding FROM IULY I YEAR
last quarterly issue of the SURVEY (No. 30). month, THROUGH LATEST (-}I OR January MONTH cumu- PERIOD latlve !
In manu caaea March ligures are nom or Feb- 1923-24' amllable and may be found In the special January Feb- ruary, 1922-23 1923-24 from I Jan. table on page Z9 ruary 1923 19~23 --- --- -----~- -------- ---!--- --
GLASS AND OPTICAL GOODS I
Illuminating glassware: I Net orders _____________ per ct. or capacity_ - 41.2 51.3 68.9 ---------· ~ ----------- ................ '1921 134 Actual production ••••• per ct. of capacity_ 51.5 52.7 55.7 ---------- -~ ..................... -------- '1921 142 Shipments billed. _____ per ct. of capacity_ 40.3 57.1 55.2 .................... --------·--- -------- 11921 146
Spectacle frames and mountings: Sales (shipment~----------index number. - --------- .. -r-------- ---------- ---------------------- ............... 1913 407 Unfilled orders value} •••• iri'dexnumber. ..................... ... ________ .,._
- -- -~------- ·-------1 1919 68
BUILDING CONSTRUCTION
!BuDding Costs
Building materials: Frame house, 6-room s _____ inde:t number •• --------- .. ---------- ---------~ ----------- ----------- -------~ 1913 195
Bu!Drick houseE6-room •------index number. -..................... -.................... ----------- ........................ 1913 199 Bullding costs ( ngineering News
Record) --·------------------index number •• ----------- ----------- 1913 197 Concrete factory costs
Aberthaw) __________________ index number •• ----------- ----------- -------- 1914 197 Plumbing fixtures, 6 artlcles ••••• lndex number ----------- ----------- ---·---- 1913 186
Construction and Losses
uildlng volume ______________ lndex number •• .................... .................... .................... .. ..................... .. .................... .................. 1913 126 Contracts awarded (27 States):
Business buildings ••.••••• thous. of sq. ft •• 6, 6liO 7,961 7,044 57,571 56,830 -1.3 1919 64 Industrial buildings _______ thous. of sq. ft •• 3,029 3, 787 5,096 50,066 32,202 -36.7 1919 35 Residential bulldings ______ thous. of sq. ft.. 34,693 28,037 22,668 197, 9-lO 231,687 +17.0 1919 122 Educational buildings ..••• thous. of sq. ft.. 2,571 4,838 3,992 29,771 28,089 -6.6 1919 112 Other Jlubllc and semipublic
2,213 3,162 2, 789 27,000 22,771 -16.7 1919 84 0
buil ngs to ______________ thous .of sq. ft •• rand totaL ______________ thous. of sq. ft __ 49,867 48,036 41,611 362,912 372,753 +2.7 1919 83
on tracts awarded, value (27 States): Business huildings _________ thous. or dolls __ 34,068 40,550 30,999 277,866 275,407 -0.9 1919 92 wdustrial bulldings _______ thous. of dolls •• 19,723 17,057 27,518 251,284 208,123 -17.2 1919 51
esldentlal buildings ______ thous. or dolls •• 158,521 129,795 101, OiO 877,416 1,057,163 +20.5 1919 158 ~ducational buildings _____ thous. of dolls •• 15,927 26,735 22,108 174,719 173,784 -0.5 1919 140
ther public and semipublic
0 buildings Jo ______________ thous. of dolls 14,899 19,825 17,781 190,723 156,003 -18.2 1919 88
ire l=: total ________________ thous. of dolls •• 261,320 259,264 229,938 2, 103,568 2,178,479 +3.6 1919 101
gnited States and Canada.thous. of dolls __ 41,244 31,448 42,771 297,416 239,833 -19.4 1919 163 reat Britaln _________ thous. or£ sterling __ 857 .......................... 937 3,239 5,388 +66.3 1919 133
c
B
F
Lumber
D
outhern pine: ~~duction (computed) _______ M ft. b. m •• 452,214 447,9M 400,113 3,519, 738 3, 601, 0-lO +2.3 1917 109
0 pments (computed) ________ M ft. b. m •• 497,038 419,297 436,772 3, 525,690 3,544,471 +0.5 1917 123
s{ders (computed) •••••••••••• M ft. b. m •• 1>11,282 384,638 483,339 3, 702,906 3,598,203 -2.8 1917 130 E ocks,endofmo. (computed).M ft. b. m •• I, 068,919 1,094,418 1,118,834
---4i9~oar ---6is;ii74- 1917 84
P xrorts---------·-------------M ft. b. m •• 55,324 84,109 63,296 "+i5~:i- 1919 140 r ce, uB" and -------- I ~tter ------------dolls. perM ft. b. m •• 44.28 44.M 50.80 ........................... ................... 1913 220
oug fir: I ~~ductlon (computed) ••••••• M ft. b. m •• 470,776 553,749 403,561 3,578,644 4, 156,316 +16.1 I 1917 122 E Pments (computed) ________ M ft. b. m •• 473,990 528,681 480,289 3,399, 752 3,944,389 +16.0 I 1917 156
E xports,lumber --------------M ft. b. m •• 111,340 56,019 36,604 296,303 444,753 +50.1 I 1919 127 P xports, timber _______________ M ft. b. m •• 86,849 51,870 13,990 too.~ 463,229 +333. 7 1922 121
aU! rtel!l,No.1 common.dolls. perM ft. b. m •• 19.50 19.50 19.50 ............................. .......................... -------- I 1913 212
onua redwood: ~uction (computed) _______ M ft. b. m •• 38,673 44,367 43,896 390,405 410,069 +6.0 I 1918 99
0 :J:ments (comrcuted>-------M ft. b. m •• 36,997 38,847 52,740 372,934 344,671 -7.6 : 1918 150
111 r ~rs r~ived computed) ___ M rt. b. m •• 40,773 38,0-lO 59,658 425,532 309,535 -27.3 1918 235
a orrua wh1te pine:
'---~;:~~~-i
~pduction ___________________ M ft. b m •• 16,576 37,163 22,699 797,508 +25.1 1918 53 stJments ____________________ M ft. b. m •• 52,381 63,171 44,282 513,269 +16.5 1918 166
ichl~8softwood:·--------------M ft. b. m •• 470,725 528,127 367,597 ------·---- 1918 163
~~fduction ___________________ M ft. b. m •• 4,474 3,990 5,556 62,368 63,811 +2.3 1917 42 S~ents ____________________ M ft. b. m •• 3,896 4, 705 5,839 65,505 51,134 -21.9 1917 37
i hi h end of month _________ M ft. b. m •• 40,127 39,185 48,436 ----------- ......................... ................. 1917 44 c gsn ardwocd: §~uction ___________________ M ft. b. m •• 12,636 13,261 15,442 110,550 115, 40-l +4.4 1917 65 St~ments ____________________ M ft. b. m •• 9,287 11,723 13,600 118, 92-l 100,032 -10.8 1917 55
est sr;nd ofmonth _________ M ft. b. m •• 69,005 68,033 106,114 ............................ ......................... ---·---- 1917 48 ernp e: E~ducti~ (computed) _______ M ft. b. m •• • 74,101 102,345 59,148 995,729 1,114, 197 +11.9 1917 59
St P:'en d (computed) ________ M ft. b. m •• •127,838 140,747 116,557 1,031,079 1,004,689 -2.6 I 1917 117
orth ~ S.~~ of~o. (computed) .. M ft. b. m .• •966,689 931,023 766,391 ----------- ----------- .................... 1920 9-l
aro fc'ne: §~fducti':" computed) _______ M ft. b. m •• 47,530 49,784 41,090 405,461 393,253 -3.0 1919 120
orth pme_n (computed) _______ M ft. b. m •• 50,680 52,325 48,930 438,014 378, 9-l5 -13.5 1919 134
L ern pme: umber-§~duction _______________ M ft. b. m •• 37,552 36,347 33,702 340,647 383,712 +12.6 1920 86
Lath- pmenta ________________ M ft. b. m •• 41,720 46,406 42,883 419,347 355,159 -16.3 1920 99
§~Fuction ________________ thousands-- 8,979 8,899 9,671 97,518 95,877 -1.7 1920 9-l
orthem h~~~;---------------thousands •• 9,106 12,105 10,845 103,451 91,862 -11.2 1920 135
rrt:ucti<t:---~---------------M ft. b. m •• 16,528 18,765 22,320 190,585 186,370 -2.2 1913 71
men --------------------r.I ft. b. m •• 17,951 19,136 19,109 210,002 184,277 -12.2 I 1913 50
s
c
M
w
N
N
N
;·: :.·.:-:-=-..:.-:..
INDEX NUMBER!'= Per ct. in
19~3
Feb. Nov. D~c.
-- ----
188 144 116 154 159 143 155 164 127
424 539 472 86 91 95
11)8 203 2M 201 206 207
205 217 218
197 199 199 182 184 lSI
105 125 101
76 75 80 40 {4 36
112 IM 151 208 184 181
124 123 83 89 111 102
92 88 115 64 100 54
143 20'J 193 222 218 2511
123 123 90 107 135 125
191 133 113 79 10.1 lOS
9-l 100 89 99 97 87
108 97 100 82 81 81
124 109 155
221 184 183
116 160 136 149 154 132 146 181 235 97 413 691
212 201 190
117 185 100 185 182 110 208 145 102
43 181 10-l 139 191 176 139 237 242
32 29 34 33 39 34 46 44 44
56 49 68 43 50 40 47 38 38
54 134 8l 106 109 101 87 123 119
120
l 153 12-l
152 165 138
84 55 70 86 88 66
101 54 72 171 113 90
59 46 50 52 68 50
11124
crease (+)
ordecrca.o;e (-) Jnn. from Dec.
Jan.
--
112 142 113
500 8:1
2M om 220
200 JSJ
130
72
'1~ 134
ll8 107
101 46
224 160
103 122
184 121
107 112 121 78
109
192
135 147 4H rm 212
103 130 142
32 164 178
28 22 38
46 30 31
68 116 110
139 • 157
93 83
9-l 143
44 49
F~h.
--
uo 146 160
520 77
2M I 207
225
202 183
128
!!6 30
139 25.1
140 103
120 40
183 268
137 121 :1
+24.5 +2.3
+41.7
+2.2 -7.2
0.0 0.0
+2.3
+1.0 0.0
-1.5
+19.7 +25.0 -19.2 +~'l.2
+42.4 -3.7
+19.0 -13.5 -18.2 +67.0
+3.1.1 -0.8
140 I, .• ____ 11 .• -23.8
II ., I i
106 I 95 !!6 80
165
193
159 1M 223 361 212
118 136 132
71 198 199
23 27 37
~I 37
9-l 126 106
145 163
90 93
93 190
50 53
-0.9 -l5.1i -2ll.ll +2.4
+52.0
+0.6
+17.6 +11.5 -49.7 -40.3
0.0
+14.7 +5.0 -6.7
+ 124.2 +20.6 -12.2
-10.8 +20.8 -2.3
+4.9 +26.2 -1.5
+38.1 +10.1 -3.7
+4.7 +3.2
-3.2 +11.2
-0.9 +32.9
+13.G +6.6
• Revised. • 12 months' avertl6te May to April, inclusive.

42
TREND OF BUSINESS ·MOVEMENTS-Continued
NOTE.-ltems marked with an IISterisk (•) NUMERICAL DATA ~~:e~ have not been published previously in the (+) SURVEY or nrc repeated for special reasons; 1---------;
1,---......,.,--------1 d
detailed tables covering back figures for these .
1
Corre- 1 CUMULATIVE TOTAL :e:e Items will be found at the end of this bulletin. sponding
1
.. 1 ( ) For detailed tables covering other items, see 192! month, TIJRR~u~~u;:TEST cu~u- 'r
last quarterly issue of the SURVEY (No. 30). January MONTH lative In manu cases l.'tlarch ligures are now ----,-----11 or Feb· ----'::..:::.;=:._--llt923-24
a~allable and may be found in the •pecial January Feb• ru19nry, I 1922-28 1928-!H from
table on page Z9 ruary 23 1922-23
BASE YEAR
OR PERIOD
I INDEX NUMBERS Per
I ct.
--------;----1 in·
I (~ 1923 192! I or de-
l crease ----,---1--1 1;;1.
! , . Dec. ----,--~--11--11--
Jan. Feb. i Nov.: Dec., Jan. Feb. from
- ----- ,--:------BUILDING CONSTRUCTION-Contd.
Lumber-Continued Northern hardwood:
Productlon ••••.•••••••••••••. M ft. b. m.. 43,525 Shipments .••••••••••.•••.•••• M ft. b. m.. 28,319
Walnut lumber: Production ••••••••••••••••••• M ft. b. m .• Shipmcnts ..••••.••••••••••••• M ft. b. m •• Stocks •••••••.•••••••••••••••• l\1 ft. b. m ••
Walnut logS: Purchases .•..•.••••••• 1\I ft. log measure •. Made Into lumber and
2,561 3,088 8,646
2,308
51,576 35,592
2, 702 3,568 7,819
2,383
veneer •••••••.••.•••• M ft. log measure.. 2,122 2, 235 Stocks •••••••••••••••.. l\I ft. log measure.. 3, 634 3, 782
All lumber: Production, 10 spccies ••••••••• M ft. b. m •• •2,229,295 2, 425,712 Exports, planks, joists, etc •••• M ft. b. m.. 218,557 159,215 Retail sales, Minneapolls ••••• l\1 ft. b. m.. • 4,413 3,164
Composite lumber prices:u Hardwoods •••••••••• dolls. perM ft. b. m.. 43.71 45.30 Softwoods ••••••••••• dolls. perM ft. b. m.. 32.80 32.36
Wooden Furniture Shipments ••••••••••• dolls., average per firm •• Unfilled orders ••••.••• dolls., average per firm ••
Flooring Oak flooring:
Production ••• ~ •••••.••••••••• l\f ft. b. m •• Shipments .•••••••••.••••••••• M ft. b. m •• Orders booked ••••••••.•..•.•• M ft. b. m •• Stocks, end of month .•.••••.• M ft. b. m •• Unfilled orders, end of month.M Ct. b. m ••
Maple flooring: Production ••••••••••••.•••.•• l\1 ft. b. m •• Shipments •••••••••••••.•••••• M ft. b. m •• Orders booked •••••••••••••••• M ft. b. m •• Stocks, end ofmonth •••• · ••••• M ft. b. m •. Unfilled orders, end or month.!\1 ft. b. m ••
Brlek Clay fire brick (computed):
Productlon •••••••••••••••••••• thousands •• Shipments •••••••••••••••••••• thousands •• Stocks, end ofmonth •••••••••• thousands •• New orders •••••••.•••••••.•••• thousands ••
S Unfilled orders •••••.•••••••••• thousands ••
Illes brick (computed): Production •••••••••••••••••••• thousands •• Shipments ••••••••.••••••••••• thousands •.
F Stocks, end of month •••••••••• thousands .•
ace brick (32 Identical plants): Production •••••••••••••••••••• thousands •• Stocks on yards u .•..•••..•••• thousands •• Unfilled orders •••••••••••••••• thousands ••
P Shipments •••••••••••••••••••• thousands ••
aving brick: . Production-
Actual ••••••••••••••...••• thousands .• Relation to capacity •••••••.. per cent ••
Shipments •••••••••••••••..••• thousands .• Stocks," end or month •••..••••• thousands •• Orders received ••••••••••••••• thousands •• Cancellations •••••••••••••••.•• thousands •• Unfilled orders, end of month •• thousands ••
Prices, common brick: Wholesale, red, New York dolls. per thous ••
Cement Production •••••••••••••••••••.• thous. of bbls •• Shipments ••••••••••••••••••••• thous. of bbls •• StoCks, end or month ••.••••••• thous. or bbls •• Price, Portland:
Chicago district. •••••••.••• dolls. per bbL.
C Lehigh Valley ••••••••••••.• dolls. per bbL.
oncrete paving contracts: ~otal ••••••••••••••••••• tbous. of sq. yds ••
oads ••••••••••••••••••• thous. or sq. yds •• Roofing
Prepar.ing roofing:
R Sh1pments ••••••••• thous. or roof squares •.
ootlng felt: ~{~~on, dry felt.. ••••••••••••••• tons ••
Total ••••••••••••••••.. _ ••••••••• tons ••
Recel Dry felt •••••••••••..•••••••••••• tons ••
pts:.
~r£~i;~:::::::::::::::::::::::i~::: ,. Revised. b 1annary, 1923.
30,596 52,964
30,136 31,080 42,141 38,595 li6, 554
10,225 8,109
14,736 21,831 18,{1.55
00,347 54,111
198,315 66,080 69,833
13,400 15,391 42,298
17,366 61,575 33,592 11,231
19,664 37
9,491 91,737 6,834 1,164
51,419
20.00
8, 788 5,210
14,155
1. 72 1. 75
4,013 2,613
2,380
14,662
12,385 1,982
16,438 6,602 1,053
29,033 30,441 28,688 38,222 53,052
9, 752 8,698 8,653
22,747 19,534
59,511 57,594
201,755 67,616 79,600
17,355 18,247 41,407
19,284 67,997 40,524 15,363
19,571 45
6,442 102,498 11,136
110 55,482
20.00
8,588 5,933
16,811
1. 75 1. 75
4,562 3,421
2,915
16,263
13,057 1,623
14,003 5,225 2,229
43,938 28,823
2,028 2,410 8,351
2,337
1,582 2,412
224,276 304,642
272,813 303,065
1 I I +21.6
-0.5
14, 057 20, 779 +47. 8
I 17,094 19,742 +12. 2
.................... -----------13, 127 18, 522 +41. 1
. 11,699 17,322 +48.1
2, 020, 775 18, 473, 838 19, 790, 799 132, 534 949, 832 1, 267, 91l6
+7.1 +33.5
I -16.5 3, 753 98, 403 82, 155
48.52 36.12
b 34,282 b 68,575
24,421 25,031 33,458 25,301 li6, 936
11,333 11,354 16,033 25,539 40,200
··········· ·······-··· 1-----··· ··········· ........... , ....... . • I
:::::::::::::::::::::: 1::::::::'
204,206 206,289 210,087
236,586 231,754 250,295
+15.9 +12.3 +19.1
101,106 89, 194 ! -11. 8 I
102, 301 79, 302 'i-22. 5 113, 151 73, 623 -34. 9
............................................................... ··········· ···········1-·······
! I
1913 1913
1922 1922 1922
1922
1922 1922
1913 1909-13
1919
1921 1920
1920 1920
1913 1913 1913 1913 1913
1919 1919 1919 1919 1919
oo, 094 435, 066 456, 001 1 +5. o : t919 sa. 323 426, 880 433, 031 I + 1. 4 , 1919
1~: m ···455;979- ---465;438. ··+2.-r 1 mg 88, 736 ••••• 1 1919
14,541 10~~~~~- ----~~:;~~-~-~~~~~- 1919 14,417 _ 99,728 os,606
1 -1.1 1 t9t9
;~~ ~~-~~~~~~ ~~~~~~~~~~~ ~~~~~~~~~! ;;;; ~~; ~ .--·i59;983" """i47;266" !""::7:9"1; II~~~
' li
~~~~~~~~~~ ~ ~~~~~:~=~== ~~~~~~~~~ ~~~=~~=~m ·········- ·········-- .....••.... 1··----··' .......... .
20.00 ·•••••••••• ... · •••••••• i 1913 !
8, 210 I 83, 152 92, 022 + 107 I' 1913 1913 1913 ~~: Wa ----~:~:. ----~:~~- --~~:~.1.
}· ~ ··········· ·······---- --------1 1913 - ••••••••••• -·-········ •••••••• , 1913
6,272 4, 725
1,952
42,811 29,755
20,182
48,145 36,447
20,868
+12.5 +2.3 :
+3.4
14,495 ••••••••••• ••••••••••• •••••••• i 11,889 1,906
13,514 5,548 2, 331
................................................................ ·---------- ...................................... . ----------- ........................................ ... ................................................................... '
.....................................................................
1919 1919
1919
1923
1923 1923
1923 1923 1923
148 149
124 128 84
168
150 94
102 73 32
115 71
85 54
155 114
112 125 82
160
119 116
92 74 20
116 73
83 51
412 366 402 417 494 548 283 281 695 785
139 113 112 96 173 113 162 165 94 105
128 114 118 126 so
102 102 111
129 191 149 137
305
104 76
102
158 214
66 62
92
89
106 122
98 91
105
111 105 118 131 95
103 103 109
102 208 186 98
305
107 82
121
173 214
141 138
94
00
97 79
88 95
206
I ; .!
I 90 114 154
168 158 112
167 151 l42 136 107 160 83 90 85
179 177 158 ~
176 157 160 187 212 174
112 94 101 82 96 123 67 31 23
104 104 105 63 64 66
182 +18.5 142 +25. 7
150 +5.6 185 +15.5 77 -9.6
163 +3.2
168 +5.3 181 -K-1
110 +8.8 89 -27.2 17 -28.3
109 +3.6 65 -1.3
99 36
79 26
76 •••••• 41
459 300 451 477 457 517 494 620 600 461 457 428 520 658 780
118 116 102 83 75 68 64 73 104
143 157 141 40 40 49
107 97
133 87 64
69 61
105
92 95
132 92 63
43 61 99
111 107 143 128 74
95 110 101
435 -3.7 507 -2.1 470 -31.9 425 -1.0 732 -6.2
97 -4.6 7a +7.3 61 -41.3
147 +4.2 51 +4.7
117 114 145 131 85
123 130 99
+u +6.4 +1.7 +2.3
+14.0
+29.5 +18.6 -2.1
138 200 105 128
134. 229
I 1 123 50' 276
+11.0 +10.4 +20.6 +36-S
93 91
122 147 80 110
------ :::::r:::: ··--·- -0.5 +21.6 -32.1 +11.7 +62.9 -OO.S +7-9
------ •••••• 1. •••••• ••••••
274
164 139 62
166 200
120 96
124
100
81 66
104 99 74
290
130 87 94
163 197
106 103
98
93
87 85
Ill 84 71
305
115 70
126
170 197
00 76
114
91
101 82
107 113 93
305
12 80
150
173 197
102 100
uo 101
106 67
0.0
-2.3 +t3.9 +18.8
+1.7 o.o +13.7 +3U
+22.5
+t0.9
+5.4 -18.1
91 -14.& 89 -:n 9
197 +111. 7
10 Includes hospitals, public buUdings social rellgi d 'alb 'ldi t u Prices are averages or quotations rePorted 8s ott~~~ w::~Fihe to'ftowftrg ~~lj!'ly shown separately in the Survey of Current Bnsiness. 11 Represents stocks ot tlnished brick on yards d d t in 1 d r d · . on · JIIpara·
ble to data prior to September, 1923. an oes no c u e orme br1ck In kUns as reported prior to September, 1923. Current data therefore are nnt co II Ten months' average, ~arch to December, inclusive.
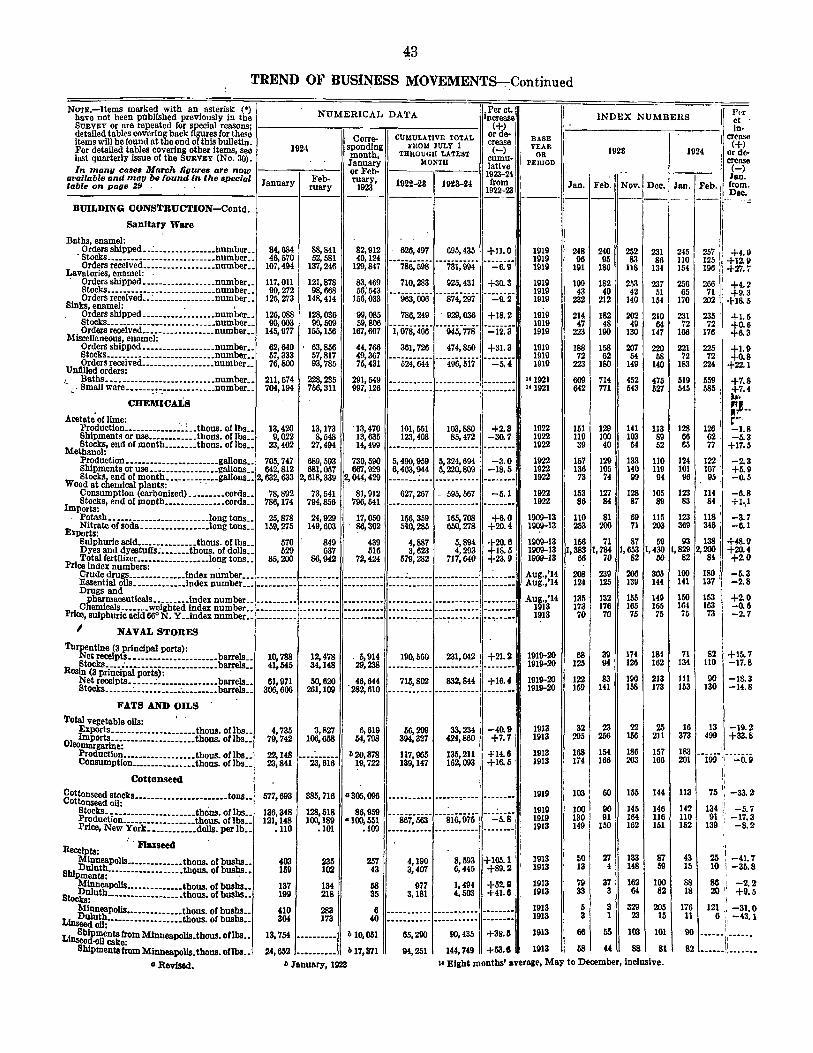
43
TREND OF BUSINESS MOVEMENTS-:-:Continued
NotE. Items marked with an asterisk (") NUMERIC.•L DATA 1Per ct. l I have not been published previously in the "' ncrease 1 SURVEY or are repeated for special reasons; 1-------.,.------..--------11 (+l II detailed tables covering back figures for these or de-items will be found at the end of this bulletin. Corre- CUMULATIVE TOTAL crease
1
F d t b) . th . 192-l sponding FROM JULY 1 or detalle a es covermg o er 1tems, see th THROUGH LATEST I (-) last quarterly issue of the SURVEY (No. 30). J~~~ary .MONTH cumu· In many cases March ligures are now 1---~---11 or Feb· 11----.----11 lat!ve
BASE YEAR
OR PEIIIOD
II P<·r ct ·
11---------------~~------ ln-
1 ~~+>
INDEX NUMBERS
1928 1924 , or de-crease
'(-) available and mag be found in the special January Feb· ruary, 1922_23 1923-24
1~~~4
table on page 211 ruary 1923 1922-23
BUILDING CONSTRUCTION-Contd.
' .. I 1---.---1 Jan.
___ -J-au_. -F-eb_·. _N_ov_. ,-D-ec_. ~~- :eb.j __ i~~~
Sanitary Ware
Baths, enamel: Orders shipped. -~----···········humber •.
· Stocks ••••••••••.••••.••••••...•• number •• Orders received •••••••••••••••••• number ••
Lavatories, enamel: . · Orders shipped •••••.•••••••••••• number ••
Stocks ••••••••••.•••••••••••...•• number .• Orders received •• : ••••••••••••••• number ••
Sinks, enamel: . . Orders shipped •••••••••••••••••• number •• Stocks •••••••••••••••••••••••..•• number •• Orders received ••••.••••••••••••• number •
Miscellaneous, enamel: • Orders shipped •••••••••••••••••• number •• Stocks •••••••••.•••••••••••••.••• number •• Orders received •••••••••••••••••• number.
U nfllled orders: • Baths ••••••••••••••••••••••••••• number ••
.. Small ware •••••• :~·.··········--·number ••
CHEMICALs
84,684 46,570
107,494
117,011 90,272
125,273 I
126,088 90,003
145,977
62,640 57,333 76,800
211,674 704,194
88,841 52,581
137,246
121,878 98,668
148,414
128,036 90,509
155,156
63,856 57,817 93,785
228,235 756,311
82,912 40,124
129,847
83,469 56;543
156,033
99,085 59,806
167,607
44,766 49,367 75,431
291,549 997,126
I
626, 497 695, 435 I + 11. o ... 786~598. --·7si~994- 1··::5~9·
no. 283 925, 431 1 +30. 3
r··iiiiS~ooo· ···874."297- ···::ii::r 786, 249 . 929, 0361 + 18. 2
"i;::::!~:- ···::::·::·1-~~:~:-
~~~:~~~~~ :::~~~~~~~] ~~~~~~~ Acetate' of lime: , .
l'roduction •••••••••••••• ~~--thous. otlbs.. 13,420 13,173 '13, 470 101, 551 103,880 +2. 3 Sblpmentsoruse •••••••••••• thous.otlbs •• 9,022 8,548 13,635 123,408 85,472 -30.7
Met~t:Of:• e~d ofmonth •••••••• thous. oflbs.. 23,402 27,494 14,499 ••••••••••••••••••••••••••••••
1919 1919 1919
1919 1919 1919
1919 1919 1919
1919 1919 1919
111921 "1921
1922 1922 1922
Production ••••••••••••••••.•••••• gallons.. 705,747 689,503 730,590 s, 490,959 5, 324,694 -3.0 I 1922 Shlpmentsotuse ••••••••••••••••• gallons .• 642,812 681,057 667,929 6,403,944 5,220,800 -18.5 1922
wo:J~~k~:~1~~~~~~:-,·····:····gallons •• 2,632,633 2,618,339 2,044,429 ---6-2-7 ••. 2~6-7-- -~-5-9-:.-56--7-- --=
5-.-
1·-JI\ 1922
Consumption (carbonized) ••••••••• cords.. 78, 892 73, 541 81, 912 . ., 1922 Imp~~~~~s, end of month ••••••••••••••• cords.. 786,174 794,856 796,541 ···-
1
::.-
3
-
5
-
9
-- ----
165
·-.-
7
-
08
--- ···+·
6
·-. 0--~~ 1922
Potash ••••••••••••••••••••••••• Jong tons.. 25,878 24,929 17,050 "" 1909-13
E Nitrate of soda ••••••••••••••••• long tons.. 159, ps 149,603 86,302 MO, 285 6.50, 278 +20. 4 1 1909-13
248 96
191
100 43
232
214 47
223
188 72
223
609 642
240 95
186
182 40
212
182 48
190
158 62
180
714 771
151 1129 119 100 39 40
157 136 73
153 86
no 253
129 105 74
127 84
81 200
252 83 us 253 42
140
202 49
130
207 54
149
452 543
141 103 54
133 140 99
128 87
69 71
231 86
134
237 51
154
210 64
147
220 58
140
475 627
113 89 52
110 119 94
105 89
115 203
I I
245 2571 +4. p 110 125 +12.11 154 19611 +27. 7
256 266 +4. 2 65 71 +9.3
170 202 +18.5
231 235 . +I. 6 72 72 +0.6
166 176 +6. 3
221 72
183
519 545
128 66 65
124 101 96
123 83
123 369
225 72
2'.14
+1.9 +0.8
+22.1
559 ' +7.8 585 i t?··
, r'-· I t'
126 ' -1.8 62 ' -6.3 77 I +17,5
I
122 I -2.3 107 1
1
+5.9 95 ' -0.5
114 84
118' 346.
-6.8 +1.,1
-3.7 -CI.1
IJiorts: I Sulphuric acld ••••••••••••••• thous. of Ibs.. 570 849 439 4, 887 5, 894 +20. 6 1909-13 156 71 87 59 93 138 +48. 9 Dyes and dyestuffs~ ••••••• thous. of dolls.. 529 637 516 3, 623 4, 293 +IS. 5 ~~~= 1, 383
66 I, 'fa I, 6~ I, •gg I, 8~ 2, ~ ++2lJ: t
Pi Total fertilizer •••••••••••••••••• long tons.. 85,200 86,942 72,424 579,282 717,640 +23. 9 ... ..-
r ce index numbers: . Crude drugs •••••••••••••• lndex number............. •••••••••• •••.••••••• ••••••••••• .••••••• Aug.,'l4 ~~:;t~Sns ............. lndex number... •••••••••• ••••••••••• ••••••••••• I Aug.,'14
~harmaceutlcals ••••••••• lndex number.. • •••••••••••••••.•••••••••••••
1
, Aug.,'H
ce, sulphuric acld66° N. Y •• index number.. ••••••••••• ••••••••••• •••••••• 1913 l'rl C emicels .•••••• weighted Index number.. •••••··•••• ••...••••••
1
........ 1 1913
I NAVAL STORES . . :'
~ntine (3 principal ports): I I et recelpts •••••••••••••••••••••• barrels.. 10,788 12,478 . s, 914 190,560 231,042 +21. 2 1919-20
Ros~'(~k~illict~&iiiiir'is):·············b~s.. 41,545 34, 1(8 29,238 ••••••••••• ----~------~------·· 1 191o-20
r~""'';~~~:~:~:::::l:::::l::: .:::m .,"/:WI .J::~l ---'~~- ___ "':~'-! ~··-~-,~ ~gfg:~ ~~~~ .. I
~porttss ••••••••••••••••••••• thous. Ot[lJbbs.. 49,7735 06,3,8
65827 6,
798619
356,
3209
27 42334
,,823460
-+470..
79 Ill m:
01 por ••••••••••••••••••••• thous. o s.. 7 , 42 1 54, 94,
eopnargarine:
c~=~~on::::::==========~t~::~m::: ~m --·23;6i6. b~:~~ m:m f~~~ ~ft: 1 m: CCootttot nseed stocks~:~~~:~~: ••••••••••• tons.. 577,693 385,716 "300,0961' .•••••••••••••••• , •••.••••••• .!,' 1919
onseed oil: ~tocks •••••••••••••••••••••• tho'us. oflbs.. 136,348 128,518 86,959 •••••••••••••••.•••••. ---~----! 1919 pr!JducNt!on.y.···k·············thous. oflbs.. 121,148 100,189 •100, 551 867,563 816,975 -5.8 }~f~
nee, ew or •••••••••••• dolls. per lb.. .no .101 .109 ••••••••••••••••••••••••••••••
Receipts: : . Fluseed
tf~n~olis •••••••••••.•• thous. of bushs •• Sblpme:~: •••••••••••••••••• thous. of bushs ••
j}l~~poUs •••••••••••••• thous. ot bushs •• Stocks: ut •••••••••••••••••• .thous. ot bushs ••
403 159
137 1119
410 304
235 102
134 218
283 173
t:~nnt~polls •••••••••••••• thous. ot bushs •• Linseed ~u:·················-thous. or bushs ••
LinsSeebldpm11ents from Minneapolls.thous. otlhs.. 13,754 ••••••••••
-o cake: Bblpmeuts from Minneapolls.tboUll. otlhs.. U, 652 ••••••••••
257 43
58 35
4,190 3,407
977 3,181
1,494 4,503
+52.11 +41.0 '
6 ••••••••••• ·······-···· •••••••• '
b 10, ~; ----~~~~~- ----~~~~- ·:;;~;-1 b 17,371 94,251 144,749 +53.0
1913 1913
1913 1913
1913 1913
1913
1913
208 124
135 173 10 I
68 125
122 169
32 295
I
239 125
132 176 70
39 94
83 141
23 256
206 139
155 165 75
174 126
190 158
22 156
1
168 154
i 174 I 166
I 103 i I 100 I I 130 I 1 149!
186 203
I I
I ~I I 79
33
~I
60 155
90 145 91' 164
1.50 162
27 4
37 3
3 1
55
44
133 148
162 64
329 23
103
88
305 14{
149 165 75
184 162
213 173
25 211
157 166
144
146 116 161
87 59
100 82
205 15
101
81
"Revised. b January, 1923 u Eight months' average, May to December, Inclusive.
190 141
150 164 75
71 134
111 153
16 373
183 201
113
142 110 152
43 15
88 18
176 11
180 137
-5.3 -2.8
153' +2.0 163 -0.6 73 -2.7
82. +15.7 110 ' -17. s 90
130 -18.3 -14.8
13 -19.2 400 ' +33.8
' -·i9n··=o~o
!: 75 I; -33.2
134 i1 -5.7 91 •: -u·. 3
139 ,· -8.2
·• 25 I -41.7 10 i -35.8
86 I 20 ,. I
-2.Z +9.5
121 .. -31,0 6. -43.1
[I

44
TREND OF BUSINESS MOVEMENTS-Continued
.NoTE. Items marked with an asterisk (•) NUMERICAL DATA Per ct. have not been publlshed previously in the Increase SURVEY or are repeated for special reasons; 1------------------ <+> deteUed tables covering back figures ror these or de-Items will be round at the end orthls bulletin.
19U Co'Jt cu~~~n;':i,i~AL crease
For detailed tables covering other Items, see spon thug TD!Iouax LATEST (-) last quarterly IsSue or the SURVEY (No. 30). mon • MO- CUlllU·
January ~·A 1 tl In many caae• JJiarch figure• are now ------ or Feb- J,'----:-----11 a ve
BASE YEAR
OR I'EIIIOD
INDEX NUMBERS
1928
Per ct. In-
available and may be found in the apecial January Feb- ruary, 1~24 I table on page za ruary 1923 1922-13 1928-21 !922-
23 J'an. Feb. Nov. Dee. J'an. Feb.
crease <+) or de· crease (-) 11111. from Dec.
FOODSTUFFS Wheat
E1ports, including Hour ••..•• thous. of bushs •• Visible supply •••••••••••••••• thous. or busbs •• Receipts, principal markcts .•• thous. or bushs ••
.Shipments, prin. markets ..... thous. or husbs •• Wheat Hour:
Production._ .............. thous. of bbls .. Consumption .............. thous. of bbls •• stocks ..................... thous. or bbls ..
Prices: No. I, northern, Chicago .. dolls. per bush .. No.2, red winter, Chicago. dolls. per bush •• Flour, standard patents,
Minnenpolls ............ dolls. per bbl.. Floulj winter straights,
Kansas Clty ............ dolls. per bbl.. Corn
Exi,JOrts, Including meal ...... thous. of bushs .. 'VIsible supply ................ thous. of bushs •• Receipts, principal markets •• tbous. of bushs •• .Shipments, prin. marke!ll ..... thous. or bushs .. ·Grindings (starch, glucose) ... thous. of bushs .. Prices, contract grades,
No.2, Chicago .............. dolls. per bush ..
Other Grains -oats:
Receipts, principal markets ................ tbous. or busbs ..
Visible supply ............ thous. ofbushs .. E%ports,fucluding meal..thous. of bushs .. Prices, contract grades,
Chicago ................. dols. per bush .. Barley:
Receipts, principal markets ................. thous. or bush ••
E%ports ................... thous. of bush .. l'rice1 fair to good, malting,
. Chicago ................. dolls. per bush ..
.Rye: Receipts, principal .
ruarkcts ............... tbous. ofbushs •• Experts, including !lour •• thous. of bushs .. Price, r-io. 2, Chlcago ..... dolls. per bush ..
Total Grains
'Total grain uports,lncl. Jlour .thous. or bushs ••
Argentine Grain E:rports:
Wheat Jlour ............... thous. of bbls •• Wheat .................... thous. or bushs •• Com ..................... thous. or bushs .. Oats ...................... thous. or bushs .. Flaxseed ................. thous. or bushs ••
'Visible sur.ply: Whea ................... thous. or bushs •• Com ..................... thous. or bushs .. Fluseed .................. thous. or bushs ..
:Rice: Other Crops
Receipts at mllls ........... thous. or bbls .. Shipments-
Total from mllls .... thous. of pockets •• Through
New Orleans ..... thous. or pockets .. Stocks, end of month,
at mllls ............... tbous. of pockets .. ~mports ................ pockets (100 lhs.) ••
• %ports ................ pockets (100 lbs.) .• _..pples:
Cold-storage holdings (1st of ro.llowiug montb) •• thous. or bbls ••
P Car-lot sh1pments ............... earloads ..
otatoes, car·lot shipments .......... carloads •• Onions, car-lot shipments ............ carloads .. -gttrus !ruft, car-lot shipments ....... earloads ..
ay, rece1pts ............................ tons •• Cattle and Beef
12,201 194,616 15,875 11,200
au,ooo 49,299 <>7, 150
1.133 1.106
6.195
5.250
3,106 10,513 30,600 19,648 6, 758
• 759
16,208 17,530
639
.474
299 2, 916
• 705
1,807 821
.725
17,066
113 1,801 3,071 4,478 6,732
6,290 1,000 3,600
1,076
1,105
229
2,019 44,876
303,950
• 7,843 7,961
18,983 2,411 9, 735
100,367
·Cattle m?vement, primary market: Rhece1pts ....................... tbousands.. 1,884 S !Pments, tetal ............... thousands _ 712 ~~•pments, stocker and reeder.thousands:. 243
.B C aughter ...................... tbousands 1 155
ee products: •• ' Inspected slaughter produc •• thous. of Jbs.. 455,002 ~rparent consumption ...... thous. or Jbs .. • 419,003 cof:f,:.:ag;;b.oiiiiDiis:·--·---thous. or lbs.. 9, 899
(end of month) ............ thous. o! lbs .. • 102,655 .
"Reviled,
10,010 104,500 10,803 10,616
10,286 8,711 7,200
1.174 1.127
6.306
5.350
3,542 20,534 43,442 21,213 7,152
. 797
18,778 17,741
485
.493
613 3,381
.740
1,938 402
.720
15,061
0,250 600
5,200
580
927
203
1;680 31,868
177,314
5,966 7,995
10,862 2,092
11,603 103,963
1,457 540 170 915
380,936 373,7331 11,669
97,874
---11~---11
12, 197 173,701 121, 226 -30. 2 1~: Ws ···asa;27o· ···28ii~ius· ·::iu~o· 10,740 211,871 141, 746 -31. 7
0,425 7,084 7,700
1.24! 1.350
6. 713
5.569
8,894 29,877 31,287 16,533 5,336
• 737
02,740 80,591
90,568 -2.3 . 78,042 -2.0
75, 749 14,178 -81. 3
---248~364- ···20a~s29· ·::is:u· 157, 376 114, 685 -27. 1
! .... ::·.~~~- ----~~~::. +U I
16, 023 171, 364 172,993 + 1. 0 27
' = ""2i;242' ----·7;499" ·::64~7" .457
1,191 2,556
.666
4, 749 5,974 .864
29,222
b114 b 12,038 b 12,593 b7, 216 b8,027
5,180 800
2,600
392
562
309
15,393 30,743
8,424 -45.3 36,045 +20.2
62, 241 23, 388 -62. 4 30, 514 11,659 -70. 5
325,590
557 58,362 84,673 11,451 26,784
162,986
598 42,720 68,070 15,187 16,638
-40.0
+7.4 -26.8 -10.6 +32.6 -37.7
... ................................................ -·------.. ................................................... --------
7,680
6,807
2,514
6,980 -9.2
6,430 -5.5
1,602 -36.3
1913 1013 1910 1919
1014 1919 1919
1913 1913
1913
1913
1913 1013 1919 1919 1913
1013
1918 1913 1913
1913
1913 1913
1913
1913 1913 1913
1013
1913 1013 1913 1913 1913
1913 1913 101.
1919
1919
1919
3~= ---442;'058" ''"iso;aar ·::49:2" m~ 334, 215 2, 413, 511 1, 782,945 -26.1 1919
3,877 ••• 6, 257 1 '9i;ai2" ""ii4;68ii' '+25."6"
13,481 154,083 157, 165 +2. 0 1,398 10,398 2G,833 +7.4
10, 665 49, 671. 50, 557 + 19. 0 69,014 635,898 683,522 +7.5
. 1,4271 •560
210 •871
16,746 8,047 3,741 8,606
16,5!4 7,509 3,509 8,943
-1.2 -6.7 -6.3 +3.9
1919 1019 1919 1919 1919 1919
1919 1019 1919 1919
366, 801 3, 455,843 3, 540, 705 +2. 5 1913 3~.· ~5 3, 31015,8,084329 3, 304, 147 +2. 31 1019
104, 759 -0. 5 1013
100,591 1----------· --·----·--- ·-·--·-- 1919
b J'anuary1 1923
105 274 119 95
104 114 78
131 128
145
145
102 264
69 54
97 gs 82
136 138
146
145
175 211 263 356 250 209 255 187 132 127
114 118
109 77 177 159
16 32
117 122
45 82 42 28
104 107
555 367 2,229 3,854
137 136
118
97 140 80
141 241
172 46
275
141
56 382 29
101 196
200 23
357
156 64
166 92
136 121
281 251 88 29
151 106
310 223 120 02 107 90 110 80 198 198 69 57
91 69 85 63 64 48 95 76
1251 107 04 83 92 84
48 42
102 361 118 88
119 127 84
120 108
132
136
26 30
155 116 133
135
88 107 39
118
18 50
105
273 633 111
75
82 49 38 51 24
114 02
110
314
202
121
214 20 59
582 371 129 151 'Jill 75
106 127 142 97
135 95 89
39
109 387 90 83
111 132 75
122 110
133
133
102 379 50 56
113 114 76
124 112
135
137
52 74 84 125
241 204 209 222 135 161
117 121
07 78 114 101 37 21
120 126
26 20 64 32
110 113
157 140 774 530 110 114
86
59 :n 40 28 36
157 57 30
158
134
80
248 21
108
556 114 76 97
198 63
88 88 80 89
120 87 70
45
82
97 21 19 88
202
243 29
495
176
181
90
240 33 07
452 117 127 139 180 83
92 80 55
101
133 100 73
43
84 388
63 53
106 107 76
129 114
138
139
-lU -0.1
+24.7 -6.2
·-6.5 -6.3 +0.7
+3.6 +1.9
+1.8
+1.9
M +16.9 243 +95.3 290 +42-0 240 +8.0 170 +6.8 128 +5.0
91 +14.0 102 I +1.2 16 I -24.1
131 +4.0
42 HOIS.O 27 +16.9
118 +5.0
150 +7.2 259 -5LO 113 -0.7
73 -11.7
' ------ ----·-· ·----- ............. .. ........................... ----·- ---··-· ...............................
357 +47.1 17 -40.0
71.4 +«-4
05 -46. 1
151 -16.1
80 -u.• 'Jill -16.8 23 -29.0 M -4L7
341 -23.9 118 +0. 4 132 +4.6 120 -13.2 217 +20. 1 86 +3.6
71 -22- 7 60 -24-2 39 -30.0 80 -20.8
Ill -16.4 84 -16.8 86 +17.9
41

4f.i
TREND OF BUSINESS MOVEMENTS-Continued
have not been published previously in the NUMERICAL DATA' Increase NOTE, Items marked with an asterisk (*) Per ct. 1
1
INDEX NUMDERS Per ct. In SURVEY or are repeated for special reasons; 1-------,.----;;--------- <+>
detailed tables covering back figures tor these I C CUMULATIVE TOTAL or de- BABE items wlll be found at the end or this bulletin. orre-For detailed tables covering other Items, see 1924 sponding FROM JULY 1 (:.sr 1 1 YEAR last <I.Uarterly issue or the SuRVEY (No. 30).
11month, THno~~~riATEST cumu· 1 on
In many caaes March figure• are now ::~~ latlve : \ PEB!On
1928
aJJailable and may be found in the •pecial Feb· ' ruary 1923-24 ' ' I table on page Z9 January ruary I 1923' 1922-28 1923-24 1~~23 ; i .Jan. Feb. Nov. Dec.
-- ---/1---11---11~==--=11-- ,-FOODSTUFFS--Continued
Cattle and Beet-Continued
Prices, Chicago: Cattle, com·fed ••••••••.• dolls. per 100 lbs .• Beet, fresh native steers.dolls. per 100 lbs •• Beet, steer rounds, No. 2.dolls. per 100 Ibs ..
Bogs and Pork
Bog movement, primary markets: Receipts, primary markets •••• thousands •• Shipments, primary markets .. thousands •• Shipments, stocker and teeder.thousands •• Slaughter •••• ·-·--·-·········. thousands ••
9,469 17.00 13.90
6,253 2,198
50 4,016
Pork products, total: Inspected slaughter produc •• thous. otlbs.. 980,793 Apparent consumptton ••••.• thous. otlbs •• • 657,931 Exports •••••.••••••••.•••••• thous. oflbs.. 224,660 Cold-storage holdings,
I.ard: (_end of month) .• ~---······thous. otlbs •• • 855,020
Production •••••••..••••••••• thous. oflbs •• • 227,689 Exports ..••••••••••••••.•••• thous. oflbs.. 132,758 Cold-storage holdings, on end
Prices of ~onth •••••.•••••••••••• thous. of lbs.. 56,161
Bogs, heavy, Chicago ••• dolls. per 100 lbs .. Hams, smoked, Chicago.dolls. per 100 lbs •• Lard, prime contract, N. Y .• .dolls. per lb .•
Sheep and Mutton
Sheep movement, primary markets: Receipts, primary markets •••• thousands •• Shipments, primary markets •• thousands •• Shipments, stocker and feeder.thousands ••
L Slaughter •••••••••.•••••••••••• thousands ••
amb and mutton: Inspected slaughter produc .• thous. of lbs .• Cold storage holdings,
Prices~end or month) ••••••••••.• thous. of lbs ••
Sheep, ewes, Chicago ••.. dolls. per 100 lbs •• Sheep, Iambs, Chicago •• dolls. per 100 lbs ••
Flsh
7,231 19.30 .128
1,697 773 149 920
42,555
• 2,306
7.188 13,325
Total catch, prin. fishing ports •• thous. oflbs.. 10,259 Cold-storage holdings, 15th of mo.thous. oflbs.. • 52, 627
·Poultry
CRece
1 ipts at five markets ••.•••••• thous. or lbs.. 37,915
o d-storage holdings (end or month) •.•••••••••••••• thous. oflbs.. • 99,486
Dairy Products
Condensed and evaporated milk: Stocks •••••••••.••••••••••••• thous. of lbs ••
R ~:rports ••••••••••••••••••..• thous. or lbs ••
ece1pts at five markets: Butter •••••••••••••••••••••• thous. of lbs •• ~heese •••••••••••••••••••••• thous. of lbs ••
Cold-:t~rag.'efioidiitgs(eii(i(i{;!~~~):0r cases •• xreall?ery butter .••••••••••• thous. oflbs •• C mencan cheese ••••••••.••.• thous. of lbs ••
Wh 1ase eggs ••••••••••••••••• thous. of cases •• ~ esale prices at five markets: , cgtter ••••••••.•••••••••••••• dolls. per lb ••
Fluid ~;-···------------·-····dolls. per lb ••
Receipts-
Raw:
Boston (includ. cream) .. thous. or qts •• Greater New York ••••• thous. of cans ••
Sugar
191,313 33,623
42,615 14,399
713
• 15,246 •40,~
• 519 .225
9.706 17.00 14.50
5,335 2,126
47 3,227
847,265 568,283 190,691
946,788
188,308 99,910
68,557
7,075 18.40 .117
1,412 693 106 725
36,197
2,175
8.425 14.550
12,277 • 40,678
27,447
93,528
154,869 21,028
48,260 16,243
999
9,837 35,223
441
.499
.221
~~rts ••••.••••••.••••••••.••• long tons.. 230,919 409,553
Steltkmgs, 8 ports ••••••••••••.. .long tons •• • 228,670 426,927 oc s at refineries, end of
Relln~onth ••••••••.•••..•••••••.•. long tons.. • 79,208 131,689 Cane, do:~f~~--------------------Iong tons.. 3,499 7,181
Prie!~ipts at 'New Orleans ••••••• Jong tons.. 22,262 1, 769
Wholesale, 96° centrifugal w~·ly ······------------~---dolls. per lb.. • 067 • 072 R t~esale, refined, N. Y ••••• dolls. per lb.. • 084 • 087
Cub e , average 51 cities •.•• index number •••••••••••••••••••••• an movement: ~ei~ts at Cuban ports •••••.•• long tons.. 548,358 736,588 St pok s ••••••••••••••••.•...•• .long tons.. 341,821 527,741
oc s, end of month •.••••••..• long tons.. 240,622 437,958
'"Revised.
il I : I
::::::::::: ::::::::::: ==:::::::I iiH 1 i~ m 1 m i~ 9.356 14. so 13.SO
• 4, 492 •1,670
64 • 2,820
752,492 491,156 163,745
842,781
158,557 89,055
59,101
7,838 20.30 .118
1,366 646 169 708
34,831
5,758
6. 719 14.613
11,647 27,070
23,619
113,503
31, 984 39, 143 +22. 4 : I 11, 263 13, 958 +23. 9 I
376 512 +36. 2 i 20, 688 25, 159 +21. 6 I
5,378,754 6,304,703 +17.2 i 4, 410, 625 5, 005, 038 + 13. 5 ! 1,147,458 1,396,439 +21.71
·;:;~;:~~~- ·;:;~;:~~- -~;;~;-1
... :~::: .... :~~~:::. -~:~~~-1 --········· ••••·•••·•• ______ __! ::::::::::: ::::::::::: ::::::::1
16,048 8,658 3,579 7,355
294,820
116,930
256, 981
16,036 9,035 3,864 6,973
293,839
132,387
279,779
-0.1 i +4.4; +8.0 1
-5.21
-0.3'
! i
+13.2[
• 79,772 12,719 ·:··9i;497· ···ioo;4i5. ·+7s:a·j 40, 662 409, 031 405, 568 -o. 8 12,575 I 135,044 148,950 +J0.3
;, ~; :::::~;~~: :::::~;~~: \::~~;) 13 •••••••••••••••••••••• -····---1 I
: m ::::::::::: ::::::::::: 1=:::::::: J
b14,357 103,587 107,184 II +3.5 i l 2,002 17,681 20,071 +13.5 i l
I i' 245, 907 2, 112,023 1, 809, 069 : -14. 3 I' i 342, 715 2, 793, 732 2, 372, 218 1 -15.1 :
' I'
~~!rs ---i88;47a· ----28;463·1·=84.Ti i 129, 931 154, 972 ! + 19. 3 i '
I ' I , ;l 1,506
..... :~~- :::::::::::1::::::::::: 1::::::::! i 681,939 1, 946, 41311· 607,189 I -17. • : 474,764 I 2, 359,841 1, 713,849 I -27.4 ; i 460,009 ·---········'··········· ········''
1919 1919 1919 1919
1913 1919 1913
1919
1919 1919
1919
1913 1913 1913
1919 1919 1919 1919
1913
1919
1913 1913
1919 1919
1919
1919
1920 1919
1919 1919 1919
1916-20 1916-20 1916-20
1919 1919
1910 1913
1913 1919
1919 1909-13
1913
1913 1913 1913
1919 1919 1919
b January, 1923.
I
142 158 88
134
120 I 145 140 II 149 85 93 111 144
156 160
61 155
~ m1 ~i ~ 239 200 1 194 230
81
206 170
64
78 122 107
72 60 30 85
81
72
148 182
45 65
221
183
30 14
10~ 79 72
29 72 6
85 83
110 145
137 77
84 160
209
92 ! 67
18o I 174 140 i 117
72i 38
94 122 107
I'
60 jl
~~ 671: 66i
I! 69 1!
1431'i 188 i
.I 67 'I ul
li :;: jl
i
32 i
~: \ 77 86
161 561
~I ~~I
I 140 I 105
130 997
9
I
85 126 128
so 90 93 74
68
24
121 158
90 103
292
95
94 31
90 104 48
91 148 109
86 so
113 153
93 89
61 104
234
82
218 155
54
84 123 120
67 57 27 79
62
30
137 160
70 104
382
141
85 42
91 88 49
54 133 52
89 74
113 156
63 61
b1 63
408
I 161 176 171 158 I
208 203 187
209 207 189
158 151
152 95 43
2071 1461 71.
3 26 5
8 1 3
192!
crease· <+>
or de-crenae
Jan. Feb.
(-) Ian. from Dec.
lll 131 106
167 184
67 158
203 235 274
93
259 209
61
86 116 116
75 64 26 87
:j 1531 171
09 85
191
149
85 47
93 88 60
27 109
14
88 73
112 158
131 70
83 118
138
192 196 185
166 105 37
114 131 l1l
143 178 63
127
175 203 232
103
214 !58
74
85 111 100
I ~?I 18 69
69
26
+2.11 0.0·
+4-3
-14.7 -3.3 -6.0
-19.6-
-13.6 -13.6 -2.2'
+to. 7
-17.3 -24.7
+22.1
-15.1 -4.7 -8.6
-16.8· -10.3 -28.9 -21.~
-14.9•
-5.7
180 +17.2 187 I +U
71 &;
139
141
69 30
105 100 1'4 17 95
1
I
84 -1 ' I
+19.7 -22.7
-27.6
-6.G-
-9.0 +37.5
+13.2 +12.8 +40.1
-35.5 -13.0 -91.2'
-3.9 -1.8
.. iiii"\ .. ";:;
233 131
+77.4 +86.7
138 +66.3 243 +105.2.
11
207 204 187
-92.1
+7.5' +3.6 +1.1
223 +34.3 162 +54.4
68 . +82.0.

46
TREND OF BUSINESS MOVEMENTS-Continued
Nou.-Items marked with an asterisk (•) NUMERICAL DATA ~~~ge~e I have not been published previously in the <+> SURVEY or are repeated for special reasons; 1~----------;;----..----------1 or de-detalled tables covering back figures for these Corre- cuMULATIVE TOTAL JtemswU!befoundottheendofthlsbulletln. 1924 spondlng FROlllULY 1 : ~~e For detalled tables covering other Items, see month, TBROUGB LATEST 1 cumu-last quarterly Issue of the SURVEY (No. 30). January MONTH i latlve
INDEX NUMBERS Per ct. In·
~!! 1923 1924 jf~ OR creese
PliRIOD 11---.--~-,----;-~-1-~-,--11 (-) Jan. In manu c ... ea ~larch ligures are now 1-----.-1----11 or Feb- 1----.-----1, 1~24 I
a~ilable and mau be found in the special January .
1
Feb- ruary, 1922-28 1928-24 I from I Jan. Feb. Nov. Dec. Jan. Feb. table on page Z9 ruary 1923 ! 1922-23 ~-~- ________ ------- I
from Dec.
FOODSTUFF8-Contlnued
Co tree Imports ••.•••••••••••••••••••••• thous. fibs •• VIsible supply:
World.····------------ .••• thous. of bags •• United States •••••••••••••• thous. of bags ••
Receipts, total, BraziL_ ..•.••• thous. of bags •• Clearances:
Total, Brazil, for world ••.. thous. of bags .• Total, Brazil, for U. S ••••• thous. of bags ••
Tea
137,397 109,994
4,~~~ ··~~ 1,235 1,054
1,~~ 1,~
131,975 853,684 956,158
i I
I ! +12.0 I I
7,491 ....................................................... ! .................. l 1' ~g ····-7;600· -----9;522- "+25:'2" ' 1,187
828 8,92! 4,879
' ; 10,882 ~ +21. 9 5,644 ~ +15. 7 :
I
1909--13
1913 1913 1913
1913 1913
Imports .•••• --··············----thous. of lbs • .'
TOBACCO
7,831 5,182
I 5,376 76,025 85,380 : +12.3 1
1
1900-13 I
Consumption (tax-paid withdrawals): · Large cigars •••••.•••••••••••••• .millions ••
Small cigorettes ••••••••••••••••• mU!Ions •• Manufactured tobacco
and snutL ••••••••.••••••• thous. ortbs •• Exports:
Unmanufactured lcar.. •••••• thous. oflbs •• Cigarettes ••••••••••••••••••••••• millions ••
Sales at loose-leaf warchouses •••• thous. of lbs .• Price, wholesale, Burley good lear,
dark red, Louisvllle ••••••• dolls. per 100 lbs1
TRANSPORTATION
Blrcr and Canal Cargo Traffic
I I I
Panama Canal: I Total cargo traffic ••••• thous. ot long tons •• In American vessels ••• thous. of long tons •• In British vessels ••••• thous. of long tons ••
Suez CanaL ............ thous. or metric tons •• Mississippi River:
Government barge line .............. tons •• Ohio River, Pittsburgh, Pa, to
504 6, 257
38,191
50,528 990
76,989
28.00
499 4,855
35,353
42,:g 48,019
28.00
2,427 2, 244 1, 4021 1, 351
2,g~~ ------~-82, 179 80, 229
507 4,623
32,611
26,740 762
34,998
27.50
1,563 959 376
& 1, 811
53,086
4,854 39,715
279,687
. 297,866 7,361
410,061
4,661 44,444
273,228
368,993 8,160
508,726
I
-4.0 I +11.9 ! -2.2 i
+23.9 +10.9 +24.1
....................................................................
11,078 5,504 3,112
12,520
314,608
18,187 11,492 3,861
13, 50S
501,930
:
I
+64.21 +tOS.S I +24.1 ' +7.9
+59.5 i
1913 1913
1913
1909--13 1913 1919
1913
1915 1915 1915 1919
1919
246, 033 335, 451 201,830 3,175, 403 4, 417,724 +39.1 ! 1922 Wheeling, W. Va ................ short tons ..
Oeean Transportation
Entrance, Yessels in foreign trade: TotaL ................. thous. of net tons.. 4,325 4,250 3,878 45,469 44,784 -1.5 , American. ······-·-----thous. or net tons.. 1, 774 1, 505 1, 527 21,623 18,484 -14.5 i Foreign ••.•.••••••••••• thous. of net tons.. 2, 551 2, 745 2, 352 23,747 26,301 +tO. 8
Clearances, vessels In foreign trade: I Total:-····--········--thous. of net tons.. 4,635 4,600 4,113 44,817 45,659 +1.9 1
Amer•can .............. thous. or net tons.. I, 817 1, 917 1, 587 21,402 19,159 -10.5 1
Fore1gn ................ thous. of net tons.. 2,818 2,683 2,526 1 23 413 26 500 +13.2 Freight rates, A tlantlc ports to: 1 I ' '
United Kingdom. weighted index number.+-----···· .-\11 Europe •••••• weighted index number •• 1.......... ::::::::::::::::::::::
Fre~gbt Cars : I
Sur~~~~;~~:~~=;~~:~;~;!:~~~;~~~~:::/J ~~;ti~ gk~~~ ~~~ 1'::::::::::: :::::::::::1:::::::: . shoJ~i~c<iiiiii-;;-.;~i8Si.weeltoTUiciiiig):mber.. 169,036 134,273 15,819 ........... ·····------ ------·-1.
~g~~:::::::::::::::::::::::::::~~~~~::/ f: :~~ k~~ ~: ~r c::::::::: ::::::::::: ::::::::1 Cars In bad order: 1 4• 598 3• 991 80, 633 ........... -·-····-··· ••••.•••
1
·
Total ................................ cars • .l 161,569 168,782 215,552 .............................. i Ratio to total in use ............. per cent •• ! 7.1 7. 5 I S. 7~------·--·· ................... :
Carf~~i~!~-~~_e_e~~-~~~~~~~~~----------cars .. j 858,863 908,404 84481,220969 .............................. !I
Lram and gram pro ucts •..••••••.•• cars .• 1 45,093 49,129 32
, 064 ~-------···· -·-·-······ c~~~~~~::::::::·.·.:::::::·.·_·_·_:·_·_-_._-_._ccaa~---_i 35,945 32,931 ,
196,826 189,991 't85,6449211::::::::::: ::::::::::: ·····--- : Forest products._ ................... cars •• 1 66,704 79,698 oo
10,31
60 1
.............................. : ·,
~:iciiiiiiJ~iiiiiiJ.miSreil~-i.ieoiis::::::~~==l· s,435 9
•466
1 BaDroad Operations I 493,874 534,305 491,505 1:::::::::::::::::::::: ::::::::\:
fu~~ I ,. ~relght .................... tbous. or dolls.. 333,576 352,443 326,836 2, 836,278 3, 039,204 +7. 2 T~l~~iai~·g····--------~~ous. o~~oUllss •• 1 468
9t,97377o
483,
9363
14 479,1351 743,519 783,622 + 5. 4
0 ............ ous. 0 0 --· • 78, 46,949 3, 955,765 4,197, 606 +6.1 ' N
peratlng expense ......... thous. of dolls.. 384,984 374,700 376,007 3, 162,170 3, ~•o 566 +3.1 ' et operating Income: """' Total ...................... thous. or dolls.. 51,281 71,192 3~, 275 I 528, 193 656,429 +24. 3 .
Re~~~pe~ ~~;~~rtive Yaluatlon •• per cen1t.. 4. 54 .......... • s07. 56
81:---·--····· ................... ,
F l h - e ................... cen s.. 1' 086 •••• •••• .~.·630
1,~---27--5·,·8·93··· --·302···,·5·8-·1- ·-+--9--.7--~1 • reg t carrled ............... mills. ton-miles.. 34,514 ~; 962 .,..
Locomotives in bad order, 1st of folloWing month, per cent to total in use: I f :
PFreight .......................... per cent.. 17.9 18.5 25 5 ' I·
assenger ·--····-·---·-·······--per cent.. 16.9 17.5 24:5 \1::::::::::: ::::::::::: !::::::::1 11
1913 1913 1913
1913 1913 1913
1920 1920
1919 1919 1919
1919 1919 1919
1913 1913
1919 1919 1919 1919 1919
. 1919 1919
1913 1913 1913 1913
1913 1913 1919 1919
1919 1919
153
65 45
105
124 176
106
89 413
100
133 470 70
1208
li
i
I I
391 425 222 156
! ~~ 86
102 150 83
174
63 59 93
120 211
65
89 357
88 I
218
40 48
125
138 190
149
103 414
90
85 171 394 496 43 120
208 212
384 545 526 785 205 26!' 151 166
608 610
68 217
189
36 39
127
130 192
167
78 342
71
177 554 115
212
613 786 340 173
593
164
182
36 37
129
115 1%8
95
so 483
103
161 512 94
212
596 778 322 173
941
82
87 130
127 125 97
721 92
127 78
232 224 151 89 89 78
130 111 103 231 179 145 92 84 87
145
35 31
110
131 162
-20.0
-10.3 -14.8 -14.7
+14.4 +~5.7
. 63 -33.
79 -1.0 374 -22.4
911 -7.
136 -15.7 342 -33.1 58 -37.6
212 0.
551 -7.5 741 -3.6 277 -14.1
.919 -2.4
112 +36.
96 -1.7 128 -15.1 84 +7.6
103 +0.8 153 +5.5 83 -4.8
25.3 21.8 22.9 21.1
28.6 27.8 27.5 29.9 :t~ 25. 1 25. 1 24. 9 25. 1
8 10 14
i 141 916 303
\ 137 124
I
I ~~ 1 105 I 109
118 ' 29 102
I 208 I 158 ' 197 I 225
102 108 150 138
I
971 91 I
3 6 8
178 923 334
141 128
106 106 97
1051 117 28,
105 '
185 138 175 Z07
65 72 154 119
9i 1 92 I
66 158 91 107 198 89 81 165 89
2 (11) 9 14 1 45 6 1 19
102 104 106 100 101 104
122 103 107 128 115 116 121 108 109 100 91 111 127 103 117 95 28 23
125 106 105
224 194 189 151 176 159 208 194 184 224 214 212
63 -30.9 75 -16.2 71 -20.6
6 -35.9 59 +30.7 17 -13.2
110 +4-5 110 +5.6
113 +5.8 126 +9.0 100 -8.4 108 -3.5 140 +19.5 25 +12.2
113 +8.2
199 +5.7 145 -9.1 188 +2. 1 206 -2.7
144 93
158 140
116 86 119 +38-
61 67
86 88 ...... •••••• ~~ ""i26" ""i35" ·":t4:ii
66 64
66 64
~January, 1923. u Index number less than 1.

47
TREND OF BUSINESS MOVEMENTS-Continued -- - ~ -- --. - -·
.Per ct. II NUMERICAL DATA INDEX NUMBEHS I Per
mcrease I ct. (+) I In-
Corre- I CUMULATIVE TOTAL or de- 1 BASE I crellSil
1924 sponding FROM JULY 1 crease YEAR : (+) (-) 1923 19U or de-
NoTE.-ltems marked with an asterisk (*) have nat been published previously in the SURVEY or are repeated for special reasons; detailed tables covering back figures for these Items will be found at the end of this bulletin. For detailed tables covering other items, see last quarterly Issue o!the SURVEY (No. 30). month,
January MONTH I THROUGH LATEST I OR cumu- crcllSil PERIOD
In many cases March figures are now aroilable and may be found in the special table on page 29
TRANSPORTATION-Continued
Passenger Travel Railroads:
Pullman passengers co.rried •••• thousands •• National parlts:
Visitors __ •••••••• _ ••••••••••••••• number •• Automobiles entered •••••••••••• number ••
Arrivals !rom abroad: Aliens.---····---··-········- •.•• number •• United States citizens •••.••••••• number ••
Departures for abroad: Aliens. ·····-····--·-············number •• United States cltizens ••••••.•••• number ••
PUBLIC UTILITIES
Telephone companies: Operating revenues •••••••• thous." of dolls •• Operating income ••••••••• thous. of dolls ••
Telegraph companies: Commercial telegraph tolls .thous. of dolls •• Operating revenues ••••••• thous. of dolls •• Operating income ••••••••. thous. of dolls ••
<Jentral electric stations: Productian, electric power-
January
2,724
35,761 1,334
44,354 15,638
14,412 20,817
46,584 9,895
8,839 10,938
' 1,424
Feb· 1 or Feb-
1
ruary, ruary 1923
,---I i '
2,483 !
I 2,313
• 27,606 20,923 I• 2, 654 I 402
40,743 ! 38,760 I 22,161 I
20,217
i 11,586 8,844 11,586
I 21,257
---~ ............. • 42,841 ...................... •9,879
---------- •8,986 ..................... • 11,130 -------·-- • 1,961
4,878
lo.tlve 1923-24
1922-28 1923-24 !rom 1922-23 ------- ·- ---
23, 292 I +6. 1 21,828
757,366 1, 094, 651 II +44. 5 105,613 127,936 : +21.1 ' 429,610 670,296 +56.0 I
I 216,963 186,898 -13.8 I
I 141,886 146,207 +3.0 I 181,139 166,296 -8.2 I
'
290,348 314,700 +8.4 63,749 66,022 +3.6
62,562 63,330 +1.2 I 77,950 77,479 -0.6
i 13,369 10,772 -19.4
I +12.0 Total ••••••••••••• mills. ot kw. hours ••
By water power •• mills. ofkw. hours •• By fuels ••.••••••• mills. of kw. hours ••
5,202 1,680 3, 522
1,560 3,318
4,324 1,468 2,857
34,431 11,634 22,797
38,566 12,582 25,954
+9.0 ! +13.8
Consumption of fuels-Coal. •••••••••••• thous. of short tons •• Oll. ••••••••.•••••••• thous. of barrels •• Go.s ••••••••••••••••. millions of cu. ft ••
Gross revenue, sales ••••••• thous. of dolls ••
3,673 1,602 2,455
126,100
3,374 1,546 2,601
----------
3,249 1,166 1,823
'112, 300
25,316 9,961
19,853 674,000
26,910 11,233 22,415
774,100 +12.9 +14.9 I
+~~:~ 1:
EJ.\IPLOYMENT I t'
Number employed, by industries: l I )• 1
Total, 1,428 firms •••••••.•••••• thousands.. 2, 006 2, 006 1, 999 -·········· ·······--·· ···-···· 1 Food products ••••••••••••••••••• number.. 138,124 137,666 141,216 ·-·······-· --·--······ ·····---Textiles ••• _______________ ••••••• number__ 259,081 254,842 282,121 --··· '· · Iron and steel ••••••••••••••••••• number.. 496,333 499,051 500,214 ••••• :::::: ::::::::::: 1.::::::: , Lumber ···-·-··-·····-··-··-·-··number__ 28,131 28,900 28,200 --··· [• Leather •••• ·····--·-····-·-··--·number.. 55,282 54,557 60,567 ••••• :::::: ::::::::::: .::::::: Paper and printlng •••.•••••••••• number__ 56,352 57,202 56,013 •••••••••••••••••••••• 1 ••••••••
~everages ...................................... number... 1,086 1,082 596 ............................................ 1 ----~---bemicals ••.•••••.•••••••.•••••. number.. 86,462 87,243 88,736 •••••••••••••••••••••• 1-···-···
~onej clay, and glass •••••••••••• number.. 19,250 19,420 18,211 ·······---- ···--·····-~·-······! T etas, exc. iron and steel. ______ number.. 109,713 110,777 106,095 •••••••••••
1 ........... ---··---~
yog!lccoproducts ••••••••••••••• number.. 30,604 29,570 30,216 ·········-- ·-·----···· ··--·-·· Re.!Cles. ________________________ number •• 329,790 331,422 303,492 ••••••••••• \ ••••••••••••••••••• 1
----
1913
1920 1920
1913 1913
1913 1913
1913 1913
1919 1919 1919
1919 ' 1919 1919
1919 1919 1919 1913
Numb~~~~~fg~:ii~stiiii&iiii.ciiy-re~~~er.. 325,860 325,344 1
3Io, 691 ······-···· ··-········ ···-····! i ~way repair shops ••••.••••••• number.. 70,032 69,698 72,555 -···---·---~·-···-·-···~·-·····-! 1
j1ew York State •••••••••••.•• tbousands.. 535 540 1 554 ••••••••••• ••••••••••• ·-··----~'
1921 1921 1921 1921 1921 1921 1921 1921 1921 1921 1921 1921 1921 1921 1921
1914 1920 1915 1922
w~trolt ••••••••••••••••..•••••• thousands.. 240 241 214 ···----·-··!·-·-······· ········ i rn~C!Jnsln _________________ index number •• -····-··-······-··-·~~---······· ··-········ ·········-·
Total pa~sioii:"····-······-····lndex number •• ·-········ •••••••••• 1 •••••••••• ------·-··· ·········-· ••••••••
1
:
~~w York State ••••••.•••• thous. of dolls._ 14,874 14,978 I 14,329 -----·-····1··········· ........ ' Avera~~~~~~Y"eamiiiii"s:······index number •• ·······-·- •••••••••• 1 •••••••.•.•••••••••••
1
...................
1
,
~~w York State •••••.••••••••••••• :dolls.. 27.81 27.73 I 25.87 ·····-····+··--····-· -···-··· . Emw;~~~\nagenciyoperat!on!?dex number •. , •••••••••• ·--·····-·!·-···-····, ···········j·-·······-·1--·-····!,
J grkerglsregistered •••••••••.•••• number •• 1
175,620 150,235 1 175,807 1,700,111 11,444,445 ~-15.0 1' ~ s:e stered •••••••••• _________ number.. 108,949 103,509 . 167,866 1,583,18711,205,812 -23.8 ; A or ersplaced •.•••••••••••••••• number._ 89,535 84,683 1 127,965 1,217,487, 974,884 -19.9 ·
verage applico.nts per job ••••••• number.. 1. 61 1. 45 I 1. 05 ·········-·:·-·-······· --··--·· ·
1914 1915
1914 1915
11921 11921 11921 11921
-;an. Feb., Nov. Dec~~ Jan. Feb.
---- --------~~-
130 112
31 30 5 6
32 3a 64 82
23 17 54 71
326 315 266 362
118 108 110 100 120 86
147 133 133 121 155 141
123 lll 136 127 118 102 432 402
124.3 128.2 107.4 107.5 104.0 110.4 140.7 143.1 119.1 121.1 121.9 122.0 113.3 112.2 40.4 41.2
115.4 118.3 119.6 131.9 135.8 139.7 101.4 100.4 186.2 197.1 118.4 118.9 103.0 108.1
114 116 114 120
12tl.7 124.7 107.1 109.7
241 241 245.0 261.6
210 207 203.0 210.0
101 87 136 144 134 135 74 61
123
43 16
89 118
36 50
345 268
116 109 92
149 123 165
118 150 124 452
129.3 113.9 102.7 144.8 123.9 113.0 112.7 69.4
118.0 154.4 142.6 102.7 196.5 119.0 114.5
115 120
120.7 108.9
239 275.2
221 228.3
81 no 114 i3
I
136 I 131 120
421 52 -40 7 18 37
57 37 34 72 64 00
45 28 23 56 69 39
351 355 -·---- -274 267 .. ............. 116 116 .............. 109 108 ----·- . 90 87 ...........
153 160 150 138 138 128 162 174 164
116 126 115 160 174 168 141 138 146 466 485 ----··
127. 4 128. 7 128. 7 110.4 105.2 IW. 9 102. 5 101.4 00. 7 140.6 141.9 142.7 122. 1 120.8 124.1 108. 1 111. 4 Ill. 9 112. 1 112. 9 114. fl 75.8 75.1 74.8
114.4 115.2 116.2 142. 1 139. 4 140. 6 145.4 144.5 145.8 104. 6 101. 6 98. 2 194.8 213. 1 214. 1 118.3 114.8 114. 2. 113.9 113.4 113.1
113 100 107 132 135 136
119.9 114.5 123.4 108.1 106.2 108.5
239 235 236 265.0 253.9 283.6
224 219 218 221.7 213.5 230.6
70 87 74 78 93 89 83 95 90 63 93 84
DISTRIBUTION 1\IOVDIENT /1!' II I I
Mail-order houses: I T8
otalsales ..••.••••••••••• thous.o!dolls.. 30,508 30,468 26,1781 203,921, 239,946 +17.7 1913 243 232 306 318 271 270 ears, Roebuck & Co ••••• thous.o!dolls.. 19,303 17,878 17,115 135,707 i 145,944 +7.5 1 1913 238 215 256 261 242 22-1
T Montgomery Ward & Co •• thous. of dolls.. 11,205 12,590 9,063 68,214 94,002 +37.8 i 1913 256 274
1
426 1455 339 380 en-cent stores:
jow S~CS •••••••••••••••• thou~. of dolls.. 19,508, 201,831 233,987 +15.9 I 1913 242 245 369 692 265 294 s"s K oolw8rthCo •••••• thous.o!dolls.. 11,234! 119,380 137,300 +15.0 m; ~ ~ ~?~ d~ ~ ii~
21,096 23,406
S ~ rrry tzes Corp ••••• thous. of dolls.. 1,256 .., 15,256 +21.9 1913 229 223 308 664 240 261
12,134 13,431 5,457 6,019 1,352 1,612 2,153 2,344
(-) Jan. !rom Dec.
-8.9
-22.9 +98.9
-8.1 +41.7
-111.4 -44.3
-6.2 -7.1 -s.s -8.1 -3.5 H.9
0.0 -0.3 -1.6 +0.5 +2.7 -1.3 +1.5 -0.4 +0.9 j-O.U
+1.0 -3.4 +0.5 -0.5 -0.2
+0.9 +0.4. +2.8 +2.2
+0.7 +11.7
-0.3 +8.0
-14.5 -5.0 -5.4 --9.9
-0.1 +7.4
+12.4
+10.9 +10.7 +10.3 +111.2 +8.9
:M C res§e o ••••••••••• thous. of dolls.. 5,0161 1~·~ 57,707 +19.6 1913 273 279 1
406 II 795 300 358
Restaura"nt ~t~ins:Co •••••••••. thous.o!dolls.. 2,002 21,695 24,724 +13.9 , I I §'?talsalcs,2chalns •••..•• thous.o!dolls.. 2,696! 22,876 24,656 +7.8 1920 1
1 113 103 115 122 117 112 -4.7-
~.gJilesdd'~f~~~~~~::::::::::::i:h'Oiii.n~~~l,;:: 1, ~g i ···-i4~754·i····i5~739"j.-+6.T -··11.9920i3" •••• 2681·::- •• 241·2·r\ •• 271·38-ii •• 2914.31- -- 2771·3;9-· •• 25138_7_ • -7.1 na or system ••••••••••• thous. of dolls__ 980' s, 122 8,917 +9.8 ""' ~ -0.4
3,062 2,918 215 216
1,967 1,827 1,095 1,091
•January, 1923. • Six months' average, July to December, Inclusive. u Preliminary; reports !rom two parks are not included.

48
TREND OF BUSINESS MOVEMENTS-Continued
NoTE.-ltems marked with an asterisk (*) NUMERICAL DATA i;~ have not been published previously in the 1 --------,-----;:---------II <+> SURVEY or are repeated for special reasons; 1- or de-detailed tables covering back figures for these Corre- CUliULATIVE TOTAL itemswillbefoundattheendofthisbulletin.
1924 spondlng FROM lULY 1 1~)e
For detailed tables covering other items, see month, Tl!ROUGH LATEST cumu-last quarterly issue of the SURVEY (No. 30). , ----..,----II J
0anr Fuel~!! , ____ Y_0
7N_m ___ ! lative
In manu cMee Jlarch figures are noiD •· u- ,. 1923-24 aMilable and mau be found in the special January Feb· l118l"Y
1923 • 1922-23 1928-24 from
table on page Z9 ruary 1922-23 -~------------1--- ------1----1---- ---DISTRIBUTION MOVEl\IENT-Contd.
Chain stores: J. C. Penney Co ••••••••••• thous. of dolls •• United Cigar Stores Co •••• thous. of dolls •• A. Schulte (Inc.) ••••••••• thous. or dolls •• Jones Bros. Tea Co •••••••• thous. of dolls •• Owl Drug Co •••••••••••••• thous. or dolls ••
American Wholesale Corp. total sales •••••••••••••••••••• thous. of dolls ••
Candy sales by manufacturers.thous. of dolls •• Magazine advertising
(lor following month) •••••••• thous. of lines •• Newspaper ad vertlslng •••.•••• thous. of lines •• Postal recelllts,
total (50 c1tles) •••••••..•••.•• thous. of dolls •• Money orders:
Do~<fu~tft~~ -~~~~~~~!=-....... number .. \ alue .................. thous. of dolls ..
Domestic issued (50 cities)-Quantlty .................... number •• Value ••••.•••••...••••• thous. of dolls ..
Foreign issued ............. tbous. of dolls •• Internal-revenue taxes collected:
Theater admlssions ........ thous. of dolls .. Firearms and shells ........ thous. of dolls .. Jewelry, watches, and
clocks ................... thous. of dolls .. Bond and stock issues
and con\·eyances ......... thous. of dolls .. Capital stock transfers ..... thous. of dolls ..
PUBLIC FINANCE
Government debt:
3,468 5,396 1,697 1,815
918
3,845 45,375
1,945 92,172
26,031
10,867 77,642
3,028 29,118 2,773
7,577 147
4,942
4,173 895
3, 708 5,619 1,656 2,022
912
2,226 31,497
2, 219 88,928
25,264
10,482 75,404
2,823 28,189 2,439
6, 739 89
2,675
3,617 906
2,823 5,158 1,269 1,367
823
2,377 32,007
2,002 83,608
23,082
9,238 65,725
2,384 24,908 2,166
5,877 197
2,570
3,700 8711
34,948 49,667 11,680 11,427 7,515
23,785 253, 9'n
1114,811 726 713
190,435
77,061 572,408
19,173 200,908 18,508
44,469 2,988
14,507
28,166 6,344
44,626 51,879 14,239 15,284 8,093
24,119 269,526
1717,540 755,880
203,354
82,578 637,025
22,113 227,667 31,012
50,848 2,693
16,871
28,632 5,254
+27.7 ·H5
+21.9 +33. 7 +7.6
+1.4 +6.1
+18.4 I +4.0
+6.8
+7.2 +11.3
+15.3 +13.3 +67.6
+14.3 -9.9
+16.2
+1.7 -17.2
BASE YEAR
OR PEIIJOD
1913 1913 1919 1913 1913
1913 1920
1913 1919
1919
1919 1919
1919 1919 1919
1919 1919
1919
1919 1919
lnterest·bearing ............ mllls. of dolls •• Total gross debt.. .......... mills. of dolls ..
21,574 21,844 40,019
183,307
21,520 21,782 50,207
206,607
22,368 ...................... •••••••• 111919
Customs rceelpts .............. thous. of dolls Total ordinary reeelpts ........ thous. of dons:: Expenditures chargeable to
ordinary receipts ............ thous. of dolls Money In circulation: ..
~otal .. , .................... mills. of dolls .. 1 er cap1ta ........................ dollars ••
BANKING AND FINANCE
Banking
Debits to individual accounts:
260,765
4,682 41.77
New.York City ............ mills. of dolls.. 22,014 Outs1de New York City .... mills. of dolls.. 19,395
Bank clearings: New York City ............ mills. of dolls.. 20,689 Outside New York City .... mills. of dolls.. 16,135
Federal Reserve Banks: Bills dlscounted ............ mills. of dolls •• Notes in circulation ........ mllls. of dolls .. Total investments .......... mills. of dolls •• Total reserves .............. mllls. of dolls .. Total depos!ts .............. mills. or dolls •• · Reserve ratio .................... per cent ..
Federal Reserve member banks: Total !oans and dlscounts •• mills, of dolls .. Totalmvestments .......... mllls. of dolls .. Net demand deposits ....... mills. of dolls .•
Interest rates: New York callloans ............. per cent ••
522 2,023
393 3,263 1,991 81.3
11,884 4,480
11,239
4.55 4.88 Commercial paper, 60-90 days ••• per cent ••
Saving deposits, by Federal Reserve Districts (balance to credit of depositors):
Total, 858 banks ........... thous. of dolls .. 6, 878,006 Boston, 64 banks ••.••• thous. or dolls 1,221, 742 New York, 30 banks ••• thous. of dolls:: 1, 922,678 Philadelphia, 79 banks.thous. of dolls 483 826 C~eveland, 18 banks •.. thous. of dolls:: 458; 720 Richmond, 91 banks ... thous. of dolls 293 099 Atlanta, 96 banks ...... thous. of dolls.. 219' 855 Chicago, 209 banks .... thous. of dons:: 891; 580 st, Louis,~ banks .... thous. of dolls.. 135,025 MIDDeagf?hs, 15 banks.thous. or dolls.. 92,303 KDanallsas Jty, 56 banks .. thous. of dolls.. 108,714
as, 85 banks ....... thous. of dolls.. 64,526 San Francisco, 73 banks thous. of dolls ·979 938
U.S. Postal Sav!ngs ....... thous. of dolls:: 130; 'n7
Ufe Insurance
Policies, new: Ordinary th f I" · lnd . • .............. OUS. 0 po ICICS ••
0 ustnal .............. thous. of policies ••
Trootalupm_ ................. number of policies ..
surance ......... thous. of policies ..
160 767 49
9'n
208,432
4,808 42.85
19,886 17,512
18,120 14,713
532 2,022
419 3,230 1,986 80.6
11,874 4,496
11,165
4.50 4. 78
11,938,646 1,235,079 1,928,114
485,354 463,107 298,464 224,817 895,491 135,929 92,076
108,653 65,082
1,006,480 132, l'n
172 649 57
821
22,717 IS 1919 48,311 ''"343~58i"""359~ii85' ""+4~8' 2 1913
197,617 2, 282, 125 2, 359,361 +3. 4 21913
244, 'n6 2, 366,440 2, 344, 512 -o. 9 r 1913
4,611 41.61
19,019 16,905
16,784 13,247
596 2,247
571 3,202 1,952 76.2
11,639 4,690
11,525
4. 78 4.63
6,407, 790 1,158,610 1,809,394
446,707 412,811 286,829 204,038 828,144 125,774 86,946
102,858 56,755
889,924 131,980
159 551 73
710
160,521 140,280
145,021 113,859
154,425 -3.8 148,295 +5. 7
140, 576 -3.1 120, 725 +6. 0
---··------ ---·------- .............. I . ............................ . ::::::::::: ::::::::::: :::::::: I ·-·-------- ··--------- .............. ..
li 1919 181919
1919 1919
19113 1913
1919 1919 1919 1919 1919 1919
1921 1921 1919
1913 1913
1920 1920 1920 1920 1920 1920 1920 1920 1920 1920 1920 1920 1920" 1913
1,250 1,415 +13.2 1913 4, 519 5, 155 + 14. 1 1913
805 783 -2.7
:/c2 ummonultahst.' averag1e, Jtulhy to June, inclusive, ending the year indicated
1ves are or e nine months' period July toM ch 1n 1 · • u Relative to June 30, 1919, • ar • c us1ve.
5, 770 6,572 ' +13. 9 """iiii3"'"
Jan.
1, 'n3 221 1m! 169 263
311 101
141 108
136
157 111
138 125 83
125 81
358
135 78
89 89
175 354
443
94 90
109 112
251 289
31 84 92
147 103 153
I 96
144 109
137 80
117 111 118 113 119 126 120-109 138 120 1'n 122
331
1
123
INDEX NUMBERS
1923 1924
Feb. I Nov. Dec. Jan. Feb.
1, 283 3, 271 3, 852 209 250 355 189 250 377 167 235 250 253 'n5 422
174 211 125 81 100 116
164 172 143 100 126 122
126 I 144 171 I 119 141 1M I' 101 134 140
126 146 172 115 133 147 72 153 185
109 61
215
1091 86
89 89
182 3'n
404
96 92
93 96
213 230
31 86 96
146 101 152
98 139 109
150 80
118 112
m1 120 I l'n I 121 I
gg! 121
m~ 127' 332'
I
l'n 157
138
95 55
86 87
176 316
424
103 97
98 106
229 263
41 86 63
146 100 152
100 133 105
151 88
124 117 122 119 132 129 129 117 146 126 133 141 137 334
130 76
142
100 77
86 86
154 956
663
103 98
109 116
247 Z17
44 89 74
143 100 146
100 135 104
144 86
126 117 126 123 135 130 131 119 149 129 135 143 140 331
1,~i~ 238 222 282
281 114
159 110
142
140 119
160 134 93
140 46
413
117 88
85 86
151 304
431
98 92
108 111
262 281
'It 77 66
149 103 162
100 133 106
143 84
126 118 125 124 133 130 130 119 149 129 134 144 140 328
1,686 228 246 247 281
163 79
181 106
137
135 115
149 130 82
125 28
223
gs 89
85 85
189 343
345
100 95
98 100
230 256
'It 77 71
147 103 161
100 134 106
142 83
128 119 126 125 134 132 133 119 150 128 134 145 144 332
Per ct. In·
crease <+>
or decrease (-) 1an, from Dec, --
+6.9 +4.1 +3.7
+11.4 -0.7
-42.1 -30.6
+14.1 -3.5
-3.0
-3.6 -0.3
-6.8 -3.2
-12.1
-11. -39.
-45.9
-15.7 +1.2
-0.3 -0.3
+25.5 +12.7
-20.
+2.7 +2.6
-9.7 -9.7
-12.4 -8.8
+1.9 0.0
+6.6 -1.0 -0.3 -0.6
-0.1 +0.4 -0.7
-0.7 -1.2
+0.9 +0.6 +0.3 +0.3
+10.0 +1.8 +2.3 +0.4 +0.7 -0.2 -0.1 +0.9 +2.7 +1.4

49
TREND OF BUSINESS MOVEMENTS-Continued
Non:. Items marked with an asterisk (*) NUMERICAL DATA . Per ct. II I Pfr
SURVEY or are repeated for special reasons; 1--------;;----...---------11 (+) 1 in· have not been published previously In the mcrease I INDEX NUMBERS ct.
detailed tables covering back figures for these Corre- CUMULAtiVE TOTAL or de· i BASE crease itemswillbefoundattheendofthlsbulletin. 192! spondlng FROM JULY 1 crease YEAR l"~S
19m, <+>
For detailed tables covering other Items, see th THRouou LATEST (-) •- •• or de last quarterly Issue of the SURVEY (No. 30). J;;~~ry MONTH cumu- PE~~OD crease In many cues March ligures are norD or Feb- lative ll--,.----;:-----1---.-- 1
( -)
a11allable and may be found in the special Feb- ruary, 1923-24 I I Jan. table on page zg January _rua_r_y_ 1923 1922-23 1923--24 1~~~23 --- Jan. Feb. Nov. De~:- Jan. Feb., ~~
II :::! j m g: !l::. w. ~: ~I BANKING AND FINANCE-Continued
Life Insurance-Continued
Amount of new insurance: I Ordinary .................. thous. of dolls .• l Industrial ................. thous. of dolls •• Group ..................... thous. of dolls •• Total insurance ............ thous. of dolls •• !
Premium collections: OrdinBry .................. thous. of dolls .. Industrial. ................ thous. of dolls ••
1
. Group ••••••••••••••••••••• thous. of dolls .. Total.. .................... thous. of dolls ••
Business Finances 1
BusW~!~~~~~~: .................... number ..1 T
Liabilities ................. thous. of dolls •• otal dividend and interest payments (for following month) ........ thous. of dolls ••
Dividend payments (for following mo.): TotaL .................... thous. of dolls •• Indus. and misc. corp •••••• thous. of dolls .. Steam rallroads ............ thous. of dolls •• Street railways ............ thous. of dolls ..
New incorporation ............. thous. of dolls .. Credit conditions:
Orders ..•••••. per ct. of total transactions •• Indebtedness.per ct. of total transactions .. Payments •••. per ct. of total transactions ••
New Capital Issues
'Total corporations ( Com mercia! and Financial Chronicle):
Purpose of issue-
448,999 179,656
8, 1'l:l 637,381
100,650 29,867 2, 278
132,795
2,108 51, 'l:13
185,56.5
76,640 41,895 28,115 6,630
878,705
25.8 38.9 54.7
New capital. •••••••••• thous. of dolls.. 276,906 Refundmg ............. thous. of dolls.. 27,792
Kind of issue-Stocks ••••.•••.••..••.. thous. of dolls.. 65,937 Bonds and notes ••••••• thous. or dolls.. 23R, 762
Dond Issues classified-Railroads-
New capital. •••••• thous. of dolls.. 45,008 Refunding ••••••••• thous. of dolls ••••••••••••
Public utUlties-New capital ••••••• thous. or dolls.. 104,803 Refundmg ......... thous. of dolls.. 20,375
Industrials-New capital. .... ~.thous. of dolls.. 14,760
"''
Refunding ......... thous. of dolls.. 5, 568 otal corporations (Journal of
:s Commerce) ................... thous. of dolls.. 220,883 tates and municipalities:
Permanent loans ••••..•••• thous. of dolls.. 85,745 Temporary loans •••••••.•• thous. of dolls.. 50,377
Agricultural Loans
.By land banks: Total closed ............... thous. or dolls •• Federal farm loan banks .•• thous. of dolls •• Joint-stock land banks thous. of dolls
.By War Jo'inance Corporation:· .. With banks and bvestock loan
com pan!~ Advancements ........ thous. of doUs •• n:~:ayments •.•••••..•• thous. of dolls •. B ance ••• -·----···---thous. of dolls ••
With cooperative market associations-Advancements ........ thous. of dolls .. R:p,arments •••••••..•• thous. or dolls .. B ance ............... thous. of dolls ..
Stocks and Bonds
:Stock prices, closing: ~ ~ustrlals, average ••.• dolls. per share ••
103 oads, average •••••• dolls. per share ••
.Stock s!J~~ks, average ........ dolls. per share ••
JJon~sJ~~tock Exchange ••• thous. of shares ••
i',1~la'{l',ous ............. thous. of dolls •• T 1~ Y- 1ctory ••••••••.•• thous. of dolls ••
Bo do ....................... thous. of dolls ..
• n pnces: H8
1gbest-grade rails.p. ct. of par, 4% bond •• eCOJ!d·gra!le ralls •• p. ct. of par, 4% bond ••
f~bh~ ~tlhty •••••• p. ct. of par, 4% bond •• Cn or, r1a r··------P· ct. of par, 4% bond •• 5 t~ • pr: indel:.p. ct. of par, 4% bond •• •16
,1 e~ty nds •••••••••••••• p. ct. or par •• •.ore1gn government an<!
CcJty ......................... p. ct. of par ••
:M .o!Db. pnceindex, 66 bonds .. p. ct. of par •• umc1pal bond yelld • .............. per cent •. "Revised.
23,747 16,454 7,293
49S 2,325
66,075
134 239
2,143
112. 14 60.35 93.00
27,762
253,3114 91,693
345,087
83.59 68.43 66.12 73.09 72.23 99.50
99.60 93.99
4. 32
467,423 143,762
8,990 620,176
110,347 30,200
2,605 143,152
1, 730 35,1142
319,041
83,2!1 49,650 29,600 3,991
661,049
415,006 114,758
9,933 539,698
86,1147 25,706 1,824
114,477
1,508 40,628
3, 211, 587 3, 719, 597 934, 474 I, 160, 308 157, 842 283, 862
4, 303, 903 5, 163, 767
674, 861 769. 053 217, t88 25-., 024
11, 679 15, 851 904, 029 1. 38, 9'l:l
13,920 340,017
12,828 367,179
283, 645 182,613, 598 182,675, 952
79,055 46,600 28,950 3,505
700,708
31.1 40.0 52.2
If 643,947 I! 413, 140 li 218,480 If 56,946
115,815, 508
18 771,792 If 427,331 18 225,390 1150,822
1!5,572, 447
+15.8 +24.2 +79.8 I
+20.0 I +14.0 +16.8 +35.711 +14.9
1-7.8 [ +8.0
·+2.4
+3.7 +3.4 +3.2 +6.8 -4.2
228, 303 a 230, 095 1, 621, 801 1, 690; 197 +4. 2 37,285 26,510 669,408 190,989 -66.51
58,876 a 78,715 548,038 423,861 -22.7 196,712 177,889 1,6«,170 1,«7,321 -12.0:
32!, 428 +81. 51 50,611 6,500
91,948 14,050
37,753 16,735
32,555 9,903
"69,082 a 9,625
059,684 a 6,920
178,700 64,105
306,728 161,479
394,952 86,183
34, 160 -46. 7 I
552, 645 +SO. 2 I uo. 426 -31. 6 I 229, 458 -41. 91 31,317 -63.7
254,913 237,609 2,423,005 1,1143,579 -19.81
102, 659 78, 429 122, 641 683, 464 -s. 4 1.
6o, 791 a5, 464 314, 187 a62, 491 + 15. 4 1
I
23,187 18,924 4,263
1,420 2,548
64,1146
15 180
1,978
lll.83 60.47 87.77
20,637
178,379 53,375
231,754
82.79 68.72 66.'l:l 72.86 72.15 99.48
99.77 93.78 4.36
47,153 17,486 29,667
2,026 9,268
119,830
300 1,865
10,609
301,021 148,570 152,451
188,774 122,166 66,608
I =rul -66.3
ll 18, 488 4, 630 -75. o 1 91, 418 36, 761 -59. 8 '
1 288 720 622, 355 -51. 71 I .. I 14, 6114 2, 552 -82. 6 1 9,939 9,330 -6.1 1 i 63,579 28,841 -54.611
, I
115.03j ••••••••••• ----······· -·-----·1! 65.28 ----------· ----------- •••••••• II
:~: ~---;~:~- ···;~~:~~~-~ --~;~;·i ;1,
I . I 187,150 I 1, 576,706 1, 257,510 11-20.2 I 61, 207 I 789, 847 508, 151 -as. 7 1
~~i; li:~~~~~: :~;~~;~~~~ :~~J 68.40 ---------·- ····------- ________ ,
~ ~ i ::::::::::: :::::::::::1 ::::::::: 99.05! -----·-···· -----------~ •••••••• ,:
1~J~ J,::::::::::: :::::::::::jj:::::::: 4.11 I ----------- -·--·------ --------!I
1913 9!8 687 931 13, 620 004 622
H. I -20.0 +3.0 -:l.7 1913 283 :m a12 491 3U 3t5
1913 1913 1913 1913
1913 1913
1913
1913 1913 1913 1913 1913
1916 1916 1916
1920 1920
1920 1920
1919 1919
1919 1919
1919 1919
1920
1913 1913
1919 1919 1919
1922 1922 1922
1922 1922 1922
1913 1913 1921
1913
1919 1919 1919
1915 1915 1915 1915 Ull5 1921
1921 1921 1913
2!3 260
235 239
5,884 :!'J9
251 303 'l:ll ' 453
1
6, 232 8, 02:! 259 i 342 ~~
159 217
113 I 128 138 179 I 221 221
119
107 106 112 129 528
107 107 96
192
113 121 117 71
407
113 103 95
197 I 102 833112!
152 88 309 f 113
193
97 132 53 70
471
28!
217 162 104 317 555
101 ! 67 Ill 1 111 108 11»
143 305
107 185
120 70
117 116
611 i 136
392 1, 006 : 144 338 151 324
272 298 277 280
;, 315 8, 403 278 299
158 226
125
110 109 IH 135 510
93 100 99
123 130
74 151
549
129 1.58
215
119 129 120 81
384
101 175
611 125
609 222
+9.6 +t.l
+14.4 +•.s
-17.9 -29.9
+71.9
+8.6 +18.5 +5.3
-39.8 -24.8
-17.6 +31.2
-10.7 -17.6
+11.0
708 1, 386 ' 781 1, 074 204 1,196 25 431
943 297
-12.3 -31.0
I
1,576 5,260
461
200 121
I 1: 1571
24 147 76
86 87
172
1 1~ I
; 1121 292
3001 32 114
94 92 93
106 96
107
107 110 93
563 73{
173
230 8S
'
349 39!
'l:13
273 72
2M 2'J2
19!
329 235
296 I 125 BS 151 i 121 142 686 I 136 . 154
14 105 72
16 134 150
198 79
112
328
262 26 81
I
94 I
92 I 93
105 96
106
109 110 92
2' ;! Hj 20' 86r 45 i
181 70
101
326
228 28 74
93 88 87
102 92
106
107 109 9S
l
7 71 41
26 100 32
187 70
107
3!8
238 29 77
92 89 88
102 93
106
107 109 98
139 359 + 15.J. 8 590 I, 775 +200. 6
161
252 125
B9 142 169
4 26 40
8 li 30
193 73
110
401
355 39
112
93 91 90
104 94
i;\ 97
1811
302 151
+t5.4
+17. 7 -20.7
145 163 99
-2.4 +15.0 -41.5
10 +185.1 29 +9.6 39 -1.7
I -88.8 13 -24.7 28 1 -7.7
192 TJ
104
298
250 23 75
92 91 1 90,
103 ' 114
107
108 110 98
-0.3 +0.2 -5.6
-25.7
-29.8 -4!.8 -32.8
-1.1 o.o o.o
-1.0 o.o 0.0
0.0 0.0
+1.0
• As of the first of the following month.

50
TREND OF BUSINESS MOVEMENTS-Continued
~~~~-~Items. m,;.ke4 w~~~-~t~;~c t•) have not been published previously m the SURVEY or nrc repented for special rcnsous; detailed tables covering back figures for th~se items will be rouud at tho end or this bulletm. For detailed tables covering other items, see lnst quarterly issue of the SuRVEY (No. 30).
1924
NUMERICAL DATA --~~··----
Corre- CUMULATIVE TOTAL FROM JULY 1 spending
· month, THROUGH L~TEST I January MONTH
,.Perct.li mcrease <+> :
orde· ' · crease 1
(-) 1 cumu-
Iative In manu cases lllarch figures are now
available and mau be found in tile special Januar table on page 29
BANKING AND FINANCE-Continued
Gold and Silver
1 or Feb-
Y I Feb- I ruary, runry 1923
1-
1923-24
1~922-23 1923-24 from i 1922-23
'
Gold: Domestic receipts at mint •••• fino ounces •• Imports •••••••••••••...••• thous. of dolls .• Exports •••.••••••••••••••• thous. of dolls ••
2 74,39 45,46
28 9 1
1 0
I
SilvPioduction ••••••.••••••• thous. of fine oz .• Imports •••••.••..••••••••• thOns. of dolls •• Exports ••••••••••••••••••• thous. of dolls .. Price at New York ••••• dolls. per tine oz •• Price at London ••• pence per standard oz .• !I
5,22 5,98 8.20 .63
33.54
FOREIGN EXCRANGE RATES
Europe: . England •..••••.••.•• dolls. per£ sterling •• Francc ••••••.•••.••••••.• dolis. per franc •• Italy •••.•.••••••••••••••••• dolls. per lire •• Bclgium •..•••.•..•••••••• dolls. per franc •• Ncthcrlands •••••••.•••• dolls. per guilder •• Sweden .................. dolls. per krone •• Switzerland ••••••••••••••• dolls. per franc ••
Asia: Japan •••••••.••••••••..•••• dolls. per yen •• India ••.••••••••.••••.••. dolls. per rupee ••
7 4.26 .04 .04
'.042 3
4 2
.37
.26 • 17 3
.44
.30 9 5
Americas: Canada .......... dolls. per Canadian dolL . 97 Argentlna ............ dolls. per gold peso.. • 73
4 7
BraziL •••.•••.••••••••• dolls. per milreis.. .109 Chilc ............... dolls. per paper peso.. .104
I 89,636 35,111
505
5,427 7,900 8,877 .644
33.565
4.31 .044 .044 .038 .374 .262 .174
• 454 .303
.969
.765
.120 • 101
General inde-" foreign cxch ••••• index number •••••••••• .......................... U.S. FOREIGN TRADE
Imports
Orand totaL .................. thOus. of dolls •• By grand divisions:
Europe-: TotaL ................ tbOus. of dolls •• France ................ thous. of dolls •• Oerman~· .............. thous. of dolls •• Italr .................. thous. of dolls •• United Kingdom ...... thous. of dolls ••
North America-TotaL ................ tho us. of dolls •• Cannda ................ thous. of dolls ••
South Amerlca'-Total •••••.••••••••.••• thOus. of dolls .. Argentina .••••••.••••• thous. of dolls ••
Asia and Occania-Total .•••••••••••.•.••• thous. or dolls •• Japan •••••••••••••••.• thous. of dolls ••
Africa, totaL •••.•••••••••• thOus. of dolls •• By classes of commodities:
Crude materials lor use in manufacturing .••••.••.•• thous. of dolls ••
Foodstuffs in crude condition and food anlmals •••••••• thous. of dolls ••
Io'oodstufis partly or wholly manuracturcd ••••••••••• thous. or dolls ••
Manufactures for further use in manufacturing •••••••• thous. of dolls ••
Manufactures ready lor consumptlon •••••••••••• thous. of dolls ••
Miscellaneous .•••••••••••• thous. of dolls .•
Exports
Grand total, including reexports •••••••••••••••••••• thous. of dolls ••
By grand divisions: Europe-:
Total ••••••••..•••••••• thous. of dolls •• France •••••••••••••.•• thous. of dolls •• Germany •••••••••••••• thous. of dolls •• Italy •••••••••••.•••••• thous. of dolls •• United Kingdom .••..• thous. or dolls ••
North Americn-TotaL ••••••••••••.•.•• thous. or dolls •• Canada ................ thous. of dolls ••
South Amerlcn-Total ••..•••••••••••••• thous. of dolls •.
. Argentina ............. thous. of dolls •• Asta and Occania-
TotaL ••••••..•••••••. thous. of dolls .• _Japan ••••••••••••••••• thous. of dolls .•
.Afrtcn, total ............... thous. of dolls ••
295,55 1
8 8
88,01 10,81 11,24 5,99
5 2
30,83 5
7 75,19 31,948
7 37,96 4,098
2 6
82,680 34,81 11,68
4
1
2
7
105,63
32,63
38,586
58,03
58,029 2,63
395,170
202,671 23,128 40,966 16,858 84,863
74,581 40,750
23,874 8,959
87,004 47,637
7,039
333,500
98,879 13,587 12,716 5,600
34,535
98,884 33,018
36,425 6,018
91,980 26,128 7,332
117,322
30,540
68,753
66,650
57,881 2,344
I 366, 135
200,729 19,946 49,080 15,889 74, 157
71,334 45,007
24,451 8, 728
58,170 20,837 5,451
I
I I
' I
72,284 733,834 752,019 +2.5
i 8,383 193,360 271,362 +40.3 1,399 36,603 7,139 -80.6
! I 4, 729 i 40,230 41,405 I +2.9 , 3,792 \ 45,531 59,300 +30.2 I 2,191 I 39,758 64,293
I=~~~~= . .643 ----------~ --------·--30.875 . ...................
~--····· 4.69 -·--------- ---------·-• 061 -------·--- .. ....................... ................ .048 ----------- ....................... .054 --------6·- •A•••••••••
.395 ----------- -----------• 266 .. ...................... ----------- 1:::::::: .188 -----·----- ----------· ___ ... ____
i : .484 ....................... ----------- 1 ......•• .318 -·--·------ ........................ 1------·-
i .987 ----------- ·---------- l ________
.842 ----------- -------·--- l·--·----.114 ...................... ....................... !········ .120 ---·------· ----·------ ·------· ! ! ---------- ----------- ----------- ;------·-I
'
303,412 2,326, 005 2, 333,619 +0.3
89,748 743,039 732,170 -1.5 10,277 99,668 97,655 ' -2.0 1
10,476 89,393 107,469 I +20.21 6,659 51,941 57,591 +10.9 ' 35,200 270,290 233,826 -13.5 I:
I 75,391 574,463 616,264 I
+7.3' I 28,291 271,332 282,165 +4.0 I
41,654 285,141 272,001 -4.6 i: 10,782 73,575 44,012 -40.2 ''
87,279 665,245 667,760 +0.4 24,850 I 255,964 235,488 -8.0: 9,340 58,118 45,424 -21.8 i
1:
127,467 925,598 795,195 -14.1:: 28,597 227,682 244,112 +7.2!1
38,641 262,225 312,415 +19.1
55,413 437,994 450,438 +2.8
52,267 457,776 511,448 +11.7 1,027 14,730 20,011 +35.9
306,957 2,653, 548 2,983,239 I +12.4
159,431 ,1,436, 740 1, 548,322 +7.8 13,791 186,0lii 195,120 +4.9 24,441 199,860 263,084 +31.6 10,705 123,193 123,821 +0.5 71,452 597,732 660, 756 I + 10. 5 : 74,664 659,288 698, 945 +6. 0 I 44,479 421,965 408, 221 I -3. 3 I
20,936 165,744 """" I +,., 9, 780 69,620 71,665 +2.9 i 46,996
I 355,700 511, 564 +43. s i I
17,650 133,519 222, 175 +66. 4 I 'I 4,931 37,076 42,000 +13.3 '
.
INDEX NUMBERS
BASE YEAR 1923 192! OR
FERIOD
I Jan. 1
Feb. 1
Nov. Dec., Jan. Feb. -----1----------
i I
II 491
1913 47 73 61 50 40 1913 618 158 749 615 856 661 1913 111 18 10 9 4 7
1913 93 85 I 88 85 94 97 1913 195 127 ' 176 273 200 264 1913 132 42 ' 168 182
1571 170
1913 110 1o8 1 107 108 106 108 1913 116 112 ! 119 121 122 122
I I I
96 1 j
90 80 88 89 Par. 96 ' Par . 35 I 32 29 27 24 23 Par. 25 1 25 23 23 23 23 Par. 31 1 28 25 24 22 20 Par. 98· 98 95 95 93 93 Par . 100' 99 98 98 98 98 Par . 97 97 91 90 90 90
Par. 98 97 97 94 90 91 Par. 65 65 63 64 63 62
Par. 99 99 98 98 97 97 Par. 88 87 74 75 76 79 Par. 35 I 35 27 29 34 37 Par. 66 . 61 57 55 53 52 Par. 68· 67 61 60 59 58
i I 1913 220 203 _195 193 198 i 221
I I 1913 144 125 I 130 130 122 137 1913 123 89 I 110 114 93 117 1913 90' 68 I 87 89 73 83 1913 186 ' 144 ! 234 190 130 121 1913 1481 155
' 122 128 136 152
1913 2201 232 226 210 231 304 1913 2581 239 325 303 270 I 279
1913 251 I 252 211 222 230 1 220 1913 5481 506 172 200 192 282
1913 361 ! 331 321 313 314 349 1913 376 I, 301
I 349 398 422 317 1913 896 i 472 I 256 384 591 371
' ' : 232 1913 276 i 253 194 204 209
1913 155 : 155 218 192 177 166
1913 189 234 216 167 234 356
1913 228 195 179 191 205 235
1913 186 I 152 186 1891
169 168 1913 1871 83 232 263 214 190
I i I
1913 162 1 148 194 2061 191 177
1913 1521 128 174 197 I 162 161 1913 1821 108 245 234 180 156 1913 89 83 97 110 140 167 1913 236 163 278 303 257 242 1913 170 145 203 250 172 151
1913 156 149 169 160 149 142 1913 145 132 136 135 121 134
1913 175 171 192 157 196 200 1913 201 213 201 137 196 190
1913 271 405 440 502 336 240 j
1913 257 339 674 721 915 400
1913 186 204 193 208 292 i 226
Per ct. in-
crease (+)
or de· crease (-) Jan. from Dec.
I I +20. -22.
5 8 7 +79.
+3. +32. +S. +1.
0.
I +1. -6.
I +2. -9.
0. 0.
+0. +1. -0.
-0. +3.
+10. -2. -1.
+12.
+12. +25. +J3. -6.
+12.
+31. +3-
-4. '+46.
I +11--24.
J-37.
I +11-
-6.
+52.
9 1 1 6 0
2 4 3 5 0 0 6
1 9
5 8 1 9 7
8
3 6 1 5 0
5 3
1 9
2 9 3
+14., 9
-0. -11.1
-7.
-1. -13. +19. -5.
-12.
-4. +10.
+2--2 .
s
0 8 8 7 6
4. 4
4 6
-33.1 -06. -22-
3 6

51
TREND OF BUSINESS MOVEMENTS-Continued
NoTE. Items markef with an asterisk(*) I NUMERICAL DATA I Pcrct.11 I INDEX NUMDEHS j Ic'tc.r
have not been pub 1shed previously in the •
1
inc(r+c>asc II
SURVEY or are repeated lor special reasons·, 1·n detailed tables covering back figures !or these I ! Corre- rl CUliULATIVE TOTAL corrc~~o· BASE ~-- - .. 1·-9··2· 3 --~--1-·11'21 ror~ct~~o-items will be round at the end of this bulletin. 1 ~ F d t ·1 d t bl · th · 1924 , spondingl FROM JULY 1 [ (-) · YEAR last quart~rly Issue or the SURVEY (No. 30). : crraso
or c a1 e a es covermg o cr ttcms, see 1 month, : Tnaouon LATEST 1 CtlmU· ·1 OR
In· niany cases March figures are nom __ II JoarnFueabry_ 'I ---~ONT~-- -: 119a23ti_v2e4; PERIOD I ( )
available and may be found in tlre special I Feb I I I I I 1 ~------·I J:O. _table on page 29 ·
1! January I ruar~ -! n:~· . 1922-2~ 1923:~: 1~~~~'h: _ _ J Jan .. ~~~!Nov. I Dec. Jnn. Fch.
1
1 ~~~ u. s. FOREIGN TRADE-Continued
1 j
1
' •
Exports-continued ,
Total, domestic exports only ••• thous. of dolls •• By classes or commodities:
Crude materials for use In manufacturing ___________ thous. of dolls .•
Foodstuffs in crude condition and rood animals ________ thous. of dolls .•
Foodstuffs partly or wholly manufactured. __________ thous. of dolls .•
Manufactures for further use In manufacturing •••••••• thous. of dolls ..
Manufactures ready for consumption •••••••••••• thous. or dolls ..
Miscellaneous .•.•••••••••• thons. of dolls ••
TRADE AND INDUSTRY OF FOREIGN COUNTRIES
United Kingdom
Imports (value): Total ••••.•.•••••••••• thous. of £sterling •• Food, drink, tobacco •• thous. of £sterling __ Raw materiaL •••••.• thous. of £sterling •• Manufactured artlcles.thous. of £sterling ••
Exports (values): Total ••••••••••••••••• thous. of £sterling •• Food, drink, tobacco •. thous. of £sterling •• Raw materlal.. •••..•• thous. or £sterling •• Manufactured articles.thous. of £sterling __
Reexports (values): Total.. •.••••••••••••• thous. of £sterling __ Food, drink, tobacco •• thous. of£ sterling __ Raw materlaL ••••••• thous. of£ sterling __ Manufactured articles.thous. or £sterling __
Exports or key commodities (quantities): Cotton piece goods •••••• thous. or sq. yds •• Woolen and worsted
tlssues ••• ______________ thous. of sq. yds •• Iron and steeL. __ ._ ••• thous. of long tons .• Coal •• -----·----------thous. of long tons ••
PrQduction: Pig iron •.•.•.•.••••••• thous. of long tons •• Steel ingots.:; ••• ~ •••• thous. of long tons .• CoaL •••••...•.••••• thous. of metric tons ••
Stocks, zinc •••••••••••••••••••••••• short tons ••
Production: Belgium
Zinc •••••••• ·····--------· ••••• short tons •• I
Total trade: Canada
389,0541
132,749 ! 13,792
59,319
54,627
127,928 639
•101, 259 40,739 39,208 20,960
64,235 4,515 9,530
48,782
13,311 3,2311 6,920 3,141
354,000
22,656 338
5,441
632 690
23,538 1,219
15,366
Imports •• ·--------------·-thous. or dolls.. 66, 56S
E Exports ••••••• ~-----------thous. of dolls.. 70,355
xports of key commodities (quantities:) 'Carmed salmon ••••••••• thous. of pounds__ 5,228 Cheese •••••••••••••••••• thous. or pounds.. 2, 278
B~heat ••...••••••••••••••• thous. of bushs.. 12,322 Bond fi::S~gs ........... , ..... mills. of dolls.. 1,339
~ovt. and provlnciaL ••••• thous. of dolls.. 8,300 C nnlclpaL ••••••••••••••• thous. of dolls.. 21,545
E ·
1orporation •••.•••.••••••• thous. of dolls.. 50,510
mp oyment:
358,576
113,862
13,927
52,287
50,374
127,433 693
96,705 42,296 32,539 20,976
•67,975 4,594 9,970
52,662
•13, 231 2, 918 7, 725 2,586
397,573
20,139 332
5,075
613 768
23,926 1,092
14,660
62,134 68,332
4,549 1,505
11,770 1,236
2,000 5,435
13,050
Total (1st of following .
N mo.) ••••.••••••••••.••••• index number.. ----·-·---ewsprint paper: ~~duction. ·------ •••••••••••• short tons •• S 1pments •••••••.•••••••.• · •••• short tons •• Etocks ••••••••••••••••••••••••• short tons ••
BuUd:tports (total prlntlng) ••••••• short tons ••
R U mg contracts awarded. __ tbous. or dolls ••
a road operations: ·
NFreight carried. _______ mllls. of ton-miles ••
et operating rcvenue •.••• thous. of dolls ••
• Revised.
109,875 IIJT, 966 16,493 113,708 6,538
2,474 1,771
111,664 109,901 18,195 99,621 21,249
302,010
77, 21JT
27,167
49,807
39,382
107,760 687
83,855 37,141 26,739 19,462
57,510 2,864 9,470
44,324
9,823 1,300 6,492 2,021
342,980
17,718 318
5,903
2, 613,071
745,012
309,921
388,040
291,735
873,352 5,011
700,471 323,083 226,384 158,469
493,184 23, li63 74,687
385,330
67,727 11,537 39,063 17, IJT3
3,077,008
135,651 2,535
48,565
2,931,048
996,753
149,380
397,767
391,092
992,633 4,323
756,871 339,094
. 241,609 172,463
576,859 33,565 82,606
391,819
80,296 20,014 41,424 19,793
2, 789,959
153,382 2, 775
50,156
+12.2
+a3.8
-51.8
+2.5
+34.1
+13.7 -13.7
i I
+8.111 +5.0 +6. 71 +8.8
+17.0 +42.4 +10.6 +1.7
+18.6 +73.5 +6.0
+15.9 i
-9.3: !
+13.11
t~J!
1913
1013
1913
1913
1{!13
1913 1913
1913 1913 1913 1913
1913 1913 1913 11113
1913 1913 1913 1913
1920
1920 1913 11113
543 71JT
22,229 221
3, 863 4, 877 +26. 3 i 1913 4,593 5,465 +19.0: 1913
179,096 186,934 +4. 4 . ,. 1913 --------·-· --·--·---·- -------- 1920
12,500 93,196 111,987 +20.2 I
I 65, 308 535, 168 569, 834 +6. ll I
58, 646 691, 291 738, 474 +6.8 i 2, 959 26, 665 38, 132 +43. 0 !
428 102, 659 106, 089 +3. 3 i 7, 129 180,754 204,122 +t2. 9 : 1, 028 10,382 11,838 +14. o I
--·-·-----1 185,650 250,342 +34. 8 il 25, 665 79, 184 45, 826 -42. 1 26, 095 71, 324 119, 153 +67.1 I :
·---------1------···-· -----·----·i ---··---: 91,686 761,073 863,581 I +13. 6 ' 90,795 754,297 867,7541 +13. 7 : 10,741 84,395 ···oo9;aa<l ---7so;s27·. -+iii~a·: 13, 311 · 202, 544 178, 1111 i -u. 8 !
b 2, s96 20,991 22, 210 I -6.1 1: : b695 38,0581 53,056 j +39.4 I
' '
1920
1913 1913
11113 1913 11113 1013
1913 1013 1913
10 1920
1910 1919 1919 19111 1913
1913 1913
b January, 11123. n Nine month's average, AprU to December, inclusive.
I 162 I I Hi9
I 172
188
131
168 132
1 156
I ~~ 135
153 124 161 155
IIJT 127 111 88
108
100 86
. 92
66 98 99 2
148 i 103
I 121 I 2/il
I 192 I 102
184 194
119 143
165 182 102 141
131 1, 159 15-1 194 114 137 121 138
131 ISO 105 172 16.3 182 129 144
108 lll 98 213
122 91 82 100
93 95
80 77 77 95
: 11: 111 117 Ill 104 I 6
206
285
105
210
154
178 87
170 104 170 134
146 163 173 140
114 198 95
110
87
86 86 96
73 102 00 5
191
207
98
230
165
196 95
158 168 167 130
147 166 164 142
146 243 130 128
96
102 82 89
74 108 97 5
176 i -7.8 I
178 . -14.2
ll'J i +1.0
193 -11.9
152 -7.8
196 -0.4 103 +&5
;
! 1st 1
11r. 139 130
155 169 171 154
145 220 145 105
liJT
91 80 83
72 120 98 4
-4.5 +3.8
-17.0 +0.1
+5.8 +1.7 +4.6 +&O
-0.6 -9.8
+11.6 -17.7
+12.3
-11.1 -1.8 -6.7
-3.0 +11.3 +1.6
-10.4
152 161 184 196 199 189 -4.6
I I 122
II 209
127
I 1i: I 167
117 187
168 3
85 133
m ··200· 219 423
129 117 442 398
I 478 304 122 62 766 685 239 196
204 3,186 18 18
123 347
119 224
298 18
147 173
188 223 8111
811.5 89.9195.7 88.7 90.6
I 148 136 165
1
139 134 163 92 8S 159
1
150 . 153 187 31 I 42
1
49
135 I 11JT 238 I 11 I (II) 201
142 163 148 159 120 131 172 170 67 20
204 129 131 28
II Relative to 1anuary, 1920.
21 Deficit.
111 217
2.?9 12
140 159
45 56
211
90.7, 166 162 144 180 66
-6.7 -2.9
-13.0 -33.9 -4.6 -7.7
-75.9 -74.8 -74.2
+0.
+1.6 +1.8
+10.3 +6.3
+225.0

52
AUTOMOBILES [Base year In bold-faced type; Index numbers on opposite page]
YEA!\ AND ~lOl!tD
PRODUCTION I I SDIPJ\IENTS t ' I EXPORTS t
1----~-----r----lil----~-------------~----~·~---------.----l i Ratto Assembled
I :ortotall----.----;---- Foreign Accesso-Total Passenger Trucks By ran- Driven By boat :exports I I assem• rles and
cars 1 · road awa:v . to pro- Passen- Trucks bly parts I .ductlon Total ger cars , ____ ....._ ___ _;.i ____ J~----··1-----'----- ----_____ ,_ __ _! ___ ...J_ ____ , ____ ,
I Thous. or
Number or cars Carloads Number or cars ! Per cent Number of cars dollars
l-----------!------c---.----l~-----l-----,-----1 1----\------,-----,----,----\·----\
~:im ~:~~ 1
!::::::::::: :::::::::::::::::::::, t~ ~i:~ ~:~gr ~ :::::::::: $~~
I
1913 monthly averag~ •••••••• 1014 monthly average •••••••. 1015 monthly avcrnge •••••••• 1916 monthly av~rnge •••••••. 1917 monthly average •••••••• 1918 monthly nverage •••••.••
19111 monthly :>verage •••••••• 1920 monthly average •••••••• 1021 monthl)' nverage •••••••• 1022 monthly nvernge •••••••• 1923 monthly a;erager······
1021 I Januarr ••••..•••••••••••••••• l February •.••••••••.••••••••• !\larch ••.•••••••••••••••••••• April ••••••••••••••.••••••••••
Mar •••••••••••••.••••••••••• ,
1~r;:.: :::::::::::::::::::::::1 August ••••••••••••••••••••••• ! September ••••••••••••••••••• October •••••••••••••••••••••• November ••••••.•••••.••••••
o~mber.~-~~~···········--~
~~~:~0~~·::::::::::::::::::::: .\priL ..•••..........••••.•.• :
i:~~i~~~~~~~~ ~ ~ ~~ ~ ~ ~ ~~ ~~~~~j i Srptember ••...•.......•.•. ··:
October .•.•......•......•...• : Xovember ••••••.•...•..•••• .i DIX't•mber ••.•..•••...•..•.... :
1923 ' Jnnuarr .•..••••••••••••.••••• i February ••••..•••••••.•••••• ! ~~~y~~::::::::: ::::::::::::::1
I
§~;~~~~~ ~ ~ ~~ ~ ~~ ~ ~ ~~ ~~ ~~~~~~~ I
September •...••••••••••••••• October ...•.••..•••••.••••.•• '
~~~c:~ce{.::: ::::::::::::::::1
40,416 47,422 74,385
131,068 155,746 00,137
16-1,50il 183,767 140,205 215,504 334,408
47,017 75,918
143,591 104,009
195,508 164,501 176,752 181,156
158,648 H7,923 116,568 79,383
91,272 122,521 li:l,IJS.I 219,864
256,5;;9 289,351 247,132 274,18~
207,156 239,361 237,301 228,364
243,539 276,934 355,030 382,695
68,218 6,167 I 16,ot8 ••••••••••• ·-···-····j 7.2 5,330 3,489 ~·.~~ •••••••••• ~·t,ll~ 124,468 1, 500 1 22,598 ••••••••.•••••••••••• , 5.1 6, 737 6,160 ··--······ , 145,006 10,680 ,. 22,462 ••••••••••••..••••••• , 4.3 6,687 35,,048078 1,207 ---······· 2,635 77,199 18,938 ' 13,456 -·········· ····-····· 4.1 3,937 869 -----····· 2,801
\3s~:~;g 22~:::r I 2zg:;i: ···a9;2s9· .... i;69s· *:~ 1~:~~ &~~~ k~: :::::::::: ~:~t~ m:g~r ~:~~
1
1
1
273169::'2031 4~5:~H i:~~ H ~:~~ ~:g~~ g~ ::::i;~ii= UU
303, OM 31, 344 • • I • I • 12, 658 10, 586 2, 072
43,086 68,088
130,263 176,439
177,438 150,263 165,616 167,756
144,670 134,774 100,081 70,727
81,696 109,171 152,962 197,224
232,462 263,053 225,0S6 249,492 187,604 217,566 215,352 208,010
223,819 254,773 319,770 3U,639
4,831 7,830
13,328 18,070
18,070 14,328 11,136 13,400
13,978 13, 149 10,487 8,656
9,576 13,350 20,022 22,640
24,097 26,298 22,()!6 24,692
19,462 21,795 21,~9 20,3M
19,720 22,161 35,260 38,056
6,485 9,986
16,287 20,187
18,608 20,269 19,514 20,758
19,002 17,808 14,264 12,310
15,357 19,636 27,753 31,334
33,416 34,230 29,116 32,817
26,335 ZT,IOO 27,232 27,244
35,228 36,165 44,983 46,095
3,185 i,507 9,939
14,197
16,193 18,834 15,533 15,218
13,840 12,971 10,528 7,501
7,479 10,173 16,917 22,381
28,827 33,857 28,100 36,768
30,177 35,203 27,376 26,743
30,031 43,613 62,988 60,467
93 99 75
1, 619
2,381 3,~7 3,726 3,595
2, 950 2,226 1,402
188
143 ISO 560
2,960
7,400 7, 737 7,030
10,1ot
8,118 7,605 5,070 I 1,307
728 882
1,1l08 5,027
15.4 4. 7 1.8 1.6
I. 5 1.4 1.5 1.4
I. 7 2.0 2.1 4.0
3.1 2.9 2.9 3.3
3.1 3.1 2.6 2. 7
3.5 3.0 2.6 3.7
3.0 3.8 3.8 4.1
7,378 3,587 2,629 3,078
2,~1 2,382 2,563 2,618
2,669 2,924 2,504 3,167
2,871 3,550 5,001 7,317
8,001 8,939 6,422 7,405
7,157 7,237 6,079 8,511
7,392 10,549 13,375 15,582
5,819 2,492 2,019 2,469
2,479 1,004 2,224 2,237
I
2,1971 2,329 2,075 2,646
2,407 3,096 4,471 6,438
6, 798 7,818 5,600 6,143
5,862 6,446 5,276 6, 740
6,040 8,851
11,811 13,352
1,559 1,095
610 609
462 418 339 381
472 595 429 511
464 454 590 879
1,203 1,121
822 1,262
1,295 791 803
1, 771
1,352 1,698
1 1,564 2,230
•9,037 •9,037 '9,037
9,514
9,679 3,427 3,099 3,196
3,205 2,212 1,953 1, 787
2,571 2, 702 2,546 2,684
2,001 2,838 3,697 3,933
3,160 4,090 2,825 2,679
3,227 3,166 3,304 3,417
4,421 4,681 4,695 5, 720
3~. 088 350, 410 43, 678 45, 397 62, 346 12, 812 3. 8 15, 105 12, 500 2, 605 11, 386 5, 559 378, 507 337, 362 41, 145 ' 40, 281 59, 099 13, 492 3. 8 14, 518 12, 387 2, 131 10, 343 4,599 327,993 297,330 30,663 32,623 46,837 10, 131 4. 5 14,922 11,817 3,105 9, 056 5, 023 345, 202 314, 373 30, 829 38, 319 45, 958 10, 053 2. 9 10, 057 8, 411 1, 646 8, 803 4, 428
327, M9 298,911 28,638 35,986 39,653 8, 463 3. 6 11,691 10,466 1, 225 8, 074 5, 302 365, 189 335, 023 30, 166 42, 236 37, 947 7, 663 3. 5 12, 775 10, 456 2, 319 8, 890 4, 917 312, 993 284, 923 28, 070 38, 133 32, 859 6, 413 4. 4 13, 795 10, 875 2, 920 7, 002 4, ~ 303, 182 275,439 27,743 34,984 27,608 4, 000 4. 0 12,135 10,069 2, 006 6, 031 5, 3
102-& : 40 Jnnuarr·;············-·····-·! 316,H8 287,302 28,846 46,359 40,976 1,018 4.9 15,459 12,614 2,845 9,256 6,\
3 Februar) •••.•••.....••..•••• 3&7,435 336,363 31,072 49,219 48,300 1,100 4..1 15 033 13 329 1,704 11,464 7,0
~1
~1~=~~: ::::::::::::::::==: :::::::::::r=========r=========i =========== ::::::::::: · · ··-····--- ::::::::::: 1 Month!}' !IUtomohile production data beginning July, 1921, represent practically complete productlon
1tncludlng total membership of the National Automobik Clw.~·
btr of Commtrce and reports to the Bureau of the Ctn&u& from outside manufacturers. Annual figures tnrough 1921 represent complete production as compiled by t. 1
National .-tutomobile Chamber of Ctm~merce. Monthly figures from Jannary, 1920, through June, 1921, have been estinlated by the Cltveland TTuat Co. on the basis or sbtP" ments and are ¥.tven to detail in the July, 1923,lssue (No. 23) of the Suroev of Current B~t~lneu.
2 Automobile shipments, reported by the National Automobile Chamber ot Commerce, represent factory shipments for practically the entire industry. • Automobile exports compiled by the U. S. Department of Commerce, Bureau of Foreign and Domeatic Commerce. • Interpobted from d:1ta g1vtnr total for the first quarter of the year.

53
AUTOMOBILES [llase year In bold-face type; numerical data on opposite p;lgt)
YKAR AND MONTH
PRODUCTION
Total
1
Passen- I : ger cars i
i
Trucks
Relative to 1919
SUIPl\fENTS•
I Ry raU- 1 Driven
road away
' Ratio of 1 I total t'l· • II)' boat : ports to
I i· produe-1 tlon
---~~---
Helntive to IU20
A~sembiNI
Fort'1Rn I AC'c-e••"" asSC!mbl)· rlrs and l part• Total
1'3 '""""1 Trurks ger r.ars
Hrlatiw to IUW i.;·t-••1. to IP2)1l<·l. to ll'lr.
---- ----·---1913monthlyaverage ••• , 25 28 7 ). ······-···-~-------·---: ••.••.••••• :
!~
1914 monthly average... 29 33 8 -··----~~-- --·········!--- ···----~
~~~~ ~~~~~~~ :~~~:~===~i ~g ~~ ~ II 10~ :::::::::::11_::::::::::1, 1917monthlyaverage ••• : 9.5 1 105 41 , !01
1
..................... ,1 1918monthly average... fi8 56 72 1 M ---···---·· ········-··)'
1919 monthly average ..• ' 100 100 100 I ll3 I · I 1920monthlyaverage... llZ 114 102 li 100 -----iil<i- 1 ··ioo--1 1922monthly average ••• ' 131 , 141 u
131 IOi 171 121 102 98
100 186 55 71
22 21 77 98 117 57
100 :l()j 46 !l5
90 184
1921 monthly average... 85 93 7477 'II
13782
I ~51 : 140:3° I
1923 monthly average .. -I 203 ' 219 119 / 187 117 145 ,
I ----·---.!..._ __ .:.:.._ --~-----'----. p 1921 '
January •••••••••.•••••• -I
Ri~~-~-:·~::::::::::::! ~!:::::::::::::::::::: i.~i~:::::::::::::::::i September ••..•••••••..• / October •••.•••••••.•.••• : November.------·-·----' December·-_. ___________ !
1922 January ••••.•.••••••••.• , February ••.••••••• ___ •• -I March ••••. ___ .•••••...• ' ApriL ••••.••••••....••• '
~~::::::::::::::::::::: August ____ •..••••••••.• _,
September •...•••••••.•• · October .••••••• ------- •• November •••.•••••••..• : December •••••••••...••• '
1923 January ••••..•••••••• _ •• ,
r:~~BfY-----····--·----; April •• ::::::~~::::~:~:~::
May ••••••••••••••...••• June ' July-~====~::::~::::~:: ::i August ••••••..•••••••••• 1
29 46 87
118
119 100 107 110
96 90 71 48
55 74
105 134
156 176 150 167
126 146 144 139
148 168 216 233
240 230 199 210
120 140 168 161
152 130 124 124
103 63 45 34
59 79 Ill 143
168 190 163 181
136 157 156 151
162 184 231 249
254 244 215 228
18 30 51 69
69 54 42 51
53• 50 40 33
36 51 76 86
91 100 84 94
74 83 83 77
75 ' 84
134 144
166 156 116 117
31 48 78 96
89 97 93 99
91 85 68 59
73 94
133 150
100 158 139 157
126 130 130 130
168 173 215 2"20
217 193 156 183
s 19 25 36
39 48 40 39
35 33 27 19
19 26 43 57
73 78 72 94
77 90 70 68
77 ll1 161 154
159 151 119 117
il' 2 2
3~ I 51 84 79 77
63 47 30 4
3 4
12 63
158 168 150 213
173 162 108 28
15 19 41
107
273 287 216 214
See footnotes on opposite page
36i 112 43 38
36 33 36 33
40 48 liO 9$
74 69 69 79
74 74 62 64
83 71 62 88
71 90 90 98
90 90
107 69
43 3:"t 37 :J&
3!1 42 3G 41i
42 51 73
100
116 130 93
107
104 105
8& 1~'3
107 153 194 226
219 211 216 146
3U 33 62 ll2 98 55
100 212
46 100 189
43 55 bO
uo 122 140 100 llO
105 115
!14 120
lOS 158 211 239
2Zl 221 211 150
(,
Z! :~f .......... 1
O:i ~·. ·-·--.- -1
f',(; ... 1
:::::::::~ 100 1&7 48 74
lf.O
·-·-·····--1 ·-·········! ...... iii•"i
120 .......... . 84 4i 47
36 .......... . 32 26 29
36 .......... . ~6 33 3V
: ........ \ .. .......... 1
I 36 ........... ! 35 ........... [ 45 68
93 ··-------·-86 63 97
I~ :::::::::::i 62
136 :~:::::::::1
104 131 120 172
201 164 239 127
• l(r'J
' HJ'.I • 102
Jn7
1:!.• lli 10'.1 II'J
l~· 1211 132 161
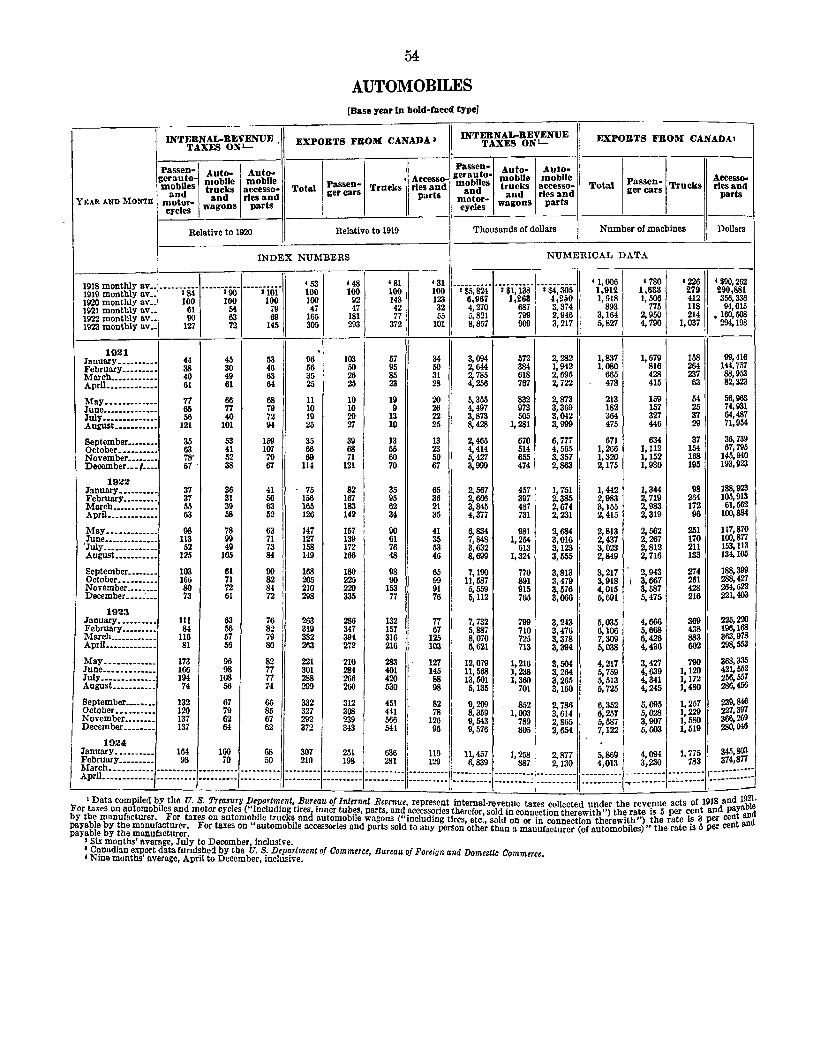
YRA.R A.ND MONTn
54
AUTOMOBILES [Base year In bold-faced trpe]
EXPORTS FRO.l\l CANADA• i
INTERNAL-REVENUE . EXPORTS FROM CANADA 3 INTERNAL-REVENUE . TAXES ON'- TAXES ON'- I
l----~----.----n----.----.----,-----11~--~~---r----l!----~---.----~----~ I Passen- Auto- Auto- i Passen• Auto
gcrauto- moblle mobiles trucks
and and motor• wagons crcles
Automobile
accessories and
parts
Relative to 1920
Total Passen• Trucks ger cars
Relative to 1919
1 Accesso- •gerauto- mobile moblle i rles and m::~es trucks accesso-1 parts motor- and rles and 1 cycles wagons parts
Thousands of dollars
Total Passen- Trucks ger cars
Number or machines
Accessories and
parts
Dollars
INDEX NUMBERS NUMERICAL DATA
1918 monthly av •••••••.•••••••••••••. 1919 monthly IIV •• '84 I 90 I 101 1920 monthly a\·.. 100 100 100 1921 monthly av •• 61 54 79 1922 monthly av •• 90 63 69 1923 monthly nv •• 127 72 145
1921 January •••••••••• February ••••••••• March •••••••••••• April •••••••••••••
'May ••••••••••••• June •••••••••••••• July •••••••••••••• August •••••••••••
September •••••••• October •••••••••• November •••••••• December ••• / ••••
1922 January •••••••••• February ••••••••• March •••••••••••• ApriL ••••••••••••
1\fay •••••••••••••
'~:!J~~:::::::::::::: August •••••••••••
September •••••••• October •••••••••• November •••••••• December----~---
1923 January •••••••••• February ••••••••• March •••••••••••• April •••••••••••••
44 38 40 61
77 65 56
121
35 63 78' 57 .
37 31 55 63
98 113 52
125
103 166 80 73
111 84
116 81
45 30 49 61
66 77 41)
101
53 41 52 38
36 31 39 58
78 99 49
105
61 71 72 61
63 56 57 56
53 46 63 64
~I 72 94
159 11)7 79 67
41 56 63 52
~I 73 84
90 82 8! 72
76 82 79 80
•53 100 100 47
165 305
96 56 35 25
11 10 19 25
35 66 69
114
75 156 165 126
147 127 158 149
168 21)5 210 298
263 319 382 263
• 48 100
92 47
181 293
103 50 26 25
10 10 20 27
39 68 71
121
82 167 183 142
157 139 172 166
180 225 220 335
286 347 394 272
• 81 1· 100 148 42 77
372
57 95 85 23
19 9
13 10
13 55 60 70
35 95 62 34
90 61 76 48
98 90
153 77
132 157 316 216
• 31 100 ""i$5;82-i" ""i$i~i38" ""i$4;305" 123 6,967 1,263 4,260 32 4, 270 687 3, 37 4 55 5, 821 799 2, 946
101 8, 857 909 3, 217
34 3,094 50 2,644 31 2, 785 28 4, 256
20 26 22 25
13 23 50 67
65 36 21 35
41 35 53 46
65 99 91 76
77 67
125 103
5,355 4,497 3,873 8, 428
2,465 4,414 5,427 3,999
2, 567 2,606 3,845 4,377
6,834 7,848 3,632 8,699
7,190 11,587 5,559 5,112
7, 732 5,887 8,070 5, 621
572 384 618 767
832 973 505
1,281
670 514 655 474
457 397 487 731
981 1,254
613 1,324
770 891 915 765
799 710 725 713
2,282 1,942 2,695 2, 722
2,873 3,369 3,042 3,999
6, 777 4,565 3,357 2,863
1, 751 2,385 2,674 2,231
2,684 3,016 3,123 3,555
3,813 3,479 3,576 3,066
3,243 3,476 3,378 3,394
May............. 173 96 82 221 210 283 127 12,079 1, 216 3, 504 June............. 166 98 77 301 284 401 145 Ill, 568 1, 238 3, 264 July.............. 194 108 77 288 266 420 88 13, 501 1, 360 3, 265 August........... 74 56 74 299 260 530 98 5,135 701 3,160
September........ 132 J 67 66 332 312 451 82 1
9, 209 852 2, 786 October.......... 120 79 85 327 308 441 78 , 8, 359 1, 003 3, 614 NDovembeber •.•••••• 137 6
642 67 292 239 566 126 1 9, 543 789 2, 865
eeem r. ••••••• 137 62 I 372 343 544 1 96 9, 576 805 2, 654
' Janu!r~~-~---···· 164 100 68 307 251 636 ! 119 I 11 457 1 258 2 877
!*8~~::::::::: ======~~== ::::::;~== ======~~==! ====~~~== =====~~~== =====~~== i=====~~== [====~~~~= =====;~;r==~~~~=
'1,006 1,912 1,918
893 3,164 5,827
1,837 1,080
665 478
213 182 364 475
671 1,266 1,320 2,175
1,442 2,983 3,155 2, 415
2,813 2,437 3,023 2,849
3,217 3,918 4,015 5,691
5,035 6,106 7,309 5,038
4,217 5, 759 5,513 5, 725
6,352 6,25f 5,587 7,122
• 780 1,633 1,506
775 2,950 4, 790
1,679 816 428 415
159 157 327 446
634 1,112 1,152 1,980
1,344 2, 719 2,983 2,319
2,562 2,267 2,812 2, 716
2,943 I 3,667
3,587 5,475
4,666 5,668 6,426 4,436
3,427 4,639 4,341 4,245
5,095 I 5,028 3,907 5,603
• 226 279 412 118 214
1,037
158 264 237
63
54 25 37 29
37 154 168 195
98 264 172 96
251 170 211 133
274 251 428 216
369 438 883 602
790 1,120 1,172 1,480
1,257 1,229 1,580 1,519
• $90,262 290,881 356,336 94,015
• 160,508 294,198
99,416 144,757 88,953 82,323
56,963 74,931 64,487 71,954
36,739 67,795
H5,940 193,923
188,923 105,913 61,562
100,884
117,870 100,871 153,113 134,105
188,399 288,427 264,622 221,403
225,220
1
. 196,168 363,978 298,553
368,335 421,552 256,557 286,456
239,846 227,397 366,269 280,046
5, 869 4, 094 1, 775 345, 80371 4,013 3,230 783 374,8
.......... :.;:::::::::/==~:::::: :::::::::::: 1 Data compiled b! the U. S. Treasury f.!partm.ent, !Jure.au of Internal Revenue, represent internal-revenue taxes collected under the revenue acts of 1918 and 191~
For taxes on automobiles and motor eycles ( mclurlmg tires, mner tubes, parts, and accessories therefor sold in connection therewith") the rate is 5 per cent and payab d by tbe manufacturer. For taxes on automo,~ilc truck~ and autol!lobile wagons ("Including tires, etc:, sold on or in connection therewith") the rate !~ 3 per cent ~d payable by the manufacturer. For taxes on automobile accessories and parts sold to any person other than a manufacturer (of automobiles)" the rate IS 5 per cent a payable by the manufacturer.
J Six months' average, July to December, inclusive. 1 C~nadian export data Curni~hed by tbe U. S.· Dep~rtment of Commerce, Bureau of Foreign and Domestic Commerce 'Ntne months' average, April to December, mclus1ve. ·

YEAR AND MO:<TH Total
55
MACHINE TOOLS [Base year In bold-faced type]
Radial driUs
__ j__
SlllPl\IENTS
Upright drills Shapers
_______ )__
Relative to 1913
I ~lii1I;;~;i~~htn~s- ___ ; ORnERs I
______ ____ ____ _ _ ___ (aU classes} 1
' u 1 I Plain I i 11 versal horizontals _____
1
,
I Rel. to 1920 l---...,..--------l------:------;----.----,----,--l--
60.2 47.7 1901 monthly average ________________ 69.5 53.0 81.3 74.9 1902 monthly average ________________ 87.8 80.1 102.1 1903 monthly average ________________ 85.3 66.0 97.6 1904 monthly average ________________ , 70.8 54.2 87.6 1905 monthly average ________________ 103.1 95.8 116.9
1906 monthly average •••• ____________ 122.5 141.0 139.8 1907 monthly average·--------------- 125.0 131.3 142.4 1908 monthly average .... ____________ 50.3 29.0 57.0 1909 monthly average ________________ 84.4 62.7 91.4 1910 monthly average ________________ 104.8 91.0 111.6
1911 monthly average ________________ 83.9 81.0 83.1 1912 monthly average ________________ 112.4 112.4 115.5 1913 monthly average ________________ 100-0 100.0 100.0 1914 monthly average ________________ 66.3 52.6 67.5 1911i monthly average ________________ 138.3 100.5 126.1
1916 monthly average ________________ 172.2 107.0 151.0 1917 monthly average ________________ 192.1 205.0 160.9 1918 monthly average ________________ 181.2 241.0 133.1 1919 monthly average ________________ 143.6 164.0 114.7
1920 monthly average ________________ 135.5 132.4 124.2 1921 monthly average---------------- 20.5 29.2 16.0 1922 monthly average---------------- 25.6 30.0 20.8 1923 monthly average ________________ 44.5 66.0 41.5
1921
~ae't~~Y:: :: :::::::::::::::::::::::: 39.8 66.6 30.0 31.7 59.5 24.3
March_------------------------------ 30.5 61.9 22.0 ApriL _____ • ___ • ___ . __ •. ---_._ .•.•••• _ 22.6 44.0 13.3
May------------------·.------------- 22.3 22.6 25.8 June __ ••••••• _ •• _ •• _ •• __ . ___ •.•• _._ •• 18.7 19.0 14.0 Jnly ------------------ -------·-- ------ 13.8 20.4 11.4 August ... _._.-- •. ---._.- .•••• -.-----. 12.3 5.1 9.4
September_.------------------------- 9.4 3.8 9.6 October. __ ._. _____ •• _._. ____ .---••••• 11.7 11.5 8.1 November ____ .-------------.--- ..... 15.8 11.5 16.0 December .. _._._ •• ___ ••• _ •• ___ ....... 12.9 21.7 6.2
1922 January-----------------------·------ 15.7 17.8 11.6
~~:c'tS:~ ~::: :::::::::::::::::::::::: 12.6 17.8 7.9 20.5 23.8 20.2
ApriL ___ --••• -. __ ._.--.--·.---------- 23.5 34.5 20.8
May--------------- _____ ---------- ... 21.5 30.9 18.4 June_. ______ ••• _ ••• _ •••• _. __ ._._._--. 27.4 10.0 21.0 July ____ ._ ••• ____ ••• _ ••• __ ........ __ •• 29.2 42.5 22.8 August_ .. ___ •• _._.- ••••. --.---------- 35.6 34.5 32.6
September.--·----------------------. 30.4 42.8 24.8 October·-------·--------------------- 35.1 48.8 27.2 November •• ------------------------- 31.3 48.8 25.0 December ... _. ___ •••• _. __ ._ ••• __ •••• -~ 31.9 29.7 29.3
JanuarY-------~~~-~-----·--------··-- 33.0 42.8 28.8
~~:c'ta~~~::::::::::: ::::::::::::::::I 43.1 57.1 43.8 58.5 75.0 52.5
April ____ • ___ .---------- ___ .. ______ ._. 60.0 67.8 54.0
May ... ___________ •• ----------------_ 57.5 77.5 56.3 June. ____ • ______ ._. ________ -------- __ 51.8 71.5 54.0 July-------------- _________ ........ --· 45.1 76.3 42.4 August. ______________________________
51.2 93.3 54.0
~':ft~t~r~~~::::::::::::::::::::::::::: 37.5 59.3 35.6 44.3 66.6 44.0
November •• ------------------------- 35.0 64.2 31.0 December------ ..... ------ ... -------- 29.4 40.0 24.5
91.3 95.4 67.9 98.7
122.8 127.3 43.5 92.1 99.4
95.7 116.1 100.0
68.5 119.5
180.3 220.6 199.4 160.7
156.3 25.6 35.3 49.3
42.8 43.5 35.7 24.1
18.6 27.2 17.1 18.6
8.5 24.1 20.2 26.4
24.9 17.1 24.1 23.3
27.2 47.4 34.2 56.0
40.4 53.6 32.6 42.8
39.6 49.0 79.3 70.0
66.9 54.4 49.8 38.1
35.0 41.3 36.6 26.5
76.2 59.5 76.3 59.6 64.2 57.5 91.0 82.8
86.1 96.4 62.3 74.9 75.7
87.1 97.3
100.0 73.5
141.2
196.0 274.1 260.1 211.9
155.6 35.2 30.9 40.6
73.6 51.0 48.0 43.0
28.0 35.0 26.0 27.0
22.0 30.0 20.0 22.0
26.0 23.0 18.0 27.0
30.0 31.0 42.0 45.0
34.0 39.0 34.0 24.0
41.0 40.0 57.0 68.0
40.0 44.0 45.0 27.0
35.0 36.0 33.0 22.0
95.6 95.6 40.6 111.1
115.2
76.8 110.4 100.0
63.2 206.4
247.6 207.0 243.2 166.7
141.6 14.0 25.7 40.0
29.0 15.2 22.1 24.2
10.3 14.5 6.9 9.0
4.1 12.4 11.0 9.0
12.4 13.8 18.0 23.7
14.'9 37.0 29.0 21.4
29.7 32.4 38.0 38.0
29.7 30.4 48.9 60.0
54.3 36.5 31.8 47.6
35.9 40.8 31.2 3-1.8
.............................. ,
100.0 18.0 34.9 59.3
20.1 18.9 23.5 20.9
17.3 15.2 14.4 18.4
14.1 15.6 17.9 19.4
23.3 20.3 21.6 28.0
36.0 42.0 43.2 31.2
46.1 40.9 43.4 43.0
71.4 58.1 77.2 71.0
58.5 56.4 55.9 63.1
48.7 52.6 53.11 45.1
1924
tl~1~f~~====~==========~==~ ~ ~ ~ ~ ~~ ~ ~ ~ ~~ ~ ~ ~ ~ 1 ~ ~ ~ ~~ ~ ~ ~ ~ ~ ~ ~ ~ ~ i ~ ~ ~ ~ ~ ~ ~ ~~~~~~~I~~~~~~~~~~~~~~ I~~~~~~~~~~~~~~ ~ ~ ~ ~ ~ ~ ~ ~ ~ ~ ~ ~ ~ ~! ~ ~ ~~~~ ~ ~ ~ ~ ~ ~ ~~ ______ ~~J ____ 1
I I I i i \
t~!ii~ ~ ~ ~~~ ~~ ~ ~ ~ ~ ~~ ~ ~ ~ ~~ ~ ~ ~ ~ ~~ ~ ~ ~ ~ l~ ~ ~ ~ ~ ~~~~~~~I~~~~~~~~~~~~~~ I~~~~~~~~~~~~~~ i ~ ~~ ~ ~ ~ ~ ~ ~ ~ ~~ ~ ~ / ~ ~ ~ ~ ~ ~ ~ ~ ~ ~ ~ i ~ ~ ~ ~ ~ ~ ~ ~~~~~~~I~~~~~~~~~~~~~~! I Compiled by the National Machine Tool Buildera' Association. Shipments data arc made up from reports of 29 firms representing about
20 per cent of the membership, but as they cover standard machines and the contributors are most of the larger firms they arc fairly typical. Orders data are an aggregate of reports from 70 firms, stated to represent 60 per cent of the industry. The index numbers are based upon Quantity figures. Shipments data were discontinued at the end of 1U23. The index numbers on orders ha\'e been recomputed to a 1Q20 buse from original data based on the average of the first three months of 1920, which represented tpe peak point.

YEAR AND MoNTH
56
ORDINARY LIFE INSURANCE SALES BY DISTRICTS ' (Base year In bold~faced type]
total trial trial tural 1 total trial trial tural South
ern Far
Western I United I Eastern l Western
11 Western~ South~ I Far llll United Eastern Western I Western I states, Indus~ Indus~
1
Agrlcul~ ern Western, States, Indo~ · Indus~ Agrlcul•
I-- - ------.. - -: ----'----'--------'-----'-----.!........---Thousands or dollars 1 . Relative to 1921 11
i ::------------------------1
INDEX NUMBERS ii NUMERICAL DATA i: ___ _
:~~~ ~g~i~~~-~~-~~-~-~~-~-~:-::_:_J __ ii ~~g ~--W-)9o"""""""'l--1~-~ ..... ~--1-1~-o ..... --1-1~-o-~: '4foi:~~ I 1923 monthly average ...... \ 129 135 134 112 127 133 549,291\
I
1921
~~~~ir;.::::::::::::::::::' March .••••••••... --------·1 April ••••••••••••• -.----- ••
r~!:::::::::::::::::::::::l July •••••••.••••••••••••••• August ••••••••.•••..••••••
September ••...••....•••.•• October •••..•......•.••••• November ••••••••.......•• December •. __ ....•••.••.••
January--~~~~---·-·······! February •.•••••••••••••••• March ••••••••••••.....••.• ... pril ••..............•...• -1 May •••....•••••••.••••.•• June •••••••....•••..•••.••• July •••.....••..........•.• August. .••......••.•..••••
September.-----··········· October .................. . November ••••••••••.•••••• December •••••.•••••.••..•
1023 January ••••••••••.•••...•• February •••..••..•••••..•• March •••••.•.•••.••••••••• April ••••.•....••.•.• _____ _
May ••••.••..•••.••.• _. ___ _ June •••...•..••..••...•.••• July •••••....••...•.••....• August •••..•...•••..•..••.
September .•.•.•••••••.•••• October .•••••..••••..•••••• November .•••••••••••••••• December •••••.•••••....••
1924 January •••••••••••••..•••• February·-·-·-·······-····
100 99
112 108
114 107 92 93
81 94 91
110
96 98
113 107
120 115 104 102
93 108 110 130
110 114 140 133
147 !39 126 127
112 131 129 144
127 129
: 108 i 107 104 99 113 113 110 lOS
116 109 109 104 87 92 89 92
77 82 93 92 87 92
107 114
110 98 109 98 122
I 113
110 107 I
126 I !20 us
I U6
106 108 101 107
92
I 94
lU 112 114 111 131 125
I
125
I 108
129 us 150 147 141
I 137
159 148 142 144 124
I
132 129 135
114 115 138
I 141
138 138 134 152
I
154
I 125
147 134
i II 95 83 92 421\,709
91\ 91 96
I 419,289
115 108 112 477,659 111 108 104 460,566
114 111 116 I
482,654 107 lOS 106 453,085 96 94 91\ 389,767 93 96 102 394,073
84 84 84 344,553 94
I 96 96 399,070
88 103 I 91 385,896 109 120 103 467,186
79 82 88 406,573 ,84 91 89 415,405 103 107 108 480,960 99 113 107 456,491
108 117 120 508,130 107 us 111 488,771 96 107 102 443,805 90 103 118 433,933
87 100 97 396,610 94 105 113 460,794 99 lOS 118 466,694
120 145 134 553,333
94 101 103 466,880 97 106 103
I 485,930
116 143 128 593,213 114 134 185 566,844
129 143 146 I 625,957 122 143
I 143 590,460
U5 I 122 H2 534,075 109
I 120 142 538,043
101 112 122 475,957 112 122 129 554,773 107 121 131 548,669 132 155 169 610,751
93 1{),5 122 538. flO! 100 110 130 546,521
i
$164,321
1
.
174,242 208, 521\
166,770 160,022 173,929 170,029
179,521\ 168,031 134,804 137,707
118,761 143,644 134,244 164,379
170, OS7 168,843 188,435 169,341
194,082 182,681 164,109 155,642
142,525 175,691 176,668 202,833
192, 326_ 199,830 230,748 217,276
244.865 219,359 191,717 199,159
175,511 212,757 212,548 206,217
238,057 226,893
$90,162 ! $81,0741 98, 380 78, 899
121, 194 90,912
96,493 76,919 89,012 77,454
101,470 92,999 95,052 89,761
97,857 92,647 93,931 86,508 82,768 77,792 82,793 75,166
74,127 67,756 83,183 76,378 82,716 71,249
102,422 88,261
88,117 64,164 88,364 68,482
102,128 83,532 96,858 80,073
108,486 87,764 104,608 87, 147 97,598 77,488 96,028 73,365
85,067 70,571 100,656 76,436 99,696 80,334
112,949 97,429
97,694 75,906 103,825 78,441 I 132,473 93,835 . 123,675 92,366
132,998 104,387 130,081 I 98,602 119,248 92,920 121,745 1 88,466
103.5731 81,569 121,07o I 90,734 124,472 86,698 137,473 I 107,019
113.1091 75, 689! 120,674 I SO, 796 ,
I !
$67,1461 61,645 72,403
47,442 52,215 61,631 61,531
63,518 60,275 53,552 55,046
48,172 55,008 58,908 68,444
46,791 51,870 61,247 64,647
67,127 67,855 61,369 58,805
57,315 60,0S8 60,027 83,133
57,485 60,334 81,798 76,410
81,780 I 81,792 ' 69,925 68,431
63,742 69,436 69,368 88,340
60,148 62,891
$42,400 46,126 56,261
39,085 40,586 47,630 44,193
49,106 44,940 40,851 43,361
35,737 40,856 38,779 43,681
37,444 37,846 45,618 45,572
50,671 46,980 43,241 50,093
41,132 47,953 49,969 56,989
43,469 43,500 54,859 57,117
61,927 60,6211 60,265 60,242
51,562 54,776 55,583 71,702
51,598 55,')J;7
i I I
I
t I
.1 Com~iled by the Life IMurance Sail& RuearcA Bureau representing reports from Insurance companies who held on Jan. 1, 1923 88 per cent of the total legal reserve ordinary life Insurance In force In the United States. Chart on p. 24 shows the boundaries of these districts. '
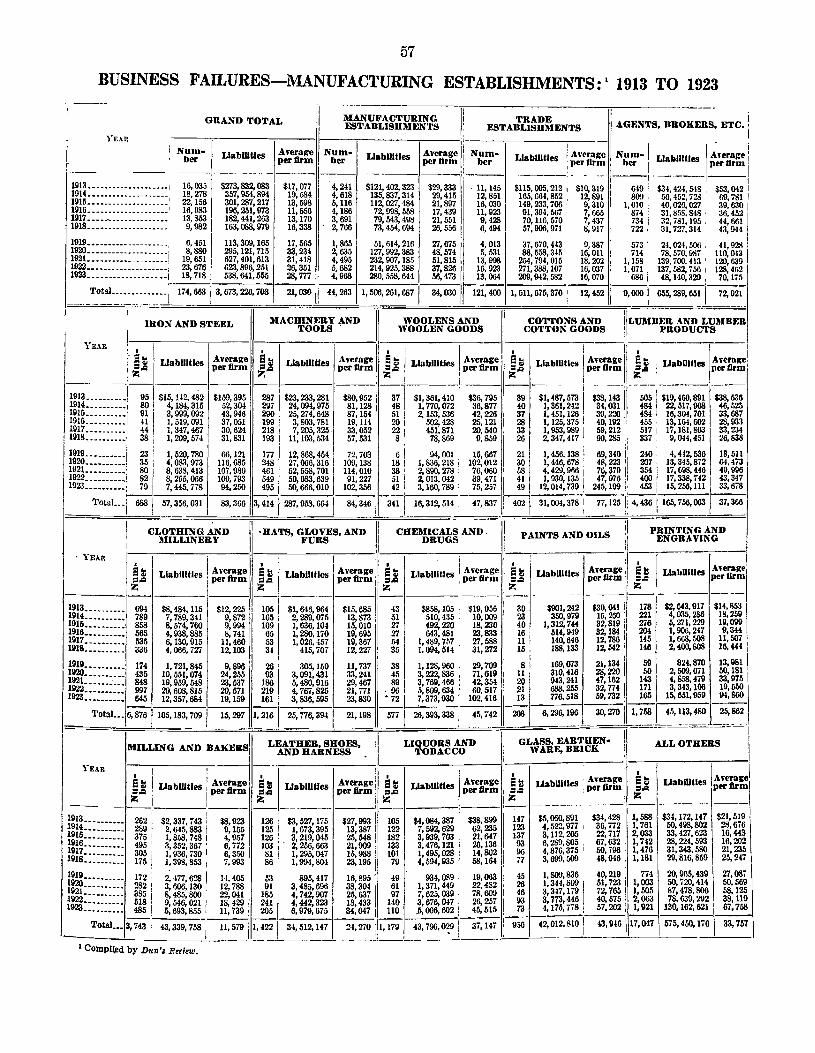
57
BUSINESS FAILURES-MANUFACTURING ESTABLISHMENTS:' 1913 TO 1923 -1'1' - -~-~-AN_U_F __ A_C_T ___ U_R_IN_G __ ,-! ____ T_R_A_D_E------;;---------· i
ESTABLISH~IENTS ESTABLISHl\IENTS AGI:NTS, BROKERS, ETC.'
YE.\R ---.-------,----11 :-----.-------,-----·11 I I i Num- LlabWtles Average j Num- UabiUtles Average ! Num- UabWtles J A\·crage -;~m-/ Llallllltlcs I ~ferage! r ber per firm ber per firm ! ber ; per tlrm bcr I per tlrm j
1913 ••••..•...•• -.-•• -.-.• -•• , 16,035 --;;;,~,083 $17,0771~ ~~4:~02,323 $29,3331~ ;115,005,212;- $1~,3;~ :~1- ;~~.&;;-~ $53,<M2 i 1914.................... 18,278 357,9M,894 19,684 4,618 135,837,314 29,415 ' 12,851 165,664,852 I 12,891 I 80!1 II 56,452,728 69,781 I 1915 •••••.•..••••••...•. ' 22,156 301,287,217 13,598 5,116 112,027,484 21,897 'I 16,030 I 149,233,706. 9,310 1,010 40,026,027 39,630 1916 ••••••••.•.....•••.. ' 16,983 196,251,973 11,556 4,186 72,998,558 17,439 11,923 91,394,5671 7,665 874 31,858,848· 36,452 1917 ••• -~---········· -·· 13, 853 I 182,441, 263 13, 170 3, 691 79, M3, 498 21,551 9, 428 70,116,570 I 7, 437 734 32, 781, 195 . 44, fl61 1918.................... 9,982 163,088,979 16,338 2,766 73,454,694 26,556 I 6,494 57,906,971. 8,917 722 31,727,314 43,944
1919.................... 6,451 113,309,165 17,565 1,865 51,614,216 27,6751 4,013 37,670,443 9,387 I 5731 24,02·1,500, 4J,928 1920 .................... : 8,880 295,121,715 33,234 2,635 127,992,383 48,574 5,531 88,558,345 16,011 : 714 78,570,9S7 110,<M3 1921. ................... ! 19,651 627,401,613 31,418 4, 495 232,907, 185 51,815 13, 998 254,794,015 18, 2()2 1 1, 158 139,700, 413 I 120,639 ~~~====~----~--~·.-::.·:::.·::1' 23,676 623,896,251 26,351 5,682 214,925,388 37,826 16,923 271,388,107 16,037 1,071 137,582,7561 128,462
18,718 538,641,555 28,777 4, 968 280, 558,644 56,473 13, 064 209,942, 582 JO, 070 686 48, 140,329 I 70, 175
J==~--~-T=o~t~==··~··~-~~:~·~-~~-·=·=-j==1~~=,68==3=1=3=,6=n=,=226~,W=8~==2=1,=03=0~=«==,2=68~=1,=5007,=,2=6=1,=68=7~==34=,=00=0~'=1=21=,=400~=1=,5=1=1,=67=5=,3=7=0~:==1=2,=45=2~~=7.~~000==~65=5=,=28=~=M=l=l~' ==72,==9~=1-l 1
IRON AND STEEL MAcmNERY AND I wooLENS AND I COTTONS AND IILUl\IDER AND LUI\IBERI J TOOLS . WOOLEN GOODS COTTON GOODS , PRODUCTS
: I I I I I ! I : I I • I ·,1 I . I I : at LlabUitles I' Average e t lJabUitles Average I e t i' Liabilities Average e t Liabilities I Average at Llabllllles I Average. 1 :;E-= per firm ,;.= per tlrm :=.= per tlrm =-= I per firm j ::.= : per tlrm'
"" 1 Z I Z I Z '
~~~------~j---;1 $15,1;4S2 1
$159,395 287 -$-23-,23-3,-28-1-I--$8-0-,9-52-,!-;1· $1,361,41~[ $36,795 --;-;1,487,5n I ~~43~~~-~~-~~;;,~~.891 $38,536-1914 •.• ·······! 80 ' 4, 184,315 52,304 W7 24,094,975 81,128 48 1, 770,072 I 36,877 40 1, 361,242 I 34,001 484 22,517,008 46,525 1915 .......... ·
1
9t 1 a,992,092 43,946 290 25,274,648 s7,154 st 1 2,153,536 42,226 37 1,451,1261
39,220 I 484: 16,304,701 33,687 1916.......... 41 1 1,519,091 37,051 199 3,803,781 19,114! 20! 502,4281 25,1211 28 1,125,375 40,192: 455 · 13,164,602 28,933 1917 .......... , 44 1,347,467 30,624 218 7,205,325.,. 33,052: 22f 451,871 20,540 33 1,953,9891 59,2121 517 I 17,181,800 33,234 1918 •••••••••• · 38 1, 209, 574 31,831 193 11, 100, 534 57,531 i 8 78,869 9, 859 26 2, 347,417 90,285 1: 337 . 9, OH, 451 26,838
1919 .......... ) 23 1,520,780 I 66,121 177 12,868,45411 72,70-3! 6 94,001 15,667 21 1,456,138 i 69,34011
240; 4,412,536 18,511 1920 .......... , 35 4, o83, 9n
1
116,685 24s 21,066,316 100, 13s ~ 1s 1, 836,218 102,012 30 1, 446, 67s : 48, m ~~~ 201 . 13,345, s12 64,473 1921. ......... · 80 8, 638,413 107,980 461 52,558,701 114,010 ! 38 2, 890,278 76,060 58 4, 429,966 I 76,379 I 3M I 17,698,446 49,006 1922 .......... ) 82 8,265,066 100,793 M9150,083,639
1
91,227 I 51 2,013,042 39,471 41 1,930,135: 47,076 I 400 I 17,338,742 I 43,347 1923 •••••••••• 1 79 7,«5,778 94,250 495 50,666,010 102,3561 42 3,160,789 75,257 49 12,ol4,n9! 245,199, 453 i 15,256,111
1
1 33,678
1_ 'l'otaL.j 6881 57,356,031! 83,366 3,4i4 287,958,6641 84,346 il 341/16,312,514 j 47,837~~402~ 31,0<M,378; 77,1251! 4,4361165,756,063·!37,300
GRA:lm TOTAL
YE.\lt
I I II I il CLOTHING AND •HATS, GLOVES, AND CHE~IICALS AND. PAINTS AND OILS PRINTING AND I lUILLINERY FURS I DRUGS il ENGRAVING
II, I I I I I I· I 'I I l 'I· I s t Liabilities Avefirrage e t I Liabilities I Aveflrrage e t II IJabllltles Avcfirrage e t I Liabilities Aveiiage ~ e t I Llabllltles peA,~eii~~~,l :=.= 1• per m :=.= per m
1 ::.= ,
1 per m :.=
1 per rm , :=.=
1-----fl._z ____ l ___ ~,-------1~1 1---- -~- ---- ---i~~--------
1913... ....... 694 $8,484, 1151 $12,225 1051 $1,646,964 $15,685 431 $858, 105 ,. $19,956 i 30 $901,242 $30, M1 f 178 $24,640:335, 91S67 $l~· m I 1914. ••••••••• 789 7, 789,341 . 9, 872 1651 2, 289,075 13,873 51 510,435 10,009 23 350,979 15, 260 : 221 ' • 2 °• 1915 •••••••••• 868 8,574,760 9,994 109 1,636,104 I 15,010 27 492,220 I 18,230 40 1,312,7« 32,819! 276 5,271,229 10,000 I 1916 M5 4, 938,885 8, 741 65 1, 280,170 19,695 27 643 481 I 23 8.33 16 514,949 32, 184 :, 201 1, 906,247 9,344 1917:::::::::: 535 6,130,915 11 460 53 1020 457 19 367 M I 1,489;7m 27;588 u 140,646 12,786 !I 145 1,668,508 11,507 : 1918 •••••••••• 336 4,066,727 12:103 34 I '415:707 12:227 i 351 1,094,514 i 31,272 15 I 188,133 12,542 'I 146 2,400,808 16,4·H II
1910 174 1 121 845 9 896 26 , aos 150 11 n; 3Sj 1 128 960 1 29 709 8 169, 073 21, t34JJ 59 824, 870 1a, 981
~1909~201 _: __ -.·_·_._:._:-:::::::::: 435 10' sst' 074 21' 255 93 a 091' 431 aa: 241 45 a' 222' 836 '1 n' 619 u 310,416 28,220 so 2, 509, on so, 181 · 848 19' 9 o' s ' 7 186 '480' 9 29,467 89 1 a' 76o' 466 42' 3M 20 943,241 47, 162! 143 4, sss. 479 33,975
997 2o' tk· M5 ~: g~1 219 ~: 767: 8~ 21, 111 , 96 1 s' so9' 634 : 6o' 517 21 688,255 az, 774) 171 3, 343, 106 19,650 1923 .......... 645 12:357:6841 19,159 161 3,836,595 23,830 21 1:373:9301 102:4161 13 776,518 59,n2 ~ 1a,M1,9~ 94,860_
TotaL.. 6, 876 105,183, 709/ 15, 297 1, 216 25, 776, 394 21,198 5771 2~. 393, 338 j----;;-742 --;(i8 6, 296, 196 ~· 270 ii 1, 758 _I 45, 113, 480 2,5~-~~ ·\
MILLING AND BAKERS! LEATHER, SHOES, II Ll~8gf~t.fD G~~~l1.W.g:N- !I ALL OTHERS i
I AND HARNESS . II . d l
l-,-.,-l-----,~--- I ! ' Avera"'e i "=''" UabUitl-·: Average\ St LlabWtlcs IAverage\l at I LlabWtles Average e t lJabiUtles Average II e t Uabilltles per firm.. I' = S! ~ ·. ""r firm I. =-= per firm :;E.= j 1 perftrm I :;E.= per firm
1 :;E.= J£ __________ :-__ : ~ _______
1 I ~~~:-------~~--;;;;-; $2,337.743; $8,923 1 ~ -;:527, 1~- $27,993 i 105 $4,084,387 $38,800
1
· ~47 $5,060,891 • $34,428 1 ~·m $3~:~~~M~ $~:~~~I
1915 .......... 289 i 2,645,883/ 9,15sj 125 1,6n,a95 13,387, 122 7,592,629 62,235 ~~ 4,5~~~, ~·m 1 ioaa 33, 427, 623 16, 443 1916 •••••••••• 375 1, 858, 748 1 4, 957 126 a, 219,045 zs, 548 1 182 3, 939, 703 21,647
1 93 3• 1•9 80• 07:632 I 1, 742 28, 224, 593 16, 202
1917----·--··· ~~g' 3,352,367; 6,772l 103 2,256,6~ 2~,90911 ~~ ~·!~~~~ ~:M~, 96 ~;~6; 375, 50, 796 , 1, 476 31, 343, 580 21, 235 1918... ••• ••.• I' 1, ~36, i30 6, 350 81 1, 295, (M 1 '988 [I ' a, 58 164 I 77 3, 699, 509 48, M6 I 1, 181 29, 816, 859 25, 247
.......... 175 ' 1~ 39S, 853 I 7, 993 I 86 1, 994, 8(M 23,195 ! 79 4, 594,935 ' I' .
11920919 .......... 172: 2,477,628) 14,4051 53 895,417 16,895 ·I' 49 934,089 19,063 : 45 1,80!1,838096 4501,272319 I' 1700374 2050.~r,20,5,443194 2750,~6~ 1921···---···· 282 ! 3, 606,130 . 12,788 111 I 3,485, 696 38,304
1
61 1, 371,4491 22 482 ' 26 1,344, j' • • •' • • • • 385 · 8 8 800 22041 185 4742907 25637 97 7625039 78'600 I 46 3,347,179
1 72,7M\ 1,505 87,478,806 58,125
11122:::::::::: 518! 9:~~:021 i 1S:429 2411 4:«2;323 1s:433 1 t4o a:676:047 2n:251 j 93 3,m,«6 40,575. 2,063 78,639,292 38,119 1923 •••••••••• ~! s,a93, 855_,~ 20s ~9, 675 34,M!_II 110 .s,oo6,602 45,515 .~_!~I 57,20211 1,921 130,162,621 67,758
Total ••• a, 743 i 4J, 339, 768 1
11, 579 ~~~~l::' M2, 1~-- 24, 270 i: 1• 179 43, 796~j 37,147- : 956 12,012.810 \ 43,11!6117,047 575,450,176\ 33,757.
·tEAR
YEAR
1 Compl~ed by Dun'' Rtritw.

58
BUSINESS FAILURES-TRADE ESTABLISHMENTS: 1 1913 TO 1923
i GROCERIES, 1\IEATS, HOTELS AND RES· LIQUORS AND CLOTIDNG AND GENERAL STORES AND FISH TAURANTS TOBACCO FURNISHINGS
YEAR . - ... --- -- • • LlabWtles I Average Et • 0
LlabiUtles :Average a .. s .. s .. LlabWtles Average at LlabWtles Average "" Llabllltles Average
="' tperDrm' ="' perDrm =-= perDrm =-= pcrDrm z.o:: perllrm z-= z.o:: z /:2
---I 1013 •• _________ 1,615 $13, 183, 035 ' $8,163 2, 774 $15, 548, 843 $5,605 510 $4, 870, 891 $9, 551 $5,922,520 $7, 118 1, 155 $11, 074, 778 $9,589 ' 1014.---------- 1, 789 15, 735, 331 I 8, 706 3, 0'.12 15,769,574 5, 218 634 7, 370,302 11,625 958 6,014, 236 6, 278 1,558 15,482,616 9,937 I 1915 ••••••••.•• 2,334 20, 37 I, 928 , 8, 72S 3,614 14,460,248 4,001 I 767 10, 121, 331 13, 196 1, 286 9,898, 475 7,697 I, 747 13,028,839 7,458 ' 1916----------- 1,391 11, 542, 210 : 8,298 3,599 12,929,101 3,592 650 6, 268, 720 9, 644 936 5,253,554 5,613 1,089 8, 928,253 8,199 I 1917.---------- ll75 7, 662,500 : 7,850 3,129 14,200,187 4,540 530 4, 441,529 81380 732 4, 587,393 6,267 836 5, 974, 142 7,146 I 1918 ___________ 593 4, 509,105 i 7,604 1,960 9,296,954 4_ 722 437 8, 728, 222 19, 973 479 3,253, 560 6, 792 645 5, 798,818 8,990 ' 1919 ___________
425 4,412,305 i 10,382 1,359 8, 256,917 6,076 324 3, 258,861 10,058 214 1, 522,640 7,115 325 2, 760,100 8,493 1020.---------- 618 10,143,829 16,414 1, 713 13,058,860 7,623 369 4,175,359 11,315 160 1,858, 623 11,616 566 7, 672,954 13,556
1 1921----------- 2,?:17 43, 059, 785 1 19,423 3,007 38,186,701 12,699 554 6, 2Sl, 008 11,338 260 1, 661,091 6,389 1, 871 29,140, ?:14 15,575 ' 1922 ___________ 2,263 43, 634, zoa 1 19,282 3,518 37,907,194 10,775 741 9, 236,429 12,46.1 346 3, 261,780 9,4?:1 2,043 31,891,240 15,610
: 1923.---------- 1, 512 24,119,655 : 15,952 2,882 25,935,596 8,999 I 739 12,473,860 16,879 302 2,841, 512 9,409 1, 561 28,513,160 ~8, 266
: 198,374,036 i 12,562 30,586 205, 556, 175 6, 721 6,255 77,226,542 12,346 6,505 46,075,384 7,083 13,396 160, 265, 174 11,964
! TotaL __ 15,792
' - -DRY GOODS AND SHOES, RUBBERS, AND FURNITURE AND HARDWARE, STOVES, CHE:&IICALS AND
CARPETS TRUNKS CROCKERY AND TOOLS DRUGS YEAR
I • 0 • • St LlabUitlcs Average St Liabilities I Average St LlabWtles Average a .. LlabWtles Average a .. LlabWtles Average i-= perftrm i,Q perDrm i-= per firm =" perftrm ="' perftrm
I ___ z-= z.c~ I
1913----------- 728 $17,819,447 $24,477 453 $4,748,617 $10,483 283 $3,359,578 $11,871 347 $4,505,482 $12,984 437 $2,565,352 $5,870 1914 •• --------- 916 54,320,728 59,302 453 4,522,983 9,985 354 4, 491,862 12,689 351 6,321,488 18,010 509 3,356, 431 6,594 1915.---------- 1,179 28,846,365 22,554 568 3, 716,724 6, 544 497 6,315, 546 12,707 491 5, 054,565 10,294 631 4, 950,037 7,845 1016.---------- 712 11,525,923 16,188 376 2,357, 730 6, 271 287 2, 647,602 9,225 349 4,090,516 11,721 490 2,361, 209 4,819 1917-- ·-------- 478 6, 220,403 13,013 229 1, 430,960 6,304 249 2, 773,802 11,140 208 2,069, 519 9,950 362 2, 182,039 6,(r.l8 1918 ••• ________ 296 5, 108,528 17,259 174 1, 362,692 7,832 148 1,417,118 9,575 152 1,390,426 9,148 280 2, 225,692 7o949 1919 ___________
206 3,073,446 14,920 120 I, 090,104 9,084 78 805,037 10,321 81 1, 211,738 14,960 130 789,261 6,0'71 1!120.- --·- ----- 377 8, 096,949 21,477 162 1, 954,013 12,062 74 743,455 10,047 83 1,434, 922 17,288 112 914,705 8,167 1921----------- 1,208 24,646,808 18,988 589 8, 913,982 15, 134 402 5,402,195 13,438 319 7,866,214 24,659 409 4, 835,851 11,824 1922. ·--------· 1,382 27,029,770 19,558 797 10,538,546 •13, 223 530 8,·708,484 16,431 484 10,502,098 21,699 528 5, 775,105 10,938 1923----------· 874 17,806,063 20,373 667 9,463,850 14,189 384 12,578,432 32,756 412 9,594, 749 23,288 490 7,231,285 14,758 -Total: ••• 8,446 204, 494, 439 24,212 4,588 • 50, 100, 201 10,920 3,286 49,243,111 14,986 3,277 54,041,717 16,491 4,378 37,186,967 8,494
I .JEWELRY AND HATS, FURls AND I PAINTS AND OILS BOOKS AND PAPERS ALL OTHERS
I CLOCKS GLOV YEAR
i • I
e t I LlabWtles Average • 0 So. IJabWtles !Average a .. LlabWtles Average at LlabWUes Average St LlabWtles Average
I =~ perftrm ="' perftrm perftrm z z.c~ i-= perDrm i-= perDrm ~-= I -1913.- •••••••• _i 52 $655,960 $12,615 322 $3,749,296 $11,644 87 $509,442 $5,856 85 $939,001 $11,047 1,465 $25, 552, 970 $17,«2 1914-----------1 62 895,084 14,437 393 4, 663,314 11,866 102 817,566 8,015 123 2,098,057 17,057 1,627 23,805,2SO 14,631 1915.- ---·- ----' 78 1,009,269 12,939 494 5, 822,430 11,786 123 822,258 6,685 118 1,086,895 9,211 2,103 23,728,796 11,283 1916.- ---------' 54 425,318 7,876 293 2, 790,361 9,523 99 549,430 5, 550 51 452,990 8,882 1,547 19, ?:11,650 12,457 1917-----------1 63 904,007 14,349 222 1, 787,026 8,050 51 462,029 9,059 37 516,799 13,968 1,327 14,898,235 11,227 1918.---------- 39 . 294,081 7,541 178 1, 644,854 9,241 42 400,842 9,544 32 370,121 11,566 1,030 12, lOS, 898 11,753 ! 1919.----------! 21 758,623 36, 125 73 699,733 9,585 21 176,337 8,397 21 288,887 13,757 615 8, 566,364 13,929 1920. __________ ,
16 324,963 20,310 103 1, 669,509 16,210 21 229,-287 10,918 135 7, 365,158 54,557 1,022 28,915,669 28,293 192L---·---·-- 72 1, 764,062 24,501 313 5, 785,059 18,483 52 458,762 8,822 125 6,420,668 51,365 2,450 70,371,525 28,723
ll:ll:: :::::::::1 75 1,185, 696 15,809 415 7, 636,434 18,401 109 857,187 7,864 114 2, 632,053 23,088 3,578 70,591,879 19,729 69 635,620 9,212 294 4, 706,046 16,007 116 1,233,242 10,631 88 1,642, 410 18,664 2,67-i 51,167,102 19,135
3,100 1 -Total •••• 601 8,852, 683 14,730 40,954,152 13,211 823 '6, 516,382 7,918 929 23,813,039 25,633 19,438 348, 975, 368 17,953
1 Compiled by Dun'1 Renew.

BANK FAILURES 1
I I I I ALL OTHERS
'I ""AL
NATIONAL
YEAR
No., LlabiUtles I No. LlabUitles No. Liabilities I -----------
192:3... •••••••••••• , 578 $203, 739, 138 77 $36, 568, 934 501 $167, 170, 204 !922 ______________ - zn 77,735, 55! 35 16,453,926 242 61,281,62.5
l:ll.::::::::::: ::::I 404 173, 027, 776 47 28,401,550 357 144, 626, 226 119 50,708,300 10 3, 350,000 109 47,358,300
1919 •••••••••••••• - 50 '16, 520, 862 4 1, 850,000 46 14, 670,862
1918 •••••••••• ·---. 201
5,131,887 ·---4-J---:i;7oo;iixi- 20 5,131,887 1917 ••••••••••.•••• 42 18,451,964 38 14,751,964 1916 •••••••••• ·----
1: 10,396,779 8 1, 755,000 42 8, 641,779
19!5 ............... 37,223,234 18 13, 649, 000 1!5 23,574,234 1914 ............... 212 56,005,107 19 9, 606,098-1 193 46,399,009
11)13 ............ ·-- 120 31,546,314 7 5, 197,336 1!3 26,348,978 1912 ............... 79 24,219,522 4 s, 313, OjJO I 75 15,906,522 1911. .............. 107 2.5, 511, 606 3 I, 250,000 104 24,261,606 1910 ............... 119 41, 097, 2.55 10 4,284,4821 109 36,812,773 1909 ............... 80 24,677, 128 11 4, 109,224 69 20,567,904
1908 ............... 180 123, 126, 956 31 48, 388. 000 I 149 74,738,956
1907 ······----·---- 132 233, 325, 972 12 12,533,000 120 220, 792, 972 1906 ............... ~I 18,805,380 8 1, 490,966 50 17,314,414 1905 ............... 20,227,155 16 4,198,348 621 16,028,807
1904 ............... 991 :18, 158, 811
I 24 10,257,223 75 17,901,588
1903 ............... 121 I 29,685,766 12 5, 735,477 109 23,950,289 1902-.............. 63, 10,969,072 2 420, 617 61 10,548,455 1901 .... --------- •• 74 1 18,018,774 9 5, 666,231 65 12,352,543
1900 ............... 681
14,456,563 I 5 1,312, 721 53 13, 143,842 1899 ............... 55 27,116,790 10 7, 10~,567 43 20,010,223 1898 ............... 1~ I 18,395,094
I 11 4, 102,290 69 14,292,804
1897 ------···--···· 28,249,700 28 5, 977,421 143 22,272,2711
11896 ............... :::1 50,718,915
I 34 22, 674,512 164 29,044,403
1895 ............... 20,710,210 34 6, 863,842 98 14,846,368 1894 .............. - 12.5 125, 666, 035 18 4, 803, 616 107 120,862,419 1893 ............... 642 210,~8,808 161 67, 673,894 481 143,324,914
I
BANK FAILURES, BY CLASSES
NATIONAL STATE AND TRUST SAVINGS PRIVATE COlUPANIES YEAR
No. UabUitles No. Llabllltles No. Llabllltles No. Llabllltles
-I $36, 568, 934 471 $154, 239, 180 11 $3,936,762 19 $8,994,262 '"'···-~ n 1922.... 35 16,453,926 227 57,117,895 2 550,000 13 3, 613, 730
1921.... 47' 28,401,550 327 114,975,024 I5 25,371,924 I5 4, 279, 278 1920.... 10 3,350,000 98 17, 684,900 4 I 25, 826, 000 I 7 I 3, 847, 400 1919.... 4 1,850,000 37 12,284,862 3 I, 260,000 6 1,I26,000 I918 .... ----- ----------&- 16 4, 700,000 I 150,000 31 191,887
I9I7 ---- 4 3, 700,000 36 14,566,964 2 I85,000 1916 .... 8 I, 755,000 37 6, 112,779 4 I, 729,000 ---i·j----soo;iixi-I915. --- I8 13,649,000 105 7, 670, I51 4 2, 231,373 6 ' I3, 672, 713 I914. --- 19 9,606,098 I73 37,812,875 IO 5,500,000 10 1 2, 786, 134 1913 .... 7 5,I97,336 88 I6,128, 253 10 3,044,501 15 7, 176, 224 I912 .... 4 8,313, 000 61 9,508,.168 4 335,440 6 5,872, 392
1911. ---~ 3 I,250,000 84 12,940,450 6 8,856,884 7 1,108, 856 1910 .... 10 4, 284,482 93 26,.176, 99I 3 I, 190,428 13 9,045,.154 1909 .... , 11 4,109,224 55 10,482, 84I 5 5, 740,000
I~ I 3,545,063
I908 .... , 31 48,388,000 112 35,140,222 23 36,684, 112 2, 914,622 1907---- I2 I2,533, 000 91 106,488,332 19 105, 562, 003 10 8, 742,637
59
PER (CENT OF BUSINESS CONCERNS FAILING I
YF.Ail I Cont'o•rns In business fallurt's }'allures
1------:------
mt:::::::::::::::::::::::J :g~~-------------------------
---;:r-:~, or I ----- ··- ·--~-··-.I
1019:::::::::::::::::::::::::1 1918 ........ _. __________ -----
lm:::::::::::::::::::::::::1 1915 •• ______________________ _
1914 ••• - --.--- .... --- ··-·-- --
1913 .... ----. --···--- ---- ..• -1912 •••••• __________________ .
1911 ... - ·---- ----· --·- •.•.•. -1910. _______________________ _ 1909 •• ______________________ _
1908 ... _ ----------- •••••. -. -· 1907 ... -----.- •••• -- ····- .•. -1906 ... ·---- -----. ···-· ------I905 ........................ . 1904 ... ----------------------
!~::··j~ __ j~j~~~:-~~~~~~~~1 I897 ......... -··--·------ ··-·[ 1896 ... ------ ••• -- •••• -- •.. --I895 _________ ---------- -·-·--
:::::::: ::::::::::::::::::::I I892 .•••••••••••• ------ ···---1 1891. .. - •• ---.---.-- •• -.- --~-I890 ___ - --------- •• -•.. -.----1889 ....... --- -------------.-
!!it::::::::::::::::::::::: I 1885 ...... --- .....• ---- •...• -I884 ......... -- --------------
1883 ..... ----------.- .•• -.---1882 ••• ___________________ ---
1881 ........... ----·-· ·--····
~~::::::::::::::~:::::::::: 1878 ........... ------ --------I877 ........................ . 1876 .... ---.- -- •• -.- ----- ·---I875 ... ----- --- •• -- ... --.----I874 ........... -........... ..
1873 ........ ------------ ---·-I872 .... ---------------- --··· I871 ....... ------------------1870 .... ---.-- -·-· ---- •.•. ---
1869 ... ------------------.---I868 ____ ................... .. 1867--.- •• ----------- --------I866 ........................ .
1 Compiled by Dun'(Rtritw.
18,718 23,676 10, 6!~2 8,881 0,451
9,982 13,855 16,993 22, ]f)6 18, 2!10
16,037 15,452 13,411 12, 652 12,924
15,000 11,725 10,682 11,520 12,I99
12,069 11,615 11,002 10,774 0,337
I2,I86 13,3.'i1 I5,088
,I3, 197 I3, 885
15,242 10,344 I2, 273 10,007 10,882
IO, 679 11,634 11,824
10,637 IO, 968
9,184 8,788 4,735 ~.375 6,658
I0,478 8,872 9,092 7,740 5,830
5,I83 4,069 2, 915 3,546
2, 799 2.608 2, 780 1,505
1,996,001 0. 94 1,98:1,100 I. 19 I, D27, 304 1.02 1,821,409 0.49 I, 710, !Kl'J 0. 38
I, 708,061 0. !>.~ l, 733, 2'1.') 0.!10 I, 707,639 0.99 1, 674, i~ 1.32 I, 655,496 1.10
1,616,517 0.99 I, 564,279 o.os ],[125,024 0.81 1,515,143 O.bO I, 486, 3!>9 O.&l
1,447,MI I. OS 1,418. 075 0.82 1,392, 949 0. 77 1,357,4M 0.85 1,320,172 0.112
• I, 281,481 0.94 1, 253,172 0.93 1,219, 242 0.90 I, 174,300 0.112 I,H7,595 0.81
I,105,830 I.IO 1,058, 521 I.26 I, 151,579 I. 3I 1,209.282 1.09 I, 114,174 1.25
1, 193, 113 I. 28 1, 172,705 0.88 1, 142,951 1.07 1, 110,590 0.98 1,051,140 I.04
1,016, 662 1.02 994,281 0.90 969,841 1.01 919,990 I.16 904,759 1.21
863,993 1.06 822,256 0.82 781,689 o. 71 746,823 0.63 702, 157 0. 95
674,741 1.55 652,006 L36 681,900 1.33 642,420 1. 21 600,490 0. G7
559,764 0.93 528,970 o. 77 475, 145 0.61 427,230 0.83
352, Gi4 0. 79 278,840 0.94 209,720 1.33 160,000 0.94

60
SUGAR 1
~------------.----------------------~------------------
YEAR ANIJ MONTB
I I
BEET SUGAR
i 1\lanurae- 1
tured I Sales
CA.NESUGA.Jt
Deliveries Delherles Stocks, end I ofmonth 1
1
1
Stocks, end Manurae-l Salles or month tured I For dlreet _ To re-
____ ---,,-------"------..:.~-- __ __:l_e_o_n_~_~_::a_P---'1-fl_n_erl_es_--'-----1 i
Short tons
--T-o-tal-.-y-ear-en_d_ID_g_J~~~~-.1-9~-= _----::~--~-~-~-------=-~----_-6_-;;....::_-39_1_11 __ -_-_·6_77.:..,3_63_11
___ 722_,_:_94_1_11·-·-··-··-·-··-------·.\1 ___ 26_7_,5_9_5+--12_1_,8_28_:1 __ 150_,_7_17_'
i~~i::::::~;~~::::::::::::::: rz:~~ ~---·---5;836"" ~::4~ ~:~ I Hll ~:r: . ~:~~ I ~~g II
September...................... 49,035 I 29,680 19,033 33,124 I '2,242 651 1,536
1
601
October......................... 218,84-l I 242,334 109,309 72,525 4,412 ~·~2 J;~g 1
J;~ !,
November •• -.................... 428,066 I 298,332 69,306 89,110 24,023 100:81~ 34,079 I, 49,769 December ••••••••••••••• ---·-··- 478,585 . 107,421 36,463 56,902 46,761 I
1923 January •••••••• ---··-+······-·· February ••• ···-··--····-······March •••••••••••••••••••••.••.• April ••••••.••••••••••• ---- •• -•..
May··················-·······-June •••• _ ..•••.•.• --·--· •••.••.• July ••••...••••••• -----·····----·
419,167 a1o,023 1
232,385 184,445 :
136,576 117,842 1
87,233 '
4,~~ !.
552 194 I
68,449 146,989 41,088 67,002
I I 63,854 I 109,401 78, 190 48,134
48,129 19,823 31,344
i 29, 265 as, 375 19, sao I 34, 472 1
1g~ ~~ t~~r li 6,~~ ' 6, 642 I 2, 259 2, 872 1, 266 :
6, 541 2, 338 1, 435 , 833 I
272,290 1
5,468 6,882 2,137
10,322 80,271 84,081
52,871 1s. 034 1 4,177
1
. 3,971
1,815 2, 266 I 2,911 l,~_l_ ~~ --
6, 469 II 1, 642 1, 453 268
7, 265 3, 635 2, 116 I 790 I - -----'-----'- ------'------ -·- ·-I
RAW SUGAR
-------,r------B-~--pt_s ____ _, ________ I-----~~------~-------S--m~
-s-!?~net~d Domestic--~- lmpor_ted MeiUngs' s!?=:n~~d.l Pr::~c- F~~cd:o':~ I ex"v':::'rt I sumptlon
--~-------~--------~
I Short tons
-I I
.i Deliveries. '
\1
~-T-o-tal-.-y-ea_r_c_n_d_lng-1-un_e.-30, 19-;;~·::~-=--=-=--=-=--~--=·=--:====15=1=, 5=28==~:==4,=7=45=·=327==~! ==4,=9=1=4,=4~26==:-=-=--=--=-=--~-~--=-:-=~~4,=608,~~=24~5=:=_3:.:.•.:..955~:_•-7_2~1=+----~~-29-~-3:..,-208~~~~---4·,-3_04,_085_1 1922 i i
1wy •••••••••••••• ---······----- 293,804 1,,133 so1,288 : 494,13o 9a,sos t60,o95 416,oso 49,682 I ·sll.eupgustemt.be.·r·.· ••• •• • -- -- -- -- ·_ ·_ -. _- •. -- -- -•• · -. -. _· -_ -. 280, 939 3, 106 570, 138 I 586, 109 130, 236 539, 538 306, 687 6, 069
•~ ~m •~1 ~~ ~~ ~m ~~ ~~· i October......................... 105,868 1,771 246,656 J 325,510 143,118 306,049
November...................... 104,732 44,628 291,707 1 337,471 164,108 317,410 December •••••••••••••••••••••• - 40,947 47,921 120,677 1 232,383 177,470 222,033
1923
477,8115 285, 1:J9 118,853
6,125 2,250 9,489
~fl~Y.::::::::::::::::::::::: ill:~ 4t:5i ~~= I i!i;~ ~~m ~:~~ ~~r4 -~~ i
July.--····-··-------------·-··· 247,225 ······------·· 245,774 266,191 354,659 243,790 282,603 22,883
492,688 503,110 260,338
389,599 296,420 208,671
285,544 446,991 334,416 404,054
419,306 262,948 309,192
April •••••.•...•••. ·-·-···-·-···· 263,550 •••••••••••••• ~;~ II 483,170 :;~~ :~~ m:~ ~:~ IJ
1 ;.;~~:::::::::::::::::::::::::::: ~~:~ -·---------~-- ~~:~ ~~:~ 1 ~:r: ~k~ ~n:~ ~~ I I --------'-----'----·------'----_c_ __ ___!_,__ __ _t__ ___ _!_ __ __! ___ ..!..----'
• 1 Compiled from reports to the U. S. Department of Commerce, Bureau of the Cemut from practically the entire indust"" except that the refined sugar statistics do no& rnclude data from two large refineries. • ' ' ' •
• 415 tons destroyed by tlre. 1 ''Meltlngs" Include 2,133 short tons of raw sug!ll', which was sold during various months for direct consumption without refining.

61
PRODUCTION OF STEEL INGOTS 1
!Prorated to 100 per cent production)
1- 19l'i 1918 1919 1920 11121 1922 1928 M ONTH ·- ·--·
Gross tons .. ----
January ••••••••••••••••••••••••••••• 2 3, 710,012 2, 641, 196 3,650,845 3, 524,026 2,517,042 I 1,891,857 ! 3,822, 369 February •• ---------.---- __ .• ----- ••• •a, 110,612 2, 724,002 3,177,311 3,401, 760 1,998, 705 I 2,071, 772 I 3,454, VIS March •••••••••••••••••••••••••• _____ • 3, 710,512 3, 727,632 3,127,481 3, 916,960 1, 794,777
i
2,814, 667 ! 4,046,85-1 AprU ••••.••••••• --···-- •..••••••••.. 13,710,512 3, 791,184 2, 631,087 3,132,458 I, 386,897 2, 902,240 ! 3,944,412
May----··· ••••••. --··- ..•••••••••••. •a. no,s12 3,939,580 2,266,109 3, 423,178 1, 446,181 3, 218,794 I 4,195,800 June. •.•••••••••••••••••••••••••••••• 3,617,322 3,695,352 2,607,015 3,538,971 1,146,350 i 3, 127,775 3, 748,890 July··-······---------··············· 3,447,461 3, 731,532 2, 946,465 3, 327,785 917,824
I 2, 952,806 3, 514,241
August ••••••••••••••••••••••. _____ •• 3,663,405 3,695,632 3,225,942 3, 562,411 1, 300,199 2,629, 256 3,677, 771
September .•••••••••••••••• ________ •• 3,486,337 I 3,832,228 • 2, 515,635 3, 561,365 1,342, 092 I 2, 818,261 3,328,580 I October ••••.•••••••••••••••••••••••• 3, 931,681 4, 017,435 I 2, 515,635 3, 580,873 1,847,139 I 3,410,265 3, 547,966 November ••••••••••••• ____ ..••.••••• 3, 713,889 3,668,164 • 2,515, 535 3,132,891 1,896,48.3 I 3,430,309 3,113,804 December ••••••••••••••••••••••••••• 3,206, 543 3, 586,125 • 2, 515,635 2, 778,714 1,630,395 I 3,300, 416 2,843, 764
TotaL ••••••••••••••••••••••••••• 43.619,200 43,051,022 33,6114,795 40,881,392 19,224,084 i 34,568,418 I 43,239,369 _i
1 Compiled by the American Iron and Steel Imtltute comprising reports from steel plants whose actual production during these years was as follows: 1917, 37,1!>7, · 325 tons, or 83 per cent of the total production in the United States during that year; 1918, 3~,922,291 tons, or 83 per cent; 1919, 28,682,664 tons, or 85 per cent; 1920, 34,432,252 tons, or S4 per cent; 1921, 16,826,946 tons, or 87 per cent;,1922, 29,116,453 tons, or 84 per cent; 1923,41,228,739 tons, or 95 per cent. These data were prorated to 100 per cent by dividing the total tonnage reported by the percentage or total production which the reporting firms represented.
' Interpolated by dividing equally between each month the total for the period.
PRODUCTION OF HOSIERY 1
I I : ' !\lEN'S WOMEN'S
BOYS' CBIL- ATB· i DR EN'S LETIC Total AND AND
ANn I (aD classes) / Full I Full I MISSES' INFANTS' SPORT
MoNTH , fashioned Seamless fashioned Seamless (aU styles) (aU styles) (all st)'les)
I Dozens of pairs
I !
II I I I I I I I
1923 monthly average (11 months) •• 3,833, 654 68,336 1, 487,158 475,277 1,065, 633 375,007 345,118 18,837 I
I I ' 1923
~~r~~~::::::::::::::::::::::::::: 3, 775,591 79,062 1,395,501 411,928 1, 248,676 350,096 290,328 (I) 4,289,049 65,849 1,591,057 475,779 1,370,842 413,590 353,952 17,980
tfart::::: :::::::: :::::::::::::::::: 4,001,093 67,208 1,467,470 473,514 1,236,588 389,519 348,544 18,250 4,213,902 64,394 1, 561,538 504,715 1, 309,072 ?86,037 371,780 16,366
June •••••••••••••••••••••••••••••••• 3,874,150 84,073 1, 456,311 493,164 1, 093,625 380,171 349,490 17,316 1
July-·--··········-----------······· 3, 478,217 59,839 1, 315,746 432,000 985,023 342,885 I 322,016 19,808
t~~i:i'er:::::::::::::::::::::::::: 3,860,265 75,960 1, 593,415 491,742 928,777 392,735 357,663 19,973 3,530,5~6 51,001 1,449,298 460,831 845,068 368,888 336,031 18,449
' October •••••••••••••••••••••••••••• 4, 025,823 69,031 1, 634,563 529,657 978,096 414,345 I 378,954 20.277
~~=~::::::::::::::::::::::::::: 3,885,316 72,134 1, 587,766 520,508 942,556 390,562 I 351,889 19,901 3, 236,227 61,259 1, 306,073 434,209 782,738 296,251 I 335,647 20,050
1924 January···-··--···················· 3,878, 298 73,120 1, 603,075 479,749 1146,276
I 369,461 385,653 20,964
1 Compiled by the U. s. Department of Commerce, Bureau of the Cennu, from reports or 270 identical establishments representing 349 mills which produced approximately 62 per cent or the total value of hosiery reported in the bienulal Census of Manufactures, 1921.
2 Not reported separately for this month.

62
WORLD PRODUCTION OF CANE SUGAR AND FLAXSEED*
YEAR World total
----1909-1913average ------------ 9,971
1914 •.•• ---------------------- 11,293
1915 ••••••. ------------------- 12,776
m~~: ~ :~::::: ~::::: ~::~::::::I 13,442 14,508 13,324
1919 ••• -----------------------1 13,799
1920 •• ----------------------- _, 13,656 1921 __________________________ I 14,563
1922 .• ---------- ••• ----------- 14,589
1923 latest estimates -----·---/ 15,232
I Louisiana and Texas. I Exports.
CANE SUGAR I FLAXSEED
I I Argen-\IndJa Java United BrazU Hawaii Porto cuba India I
United Canada States • Rleo tina States
World
1~1~ --------------------- total
May Oct. Oct. Nov. Dec. Dec. Dec. Aug. Aug.
Thousands of short tons Thousands of bushels
I 1, 514 311 138 567 363 2,295 2,614 110,992 31,989 19,870 19,505 12,040
1,054 2!7 344 646 346 2,967 2, 757 94,559 36,928 15,448 13,749 7,175
1, 797 139 486 593 484 3,437 2,950 103,287 45,040 15,880 14,030 10,628
2,009 3ll 413 645 503 3,442 3,058 I 82,151 39,289 19,040 14,296 8,260
1,960 246 493 577 454 3,957 3, 708 41,063 4,032 21,040 9,164 5,935
1,478 284 440 600 406 4,597 2,617 61,821 19,588 20,600 13,369 6,055 1,473 122 496 556 485 . 4,209 3,361 61,692 30,775 9,400 7,256 5,473 1,579 176 580 522 490 4,408 2,826
87,964 I 42,038 16,760 10,774 7,998 1,906 328 551 592 408 4,517 2,925 83,288 50,470 10,800 8,029 4,112 1,993 295 1667 1537 1379 14,034 1 3,409 1 94,000 44,286 17,440 10,375 6,009
---I I 1,971 172 710 605 407 4,271 3,629 127,000 63,225 21,280 17,429 7,140
!
' From private sources. • New crop available In January of the year indicated; January, 1924, estimate Is 63,225,000 bushels.
WORLD PRODUCTION OF BEET SUGAR *
YEA I!. fo%'t~ II ~r~!:: I ::~;, ~~~~~~;~Russia I Poland I~~~::·! g'~ I France 'Italy I Spain I !~~k !sweden I
1909-1913 average _____________ _
1914.--------.--·-.----. -------1915.-----------.--------------1916 .• ·--.-------•• ------------1917---------------------------1918 ••• ------------------------1919 ••••• ----------------------1920.:----,-------------------1921 ______ ---------------------1922 ________ -------------------
1923latest estimates ___________ ,
::~~ II 6,056 5,808 5,208 4,592 3,490 4,997 5,443
•5, 700
Thousands or short tons
~ 2,296 4m ~m m ~ m ~ m m m w 722 2, 721 1, 004 1, 879 ---------- 316 215 334 166 112 168 170 374 1, 678 812 1, 82! 239 264 120 150 166 117 143 140 m ~m ~ 4m m ~ ~ m ~ m m m • ~m ~ 4m ~ m m ~ ~ w m m m 4~ ~ m ~ m ~ w ~ • ~ WJ m ~ ~ M ~ ~ m m m ru m w 4~ ~m m M w ru ~ m ~ ~ ~ ml
•m 4~ 1m ~m •m ~ •m ru ~ 1m •1,074 1,416 726 61 198 ---41_2 ____ 3-15-i--•-31-9-l·--23-4-l---s-o+--1-5946-: 1279591
,~~,~------;;-1~1 274 I 3091 516 339 187 I 121 I 1651 6,202
I Crops mall countnes here gtven are harvested begtnntng in September. • From private sources. ·
1 Include! Ukraine; data from private sources. • Refined sugar in terms of raw on the basis or 95 per cent or the raw.
WORLD PRODUCTION OF RICE * CountrY-----------------···-·--·----------···--·
World total a IndJa Egypt United
States Italy Spain Japan Dutch East
Indies 1
Philip• plues
-----·1-------·1--------------New crop available •••••••••••••••••••••••••••••• -------------- Apr. Apr. Aug. Sept. Sept. Nov. Dec. Dec.
Millions or pounds (cleaned)
I Normal consumption (1909-1913) ••• : ••••••••••••• --------------1 67,891
l-1-909--1-9-13 ___ -_-__ -__ -_-__ -_-__ -_-__ -__ -_-__ -_-__ -_-__ -__ -_-__ -_-_ -----------Ji--1-10-, -780-j:l--7-2,-9-50-l·----:----f. 646 297 14 009 7 349
------ _____ ! __________ _ 518 14,602
1914---------------------------------------------- 116, ooo 1 61,109 741 337 17:909 1:826 1915----------------------------------------------, 126.000 I 73.315 763 320 17,569 7, 964 1916·--------------------------------------------- 131,000 78,521 708 329 18,360 7, 912
1,124 1,404 1,100 1,289 1, 745 2,213 2,089 2, 247 2,565 2,681
1§~:\.\\~l~\~l\:~:--~-OO\\~~~l~ll\\~~~:~~~:::~~-ll~§ 1 ~~ .~ ! ~E .m ~ i~§ ~ill 19231atest estimates •••••••••••••••••••••••••••• ~-j--------------I--63-,-37-6-1---27-0-,--924-1 670 330 18,303 ·6, 904 I 2, 703
1 J'a va and Madura. I Acreage about hal! of n a}· sum n1 1 • Data compiled by U. s Department f A 1 1 orm · mer CfC!P 0 Y g ven. 1 1922 acreage 296,500, compared with 286,400 acres In 1921.
celved by that department 0 j. by Departm~nt :J J:~':::;c:uiJ::,~a0£ 1!'FC::~~~a!:,cr}~omlct'' a~d corrected monthly in accordance with latest available inlorhma~~:% Corrected to !.Iorch Zll, 1SZ4. • ' • ome1 IC vommeree. Countries are placed in the order in which crops are ar
1 Exclusive of China: Chinese crop estimated at 52,788,000,000 po~ds in 1920 and 7o,218,667,000 In 1917•

63
WORLD PRODUCTION OF COTTON* ~--------------------~------~----~------------~------
Country •••••...••••••••.••••••••••••• World total Peru United States 1\lexlco India Brazil Egypt
New crop available ••••••••••••.•••••••••••••••••••••• June August August November September September
11109-1913 average ••••••••••••••••••••••• 1914 ••••••••••••••••••••••••••..•••••••• 1915 .••••••••••••••••••••••••••••••••••• 1916 ••••...•.•.••••••••••••••••••••••••• 1917 ••••••••••••••••••••••••••••.•....••
1918 .••••••••••••••...••••••••••••••••••
1919 •• ---------•• -- ••• -- -----.-•••••• -•• 1920 •••••••••••••••••••••••••••••••.•••• 1921. ••••••••••••••••...••• ----········-1922 ••••..•.••••••••••••••••••••••••••••
1923,Jatest estimates •••••••••••••••••.•
I From private sources.
20,660 24,630 18,470 . 18,970 18,370
18,580 19,925 20,940 15,391 18,705
19,125
Thousands of bales (478 pounds net)
106 13,033 193 3,584 322 129 16,135 108 4,354 387 113 11,192 95 3,128 282 127 11,500 103 3, 759 281 125 11,302 135 3,393 345
142 12,041 203 3,328 339 155 11,421 199 4,853 384 1M 13,440 188 3,013 451 157 7,954 147 3,748 505 137 9, 762 '178 14,336 553
........................ 10,081 138 4,219 ------------s 1922 acreage 12,496,000 compared with 11,976,000 In 1921.
WORLD PRODUCTION OF WHEAT*
country .................. World total Argen• Australia India United Spain Italy France IGerma~y tina States
New crop available ......... -------------- January January March July August August August I August
Millions of bushels
Normal consumption {1909-1913). ·-··········-· ............ J
I 64 37 301 581 136 236 361 221
1909-1913 average ••••••••••• 3,577 I
157 85 351 690 130 183 318 152 1914 ••••••••••••••.••••••••• 3,586
I 105 103 312 891 116 170 283 146
1915 •••••••••••.••••••..•••• 4,199 169 25 377 1,026 139 171 223 142 1916 ••••••••.••••••••••••••• 12,609 169 179 323 636 152 177 205 •no 1917 ····---·········-······· 12,288 80 152 382 637 143 140 135 182
1918 •••••••••••••••••••••••• 12,804 224 115 370 921 136 183 226 186 1919 ••••••••••••••••.••••••• 12,743 180 76 280 968 129 170 1182 •so 1920 ••••••••••••.•••••••.••• 12,868 217 46 378 833 139 141 •237 '83 1921. ••••••••••••••••••••••• 13,069 156 146 250 815 145 194 • 323 1108 1922 ........................ 13,096 191 129 367 868 125 162 • 243 '72
1923, l~~ttest estimates_ ...... --------------1 196 109 369 786 157 I 225 290 106 1924,latest estimates ....... -------------- 259 126 ----------·- ........................ ·-·······--·!·········--- .......................... ------------
1,453 1, 337
989 1,048 1,304
999 1,155 1, 251
902 1,170
1, 213
Rumania
August
I 34
87 49 89 78
......................
118 166 • 61 179 '92
103
------------I Russia excluded. No accurate statistics are available. 4 New boundaries. J Excludes Alsacc-Lorraine. • Former kingdom, Bessarahia and Bukowina.
, I Excludes Dobruja.
Canada
September
116
197 161 394 263 234
189 193 263 301 400
~n ......................
• Data compiled by U. S. Department of Agriculture, Bureau of Agricultural Economics, and corrected monthly In accordance with latest available information received by that department or by Department of Commerce, Bureau of Foreiun and Domestic CommeTce. Countries are placed in the order in which crops are harvested. Corrected to March zo. 19Z4.

64
SOURCES OF DATA
SOURCE DATA cu'RRENT PUBLICATION 1 DATE OF PUBLICATION
I~REPORTS FROM GOVERNMENT DEPARTMENTS, FEDERAL, STATE, AND FOREIGN
ARGENTINE MINISTER OF AGRICULTURE AUSTRALIAN COMMONWEALTH'S Btl·
BEAU OF CENSUS AND STATISTICS. BANK OF JAPAN •••••.••••••••••••••••• BRITISH BOARD OF TRADE •••••••••••• CANADIAN DEPARTMENT OF LABOR ••
CANADIAN DEPARTMENT OF TRADE AND COMMERCE.
FEDERAL FAR>! LOAN BOARD •••.•••• FEDERAL RESERVE BANK OF ATLANTA. FEDEl\AL RESERVE BANK OF BOSTON. FEDERAL RESERVE BANK OF CIIICAGO.
FEDERAL RESERVE BANK OF CLEVE· LAND.
FEDERAL RESERVE BANK OF DALLAS. FEDERAL RESERVE BANK 01' KANSAS
CITY, FJ:DERAL RESERVE BANK OF MINNE•
APOW. FEDERAL RESERVE 13ANK OF NEW
YORK. FEDERAL RESERVE BANK OF PBILA·
DELPHIA, FEDERAL RESERVE BANK OF RICH·
liOND. FEDERAL RESERVE BANK OF SAN
FRANCISCO.
FEDERAL Rl!SERVE BOARD ......... ..
FRENCH MINISTRY OF LABOR AND SOCIAL WELFARE.
ILLINOIS DEPARTMENT OF LABOR .... . INDIAN DEPARTMENT OF STATISTICS .. . INTERSTATE COMMERCE COI.IMISSION ••
MASSACHUSETTS DEPARTMENT or LABOB AND INDUSTRIES,
MASSACIIUSETTS DEPARTKENT OF PUBLIC UTILITIES,
NEW YOBK STATE DEPARTMENT OF LABOR.
NEW YORK STATE DEPARTMENT 01'
Cereal exports from Argentina ................ , Estadfstica Agro-Pecuaria ............... .. Price index for Australia ...................... Federal Reserve Bulletin ................ ..
Price index for Japan.......................... Federal Reserve Bulletin ................ .. Price Index for United Kingdom.............. British Board of Trade JournaL ........ .. Price index for Canada ........................ Labour Gazette (Canadlan) .............. . Employment in Canadian trade-unions ....... Labour Gazette (Canadian) .............. . Operations of Canadlan employment service ... Labour Gazette (Canadlan) ............. .. Foreign trade of Canada...................... Foreign trade of Canada ................ .. Canadian railroad operations .................. Operating Revenues, etc., or Railways • .. . Canadian iron and steel production ........... Press releases • ...................... c .... . Agricultural loans by land banks.............. Not published .......................... .. Wholesale trade ............................... Business Conditions ..................... . Savings deposits in First l''ed. Res. Dist ...... Monthly Review ....................... .. Savings deposits in Seventh Fed. Res. Dist... Business Conditions .. --·-----------------Agricultural pumps ........................... Business Condltions .................... .. Savings deposits in Fourth Fed. Res. Dist.... Business Review ........................ ..
Wholesale trade............................... Business Conditions .................... .. Wholesale trade............................... Business Conditions ..................... .
Monthly. Second week of month.
Second week or month.
Monthly. Semimonthly. Semimonthly. Monthly. Monthly.
Monthly. Monthly. Monthly. Monthly. Monthly.
Monthly. Monthly.
Retail sales oflumber by rural yards.......... Business Conditions...................... Monthly.
Foreign exchange rates and index ............ . Savings deposits in Second Fed. Res. Dist .. .. Savings deposits In Third Fed. Res. Dist ... .. Wholesale trade .............................. . Savings deposits in Fifth Fed. Res. Dist .... .. Wholesale trade .............................. . Savings deposits in Twelfth Fed. Res. Dist.. .. Wholesale trade ................ ! ............. . Automobile registrations ..................... . Foreign exchange index numbers ............. . Debits to indlvidual accounts ............... .. Condition of Federal reserve banks ........... . Condltlon of reporting member banks ........ . Money held outside U.S. Treasury and Fed-
eral reserve system to July 1, 1922. Wholesale price index numbers ............... . Department store trade; in cooperation with
National Retail Dry Goods Association. Index nnmbers of department store, mail·
order, and chain-store trade. Barley and rye receipts ...................... . Sales of loose lear tobacco .................... .. Index of ocean freight rates ................... . Index nnmbers of production ................ .. Wholesale trade .............................. . Price index for France ....................... ..
Employment In Dlinois ................... : ... Prico Index for India ........................ .. Railway revenues and expenses .............. . Telephone operatin;: revenue and income ... .. Telegraph operations and Income ............ . Express operations and income .............. .. Massachusetts employment .................. .
Fed. Res. Bull. and dally statement • ... .. Monthly Review ........................ . Business and Financial Conditions ...... .. Business and Financial Conditions ....... . Business and Agricultural Conditions ... .. Business and Agricultural Condltlons ... .. Business Conditions ..................... . Business Conditions ..................... . Business Conditions ..................... . Federal Reserve Bulletin ................ .. Fed. Res. Dull. and weekly press releases •. Fed. Res. Bull. and weekly press releases •. Fed. Res. Bull. and weekly press releases •. Federal Reserve Bulletin ................ ..
Federal Reserve Bulletin ................. . Federal Reserve :Sulletin ................. .
Federal Reserve Bulletin ................. .
Federal Reserve Bulletin ................ .. Federal Reserve Bulletin ................ .. Federal Reserve Bulletin ................ .. Federal Reserve Bulletin ................ .. Federal Reserve Bulletin ................. . Bulletin de Ia Satisque Generale ........ ..
The Employment Bulletin .............. .. Federal Reserve Bulletin ................ .. Preliminary statement Class 1 roads .... .. Operations ollarge telephone companies .. . Not published .......................... .. Not published .......................... .. Monthly statement • ................... ..
Milk receipts at Boston ....................... Not published .......................... ..
Dally and monthly, Monthly. Monthly. Monthly. Monthly. Monthly. Monthly. Monthly. Monthly. Monthly (second week of month). Sunday papers and monthly. Fri. morning papers and monthly. Fri. afternoon papers and monthly Monthly.
Monthly. Monthly.
Monthly.
Monthly. Monthly. Monthly. Monthly. Monthly.
Monthly. Second week of month. Monthly. Monthly.
New York State factory employment and LaborMarketBulletinandpressreleases•. Monthly earnings.
New York State canal trafllc .................. Annual report ............................. Yearly. PUBIJC WORT(S, PANAMA CANAL ....................... Panama Canal traffic ......................... The Panama Canal Record ............... Last weekly issue or month. PENNSYLVANIA DEPARTMENT or LA· Unemployment in Pennsylvania.............. Semimonthly report • ..................... Semimonthly. BOB AND INDUSTRY. U /Ti~E'!_P;~rr"X~~:::!t~!:'~i:~:.E- Beef, pork, and lamb production .............. Crops and Markets ............ ;---------- Monthly supplement.
U.S. DEPARTKENT or AGRICULTURE- .Prices ortarm products to producers .......... ' Crops and Markets ...................... . ~~ORNOE'~ U OF AGRICULTURAL Wool stocks i~ dealers' hands ................. Crops and Markets ...................... .
ales. Crop productiOn .............................. Crops and Markets and press releases • .. ..
I Cold-storage holdings and fish frozen ......... : Crops and Markets ..................... .. Movement of cattle, hogs, and sheep.......... Crops and Markets ..................... ..
I Receip~ of butt~r, cheese, eggs, and poultry .. Crops and Markets ...................... . l'roductton or datry products.................. Crops and Markets Car lot shipments or fruits and vegetables ..... Crops and Markets:::::::::::::::::::::::
1 Fa11f labor, wages, ~upply, etc ................ Crops and Markets ..................... .. \'-:or d crop productiOn ........................ Foreign crops and markets • ............. .
U ·B. DEPARTMENT OF AGRICULTURE- ~~~~~~~g~/~~qctioiiiromiiiiat(iio2fi:::: ~~~s~~8~n ~~nr~'i~l)er:Lath:and.Shingies: FOREST SERVICE. Wood pulp productiOn, 1914 and 1916 .......... Pulp Wood Consumption and Wood-Pulp
Monthly supplement. Monthly supplement. , Releases about 1st of month (cotton)
and lOth (other crops). Monthly supplement. Monthly supplement. Weekly. , Quarterly. Monthly supplement. Monthly supplement. Weekly. Annually. Yearly. Yearly.
U. S. DEPARTKENT OF COlUf.ERCE- Production. BUREAU or THE CENsus. Cconon ginned .. d .... d ..... h ..................... Preliminary report on ginnings • .......... semimonthlyhduring season.
o on Gonsume an on and ................ Preliminary report on cotton consumed •••
1
15th of mont • Active textile machinery ...................... Wool machinery and cotton spindles • .... 20th of month. Leather, hides, shoes, production and stocks ... Census of hldes, skills, and leather • .......
1
First week of month. Cottonseed and cottonseed oil................. Preliminary report on cottonseed.......... 18th of monthh, Hoisery statistics .............................. Press release • ............................. ,30th or month. Mefs and boys' clothing ..................... Press release • ............................. 30th of mont • Ma leable castings............................ Press release • ............................. I 30th of month. Wheat flour production from May, 1923 ....... Press release • ............................. 30th or month. Pyrkoxylin coated textiles...................... Press release • --··------------------------- 30th of month. Sto ers, sales from January, 1923 .............. Press release • ............................. 20th of month. d r uarter Stocfs or tohacc!l held......................... Statement on stocks or lear tobacco........ One month after en o q • Woo consumption ............................ Press release • __ 30th of month. ;o~~ s~octs-------------------·----·---------- Press release • : .. :::::::::::::::::::::::::: Quarterly. Cot. ot !ng ................................ Press release • ----·--·--·--------------~--- 30th or month.
as ·Iron ptpe ................................ .l Press release • ............................. 25th or month. • Multigraphed or mimeographed sheets. 1
This is not n_ecessarily the sour~ or the figures published in the SURVEY as many or them are obtained direct from the compilers prior to publication In the rupee· tlve Journals. This column and the rillht-hand Clllumn have b<>.cn added to assist read"'" In obtaininl: current statistics between Dublication dates of the suavitY.
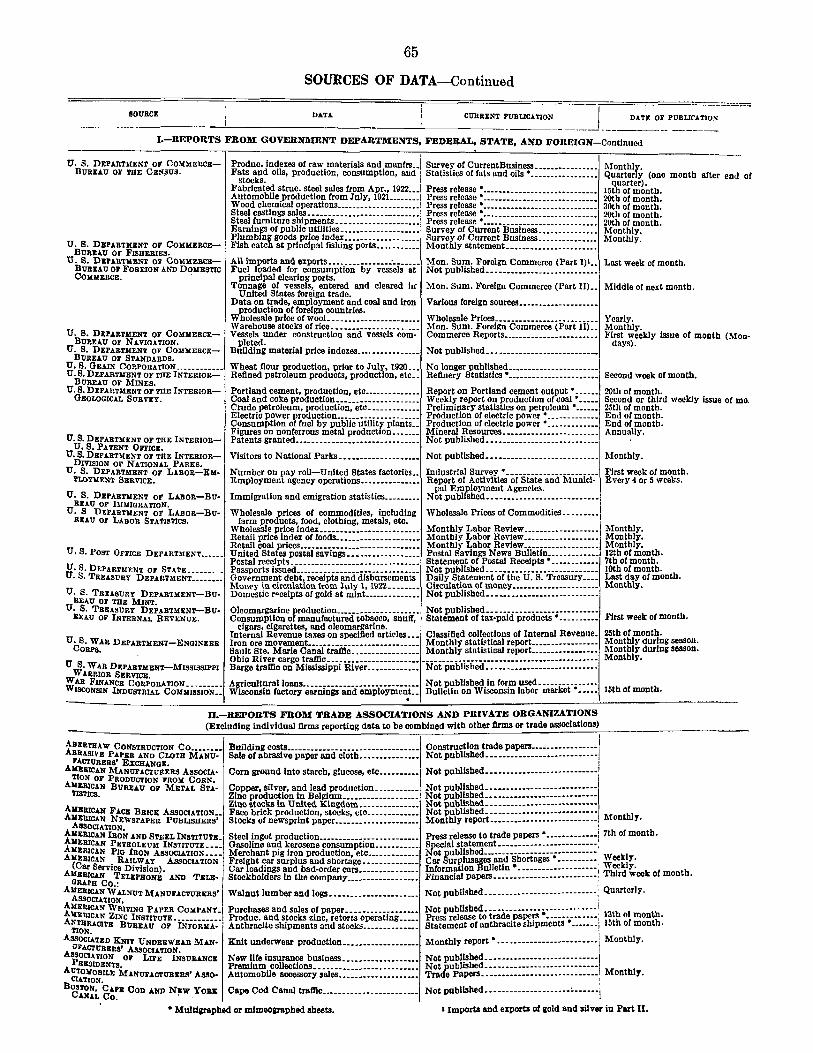
65
SOURCES OF DATA-Continued
------___________ s_o_u_R-CE------------~----------------D-.1.-TA ________________ _L ________ cu_R_R_E_N_T __ ~uBUCATI~--------_j ___ ~ATE 0~-p~~~~~ION-
J,-REPORTS FROM GOVERNl\ffiNT DEPARTl\IENTS, FEDERAL, STATE, AND FOREIGN--Continued
U. S. DEPAIITHENT OF COMMERCEBURE.I.U OF THE CENSUS.
U. 8. DEP.I.RTMENT OF COMHERCEBUU.I.U 01' FISHERIES. u. s. DBP.i.RTHENT 07 COl!'MERCl!.BUREAU or FOREIGN AND DOMESTIC COliMERCE. .
U. 8. DEP.I.RT.IdENT OF COMMERCE-BUREAU OF NAVIGATION.
U. 8. DEPARTMENT OF COMMERCEBUREAU OF ST.I.NDARDS.
U. 8. GBA.IN CORPORATION ........... , U. 8. DEPARTMENT Oi' THE INTERIOR
BUREAU OF MINES. U.S. DEPARTMENT or TliE INTERIOR
GEOLOGICAL SURVEY.
U, S. DEPARTMENT OF THE INTERIORU, S. PATENT OFFICE.
U, S. DEPARTlolENT OF TliE INTERIORDIVISION OF NATIONAL PARKS.
U. S. DEPARTMENT OF LABOR--EM· l'LOY'MENT SERVICE.
U. S. DEPARTMENT or LABOR-BU· BEAU OF IMMIGRATION.
u. s DEPARTMENT or LABOR-BuREAU OF LABOR STA1IST!CS.
U, S. POST OFFICE DEPARTMENT ......
8· S. DEPARTMENT OF STATE ....... . • S. TREASURY DEPARTMENT ...... ..
U. S. TREASURY DEPARTMENT-BU· RE.\U OJ' THE MINT.
U. 8. TREASURY DEPARTMENT-BU· IIEAU OF INTERNAL REVENUE.
u.s. W.I.R DEP.I.RTHENT-ENGINEER Co us.
U S. WAR DEPARTMENT-li:IISSISSIPPI WARRIOR SERVICE.
WWAR FINANCR CORPORATION ......... ISCONSIN INDUSTRIA.L COMHISSION ..
Produc. indexes of raw materials and manfrs •• Fats and oils, production, consumption, and
stocks. Fabricated struc. steel sales from Apr., 1922 ••• Automobile production from July, 192L .•••••. Wood chemical operations ____________________ _ Steel castings sales ___________________________ _
Steel furniture shipments---------------------Earnings or public utilities ___________________ _ Plumbing goods price index __________________ _ Fish catch at principal fishing ports .......... .
Survey or CurrentBusinoss ............... . Statistics or fats and oils • ......... _ ...... .
Press release • ............................ . Press release • ............................ . Press release • ............................ . Press release •----------------------·-·----Press release • ............................ . Survey of Current Business .............. . Survey of Current Business ............. .. Monthly statement ...................... .
All imports and exports ............... .-....... Mon. Sum. Forclgn Commerce (Part 1)1 •• Fuel loaded for consumption by vessels at I Not published .......................... ..
principal clearing ports. Tonnage or vessels, entered and cleared in Mon. Sum. Foreign Commerce (Part II) ..
United States foreign trade. Data on trade, employment and coal and Iron Various foreign sources .................. ..
production of foreign countrias. Wllo!esale price or wooL ...................... Wholesale Prices .................... ____ __ Warehouse stocks of rice ...................... Mon. Sum. Foreign Commerce (Part II) .. Vessels under construction and vessels com- Commerce Reports ....................... .
pleted. Building material price indexes ................ Not published ........................... .
Monthly. Quarterly (one month after end of
quarter). 15th or month. 20th or month. 30th of month. 20th or month. 20th or month. Monthly. l\Iontllly.
Last week of month.
Middle of nest month.
Yearly. Monthly. First weekly Issue of month (Man·
days).
Wheat flour production, prior to July, 1920 ... No longer published ..................... .. Refined petroleum products, production, etc .. Retlnery Statistics • ....................... Second week or month.
Portland cement, production, etc ... ___________ Report on Portland cement output • ...... 20th of month. Coal and coke production ..................... Weekly report on production of coal • ..... Second or third weekly Issue or mo. Crude petroleum, production, etc ............. Preliminary statistics on petroleum • ...... 25th of month. Electric power production ..................... Production or electric power • ---··-------- End of month. Consumption or fuel by public utility plants.. Production of electric power • ............. End or month. Figures on nonferrous metal production ....... Mineral Resources ................ ________ Annually. Patents granted ............................... Not published ........................... .
Visitors to National Parks .................... Not published .... ________________________ 1\lonthly.
Number on pay roll-United States factories .. Employment agency operations ............. ..
Immigration and emigration statistics ........ .
Industrial Survey • ------------·---------- First week of month. Report of Activities of State and Municl· Every 4 or 5 weeks.
pal Employment Agencies. Not .published ........................... .
Wholesale prices of commodities, including Wholesale Prices of Commodities.-- ...... farm products, rood, clothing, metals, etc. I
Wholesale price index ......... .--------------- Monthly Labor Review ___________________ Monthly. Retail price index or roods ...................... Monthly Labor Rev!ew ................... Monthly. Retail coal prices .............................. Monthly Labor Review_. _________________ Monthly. United States postal savings .................. Postal Savings News Bulletin ............. 12th of month. Postal receipts................................ Statement or Postal Receipts • ............ 7th or month. Passports issued ............................ ___ Not published ............................ lOth of month. b Government debt, receipts and disbursements Daily Statement or the U. S. Treasury.... Last day or mont . Mont•y in ciroulation from luly l, 11122 ........ Circulation of money ...................... Monthly. Domestic receipts or gold at mint .... " ......... Not published .......................... ..
Oleomargarine froduction ..................... Not published ............................ First week of month. Consumption o manufactured tobacco, snuff, Statement of tax-paid products • ......... .
cigars, cigarettes, and oleomargarine. Internal Revenue taxes on specified artirles... Classified collections of Internal Revenue. 25th of month. Iron ore movement ............................ Monthly stat!Etical report ................. Monthly during season. Sault Ste. Marie Canal tratllc ................. Monthly stntistlcal report ................. Monthly during season. Ohio River cargo trafiic ................................................................... Monthly. Barge trafiic on Mississippi River ............. Not published ........................... .
Agricult!lralloans ............................. Not published in for.m used ..... k·--·;----- I'th or month. Wisconsin factory earnings and employmen.t.. Bulletin on Wlsconsm labor mar et ..... ~
D.-REPORTS FROl'll TRADE ASSOCIATIONS AND PRIVATE ORGANIZATIONS (Excluding individual firms reporting data to be combined with other firms or trade associations)
!:I:RTHAW CoNsTRUCTION Co ........ Building costs ................................. , Construction trade papers ................. J RASIVE P.I.PER .I.ND CLOTH M.i.NU· Sale of abrasive paper and cloth ............... Not published ............................ ,
FACTURERS' EXCH.I.NGE. Alt:tii!CAN MANUF.I.CTUJ!.ERS AssOCIA.· Com ground into starch, glucose, etc .......... 1 Not published ............................ !
TION Or PRODUCTION FROK CORN. I ! AJu:rucAN BURE.I.U OF METAL ST.i.· Copper, silver, and lead production ...........
1
Not publ!shed ............................ l Ti8Tics. Zinc prOduction In Belgium ................... Not pubbshed ............................ l
Zinc stocks in United Kingdom............... Not published ........................... . AHIIRIC.I.N F.I.CE BRICK ASSOCIATION .. Face brick production, stocks, etc ............. Not published............................ bl A~II:IIICAN NEWSPAPER PUBUSHERS' Stocks of newsprint paper ..................... Monthly report ........................... Mont Y•
A !SOCIATION. · ; h f th HEIUCA.N IRON AND STEEL INsTITUTE. Steel ingot production......................... Press release to trade papers • ------···----! 7t 0 man •
AHI!:RICAN PETROLEUll INSTITUTE .... , Gasoline and kerosene consumption ........... Special statement ............... " ......... , A:U:ERICAN PIG IRON ASSOCIA.TION .... Merchant pig iron production, etc ............. Not published ............................ . AloiiiiiiCAN RAILWAY A.ssociA.TION J Freight car surplus and shortage .............. Car Surp_lusagos and ~hortages ........... ~ee~JY·
(Car Service Division). Car loadings and bad-order cars ............... Information Bulletin .................... , T:fd Y· k 1 month AH
011111CAN TELEPHONE A.ND TELII:· Stockholders In the company .................. Financial papers ... ~ ...................... ; r wee 0 ' IIAPu Co.:
1
. AJ.IAERICAN WALNUT l\:l.i.NUF.I.CTUBERS' Walnut lumber and Jogs ...................... Not published ............................ : Quarterly.
SSOCI.I.TION, : AMRIUCAN WRITING PAI'ER CoKPANT ·I Purchases and sales of paper .................. Not published ... ··---------;-------------1
AKl!:lllCAN ZINc INSTITUTE............ Produc. and stocks zinc, retorts operating ..... Press release to trade_pape!'S ·--"--.-------· 13th of month. A~r~~ACITE BUEEAU oF INFORKA· Anthracite shipments and stocks .............. Statement of anthrac1te shipments -·-----~15th of month.
ASSOCIATED KNIT UNDERWE.I..R M.I.N• Knit underwear production ................... Monthly report • .......................... 1
Monthly. A ili'ACTUREIIS' ASSOCIATION. ' ~OCUTION or LIFE INSUR.I.NCIC New llle insurance business ................... Not published ............................ !
Au RE:JIDENTs. PremiuiD collections .......................... Not published ............................ M thl TOKOBILE l\:l.i.NUF.I.CTUBERS' AIIIIO• Automobile accessory sales.................... Trade Papers............................. ' on y.
BCI.I.TION. i OCSTON, C.t.P11 COD .I.ND NEW You: Cape Cod Canal tramc ........................ Not published ..................... ~ ...... ,
.I.N4L Co. · · • MultiiJ'IIphed or mimeoaraphed sheets. liiOparta and exports ol&old and silver in Pert II.

66
SOURCES OF DATA-Continued
SOUBC!l DATA CURRENT l'UBLICATION DATE OF l'UBLICATION
D.-REPORTS FROM TRADE ASSOCIATIONS AND PRIVATE ORGANIZATIONS-Continued (Excluding Individual firms reporting data to be combined with other firms or trade associations)
BosTON CHAMBER OF COMMERCE..... Receipts of wool at Boston .••••••••••••••••••• , Trade papers ••••..••.••••••••••••••••••••. ~ Daily. BRIDGE BUILDERS AND STRUCTURAL Fabricated structural Steel sales before April, No longer published •••••••••••••••••••••••
SOCIETY. 1922• · M thl DUBEAU or RAILWAY EcoNOMICS •••••• Number o! tons carried 1 mile •...•••••...••••• Summary of operating statiStics........... on Y· Average receipts per ton-mile •••••••••••••••••• Not published •• --~-------,--.-------------
CALIFORNIA REDWOOD AsSOCIATION .. CALIFORNIA WHITE AND SUGAR PINE
AssOCIATION. CmcA.GO llOA.RD 0'1" TRADE ••••••••••• CHILDS Co •••••••••••••••••••••••••••• CLEVELAND TRUST Co ••••••••••••••••
CoMPAGNIE UNIVERSELLE DU CANAL MARITIME DE SUEZ.
CONTAINER CLUB •••••••••.••••••.••••
CREDl'r CLEARING HOUSE •••••••••••• DAIRYMEN'S LEAGUE COOI'ERATIVE
ASSOCIATION, INC. F, W. DODGE CORP ••••••••••••••••••• EMPLOYERS' ASSOCIATION OF DETROIT. ENAMELED SANITARY MANUFA.C·
TUBERS' ASSOCIATION. FED&RATION OF lRON AND STEEL
MANUFACTURI!r.S (British). FELT MANUFACTURERS ASSOCIATION •• FINE COTTON GOODS EXCHANGE •••••• FIRE EXTINGUISHER EXCHANGE ••••••• FoUNDRY EQUiniE!'IT MANUFA.t-
TURERS' AsSOCIATION. HARDWOOD MANl"ftS, INSTITUTE ••••••• llAFFARDs, G. M., & Co •••••••••••••• HYDRAUUC SOCIETY ••••••••••••••••••• ILLUliiiNATING GLASSWARE GUILD ••••• IOWA-NEBRASKA CANNERS' ASSOCN .. ;JACKSONVILLE CHAl411ER OF COMMERCE 10NES BROS. TEA co •••••••••••••.•••• LAKE SUPERIOR IRON ORE ASSOCN ••••• LEATIIEB BEtTING ExrnANGE •••••••• , LIFE INSURANCE SALES RESEARCH
BUREAU. MAPLE FLOORINCt MANFRS. ASSOCN ••• MCLEAN BUILDING REPORTS, LTD ••••• MERCHANTS' EXCHANGE OF ST. LOUIS.
1\IICHIOAN IIARDWOOD l\IANUFACTUR· ERS' ASSOCIATION,
1\IINNEAPOLIS CHAl4BER OF COM• MEIICE.
NATIONAL ALLIANCE OF CASE 000DS ASSOCIATION.
Passengers carried 1 mile...................... Summary o! operating stat1st1cs........... Monthly. Railway employment......................... Not published •••••••••••••••••••••••••••• Locomotives in bad order..................... Not published •• ---------·-·············-· Per cent of earnings on valuation •••••••••••••• Not published ••..••••••••••••••••••••.••• Redwood lumber production, etc •••••••••••••• Not published ••••••••••••••••••••..•.••.. Sugar pine lumber production, etc •••••••••••• Not published ••••••••••••••••••••••••••••
Wheat, corn and oats, receipts, etc •.•••••••••• Restaurant sales .••••••••••••••• -------------. Automobile production, monthly, January,
1920, to June, 1921.
Trade papers •••••••••••••••••••••••••••••• Daily. Monthly report. ••••••••••••••..•...•.•••• Monthly. Not published currently ••••••••••••••••••
Suez Canal tratnc •••••••••••••.••••...•.•.•... Le Canal de Suez......................... 5th, 15th, and 25th or month
Production of paper box board through April, Not published •.•••••••••••••••••••••••••••
ci:~i conditions ••• ---------··········----·-- Credit.................................... Weekly. Milk deliveries to milk plllnts .•••••••••••••••• Not published ••••••••••...•.•••••••••••••
Building statistics-Contracts awarded ••••••• Statement on Building Statistics •••••••••• Monthly. Detroit lllctory employment ••••••••••••..•..•. Weekly press release ...................... i Enameled sanitary ware •••••••••••••••••••••• Not published ••.••••.••••••••••••••••••••• ! British iron and steel production.............. Trade papers.............................. Second week or month
Roofing felt production, stocks, etc •••••••••••• Not published •••••••••••••••••••••••••••• Fine cotton goods production and sales........ Trade papers .•••••••••••••••••..•••••••••• Shipments ol fire extinguishers .••••••••••••••• Not pubhshed •••.••••••••••••••••••••••.. Foundry equipment production.······-------- ---···-·------············---·----········-- Monthly.
Stocks and untilled orders hardwood lumber .• Fall River Mill dividends ••••••••••••••••••••• Hydmulic machinery shipments, etc ••..•••••• Illuminating glassware production, orders, etc. Unsold stock of sweet corn ••••••••••••..•••••• Turpentine and rosin receipts •••••••••••••••••• Sales •••••••••••••••••• _:. •••••••••••••.. _ •••••• Consump.and Stocks of Lake Superior Iron Ore. Sales or leather belting ••••••••••••••.••••••••• Life insurance sales •••••••••••..••••••••••..••
Maple flooring production, etc .•••••••••.••••• Canadian building contracts •••••••••••••••••• Receipts and shipments o! lead and zinc .••.••• Mississippi River tratnc •••.••••••.•••••••.••.• Hardwood and softwood lumber, production
and shipments. Linseed oil and oil-cake shipments ••••••••••••
Monthly report ••••••••••.•••••••••••••••• Bradstreets •••••••••••••••••••••••....•••• Not 'published •••••••••••.•••••••••••••••• Not published ••••••••••••••••••••••••••••• Weekly report • ••••••••••••••••••••••••••• Naval Stores Review ••••••••••.••••••••••• Financial papers ••••.•••••••••••••••••••.. Monthly report• ----------------······---Montbly report (not published) ••••..••••• Monthly release •••••••••••.••.••••••••••••
Not published •••••••••••••••••••••••••••• Canadian Building Review ••.•••••••••••• Receipts and shipments at St. Louis .••••• Not published •••••••••••••••••••••••••••• Not published ••• ----···--------------····
Monthly statements ••••••••••••••••••••••
Unfilled orders and shipments o! furniture •••• Not published in form used •••••••••••••••
Brass faucets, orders and shipments •..•••••••• Not published •••••••••••.••••••••••••••••
Quarterly.
Weekly. Weekly. Monthly.
18th of month.
Monthly. 3d of month
NATIONAL ASSOCIATION OF BRASS MANUFACTURERS.
NATIONAL ASSOCIATION OF BUTTON Button stocks, activity, etc •• , •••••••••••••••• Weekly report ••••••••••••••••••••••..•••• Weekly. 1\fANUFACTUREI!S.
N ATJONAL ASSOCIATION OF CHAIR Chair shipments and unfilled orders........... Not puolished in form used ••••••••••••••• MANUFACTURERS.
NATIONAL ASSOCIATION OF CORRU• Production of paper box board through April, Not published ••••.••••••••••••••••••••••• GATED AND FIBER BOX MANFRS, 1923.
NATIONAL ASSOCIATION OF FARJ.! Agricultural pumps ......................... .. Business conditions (Chicago Federal Monthly Reserve). EQUIPl4ENT MANUF ACTlJRERS.
NAtiONAL AssOCIATION OF FINlBBERS OF COTTON FABRICS.
F'::~~:, ;~~t~ro~~~ds, billings, orders, shin- Not published ..••••••••••••••••••••••••••
Hat production, etc., and stocks of fur......... Not publ!sbed •••••••••••••••••••..••••••• NATIONAL AsSOCIATION OF HAT MAN· UF ACTURERS.
NATIONAL· ASSOCIATION OF STEEL Steel furniture Shipments ••••••••••••••••••••• Not published •••••••••••••••••.•• : ••••••• FUUNITURE MANUFACTURERS,
NATIONAL ASSOCIATION OF SHEET AND Sheet-metal production and stocks ••••••••••••. Not published ••••.••••••••••••••••••••••• TIN PLAT£ MANUFACTUBE!lS.
NATIONAL Assocu.TION OF WooL 1913 figures !or active textile machinery ••••••• No longer published •••.••••••••••••••••••• 1\IANUFACTURE!tS.
NATIONAL AUT0l40BILE CHAMBER OF COJ.Jl!ERCE.
NATIONAL BOTTLE MANFRS, AssoCN ••• N AT!ONAL CONTAINER ASSOCIATION •••• NATIONAL ELECTRICAL CREDIT Asso-
CIATION.
Production and shipments of passenger cars · and trucks. Glass bottle production index.··-------------Production of paper box board since April, 1923 Credit conditions •••••••••••••••••••••••••••••
Tra!lic bulletin• (production figures not published).
Not published •••••••••••••••••••••••••••• Not published •••••••••••••••••••••••••••• Not published ••••.•••••••••••••••••••••••
Second week or month.
NAT. INDUs. CoNfERENCE BO.\RD ••••• Cost !!l livlnf···-------······················· Monthly press release •••••••••••••••••.••• 21st of month. Ni_~~~t~;~BINE TOOL BUILDERS' Machtnc-too orders, etc ••••••••••••••••••••••• Not published ••••••••••••••••••••••••••••
NATIONAL PAVING BRICB: MANUFAc-TURERS' ASSOCIATION.
NATIONALRETAILDRYGOODSASSO ••• NATIONAL WooD CHEMICAL ASSO .... NEW ORLEANS BOARD OF TRADE •••• NEW ORLEANS COTTON EICIUNGE •••• NEWS PRINT SERVICE BUREAU ••••••••
NEW YoRB: CoFFEE AND SUGAR Ex NEW YORK METAL EXCHANGE ••••••• NEW YoRB: TRUST ColoiPANY •••••• :::: NORTB CAROLINA PINE ASSOCIATION •• NOIITHEIIN HEl4LOC!t.I.ND HARDWOOD
MANU'I"ACTUIIERS' ASSOCIATION. NORTHERN PINE MANJRS. ASSOCN Oo\B: FLOORING MANJRS. ASSOCN 7 ... Onto FOUNDRYKEN's AssOCIATioN:::: OPTICAL MANUFACTUBERS' ASSOCN PACIFIC CANNED Ftsn BROKERS':;;;·
I!OCIATION.
Paving-brick production, etc •••••••••••••••••• Monthly report •••••••.•••• ~------······-·
Department store trade (aee Fed. Res. Bd.) ••.• Federal Reserve Bulletin •••••••••••••••••• Production of wood alcohol and acetate of lime. ~ot phublished ••••••••••••.••••••••••••••• Rice distribution through New Orleans ••••••• ,,font ly report. •••••••••.•••••••••••••••• Cotton receipts into sight. •••••••••••••••••••• Monthly report Canadian newsprint production, etc ••..••••••• Monthly bulletin·················----···· United States newsprint data sinceJune,l923.. Monthly bulletin·---------·-············· Coffee receipts, stocks, etc ..................... j Monthly stateme;;t··------··············· Stocks of tin.................................. Trade papers • ··············-----·-Indexes of stock and bond prices •••••••.•••••• The Index ····················--········ North Carolina pine, production, etc.......... Not publisbed·-···-------------·····-----llemt lock and hardwood lumber production, Not published:.:::::::::::::::::::::::::::
e c. Northern pine lumber and lath •••••••••••••••• Oak tlooring, production, etc •••••••••••••••••• Ohio foundry iron production ••••••••••••••.•• Sp!!Ctacle frames and mountings, sales, etc. ••••• Shipments of canned salmon ••••••••••••••••••
Not published •••••••••••••••••••••••••••• Not published •••••••••••••••••••••••••••• Monthly report• (not published) ••••••••.• Not published •••••••••••••••••••••••••••• Not published .•••••••• ~----··············
• Mn!tl~~n~phed or mlmeoiiJ'aphed sheets.
Monthly.
First week or month. First week of month.
First week of month. First week of month. Monthly.
Monthly.

67
SOURCES OF DATA-Continued
SOURCE DATA CURRENT PUBUCATION DATE OF PUBLICATION
D.-REPORTS FROM TRADE ASSOCIATIONS AND PRIVATE ORGANIZATIONS-continued
(Excluding Individual firms reporting data to be combined with other firms or trade associations)
PENNSYLVANIA RAILROAD Co ••••••••• J Stockholders In the company •••••••••••••••••. PENSACOLA CHAMBER OF COMMERCE .• Turpentine and rosin receipts ••••••••••••••••• PHILADELPBIA MILK EXCHANGE ••••••• Milk receipts at Philadelphia •••••••••••.•.•••• PORTLAND CEMENT ASSOCIATION...... Cement paving contracts •••••••••••••.•••••••• PREPARED ROOFING MANFRS, ASSOCN. S.hipments Of prepared roofing ••••••••••.•••••• PULLMAN CoMPANY................... :Pullman passenger traffic ..••••••••••••••••••• REFRACTORIES MANUFACTURERS' AS· Fire-elay brick production, etc ••••••••••••.•••
SOCIATION. Silica brick production, etc ••••••••.••••••••.•• RzcE MILLERS' AssOCIATION.......... Rice receipts, stocks, etc •••••••••••••••••••••• ROPE PAPER SACK MANFRB. ASSOCN •• Shipments of rope paper sacks •••••••••••••••.. RUBBER ASSOCIATION OF AMERICA •••• Automobile tires, tubes, and raw materiaL •••• RUBBER GROWERs' ASSOCIATION •••••• Rubber stocks In England •••••••••••••••••••. SAVANNAH BOARD OF TRADE •••••..•• Turpentine and rosin receipts •••••••...••••••• SAVINGS BANKS ASSOCIATION OF STATE Savings banks deposits in New York State ••••
OF NEW YORK,
Financial papers •••••••••••••••••••••••••• ! Quarterly. Naval Stores Review ••••••••••••••••••••• .! Weekly. Not published •• ······················----1 Concrete Highway Magazlne ••••••••••••••
1
Monthly, Not published •••••••••••••••••••••••••••• Not published •••••••••••••••••••••••••••• Not published ••••••••.••••••••••••••••••• Not published ••••••••••••.••••••••••••••• Monthly report. ••.••••••••••••••••••••••• Not published ••••••••••••.••••••••••••••. Monthly reports (not published) •••••••••• Bulletin of Rubber Growers Association •• Monthly. Naval Stores Review ••••••••••.•••••••.••• Weekly. Not published ••••••••••.•••••••••••••••••
SILK AssoCIATION OF AMERICA........ Raw silk consumption, etc.................... Monthly press release to trade papers • •••• 5th of month, SOUTHERN FURNITURE MANUFAC· Furniture shipments and untilled orders ••••.. Not published in form used •••••••••••••••
TURERS' ASSOCIATION, SOUTHERN PINE ASSOCIATION •••.••••• STEEL BARREL MANFRS. AssocN •••.•• STEEL FOUNDERs' SOCIETY ••••••.••••• STOKER MANUFACTURERS' ABSOCN •••• STRUCTURAL STEEL SOCIETY ••••••••••• TANNERS' COUNCIL •••••..••••••••.••• TUBULAR PLUMBING GOODS ABSOCN •• TWIN CITY MILK PRODUCERS' ASSO·
Yellow pine production and stocks •••••••••••• Steel barrel shipments, orders, etc •.••••••••••• Sales of steel castings ••••••••••••••••••••••.••• Sales of stokers through December, 1922 ••••••• Sales of fabricated structural steeL ••.••••••••• Leather production through May, 1922 •••••••• Tubular plumbing sales ••••••••••••••••••••••• Milk production, Minnesota •••••••••••••••••.
Not published in form used ••••••••••••••• Monthly reports • (not published) •••••••• Not published •.••••..•••••••••••••••••••• No longer published •••••••••••••••••••••••
CIATION,
Not published ••••••••••••.••••••••••••••• Not published .••••••••••••••••••••••••••• Semiweekly reports ••••••••••••••••••••••• Not published ••••••••••••••••••••••••.•••
U, S. STEEL CORPORATION ••••••••••••• Untilled orders................................ Press release • ••••••••••••••••••••••••••••• Earnings ••••••••••••.••••••••••••.•••••••••••• Press release • •••••••••••••••••••••••••.••• Stockholders ••••••••••••••••••••••••••••.••••• 1
1
Financial papers .••••••••••••••••••••••••• Wages o{ common lab.·r....................... Special reports • ••••.•••••••••••••••••••••• Printing activity ••••••.••••••••••••••••••••••• Typothetae Bulletin •••••••••••••.•••••••• Restaurant sales.............................. Monthly press release • •••••••••.••••••••• Douglas fir lumber production, etc •••••••••••• I Not -published •••••••••••••••••••••••••••• Sales of elastic web6ing. •...•••••••.••••••••.• Not published •••••••••••••.••••••••.••••• Western pine lumber production, etc •••••••••• Not published .•••••••••••••••••••••••••••
lOth of month. Monthly. Quarterly. Occasiona.IIy. Monthly. UNITED TYPOTHETAE OF AMERICA •••••
WALDORF SYSTEM, INc •.•••••••••••••• WEST COAST LUMBERMEN'S ASSOCN •• WEBBING MANUFACTURERS' EXCH •••• WESTERN PINE MANUFACTURERS'
ASSOCIATION.
SOURCE DATA
111.-REPORTS FROM TECIINICAL PERIODICALS
Al!ERICAN METAL MARKET ••••••••••••••••••••••••••• THE ANNAUST ••••.••••••••••••••••••••••••••••••••••••
THE BOND BUYER.--·-----···---------------··------
BaADSTREET'B ••••••••••.•••••••••••••••••••••• ----••. -
BULLETIN DE LA STATISTIQUE GENERALE ••.•••••••••• CHElllCAL AND METALLURGICAL ENGINEERING •••••••• goAL AGE ••••••••••.•••.••••••••••••..•••••.••••••••••
Olll!ERCIAL AND FINANCIAL CHRONICLE ••••••••••••••
Dow, JONES & CO. (WALL STREET JOURNAL) ••••••••••
i~~R~~~~~'i>aiD:::::::::::::::::::::::::::::::::::: E NGINEI!RING AND MINING JOURNAL-PRESS ••.•••••••• FNG!NEERING NEW8 RECORD ••••••••••••••••••••••••• FINANCIAL POST ..•••••••.•••••••••••.••••••••••••••••• H RAN~SURTER ZEITUNG-- -----------------------------
In~~ A~~~~-~~~~~-~:::::::::::::::::::::::::::::::::: IRON TI!ADE REVIEW., ••••••••••••••••••••••••••••••••
tONDON EcoNOMIST···················-~·-············ MU!oi.BER.- --. ·--.-------------•••• -------------------•• MANUl'ACTURERS' RECORD ___________________________ _
~~~~~E~~~ERR:::::::::::::::::::::::::::::::::::::: ~ AVAL STORES REVIEW ••••••••••••••.•••••..••••••••• NEUE i'UI!.ICBER ZEITUNG •••••••••••••••••••••••••••••
EW ORK JOURNAL OF COlUlERCE .••••••••.••••••••
~EW YORE EVENING POST ••••••••••••••••••••••••••• OR TBWESTERN MILLER ••••••••••••••••••••••••••••••
OIL, PAINT, AND DRUG REPORTER ••••••••••••••••••••
~~~N;~~E I~ OURNAL •••••••••••••••••••••••••••••••••• Pu K •••••• " •• • •• ••• ••••· ••••••• ••••• ••••••• •• RU BUSBERS' WEEKLY ••••••••••••••••••••••••••••••••• St SSELL's CGllolliERCIAL NEWS •••••••••••••••••••••••• s/TISTICAL SUGAR TRADI!: JOURNAL ••••••••••••••••••
ENSK Il.!.NDELSTIDNING ••••••••••••••••••••••••••• c··
• Multliraphed or mimeographed sheets.
Composite pig Iron and steel prices .••••••••••••••••..••• New York stock sales •••••••..•••••••••••••••••••••••••• New York closing stock prices •••.•.•••••••••••••••••..•• Foreign exchange rates, 191<! to 1918 •.••••••••••••••••••• State and municipal bond Issues •••••••••••••••••••••••• Municipal bond yields •••••••...••••••••..•••••••••••••• VIsible supply of wheat and corn ••.•••••••••••••••••••.• Bank clearin~, United States and Canada .••••••••••••• Wholesale pnce Index .•••••••••••••••••••••••••••••••••• Business failures, Canada •••••.••••••••••.•••••••••••••• Price index for France .•••••••••••••••••••••••••••••••••• Chemicsl price Index ••••••••••••••••.•••.•.••••••••••••• Mine price of bituminous coal ••••••••••••••••••••••••••• Cotton (visible supply) and interest mtes •••.•••••••• c •• Mail order and cham store sales ••••••••••••••••••••••••• New corporate securities ••.••••••••••.••••••.•.•••••.••• New York bond sales and prices •••••••••••••••••••••••• Mexican petroleum shipments ..••••••.•••••.•.••••••••• Business failures and wholesale price index •••••••••••••• Sales of electrical energy, central stations •••••••••••••••• Rand gold production and silver prices •••••••••••••••••• Construction cost and volume index ••••••••••••••••••••• Canadian bond issues •.••••••••••••••••••••••••••••••••• Price index lor Germany •••••••••••••••••••••••••••••••• Hay receipts •.•••••••.•••••••••••••••••••••••••••••••••• Pig-iron production and furnaces in blast •••••••••••••••• Composite tinished steel price ••••••••••••••••••••••••••• Iron and steel prices ••••••.•••••••••••••••••••••••••••••• Railway freight car orders ••••••••••••••••••••••••••••••• Price index for United Kingdom ••••••••••••••••• , •••••• Price indices of lumber •.•••••••••••••••••••••••••••••••• Southern construction and southern bond Issues ••••••••• Milk receipts at Greator New York ••••••••••••••••••••• Argentine visible supply of wheat and corn •••••••••••••• Turpentine and rosin, receipts and stocks ••••••••••••••• Price index lor Switzerland •••••••••••••••••••••••••••••• Dividend and interest payments •••••••••••••••••••••••• New capital issues and new corporations •••••••••••.•••• Fire losses ••••••••••••••••••••••••••••••••••••••••• -····· Newspaper advertising •••••••••.••••••••••••••••••..•••• Flaxseed, receipts, etc •••••••••••••.••••••••••••••••••••• Wheat !lour production lor 1917 ••••••••••••••••••••••••• Price indices of drugs, oils, etc •••••.••••••••••••••••••••• Argentine visible supply of flaxseed •••.••••••••••••••••• Mexican petroleum si:Upments •••••••••••••••••••••••••• Magazine advertising ••••••••••••••••••••••••••••••••••• Book production •••••••••••..••••••.••••••••••• -··--···· Wbeat flour production, !rom July, 1920 •••.••••••••••••• Sugar stocks, receipts, meltings, and Cuban statistics ••• Price Index for Sweden ••••••••••••••••••••••••••••••••••
0
DATE OF PUBUCATION
First or second week of month (dally). First weekly issue of month (Mondays). Weekly (Mondays). Weekly (Mondays). First weekly issue or month (Saturdays). First weekly Issue of month (Saturdays). Weekly (Saturdays). First weekly Issue of month (Saturdays). Second weekly issue of month (Saturdays). First weekly issue of month (Saturdays). Monthly. Weekly (Wednesdays). Weekly (Thursdays). Weekly (Saturdays). Second or third weekly issue or month (Saturdays). Lnst issue of month. First week of month (daily), 20th of month (daily), First weekly Issue of month (Saturdays), First weekly issue of month (Saturdays). Second weekly Issue of month (Saturdays). First weeklY issue of month. Weekly (Thursdays). Monthly. Weekly (Fridays). First weekly issue or month (Thursdays). Weekly (Thursdays). Weekly (Thursdays). First weekly issue of month (Thursdays). lOth of month. First weekly issue or month (Fridays). Monthly. Weekly. Weekly. Weekly (Saturdays).
First week of month (daily). First week of month (daily). lOth of month (daily). Not published. Weekly (Wednesdays).
Weekly (Mondays), Weekly (Mondays). lOth of month (monthly), second week of month. Third week or month. Weekly compilation (dally). Weekly (Fridays).

PUBLICATIONS OF THE DEPARTl\IENT OF COMMERCE
RccNtL publications of the Department of Commerce having the most direct interest to readers of the .-{uavia ov CunnENT Busi:>:l'>'H Lre listed below. A complete list may be obtained by addressing the Divi~ion of Publications, Department of Commerce, at Wash in !ton. CopieR of the publications may be purchased from the Superintendent of Documents, Uovcmmcnt Printing Office, \Va.;hington, at the prices stated below. If no price is mentioned, the pt;,blication is distributed free.
Ol'FICE 01<' TUE SECRETARY
J,umbt>;·: ziim])lif'h•d l'rad:Ite lr.ecommcndation.-This ln·lletin i~ a \'on!inuntion of the E!iminnt.ion of Wa~te St>ries nnd c.>nk tts the n~•·mHHH1rHled stancbrd~ on lumber cla~sifi- ; cntion, i!,r.t<:c nntiH'S, i'tnn<hrrl and extra standarrl size . .; for · !umlwr :'> a•":.,, me1 hod,.: of lumh'r nwa<>nren!ent, standard shipping Wl'iv,L t.<, .-::ipping, and ollwr r•rovisions.
{For circu1ars giving nl:m of puhlicntion nncl distribution of F'ourtC{'nth Cen~us puhlie,4tJOn~ nddres.." the Oircetor of the Cen3usl
C:ensus •~f ~lfanurattures, 1921.·---InduBtry bulletin series: Cotton m mHfac·tun"l, 2!J pages; The leather industries, 53 png•·~: Co ·dage, t\\'in(', jute good;;, linen goods, fur-felt h!>t~. d• ,•ing and fini~hin1; 1e:dil(':l, oilcloth and linoleum, flax and J,rlllp, dre:.;<ed hair..!oth, nut1.;; and matting, 36 pages; \Vearing apr•an•l, ·1} pagp;;; CIH.'mieals and aeids, 48 pages; Clay and TP~l·af•i.ory rroduct..:;, 23 pPgen.
.l<'orcst Produeb, series, 11l22.··-Pulp-wood eommmption
Fm·eign Capital -=:nn·~tmPn ts in Itussian lndust1•ies and Cutnnlcrce, l}y Leqn:1:·'l .L L:.:\\·r·ry, ~·~:~i:-n~tllf ehir-f~ I•~JJropean and Le•.~.:tntint> I>i\y; Ji(>n. i\Tisf•t)l!~ud·ou...; ~~:-r-iP~ No. 12'!1 28 pages. ~rhe reJK>~-t. {'flHta!:l.: :L ··t-:.:-,uae d •. thn r~··n·iga c~tpital invc~trnents in H.tJs~i:tn i1ui:1~i ,..!r.o :; 1 Jd t'1llHlll(•r'"·r·. t•otupilcd fron\ Sn\-i0t nfiiei.tl s~_,urces. P1 ic~·. ;) t'l':1t,.-1
Am<>~·icau .\utomntive ••ra~nd.,.. in ::;J:a. by C. C. Batehcldcr, tra:-Ic Ul;niitti~si;nl:-,. ~);w,·i:d _..\g: :1t ~ N ·rie . .; ~fo. ·2'~:~; 61 pagt;:;. The sturly cmhr:H'('~ an :tnnl::si.o .,f e:,!Jdit.ion~ n.ffecting the autntnobib ind'E~ r.'· ;,;,r! ,·.;:.\:tit!.< infonnation e•mecrning husin(''" meth.,do. P•·j,.,,, lfl c,·nh.
Market l\fctbnd.-; and 'rratic C:::t!l;?~' :n I(J;Hit)n, '"'In· pi1c1l by the MtafJ of the .:\nH~rH:an ,~nn:-,·d--11~· ~~~nt\r:Ll in London. t;pet:ial (~onsulf!,r Hr-p::;rt,-.: :\,., SH; 'i2 pn~~>::o. Bt'CnTt-->~ of the imporkwce of 'LoJHlon :ts :u1 intemalional market, t!1is stuc!y ctcs,·rihcs the methods of handliw:: <'ertain imp,>ri.au~ commodities :u typical of method<; :1nd n~ag,·F in Londno. A report on cotton at Li ·Jerpool b indude,l. i'ric<~, 10 cents.
BUR1!:AU 0.1<' FISUERU:S nnd wood-p11lp produetion, 16 pageR.
~tale ('OIHJH'IIdlums, 1920.·---Arkansas, Hl 2ii f'l'l'1"; ''alifornin. l!)G pag<·s, 30 CPnts.
pn.gc~, price 1 Artificial Propagation of \1.hitefish, Grayling. and Lake , Trout, by Glen C. L<'ach, assistant in <'ll:Uf:\C of lish cuiturP.
F'ourtN·DHI (;ensus Report, Volume IV, Occupations, l,:SO!l pagf~:;. Price, $2.2.').
BURK<\U OF Jt'OREIGN AND DOlUESTIC COl\IlUERCE
Commt!rCe Reports.--A W<'ekly survey of foreign trade. Cable sun·maries of world eonditions and articles on situation in various commoclitie;.; in foreign ('OUntries. Quarto, 72 pages. Pri<'P. 10 u·nh r)('r enpy; $a p<'r year ($5 for foreign).
1\Jnnth,~· ~•umm:cry of l''m·eign Commerce of the {;uHPtl ~ tat<'s.- l'nrf, l a.nd ~. Gives total valups by eountri<·~ utd by e!l.;toms di,.:trirts, movements of gold and Nil ver in f Jreign. trade, merel.awlise remaining in warehouse, unrl i mde witl'i noneontiguous territories of the United i::itates. l>ri<·<•, I 0 cent:<, inclwlinp: both parts; $1 per year.
{'n;!l•• l~ubbt•r Suney: No. L Marketing of Ph::J.t.ation 1l<lhlwr. l v .1. J. Blandin, spPeial agent. Trade Id<1rmation Bnll<'tin ~;·n. l'i!l. Crudl' rnhber is one of the raw materials under spf' ·ial investig:;tion hy the Department of Commeree, anrl this review of plantation r11hber is the first uf a ,:eries of reports gmwing out of the Hhtdy of the rubber siiu:1tion. T"pi(·R Pll'-'<mtPd are world rubber pro<luction anrl portion hi:, .. ; by l'nited Stales, methods of direct pun·ha~·~ by l'nitcd t't.llc·,.· ,.,,, ,.,.rtl~. European and Far Eastern markPts. In t.he appendix .o i b• r<·port are printed the rules and regulationR of ihc Hubl)('r A'~<wiation of North America. !
Protesting !)rafts in Westercl and Northern J<;urope, preparpd in tLc Division of Coranwreial Laws from reports Fui.mittPd bv Atnl'ri<'Ull consuls and reprnsentnti\·es of the [kpart.awnt 'of Cnrnm;,rr·P. Trade [nformation Bulletin i\o. 11'::), I~ p:· """· This hullc1 in is a continuation of the series. of which nii:o' numbers havP nlre:1d\' been announced. The methn<!s C>f p·td<•Htinl! rlmft;; in these' countries have hllcn developed l·y thC' qtl ,,tionnaire pbn in whieh was used a set of 10 questions covpring the lead in~ pha>~cs of the subjec·t.
Met!w~ls of M(•r«>handisiug American Wheat in the Export 'rl'ade: J.>art I. Buying Wheat for Export, by Theodore D. IJamrnntt, special agent. Trade lnformation Bulletin No. 1R3; i-1 pages. r..tethodR employed by exporters arc prosentPd in detail, wit.h accompanying illustrative- material in form~ and f'hart;.;.
Same: Part H. !0\(•llin!r. Ameri<>an Wheat Abroad. Trade Information Bull<)tin No. JR!'i; IS pages. This part of the ~urve, discusseR rrt('thods of operation, st>euri ng ::supplies !.:1ndling ·vheai at p"rtR, sales pradic·es and liu.-;ards, Rhipping :·ractit•f'f< at New York. As ill Part I, numerous forms are h··h:d<>d.
('uban Market for l'atwr and I'ap1•r R•n•durts, hy C. A. Liv<'PI';• '"' , trade rommi,.;~iooer, I! :tiJ<tr:a. Trade 1 nformation ll!!Ji<·1in :\o. l'l:2; Iii pn!!,t'S. Thi~ is the third of a st>rie~ of t>;llldin~ i '''"'"on lhP prtj'nr markets of vnr;c!l!S Lntin-:\merif'an rf•!o(ion~. The rf'portH cdl'>W 1 i,:lf the ,d f"fl!!,' I'Ol!lpC'tition frnrn European Enurt'<''l nw.kPs n<'ee-;:<:lry a 1l~<;rough auderstanding of the fur1 ors enJitr•;lli Ill!,' the:<e markd,s.
Bureau of Fisheries Document. :'\o. 9-H1; ;;:2 p:tgcs. For tile typ% of fish included, t.he poiHt.o; discl!Ss<~d arc rangp and description, habits, comtaercial valnc, methods used in artificial propagatirm.
BUREAU Olt' STANI>AUDS
l'v1et-Prore..,:; Enam;•!s for 1;ast Iron, f.Jy !C IL IhniPlson, tcchnolcg~~i,, und }1. P. heinc··kt-!r, as.-;i.-:tant cbctni~-d. 'Cet~hnolog;ic· Paper ?\o. :.l!H; 11 page~. Thi~ p.~fn'r deals with an inve~til!aLion of vitr<'ous enamels to l>c applied Lo east iron by the wt>• proec~.<~, buth with and without groar;d eonb. Pri()e, 10 ('PIJh.
R!:})f)sure ·':'r,~s on Colorless Watt>rpmoflul! Maii)Ti31s, by D. \Y. I\ck:<;r. tl.-Sl)Ciat<- !Jh'·~idsi. Teehn.,logie Paper No. 24R; ~4 p::Lg~...·~. ~rh~ report (~·~-;critH'H lllP n:.tturP nf RCYer't-1 eoloriess "·atcrproofiw: material< antl res:Jlts of t('sL:, in t11"ir applie:1tion to the :-:u:·far~c nf sneh porous iatl.l.t•rials as t>tono, brick, and r•,)n~retc. Priee, 15 ,.cnt,;.
Lt'~al W.:lights 1:.1 Pound.~; per Bushel of Various Conlmodit!e;;. (F,,l;th cditioH, .Jan. :2:2, l D24.) Circular Xo. IO; IS page,. Price, .') cents.
Numbered Cotton D~ck, United Slat!'s (;overnment standard SfiCCitlcation I'io. ;}3. Cirr·ular J'\o. l;}G. ~P''':ificntions offirially ildopt0cl hy 1 he F<'(kml ~pw•ific•:ttinns lloarrl for the n~e of the depurtrnent~ il'Hi in,lr~p.,udcr:t P.~tabli~l,ments of the Government in the purchase cr l:<Imhered dude
'\'fall Plaster: Its 1ngreaients, I•reparatinu, and Properties. Circular I'i·J. liH; fiG pag<:'s. Pri<·<~, 1 ;) centt~.
BUREAU OF NAVIGATION
Seagoing Vessels of the 'l'nited States, 1923.---Part VI of the fifty-fifth annual li8t of m<>rrhant Yes:wl>l ,,f thP United States for "the .\·ear ended June 30, 102:~. Price, :15 eents.
Commertial and Hovernment ltadio Station::. of the United States, edition of Jnne :10, 1923. Price, Iii eents.
Amateur Radio Stations of the United Stlltes, c<litlon of June 30, 1923. Price, 2.5 eents.
COAST AND GEODETIC SURVf~Y
Results of Observations Made at the United Statos Coast and Geodetit Survey Magneth' Obsf.'rVl\tory near Tucson, Ariz., in 19Hl and l!J20. b_-, Daniel L. Hazard, a~~istant chief, Divi8ion of Terrestriai :\1!,;.:ndism. Serial No. 248. Contains 98 pa~~:es of tables and ~() ehartii.
Buoy Lists. llawalian and ~amoan Islands, and J•orto Rico and Adjacent Islands.-- Both li,;t,.; are corrlo'cted to November 1, 1923. Price, 20 eents each.

D.EPART:\IENT OF COl\11.\tiERCE HERBERT HOOVER, Secretary or Commerce
BUREAU OF 'fHE CENSUS \\.I!.r.t.uf .:\1. :-4TCFART, Dirednt'
( 'hief function.~ The takin~ pf the o:h!cPY:ni~t! een~u .. ~u\ erir1g population, agri
culture, mannfa~tnrec;. mine~ and qu:1rries, alH! fore~L produds. lJececmiul repor1 ua wealth, pui,Jie tit•:,t, ;.nd !u.-..::J.ti•m, iaclurl
in1; principal fiua1,eiai stati:;tic~ on Federal. ;-}tate, C•lunty, city, autl to\vuship f!;t) \'l:'naneut.s.
.. \r~nt~a.l fin:trH'I.:d .:-:tat.btics of ::-31ate au:l lOll!lieipal gr1Vl~rnlli.C!.1ts --~ouree3 u[ revennc. objet r::- ,Jf p~t} HlCJd . .-1, de:)t, tn.x levies.
1Jeeer.:.ni.:1i :~lat.}:-)ll~-8 relating tu ituuutc-5 of in~tltutions, in ... C}udirtg iJaUper.;; 1 :n:-;&Ile, pri.::i 11 :H'r3 1 ttud jLlVCilile dclintpl(;Uts.
A <·eu~u..; of a:~rit·ultaro lu C~ich tuiddet·cnnial year, lt [;i0Hnial C\~n~.!:-5 uf n1anuf..1eture~J :.t. qtt1-·. 1nennial ceu~u~ of cleetrical !
punli·: :ttii!tie~, ~t~1 listie:' of rr1a.rrj.;~<~e and divorec. Annuul ,.tatbt.ic, o! !J:n,hs, cicuth~, ,·:.use,.; of death, etc., in
iht: n·g:~;tration are...t \,r Lilt~ Cnitcd Sutt(~"· (~;t:utcrly stu.ti,;iic~ uf :e~tf [>JIJ.teC<• '""el;s and uf production,
Ht.od .. :<, awl evn~r:utpl :"'' ,,f f:tts and oils. :\·iollthh· :•r HClt,il:lOUthly stat btico ,.[ eoitoa ginning; cotton
stcwl~.;; and coa.,aropti,"Jn; thP I,;- .d~~c~i-.:~, stf,Ck:-i, and consumptioll of l1ides a.nd lca.Ujcr; the pt\Hlu :tl· )a of shoes; and Rtatistk.c; of aet.in· textile ruao!1incrY awl of 1110Vements in an increasing 1~HIUl)(;r o~ oLl,er iHdu:::LriC~.
'fl,e L•>!l!pi!atit,n :tnd publif"ai!ot;, [,. E.e "Survey of Current Bu~in<:~s," of won lilly <'urnrrtc:rr:ial and indusl ri::tl statistics.
BUREA[ OF I•OREIGN AND DOM~STIC COMMERCE .lul.ln: KLeix, Direetor
crLit'j fauctiuns
BUREAt; OF Fl8HERIES HE:'<iHY O'MALLEY, Commi1<siuucr
Ch7•J ju.nrtions
1~he propag[ttion of ltq('fnl fo·Hl fishPs, iae!udiln: !dLster!-1
oy'<i·er.<, and other shellfi,;!J. and t.lteir distribution t>t :<uitabk water~.
Investigations of fish r·•1hure, fiplJ tli:,ca,;es, am! f,r the eouservat.io!l of ti,;h<!l'.Y resourc~:,; anJ the de\·,·l· >J>IHeat of cdl11lU<Ircial ti>:lwrics.
The studv of the nwthud~ en· the fisheries and Gshcrv in.Juc;trie:l and the utilization of fi~hery prodJH·ts. ·
The C(lllcetion <lf stati~tit:,; of lis!wries. The admini~Lmtion of t!tt: .\lasku. :<almt>n li::hl'rie~. l.itr~ fnr-~eal
herd on the Prit)ilof IslaiHH, nnd the law f,,r the pr••'•'•'tll)ll of sponges off the coast of Florida.
BUREAU 0}' LIGH'l'HOUSES GEOHOE H .. PuTNA~t, Cmumi:<siouer
Cnief junction.~
The establishment a.ad mainteJ•:tuce of ligh<.l,;mo.;~~. li·~htships, buoys, and other aids t.o ual·i~:d.iuu "n 1.iw ··n~. '""l e1e lake coast and on t.he ri1·erH of the lluited ~;I.~Jl(··<, i1.d:Hiiug Alaska, Hawaiian Island.'!, and Port>J llito.
Tne puhlict1tiun uf Light L:Fis. i:noy Lislo;, and Yo\.,'<'s to :\Iarincrs, including inforunt ion regnrding all aid..; to :~:n ::• .. ; ;!."Jr.. maintained by the Lighthouse Ser\'ice .
COAST AND GEODETIC SlJRVEY E. Lt;;:;TEH .Jo~Es, DiredPr
Chief junction.~
TLe tf'rupilation of timeiy information concerning world IYHtrkct t:<"ldit!orh alld openin~s for Alllf'rir·~1!J prorlr:Ns in fur£~lgil countru:--: t-.Peured through cotnnlere~~.d u.tttl.cL(-... and trade corunJbci<m.,;·,.. of the JJop:~rLment of c._.n.merc,, :1:Hl the foreign sen·ice d the D•'J>~Httn,;~,t of Statf'. T!<c .!istributioll of such The survey of the e"asts of the United Htatl'E n.nd :h~: ;>;,hli-informatiun t."• ;l!ll<lrk:trr Lusinc~s thr'•llll:il wcel:iv ''Commerce cation of eharts nPederl for the navigatiun of i.!w ndJaect•~ rellt•rLH," <>Jn;•·ini I ··illl't i !tR, r•mllide!<l inl Circular~,· the nt>w,; and waters, including Alaska, tht_• Philippine hland''• lla\1 aii, l'<•rk tra.:l:: J>rt'''"· f'orrco{"nHlen.·c, and per,n:;al er•llta<:t. Approxi- Rico, lhe Virgin Tshnd$. nnd the Cn11al :l.<•llf'. Iuutely ;) .. 000 tra\!t· inqnirie~ arf· a.us\Yercd da.Jly by the bureau ... \.. cnrnprehensiYc geode-til! ~ystel!l, extending inl'> th~\ ini,·ril~r, aLHi it~ nlne db~ rl<'t oHitt.:..:. 1 connects and coordinatt~s t!Le ,-;1aVC\';:.; nf t !1e coa -..·t.:: .... IHl !,~ dt\_,
T!Je maintelltt:><·e of eummodit.y, technical, and geographical ' ~igned to furnish accumtcly dderrrii11cd Jh>inb :tnd ·: ...... ti···•~ diYi,:onh to alford ,.pef'ial ~erYiee tl) America:c '~'P''n ir:dnstries. ill all paris of the C<l\Wtr.'·· The:-<' ,trc a\·ailahk "'': i•:.·• [ ·"
The <'<ol!lpi!l,ti"r' :~•v! rli,otrihutior. of mw•e•' t>f ;'<•ssil>it' buyers Federal, State, actd m•wkip:1l s•In'<:Y•"· snd 0 :J!.!:!l'<'<'r;:·•, pr.·.· '1·: HILI ~l~er;t~ for ~\!ill"'Tlf·an prPduct~ in h.ll lJHrts (,f the 'V<,r1J a.nd of every kind. rl'lH' fll[tf!;llPtie det·!i~laiiolt ha.-, }H'•'!: d •it····z·:1a~J pu\,!ir·;c\.hH< of W(•ckly Jiqts ,,f "i'c:eifie ,;til<'~ <•ppurtu:lities abroad. at a large number of stutio;1s t h~"''glwuf t.!H' <·ount r: ·, :11Jd the
'T!;t~ ;u~tintc~na.rH·e cf dbt.rjet ~n~d c~,o~ :t rtd..ive oil Ice<::. in;);) cities rc;-;ults arc available for tLt: u~e ! 1f bUrvevnrs and ern inee:·s. '•t i.L•· l'nit,·d :'!a!,., '·'' ,,xpcdlt<~ dehn:•r.'· cf markd i!lf.,rmation The techn:cal opcrati(liJS irH:Iude lmsc; HH'<t~-><m·.<, · crut:l~nb-t<· bd<ll··~•' we:1 nnd to keep the rlPp:t;·tmf'Ht ad\"i~ed a~ to tioa, traverse, precis<• levd<n~, the dekrmination of ln. .it>uk a'••l !f:,. ~~r~;t'tJt re<t't:r~·~IH~nt:-; of AJneriean tra'"lnR and industries. azin1uth, the dett.!fiUilutfiun of difff•rP.Ill't,; ~,f lungitude hv t~~~~-
'!'iw P•tblit·J.1i•m .,f t,Jijr·ial stutisties on imp()r\S auct exports. graph or radio, mag;n<'li<· <observ:ttidns and n·~,:ru·et,,•H. tlrP Till' ,.t udy ,,[ t,Le pru('es~c~ of domesl.i" trade and <'()tnmercc, preparation of magneti•.; map~. l!tt' dl"!.ennin;d :"n ol t '"~ fnrr•c
'.V :tl~ tt. ·:ie\\' t~! 1 heir irnpr•H'("ll~Pnt anrl t.hc tti~spntiu!l tinn of of ~ravity' tO!)Ogr: .. p~y. hyrlro~r:l rhr. dvep-~~·a '=•:!1' F ft![",
<nh~wuli•·ll o!•t.n.iued f<·:· tl,e berJCfit of the pl!blif·, a~ weil &s of water temperatE!"%. tidal :t>1<l curren1. ol>~ervatiml". !IH·'''' r!in~d·l:; ''"ll<'t rne<i. The results nrc publ'~h·c~d iu the form <:f c·JJ:rrH "ll ,·nrwuil
.BPRK\U OF :-'TA~DARDS
(\ irf funcfl'·.)11.S
t_',u;-;!/,d.'"· (,f st:uui~ud.- ~.f HH;a~ilrernent, qun1ity, pPrfurtnance, 01 }Jrfl(;~ in\ ·~~l~~pted {lr !'(~c( ~!;l~:hl t ·y the (}o\ ~·r:1ItH~Ht. T)oYelt}T•I;;.··~tt u:!,~ Ci·I!.-.tr:~:._·tion ~~r :-·iie!t !-"tar:da,rdti \\LC)l uece.~·sarY. ·r""· .:t1:..-: a.1:·i (·.:diLl":t"'! :.d-: ~1f upp~·r;t~~l:·: and CIJirti'arisfJn of :-;tand:.r~ .. •:.,·. 1 \.:. ,·ic.d;fi,. u> <•thn institutions wiLh tlw;.,e in the . u .... JiuJy ,.f i1.l~ },,:f\':..:'J,
! i._·t(·r.ttilw.t:,j.it ,;; iJtl~,·;:-:~·u.i {'Ou'::tant-s and prop<~rt:e8 of ";_ll~i u; :~· . .;,
:.·: tii~~ d[ 1 .[)~·::~~:..:and e:~tabli ..... h::nent of standard~ and ~-.r, ~ t'·-~ ... trl t'{n~perati~ :t \\ i:..h t'ldUlt;tflCi~.d hrrus or organizations.
j !idl~-- 1 ··.:d l'i''-(';1r('L~·~ t'(,V(:ring ;·tn:rtuntlf eng~nCering, and :c·;::..::-v~~;~rt~ '·'~: JJ~·;Jpr>~~...:, r·ad!(_t., r·1.<inin, !ne·~·h:on:.•al applianees, ~~-::,:u 1.:·~·~1!. d·'f.'-~. [t_···,t'H.:r, p:tl)(~r. ru.rd--~rr, aHd t(lxtilc.;;; cJay :- .... , J·.t:t , ..:~-~ -. ·~·.~~ tt·fr~J·tflr:l~"'· nv~t[,l..., ~1.n(l lltt..-:.in11nrgy
1 u.nd
.. ld'~!t:r ;~r,),!J.. . •• :,!,,\·:
't': :\ I'I)~J •• ·l :· t' :·· ·~ -~~·-.::.::uinati<~n r~ lnr'cnnat.ion ~howing ap!\f"'l'.('•; n \'t!·<~· 1 -. ~r '·dilcE~~._-. r;l'HH!i1:v, <.'lncl c(1Yl::.truction, inchJd~1:.-. iH!:;,j!fti.~ Ll•··,·!··.~·-, !'!·d ,., ·l·.~ and fOlf;h other matters as1nav 6lh'<Jtlf":t<:.~\ tn:r•i'l_,\·c. :~J·'i eLc:tpen C~Jn~trtH~ti·,n and housing. ~
~~tuJie" ··It :-.iLq,:: :~:,1 :1 ::<t •. •rT~al nraetL2r:s and establishrnent of f~~:.:h J.Utci:.'p~, tl:n<~r .!; f'•;l!~~··r...tL~Ye l)u:-·iuessorga.nir.ations.
'The !~P;• :!1! i'uLli-J. ,~ :::-h~ 1--vric1 nf ~~ricntific aud terbnical puhlicnii<HJ!{, r(·f•urtins 1 !u· re:-'lllt:·) ,-,f i.t~ re~f'arehes and giving f.cclmical (hta lti!!danwn•al 1-; n:dc:,irv.
The Direct.c'r hn:s r.'ui-'CrYi~,:m: <•f r,iw· preparation of technical specifications tl.rou~:ll th,! Federal SJJ;:ocificationci Bo~ud.
scales, annual rt~ports, t•oa~t r}i!nt:-::, t~de t.abJr·~ : pn!~h ... ht~d annually in advanee), current tahit::-:, di;.u·st.;--· <;f gl_'{ldt·1 it· pll 1 )He~l1 !1HJs)
and ~peeial publications.
BUREAU OF NAVIGAT!ON D. H. C.• H"ON, f'<Jwmissiont•r
t}J12Cf J~tnclious
C~e11eral superint.cJtdence of <·o1nrncrcbJ Hiariue aud Iu1.·reh·1ui sr•amen.
~uperYision of regist~rinc:, enroflin,;, lict·~ltiiiu!. illlJr,t.t)r~n~z~ eit'., nf v<·ssp]:; under the IJnitcd ~tales ib14, and 11'" :l.lll:llal
puhlitation qf a li~t <'f ~·wh YCK"el~. 'The cnfnrcerncut of th~ H3.vigation ttlld t:t<~a.nlbt~tct i:~.~p~·<<;-.)d
la\V~ and t!1c la·w.:; ?!~)Vl'rniu~r radlo (:o tllnuiii,·:dit.t., a~' \\t·d t.J.' dutiE's ~·,mnedcd with f<'<'"· tim's, t01mage taxi's, rd l•l·!·:, •'t':. originnting under snch lfnv;:.
STEAMBOAT INRFEfTJO:'~ SERVICE (iBUJh-;i:: UHLLH, Supfrvi.--1.ug fn.,rH·<·tvr (~t 1 H! rn.:
:;tq>-f j·ru .. rf?·{,n~
'rhe iti.~;{J('('tif!!! r Vt·~.~~p~~, 1 n(; h<·P~JHill~ uf the Of!!C~!r~ df V~.:-t~ sel~, 8lni thC adnJi:Ji:-.tr:~t!(JJI nf l<H\'N f('iHting tq !'t!i'lt ~·c~i:-:Ct:.1 !}.;1d thejr oflic•ers. 'The t·er-tiii{•atiOtl of nhie ::-t·aaH.:n ,~~ho [,Aru the crC\YA • . .)f n1erchnot Y~'.~P~'1~.
The ir,,.,pectiun (Jf \'£'>'!'..!!', includii</l the 1ypes of t.,;i:r;r~: 1be te5tinu: of all !!Uiterials snb~<·ct to 1\·n~:lt' si.r:\in in ma.r nc l•uiler:;· the in:~pt''?tion of bull:: und of lifo-H~,ving ('quipwent.