survey of providers of outdoor recreation conducted in support of the development of the
TRANSCRIPT

SURVEY OF PROVIDERS OF OUTDOOR RECREATION CONDUCTED IN SUPPORT OF THE DEVELOPMENT
OF THE WASHINGTON STATE COMPREHENSIVE OUTDOOR RECREATION PLAN
Conducted for the Washington Recreation and Conservation Office
by Responsive Management
2012

SURVEY OF PROVIDERS OF OUTDOOR RECREATION CONDUCTED IN SUPPORT OF THE DEVELOPMENT
OF THE WASHINGTON STATE COMPREHENSIVE OUTDOOR RECREATION PLAN
2012
Responsive Management National Office Mark Damian Duda, Executive Director
Martin Jones, Senior Research Associate Tom Beppler, Research Associate
Steven J. Bissell, Ph.D., Qualitative Research Associate Andrea Criscione, Research Associate Patrick Doherty, Research Associate Amanda Ritchie, Research Associate
Carol L. Schilli, Senior Statistician Tim Winegord, Survey Center Manager
Alison Lanier, Business Manager
130 Franklin Street Harrisonburg, VA 22801
Phone: 540/432-1888 Fax: 540/432-1892 E-mail: [email protected]
www.responsivemanagement.com

Acknowledgments
Responsive Management would like to thank all of the providers who took the time to complete
the survey and give their input.


Results of Provider Survey in Support of the Washington SCORP i
TABLE OF CONTENTS Introduction and Methodology ........................................................................................................1
Use of the Web for the Survey ................................................................................................1
Questionnaire Design ..............................................................................................................1
Survey Sample .........................................................................................................................1
Survey Facilities ......................................................................................................................2
Survey Dates and Times ..........................................................................................................2
Data Analysis ...........................................................................................................................3
Additional Information About the Presentation of Results in the Report ...............................4
Major Issues and Obstacles ..............................................................................................................5
Funding ..........................................................................................................................................63
Use Conflicts, and Pressures on Recreation Land for Other Uses .................................................65
Recreation Infrastructure and Demand Met, Goals and Goals Met ...............................................76
Satisfaction of Residents and Users of Recreation Services ........................................................129
Other Outdoor Recreation Issues .................................................................................................131
Proximity to Parks and Trails, and Access to Recreation Areas .........................................131
Sustainability .......................................................................................................................133
Active and Passive Forms of Recreation .............................................................................140
Conservation Projects and Access .......................................................................................141
Habitat Types and Recreation .............................................................................................143
GIS .......................................................................................................................................155
Data on the Agencies and Organizations in the Sample ..............................................................157
Existence of Outdoor Recreation Plans .......................................................................................163
About Responsive Management ..................................................................................................164


Results of Provider Survey in Support of the Washington SCORP 1
INTRODUCTION AND METHODOLOGY This study was conducted for the Washington Recreation and Conservation Office (RCO) to help
assess issues pertaining to providing outdoor recreation in the State of Washington. This study is
a component of the overall research being conducted in support of the Washington State
Comprehensive Outdoor Recreation Plan (SCORP). Specifically, this report presents the results
of two separate web-based surveys of providers of outdoor recreation in Washington State: a
survey of local recreation providers and a survey of federal and state government providers,
tribal organizations, and nonprofit organizations (the latter survey for those working statewide
or, at least, regionally, rather than strictly local). The purpose of the surveys of recreation
providers is to provide detailed information on supply, capacity, and the demand met, as well as
information about needs and challenges in providing outdoor recreation. Specific aspects of the
survey methodology are discussed below.
USE OF THE WEB FOR THE SURVEY To reach providers of outdoor recreation, a web-based survey was selected as the preferred
sampling medium. Appropriately designed web-based surveys are methods of public opinion
polling where a known group of potential respondents are invited to participate in completing a
web-based survey, and their responses are submitted electronically by means of the Internet.
Web-based surveys are an excellent survey method to use when the sample consists of known
respondents with Web access, as is the case in these surveys of recreation providers. In the
sample for this survey, all potential respondents had guaranteed Internet access through their
workplace. In addition, web-based surveys allow the respondent to complete the survey at a time
(and often, place) most convenient to him or her.
QUESTIONNAIRE DESIGN The provider survey questionnaires were developed cooperatively by Responsive Management
and the RCO. Responsive Management conducted pre-tests of the questionnaires to ensure
proper wording, flow, and logic.
SURVEY SAMPLE The sample of providers of outdoor recreation in Washington State was obtained through
cooperation with the RCO; additional research was conducted by Responsive Management to
supplement the sample provided by the RCO. The sample consisted of the following:
o Park department directors and other administrative personnel (those with project
management or park management responsibilities).
o Directors and project managers of districts, such as public utility districts or irrigation
districts.
o State and Federal agency personnel (those with project management, park management,
or administrative responsibilities).
o Tribal representatives.
o Not-for-profit organization administrators (not-for-profits concerned with outdoor
recreation and natural resources).

2 Responsive Management
SURVEY FACILITIES A central polling and data collection site at the Responsive Management office allowed for
rigorous quality control over the surveys and data collection. Responsive Management
maintains its own in-house surveying facilities.
SURVEY DATES AND TIMES An advantage of a web-based survey is that respondents can complete the survey at a time most
convenient to them. Nonetheless, staff members from Responsive Management were on call
during the day, and via return email or telephone call (if a question arose during the evening or
night), to assist respondents with any problems or questions they had with the survey.
To ensure a good response rate, Responsive Management used a multiple-contact strategy to
conduct the web-based surveys. Responsive Management sent an initial email invitation to
potential respondents to inform them of the survey and to encourage their participation. The
invitation included information about the survey and an Internet link to the survey site. Shortly
after distributing the initial email, a trained, professional interviewer contacted each respondent
to confirm that he or she received the email and to encourage completion of the survey. The
interviewer also maintained a log of contacts, which was updated daily with new information to
ensure that the appropriate individuals were being re-contacted to complete the survey.
After two weeks, Responsive Management sent a second invitational email to all those who had
not yet completed the survey to serve as a reminder and encourage their participation. The
second email message was personalized (i.e., sent to specific, named people), and it provided an
invitation to participate and the Internet link to the survey. In the week following the second
email, a professional interviewer contacted each person who received the second email,
confirmed receipt of the email, and encouraged them to complete the survey. Additionally in the
second email, a specific deadline was given for survey completion, and the reminder highlighted
the timeliness and importance of responding before the deadline. The contact log was updated
after this second round of emails and reminder calls to track non-respondents to be targeted for
further outreach. Finally, a third email was sent to all non-respondents as a final reminder to
complete the survey, followed by a personal telephone call by a professional interviewer.
Throughout the project, survey responses and contacts with respondents were recorded in the
contact log to ensure that all non-respondents received several notifications and personal
telephone calls to encourage survey completion.
After the surveys were obtained, the Survey Center Managers and/or statisticians checked each
completed survey to ensure clarity and completeness. The Local Provider Survey was conducted
from July to October 2012. The Federal/State/Not-for-Profit Survey was conducted from August
to October 2012. In total, Responsive Management obtained 213 completed questionnaires from
providers, broken down as follows: 85 local providers and 128 state/federal/not-for-profit
providers.

Results of Provider Survey in Support of the Washington SCORP 3
DATA ANALYSIS The analysis of data was performed using Statistical Package for the Social Sciences as well as
proprietary software developed by Responsive Management. Part of the analysis included a
breakdown of the data into ten regions in Washington (see map that follows).
Note: Map was produced in color; may not be legible in black and white.
The Islands: Island and San Juan Counties
Peninsulas: Clallam, Jefferson, Kitsap, and Mason Counties
The Coast: Grays Harbor, Pacific, and Wahkiakum Counties
North Cascades: Chelan, Kittitas, Okanogan, Skagit, Snohomish, and Whatcom Counties
Seattle-King: King County (including the City of Seattle)
Southwest: Clark, Cowlitz, Klickitat, Lewis, Pierce, Skamania, and Thurston Counties
Northeast: Ferry, Pend Oreille, Spokane, and Stevens Counties
Columbia Plateau: Adams, Douglas, Grant, and Lincoln Counties
South Central: Benton, Franklin, Walla Walla, and Yakima Counties
The Palouse: Asotin, Columbia, Garfield, and Whitman Counties

4 Responsive Management
ADDITIONAL INFORMATION ABOUT THE PRESENTATION OF RESULTS IN THE REPORT In examining the results, it is important to be aware that the questionnaire included several types
of questions:
Open-ended questions are those in which no answer set is provided to the respondents;
rather, they can respond with anything that comes to mind from the question.
Closed-ended questions have an answer set from which to choose.
Single or multiple response questions: Some questions allow only a single response,
while other questions allow respondents to give more than one response or choose all that
apply.
Scaled questions: Many closed-ended questions (but not all) are in a scale, such as
excellent-good-fair-poor.
Series questions: Many questions are part of a series, and the results are primarily
intended to be examined relative to the other questions in that series (although results of
the questions individually can also be valuable). Typically, results of all questions in a
series are shown together.
Some graphs and tabulations show an average, either the mean or median (or both). The mean is
simply the sum of all numbers divided by the number of respondents. Because outliers
(extremely high or low numbers relative to most of the other responses) may skew the mean, the
median may be shown. The median is the number at which half the sample is above and the
other half is below. In other words, a median of 30 days means that half the sample gave an
answer of more than 30 days and the other half gave an answer of less than 30 days.
Results of Provider Survey in Support of the Washington SCORP 5
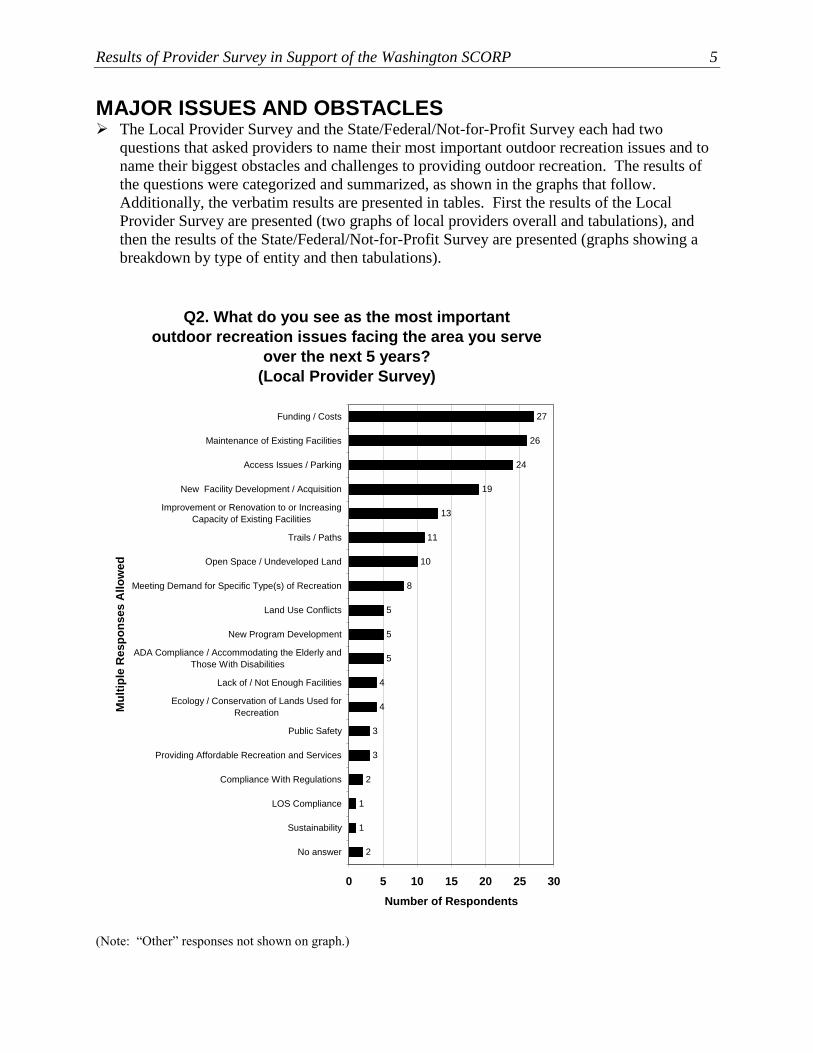
MAJOR ISSUES AND OBSTACLES The Local Provider Survey and the State/Federal/Not-for-Profit Survey each had two
questions that asked providers to name their most important outdoor recreation issues and to
name their biggest obstacles and challenges to providing outdoor recreation. The results of
the questions were categorized and summarized, as shown in the graphs that follow.
Additionally, the verbatim results are presented in tables. First the results of the Local
Provider Survey are presented (two graphs of local providers overall and tabulations), and
then the results of the State/Federal/Not-for-Profit Survey are presented (graphs showing a
breakdown by type of entity and then tabulations).
Q2. What do you see as the most important
outdoor recreation issues facing the area you serve
over the next 5 years?
(Local Provider Survey)
27
26
24
19
13
11
10
8
5
5
5
4
4
3
3
2
1
1
2
0 5 10 15 20 25 30
Funding / Costs
Maintenance of Existing Facilities
Access Issues / Parking
New Facility Development / Acquisition
Improvement or Renovation to or Increasing
Capacity of Existing Facilities
Trails / Paths
Open Space / Undeveloped Land
Meeting Demand for Specific Type(s) of Recreation
Land Use Conflicts
New Program Development
ADA Compliance / Accommodating the Elderly and
Those With Disabilities
Lack of / Not Enough Facilities
Ecology / Conservation of Lands Used for
Recreation
Public Safety
Providing Affordable Recreation and Services
Compliance With Regulations
LOS Compliance
Sustainability
No answer
Mu
ltip
le R
esp
on
ses A
llo
wed
Number of Respondents
(Note: “Other” responses not shown on graph.)

6 Responsive Management
Q3. What do you see as the greatest challenges or
obstacles to providing outdoor recreation in the
area you serve over the next 5 years?
(Local Provider Survey)
67
23
10
9
6
4
3
2
2
2
2
2
0 10 20 30 40 50 60 70 80
Funding / Costs
Maintenance of Existing Facilities
Compliance With Regulations
New Facility Development / Acquisition
Access Issues / Parking
Land Use Conflicts
Improvement or Renovation to or Increasing
Capacity of Existing Facilities
Lack of / Not Enough Facilities
Open Space / Undeveloped Land
Ecology / Conservation of Lands Used for
Recreation
Providing Affordable Recreation and Services
No answer
Mu
ltip
le R
esp
on
ses A
llo
wed
Number of Respondents
(Note: “Other” responses not shown on graph.)

Results of Provider Survey in Support of the Washington SCORP 7
Q2. What do you see as the most important outdoor recreation issues facing the area you
serve over the next 5 years? (Local Provider Survey)
Region Issue T
he
Isla
nds
Providing and maintaining quality facilities.
Paying for the facilities we already have in place.
The potential for reductions in funding allocated for parks and recreation operations
and maintenance at the Washington State and Island County levels is significant
enough that special actions by other parks stakeholders, including the South Whidbey
Parks & Recreation District, may be necessary to maintain public access to facilities
within district boundaries currently operated by these and other entities. A year-end
2011 Washington State Parks “Bridging the Gap” presentation documents this
possibility in outlining a plan to deal with a sizeable budget shortfall resulting from the
unprecedented financial crisis at the state level. One major element of that state parks
plan is the immediate creation of a “Partnership Unit.” The State Parks Plan indicates
that the agency needs to immediately begin building viable volunteer Friends Groups
and Cooperating Associations that can assist with keeping parks open and in a
condition that the public will choose to use them. The District’s role as key stakeholder
in any local, regional, or state-level initiative to maintain public access to these
facilities has the potential to place significant pressure on the Parks District budget.
Outdoor recreation space development vs. conservation/preservation of lands.
Pen
insu
las
Citizens here have really prioritized trail development and water access. We just did an
outreach survey for our park plan update, and those were the two top items.
Mason County is a small rural/residential community. I see funding as the main issue
for this area.
Lack of multi-use, all-weather facilities.
Public access to shorelines and support of recreational fishing and motorized/non-
motorized recreational boating.
Increasingly strict regulations on maintenance and construction of waterfront facilities.
It has taken us eight months to get a permit to replace a 20x60 ft. float in the same
footprint with upgraded construction (fish-friendly) that was damaged during a wind
storm. And the cost involved.
Funding availability for marinas that provide recreational use and public access.
The ability to continue providing parks for people to enjoy. Our county, like so many
others, is feeling the impacts of reduced funding. Being a “non-mandated” department
places us in a position to be one of the first to be eliminated and/or closed down as the
situation dictates.
Providing adequate neighborhood park space and water access.
Water access and storage for non-motorized watercraft (kayaks, rowing shells,
rowboats, etc.). Maintenance and repair/replacement of existing boating facilities (pier,
dock, boat launch, dredging, etc.).
Continued use of our boat launch and marina facility.
Adequately taking care of what we own so that parks are kept open and maintained for
the public.
1) Providing a backlog of needed capital projects; 2) Creating and then implementing
Forest Management Plans for the thousands of acres of open space lands.

8 Responsive Management
Q2. What do you see as the most important outdoor recreation issues facing the area you
serve over the next 5 years? (Local Provider Survey) (continued)
Region Issue T
he
Coas
t
We need better facilities for supporting water recreation.
Waterfront access; maintenance of existing facilities; and improvements/renovations of
facilities.
Transient boats visiting our marina. Dredging issues and areas of shoaling make it
harder and harder for boats to visit our marina.
Finding the money to pay for maintenance.
Access to Willapa Bay, picnic facilities, and trails.
Nort
h C
asca
des
Water access, trails, snowmobiling.
Trail improvements—more walking/hiking trails, more biking trails, and ice
skating/hockey.
Management of passive recreation land, undeveloped land. Working near critical areas,
wetlands, and streams while still providing public access. Deterring homeless camps in
natural areas.
Safe bicycle and pedestrian paths.
Financial viability for departments to adequately serve their constituents. Value of
parks recognized for the importance in providing mental and physical well-being.
Maintenance dredging at our marina and keeping the marina full of boaters.
Providing access for boats 32 feet and under. Many marinas are redesigning their
moorage to accommodate larger boats because there is high vacancy of moorage slips
in the smaller boat categories; therefore, marina’s revenues have declined, making it
difficult to cover expenses. More and more small boats are being stored on trailers or
in dry storage facilities because of the inability of small boat owners to afford keeping a
moorage slip on a year-round basis.
Limited or declining availability of funding for operations, maintenance, and recreation
services. Aging infrastructure and demand for new programs, facilities, and services.
We have a very strong public support base for our park systems. The issue is bringing
elected officials to that same level of public support.
Public access to the waterfront. Connectivity and maintenance of non-motorized trails
and paths.
Providing additional RV camping spaces for the significant number of fishing boats and
tow vehicles. We currently have 23 full hook-up spaces and 8 overflow spaces
available. During July and August, we had an average of 220 boats per day being
launched from the public launch. Those people only had empty dirt lots to park/camp
in.
Open space needs, field space, overcrowding of existing facilities.
Lack of funding.
Maintenance of green space where the field surface needs to be completely re-done,
and keeping the blackberries from encroaching on the playing surface and the nearby
skateboard park. Trails need to be restored and maintained.
Increasing capacity of existing facilities to meet increased demand for use, maintaining
and restoring natural and cultural resources on parklands, and maintaining an aging
infrastructure.

Results of Provider Survey in Support of the Washington SCORP 9
Q2. What do you see as the most important outdoor recreation issues facing the area you
serve over the next 5 years? (Local Provider Survey) (continued)
Region Issue
No
rth
Cas
cad
es
(co
nt.
)
New park and trail development, deferred maintenance of existing parks/trails, meeting
LOS and ADA compliance.
Acquisition of open space, comprehensive trails, and habitat restoration and protection.
Providing quality parks and recreation with reduced budgets and staffing.
Walking trails, water access, and a trail along water.
Sea
ttle
-Kin
g
Competing interests and the importance of continuing to support parks and recreation
with limited resources.
The ability to optimally maintain and care for our assets (parks and facilities) during
challenging budget times when local budgets have been reduced significantly; hence,
hammering our ability to keep up with maintenance and service levels. Another related
issue is the need for more grant dollars to help with renovating and preserving existing
public assets. While acquisition is still important, major urban cities such as Seattle are
having a harder time protecting and preserving our recreation assets. More grant
funding for WWRPs [Washington Wildlife and Recreation Programs]. Development of
local parks would be helpful to tackle these concerns.
Affordable marina space, particularly for large boats, and guest moorage. Saltwater
waterfront access, including boat launch facilities, parks/picnic areas, and shoreline
access.
Funding.
Preservation of open space within or adjacent to urban growth areas. Preservation and
development of regional trails—particularly rail-banked corridors. Encouraging
ethnically diverse populations to take advantage of outdoor recreation opportunities.
Funding for operations, maintenance, and improvements.
Preservation of open space; mitigation of natural hazards so that recreation areas are
safer; resolving conflicts among incompatible users and providing separate
areas/facilities for incompatible uses.
Buying land and developing new neighborhood parks, community parks, and trails to
keep up with the rapid growth in the new and growing suburbs.
Maintaining what we have.
Developing parks to meet the needs of our citizens.
Changes in the public use and preferences for their outdoor recreational experiences.
More elderly users and more demand for active opportunities like hiking and bicycling.
Meeting the need for a spray park, community garden, skate park, free-ride bike park.
Keeping up with maintenance and operations of existing facilities.
Scheduling use of field time so as not to compromise turf integrity balanced with
declining levy income.

10 Responsive Management
Q2. What do you see as the most important outdoor recreation issues facing the area you
serve over the next 5 years? (Local Provider Survey) (continued)
Region Issue S
outh
wes
t
Satisfying the City of Tacoma.
Projects to provide access to recreational areas, like the Pioneer Street Railroad
Overpass, the bridge over Lake River to the RNWR [Ridgefield National Wildlife
Refuge] River S Unit, and the water trail.
Construction of short-term and long-term moorage and associated services (e.g.,
commercial vessel dock, pump-out station, upland services, fuel dock), improved
parking and access to existing parks, and improved conveniences (e.g., ADA-compliant
restroom facilities, showers, drinking fountains).
Maintenance and operations funding; expansion of existing trail systems to meet public
need; enhancing bike/pedestrian mobility; and increasing accessibility.
Development of youth athletic fields; renovation of boat launching facilities; renovation
of playground equipment; bicycle paths, routes, and signage.
Replacing/maintaining existing dock facilities that have exceeded their lifespan.
Having sufficient parking available to marina tenants and transient boaters.
Compliance with the ever-changing regulations of state and federal agencies.
The decline of the city’s general fund (property and sales taxes) that pays for operations
and maintenance expenses of parks, facilities, and recreation programs.
1. Economic recovery has been slow, and it appears that further reduction in city
services will be necessary. 2. Obesity is an important issue (referred to often as a
national crisis), and outdoor recreation providers are being asked to do more (programs
and outdoor facilities). 3. Parking stalls and the demand for additional parking eats up
green, outdoor recreation space. 4. Vandalism, misuse, dog waste, etc., consume
resources that would be better used elsewhere, and it continues to escalate each year.
5. Union opposition to volunteer projects.
Budgets: Most all recreational development and maintenance take funding, and, given
the current state of the economy, it is harder and harder to dedicate funding to new
recreational opportunities. Basically make it the priority during budget cuts so we can
maintain what we already have.
Providing public access to natural areas while protecting sensitive habitat and
environmental resources.
Trying to satisfy a diverse community and their recreational needs and being able to
have a unified focus for the agency.
Providing access to and maintaining park and open space areas.
The development of sports fields to serve the youth and adult population of the
Puyallup area. Also the need for additional community parks and neighborhood parks
in identified locations of the city. The addition of special services such as spray pools,
dog parks, and playgrounds are issues as well.
Lack of regional facilities to provide adequate level of service for the county
population.

Results of Provider Survey in Support of the Washington SCORP 11
Q2. What do you see as the most important outdoor recreation issues facing the area you
serve over the next 5 years? (Local Provider Survey) (continued)
Region Issue N
ort
hea
st
User access rises to the top. There are several public lands within a 15-30 minute drive
from our community, yet few have adequate parking or are even recognizably marked
as public lands. There are incredible outdoor recreation opportunities close by, but
people first need to know that they are available and accessible, and then, once the
people know the opportunities are there, the people need to be welcomed by
appropriate signage that identifies boundaries, rules regarding use, safety precautions,
etc.
Accommodation of a healthy aging population with recreational opportunities. Older
recreation facilities. Reduction in operating funding.
Management of OHVs. The widening division between motorized and non-motorized
users. Similarly, the large split between those users desiring additional wilderness
acres and those desiring no additional acres. Just a couple of these polarizing issues are
making it difficult to move forward on numerous recreational planning projects.
Adequate funding for care and maintenance of existing parks and recreation facilities.
Improvement of access (parking, trailheads, etc.) to newly acquired natural areas and
open space to meet rising demand for hiking trails and passive recreational experiences
in Spokane County.
Colu
mbia
Pla
teau
Funding.
Gas prices.
Not enough outdoor facilities.
Access to Wells Reservoir for a growing recreational fishery. Maintenance of existing
facilities. Water trail facility development in the mid-Columbia River. Trail
development in populated areas.
South
Cen
tral
Providing facilities for the members of our community and surrounding area to
participate in programs and activities.
Development of, access to, and maintenance of recreation facilities near and on the
Columbia River to benefit a growing population.
Continuing to provide quality programs that are sustainable while still being affordable
to the public.
State and federal funding cutbacks for parks and recreation areas, which could close
parks or leave the parks short-staffed.
People recreating closer to home due to the economy and fuel prices. Lack of outdoor
recreation facilities due to state parks’ and local parks’ closures. Higher outdoor
recreation demand due to baby boomers retiring.
The
Pal
ouse
The ability for parks to remain open due to lack of funding.
Access.
Completion and opening of a dog park. Development of land that was donated for two
parks. Development of outdoor spray park.

12 Responsive Management
Q3. What do you see as the greatest challenges or obstacles to providing outdoor recreation
in the area you serve over the next 5 years? (Local Provider Survey)
Region Challenge or Obstacle T
he
Isla
nds
Funding for ongoing maintenance and capital improvements. If we can’t afford the facilities we have in place, how will we afford creating new facilities? Finding public support for increased parks funding and funding required to support new properties transferred to this district from other entities. It is unlikely the public tax burden levied by those other entities will be reduced when facilities are surplused, so local district citizens will see overall tax rates increase to keep those surplus facilities open, if they are picked up by the district to be kept open. Outdoor recreation land(s) development vs. conservation/preservation of land(s).
Pen
insu
las
Sustainable funding for maintenance and operations of our parks and facilities.
As stated above, funding will be the biggest challenge.
Lack of a reliable funding source.
Ownership/control of shorelines and funding to meet recreational needs while meeting
environmental concerns in support of a healthy Puget Sound aquatic environment.
Acquiring permits and funding for much-needed upgrades at our marina.
Funding.
Available funding.
Planning, permitting, financing, construction. Limited parking will be a continuing
issue. New comprehensive planning will be initiated and completed.
Shoaling of the area around our boat launch and marina facility.
Funding and staff for maintaining the parks as they should be.
Budget. Most park staff are on part-time status due to reduced funding.
The
Coas
t
Limited local funding and difficult permit requirements for water-oriented projects. Funding for regular maintenance and improvements. Getting the monies and permits to have the dredging completed. Local tax base and the growing percentage of the general fund that goes towards police and fire. Permitting, funding.
Nort
h C
asca
des
Availability of monies.
Funding.
Funding.
Financial constraints; 1% cap limits on taxes reducing budgets by the rate of inflation.
Maintenance dredging at our marina and keeping the marina full of boaters.
Lack of funding.
Bringing back the staff we have lost due to the economic downturn.
Topography (much of Chelan County is mountainous, except river bottoms where most
people live and work). Federal land ownership (85% of Chelan County is under U.S.
Forest Service management).
Limited financial resources. Inability of many public agencies to maintain and/or
rebuild existing facilities to accommodate users.
Availability of funding.
Funding opportunities. Available space. Land use conflicts.

Results of Provider Survey in Support of the Washington SCORP 13
Q3. What do you see as the greatest challenges or obstacles to providing outdoor recreation
in the area you serve over the next 5 years? (Local Provider Survey) (continued)
Region Challenge or Obstacle N
ort
h C
asca
des
(co
nti
nu
ed)
With budget cuts and reduced revenues along with building costs for an expanded RV
park, money is the biggest issue.
Available space to be developed, budget dollars for maintenance and development.
Lack of funding and volunteers. Volunteers have expended many hours taking out
blackberries and other encroaching vegetation, and have also donated a significant
amount of machinery and materials to completely re-grade and surface the parking
area. Volunteer fatigue is resulting in the re-growth of the encroaching vegetation and
lack of funds has resulted in an abandonment of all objectives to restore the playing
surface to a safe level (there are sinkholes in the field making it dangerous to run or
play), or to pursue any new objectives to add outdoor recreational areas (currently
considering a Frisbee golf course, picnic areas, outdoor stage).
Maintaining adequate funding and staffing levels for maintenance and operations.
Available funding.
Funding at local, state, and federal levels.
Meeting the needs of both urban and rural areas in the county.
Property access; money for construction.
Sea
ttle
-Kin
g
Resources, maintenance, competing interests, funding.
Lack of local funding. More grants to support and complement current local resources
would be helpful. Looking at a less than 50% local match requirement may also be
helpful.
Funding for the above recreation issues.
Funding. More specifically the state’s archaic property tax system.
Lack of funding.
Providing shoreline public access due to high cost of land and redevelopment
pressures. Outdoor recreation preferences, particularly for outdoor sports, are
becoming more diverse and increasingly offered year-round, resulting in higher levels
of demands for existing fields. Providing accessible facilities/trails for individuals of
all ages with health and mobility challenges.
Insufficient facilities to accommodate some popular activities; insufficient open space
on our small island for some activities such as mountain and dirt biking that need vast
open space that others do not want to remain pristine; conflicting goals among
stakeholders and users. Keeping illegal drug/alcohol activity (and its tentacles) out of
parks.
Funding for staff, acquisition, development, and maintenance.
Securing funding for maintenance of facilities we currently manage.
Funding for acquisition and development of park land.
The funding to keep up with current usage and facility conditions, not to mention
catching up on maintenance deferred already due to budget constraints.
Lack of matching funds for grants, no funding for operations and maintenance
demands.
Declining levy income to maintain, upgrade, and complete construction of new fields
when staff cuts are pending.

14 Responsive Management
Q3. What do you see as the greatest challenges or obstacles to providing outdoor recreation
in the area you serve over the next 5 years? (Local Provider Survey) (continued) S
outh
wes
t Creating shoreline access while avoiding conflict with industrial uses.
Obtaining funding for the above projects. Funding. Moorage is commonly a break-even prospect (over the long term) at best. Parks are a cost center that must be funded through other revenues that are already being squeezed. Insufficient staffing and resources. Limited and dwindling local funding. Providing adequate parking for the marina. It’s all about need and meeting people’s expectations for recreation services. As the baby boomers continue to retire, there is an expectation that low-cost recreation opportunities will be available. Unfortunately, the declining economy and tax base make it difficult to provide parks and recreation services when competing for funding for other municipal services such as fire, police, and utilities. Securing funds to provide even minimal development of land for which we have had master plans for several years is an obstacle. The second obstacle is being able to maintain any new parks developed at an acceptable standard. Public demand exceeds true need, in my opinion, but we aren’t meeting true need. Budgeting and permitting. Adequate funding of maintenance requirements. Operational funding to support program delivery and facility maintenance. Funding and lack of awareness of importance of open space as a core need/service in a community. Finding funding to provide these additional parks and facilities in a time of shrinking public funds, and balancing funds with other city service needs. Lack of capital funding sources to acquire recreation lands and build recreation facilities.
Nort
hea
st
1. Costs: With the state now charging for access to state parks, there is a fear that
fewer people will have the means to visit. Also, there is a fear that many people will
look to local parks, where they do not have to pay, as opposed to venturing into the
outdoors. Also, there are quite a few people who do not realize the amount of available
low-cost outdoor recreation. They look to rock climbing, skiing, or river rafting, see all
the high costs, and totally forget about hiking, mountain biking, geocaching,
snowshoeing, etc. Education about low-cost outdoor recreation activities could be
helpful.
2. Education: Most people do not know how to get started or where to go when it
comes to outdoor recreation. We need to educate people on what they can do and how
to do it. Historically, our physical education classes teach about sports, physical
activities, and recreation, but few have focused on outdoor recreation.
Reduction in maintenance and replacement funding.
Funding shortages on all aspects of recreation management: trail and campground
maintenance and operations, winter trail grooming (ski and snowmobile), and
compliance patrols for OHV management. Without adequate funding, trails and
recreation sites may need to be closed for public safety. A shortage of compliance
patrols may result in excessive illegal OHV use. This type of use may lead to decisions
to close motorized recreation opportunities in order to protect resource values.
Limited funding due to budget constraints at all levels of local government.

Results of Provider Survey in Support of the Washington SCORP 15
Q3. What do you see as the greatest challenges or obstacles to providing outdoor recreation
in the area you serve over the next 5 years? (Local Provider Survey) (continued)
Region Challenge or Obstacle
Colu
mbia
Pla
teau
Ecology.
Upkeep on the parks with a limited budget.
Economic uncertainty.
Costs and constraints associated with environmental permitting and mitigation for
public facilities in the shoreline environment. This includes permitting for new
facilities as well as maintenance activities at existing facilities.
South
Cen
tral
Lack of facilities.
U.S. Army Corps of Engineers regulations relating to development, management, and
maintenance of leased recreational property as well as NOAA, NMF, Ecology, FWS,
and other regulatory agency rules relating to operation, maintenance, and development
of recreational facilities on the Columbia, Snake, and Yakima rivers. Access to grants
and other funding to support maintenance of existing and development of new
recreational facilities for a rapidly expanding population.
In this time of reduced budgets, maintaining what we have is crucial. Our parks are
being used very heavily, and we are constantly finding ways of doing more with less.
We have fewer employees doing more work with less money on old equipment. In the
meantime, our population has been consistently growing, which further puts strain on
the facilities. There is a push to provide more park facilities, but the money to develop
and maintain them is difficult to come by.
The permitting process is very difficult. There is no checklist from the state or federal
level, and none of the government agencies know exactly what permits are needed and
from whom.
Lack of funding for outdoor recreation facilities and programs. Postponed maintenance
or outright closing of outdoor facilities due to lack of funding. Providing outdoor
recreation opportunities for a growing local/retirement population with limited
facilities and funding.
The
Pal
ouse
State budget and the lack of funding.
Funding for priorities.
Lack of dedicated funds.

16 Responsive Management
Q1. What do you see as the most important
outdoor recreation issues facing the area you serve
over the next 5 years? (Part 1)
(State/Federal/Not-for-Profit Survey)
5
10
10
13
15
13
25
20
53
14
14
0
43
0
29
29
43
43
9
0
18
0
0
0
0
0
64
0
0
23
8
0
15
15
8
46
8
8
0
0
23
23
8
23
54
17
0
0
9
4
13
9
4
74
0
0
0
0
25
25
0
50
50
0
33
0
0
11
11
44
11
11
0
0
0
25
25
25
0
25
25
0 20 40 60 80 100
Public access
Funding
Habitat health /
wildlife health
Acquisition of land /
building facilities
Maintenance /
existing infrastructure
Crowding /
dispersement of users
Use conflicts / activity
conflicts
Land preservation /
urban encroachment
Sustainability
Mu
ltip
le R
esp
on
ses A
llo
wed
Percent
Conservation or trust (n=40)
Land use and/or wildlifemanagement (n=7)
Misc. (n=11)
Nonprofit fishing / hunting /shooting (n=13)
Nonprofit general / otheractivity (n=13)
Nonprofit off-roading (n=23)
Nonprofit trails in general(n=8)
Parks (n=9)
Tribal (n=4)

Results of Provider Survey in Support of the Washington SCORP 17
Q1. What do you see as the most important
outdoor recreation issues facing the area you serve
over the next 5 years? (Part 2)
(State/Federal/Not-for-Profit Survey)
0
0
3
5
3
8
3
14
0
0
29
0
0
0
0
9
9
0
0
0
9
0
15
15
0
8
0
8
15
15
0
0
0
0
0
4
0
4
0
0
0
0
0
0
0
0
13
0
0
44
33
22
11
11
11
0
0
0
25
0
25
0
0
0 20 40 60 80 100
Communications to
visitors / outreach /
education
Encouraging people to
recreate outdoors
Building partnerships
Providing reasonably
priced recreation
Invasive species
Water pollution
Don't know / no answer
Mu
ltip
le R
esp
on
ses A
llo
wed
Percent
Conservation or trust (n=40)
Land use and/or wildlifemanagement (n=7)
Misc. (n=11)
Nonprofit fishing / hunting /shooting (n=13)
Nonprofit general / otheractivity (n=13)
Nonprofit off-roading (n=23)
Nonprofit trails in general(n=8)
Parks (n=9)
Tribal (n=4)
(Note: “Other” responses not shown on graph.)

18 Responsive Management
Q2. What do you see as the greatest challenges or
obstacles to providing outdoor recreation in the
area you serve over the next 5 years? (Part 1)
(State/Federal/Not-for-Profit Survey)
3
3
23
10
5
70
5
0
0
57
43
29
86
29
0
18
9
9
0
45
18
15
8
0
23
0
0
0
0
0
0
15
15
38
8
22
0
13
13
4
30
4
0
0
38
0
13
63
13
11
0
11
0
22
78
22
25
0
0
25
0
25
25
0 20 40 60 80 100
Funding
Public access
Maintenance of
existing facilities
Use conflicts
Increasing
recreational
opportunities /
increasing capacity /
crowding
Resource protection
Acquisition /
infrastructure
development
Mu
ltip
le R
esp
on
ses A
llo
wed
Percent
Conservation or trust(n=40)
Land use and/or wildlifemanagement (n=7)
Misc. (n=11)
Nonprofit fishing / hunting /shooting (n=13)
Nonprofit general / otheractivity (n=13)
Nonprofit off-roading(n=23)
Nonprofit trails in general(n=8)
Parks (n=9)
Tribal (n=4)

Results of Provider Survey in Support of the Washington SCORP 19
Q2. What do you see as the greatest challenges or
obstacles to providing outdoor recreation in the
area you serve over the next 5 years? (Part 2)
(State/Federal/Not-for-Profit Survey)
8
3
13
28
5
10
14
14
14
29
0
0
9
9
0
18
0
0
15
0
23
31
15
0
23
0
15
23
8
0
35
0
9
22
4
4
25
13
0
13
0
0
0
22
11
22
11
0
0
0
0
25
0
25
0 20 40 60 80 100
Getting and using
partnerships /
coordination with
other entities
Providing affordable
recreation
Outreach and
education
Staffing levels
Sustainable
recreation
No answer / don't
know
Mu
ltip
le R
esp
on
ses A
llo
wed
Percent
Conservation or trust (n=40)
Land use and/or wildlifemanagement (n=7)
Misc. (n=11)
Nonprofit fishing / hunting /shooting (n=13)
Nonprofit general / otheractivity (n=13)
Nonprofit off-roading (n=23)
Nonprofit trails in general (n=8)
Parks (n=9)
Tribal (n=4)
(Note: “Other” responses not shown on graph.)

20 Responsive Management
Q1. What do you see as the most important outdoor recreation issues facing the area you
serve over the next 5 years? (State/Federal/Not-for-Profit Survey)
Type of
Org. Issue
Conse
rvat
ion o
r T
rust
Public access to saltwater and freshwater shorelines; funding to manage and maintain
existing infrastructure (trails, structures, roads, etc); and funding to secure additional
land to make available for outdoor recreation.
Costs of management and maintenance balanced with the ability of the public to use
recreation areas. One critical component of management and maintenance that is
typically under recognized and vastly under funded is noxious weed control, which
impacts the ecosystems in the recreation areas. I recommend that volunteers
pull/mow/cut Scotch broom, herb Robert, tansy ragwort, European blackberry,
foxglove, English holly/laurel/ivy, butterfly bush, reed canary grass, and others as a
way to pay for their user fees.
In terms of the marine environment, access to the shoreline continues to be an
obstacle. In some areas, there are no public launch sites for miles, and beaches are
closed due to over protective landowners. As more and more people move to
Washington state, which unfortunately allows landowners to “own” and thus limit
access to beaches and tidelands, this will make work and recreation on the shoreline
more challenging.
Maintaining the boundaries between incompatible user groups.
Diminishing free access to private forest lands and need for dispersed recreation
around Mount Rainier National Park.
The ability of recreation-area managers (state and local governments, non-profits,
etc.) to maintain their existing facilities.
Operations and maintenance funds.
More people in the San Juans recreate at state-owned places such as parks and DNR
land than anywhere else, and maintenance of the existing trails and infrastructure is
probably the biggest issue due to reduced funding.
Bike and walking access, trail connectivity, protected outdoor space, forest
health/fuel load management, growth management, salmon recovery, water quality
and quantity, and rural community sustainability.
Parking is always the biggest concern for our organization. There is a very limited
number of restoration sites along the Cedar River that accommodate more than 30
vehicles.
Land use.
Meeting demand for outdoor recreation sites and facilities at a time when funding
sources are becoming harder to find. The population of the Puget Sound region
continues to grow, as does demand for multiple forms of outdoor recreation: hiking,
biking, kayaking, equestrian activities, mountain biking. Meeting the needs of these
many user groups in a sustainable fashion that does not detract or damage existing
natural areas will be a challenge in the next 5 years, especially with government
(federal, state, county, local) agencies facing significant budgetary challenges.

Results of Provider Survey in Support of the Washington SCORP 21
Q1. What do you see as the most important outdoor recreation issues facing the area you
serve over the next 5 years? (State/Federal/Not-for-Profit Survey) (continued)
Type of
Org. Issue
Conse
rvat
ion o
r T
rust
(co
nti
nued
)
The increase in population impacting recreation areas. Establishing new areas with
proactive management plans to protect resources, while allowing access.
Waterfront access is currently an issue and will probably be an even greater issue in
coming years.
ORV overuse of public and private land.
The Columbia River Gorge is loved, but is it on its way to being loved to death?
Trends show that the Portland-Vancouver metro area is set to double in size over the
next 50 years, and with that comes the need for more managed recreation. Recently,
public land managers are encountering user-made trails and access points to public
lands, causing problems in managing and protecting public land. We believe this is a
crucial time to rein in these behaviors by implementing managed corridors of
recreation to address needs.
Need for completion of planned trails and implementation of the Parks, Recreation,
and Open Space Plan.
1. Protection of remaining undeveloped shoreline for recreational access and habitat
protection. 2. Protection of wildlife networks and connecting corridors for people,
wildlife, and water resources before resurgent development pressure fragments
remaining natural areas too much.
Overuse and accompanying natural resource problems (noxious weeds, trail erosion,
soil and water degradation, etc.).
Water: access and clean.
Lack of access by most Americans and particularly young student-age citizens.
Public beach and dock access for all ages and abilities.
Developing appealing urban outdoor recreational opportunities to encourage density
in urban areas vs. sprawl and carving up the landscape into 5-acre tracts. We have
recognized this need and are starting to partner more with local municipalities.
There is also a need to develop more access to our river and shorelines.
Having a sensible raised boardwalk on an existing trail in the wetland/stream so
people will have safe and easy access to view wildlife and recreate in an urban
natural area.
We are literally “loving to death” our existing outdoor recreation facilities. The last
4 or 5 years, we have seen a dramatic increase in the number of people using our
pathways, parks, and playgrounds as the community is facing the shuttering of
public-maintained facilities and families are struggling to find inexpensive ways to
recreate and entertain. Obesity is on the rise, and families need a way to get out and
walk and bike that is close to home.
Restricted uses of public lands (Discover Pass, no overnight camping at U.S. Army
Corps of Engineers sites, etc.), overly conservative and confusing regulations
(primarily in regard to fishing and hunting), and limited accessibility and availability
of recreational opportunities in or near urban areas (easier to spend time on
Xbox/computer than visit a recreation site in the country).

22 Responsive Management
Q1. What do you see as the most important outdoor recreation issues facing the area you
serve over the next 5 years? (State/Federal/Not-for-Profit Survey) (continued)
Type of
Org. Issue
Conse
rvat
ion o
r T
rust
(co
nti
nued
)
Overuse and motorized vs. non-motorized recreation.
Providing outdoor recreation to the public while protecting wildlife habitat.
Invasive species, aquatic and terrestrial.
Adequate funding for land acquisition to meet the recreation needs of the growing
state population. Also, stewardship dollars are needed for the ongoing maintenance
of those assets.
Balancing access to state aquatic lands with habitat needs and recreational use.
Access to public lands is a big issue here locally, as well as recreation opportunities
such as bike paths and hiking opportunities for people of all abilities.
Access to water (the Nisqually) and trail systems that support a variety of uses.
Continuing to acquire and steward habitat-sensitive areas and working lands through
grant programs.
Continued unimpeded access by the public to wilderness areas, State Parks, and
National Forests.
As part of our mission to create great communities and conserve great lands, it’s
important to have outdoor recreation preserved both in our urban cores and in our
rural and wild lands.
Public access to shoreline and funding to keep State Parks open.
Cost of participation for parks departments, schools, etc. There are cutbacks in all of
these traditional routes to recreation and activity with no real replacements emerging.
Funding to maintain trails and other facilities as well as improving access and
opportunities to certain communities such as Cowlitz County.
Lan
d U
se a
nd/o
r W
ildli
fe M
anag
emen
t
The decrease in federal, state, and local funding is the greatest issue Reclamation
faces over the next 5 years. Funding is anticipated to be tightening, and, as a result,
we will be focusing on building and improving the relationships we have with our
federal and non-federal managing partners and, where possible, seeking new
partnerships to assist in providing quality recreation. Ninety-seven percent of
Reclamations recreation sites in Washington are managed by a federal or non-federal
managing partner. Without a federal or non-federal managing partner, Reclamation
lacks the authority to provide recreation facilities and is limited to installing only
basic minimum facilities, such as toilets, guardrails, and vehicle turnarounds. Being
able to enter into management agreements with other agencies allows the managing
partner to provide more than just the minimum basic facilities, such as electrical
hook-ups, water, showers, etc. Potential management partners are required to submit
detailed information regarding their ability to manage and provide long-term funding
for operating and maintenance activities for a recreation area prior to Reclamation
agreeing to a partnership. If a potential partner does not provide sufficient evidence
of its ability to provide funding to manage an area, Reclamation will not enter into a
management agreement with that entity, which takes away recreational opportunities
for the general public.

Results of Provider Survey in Support of the Washington SCORP 23
Q1. What do you see as the most important outdoor recreation issues facing the area you
serve over the next 5 years? (State/Federal/Not-for-Profit Survey) (continued)
Type of
Org. Issue
Lan
d U
se a
nd/o
r W
ildli
fe M
anag
emen
t (c
onti
nued
)
Funding.
Sustainable recreation: responding to changing demographics, evolving
expectations, increasing demand for access, and increasing value for landscape
settings in which our public lives, works, and plays. Specifically, an increased
visibility and importance of recreation; scenic and social resource components in
forest planning; connecting people with their natural and cultural settings; restoring
and adapting recreation settings; implementing sustainable operations; finding ways
to strengthen existing and new partnerships; and collaboration with other recreation
providers to provide sustainable experiences, benefits, and outcomes across the
larger landscape to communities and the general public.
Completing rails-to-trails sections. Maintaining and improving public access to
waterfronts and rivers. Removing vacant waterfront buildings and replacing with
parks.
Population growth and demand for outdoor recreation.
1) Providing access for motorized recreation at Juniper Dunes. 2) Increasing
popularity of public lands recreation and a population increase, leading to
competition amongst individual recreation activity users for limited lands and
capacity management problems. 3) Protecting natural and historical resources from
potentially impactive recreation such as off-highway vehicles and target shooting.
Funding, public safety, resource protection, risk management, population growth,
recreation planning, and an increasing demand for facilities that support newer, more
“extreme” sports and recreation activities.
Mis
cell
aneo
us
To be able to serve all of Chelan and Douglas Counties for the people that have
autism and autism-spectrum disorders.
Preservation of habitat and access.
Lack of recreation for youth.
Land closures.
Land closures.
Access to areas and closures of ORV opportunities.
Lack of access to public lands for multi-use activities, especially off-road
motorcycles.
Lack of access.
Preservation of lands for recreation.

24 Responsive Management
Q1. What do you see as the most important outdoor recreation issues facing the area you
serve over the next 5 years? (State/Federal/Not-for-Profit Survey) (continued)
Type of
Org. Issue
Not-
for-
Pro
fit
Fis
hin
g /
Hunti
ng /
Shooti
ng
Loss of accessible property for hunting. This includes private land being posted as
“No Hunting.”
Land access! Overharvest of Northwest fisheries and impacts from commercial
fishing.
Political agendas that are anti-shooting do not reflect the growth that Seattle Skeet &
Trap Club and the industry are experiencing. Well-managed facilities that are
accessible to the public are very important to help decrease unauthorized shooting on
public lands. Also, with very limited hunting opportunities in this state, it is
important to provide a service where sport shooters can at least enjoy simulated
hunting activities at a managed shooting facility.
Increasing population combined with greater urbanization of the region leading to
fewer people with a tradition of outdoor recreation. In our case, we face the concern
of many of our members being senior citizens with limited younger membership.
We are running ambitious youth programs, however, to try to counter this trend.
Two things: loss of habitat and crowding. 1. Loss of places to recreate outdoors
due to development. Two examples (of many) are bottomland development in the
Puyallup/Orting/Sumner Valley and the defunct Cascadia development above the
valley. Cascadia was an awesome mountain biking area, now destroyed. The
bottomland (farmland) destruction limits habitat for wildlife, deteriorates wildlife
numbers in semi-wild areas, and puts decent birding, hunting, and fishing areas that
much more out of reach geographically to the average person. 2. Western
Washington has high usage of wild areas due to the nearby population density, which
also diminishes the outdoor experience. I thought rifle season was crowded, went
bowhunting, and it’s still crowded out in the woods, within an hour’s drive of
Puyallup anyway. Not everyone can always afford a week-long birding, hiking, or
hunting trip to a remote part of the state.
Complying with environmental issues and requirements.
Getting new people involved, aging population is getting less active outdoors.
USFS/DNR road closures restricting access to public lands for hunting, etc. Cost of
running Washington Department of Fish & Wildlife. Cutting hunting seasons for all
the wrong reasons and increasing costs of tag/licenses with little or no benefit to the
wildlife or the sportsman. Urban growth into wild areas (although most is on private
property) still affects habitat.
Housing developments.
Higher fuel prices and the struggling economy seem to be the two factors that affect
our shooting sports the most.
Leasing property for a range.
Lack of available public land for the firearms sports. At Black Diamond [Gun Club],
due to the limited space and availability of ranges, we often have to shut down one
venue to support the activity in the other venue. Shotguns vs. rifle or rifle vs. pistol.
Just hearsay, but am hearing for instance that Cascade Rifle and Pistol [Club] has
capped their membership at 1,000 and that there is a 2-year waiting list to join.

Results of Provider Survey in Support of the Washington SCORP 25
Q1. What do you see as the most important outdoor recreation issues facing the area you
serve over the next 5 years? (State/Federal/Not-for-Profit Survey) (continued)
Type of
Org. Issue
Not-
for-
Pro
fit
Gen
eral
/ O
ther
Act
ivit
y
Access to trails and trailheads, particularly those farther away from large urban areas.
Maintenance of trails and campgrounds, especially with declining resources and
increased environmental protection processes.
River access and cleanliness. As the Columbia River is our primary recreation
source, it is imperative that we continue to maintain safe and reasonable access.
Additionally, limiting pollution of the river is a primary concern.
1. Underfunded, misused parks: In the absence of sufficient government funding,
more parks are naturally turning to “Friends of” groups of citizens for maintenance
and, increasingly, policy decisions about who can and cannot use the park. This shift
often results in public use restrictions that are based less on ecological science and
more on the idea that every park is a pristine wilderness area—separating audiences
of users from their parks just when more engagement is needed. 2. Indoor kids:
The next generation is growing up with less environmental immersion than ever
before, and they will vote on future park bonds. We need to experiment now with
diverse ways to help kids interact with their local parks in immersive, exciting ways
beyond the ballfields.
Increasing participation and organic growth, as well as increasing awareness for our
sport/activity.
Providing and maintaining quality facilities.
Finding safe areas to cross country ski and educating the other winter recreation
users to respect the ski trails and not walk on them.
More ballfields (baseball/soccer/softball). More trails for hiking.
Maintaining existing Washington State Park facilities and trails along the
Washington coast. Maintaining and expanding the Olympic Discovery Trail.
Loss of off-road motorcycling areas.
Cost of agency compliance for river facility improvements, i.e., access, docks, trails,
ramps, buildings, flood control, shoreline repair, etc.
Adding to the number of public access sites open to state waterways as well as
protecting those we already have in place. A complementary issue is
environmentally stewarding these sites and educating the users of these sites as well
as members of the public at large. These interconnecting issues will increase the
health of our human communities while limiting human impacts to shore lands and
waterways.
The need for more money for trails and off-road parks for people to have a place to
ride. More lands are needed, and it seems that there are fewer places to ride.
The sport of soccer is becoming increasingly popular, but there are not enough turf
fields to match the demand. There are pastures that serve as fields, but due to the
rainy weather, they are only able to be used a few months a year.

26 Responsive Management
Q1. What do you see as the most important outdoor recreation issues facing the area you
serve over the next 5 years? (State/Federal/Not-for-Profit Survey) (continued)
Type of
Org. Issue
Not-
for-
Pro
fit
Off
-Road
ing
Expansion. The area is vastly under-serving the motorized recreational public in
Southwest Washington. We have a very limited amount of ATV/dirt bike trails and
zero legal 4x4 opportunities on public land in Southwest Washington.
Grooming for the trails, SnoPark expansion, and road maintenance.
Access to the Okanogan National Forest.
Balancing the wants and needs of the individual or group with the need to protect our
environment.
Access and trail closures.
Lack of single-track trails to ride dirt bikes or any type of trail system or roads to
enjoy ORVs.
Coming up with a feasible, affordable, and sustainable trail management plan for
OHV use.
Education of proper OHV recreation to ensure sustained future use. All users
working together to maintain OHV recreation opportunities.
I am worried about the closure of four-wheeling trails. People like different kinds of
activities, whether it is four-wheeling, hiking, horseback riding, dirt biking, camping,
whitewater rafting, etc. Everyone deserves the right to use the land however fits
his/her desires.
Maintaining single-track trail access for motorized off-road vehicles.
Lack of designated Class II OHV areas with true Class II OHV trails that are
challenging, rewarding, and sustainable. While there are some, there are none in
Southwest Washington. Another issue is regaining the trust of OHV users after the
governor raided the OHV fund.
The lack of places for OHV enthusiasts to recreate. There are more and more users
competing for less and less space to legally ride. There is roughly 45% of the space
open for riding with roughly 55% more riders to fit in the same area, while non-
motorized users get more wilderness to recreate in.
Loss of access for ORV uses.
Closure or lack of open Forest Service roads.
The nonsensical expansion of “wilderness” areas for the purpose of excluding ORV
users, which is a legitimate outdoor recreation!
Public access to public lands.
Loss of public access for motorized off-highway use and discrimination against
motorized off-highway recreation.
Lack of access to trails for 4x4s. Lack of trails when compared to the number of
users in a fast-growing sport. Overuse of existing legal trails.
All terrain, utility vehicles, and dirt bikes.
Funding, so organizations such as ours can provide the needed services.

Results of Provider Survey in Support of the Washington SCORP 27
Q1. What do you see as the most important outdoor recreation issues facing the area you
serve over the next 5 years? (State/Federal/Not-for-Profit Survey) (continued)
Type of
Org. Issue
Not-
for-
Pro
fit
Off
-
Road
ing (
conti
nued
)
Less space and access allowed for usage.
The most important issue is multiple use recreation access to public lands. Roads
and trails need to remain open to motorized recreation. Many roads on the forest
need to be designated at dual-use roads so that the public can use ATVs. Some
forest roads need to be converted to ATV trails.
The amount of public land available for OHV recreation is continually decreasing.
This forces an increasing number of OHV users onto a limited number of areas,
causing overuse and irreversible damage to these public OHV lands.
Elimination of OHV recreational opportunities.
Not-
for-
Pro
fit
Tra
ils
in G
ener
al
Acquisition of land and water recreation properties.
Continued use of public lands on which our trails exist.
Lack of funding is probably the biggest issue facing recreation today. If it wasn’t for
the RTP [Recreational Trails Program] funding through the RCO, there would not be
much in the line of funding for recreation.
Funding the rising costs of keeping trails and other recreational facilities open and in
high quality without limiting access to low/medium income residents and visitors
because of prohibitively high trail pass or trailhead pass fees.
Lack of motorized recreation sites and trail mileage.
Not having enough places for the types of recreation required.
Keeping parks open due to funding decisions. Maintenance of the park systems.
1. Lack of funding for recreational opportunities and maintenance. 2. Need for
more hiking opportunities near urban areas. 3. Proliferation of passes and resulting
confusion.
Par
ks
Integrating interpretive messages into recreation by local repeat visitors. Noxious
weed and trash introduction at remote riverside site.
Increasing opportunities and awareness among the community and tourists.
Reasonably priced access and transportation options for getting to public lands for
the entire public. I see that, as an issue we’ve been ignoring, it will probably not bite
us in the next 5 years but will come to impact us a great deal if we don’t address it in
a meaningful way in the near future. Our current user base (at least for National
Parks) is overwhelmingly white, middle- to upper-class, and increasingly older.
When that population is gone, there will be fewer champions for public lands. If
people don’t recognize a personal need for public lands, they may not vote in a way
that allows for the continued protection of natural areas with opportunities for
outdoor recreation.
Increased emphasis on environmental education. Increased emphasis on partnerships
in accomplishing all our goals. Increased emphasis on broadening the diversity of
the natural and cultural history represented in the National Park System. Increase
emphasis on active recreational opportunities.

28 Responsive Management
Q1. What do you see as the most important outdoor recreation issues facing the area you
serve over the next 5 years? (State/Federal/Not-for-Profit Survey) (continued)
Type of
Org. Issue
Par
ks
(conti
nued
)
1. Development of management responses to manage impacts of climate change.
2. Lack of scientifically defensible metrics quantifying the public health benefits of
parks. 3. Engaging youth to create lifelong stewards of parks among all populations.
4. Development of a comprehensive park-wide transportation system that balances
public demand with resource protection.
Providing continued access to the public via safe and well-maintained facilities while
protecting the environment.
Providing recreational opportunities for the public at current or slightly reduced
levels.
Balancing recreational demand while continuing to protect the environment and
resources.
With the loss of state general funding for WA State Parks, the most important issue
is revenue funding for general operations, retaining and recruiting recreational and
maintenance staff, and capital funds for maintaining and repairing aged park
facilities in a safe and sustainable manner. Land acquisition and the protection of
environmentally, culturally, and historically significant properties are also priorities.
Tri
bal
Tribally created and managed opportunities.
Lack of funding to build and maintain parks. There is a need to provide services in
our area for more people turning to RV and trailer use.
Access and cost for tribal members. Tribal members should have access to areas to
gather resources. They should be able to access areas for free. They should be able
to access areas easily without having the Internet.
The increase in the numbers of youth in the tribe, requiring more recreation
opportunities for children, teens, and families.

Results of Provider Survey in Support of the Washington SCORP 29
Q2. What do you see as the greatest challenges or obstacles to providing outdoor recreation
in the area you serve over the next 5 years? (State/Federal/Not-for-Profit Survey)
Type of
Org. Challenge
Conse
rvat
ion o
r T
rust
As more and more people head outdoors to recreate, the challenge will be to provide
access while limiting impact. As more rural and shoreline parcels are sold and
developed, areas that were traditionally available for recreation will be impacted. In
addition, we need to keep identifying developed and denuded areas that can be
restored in order to ensure no net loss of ecosystem function, and indeed to make
gains in ecosystem function so all that is wild and wonderful in this region can be
preserved.
Providing access to private timberlands, dramatically increasing harvest rates on
those lands.
Unrestricted growth, reduced funding for conservation programs, water quantity
reduction, lack of prevention of wildfire, disconnectedness of habitat and
floodplains, lack of public education, and lack of support for rural communities.
We enhance the volunteer habitat restoration experience with educational talks and
tours, which we have found our volunteers love. However, available funding for
restoration work limits how well we can develop our education or how many groups
we can reach.
The lack of sustainable funding sources. Agency budgets are shrinking, and this has
a substantial effect on outdoor recreation facilities. Trails, trailheads, and other
facilities are not being cleaned or maintained. Law enforcement and safety patrols
are decreasing at a time when day use and demand are increasing. Fewer facilities
are being constructed, such as access points and trails, and there are fewer crews and
resources to sustainably manage existing opportunities.
Shrinking federal and state budgets.
Funding and capacity of public land agencies to address and manage their lands.
Funding for development, implementation, and maintenance.
Financial resources.
Access to private land, lack of comprehensive recreation management on private
lands, and lack of coordination between private land and public land management.
Water, access and clean.
Funding.
Adequate funding for management of lands after acquisition.
Permitting for projects to restore habitat and to make environmentally friendly access
projects for hiking, etc.
Dealing with increasing numbers of users and non-compatible forms of recreation.
Access to areas that could be designated for outdoor recreation. Having adequate
personnel (either paid or volunteer) to assist in this effort. Educating the public on
the issue of outdoor recreation. Funding to implement ideas and plans.
Budget cuts. Less funding for maintenance, parks, restoration, etc.
1. Adequate funding. 2. Political bickering over the capital budget for recreation
dollars. 3. State parks becoming self-sufficient.
Resources to manage public lands and provide access.

30 Responsive Management
Q2. What do you see as the greatest challenges or obstacles to providing outdoor recreation
in the area you serve over the next 5 years? (State/Fed/Not-for-Profit Survey) (continued)
Type of
Org. Challenge
Conse
rvat
ion o
r T
rust
(co
nti
nued
)
Maintaining public access in the midst of population growth and economic
challenges, and stewardship of acquisitions.
Access and availability of outdoor recreation opportunities.
Concerns over landowner liability for providing access, concerns over recreational
user liability associated with in-stream restoration projects.
Funding for management and upkeep. I support a targeted income tax, user fees on a
sliding scale, or somehow adjusted for incomes so that low-income users can still
access places.
Shrinking government=less funding to maintain and expand trails and facilities.
Diversification of funding sources to maintain areas.
Reduction in funding to State Parks, which may cause additional fees or closures.
There are also challenges from extractive industries and logging interests that may
reduce access.
Access to recreation that is local, affordable, and easily accessible (perhaps even by
public transportation or other alternative transportation methods).
Funding for effective management and stewardship of recreation areas.
Funding to maintain infrastructure.
Funding: public and political support for making funds available for maintaining
and expanding outdoor recreational opportunities.
Lack of funding to maintain public spaces, which reflects prevailing thought that we
can’t raise revenue, taxes in particular, to provide for the public good.
Lack of operations and maintenance funds.
Land use planning.
Maintaining existing levels of service as government continues to face budget woes
that are shuttering publicly operated facilities, increasing the demand for non-profit
organizations that provide outdoor recreation opportunities to the community without
charge and without government money for operations. Donations are not matching
increasing costs to provide services.
Many landowners we work with on conservation easements are not interested in
allowing public access, and purchasing lands fee simple is much rarer for our
organization. When we do purchase lands fee simple, we often manage them for the
public, but this is expensive and time-consuming. The biggest barrier for us is
funding to manage those lands for the public.
Money. We have decent facilities here, but if they fall into disrepair, fewer people
will use them.
Ocean Inquiry Project educates students and community members of all ages through
boat-based, scientific inquiry on Puget Sound, making them partners in estuarine
research by contributing data to current projects and long-term databases.
Public sector funding.
Cost of participation for parks departments, schools, etc. There are cutbacks in all of
these traditional routes to recreation and activity with no real replacements emerging.

Results of Provider Survey in Support of the Washington SCORP 31
Q2. What do you see as the greatest challenges or obstacles to providing outdoor recreation
in the area you serve over the next 5 years? (State/Fed/Not-for-Profit Survey) (continued)
Type of
Org. Challenge
Lan
d U
se a
nd/o
r W
ildli
fe M
anag
emen
t
Due to the decrease in funding limits for work-related travel, Reclamation faces the challenge of conducting Comprehensive Condition Assessments (CCA) at recreation sites in Washington. The purpose of the CCA inspections is to ensure public health and safety requirements are being met and to monitor compliance with Federal regulations. Other items reviewed include: compliance with terms and conditions of agreements with Reclamation; assessments for public demand for recreation; identification of hazards and risk reduction actions; care of natural resources; potential cost-share opportunities; and storage and handling of hazardous materials. Reclamation has a responsibility to ensure that its recreation facilities are effectively operated and maintained. Regardless of the operating and maintenance entity, the federal investment and ownership in these facilities has an inherent liability (design/construction) and there is a need to safeguard related public interests relative to their operation. To adequately protect these interests and for responsible asset management purposes, a periodic review of the condition and associated activities of these facilities is necessary. Any deficiencies identified in the CCA review may require corrective actions, and, due to the lack of funding, those items end up creating a backlog of deferred maintenance items for Reclamation and the managing partner. This could lead to a potential shutdown of the recreation site if the deferred maintenance items are not corrected.
Funding for operating and maintaining facilities, including removal of invasive species and development of new facilities.
Relatively static land base compared with increasing demand for recreation use. Maintenance backlog of developed recreation facilities, trails, and other associated facilities. A niche on many forests includes providing general forest and dispersed recreation opportunities, which are underfunded and time-consuming to manage. Resolving conflicting use demands on specific recreation sites. Travel planning and resource management that leads towards a sustainable network of roads and trails. A changing workforce to keep up with the needs of our recreating public. Declining budgets necessitate that we provide a more focused view of what we provide, where, and how. Climatic changes in forest vegetation conditions will heighten the risks and challenges in protecting and enhancing scenic character of recreation settings.
1. Efficient cooperative management between recreation and other programs/emphases, especially wildlife, historical/cultural, natural resource protection, wilderness and lands with wilderness characteristics, botany, weeds. 2. Meeting public demand for provision of recreation opportunities where appropriate (especially for impactive activities), and facilities/infrastructure. 3. Public access issues.
Lack of stable funding sources, aging infrastructure, and an increase in demand for outdoor recreation opportunities coupled with an decrease in accessibility and decline in the number of available opportunities.
Funding for purchases of prime real estate when available.
Lack of funding and staff for maintenance of existing facilities/sites, as well as for any new facilities/sites.

32 Responsive Management
Q2. What do you see as the greatest challenges or obstacles to providing outdoor recreation
in the area you serve over the next 5 years? (State/Fed/Not-for-Profit Survey) (continued)
Type of
Org. Challenge
Mis
cell
aneo
us
Staffing and budget are always a challenge. Transporting people to the sites requires
time and money. Serving only those who can transport themselves to sites would
threaten the equitability.
Budgets to keep parks open and trails maintained.
Keeping land open for motorized recreation.
U.S. Forest Service and Department of Natural Resources.
Increasing ORV usage and shrinking ORV resources.
Lack of access and the theft of off-road tab money by the legislature.
Use of NOVA [Nonhighway and Off-Road Vehicle Activities] program funds by
other agencies not related to ORV use.
Creation of land and water trails.
Lack of space and funding.
Government interference.
Not-
for-
Pro
fit
Fis
hin
g /
Hunti
ng /
Shooti
ng
Anti-hunting/gun political parties and environmental special interest groups have a
great impact on hunting.
More opportunities for hunting and fishing instead of less with price increases.
If the economy recovers and the housing market improves, political agendas will
attempt to limit growth or eliminate existing shooting ranges. I thought the GMA
[Growth Management Act] would help here. It has not. Developing a new range in
another rural area in King County is very expensive for a non-profit and also
financially unattractive to a private developer.
Again, an aging population of shooters is a concern, but we are trying to attract a
younger generation of shooters through FFA [Future Farmers of America] and the
Scholastic Clay Target programs. We are located in a rural area, so we have limited
complaints about noise, traffic, or other concerns that plague other firearms ranges.
Environmental concerns may arise over lead accumulation, but our site is being
mined at the present time to clean up this material.
The greatest challenge is finding ways to satisfy people’s need to get outdoors and
recreate while managing use of available areas and resources to avoid overcrowding.
There is currently too high a demand and too few opportunities and places to enjoy
the outdoors. In our particular case—that is, we are an archery range with a good
population of hunting archers (vs. target/tournament archers)—we can provide a
place for hunters to practice, but if there’s no chance of ever getting an animal
because good hunting areas are too far away, have no animals, or are too crowded,
why hunt? Another obstacle is that DNR lands are supposed to be open for the
public to hunt on, but when you get to a DNR plot, often the lessee has posted the
land, so a promising patch on paper becomes nothing but disappointing when you get
there. We need a map that truly shows which public lands really are open to the
public.
Meeting the environmental requirements.

Results of Provider Survey in Support of the Washington SCORP 33
Q2. What do you see as the greatest challenges or obstacles to providing outdoor recreation
in the area you serve over the next 5 years? (State/Fed/Not-for-Profit Survey) (continued)
Type of
Org. Challenge
Not-
for-
Pro
fit
Fis
hin
g /
Hunti
ng /
Shooti
ng
(co
nti
nued
)
Expensive. We are going to need to be easy to do, open more hours, and add to
types of shooting.
Economy issues/jobs in the local area. Logging is the lifeblood of this area and there
isn’t much logging on USFS land going on. I don’t know what the numbers are, but
I know that the USFS logging cutbacks have had some effect on the local economy.
Environmental issues.
Trying to keep the price of shooting down so that the general public can afford to
come to our gun club.
Road access to and in the Gifford Pinchot National Forest.
Encroachment from the urban growth in the Black Diamond area. Not unlike what
happened between Kent and Auburn or what we see going on between Bonneylake
and Buckley or Buckley and Enumclaw. It seems that by and large, the land between
two cities that are close eventually fills in with homes and businesses.
Not-
for-
Pro
fit
Gen
eral
/ O
ther
Act
ivit
y
Objections from “habitual appellants” to anything they feel is inappropriate for the
environment, including recreation. Increasing drought resulting in less available
water in certain areas.
With changing environmental conditions and industrial proposals, it will be
important to maintain a close working relationship with local, regional, and national
government agencies, as well as non-governmental entities, to ensure everyone is on
the same page and working together to accomplish goals.
Orienteering is a sport that immerses people of all ages in the outdoors, building
valuable navigational skills that are useful across many outdoor activities. It is so
valuable that Nordic countries teach it in schools, and many meets involve thousands
of participants. Yet in this area, the growth of orienteering is often restricted by local
landowners and “Friends of” groups on the basis that their land is so unique and
natural that even small groups of outdoor people can’t use it for navigation. This is
how to overprotect a public property into irrelevance.
Off-trail bans. Park fees.
Limited number of sports fields and high competition for access to them.
A lack of safe areas to ski in. The downhill ski area has no course for us, and the
snowshoe and walkers don’t respect our trails.
Lack of designated funding.
Funding for WA State Park facilities and trails along the Washington coast. Funding
for Olympic Discovery Trail through the Washington Wildlife and Recreation
Program.
Not following the vision Gifford Pinchot envisioned for multiple use in our forests.

34 Responsive Management
Q2. What do you see as the greatest challenges or obstacles to providing outdoor recreation
in the area you serve over the next 5 years? (State/Fed/Not-for-Profit Survey) (continued)
Type of
Org. Challenge
Not-
for-
Pro
fit
Gen
eral
/ O
ther
Act
ivit
y (
conti
nued
)
Cost of agency compliance for river facility improvements (e.g., access, docks, trails,
ramps, buildings, flood control, shoreline repair).
The greatest current challenge is financial support for keeping water trails open and
ecosystems healthy. Long-term partnerships with state agencies have become more
difficult because of the cumulative legislative cuts in their budgets. WWTA
[Washington Water Trails Association] plans to assist in whatever ways we can with
stewarding our shared outdoor recreation lands, and we have a site steward project
on the Cascadia Marine Trail to monitor all public access sites on a continuing basis.
The state taking away money from our fund so that we have fewer places to ride, and
less work is being done on the trails that we have.
Increase in population requires more land development for housing rather than green
space/soccer fields.
Not-
for-
Pro
fit
Off
-Road
ing
Dealing with political red tape from the upper levels on the DNR and objections
from environmental radicals.
Funding for grooming and maintenance.
Access and funds to maintain the trail systems in the National Forest.
Maintaining open trails for the motorized recreationist. The motorized community is
continually being demonized as the major contributor to erosion, illegal trails, or
habitat destruction. The vast majority of motorized recreationists are law-abiding
citizens who spend countless hours volunteering to help maintain trails and the
environment, while the only ones who are publicized are the people doing illegal or
destructive activities.
Liability issues and funding.
The greatest challenge or obstacle to providing outdoor recreation in my area is the
environmentalist and the Washington State DNR. Environmentalists are constantly
trying to obstruct any kind of outdoor activity that either involves a motor or isn’t
affiliated with their belief system. The DNR managers are anti-ORV or have no
affiliation to any type of outdoor recreation involving an ORV.
The current plan being implemented at Reiter Road is cost-prohibitive and entirely
too limited for people to use. The cost must come down and the miles must go up.
The only way to decrease impact on the trails is to get more miles, so that the users
get dispersed and the impact is spread out. The impact from the closure of Reiter has
negatively affected all other areas on the west side of the Cascades and is
unsustainable.
Getting user groups to work together to maintain outdoor recreation opportunities.
Whether motorized or non-motorized, we should all have the common goal of
maintaining opportunities for everyone.

Results of Provider Survey in Support of the Washington SCORP 35
Q2. What do you see as the greatest challenges or obstacles to providing outdoor recreation
in the area you serve over the next 5 years? (State/Fed/Not-for-Profit Survey) (continued)
Type of
Org. Challenge
Not-
for-
Pro
fit
Off
-Road
ing
(co
nti
nued
)
I am worried that building is going crazy and we aren’t going to have any forest and
open space left. With the rising obesity rate in our country, outdoor activity is more
important than ever. We need lots of space to accommodate everyone’s activities.
No more passes and fees for everything either. We already pay taxes—use the
money more wisely.
Changing land-use policies.
The time it takes to get OHV trails built and open takes too long. DNR has been
working on the Yacolt Burn OHV system for 3 years without opening any trails.
Thousands of dollars have been raised by a local club to support this trail system, but
the project seems to continue to be bogged down in red tape. The lack of Class II
OHV systems in Washington is causing the state to lose money as residents are
forced to travel out of state. There is no reason to have a Washington State OHV tag
if I can’t use it here.
The overuse of the existing trails we now have, with the constant threat of closure
due to overuse. We need more space to recreate in.
Environmentalists.
Elitist groups who hate off-road vehicles use every means possible to exclude, close,
or restrict this very legitimate form of outdoor recreation.
Organizations disguised as conservation groups pass legislation and file lawsuits
attempting to lock people out of public lands.
Regulation and restriction of motorized off-highway vehicle use and diversion of
funds that are intended to provide for motorized off-highway vehicle use. Agency
personnel that discriminate against motorized recreation.
Getting roads open in the state and National Forest lands.
Maintaining funding for outdoor recreation activities.
Adequate management of current and proposed areas.
The greatest obstacle is selfish people. Many hiker-only organizations, groups, and
individuals work hard to exclude other forms of recreation on public lands so they
can have it all to themselves. They use environmental regulations as a lever to attain
their own exclusive use of public lands.
Lack of funding has proved the greatest challenge in keeping public land open for
OHV use. This lack of funding means less money available for the maintenance,
construction, and public education on these lands.
Misguided attempts to further the above agenda.

36 Responsive Management
Q2. What do you see as the greatest challenges or obstacles to providing outdoor recreation
in the area you serve over the next 5 years? (State/Fed/Not-for-Profit Survey) (continued)
Type of
Org. Challenge
Not-
for-
Pro
fit
Tra
ils
in G
ener
al
Development of those properties for all types of wildlife, recreation, and
eco-recreation.
Funding for operation and maintenance of grooming equipment for cross country
skiing: snow cats and snowmobiles.
We serve a very diverse area, with the trail being over 1,200 miles long and another
600 miles of feeder trails. I know that federal dollars for a lot of recreation are
drying up, and that needs to be rectified somehow. We lobby Congress every year
for more recreational dollars, whether it be to fund the RTP [Recreation Trails
Programs] or the various agencies, and sometimes we are successful.
The high (and rapidly increasing) cost (of finances and time) to coordinate with
county, state, and federal agencies to secure permitting and funding for high-priority
and time-sensitive maintenance and development projects that support the local
economy and character of the region.
Environmental and non-motorized recreation groups pushing the motorized
recreation groups out of areas that have historically been used by the motorized
groups.
People making decisions to close down areas without good data or reasons.
Someone doing something wrong and blaming everyone.
Funding. Maintenance.
1. Lack of funding for trail and road maintenance and unmet planning needs.
2. Lack of agency personnel to coordinate with volunteer-based non-profits.
3. Confusion over federal vs. state land passes.

Results of Provider Survey in Support of the Washington SCORP 37
Q2. What do you see as the greatest challenges or obstacles to providing outdoor recreation
in the area you serve over the next 5 years? (State/Fed/Not-for-Profit Survey) (continued)
Type of
Org. Challenge
Par
ks
Sufficient funding for infrastructure development; remote site staffing; cultural and
natural resource preservation vs. visitor impacts.
To provide outdoor recreation facilities and access that is sustainable without major
maintenance needs, as State Parks and other organizations have less and less
available funding to support.
The lack of connection to the Lewis and Clark NHT with all other resources along
the 3,700-mile Lewis and Clark National Historic Trial. Working to protect,
connect, promote, and assist managing partners to increase interpretation and
recreational opportunities along the Lewis and Clark NHT.
Flat to decreasing budgets.
Lower lake levels on Lake Roosevelt and shrinking budgets for parks.
Doing more with less: providing excellent park services with fewer full-time rangers
and maintenance staff. Transition from subsidized service to service for a fee
(Discover Pass). With agency staff reductions, the loss of institutional knowledge.
1. Receding glaciers and aggrading rivers threatening park infrastructure and forcing
closure of roads and campgrounds. 2. Funding to repair/maintain critical park
infrastructure. 3. Management of growth and development pressures outside park
boundaries. 4. Development and ongoing monitoring of standards and indicators to
measure visitor experience and resource protection in specified management zones
of the park.
Reasonable transportation access for an urban population reliant on public
transportation (some of whom have given up cars for a lighter footprint, but in
particular for those who simply can’t afford to own reliable transportation) and the
deterrent that entrance fees can pose to people of limited income. Public lands
should be accessible to everyone, not merely those of means. This will of course
prove increasingly difficult as budgets continue to dwindle and more land managers
are forced to be increasingly self-sustaining. This is less of an issue at present for
National Parks, but is a very real concern for State Parks and some other federal
agencies, and the public does not always understand the difference between who
manages what land.
Working collaboratively with other outdoor recreation partners and agencies to
provide a multifaceted approach to recreation.
Tri
bal
Funding and maintaining jurisdiction over all lands on the reservation.
Providing services for RVs and trailers, building more boat launches, and keeping up
with an increase in visitation.
Tribal members are unaware of what is available because there is no direct outreach.
Also, they don’t have prioritized access to areas or access to areas that are not
available to the general public.
The tribe does not have a parks and recreation plan or department that can give
guidance on how to increase recreational opportunities.
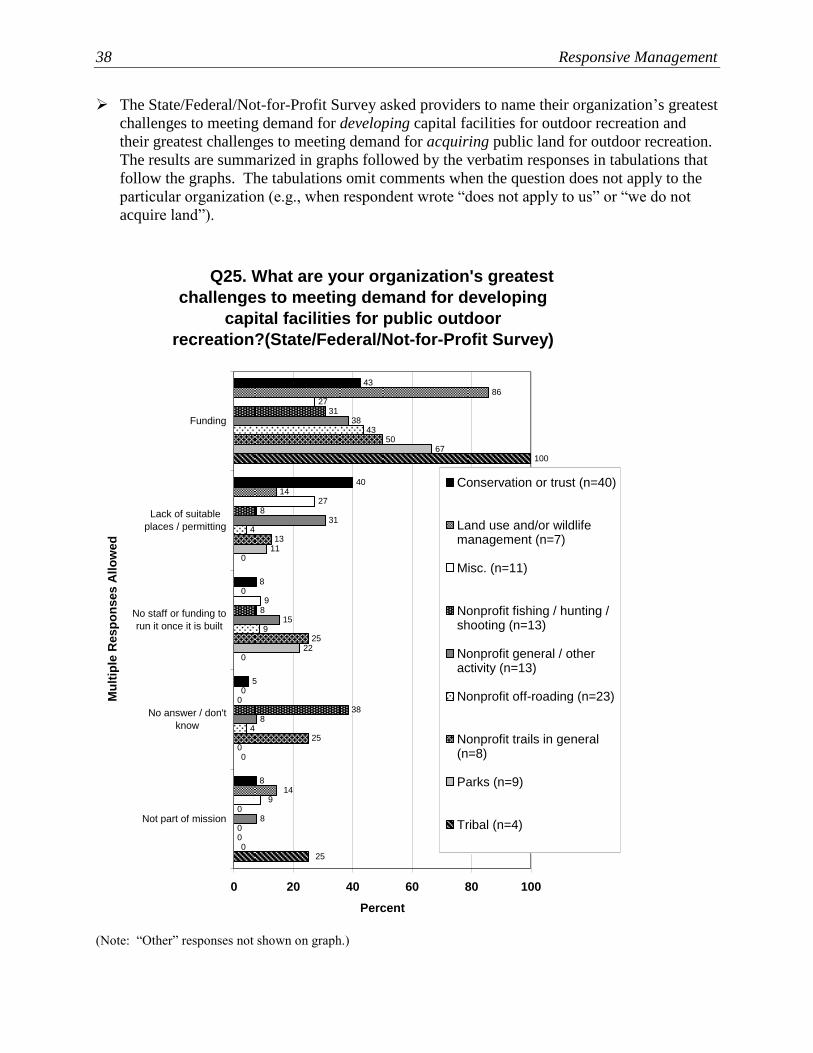
38 Responsive Management
The State/Federal/Not-for-Profit Survey asked providers to name their organization’s greatest
challenges to meeting demand for developing capital facilities for outdoor recreation and
their greatest challenges to meeting demand for acquiring public land for outdoor recreation.
The results are summarized in graphs followed by the verbatim responses in tabulations that
follow the graphs. The tabulations omit comments when the question does not apply to the
particular organization (e.g., when respondent wrote “does not apply to us” or “we do not
acquire land”).
Q25. What are your organization's greatest
challenges to meeting demand for developing
capital facilities for public outdoor
recreation?(State/Federal/Not-for-Profit Survey)
8
5
8
40
43
14
0
0
14
86
9
0
9
27
27
0
38
8
8
31
8
8
15
31
38
0
4
9
4
43
0
25
25
13
50
0
0
22
11
67
25
0
0
0
100
0 20 40 60 80 100
Funding
Lack of suitable
places / permitting
No staff or funding to
run it once it is built
No answer / don't
know
Not part of mission
Mu
ltip
le R
esp
on
ses A
llo
wed
Percent
Conservation or trust (n=40)
Land use and/or wildlifemanagement (n=7)
Misc. (n=11)
Nonprofit fishing / hunting /shooting (n=13)
Nonprofit general / otheractivity (n=13)
Nonprofit off-roading (n=23)
Nonprofit trails in general(n=8)
Parks (n=9)
Tribal (n=4)
(Note: “Other” responses not shown on graph.)

Results of Provider Survey in Support of the Washington SCORP 39
Q27. What are your organization's greatest
challenges to meeting demand for acquiring public
land for public outdoor recreation?
(State/Federal/Not-for-Profit Survey)
25
8
3
13
13
60
29
14
0
0
14
43
27
36
0
0
18
18
31
15
0
8
31
23
8
15
15
8
15
31
9
30
9
0
26
17
38
13
13
13
0
25
44
11
0
0
11
33
0
50
25
0
25
0
0 20 40 60 80 100
Funding
Finding appropriate
areas
Ensuring there are
managers /
maintenance once
land acquired
Land use regulations /
permits
Don't know / no
answer
None / does not
acquire land
Mu
ltip
le R
esp
on
ses A
llo
wed
Percent
Conservation or trust (n=40)
Land use and/or wildlifemanagement (n=7)
Misc. (n=11)
Nonprofit fishing / hunting /shooting (n=13)
Nonprofit general / otheractivity (n=13)
Nonprofit off-roading (n=23)
Nonprofit trails in general(n=8)
Parks (n=9)
Tribal (n=4)
(Note: “Other” responses not shown on graph.)

40 Responsive Management
Q25. What are your organization’s greatest challenges to meeting demand for developing
capital facilities for public outdoor recreation? (State/Federal/Not-for-Profit Survey)
Type of
Org. Challenge
Conse
rvat
ion o
r T
rust
Funding.
We develop minimal facilities to keep management and organization costs down and
also to ensure that protection of the natural environment takes precedence. We partner
with local and state organizations for high-level use areas, and, in those cases, lack of
funding and management and organization to maintain the facilities are the biggest
problems.
Lack of new funding and the decrease of current funding.
Deciding where it’s appropriate to allow visitation and creating public access to those
sites (some are located on private roads).
Having the money to install facilities, like bathrooms for public use, kitchen facilities,
and community indoor meeting space.
Overregulation and taxation.
The greatest challenge to meeting demand is the lack of sustainable funding. Wild
land trails, trailheads, river access points, roads, regional trails (such as the Burke-
Gilman Trail), parks, and natural areas all have costs associated with their
development and long-term management. Controlling for invasive species and
restoring natural areas, monitoring for changes, cleaning, repaving, clearing and
brushing, repairs—all have costs that must be paid for, and finding sources of funding
that will last longer then a few years is extremely challenging. The Mountains to
Sound Greenway Trust generally does not hold funding for capital development
projects. We work with agencies to secure funding and assist in design, development,
construction, and other aspects of projects.
Funding.
Finding capital.
No planning has been conducted.
Maintenance budgets: We’ve weathered the storm of post-2008 economy by deferring
maintenance.
Funding, capacity, and resources of local land managers. With dwindling resources to
support existing facilities, public land managers are hesitant to implement new capital
facilities.
Obtaining property from private owners.
Development of capital facilities is not our primary mission. Our primary mission is
conservation through acquisition or conservation easements, either alone or in
partnership with agencies more directly focused on developing and managing
recreational facilities. We also have begun sponsoring major shoreline restoration
efforts in our service area, mostly for improvement of habitat rather than for
recreation.
Funding, organizational capacity, landowner willingness.

Results of Provider Survey in Support of the Washington SCORP 41
Q25. What are your organization’s greatest challenges to meeting demand for developing
capital facilities for public outdoor recreation? (State/Federal/Not-for-Profit Survey)
(continued)
Type of
Org. Challenge
Conse
rvat
ion o
r T
rust
(conti
nued
)
Funding and staffing.
Generating funds.
Funding and permitting.
Money to maintain and expand.
Lack of capital.
Cost, lack of funding.
Public dollars.
Balancing the desires for access and recreational use with habitat restoration needs.
Funding.
Lan
d U
se a
nd/o
r
Wil
dli
fe M
anag
emen
t State parks have the primary role of meeting demand for developing capital facilities
for public outdoor recreation.
Limited funding for capital improvements and declining funding for long-term
operations and maintenance.
Budget for capital and operating expenses.
Decreasing BLM funding, especially for maintenance. Increasing time needed for
paperwork and appeals of BLM decisions.
Flat/declining budgets and limited opportunities to leverage outside funding.
Funding, limited staffing levels.
Mis
cell
aneo
us Staffing time to set up and manage events. Changes in government policies about land
use.
Lack of funding.
Money.
Funding.
Getting more area designated for ORV use.

42 Responsive Management
Q25. What are your organization’s greatest challenges to meeting demand for developing
capital facilities for public outdoor recreation? (State/Federal/Not-for-Profit Survey)
(continued)
Type of
Org. Challenge
Not-
for-
Pro
fit
Fis
hin
g /
Hunti
ng /
Shooti
ng
Funding.
Funding.
The length of time, complexity of the process, and associated expense of the
permitting process in King County is excessive. State government permitting
expenses, so far, are reasonable for nonprofits, their processes more streamlined, and
the employees come across as genuinely committed to our success and serving our
needs.
Limited revenue above costs of operations to allow us to participate in programs like
FARR [Firearms and Archery Range Recreation Program] that require matching funds
from the applicant organization. We recently qualified to receive 501(c)(3) status with
the IRS, allowing us to be considered a charitable organization for purposes of
fundraising.
Money. We need cash to expand our members’ range, which is open to the public one
night a week (and it’s packed). We now offer two sessions, and we still turn people
away. Our Junior Olympic Archery Development programs (on two other nights each
week) are also getting full for the size of our facility.
Limits on our existing lease with King County.
We have very limited profit to upgrade and need to keep our prices as low as possible
so that shooters can afford to shoot. This will always be a challenge.
Our club house is 50-plus years old and past its life cycle.
Keeping volunteers involved.
Not enough of the public comes out to enjoy the club facilities, so therefore we are not
reaching our goals.
Property for outdoor range.
Shooting has dropped off during the recession and is slowly coming back, but due to
the original drop-off, the volunteer base and revenues have shrunk. This leaves gun
clubs in the catch-up mode, and so we are struggling to maintain or improve existing
facilities and/or to expand services.

Results of Provider Survey in Support of the Washington SCORP 43
Q25. What are your organization’s greatest challenges to meeting demand for developing
capital facilities for public outdoor recreation? (State/Federal/Not-for-Profit Survey)
(continued)
Type of
Org. Challenge
Not-
for-
Pro
fit
Gen
eral
/ O
ther
Act
ivit
y
Resources: personnel and monetary.
This is not a capital issue. It is an access issue, and we are continually asked to
provide more access to parks and recreational areas that we can use once/year for off-
trail navigation.
Lack of financial capacity.
Finding suitable sites for cross country ski trails and their development.
Part of our Sports Council is the Wenatchee Valley Sports Foundation. We rely on
contributions and/or fee-based activities (e.g., tournaments) to generate revenue to
facilitate projects. This is a very difficult time to generate those dollars.
Funding.
Loss of off-road motorcycling areas.
Permitting along the Columbia River shoreline.
The need for more money to upgrade and maintain our facilities.
Not-
for-
Pro
fit
Off
-Road
ing
Loss or theft of RCO, NOVA [Nonhighway and Off-Road Vehicle Activities
Program], and other grant funding, as well as Department of Natural Resources red
tape.
Accessibility and funds.
Once again, pressure from groups who don’t understand that the majority of motorized
recreationists are law-abiding citizens who spend countless hours helping to maintain
our trails, clean up trash, and ensure that all users are following the rules while
enjoying our outdoors.
Public perception of our contributions.
The state keeps on closing the trails. They are charging all kinds of fees, yet close
trails and blame the four-wheelers for it. We don’t let a few bad apples close other
parks, so why let them close the trails? Patrol the trails every now and then, just like
police patrol the parks every now and then. If people had a fear of getting caught, it
might help clean things up. Lots of four-wheelers are more than happy to participate
in clean-up days. Just ask for help when it’s needed instead of closing things down.
We have to have space and trails to wheel!
NOVA [Nonhighway and Off-Road Vehicle Activities Program] funds were taken
away in 2009, ensuring that the permit fees and gas taxes contribute to their designed
goals.
Lack of access to public land.
Lack of respect from government agencies and officials. The people in charge of
making recreation decisions will cater to one or two groups and focus on them,
allowing other types of recreation to be choked out due to lack of respect.

44 Responsive Management
Q25. What are your organization’s greatest challenges to meeting demand for developing
capital facilities for public outdoor recreation? (State/Federal/Not-for-Profit Survey)
(continued)
Type of
Org. Challenge
Not-
for-
Pro
fit
Off
-Road
ing
(co
nti
nued
) The siphoning off (redirecting, out-and-out theft) of monies from the NOVA
[Nonhighway and Off-Road Vehicle Activities Program] fund, ORV tab dollars to
agencies that do not provide ATV opportunities, and/or use of those funds for closures
or harassment of ATV users.
The state legislature stealing OHV funds, DNR mismanagement of OHV funds, anti-
access groups deciding how OHV funds are distributed.
Constant attack from groups to close public access for off-highway travel and
motorized recreation.
Money. Finding government employees willing to work with our form of recreation.
Funding and volunteers.
Funding and DNR reluctance to move ahead on needed projects.
Our greatest challenge is raising enough money to buy land off of Cheyne Road
located north of Zillah, WA., so that we can keep the popular Rankville area open to
ATVs and dirt bikes.
Lack of funding, as all positions in this organization are volunteers.
Not-
for-
Pro
fit
Tra
ils
in G
ener
al
Raising money for land acquisition.
On state lands, we really have no challenges other than maybe a few more trailheads
and access points. On private lands, there are some definite roadblocks, such as land
acquisition, overnight camping, and developed trailheads. On federal lands, we need
better access points and more trailhead development.
We do not have a reliable revenue source to have a budget to improve the experience
for those user groups, and to support maintenance and improvement of our current
200 km of trail for the non-winter months. Ski trail passes cover the cost of winter
maintenance, but not summer users such as bikers, hikers, and equestrians.
Too many nonmotorized-only areas compared to motorized.
Pass laws that allow us access to some recreation facilities, like other states.
Funding, shoreline, and critical area ordinances.
We define new trail miles as capital facilities. The challenges of new hiking
opportunities, whether front- or backcountry, include the cash-strapped nature of our
public agencies and NEPA [National Environmental Policy Act] and SEPA [State
Environmental Policy Act] requirements and costs.

Results of Provider Survey in Support of the Washington SCORP 45
Q25. What are your organization’s greatest challenges to meeting demand for developing
capital facilities for public outdoor recreation? (State/Federal/Not-for-Profit Survey)
(continued)
Type of
Org. Challenge
Par
ks
Capital funding.
Access, land ownership, proximity of facilities to population, geography—there are
large water bodies that restrict or make improvements extremely expensive for land-
based recreation that avoids driving.
Competition within the National Park Service for limited funding opportunities.
Constrained budgets.
Shrinking federal budgets and increasing staff costs. The NPS currently has a freeze
on new facility projects.
Funding.
Besides adequate sources of capital funding, the strict regulations on development in
environmentally, culturally, and historically significant settings.
Tri
bal
Funding and making sure there is limited, controlled public access to only desired
locations.
Getting the needed funding with all the fiscal shortfalls.
Funding and staff capacity (which is really about funding).
Funding. Funding sources require facilities to be accessible to the public, and the tribe
has not addressed whether recreation is for the public or tribal members only.

46 Responsive Management
Q27. What are your organization’s greatest challenges to meeting demand for acquiring
public land for public outdoor recreation? (State/Federal/Not-for-Profit Survey)
Type of
Org. Challenge
Conse
rvat
ion o
r T
rust
Funding for acquisition and for management.
Perception or reality of removing tax income from rural county income streams.
Funding.
Funding.
Finding adequate funding or matching funds to purchase lands. State agencies don’t
have to secure a match, whereas nonprofits and local governments do. This means
that state agencies tend to get more grants because they don’t have the same costs.
Yet the state agencies typically do the worst job in terms of taking care of their lands
and also spending the millions of dollars they secure, meaning that projects down the
list are not funded and matching funds are lost while the state agencies sit on huge
amounts of capital funding.
Money.
Land use regulations.
Adequate funding, both for purchasing land from willing sellers at fair market value,
and then for managing this land once it has been acquired. The Mountains to Sound
Greenway has worked with partners to move land into public ownership, whether a
large chunk of acreage or a small parcel, in a manner that meets demand for building
vibrant communities while protecting natural areas. The Mountains to Sound
Greenway Trust generally does not hold funding for land acquisitions, nor does the
organization own land. We work with agencies to secure funding to acquire and
manage land, and assist in facilitating the stages of acquisition.
Funding.
It is not currently a goal of ours to “meet demand for public land.” Conserving
important wildlife habitat, working forests, and farmland is the demand we are
hoping to meet.
Funding.
Getting LWCF [Land and Water Conservation Fund] funds designated to the
Columbia River Gorge for a backlog of prioritized lands from USFS. Friends of the
Columbia Gorge’s Land Trust works with state parks and USFS to acquire lands that
have been prioritized for public land acquisition. The Gorge has not received LWCF
for the last three funding cycles, preventing the National Scenic Area from securing
and protecting sensitive and recreationally rich lands.
Obtaining property from private owners.
Financial. We have the projects in the queue and the stakeholder support for those
projects lined up.
Funding, organizational capacity, and landowner willingness.
Funding to increase access and/or purchase lands.
Funding.
Funding.
How to generate funds and sustain the support.

Results of Provider Survey in Support of the Washington SCORP 47
Q27. What are your organization’s greatest challenges to meeting demand for acquiring
public land for public outdoor recreation? (State/Federal/Not-for-Profit Survey)
(continued)
Type of
Org. Challenge
Conse
rvat
ion o
r T
rust
(co
nti
nued
)
While our new conservation strategy plan has a component for “People in Nature,”
our primary focus is still habitat protection. Now that other RCO funds besides
SRFB [Salmon Recovery Funding Board] are available to non-profits, we would like
to partner with groups to access funds to acquire beloved local lands. Our biggest
challenge would be managing lands with heavy public use with no outside
assistance.
Funding and willing landowners to sell.
Money to maintain takes all that we can get, and we find it increasingly insufficient.
As a non-governmental organization, many grants are unavailable to us. Fortunately,
the county has sponsored many grant applications on our behalf. Finding money to
build is easier than finding money to maintain.
Increasing land prices.
Public funding. Political bickering over private land being taken off the tax roles for
public outdoor recreation.
Our niche may be to facilitate access to public lands by acquiring easements through
private lands that lie between communities and our public lands.
Funding to buy and develop appropriate access.
Funding and staff capacity to purchase properties.
Competitive grant programs and limited funding.
Lan
d U
se
and/o
r W
ildli
fe
Man
agem
ent
Funding.
Funding for acquisitions or land exchanges, paperwork required, locating willing
sellers, and coming to agreement with appraised land values.
Increasing public demand does not necessarily equate to governmental goals and
directives.
Budget.
Mis
c. Lack of understanding of land managers about our needs.
Funding.
Negative image of ORV use.
Finding grants or money to purchase properties.
No
t-fo
r-P
rofi
t F
ishin
g /
Hunti
ng /
Shooti
ng
Funding and landowner cooperation.
Unlike when the range was purchased in the ‘50s, we are now surrounded by houses
on three sides. Coordinating an offer to buy land to expand the one side with open
space, using grant money, and the grant process itself seems insurmountable.
Just keeping what we have is enough of a challenge.
Raising funding (matching) to purchase additional property.
No public land available next to our property.
The fact that 80% of our county is U S Forest Service ground.
Having the land available for purchase would be the number one obstacle and then
having the funds to purchase would be the very next issue for the club to face.

48 Responsive Management
Q27. What are your organization’s greatest challenges to meeting demand for acquiring
public land for public outdoor recreation? (State/Federal/Not-for-Profit Survey)
(continued)
Type of
Org. Challenge
Not-
for-
Pro
fit
Gen
eral
/ O
ther
Act
ivit
y
Funding and the underestimated popularity of horse riding.
Of our 40 mapped park areas, only about 50% allow off-trail navigation. Learning to
navigate without leaving the trails is like learning to sail without leaving the
shoreline—good sailors aren’t made in calm harbors. Our #1 challenge is the lack of
a science-based, statewide perspective on the appropriateness of orienteering as a
recreational activity in Washington parks. We are often off-trail, but we also often
leave areas even better than we found them.
Lack of financial capacity.
Convincing the other users that ski trails are needed.
Funding from the Washington Wildlife and Recreation Program through the
legislature.
Loss of off-road motorcycling areas.
Agency approvals, i.e., Chelan County PUD, Chelan County, City of Wenatchee.
The limited percentage of public lands available, as well as financial support for
overhead costs to work with partners to increase public access sites to water trails.
The need to change the laws to open more lands for riding.
Not-
for-
Pro
fit
Off
-Road
ing
Money.
Environmentalists.
Public perception of the differences within our user groups: off-road motorcycle
riders are NOT the same as quad riders or the wheeler crowd in respect to attitude,
approach, resource impact, trail usage, or really any way.
Financial.
Again, we need space for our activities. Put some restrooms at the trailheads and
even along the trail, so things don’t get stinky.
Miscommunication.
Bureaucracy. It should not be this hard to use public land in a responsible way.
There are thousands of individuals willing to volunteer to help build OHV trail
systems that are sustainable and enjoyable for the user. Unfortunately, it is
challenging to get access to public land to put these trails on. Once you do get
access to the land, developing the plan takes too long and is filled with rivers of red
tape to swim through. Washington needs to get serious about OHV use and
seriously develop a plan for opening areas to OHV use. Without this, illegal trails
will continue to be built, causing far greater resource damage than a legal trail
system would have. Build it and they will come. If you don’t build it, it will still get
built, but without the state’s oversight and control.
We have to sit back and listen to how there is no money for the projects we propose,
but yet the state government will take the funds set aside for us and put it into the
general fund to finance state parks. To us, that was stealing. The money was set
aside for us to use for motorized projects, not to fund state parks!
Elitist user groups that seek to exclude ATVs, a legitimate outdoor recreation
segment.

Results of Provider Survey in Support of the Washington SCORP 49
Q27. What are your organization’s greatest challenges to meeting demand for acquiring
public land for public outdoor recreation? (State/Federal/Not-for-Profit Survey)
(continued)
Type of
Org. Challenge
Not-
for-
Pro
fit
Off
-
Road
ing (
conti
nued
)
Agencies and officials who discriminate against motorized off-highway travel and
recreation.
Environmental laws and rules, finding government employees who are willing to
learn about our sport and what we want/need for a quality experience.
We currently have no plans.
Perception by general public that our sport is detrimental and their persistence in
having access closures.
Selfish people want to exclude all forms of outdoor recreation other than hiking.
Lack of funding.
Small membership.
Not-
for-
Pro
fit
Tra
ils
in G
ener
al
Finding grants or other non-tax revenue to purchase lands.
Getting more funding to enable us to get more youth crews out to maintain the trail.
Volunteers are great, but there are a lot of projects where we need accountable crews
to guarantee the quality of the work.
We do not have trouble with acquisition, but with getting permits to maintain our
facilities on public lands.
Conservation funding is available and keeps us from having motorized recreation.
Not enough common sense in some people. Trails are needed so people will use
them and have a place to ride rather than some riding where they shouldn’t and
making all look bad.
We do not acquire land. We assist in the maintenance and development of the
Spokane Centennial Trail.
While we do not acquire public land, our members benefit from the acquisition of
public land. As we see it, the greatest challenge facing public land acquisition is
lack of funding at the state and federal level.
Par
ks
Our parks were not established to provide recreational opportunities as commonly
understood. As a result, our small land base, centered on nationally significant
cultural resources, limits the nature and extent of recreational opportunities provided.
Finding appropriate and available areas.
Funding.
Funding, partner support, and public support.
Having sufficient up-front funds to take advantage of adjacent land purchases or in-
holdings willing to sell their properties for outdoor recreation.
Tri
bal
There is no public demand for public outdoor recreation.
Putting land into trust.
Much of the reservation is in the floodplain, which is a challenge when developing
larger outdoor areas.

50 Responsive Management
The Local Provider Survey asked a series of 16 questions. For each question, local providers
rated the importance of the item to the agency. The mean and median ratings are tabulated
for all regions. The tabulation is followed by a graph for each region of its results, ranked
from the highest to the lowest mean rating.
On a scale of 0 - 10 where 0 is not at all important and 10 is extremely important, the mean and median
rating of importance of the following to the agency. (Local Provider Survey)
Major Issues and Challenges Mean or
Median
Region
Th
e Is
lan
ds
(n=
4)
Pen
insu
las
(n=
12
)
Th
e C
oa
st (
n=
5)
No
rth
Ca
sca
des
(n=
19
)
Sea
ttle
-Kin
g (
n=
13
)
So
uth
wes
t (n
=15
)
No
rth
east
(n
=4
)
Co
lum
bia
Pla
tea
u
(n=
4)
So
uth
Cen
tra
l
(n=
6)
Th
e P
alo
use
(n
=3
)
To
tal
(n=
85
)
Increasing agency staffing Mean 7.00 4.33 3.40 6.68 6.69 5.86 9.50 1.50 5.50 4.33 5.75
Median 7.5 5 2 8 7 6.5 10 0.5 5 5 6.5
Creating new partnership opportunities
Mean 8.50 8.33 6.20 7.74 8.15 8.54 8.75 6.25 8.83 7.33 8.00
Median 8.5 9 7 8 8 9 9 5 8.5 7 8
Updating agency planning documents (e.g., recreation master plan, open space master plan)
Mean 5.00 6.50 5.80 7.05 6.08 7.00 8.00 6.50 6.83 6.33 6.62
Median 5 7 5 7 7 7.5 8 6.5 7.5 8 7
Acquiring land for public parks and/or recreation
Mean 8.00 6.92 4.80 6.11 6.85 6.14 4.50 4.50 5.83 6.33 6.19
Median 8.5 7 5 7 7 5 4.5 4.5 5.5 6 6.5
Developing new public parks and recreation sites
Mean 7.50 7.50 4.40 6.16 7.23 6.93 6.50 4.50 6.67 7.67 6.63
Median 7.5 8 5 7 8 7 7.5 4.5 6 8 7
Increasing maintenance of existing public park and/or recreation sites
Mean 6.50 8.08 8.80 8.68 8.23 7.79 9.00 4.75 8.50 7.00 8.04
Median 7 8 10 10 9 8.5 9 6 8.5 7 9
Increasing natural resource protection
Mean 6.75 6.25 5.60 7.42 6.85 6.71 7.00 3.75 6.50 4.33 6.54
Median 6.5 8 5 7 8 7 7 4.5 7 3 7
Increasing control efforts of invasive species
Mean 6.00 5.50 7.80 6.68 7.33 6.86 6.75 3.75 7.00 5.33 6.51
Median 6.5 6.5 7 7 8 7 7.5 4 6 4 7
Increasing public access Mean 8.50 8.50 7.80 7.11 7.77 7.36 6.25 7.00 8.17 6.67 7.57
Median 9.5 9.5 9 7 8 7.5 7 7 8 8 8
Having a better understanding of user satisfactions and dissatisfactions
Mean 7.25 6.55 5.80 7.16 7.15 6.36 6.25 6.75 9.17 6.67 6.93
Median 8 7 5 7 8 7 7.5 6 9.5 6 7
Providing more education and outreach related to public parks and/or recreation sites
Mean 6.00 6.33 5.60 6.21 6.54 6.46 7.75 5.25 8.00 4.67 6.37
Median 5.5 7.5 5 7 8 7 8 4.5 8 3 7
Providing more signage Mean 3.50 6.25 8.60 6.21 5.69 5.57 6.75 5.50 6.50 8.00 6.12
Median 3.5 6.5 9 7 6 6.5 6.5 5 7 9 7
Providing more access for persons with disabilities
Mean 6.25 7.83 9.40 8.05 6.62 7.29 8.25 6.50 8.17 6.67 7.56
Median 7 7.5 10 8 7 7 8 6.5 8 5 8
Building more restrooms Mean 2.50 5.50 5.80 6.26 5.75 5.21 5.25 5.25 7.67 5.33 5.66
Median 2 6.5 6 7 7 5 5 5 7.5 5 6
Establishing more volunteer programs for maintaining or managing public parks and/or recreation sites
Mean 6.75 6.92 5.00 5.79 6.23 6.71 9.00 4.50 8.50 6.67 6.49
Median 7 7.5 5 7 7 7.5 9 5 8.5 7 7
Providing more sustainable outdoor recreation opportunities
Mean 7.50 7.58 6.80 6.68 6.31 6.57 6.25 6.25 8.50 5.67 6.83
Median 7 8 8 6 6 7 7 5.5 8.5 5 7

Results of Provider Survey in Support of the Washington SCORP 51
Mean ratings of importance of the following to
respondent's agency.
(Local Provider Survey)
(The Islands)
8.50
8.50
8.00
7.50
7.50
7.25
7.00
6.75
6.75
6.50
6.25
6.00
6.00
5.00
3.50
2.50
0.00 2.00 4.00 6.00 8.00 10.00
Creating new partnership opportunities
Increasing public access
Acquiring land for public parks and/or recreation
Developing new public parks and recreation sites
Providing more sustainable outdoor recreation
opportunities
Having a better understanding of user satisfactions
and dissatisfactions
Increasing agency staffing
Increasing natural resource protection
Establishing more volunteer progs. for maintaining /
managing public parks / recreation sites
Increasing maintenance of existing public park and/or
recreation sites
Providing more access for persons with disabilities
Increasing control efforts of invasive species
Providing more education and outreach related to
public parks and/or recreation sites
Updating agency planning documents
Providing more signage
Building more restrooms
Mean

52 Responsive Management
Mean ratings of importance of the following to
respondent's agency.
(Local Provider Survey)
(Peninsulas)
8.50
8.33
8.08
7.83
7.58
7.50
6.92
6.92
6.55
6.50
6.33
6.25
6.25
5.50
5.50
4.33
0.00 2.00 4.00 6.00 8.00 10.00
Increasing public access
Creating new partnership opportunities
Increasing maintenance of existing public park and/or
recreation sites
Providing more access for persons with disabilities
Providing more sustainable outdoor recreation
opportunities
Developing new public parks and recreation sites
Acquiring land for public parks and/or recreation
Establishing more volunteer progs. for maintaining /
managing public parks / recreation sites
Having a better understanding of user satisfactions
and dissatisfactions
Updating agency planning documents
Providing more education and outreach related to
public parks and/or recreation sites
Increasing natural resource protection
Providing more signage
Increasing control efforts of invasive species
Building more restrooms
Increasing agency staffing
Mean

Results of Provider Survey in Support of the Washington SCORP 53
Mean ratings of importance of the following to
respondent's agency.
(Local Provider Survey)
(The Coast)
9.40
8.80
8.60
7.80
7.80
6.80
6.20
5.80
5.80
5.80
5.60
5.60
5.00
4.80
4.40
3.40
0.00 2.00 4.00 6.00 8.00 10.00
Providing more access for persons with disabilities
Increasing maintenance of existing public park and/or
recreation sites
Providing more signage
Increasing control efforts of invasive species
Increasing public access
Providing more sustainable outdoor recreation
opportunities
Creating new partnership opportunities
Updating agency planning documents
Having a better understanding of user satisfactions
and dissatisfactions
Building more restrooms
Increasing natural resource protection
Providing more education and outreach related to
public parks and/or recreation sites
Establishing more volunteer progs. for maintaining /
managing public parks / recreation sites
Acquiring land for public parks and/or recreation
Developing new public parks and recreation sites
Increasing agency staffing
Mean

54 Responsive Management
Mean ratings of importance of the following to
respondent's agency.
(Local Provider Survey)
(North Cascades)
8.68
8.05
7.74
7.42
7.16
7.11
7.05
6.68
6.68
6.68
6.26
6.21
6.21
6.16
6.11
5.79
0.00 2.00 4.00 6.00 8.00 10.00
Increasing maintenance of existing public park and/or
recreation sites
Providing more access for persons with disabilities
Creating new partnership opportunities
Increasing natural resource protection
Having a better understanding of user satisfactions
and dissatisfactions
Increasing public access
Updating agency planning documents
Increasing agency staffing
Increasing control efforts of invasive species
Providing more sustainable outdoor recreation
opportunities
Building more restrooms
Providing more signage
Providing more education and outreach related to
public parks and/or recreation sites
Developing new public parks and recreation sites
Acquiring land for public parks and/or recreation
Establishing more volunteer progs. for maintaining /
managing public parks / recreation sites
Mean

Results of Provider Survey in Support of the Washington SCORP 55
Mean ratings of importance of the following to
respondent's agency.
(Local Provider Survey)
(Seattle-King)
8.23
8.15
7.77
7.33
7.23
7.15
6.85
6.85
6.69
6.62
6.54
6.31
6.23
6.08
5.75
5.69
0.00 2.00 4.00 6.00 8.00 10.00
Increasing maintenance of existing public park and/or
recreation sites
Creating new partnership opportunities
Increasing public access
Increasing control efforts of invasive species
Developing new public parks and recreation sites
Having a better understanding of user satisfactions
and dissatisfactions
Increasing natural resource protection
Acquiring land for public parks and/or recreation
Increasing agency staffing
Providing more access for persons with disabilities
Providing more education and outreach related to
public parks and/or recreation sites
Providing more sustainable outdoor recreation
opportunities
Establishing more volunteer progs. for maintaining /
managing public parks / recreation sites
Updating agency planning documents
Building more restrooms
Providing more signage
Mean
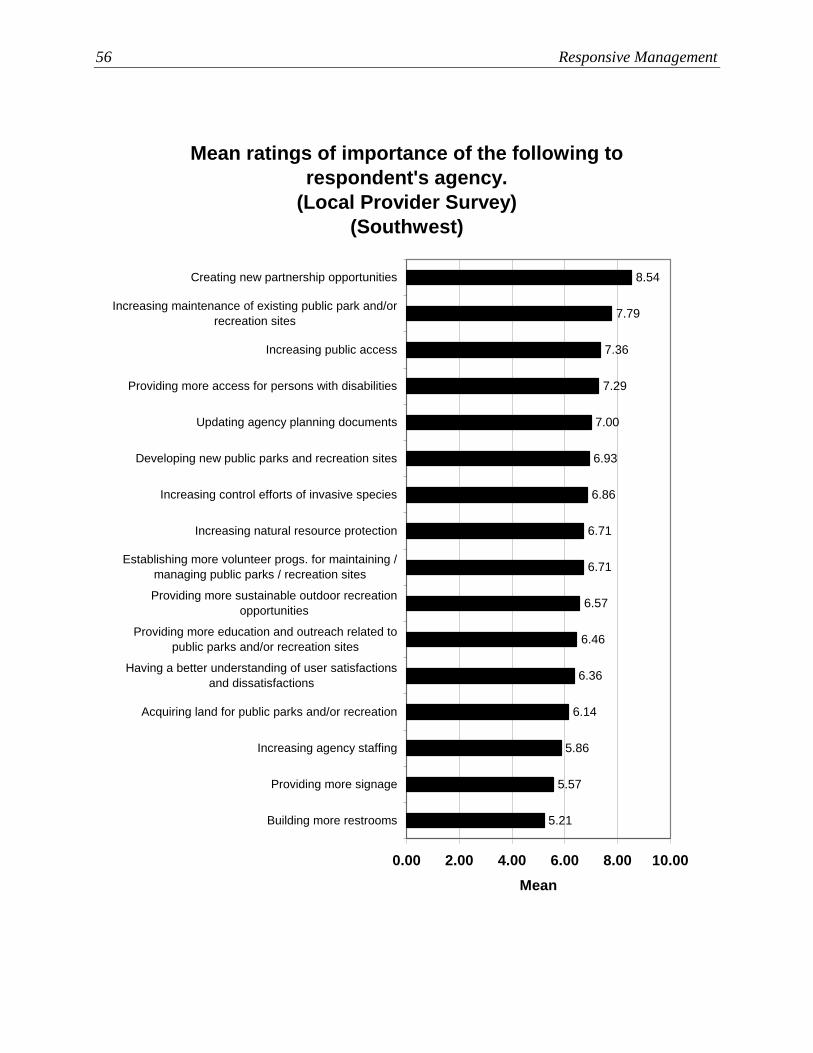
56 Responsive Management
Mean ratings of importance of the following to
respondent's agency.
(Local Provider Survey)
(Southwest)
8.54
7.79
7.36
7.29
7.00
6.93
6.86
6.71
6.71
6.57
6.46
6.36
6.14
5.86
5.57
5.21
0.00 2.00 4.00 6.00 8.00 10.00
Creating new partnership opportunities
Increasing maintenance of existing public park and/or
recreation sites
Increasing public access
Providing more access for persons with disabilities
Updating agency planning documents
Developing new public parks and recreation sites
Increasing control efforts of invasive species
Increasing natural resource protection
Establishing more volunteer progs. for maintaining /
managing public parks / recreation sites
Providing more sustainable outdoor recreation
opportunities
Providing more education and outreach related to
public parks and/or recreation sites
Having a better understanding of user satisfactions
and dissatisfactions
Acquiring land for public parks and/or recreation
Increasing agency staffing
Providing more signage
Building more restrooms
Mean

Results of Provider Survey in Support of the Washington SCORP 57
Mean ratings of importance of the following to
respondent's agency.
(Local Provider Survey)
(Northeast)
9.50
9.00
9.00
8.75
8.25
8.00
7.75
7.00
6.75
6.75
6.50
6.25
6.25
6.25
5.25
4.50
0.00 2.00 4.00 6.00 8.00 10.00
Increasing agency staffing
Increasing maintenance of existing public park and/or
recreation sites
Establishing more volunteer progs. for maintaining /
managing public parks / recreation sites
Creating new partnership opportunities
Providing more access for persons with disabilities
Updating agency planning documents
Providing more education and outreach related to
public parks and/or recreation sites
Increasing natural resource protection
Increasing control efforts of invasive species
Providing more signage
Developing new public parks and recreation sites
Increasing public access
Having a better understanding of user satisfactions
and dissatisfactions
Providing more sustainable outdoor recreation
opportunities
Building more restrooms
Acquiring land for public parks and/or recreation
Mean

58 Responsive Management
Mean ratings of importance of the following to
respondent's agency.
(Local Provider Survey)
(Columbia Plateau)
7.00
6.75
6.50
6.50
6.25
6.25
5.50
5.25
5.25
4.75
4.50
4.50
4.50
3.75
3.75
1.50
0.00 2.00 4.00 6.00 8.00 10.00
Increasing public access
Having a better understanding of user satisfactions
and dissatisfactions
Updating agency planning documents
Providing more access for persons with disabilities
Creating new partnership opportunities
Providing more sustainable outdoor recreation
opportunities
Providing more signage
Providing more education and outreach related to
public parks and/or recreation sites
Building more restrooms
Increasing maintenance of existing public park and/or
recreation sites
Acquiring land for public parks and/or recreation
Developing new public parks and recreation sites
Establishing more volunteer progs. for maintaining /
managing public parks / recreation sites
Increasing natural resource protection
Increasing control efforts of invasive species
Increasing agency staffing
Mean

Results of Provider Survey in Support of the Washington SCORP 59
Mean ratings of importance of the following to
respondent's agency.
(Local Provider Survey)
(South Central)
9.17
8.83
8.50
8.50
8.50
8.17
8.17
8.00
7.67
7.00
6.83
6.67
6.50
6.50
5.83
5.50
0.00 2.00 4.00 6.00 8.00 10.00
Having a better understanding of user satisfactions
and dissatisfactions
Creating new partnership opportunities
Increasing maintenance of existing public park and/or
recreation sites
Establishing more volunteer progs. for maintaining /
managing public parks / recreation sites
Providing more sustainable outdoor recreation
opportunities
Increasing public access
Providing more access for persons with disabilities
Providing more education and outreach related to
public parks and/or recreation sites
Building more restrooms
Increasing control efforts of invasive species
Updating agency planning documents
Developing new public parks and recreation sites
Increasing natural resource protection
Providing more signage
Acquiring land for public parks and/or recreation
Increasing agency staffing
Mean

60 Responsive Management
Mean ratings of importance of the following to
respondent's agency.
(Local Provider Survey)
(The Palouse)
8.00
7.67
7.33
7.00
6.67
6.67
6.67
6.67
6.33
6.33
5.67
5.33
5.33
4.67
4.33
4.33
0.00 2.00 4.00 6.00 8.00 10.00
Providing more signage
Developing new public parks and recreation sites
Creating new partnership opportunities
Increasing maintenance of existing public park and/or
recreation sites
Having a better understanding of user satisfactions
and dissatisfactions
Providing more access for persons with disabilities
Establishing more volunteer progs. for maintaining /
managing public parks / recreation sites
Increasing public access
Updating agency planning documents
Acquiring land for public parks and/or recreation
Providing more sustainable outdoor recreation
opportunities
Increasing control efforts of invasive species
Building more restrooms
Providing more education and outreach related to
public parks and/or recreation sites
Increasing agency staffing
Increasing natural resource protection
Mean

Results of Provider Survey in Support of the Washington SCORP 61
The State/Federal/Not-for-Profit Provider Survey asked the same series of 16 questions that
was asked of local providers. For each question, providers rated the importance of the item
to their organization. The mean and median ratings are tabulated for each organization type.
Q19. Please indicate how important each of the following are to your organization, on a scale of 0 to 10, where 0 is not at all important and 10 is extremely important. (State/Federal/Not-for-Profit Survey)
Factors Mean / Median
Conservation or trust
Land use and/or wildlife management
Not-for-profit
activity oriented
Parks Tribal Misc. Total
Increasing agency/ organization staffing
Mean 6.58 7.00 4.44 6.44 6.25 3.73 5.38 Median 7 6 5 7 6.5 5 5
Creating new partnership opportunities
Mean 8.05 8.00 6.58 9.33 4.75 6.45 7.24 Median 9 9 7 10 4.5 7 8.5
Updating agency/ organization planning documents
Mean 4.95 7.57 4.56 7.11 5.75 4.09 5.02
Median 5 8 5 7 5.5 5 5
Acquiring land for recreation
Mean 4.48 5.00 6.56 3.44 4.50 6.00 5.49 Median 5 5 10 1 4 8 5
Developing new recreation sites
Mean 3.68 5.14 8.00 5.78 6.75 6.00 6.13 Median 2.5 5 10 5 8.5 8 7
Increasing maintenance of existing recreation sites
Mean 5.05 8.14 7.68 7.22 4.25 5.64 6.57
Median 6 8 9 8 4 6 8
Increasing natural resource protection
Mean 9.10 8.86 5.42 9.11 9.00 4.18 7.02 Median 10 8 5 9 9 5 8
Increasing control efforts of invasive species
Mean 8.35 9.00 3.75 9.22 8.75 3.55 6.00
Median 9.5 9 3 9 9 4 7
Increasing public access Mean 6.33 7.14 7.98 6.89 2.25 8.00 7.16 Median 6 8 10 7 1 9 8
Having a better understanding of user satisfactions and dissatisfactions
Mean 4.70 6.86 6.74 8.11 5.25 6.82 6.16
Median 5 7 7 9 6 7 6
Providing more education and outreach related to recreation sites
Mean 6.15 7.71 6.42 9.22 4.75 5.18 6.45
Median 7 8 7 10 5 5 7
Providing more signage Mean 5.69 6.57 5.72 6.67 3.00 3.91 5.58 Median 6 6 7 8 2.5 5 6
Providing more access for persons with disabilities
Mean 4.72 7.86 5.46 8.44 5.50 5.91 5.61
Median 5 8 5 9 6.5 5 5
Building more restrooms Mean 2.95 5.43 4.32 5.78 3.00 5.18 4.09 Median 2 5 5 6 1.5 5 5
Establishing more volunteer programs for maintaining or managing recreation sites
Mean 6.33 7.57 6.75 8.22 3.25 6.36 6.62
Median 7.5 8 8 9 3.5 7 8
Providing more sustainable outdoor recreation opportunities
Mean 7.25 8.57 7.05 8.33 7.00 5.27 7.13
Median 8 9 9 10 7 6 8

62 Responsive Management
Also related to this section on major issues and obstacles is the current functionality of the
recreation sites in communities. For the most part, it appears that the majority of sites meet
the design and safety guidelines assigned to them by their agency or organization.
Q16. What percent of the public park and/or recreation facilities managed by your agency are fully
functional (that is, meet their design and safety guidelines assigned to them by your agency)?
(Local Provider Survey)
Percent that
are fully
functional
Number Giving Response
Th
e Is
lan
ds
(n=
4)
Pen
insu
las
(n=
12
)
Th
e C
oa
st (
n=
5)
No
rth
Ca
sca
des
(n=
19
)
Sea
ttle
-Kin
g
(n=
13
)
So
uth
wes
t
(n=
15
)
No
rth
east
(n
=4
)
Co
lum
bia
Pla
tea
u (
n=
4)
So
uth
Cen
tra
l
(n=
6)
Th
e P
alo
use
(n=
3)
To
tal
(n=
85
)
100% 4 3 1 10 2 2 0 2 1 0 25
76%-99% 0 4 2 3 5 4 1 1 1 1 22
75% 0 0 0 2 0 1 0 0 0 0 3
51%-74% 0 1 0 2 2 3 1 0 1 0 10
50% 0 0 2 1 1 0 0 0 1 1 6
26%-49% 0 0 0 0 0 0 1 0 0 0 1
25% 0 1 0 0 1 1 0 0 0 0 3
1%-24% 0 1 0 0 1 0 0 0 1 0 3
0% 0 0 0 0 0 2 0 1 0 1 4
Don’t know 0 2 0 1 1 2 1 0 1 0 8
Mean 100.00 74.30 72.00 89.17 82.92 66.00 66.00 71.25 62.20 46.67 76.56
Median 100 85 80 100 87.5 75 70 92.5 70 50 85
Q13. What percent of the public park and/or recreation sites managed by your organization are fully functional (that is, meet their design and safety guidelines assigned to them by your organization)? (Of those whose organization currently manages at least one public park and/or recreation site.) (State/Federal/Not-for-Profit Survey)
Percent Functional
Number Giving Response
Conservation or trust
Land use and/or wildlife
management
Not-for-profit
activity oriented
Parks Tribal Misc. Total
100% 6 1 17 4 0 2 30
76%-99% 1 1 1 0 0 0 3
75% 2 0 0 1 1 1 5
51%-74% 0 0 3 1 0 0 4
50% 1 1 3 1 0 0 6
26%-49% 1 0 1 0 0 0 2
25% 2 0 2 0 0 0 4
Less than 25% 1 0 2 0 0 0 3
Don’t know 4 3 3 1 1 1 13
Mean 71.43 80.00 77.72 84.43 75.00 91.67 77.81
Median 82.5 90 100 100 75 100 100
Total 18 6 32 8 2 4 70

Results of Provider Survey in Support of the Washington SCORP 63
FUNDING Two questions in the Local Providers Survey concerned funding goals for developing capital
facilities for public outdoor recreation and funding goals for acquiring land for public
outdoor recreation. Both questions found low percentages of funding goals being met among
local providers.
Q30. What percent of your agency’s funding goal for developing capital facilities for public outdoor
recreation is your agency able to meet? (Local Provider Survey)
Percent of
funding goal
met
Number Giving Response
Th
e Is
lan
ds
(n=
4)
Pen
insu
las
(n=
12
)
Th
e C
oa
st
(n=
5)
No
rth
Ca
sca
des
(n=
19
)
Sea
ttle
-Kin
g
(n=
13
)
So
uth
wes
t
(n=
15
)
No
rth
east
(n=
4)
Co
lum
bia
Pla
tea
u (
n=
4)
So
uth
Cen
tra
l
(n=
6)
Th
e P
alo
use
(n=
3)
To
tal
(n=
85
)
100% 0 0 0 3 0 1 0 1 1 0 6
76%-99% 0 0 1 1 0 1 0 0 0 0 3
75% 0 1 0 0 0 0 0 0 0 0 1
51%-74% 0 1 0 1 1 0 0 0 0 0 3
50% 0 0 0 3 2 0 0 0 0 0 5
26%-49% 0 1 0 0 3 1 0 0 0 0 5
25% 1 3 0 1 2 2 0 0 2 0 11
1%-24% 1 6 4 6 1 4 3 0 3 1 29
0% 1 0 0 3 2 4 1 3 0 2 16
Don’t know 1 0 0 1 2 2 0 0 0 0 6
Mean 10.00 25.42 22.00 40.56 30.91 24.62 7.50 25.00 28.33 0.67 27.05
Median 5 22.5 10 22.5 30 20 10 0 17.5 0 20
Q32. What percent of your agency’s funding goal for acquiring land for public outdoor recreation is your
agency able to meet? (Local Provider Survey)
Percent of
funding goal
met
Number Giving Response
Th
e Is
lan
ds
(n=
4)
Pen
insu
las
(n=
12
)
Th
e C
oa
st
(n=
5)
No
rth
Ca
sca
des
(n=
19
)
Sea
ttle
-Kin
g
(n=
13
)
So
uth
wes
t
(n=
15
)
No
rth
east
(n=
4)
Co
lum
bia
Pla
tea
u (
n=
4)
So
uth
Cen
tra
l
(n=
6)
Th
e P
alo
use
(n=
3)
To
tal
(n=
85
)
100% 0 0 0 2 1 1 0 1 0 0 5
76%-99% 0 2 0 1 1 1 0 0 0 0 5
75% 0 1 0 0 0 1 0 0 0 0 2
51%-74% 0 0 0 1 0 0 0 0 0 0 1
50% 0 0 1 1 0 2 1 0 0 0 5
26%-49% 0 0 0 1 1 0 0 0 0 0 2
25% 0 4 0 0 1 1 0 0 0 0 6
1%-24% 1 1 2 4 2 4 2 1 1 0 18
0% 2 3 2 6 4 3 1 2 3 3 29
Don’t know 1 1 0 3 3 2 0 0 2 0 12
Mean 1.67 31.82 14.00 30.31 26.50 32.69 16.25 26.25 2.50 0.00 24.38
Median 0 25 10 10 15 20 7.5 2.5 0 0 10

64 Responsive Management
The State/Federal/Not-for-Profit Survey also had questions concerned with meeting goals for
capital facility development and land acquisition. For the most part, goals are not being met.
What is the biennial average percent of your organization’s unmet capital facility development (i.e., redevelopment, renovation, and/or restoration) goals for public outdoor recreation? (State/Federal/Not-for-Profit Survey)
Percent
Number Giving Response
Conservation or trust
Land use and/or wildlife
management
Not-for-profit
activity oriented
Parks Tribal Misc. Total
100% 1 0 6 1 0 1 9
76%-99% 1 1 6 0 0 0 8
75% 0 0 0 0 0 1 1
51%-74% 0 0 2 1 0 0 3
50% 3 2 5 1 0 1 12
26%-49% 1 1 4 0 0 1 7
25% 2 0 1 2 1 0 6
Less than 25% 14 0 13 1 1 0 29
Don’t know 18 3 20 3 2 7 53
Mean 22.73 56.25 47.00 48.33 12.50 63.75 40.45
Median 12.5 50 50 37.5 12.5 62.5 30
Total 40 7 57 9 4 11 128
What is the biennial average percent of your organization’s unmet land acquisition goals for public outdoor recreation? (State/Federal/Not-for-Profit Survey)
Percent
Number Giving Response
Conservation or trust
Land use and/or wildlife
management
Not-for-profit
activity oriented
Parks Tribal Misc. Total
100% 3 0 7 0 0 2 12
76%-99% 0 1 2 0 0 0 3
75% 0 0 0 0 0 0 0
51%-74% 0 0 3 0 0 0 3
50% 4 1 2 0 0 0 7
26%-49% 1 0 2 1 0 1 5
25% 0 0 1 2 0 0 3
Less than 25% 13 2 19 3 1 1 39
Don’t know 19 3 21 3 3 7 56
Mean 27.38 37.50 36.17 15.00 0.00 57.50 32.60
Median 0 30 15 12.5 0 65 12.5
Total 40 7 57 9 4 11 128

Results of Provider Survey in Support of the Washington SCORP 65
USE CONFLICTS, AND PRESSURES ON RECREATION LAND FOR OTHER USES A question in both the surveys asked providers to describe some of the pressures their
agencies and organizations have experienced to use their outdoor recreation sites and
facilities for non-recreational purposes. The results of the question were categorized and
summarized, as shown in the graphs. Additionally, the verbatim results are tabulated.
Q27. Describe some of the pressures your agency
has experienced to use the outdoor recreation
sites and facilities for non-recreational purposes.
(Local Provider Survey)
14
14
8
2
2
40
6
0 10 20 30 40 50
Commercial Uses of
Land
Land Use and
Activity Conflicts
Encroachment by
Development
Storm Water
Control
Infrastructure
Illegal Activity
None
No Answer
Mu
ltip
le R
esp
on
ses A
llo
wed
Number of Respondents
(Note: “Other” responses not shown on graph.)

66 Responsive Management
Q27. Describe some of the pressures your agency has experienced to use the outdoor
recreation sites and facilities for non-recreational purposes. (Local Provider Survey)
Region Pressure T
he
Isla
nds
Proposing cell tower site at park to help cover maintenance.
None.
No significant pressures in this area.
None.
Pen
insu
las
Boat launches and commercial uses.
Pressure by commercial entities to use existing boat ramp and parking lot.
Community wants us to build a bike trail and a soccer field. Finances preclude this
effort.
None.
Lot of pressure from a small group to build a very large stage in the waterfront park
for performances. While this is “recreation,” the scale of the project could
overpower the existing small facility, and current use (playground, picnicking,
weddings, swimming, beachcombing, etc.) would compete for use. Anticipate
upwards of 1,000 attendees per event. It would also create hundreds of feet of
impervious surface.
Increasing commercial use of a marina that is primarily oriented towards recreational
boating.
Weddings and private gatherings
None.
Public trying to use parking areas identified for recreational boaters and trailers.
Little to none.
None.
Homeless shelter.
The
Coas
t None.
None.
None.
None.
Commercial shellfish farmers fiercely protect the bay.
Nort
h C
asca
des
None.
Although recreational, a commercial aspect has an impact. For example: access to
the river for commercial “floating and rafting” festivals and events within Lions
Club and Front Street parks, and the farmer’s market. In addition, parking areas of
parks have had requests for alternative use.
None.
None.
Fairground activities, film crews, and private home encroachment.
None.
Financial demands and constraints.

Results of Provider Survey in Support of the Washington SCORP 67
Q27. Describe some of the pressures your agency has experienced to use the outdoor
recreation sites and facilities for non-recreational purposes. (Local Provider Survey)
(continued)
Region Pressure
Nort
h C
asca
des
(co
nti
nu
ed)
None.
Liability concerns require us to close the gate accessing the boat ramp during high flood waters, i.e., 19 feet or higher. Many times, these closures happen during the midst of fishing seasons, which causes fisherman to get frustrated and take it out on our department. Many times, people get their vehicles locked in at a park overnight because they don’t read the signs for closure and get irritated when they must come back the following day to get their vehicles.
Balancing recreational use with commercial use.
None.
Local development and encroachment.
None.
A very contentious issue has been the impending installation of a cell phone tower on Park District property. This has resulted in town hall meetings, in-depth consideration of topical literature and films, and even escalated to the Park District defense of legal action brought by a small group of local residents.
Pets off leash, paintball, off-road vehicles, and unauthorized mountain bike trails.
Non-recreational use of parks is controlled by permits, ordinances, and park rules and regulations.
None.
We have one undeveloped site that is currently leased for farming as an interim use and three other sites that are leased for haying. These uses, however, are considered a benefit to the Parks Department as they generate revenue and, more importantly, reduce maintenance needs that otherwise would be borne by staff.
We don’t have much pressure to do this.
Sea
ttle
-Kin
g
Commercial use, advertising.
None.
None.
None.
Very little.
None.
Homeless people, drug/alcohol addicts, and dealers use some of our parks for their activities and daily living. These people deter others from using those parks and cost us thousands of dollars annually in clean-up.
One area originally designated as open space is now a roadway. One property that is listed as undeveloped park space is currently the location of an interim public works maintenance shop.
Vendors requesting concession permits for commercial photography. Developing a restaurant/cafe site within a park.
None.
None.
Maintenance yard needs.
Soccer, baseball, and lacrosse clubs need more field space and time.

68 Responsive Management
Q27. Describe some of the pressures your agency has experienced to use the outdoor
recreation sites and facilities for non-recreational purposes. (Local Provider Survey)
(continued)
Region Pressure
South
wes
t
None.
None.
None.
None.
Pressure from developers to purchase undeveloped park properties.
Threatened sale of parts of parks currently unused for recreation. Some events
occurring on park property temporarily displace local recreation users for event users
that are from outside the service area.
None.
There has been some interest in use of parks for storm water detention, sewer lift
stations, and cell towers.
1. Pressure to allow alcoholic beverages at special-use areas, special events, and
festivals to make those facilities and events 100% cost recovery or to generate
revenue beyond expenses.
2. Pressure to expand the senior center, a non-outdoor recreation facility.
3. Interest to continue with lease of an undeveloped park for farming so that the city
doesn’t have to maintain fallow land because we lack new park development funds.
Demand for special event parking and camping.
Very little.
Police wanting to use sites for training.
Requests for indoor use/space on RCO-funded properties. Right of way needed for
street projects. No funding to develop/maintain properties.
None.
None.
Nort
hea
st
None.
Storm water control, expansion of adjacent private development, and easement
requests.
None.
Ongoing motorized access problems and some pressure to open areas to hunting and
shooting.
Colu
mbia
Pla
teau
Funding.
None.
None.
Douglas PUD’s Land Use Policy prohibits private-use docks on Wells Project lands
outside city limits. Many adjacent landowners have expressed interest in
constructing private-use boat docks on Wells Project lands.

Results of Provider Survey in Support of the Washington SCORP 69
Q27. Describe some of the pressures your agency has experienced to use the outdoor
recreation sites and facilities for non-recreational purposes. (Local Provider Survey)
(continued)
Region Pressure
South
Cen
tral
None.
None.
None.
None.
None.
Various towers. Property for home sites.
The
Pal
ouse
None.
None.
Equestrian activities. Privately sponsored musical concerts. Fenced softball fields
being used for a dog park.

70 Responsive Management
Q23. Describe some of the pressures your
organization has experienced to use the outdoor
recreation sites and facilities for
non-recreational purposes.
(State/Federal/Not-for-Profit Survey)
3
13
0
38
43
14
0
0
14
57
0
0
0
45
45
0
0
8
8
77
0
15
8
31
38
0
0
13
22
57
25
0
13
13
50
11
22
11
33
22
0
0
50
25
25
0 20 40 60 80 100
Commercial and
industrial uses
Development /
housing, etc.
Illegal dumping
No answer / don't
know
None
Mu
ltip
le R
esp
on
ses A
llo
wed
Percent
Conservation or trust (n=40)
Land use and/or wildlifemanagement (n=7)
Misc. (n=11)
Nonprofit fishing / hunting /shooting (n=13)
Nonprofit general / otheractivity (n=13)
Nonprofit off-roading (n=23)
Nonprofit trails in general(n=8)
Parks (n=9)
Tribal (n=4)
(Note: “Other” responses not shown on graph.)

Results of Provider Survey in Support of the Washington SCORP 71
Q23. Describe some of the pressures your organization has experienced to use the outdoor
recreation sites and facilities for non-recreational purposes. (State/Federal/Not-for-Profit
Survey)
Type of
Org. Pressure
Conse
rvat
ion o
r T
rust
None.
Not much pressure; however, some recreation areas are impacted by commercial
recreational use, which can interfere with, and in some cases preclude, use by the
public.
Development of trail area.
None.
Heavy use of some hiking trails that have no maintenance or access facilities
(parking, toilets, interpretive signs, etc.).
Motorcycles and ORVs sneak in and do a lot of damage. People want to hold big
events that will cause resource damage.
The pressures we experience are for more access by commercial recreation providers
(primarily tour businesses), which we try to limit.
None.
None.
None.
The Mountains to Sound Greenway Trust supports multiple uses of natural land. We
are supporters of non-recreational uses, such as fisheries, logging and timber
activities, and agriculture. Some forested lands within the Mountains to Sound
Greenway are actively managed by the Washington State Department of Natural
Resources as trust lands, and timber is harvested to support public institutions across
the state.
None.
Desire by public to have habitat lands used for recreational purposes.
None.
None.
None.
There is some developmental pressure in the area: lots of interest in building new
houses, drilling new wells, building roads, increasing overall traffic and human
impacts, etc.
None.
None.
Funding for ourselves and our partners.
Our agency focuses on habitat protection with recreational opportunities as a side
benefit (except for two or three properties where public access is as important as
protecting habitat). I believe if we restricted access to our properties, some residents
would accuse us of “locking up lands.” Given our policies, this is not true.
Neighbors illegally cutting trees, vandalism by people, trash dumping, development.

72 Responsive Management
Q23. Describe some of the pressures your organization has experienced to use the outdoor
recreation sites and facilities for non-recreational purposes. (State/Federal/Not-for-Profit
Survey)
Type of
Org. Pressure
Conse
rvat
ion o
r T
rust
(co
nti
nued
)
We have a substantial riparian area virtually in the middle of an urban area. We are
experiencing a dramatic increase in the number of homeless that are residing in that
environment. There have been fires, trash, physical altercations, and other negative
issues. Since we are not a publicly owned and managed facility, city police and
county sheriff personnel are not as available to assist as they would be if the parks,
playgrounds, and pathways were city- or county-owned.
None.
None.
None.
The cost of use for the facilities.
There is the regular pressure of development of potential recreational properties or
access sites. Shoreline properties are attractive for development as well as other
view properties that are better suited for public lands. Also, there can be friction
among different types of recreational users, from very passive to motorized
recreation.
The majority of recreational users of shorelines have an expectation that these areas
be and remain safe for novice recreational use. Our organization is committed to
restoring the health of salmon runs and their aquatic habitat. Little effort is spent by
recreation proponents to educate shoreline users to the opportunities and impacts
posed by their chosen recreation. These expectations combined with the lack of
educational support place significant pressures on our organization to limit effective
habitat restoration.
None.
Timber harvest, gravel mining, residential development, road construction or
reconstruction, and gold mining.
None.
None.
Lan
d U
se a
nd
/or
Wil
dli
fe
Man
agem
ent
None.
None.
None.
Pressure from miners at recreation sites; long-term campers.
Mining, litter/dumping.
None.
Mis
cell
aneo
us
A lot of places are not wheelchair accessible.
None.
None.
Festivals, car shows, parking, and special events.
None.
None.
Continuing closures of areas with a rapidly growing ORV community is a big issue.

Results of Provider Survey in Support of the Washington SCORP 73
Q23. Describe some of the pressures your organization has experienced to use the outdoor
recreation sites and facilities for non-recreational purposes. (State/Federal/Not-for-Profit
Survey) (continued)
Type of
Org. Pressure
Mis
cell
aneo
us
(co
nti
nued
)
Less and less land open to off-road motorcycles, forcing more and more riders onto
smaller areas, creating safety and environmental issues.
DNR roads being gated.
Closure of county water trail sites.
None.
Not-
for-
Pro
fit
Fis
hin
g /
Hunti
ng /
Shooti
ng
None.
Local landowners’ complaints.
None.
None. The shotgun club lease is part of a larger bequest to the City of Lynden that is
known as Berthusen Park and was designated at the time of the bequest for
recreational use of various types. These include a campground, a tractor club lease,
an airplane club lease, and a farm lease, in addition to the shotgun club.
None yet. We are at risk of being exactly on the edge of current Puyallup city limits.
None.
None.
None.
None.
None.
None.
U.S. Forest Service regulations and road access.
Not-
for-
Pro
fit
Gen
eral
/ O
ther
Act
ivit
y Current application process for mining exploration in horse camps in the Gifford
Pinchot National Forest.
When we ask if we can use park land for an outdoor-immersion navigational event
for students, we have been told at times that we must stay on trails and have no more
than a dozen students or the park is off limits. These limitations eliminate the event
and invalidate all effort and cost of making a detailed map that correctly shows the
natural features throughout the park. These parks are then no longer part of our
students’ outdoor immersion experience.
None.
None.
None.
None.
Loss of off-road motorcycling areas.
Landlord desire for maximum asphalt to accommodate future growth of automobiles.
Not our organization’s desire.

74 Responsive Management
Q23. Describe some of the pressures your organization has experienced to use the outdoor
recreation sites and facilities for non-recreational purposes. (State/Federal/Not-for-Profit
Survey) (continued)
Type of
Org. Pressure
Not-
for-
Pro
fit
Gen
eral
/ O
ther
Act
ivit
y
(conti
nued
)
The pressures of limited shore lands available for public access to waterways; these
limits stem from commercially and privately owned lands. Across the state,
estimates are that between 10% and 30% of shore lands are available to the public.
In some areas, available lands for public access sites are even lower. For example, in
Kitsap County, 100% of the people reside within 10 miles of a 253-mile shoreline
that offers public access to a mere 22 miles, or 8.7%, of its shore lands.
The need to educate people on the sport of dirt bike riding and that we are
responsible to the outdoors and it is a family sport.
None.
Not-
for-
Pro
fit
Off
-Road
ing
None.
None.
None.
None.
None.
None.
None.
None.
None.
In Southwest Washington, we do not have access to an area to use. DNR is 3 years
into a 10-year plan for the Yacolt Burn, and yet nothing has happened. The Gifford
Pinchot National Forest does not provide Class II opportunity.
None.
Pressure to create wilderness or roadless areas that deny public access in areas
previously used for multiuse or motorized access by the public.
We are constantly under attack by “green” groups to eradicate our use of our public
lands.
None.
Logging and closed access.
Productive forest management including timber sales and fuels reduction projects are
good for forest health and good for us.
None.
None.

Results of Provider Survey in Support of the Washington SCORP 75
Q23. Describe some of the pressures your organization has experienced to use the outdoor
recreation sites and facilities for non-recreational purposes. (State/Federal/Not-for-Profit
Survey) (continued)
Type of
Org. Pressure
Not-
for-
Pro
fit
Tra
ils
in G
ener
al
Lack of management has caused pressure between user groups.
None.
None.
The potential conversion of traditionally single-use trails on public land (non-
motorized) to multi-use (mixing motor and non-motor) that would detract from the
quality of the experience for all users.
None.
Doing clean-up rides as garbage pick-up rather than people going out to view the
countryside. But someone has to pick up the plastic bottles from the
environmentalist.
None.
On lands where enforcement staff is scarce, we often hear about or encounter illegal
uses such as drug labs and dumping. In some cases, we encounter illegal use by
motorized vehicles such as ORVs on non-motorized trails.
Par
ks
Precisely the opposite: use of historic or cultural sites for non-interpretive
recreational activities continues to provide the bulk of the challenges in management.
Some efforts to use land for commercial purposes.
As a whole, the NPS is dealing with the appropriateness of some proposed recreation
opportunities and their potential impact on cultural or natural resources, but no non-
recreational purposes spring immediately to mind.
None.
Housing developments along the edge of the NPS property continue to include
encroachments and misuse.
Trespass issues where adjacent landowners have cleared or encroached upon state
park property. In the Seashore Conservation Area, ocean beach driving, fireworks,
and trash removal affect environmental quality and public safety.
Tri
bal
All listed requirements above are important to the Nation, however, not for
recreation, but for preservation.
Alcohol drinking parties that vandalize the parks.
None.

76 Responsive Management
RECREATION INFRASTRUCTURE AND DEMAND MET, GOALS AND GOALS MET The tabulation below shows that less than half of local providers indicate that their agency
has a goal for outdoor recreation.
Q11. Does your agency have a goal for outdoor recreation, such as number of people it can accommodate,
number of people it serves, or a desired per-capita acreage of public park and/or recreation sites? (Local
Provider Survey)
Region Number Giving Response
Yes No Don’t know
The Islands (n=4) 2 1 1
Peninsulas (n=12) 7 5 0
The Coast (n=5) 0 5 0
North Cascades (n=19) 11 7 1
Seattle-King (n=13) 5 7 1
Southwest (n=15) 6 9 0
Northeast (n=4) 2 2 0
Columbia Plateau (n=4) 1 2 1
South Central (n=6) 2 3 1
The Palouse (n=3) 1 2 0
Total (n=85) 37 43 5

Results of Provider Survey in Support of the Washington SCORP 77
The following pages show tabulations for 45 major activities or activity groups. For each
activity or activity group, the tabulation shows the average number of sites or miles (or
whatever the measurement unit is) for that activity managed by the agencies in each region,
the estimated percent of demand met (estimated by the agencies), an indication of how the
estimation was made (i.e., either by a stated goal or by professional judgment), and an
indication of how important the activity or activity group is to the agency’s service area. The
activities or activity groups in the tabulations are presented in the order as follows:
ACTIVITY PAGE
Sightseeing
Designated Sightseeing Areas......................................................................................79
Cultural and/or Historic Sites .......................................................................................80
Nature Activities
Nature Interpretive Centers ..........................................................................................81
Community Gardens or Pea Patches ............................................................................82
Fishing or Shellfishing
Fishing Piers.................................................................................................................83
Picnicking, BBQing, and Cooking Out
Picnic Areas .................................................................................................................84
Water-Related Activities
Freshwater Beach Access ............................................................................................85
Saltwater Beach Access ...............................................................................................86
Boat Access Sites for Non-Motorized Boats ...............................................................87
Boat Access Sites That Accommodate Motorized Craft .............................................88
Pump-Out Stations .......................................................................................................89
Snow and Ice Activities
Outdoor Ice Skating Rinks ...........................................................................................90
Designated Snow and Ice Trails ..................................................................................91
Downhill Skiing Areas .................................................................................................92
Air Activities
Air Activities Sites .......................................................................................................93
Walking, Hiking, Climbing, and Mountaineering (including Pet activities)
Dog Parks .....................................................................................................................94
Surfaced Trails .............................................................................................................95
Unsurfaced Trails .........................................................................................................96
Bicycle Riding
Surfaced Trails Appropriate for Bicycles ....................................................................97
Unsurfaced Trails Appropriate for Bicycles ................................................................98
Horseback Riding
Equestrian Facilities .....................................................................................................99
Designated Bridle Trails ............................................................................................100
Off-Roading for Recreation
Designated Motorized Trails......................................................................................101
Designated Motorized Areas Without Trails .............................................................102

78 Responsive Management
Camping
Campgrounds .............................................................................................................103
Hunting and Shooting
Designated Hunting Areas .........................................................................................104
Shooting Ranges ........................................................................................................105
Shooting Ranges That Accommodate Archery..........................................................106
Shooting Ranges That Accommodate Rifle / Handgun .............................................107
Shooting Ranges That Accommodate Skeet / Trap / Clay / Target Games ...............108
Recreational Activities
Equipped Playgrounds / Play Areas ...........................................................................109
Outdoor Tracks For Running / Jogging .....................................................................110
Outdoor Swimming Pools ..........................................................................................111
Roller Skating / Skateboard Parks .............................................................................112
Basketball ...................................................................................................................113
Outdoor Tennis Courts ...............................................................................................114
Sports Fields...............................................................................................................115
Sports Fields for Multipurpose Use ...........................................................................116
Sports Fields With Football Goals .............................................................................117
Sports Fields With Lacrosse Goals ............................................................................118
Sports Fields With Rugby Goals................................................................................119
Sports Fields With Soccer Goals ...............................................................................120
Baseball / Softball ......................................................................................................121
Golf Courses ..............................................................................................................122
Frisbee Activities
Disc Golf ....................................................................................................................123

Results of Provider Survey in Support of the Washington SCORP 79
Designated Sightseeing Areas (Local Provider Survey)
Region
*Number of Areas
Estimated Percent of Current
Demand Agency Meets
Method Used For Measuring Demand
(Number Giving Response)
Rating of Importance to Recreation in the
Service Area (Number Giving
Response)
Mean Median Mean (%)
Median (%)
Sta
ted
Go
al
or
Fo
rma
l A
sses
smen
t
Use
d
Pro
fess
ion
al
Ju
dg
men
t
Do
n’t
kn
ow
Hig
h
Med
ium
Lo
w
Do
n’t
kn
ow
The Islands (n=4)
0.75 0 0.00 0 1 0 0 0 1 0 0
Peninsulas (n=12)
1.92 1 67.00 75 0 6 1 3 3 1 0
The Coast (n=5) 1.20 1 75.00 75 0 2 1 1 1 0 1
North Cascades (n=19)
0.94 0 55.00 62.5 1 5 1 3 2 2 0
Seattle-King (n=13)
1.38 0 93.33 100 1 4 0 1 2 2 0
Southwest (n=15)
1.77 0 90.00 90 0 1 3 2 1 0 1
Northeast (n=4) 7.00 10 56.67 50 0 3 0 1 2 0 0
Columbia Plateau (n=4)
0.50 0.5 62.50 62.5 0 2 0 0 2 0 0
South Central (n=6)
14.80 0 58.33 50 1 2 0 1 1 1 0
The Palouse (n=3)
1.00 1 62.50 62.5 0 1 1 0 1 1 0
Total 2.38 0 70.00 75 4 26 7 12 16 7 2
*Reporting only the count of those who used the suggested unit of measurement.

80 Responsive Management
Cultural and/or Historic Sites (Local Provider Survey)
Region
*Number of Sites
Estimated Percent of Current
Demand Agency Meets
Method Used For Measuring Demand
(Number Giving Response)
Rating of Importance to Recreation in the
Service Area (Number Giving
Response)
Mean Median Mean (%)
Median (%)
Sta
ted
Go
al
or
Fo
rma
l A
sses
smen
t
Use
d
Pro
fess
ion
al
Ju
dg
men
t
Do
n’t
kn
ow
Hig
h
Med
ium
Lo
w
Do
n’t
kn
ow
The Islands (n=4)
0.00 0 N/A N/A N/A N/A N/A N/A N/A N/A N/A
Peninsulas (n=12)
0.58 0 62.50 55 0 4 1 1 2 2 0
The Coast (n=5) 0.80 1 58.33 50 0 3 0 0 3 0 0
North Cascades (n=19)
1.05 0 72.50 77.5 1 4 2 3 4 0 0
Seattle-King (n=13)
2.00 1 72.50 77.5 3 4 1 1 4 2 1
Southwest (n=15)
0.79 0 68.14 80 0 5 2 1 4 1 1
Northeast (n=4) 3.25 4 41.67 50 0 3 0 0 3 0 0
Columbia Plateau (n=4)
0.25 0 25.00 25 0 1 0 0 1 0 0
South Central (n=6)
0.60 0 45.00 45 1 1 1 1 2 0 0
The Palouse (n=3)
1.33 0 50.00 50 0 1 0 0 0 1 0
Total 1.07 0 62.69 55 5 26 7 7 23 6 2
*Reporting only the count of those who used the suggested unit of measurement.

Results of Provider Survey in Support of the Washington SCORP 81
Nature Interpretive Centers (Local Provider Survey)
Region
*Number of Centers
Estimated Percent of Current
Demand Agency Meets
Method Used For Measuring Demand
(Number Giving Response)
Rating of Importance to Recreation in the
Service Area (Number Giving
Response)
Mean Median Mean (%)
Median (%)
Sta
ted
Go
al
or
Fo
rma
l A
sses
smen
t
Use
d
Pro
fess
ion
al
Ju
dg
men
t
Do
n’t
kn
ow
Hig
h
Med
ium
Lo
w
Do
n’t
kn
ow
The Islands (n=4)
0.50 0 50.00 50 0 1 0 0 1 0 0
Peninsulas (n=12)
0.25 0 30.00 30 0 2 1 1 2 0 0
The Coast (n=5) 0.40 0 50.00 50 0 2 0 0 2 0 0
North Cascades (n=19)
0.42 0 63.00 50 2 3 1 4 1 0 1
Seattle-King (n=13)
0.54 0 80.00 80 2 1 1 2 0 2 0
Southwest (n=15)
0.43 0 60.00 90 0 2 2 1 1 1 1
Northeast (n=4) 0.25 0 25.00 25 0 1 0 0 1 0 0
Columbia Plateau (n=4)
0.00 0 N/A N/A N/A N/A N/A N/A N/A N/A N/A
South Central (n=6)
0.33 0 50.00 50 1 0 1 0 1 1 0
The Palouse (n=3)
0.33 0 85.00 85 0 1 0 0 0 1 0
Total 0.38 0 59.72 50 5 13 6 8 9 5 2
*Reporting only the count of those who used the suggested unit of measurement.

82 Responsive Management
Community Gardens or Pea Patches (Local Provider Survey)
Region
*Number of Gardens
Estimated Percent of Current
Demand Agency Meets
Method Used For Measuring Demand
(Number Giving Response)
Rating of Importance to Recreation in the
Service Area (Number Giving
Response)
Mean Median Mean (%)
Median (%)
Sta
ted
Go
al
or
Fo
rma
l A
sses
smen
t
Use
d
Pro
fess
ion
al
Ju
dg
men
t
Do
n’t
kn
ow
Hig
h
Med
ium
Lo
w
Do
n’t
kn
ow
The Islands (n=4)
0.25 0 100.00 100 1 0 0 1 0 0 0
Peninsulas (n=12)
0.33 0 58.67 75 0 3 0 1 2 0 0
The Coast (n=5) 0.20 0 20.00 20 0 1 0 0 1 0 0
North Cascades (n=19)
0.17 0 50.00 50 0 2 1 1 1 1 0
Seattle-King (n=13)
0.50 0 78.00 90 4 1 1 2 4 0 0
Southwest (n=15)
1.43 1 56.86 60 1 5 2 1 5 1 1
Northeast (n=4) 0.33 0 77.50 77.5 0 2 0 1 1 0 0
Columbia Plateau (n=4)
0.00 0 N/A N/A N/A N/A N/A N/A N/A N/A N/A
South Central (n=6)
0.17 0 0.00 0 0 0 1 0 1 0 0
The Palouse (n=3)
0.33 0 80.00 80 0 1 0 0 1 0 0
Total 0.47 0 64.50 75 6 15 5 7 16 2 1
*Reporting only the count of those who used the suggested unit of measurement.

Results of Provider Survey in Support of the Washington SCORP 83
Fishing Piers (Local Provider Survey)
Region
*Number of Piers
Estimated Percent of Current
Demand Agency Meets
Method Used For Measuring Demand
(Number Giving Response)
Rating of Importance to Recreation in the
Service Area (Number Giving
Response)
Mean Median Mean (%)
Median (%)
Sta
ted
Go
al
or
Fo
rma
l A
sses
smen
t
Use
d
Pro
fess
ion
al
Ju
dg
men
t
Do
n’t
kn
ow
Hig
h
Med
ium
Lo
w
Do
n’t
kn
ow
The Islands (n=4)
1.00 1 58.33 50 1 3 0 3 1 0 0
Peninsulas (n=12)
0.42 0 63.33 75 1 2 1 2 2 0 0
The Coast (n=5) 0.80 1 33.33 50 0 3 1 2 1 0 1
North Cascades (n=19)
0.44 0 59.00 75 1 4 1 3 1 2 0
Seattle-King (n=13)
1.00 0 87.50 100 1 2 2 1 2 2 0
Southwest (n=15)
0.57 0 33.00 25 2 4 0 2 4 0 0
Northeast (n=4) 0.67 0 37.50 37.5 0 2 0 1 1 0 0
Columbia Plateau (n=4)
0.00 0 N/A N/A N/A N/A N/A N/A N/A N/A N/A
South Central (n=6)
Don’t know
Don’t know
60.00 60 0 1 0 1 0 0 0
The Palouse (n=3)
1.00 0 50.00 50 0 1 0 0 1 0 0
Total 0.58 0 54.07 50 6 22 5 15 13 4 1
*Reporting only the count of those who used the suggested unit of measurement.

84 Responsive Management
Picnic Areas (Local Provider Survey)
Region
*Number of Areas
Estimated Percent of Current
Demand Agency Meets
Method Used For Measuring Demand
(Number Giving Response)
Rating of Importance to Recreation in the
Service Area (Number Giving
Response)
Mean Median Mean (%)
Median (%)
Sta
ted
Go
al
or
Fo
rma
l A
sses
smen
t
Use
d
Pro
fess
ion
al
Ju
dg
men
t
Do
n’t
kn
ow
Hig
h
Med
ium
Lo
w
Do
n’t
kn
ow
The Islands (n=4)
4.50 4 97.50 100 1 3 0 1 3 0 0
Peninsulas (n=12)
3.50 1 72.67 72.5 1 5 1 3 4 0 0
The Coast (n=5) 3.80 2 75.00 75 0 3 1 0 3 0 1
North Cascades (n=19)
5.50 4 79.55 80 4 6 2 6 6 0 0
Seattle-King (n=13)
8.25 6 69.36 70 5 6 1 4 7 1 0
Southwest (n=15)
15.15 4 80.11 80 2 6 4 4 3 3 2
Northeast (n=4) 12.00 11 70.00 65 0 3 1 1 3 0 0
Columbia Plateau (n=4)
3.00 3 96.67 100 0 3 0 0 3 0 0
South Central (n=6)
10.60 7 70.00 72.5 1 1 3 1 3 0 1
The Palouse (n=3)
5.00 2 77.50 77.5 0 2 0 0 2 0 0
Total 8.85 4 77.46 80 14 38 13 20 37 4 4
*Reporting only the count of those who used the suggested unit of measurement.

Results of Provider Survey in Support of the Washington SCORP 85
Freshwater Beach Access Sites (Local Provider Survey)
Region
*Number of Access Sites
Estimated Percent of Current
Demand Agency Meets
Method Used For Measuring Demand
(Number Giving Response)
Rating of Importance to Recreation in the
Service Area (Number Giving
Response)
Mean Median Mean (%)
Median (%)
Sta
ted
Go
al
or
Fo
rma
l A
sses
smen
t
Use
d
Pro
fess
ion
al
Ju
dg
men
t
Do
n’t
kn
ow
Hig
h
Med
ium
Lo
w
Do
n’t
kn
ow
The Islands (n=4)
1.50 1.5 95.00 95 1 1 0 2 0 0 0
Peninsulas (n=12)
0.67 0 85.00 85 0 2 0 2 0 0 0
The Coast (n=5) 0.20 0 100.00 100 0 1 0 1 0 0 0
North Cascades (n=19)
2.42 0 77.86 75 1 5 1 4 2 1 0
Seattle-King (n=13)
1.09 0 82.60 98 1 3 2 3 3 0 0
Southwest (n=15)
1.79 1 42.14 50 2 6 2 7 1 1 1
Northeast (n=4) 2.50 1.5 41.50 41.5 0 2 0 2 0 0 0
Columbia Plateau (n=4)
0.75 0 75.00 75 0 1 0 1 0 0 0
South Central (n=6)
0.33 0 35.00 35 1 1 0 1 0 1 0
The Palouse (n=3)
Don’t know
Don’t know
15.00 15 0 1 0 0 0 1 0
Total 1.38 0 65.20 72.5 6 23 5 23 6 4 1
*Reporting only the count of those who used the suggested unit of measurement.

86 Responsive Management
Saltwater Beach Access Sites (Local Provider Survey)
Region
*Number of Access Sites
Estimated Percent of Current
Demand Agency Meets
Method Used For Measuring Demand
(Number Giving Response)
Rating of Importance to Recreation in the
Service Area (Number Giving
Response)
Mean Median Mean (%)
Median (%)
Sta
ted
Go
al
or
Fo
rma
l A
sses
smen
t
Use
d
Pro
fess
ion
al
Ju
dg
men
t
Do
n’t
kn
ow
Hig
h
Med
ium
Lo
w
Do
n’t
kn
ow
The Islands (n=4)
2.00 2 75.00 100 1 2 0 3 0 0
Peninsulas (n=12)
3.18 1 60.11 60 1 8 1 9 1 0
The Coast (n=5) 0.20 0 50.00 50 0 1 0 1 0 0
North Cascades (n=19)
1.37 0 56.67 50 0 5 1 6 0 0
Seattle-King (n=13)
1.42 0 84.00 95 3 3 0 6 0 0
Southwest (n=15)
0.86 0 76.67 80 0 2 2 3 0 1
Northeast (n=4) 0.00 0 N/A N/A N/A N/A N/A N/A N/A N/A N/A
Columbia Plateau (n=4)
0.00 0 N/A N/A N/A N/A N/A N/A N/A N/A N/A
South Central (n=6)
0.00 0 N/A N/A N/A N/A N/A N/A N/A N/A N/A
The Palouse (n=3)
0.00 0 N/A N/A N/A N/A N/A N/A N/A N/A N/A
Total 1.21 0 66.89 70 5 21 4 28 1 1
*Reporting only the count of those who used the suggested unit of measurement.

Results of Provider Survey in Support of the Washington SCORP 87
Boat Access Sites for Non-Motorized Boats Only (Local Provider Survey)
Region
*Number of Sites
Estimated Percent of Current
Demand Agency Meets
Method Used For Measuring Demand
(Number Giving Response)
Rating of Importance to Recreation in the
Service Area (Number Giving
Response)
Mean Median Mean (%)
Median (%)
Sta
ted
Go
al
or
Fo
rma
l A
sses
smen
t
Use
d
Pro
fess
ion
al
Ju
dg
men
t
Do
n’t
kn
ow
Hig
h
Med
ium
Lo
w
Do
n’t
kn
ow
The Islands (n=4)
2.50 2.5 78.75 82.5 1 3 0 4 0 0 0
Peninsulas (n=12)
0.75 1 63.57 70 1 6 1 5 2 1 0
The Coast (n=5) 20.40 1 66.67 50 0 3 0 3 0 0 0
North Cascades (n=19)
1.00 0 70.00 75 0 7 1 4 3 1 0
Seattle-King (n=13)
2.23 1 56.88 50 3 5 1 3 5 1 0
Southwest (n=15)
1.67 1 45.00 50 2 5 2 6 1 1 1
Northeast (n=4) 3.50 1.5 52.50 52.5 0 2 0 2 0 0 0
Columbia Plateau (n=4)
1.75 0 100.00 100 0 1 0 0 1 0 0
South Central (n=6)
0.40 0 30.00 30 1 1 1 1 0 1 1
The Palouse (n=3)
Don’t know
Don’t know
20.00 20 0 1 0 0 1 0 0
Total 2.58 1 58.95 50 8 34 6 28 13 5 2
*Reporting only the count of those who used the suggested unit of measurement.

88 Responsive Management
Boat Access Sites That Accommodate Motorized Craft (Local Provider Survey)
Region
*Number of Sites
Estimated Percent of Current
Demand Agency Meets
Method Used For Measuring Demand
(Number Giving Response)
Rating of Importance to Recreation in the
Service Area (Number Giving
Response)
Mean Median Mean Median
Sta
ted
Go
al
or
Fo
rma
l A
sses
smen
t
Use
d
Pro
fess
ion
al
Ju
dg
men
t
Do
n’t
kn
ow
Hig
h
Med
ium
Lo
w
Do
n’t
kn
ow
The Islands (n=4)
2.00 2 87.50 87.5 1 3 0 4 0 0 0
Peninsulas (n=12)
2.17 1 86.11 90 1 7 2 6 1 2 1
The Coast (n=5) 40.80 1 33.33 50 0 3 1 3 0 0 1
North Cascades (n=19)
1.95 1 78.00 85 1 8 2 7 1 3 0
Seattle-King (n=13)
0.54 0 78.33 100 1 4 2 4 0 3 0
Southwest (n=15)
24.33 1 72.00 75 0 7 3 7 2 0 1
Northeast (n=4) 3.75 0.5 65.00 65 0 2 0 1 0 1 0
Columbia Plateau (n=4)
1.75 0 95.00 95 0 1 0 1 0 0 0
South Central (n=6)
0.20 0 52.50 52.5 0 1 1 1 0 0 1
The Palouse (n=3)
0.33 0 25.00 25 0 1 0 0 1 0 0
Total 7.99 1 74.09 80 4 37 11 34 5 9 4
*Reporting only the count of those who used the suggested unit of measurement.

Results of Provider Survey in Support of the Washington SCORP 89
Pump-Out Stations (Local Provider Survey)
Region
*Number of Stations
Estimated Percent of Current
Demand Agency Meets
Method Used For Measuring Demand
(Number Giving Response)
Rating of Importance to Recreation in the
Service Area (Number Giving
Response)
Mean Median Mean (%)
Median (%)
Sta
ted
Go
al
or
Fo
rma
l A
sses
smen
t
Use
d
Pro
fess
ion
al
Ju
dg
men
t
Do
n’t
kn
ow
Hig
h
Med
ium
Lo
w
Do
n’t
kn
ow
The Islands (n=4)
0.50 0.5 100.00 100 1 1 0 2 0 0 0
Peninsulas (n=12)
0.92 0 79.00 80 1 4 1 3 2 1 0
The Coast (n=5) 1.00 1 50.00 50 0 3 1 3 0 0 1
North Cascades (n=19)
0.78 0 83.33 90 0 6 0 3 0 3 0
Seattle-King (n=13)
0.00 0 100.00 100 1 2 0 0 0 3 0
Southwest (n=15)
0.17 0 86.25 97.5 0 3 1 1 1 1 1
Northeast (n=4) 0.00 0 N/A N/A N/A N/A N/A N/A N/A N/A N/A
Columbia Plateau (n=4)
0.00 0 N/A N/A N/A N/A N/A N/A N/A N/A N/A
South Central (n=6)
0.17 0 80.00 80 0 1 0 1 0 0 0
The Palouse (n=3)
0.33 0 50.00 50 0 1 0 0 1 0 0
Total 0.45 0 80.80 95 3 21 3 13 4 8 2
*Reporting only the count of those who used the suggested unit of measurement.

90 Responsive Management
Outdoor Ice Skating Rinks (Local Provider Survey)
Region
*Number of Outdoor Rinks
Estimated Percent of Current
Demand Agency Meets
Method Used For Measuring Demand
(Number Giving Response)
Rating of Importance to Recreation in the
Service Area (Number Giving
Response)
Mean Median Mean (%)
Median (%)
Sta
ted
Go
al
or
Fo
rma
l A
sses
smen
t
Use
d
Pro
fess
ion
al
Ju
dg
men
t
Do
n’t
kn
ow
Hig
h
Med
ium
Lo
w
Do
n’t
kn
ow
The Islands (n=4)
0.00 0 N/A N/A N/A N/A N/A N/A N/A N/A N/A
Peninsulas (n=12)
0.00 0 N/A N/A N/A N/A N/A N/A N/A N/A N/A
The Coast (n=5) 0.00 0 N/A N/A N/A N/A N/A N/A N/A N/A N/A
North Cascades (n=19)
0.00 0 N/A N/A N/A N/A N/A N/A N/A N/A N/A
Seattle-King (n=13)
0.15 0 100.00 100 0 1 1 0 1 1 0
Southwest (n=15)
Don’t know
Don’t know
100.00 100 0 1 0 0 0 1 0
Northeast (n=4) Don’t know
Don’t know
50.00 50 0 1 0 0 0 1 0
Columbia Plateau (n=4)
0.25 0 10.00 10 0 1 0 0 0 1 0
South Central (n=6)
0.00 0 N/A N/A N/A N/A N/A N/A N/A N/A N/A
The Palouse (n=3)
0.00 0 N/A N/A N/A N/A N/A N/A N/A N/A N/A
Total 0.04 0 65.00 75 0 4 1 0 1 4 0
*Reporting only the count of those who used the suggested unit of measurement.

Results of Provider Survey in Support of the Washington SCORP 91
Designated Snow and Ice Trails (Local Provider Survey)
Region
*Number of Miles
Estimated Percent of Current
Demand Agency Meets
Method Used For Measuring Demand
(Number Giving Response)
Rating of Importance to Recreation in the
Service Area (Number Giving
Response)
Mean Median Mean (%)
Median (%)
Sta
ted
Go
al
or
Fo
rma
l A
sses
smen
t
Use
d
Pro
fess
ion
al
Ju
dg
men
t
Do
n’t
kn
ow
Hig
h
Med
ium
Lo
w
Do
n’t
kn
ow
The Islands (n=4)
0.00 0 N/A N/A N/A N/A N/A N/A N/A N/A N/A
Peninsulas (n=12)
0.00 0 N/A N/A N/A N/A N/A N/A N/A N/A N/A
The Coast (n=5) 0.00 0 N/A N/A N/A N/A N/A N/A N/A N/A N/A
North Cascades (n=19)
0.00 0 N/A N/A N/A N/A N/A N/A N/A N/A N/A
Seattle-King (n=13)
0.00 0 N/A N/A N/A N/A N/A N/A N/A N/A N/A
Southwest (n=15)
0.00 0 N/A N/A N/A N/A N/A N/A N/A N/A N/A
Northeast (n=4) 184.67 0 55.00 55 0 2 0 2 0 0 0
Columbia Plateau (n=4)
0.00 0 N/A N/A N/A N/A N/A N/A N/A N/A N/A
South Central (n=6)
0.17 0 10.00 10 1 0 0 0 0 1 0
The Palouse (n=3)
0.00 0 N/A N/A N/A N/A N/A N/A N/A N/A N/A
Total 6.61 0 40.00 25 1 2 0 2 0 1 0
*Reporting only the count of those who used the suggested unit of measurement.

92 Responsive Management
Downhill Skiing Areas (Local Provider Survey)
Region
*Number of Areas
Estimated Percent of Current
Demand Agency Meets
Method Used For Measuring Demand
(Number Giving Response)
Rating of Importance to Recreation in the
Service Area (Number Giving
Response)
Mean Median Mean (%)
Median (%)
Sta
ted
Go
al
or
Fo
rma
l A
sses
smen
t
Use
d
Pro
fess
ion
al
Ju
dg
men
t
Do
n’t
kn
ow
Hig
h
Med
ium
Lo
w
Do
n’t
kn
ow
The Islands (n=4)
0.00 0 N/A N/A N/A N/A N/A N/A N/A N/A N/A
Peninsulas (n=12)
0.00 0 N/A N/A N/A N/A N/A N/A N/A N/A N/A
The Coast (n=5) 0.00 0 N/A N/A N/A N/A N/A N/A N/A N/A N/A
North Cascades (n=19)
0.00 0 N/A N/A N/A N/A N/A N/A N/A N/A N/A
Seattle-King (n=13)
0.00 0 N/A N/A N/A N/A N/A N/A N/A N/A N/A
Southwest (n=15)
0.00 0 N/A N/A N/A N/A N/A N/A N/A N/A N/A
Northeast (n=4) 0.25 0 90.00 90 0 1 0 1 0 0 0
Columbia Plateau (n=4)
0.00 0 N/A N/A N/A N/A N/A N/A N/A N/A N/A
South Central (n=6)
0.00 0 N/A N/A N/A N/A N/A N/A N/A N/A N/A
The Palouse (n=3)
0.00 0 N/A N/A N/A N/A N/A N/A N/A N/A N/A
Total 0.01 0 90.00 90 0 1 0 1 0 0 0
*Reporting only the count of those who used the suggested unit of measurement.

Results of Provider Survey in Support of the Washington SCORP 93
Air Activities (Local Provider Survey)
Region
*Number of Sites
Estimated Percent of Current
Demand Agency Meets
Method Used For Measuring Demand
(Number Giving Response)
Rating of Importance to Recreation in the
Service Area (Number Giving
Response)
Mean Median Mean (%)
Median (%)
Sta
ted
Go
al
or
Fo
rma
l A
sses
smen
t
Use
d
Pro
fess
ion
al
Ju
dg
men
t
Do
n’t
kn
ow
Hig
h
Med
ium
Lo
w
Do
n’t
kn
ow
The Islands (n=4)
0.00 0 N/A N/A N/A N/A N/A N/A N/A N/A N/A
Peninsulas (n=12)
0.17 0 70.00 70 0 2 0 1 1 0 0
The Coast (n=5) 0.00 0 N/A N/A N/A N/A N/A N/A N/A N/A N/A
North Cascades (n=19)
0.32 0 99.00 100 1 3 1 1 0 4 0
Seattle-King (n=13)
0.23 0 0.00 0 0 0 1 0 0 0 1
Southwest (n=15)
0.13 0 100.00 100 0 1 1 0 2 0 0
Northeast (n=4) 0.00 0 N/A N/A N/A N/A N/A N/A N/A N/A N/A
Columbia Plateau (n=4)
0.00 0 N/A N/A N/A N/A N/A N/A N/A N/A N/A
South Central (n=6)
0.20 0 100.00 100 0 2 0 1 0 1 0
The Palouse (n=3)
0.33 0 100.00 100 0 1 0 0 0 1 0
Total 0.18 0 94.09 100 1 9 3 3 3 6 1
*Reporting only the count of those who used the suggested unit of measurement.

94 Responsive Management
Dog Parks (Local Provider Survey)
Region
*Number of Parks
Estimated Percent of Current
Demand Agency Meets
Method Used For Measuring Demand
(Number Giving Response)
Rating of Importance to Recreation in the
Service Area (Number Giving
Response)
Mean Median Mean (%)
Median (%)
Sta
ted
Go
al
or
Fo
rma
l A
sses
smen
t
Use
d
Pro
fess
ion
al
Ju
dg
men
t
Do
n’t
kn
ow
Hig
h
Med
ium
Lo
w
Do
n’t
kn
ow
The Islands (n=4)
0.00 0 N/A N/A N/A N/A N/A N/A N/A N/A N/A
Peninsulas (n=12)
0.33 0 37.00 37 0 2 0 2 0 0 0
The Coast (n=5) 0.00 0 N/A N/A N/A N/A N/A N/A N/A N/A N/A
North Cascades (n=19)
0.44 0 57.50 62.5 2 4 1 2 3 2 0
Seattle-King (n=13)
0.85 0 50.00 25 2 1 1 3 1 0 0
Southwest (n=15)
0.79 0 47.60 40 1 4 2 5 1 0 1
Northeast (n=4) 0.33 0 41.50 41.5 0 2 0 1 1 0 0
Columbia Plateau (n=4)
0.00 0 N/A N/A N/A N/A N/A N/A N/A N/A N/A
South Central (n=6)
0.00 0 N/A N/A N/A N/A N/A N/A N/A N/A N/A
The Palouse (n=3)
0.33 0 60.00 60 0 1 0 1 0 0 0
Total 0.44 0 50.00 50 5 14 4 14 6 2 1
*Reporting only the count of those who used the suggested unit of measurement.

Results of Provider Survey in Support of the Washington SCORP 95
Surfaced Trails (Total) (Local Provider Survey)
Region
*Number of Miles
Estimated Percent of Current
Demand Agency Meets
Method Used For Measuring Demand
(Number Giving Response)
Rating of Importance to Recreation in the
Service Area (Number Giving
Response)
Mean Median Mean (%)
Median (%)
Sta
ted
Go
al
or
Fo
rma
l A
sses
smen
t
Use
d
Pro
fess
ion
al
Ju
dg
men
t
Do
n’t
kn
ow
Hig
h
Med
ium
Lo
w
Do
n’t
kn
ow
The Islands (n=4)
2.50 2.5 55.00 55 2 1 0 3 0 0 0
Peninsulas (n=12)
9.50 0.5 46.00 50 1 4 1 1 4 1 0
The Coast (n=5) 2.40 0 60.00 60 0 2 0 2 0 0 0
North Cascades (n=19)
5.50 1 57.08 72.5 3 8 1 9 1 2 0
Seattle-King (n=13)
14.06 1.5 77.00 80 3 2 1 5 1 0 0
Southwest (n=15)
8.32 0.5 48.29 55 1 5 2 6 1 0 1
Northeast (n=4) 19.75 17 27.50 25 0 4 0 2 1 1 0
Columbia Plateau (n=4)
1.75 0.5 50.00 50 1 1 0 1 1 0 0
South Central (n=6)
2.70 0 53.33 60 1 2 0 3 0 0 0
The Palouse (n=3)
7.33 2 60.00 60 0 2 0 1 0 1 0
Total 7.89 1 53.59 52.5 12 31 5 33 9 5 1
*Reporting only the count of those who used the suggested unit of measurement.

96 Responsive Management
Unsurfaced Trails (Total) (Local Provider Survey)
Region
*Number of Miles
Estimated Percent of Current
Demand Agency Meets
Method Used For Measuring Demand
(Number Giving Response)
Rating of Importance to Recreation in the
Service Area (Number Giving
Response)
Mean Median Mean (%)
Median (%)
Sta
ted
Go
al
or
Fo
rma
l A
sses
smen
t
Use
d
Pro
fess
ion
al
Ju
dg
men
t
Do
n’t
kn
ow
Hig
h
Med
ium
Lo
w
Do
n’t
kn
ow
The Islands (n=4)
3.75 3.005 58.33 50 2 2 0 2 0 1 1
Peninsulas (n=12)
8.33 0 42.50 50 1 3 1 1 3 1 0
The Coast (n=5) 1.40 1 56.67 50 0 2 1 2 1 0 0
North Cascades (n=19)
14.16 2 57.92 50 3 8 1 9 0 3 0
Seattle-King (n=13)
8.89 2.625 62.86 75 4 3 0 4 3 0 0
Southwest (n=15)
3.82 1 58.50 60 1 8 0 6 3 0 0
Northeast (n=4) 139.25 29 46.67 25 0 3 0 3 0 0 0
Columbia Plateau (n=4)
0.25 0 50.00 50 0 1 0 0 1 0 0
South Central (n=6)
585.08 0.25 56.67 60 1 2 0 1 2 0 0
The Palouse (n=3)
0.67 0 62.50 62.5 0 1 0 0 1 0 0
Total 55.68 1 56.59 50 12 33 3 28 14 5 1
*Reporting only the count of those who used the suggested unit of measurement.

Results of Provider Survey in Support of the Washington SCORP 97
Surfaced Trails Appropriate for Bicycles (Local Provider Survey)
Region
*Number of Miles
Estimated Percent of Current
Demand Agency Meets
Method Used For Measuring Demand
(Number Giving Response)
Rating of Importance to Recreation in the
Service Area (Number Giving
Response)
Mean Median Mean (%)
Median (%)
Sta
ted
Go
al
or
Fo
rma
l A
sses
smen
t
Use
d
Pro
fess
ion
al
Ju
dg
men
t
Do
n’t
kn
ow
Hig
h
Med
ium
Lo
w
Do
n’t
kn
ow
The Islands (n=4)
2.50 1 55.00 55 1 1 0 2 0 0 0
Peninsulas (n=12)
0.08 0 1.00 1 1 0 0 0 0 1 0
The Coast (n=5) 2.40 0 60.00 60 0 2 0 2 0 0 0
North Cascades (n=19)
5.02 0 53.75 60 1 6 1 6 0 2 0
Seattle-King (n=13)
2.92 0 77.50 85 2 2 0 3 1 0 0
Southwest (n=15)
3.11 0 43.83 45 1 4 1 4 1 0 1
Northeast (n=4) 13.00 7.5 37.50 37.5 0 2 0 1 0 1 0
Columbia Plateau (n=4)
0.25 0 50.00 50 0 1 0 0 1 0 0
South Central (n=6)
502.50 4.5 47.50 45 1 3 0 4 0 0 0
The Palouse (n=3)
6.67 0 70.00 70 0 1 0 0 1 0 0
Total 33.93 0 52.23 50 7 22 2 22 4 4 1
*Reporting only the count of those who used the suggested unit of measurement.

98 Responsive Management
Unsurfaced Trails Appropriate for Bicycles (Local Provider Survey)
Region
*Number of Miles
Estimated Percent of Current
Demand Agency Meets
Method Used For Measuring Demand
(Number Giving Response)
Rating of Importance to Recreation in the
Service Area (Number Giving
Response)
Mean Median Mean (%)
Median (%)
Sta
ted
Go
al
or
Fo
rma
l A
sses
smen
t
Use
d
Pro
fess
ion
al
Ju
dg
men
t
Do
n’t
kn
ow
Hig
h
Med
ium
Lo
w
Do
n’t
kn
ow
The Islands (n=4)
3.25 2.505 62.50 62.5 1 1 0 2 0 0 0
Peninsulas (n=12)
3.33 0 50.00 50 0 1 0 0 0 1 0
The Coast (n=5) 1.00 0 20.00 20 0 1 0 1 0 0 0
North Cascades (n=19)
3.83 0 55.00 55 2 6 1 6 1 2 0
Seattle-King (n=13)
4.83 0 80.00 100 1 2 0 2 1 0 0
Southwest (n=15)
1.21 0 37.00 30 1 5 0 3 0 2 1
Northeast (n=4) 126.00 27 53.33 50 0 3 0 2 0 1 0
Columbia Plateau (n=4)
0.00 0 N/A N/A N/A N/A N/A N/A N/A N/A N/A
South Central (n=6)
0.50 0 10.00 10 1 0 0 1 0 0 0
The Palouse (n=3)
0.67 0 50.00 50 0 1 0 0 1 0 0
Total 8.61 0 51.15 50 6 20 1 17 3 6 1
*Reporting only the count of those who used the suggested unit of measurement.

Results of Provider Survey in Support of the Washington SCORP 99
Equestrian Facilities (Local Provider Survey)
Region
*Number of Facilities
Estimated Percent of Current
Demand Agency Meets
Method Used For Measuring Demand
(Number Giving Response)
Rating of Importance to Recreation in the
Service Area (Number Giving
Response)
Mean Median Mean (%)
Median (%)
Sta
ted
Go
al
or
Fo
rma
l A
sses
smen
t
Use
d
Pro
fess
ion
al
Ju
dg
men
t
Do
n’t
kn
ow
Hig
h
Med
ium
Lo
w
Do
n’t
kn
ow
The Islands (n=4)
0.00 0 N/A N/A N/A N/A N/A N/A N/A N/A N/A
Peninsulas (n=12)
0.08 0 50.00 50 0 1 0 0 1 0 0
The Coast (n=5) 0.00 0 N/A N/A N/A N/A N/A N/A N/A N/A N/A
North Cascades (n=19)
0.26 0 87.50 87.5 0 2 0 1 0 1 0
Seattle-King (n=13)
0.25 0 87.50 87.5 1 1 1 2 1 0 0
Southwest (n=15)
0.15 0 50.00 50 0 2 0 0 2 0 0
Northeast (n=4) Don’t know
Don’t know
60.00 60 0 1 0 1 0 0 0
Columbia Plateau (n=4)
0.00 0 N/A N/A N/A N/A N/A N/A N/A N/A N/A
South Central (n=6)
0.17 0 0.00 0 0 0 1 0 1 0 0
The Palouse (n=3)
0.00 0 N/A N/A N/A N/A N/A N/A N/A N/A N/A
Total 0.15 0 70.00 75 1 7 2 4 5 1 0
*Reporting only the count of those who used the suggested unit of measurement.

100 Responsive Management
Designated Bridle Trails (Local Provider Survey)
Region
*Number of Miles
Estimated Percent of Current
Demand Agency Meets
Method Used For Measuring Demand
(Number Giving Response)
Rating of Importance to Recreation in the
Service Area (Number Giving
Response)
Mean Median Mean (%)
Median (%)
Sta
ted
Go
al
or
Fo
rma
l A
sses
smen
t
Use
d
Pro
fess
ion
al
Ju
dg
men
t
Do
n’t
kn
ow
Hig
h
Med
ium
Lo
w
Do
n’t
kn
ow
The Islands (n=4)
1.75 1 17.50 17.5 0 2 0 1 1 0 0
Peninsulas (n=12)
8.17 0 87.00 87 0 2 0 0 0 2 0
The Coast (n=5) 0.20 0 0.00 0 0 1 0 0 0 1 0
North Cascades (n=19)
1.16 0 37.50 37.5 1 1 1 0 2 1 0
Seattle-King (n=13)
0.82 0 75.00 75 1 2 0 2 1 0 0
Southwest (n=15)
1.21 0 50.00 50 0 1 1 1 0 1 0
Northeast (n=4) 78.50 7.5 47.50 47.5 0 2 0 2 0 0 0
Columbia Plateau (n=4)
0.00 0 N/A N/A N/A N/A N/A N/A N/A N/A N/A
South Central (n=6)
0.00 0 N/A N/A N/A N/A N/A N/A N/A N/A N/A
The Palouse (n=3)
0.00 0 N/A N/A N/A N/A N/A N/A N/A N/A N/A
Total 5.71 0 48.25 50 2 11 2 6 4 5 0
*Reporting only the count of those who used the suggested unit of measurement.

Results of Provider Survey in Support of the Washington SCORP 101
Designated Motorized Trails (Local Provider Survey)
Region
*Number of Miles
Estimated Percent of Current
Demand Agency Meets
Method Used For Measuring Demand
(Number Giving Response)
Rating of Importance to Recreation in the
Service Area (Number Giving
Response)
Mean Median Mean (%)
Median (%)
Sta
ted
Go
al
or
Fo
rma
l A
sses
smen
t
Use
d
Pro
fess
ion
al
Ju
dg
men
t
Do
n’t
kn
ow
Hig
h
Med
ium
Lo
w
Do
n’t
kn
ow
The Islands (n=4)
0.00 0 N/A N/A N/A N/A N/A N/A N/A N/A N/A
Peninsulas (n=12)
0.08 0 40.00 40 0 1 0 0 1 0 0
The Coast (n=5) 0.00 0 N/A N/A N/A N/A N/A N/A N/A N/A N/A
North Cascades (n=19)
0.53 0 0.00 0 0 0 1 0 0 0 1
Seattle-King (n=13)
0.00 0 N/A N/A N/A N/A N/A N/A N/A N/A N/A
Southwest (n=15)
0.00 0 N/A N/A N/A N/A N/A N/A N/A N/A N/A
Northeast (n=4) 46.50 8 50.00 50 0 2 0 2 0 0 0
Columbia Plateau (n=4)
0.00 0 N/A N/A N/A N/A N/A N/A N/A N/A N/A
South Central (n=6)
0.00 0 N/A N/A N/A N/A N/A N/A N/A N/A N/A
The Palouse (n=3)
0.00 0 N/A N/A N/A N/A N/A N/A N/A N/A N/A
Total 2.35 0 46.67 50 3 1 0 1
*Reporting only the count of those who used the suggested unit of measurement.

102 Responsive Management
Designated Motorized Areas Without Trails (Local Provider Survey)
Region
*Number of Areas
Estimated Percent of Current
Demand Agency Meets
Method Used For Measuring Demand
(Number Giving Response)
Rating of Importance to Recreation in the
Service Area (Number Giving
Response)
Mean Median Mean (%)
Median (%)
Sta
ted
Go
al
or
Fo
rma
l A
sses
smen
t
Use
d
Pro
fess
ion
al
Ju
dg
men
t
Do
n’t
kn
ow
Hig
h
Med
ium
Lo
w
Do
n’t
kn
ow
The Islands (n=4)
0.00 0 N/A N/A N/A N/A N/A N/A N/A N/A N/A
Peninsulas (n=12)
0.00 0 N/A N/A N/A N/A N/A N/A N/A N/A N/A
The Coast (n=5) 0.00 0 N/A N/A N/A N/A N/A N/A N/A N/A N/A
North Cascades (n=19)
0.00 0 N/A N/A N/A N/A N/A N/A N/A N/A N/A
Seattle-King (n=13)
0.00 0 N/A N/A N/A N/A N/A N/A N/A N/A N/A
Southwest (n=15)
0.00 0 N/A N/A N/A N/A N/A N/A N/A N/A N/A
Northeast (n=4) 0.50 0 50.00 50 0 1 0 1 0 0 0
Columbia Plateau (n=4)
0.00 0 N/A N/A N/A N/A N/A N/A N/A N/A N/A
South Central (n=6)
0.00 0 N/A N/A N/A N/A N/A N/A N/A N/A N/A
The Palouse (n=3)
0.00 0 N/A N/A N/A N/A N/A N/A N/A N/A N/A
Total 0.02 0 50.00 50 0 1 0 1 0 0 0
*Reporting only the count of those who used the suggested unit of measurement.

Results of Provider Survey in Support of the Washington SCORP 103
Campgrounds (Local Provider Survey)
Region
*Number of Campgrounds
Estimated Percent of Current
Demand Agency Meets
Method Used For Measuring Demand
(Number Giving Response)
Rating of Importance to Recreation in the
Service Area (Number Giving
Response)
Mean Median Mean (%)
Median (%)
Sta
ted
Go
al
or
Fo
rma
l A
sses
smen
t
Use
d
Pro
fess
ion
al
Ju
dg
men
t
Do
n’t
kn
ow
Hig
h
Med
ium
Lo
w
Do
n’t
kn
ow
The Islands (n=4)
0.25 0 25.00 25 1 0 0 1 0 0 0
Peninsulas (n=12)
4.92 0 46.00 46 0 2 0 2 0 0 0
The Coast (n=5) 0.40 0 50.00 50 0 1 0 1 0 0 0
North Cascades (n=19)
0.67 0 81.00 75 2 3 1 5 1 0 0
Seattle-King (n=13)
Don’t know
Don’t know
50.00 50 0 1 0 0 1 0 0
Southwest (n=15)
0.31 0 100.00 100 0 2 0 0 1 1 0
Northeast (n=4) 7.00 0.5 56.50 56.5 0 2 0 2 0 0 0
Columbia Plateau (n=4)
0.25 0 50.00 50 0 1 0 1 0 0 0
South Central (n=6)
0.50 0 57.50 57.5 1 0 1 0 1 0 1
The Palouse (n=3)
0.67 1 67.50 67.5 0 2 0 1 1 0 0
Total 1.38 0 63.06 70 4 14 2 13 5 1 1
*Reporting only the count of those who used the suggested unit of measurement.

104 Responsive Management
Designated Hunting Areas (Local Provider Survey)
Region
*Number of Acres
Estimated Percent of Current
Demand Agency Meets
Method Used For Measuring Demand
(Number Giving Response)
Rating of Importance to Recreation in the
Service Area (Number Giving
Response)
Mean Median Mean (%)
Median (%)
Sta
ted
Go
al
or
Fo
rma
l A
sses
smen
t
Use
d
Pro
fess
ion
al
Ju
dg
men
t
Do
n’t
kn
ow
Hig
h
Med
ium
Lo
w
Do
n’t
kn
ow
The Islands (n=4)
0.00 0 N/A N/A N/A N/A N/A N/A N/A N/A N/A
Peninsulas (n=12)
8.33 0 15.00 15 0 1 0 0 0 1 0
The Coast (n=5) 0.00 0 N/A N/A N/A N/A N/A N/A N/A N/A N/A
North Cascades (n=19)
0.00 0 N/A N/A N/A N/A N/A N/A N/A N/A N/A
Seattle-King (n=13)
0.00 0 N/A N/A N/A N/A N/A N/A N/A N/A N/A
Southwest (n=15)
0.00 0 N/A N/A N/A N/A N/A N/A N/A N/A N/A
Northeast (n=4) 325,000 0 100.00 100 0 1 0 1 0 0 0
Columbia Plateau (n=4)
1.25 0 80.00 80 0 1 0 0 1 0 0
South Central (n=6)
0.00 0 N/A N/A N/A N/A N/A N/A N/A N/A N/A
The Palouse (n=3)
0.00 0 N/A N/A N/A N/A N/A N/A N/A N/A N/A
Total 15,477 0 65.00 80 0 3 0 1 1 1 0
*Reporting only the count of those who used the suggested unit of measurement.

Results of Provider Survey in Support of the Washington SCORP 105
Shooting Ranges (Total) (Local Provider Survey)
Region
*Number of Ranges
Estimated Percent of Current
Demand Agency Meets
Method Used For Measuring Demand
(Number Giving Response)
Rating of Importance to Recreation in the
Service Area (Number Giving
Response)
Mean Median Mean (%)
Median (%)
Sta
ted
Go
al
or
Fo
rma
l A
sses
smen
t
Use
d
Pro
fess
ion
al
Ju
dg
men
t
Do
n’t
kn
ow
Hig
h
Med
ium
Lo
w
Do
n’t
kn
ow
The Islands (n=4)
0.00 0 N/A N/A N/A N/A N/A N/A N/A N/A N/A
Peninsulas (n=12)
0.00 0 N/A N/A N/A N/A N/A N/A N/A N/A N/A
The Coast (n=5) 0.00 0 N/A N/A N/A N/A N/A N/A N/A N/A N/A
North Cascades (n=19)
0.11 0 87.50 87.5 1 1 0 1 1 0 0
Seattle-King (n=13)
0.08 0 100.00 100 0 1 0 0 0 1 0
Southwest (n=15)
0.07 0 0.00 0 0 0 1 1 0 0 0
Northeast (n=4) 0.00 0 N/A N/A N/A N/A N/A N/A N/A N/A N/A
Columbia Plateau (n=4)
0.00 0 N/A N/A N/A N/A N/A N/A N/A N/A N/A
South Central (n=6)
0.00 0 N/A N/A N/A N/A N/A N/A N/A N/A N/A
The Palouse (n=3)
0.00 0 N/A N/A N/A N/A N/A N/A N/A N/A N/A
Total 0.05 0 91.67 100 1 2 1 2 1 1 0
*Reporting only the count of those who used the suggested unit of measurement.

106 Responsive Management
Shooting Ranges That Accommodate Archery (Local Provider Survey)
Region
*Number of Ranges
Estimated Percent of Current
Demand Agency Meets
Method Used For Measuring Demand
(Number Giving Response)
Rating of Importance to Recreation in the
Service Area (Number Giving
Response)
Mean Median Mean (%)
Median (%)
Sta
ted
Go
al
or
Fo
rma
l A
sses
smen
t
Use
d
Pro
fess
ion
al
Ju
dg
men
t
Do
n’t
kn
ow
Hig
h
Med
ium
Lo
w
Do
n’t
kn
ow
The Islands (n=4)
0.00 0 N/A N/A N/A N/A N/A N/A N/A N/A N/A
Peninsulas (n=12)
0.00 0 N/A N/A N/A N/A N/A N/A N/A N/A N/A
The Coast (n=5) 0.00 0 N/A N/A N/A N/A N/A N/A N/A N/A N/A
North Cascades (n=19)
0.05 0 80.00 80 0 1 0 1 0 0 0
Seattle-King (n=13)
0.08 0 100.00 100 0 1 0 0 0 1 0
Southwest (n=15)
0.00 0 N/A N/A N/A N/A N/A N/A N/A N/A N/A
Northeast (n=4) 0.00 0 N/A N/A N/A N/A N/A N/A N/A N/A N/A
Columbia Plateau (n=4)
0.00 0 N/A N/A N/A N/A N/A N/A N/A N/A N/A
South Central (n=6)
0.00 0 N/A N/A N/A N/A N/A N/A N/A N/A N/A
The Palouse (n=3)
0.00 0 N/A N/A N/A N/A N/A N/A N/A N/A N/A
Total 0.02 0 90.00 90 0 2 0 1 0 1 0
*Reporting only the count of those who used the suggested unit of measurement.

Results of Provider Survey in Support of the Washington SCORP 107
Shooting Ranges That Accommodate Rifle / Handgun (Local Provider Survey)
Region
*Number of Ranges
Estimated Percent of Current
Demand Agency Meets
Method Used For Measuring Demand
(Number Giving Response)
Rating of Importance to Recreation in the
Service Area (Number Giving
Response)
Mean Median Mean (%)
Median (%)
Sta
ted
Go
al
or
Fo
rma
l A
sses
smen
t
Use
d
Pro
fess
ion
al
Ju
dg
men
t
Do
n’t
kn
ow
Hig
h
Med
ium
Lo
w
Do
n’t
kn
ow
The Islands (n=4)
0.00 0 N/A N/A N/A N/A N/A N/A N/A N/A N/A
Peninsulas (n=12)
0.00 0 N/A N/A N/A N/A N/A N/A N/A N/A N/A
The Coast (n=5) 0.00 0 N/A N/A N/A N/A N/A N/A N/A N/A N/A
North Cascades (n=19)
0.05 0 100.00 100 0 1 0 1 0 0 0
Seattle-King (n=13)
0.08 0 100.00 100 0 1 0 0 0 1 0
Southwest (n=15)
0.07 0 0.00 0 0 0 1 1 0 0 0
Northeast (n=4) 0.00 0 N/A N/A N/A N/A N/A N/A N/A N/A N/A
Columbia Plateau (n=4)
0.00 0 N/A N/A N/A N/A N/A N/A N/A N/A N/A
South Central (n=6)
0.00 0 N/A N/A N/A N/A N/A N/A N/A N/A N/A
The Palouse (n=3)
0.00 0 N/A N/A N/A N/A N/A N/A N/A N/A N/A
Total 0.04 0 100.00 100 0 2 1 2 0 1 0
*Reporting only the count of those who used the suggested unit of measurement.

108 Responsive Management
Shooting Ranges That Accommodate Skeet / Trap / Clay / Target Games (Local Provider Survey)
Region
*Number of Ranges
Estimated Percent of Current
Demand Agency Meets
Method Used For Measuring Demand
(Number Giving Response)
Rating of Importance to Recreation in the
Service Area (Number Giving
Response)
Mean Median Mean (%)
Median (%)
Sta
ted
Go
al
or
Fo
rma
l A
sses
smen
t
Use
d
Pro
fess
ion
al
Ju
dg
men
t
Do
n’t
kn
ow
Hig
h
Med
ium
Lo
w
Do
n’t
kn
ow
The Islands (n=4)
0.00 0 N/A N/A N/A N/A N/A N/A N/A N/A N/A
Peninsulas (n=12)
0.00 0 N/A N/A N/A N/A N/A N/A N/A N/A N/A
The Coast (n=5) 0.00 0 N/A N/A N/A N/A N/A N/A N/A N/A N/A
North Cascades (n=19)
0.11 0 62.50 62.5 1 1 0 0 2 0 0
Seattle-King (n=13)
0.00 0 N/A N/A N/A N/A N/A N/A N/A N/A N/A
Southwest (n=15)
0.00 0 N/A N/A N/A N/A N/A N/A N/A N/A N/A
Northeast (n=4) 0.00 0 N/A N/A N/A N/A N/A N/A N/A N/A N/A
Columbia Plateau (n=4)
0.00 0 N/A N/A N/A N/A N/A N/A N/A N/A N/A
South Central (n=6)
0.00 0 N/A N/A N/A N/A N/A N/A N/A N/A N/A
The Palouse (n=3)
0.00 0 N/A N/A N/A N/A N/A N/A N/A N/A N/A
Total 0.02 0 62.50 62.5 1 1 0 0 2 0 0
*Reporting only the count of those who used the suggested unit of measurement.

Results of Provider Survey in Support of the Washington SCORP 109
Equipped Playgrounds / Play Areas (Local Provider Survey)
Region
*Number of Playgrounds
Estimated Percent of Current
Demand Agency Meets
Method Used For Measuring Demand
(Number Giving Response)
Rating of Importance to Recreation in the
Service Area (Number Giving
Response)
Mean Median Mean (%)
Median (%)
Sta
ted
Go
al
or
Fo
rma
l A
sses
smen
t
Use
d
Pro
fess
ion
al
Ju
dg
men
t
Do
n’t
kn
ow
Hig
h
Med
ium
Lo
w
Do
n’t
kn
ow
The Islands (n=4)
1.50 2 96.67 100 1 2 0 2 1 0 0
Peninsulas (n=12)
2.25 1 48.50 40.5 2 4 1 2 4 1 0
The Coast (n=5) 2.20 0 62.50 62.5 0 2 0 1 1 0 0
North Cascades (n=19)
4.72 2 69.00 75 4 6 1 6 3 2 0
Seattle-King (n=13)
9.85 6 71.60 77.5 5 5 1 4 6 1 0
Southwest (n=15)
14.71 3.5 77.00 77.5 1 5 3 4 2 2 1
Northeast (n=4) 7.67 7 73.33 80 1 2 0 2 1 0 0
Columbia Plateau (n=4)
1.50 1 70.00 90 0 3 0 1 2 0 0
South Central (n=6)
4.50 3.5 55.00 60 1 1 2 2 2 0 0
The Palouse (n=3)
2.67 0 75.00 75 0 1 0 1 0 0 0
Total 6.43 2 69.46 75 15 31 8 25 22 6 1
*Reporting only the count of those who used the suggested unit of measurement.

110 Responsive Management
Outdoor Tracks for Running / Jogging (Local Provider Survey)
Region
*Number of Outdoor Tracks
Estimated Percent of Current
Demand Agency Meets
Method Used For Measuring Demand
(Number Giving Response)
Rating of Importance to Recreation in the
Service Area (Number Giving
Response)
Mean Median Mean (%)
Median (%)
Sta
ted
Go
al
or
Fo
rma
l A
sses
smen
t
Use
d
Pro
fess
ion
al
Ju
dg
men
t
Do
n’t
kn
ow
Hig
h
Med
ium
Lo
w
Do
n’t
kn
ow
The Islands (n=4)
0.00 0 N/A N/A N/A N/A N/A N/A N/A N/A N/A
Peninsulas (n=12)
0.00 0 N/A N/A N/A N/A N/A N/A N/A N/A N/A
The Coast (n=5) 0.20 0 25.00 25 0 1 0 0 1 0 0
North Cascades (n=19)
0.00 0 N/A N/A N/A N/A N/A N/A N/A N/A N/A
Seattle-King (n=13)
0.54 0 91.67 100 2 1 0 0 2 1 0
Southwest (n=15)
0.07 0 87.50 87.5 0 1 1 0 0 1 1
Northeast (n=4) 1.00 0.5 100.00 100 0 2 0 0 2 0 0
Columbia Plateau (n=4)
0.00 0 N/A N/A N/A N/A N/A N/A N/A N/A N/A
South Central (n=6)
0.00 0 N/A N/A N/A N/A N/A N/A N/A N/A N/A
The Palouse (n=3)
0.33 0 75.00 75 0 1 0 0 0 1 0
Total 0.17 0 81.25 87.5 2 6 1 0 5 3 1
*Reporting only the count of those who used the suggested unit of measurement.

Results of Provider Survey in Support of the Washington SCORP 111
Outdoor Swimming Pools (Local Provider Survey)
Region
*Number of Outdoor Pools
Estimated Percent of Current
Demand Agency Meets
Method Used For Measuring Demand
(Number Giving Response)
Rating of Importance to Recreation in the
Service Area (Number Giving
Response)
Mean Median Mean (%)
Median (%)
Sta
ted
Go
al
or
Fo
rma
l A
sses
smen
t
Use
d
Pro
fess
ion
al
Ju
dg
men
t
Do
n’t
kn
ow
Hig
h
Med
ium
Lo
w
Do
n’t
kn
ow
The Islands (n=4)
0.00 0 N/A N/A N/A N/A N/A N/A N/A N/A N/A
Peninsulas (n=12)
0.00 0 N/A N/A N/A N/A N/A N/A N/A N/A N/A
The Coast (n=5) 0.20 0 0.00 0 0 1 0 0 1 0 0
North Cascades (n=19)
0.16 0 83.33 100 2 1 0 1 2 0 0
Seattle-King (n=13)
0.15 0 85.00 85 1 1 0 2 0 0 0
Southwest (n=15)
0.20 0 80.00 80 0 2 0 2 0 0 0
Northeast (n=4) 1.00 1 88.67 100 1 2 0 2 1 0 0
Columbia Plateau (n=4)
0.00 0 N/A N/A N/A N/A N/A N/A N/A N/A N/A
South Central (n=6)
0.33 0 82.50 82.5 0 1 1 2 0 0 0
The Palouse (n=3)
0.67 0 50.00 50 0 1 0 1 0 0 0
Total 0.19 0 75.46 80 4 9 1 10 4 0 0
*Reporting only the count of those who used the suggested unit of measurement.

112 Responsive Management
Roller Skating / Skateboard Parks (Local Provider Survey)
Region
*Number of Parks
Estimated Percent of Current
Demand Agency Meets
Method Used For Measuring Demand
(Number Giving Response)
Rating of Importance to Recreation in the
Service Area (Number Giving
Response)
Mean Median Mean (%)
Median (%)
Sta
ted
Go
al
or
Fo
rma
l A
sses
smen
t
Use
d
Pro
fess
ion
al
Ju
dg
men
t
Do
n’t
kn
ow
Hig
h
Med
ium
Lo
w
Do
n’t
kn
ow
The Islands (n=4)
0.50 0.5 95.00 95 0 2 0 1 1 0 0
Peninsulas (n=12)
0.33 0 57.67 80 0 2 0 0 2 0 0
The Coast (n=5) 0.20 0 100.00 100 0 1 0 0 0 0 1
North Cascades (n=19)
0.33 0 68.57 50 1 5 1 3 4 0 0
Seattle-King (n=13)
0.85 1 69.38 77.5 4 3 1 3 5 0 0
Southwest (n=15)
1.23 0 64.17 55 1 4 2 1 2 3 1
Northeast (n=4) 0.33 0 60.00 60 0 2 0 0 2 0 0
Columbia Plateau (n=4)
0.25 0 50.00 50 0 1 0 1 0 0 0
South Central (n=6)
0.33 0 87.50 87.5 0 1 0 1 0 0 0
The Palouse (n=3)
0.33 0 62.50 62.5 0 1 0 1 0 0 0
Total 0.56 0 69.21 75 6 22 4 11 16 3 2
*Reporting only the count of those who used the suggested unit of measurement.

Results of Provider Survey in Support of the Washington SCORP 113
Basketball Courts (Local Provider Survey)
Region
*Number of Courts
Estimated Percent of Current
Demand Agency Meets
Method Used For Measuring Demand
(Number Giving Response)
Rating of Importance to Recreation in the
Service Area (Number Giving
Response)
Mean Median Mean (%)
Median (%)
Sta
ted
Go
al
or
Fo
rma
l A
sses
smen
t
Use
d
Pro
fess
ion
al
Ju
dg
men
t
Do
n’t
kn
ow
Hig
h
Med
ium
Lo
w
Do
n’t
kn
ow
The Islands (n=4)
1.25 0.5 75.00 75 1 1 0 0 2 0 0
Peninsulas (n=12)
1.08 0 72.00 80 2 3 0 0 2 3 0
The Coast (n=5) 1.20 0 100.00 100 0 1 0 1 0 0 0
North Cascades (n=19)
2.39 0.5 65.00 77.5 3 6 1 1 6 3 0
Seattle-King (n=13)
6.00 3 75.80 80 2 7 2 2 5 4 0
Southwest (n=15)
3.93 2 82.86 90 0 6 3 1 4 2 2
Northeast (n=4) 8.75 2.5 31.00 10 1 2 0 0 3 0 0
Columbia Plateau (n=4)
0.25 0 1.00 1 0 1 0 0 1 0 0
South Central (n=6)
2.83 1.5 80.00 80 1 0 2 0 3 0 0
The Palouse (n=3)
1.67 0 60.00 60 0 1 0 0 1 0 0
Total 3.11 1 69.58 80 10 28 8 5 27 12 2
*Reporting only the count of those who used the suggested unit of measurement.

114 Responsive Management
Outdoor Tennis Courts (Local Provider Survey)
Region
*Number of Outdoor Courts
Estimated Percent of Current
Demand Agency Meets
Method Used For Measuring Demand
(Number Giving Response)
Rating of Importance to Recreation in the
Service Area (Number Giving
Response)
Mean Median Mean (%)
Median (%)
Sta
ted
Go
al
or
Fo
rma
l A
sses
smen
t
Use
d
Pro
fess
ion
al
Ju
dg
men
t
Do
n’t
kn
ow
Hig
h
Med
ium
Lo
w
Do
n’t
kn
ow
The Islands (n=4)
0.00 0 N/A N/A N/A N/A N/A N/A N/A N/A N/A
Peninsulas (n=12)
0.92 0 40.50 40.5 1 1 0 1 1 0 0
The Coast (n=5) 1.20 0 100.00 100 0 1 0 1 0 0 0
North Cascades (n=19)
2.00 0 63.00 66 3 3 1 2 4 0 1
Seattle-King (n=13)
4.62 1 90.00 90 2 3 2 1 4 2 0
Southwest (n=15)
4.93 1 67.14 80 1 4 3 0 5 2 1
Northeast (n=4) 4.33 3 75.00 75 0 3 0 0 3 0 0
Columbia Plateau (n=4)
0.50 0 75.00 75 1 0 0 0 1 0 0
South Central (n=6)
4.33 0 70.00 70 0 1 1 0 2 0 0
The Palouse (n=3)
3.33 0 82.50 82.5 0 1 0 0 1 0 0
Total 2.86 0 72.14 80 8 17 7 5 21 4 2
*Reporting only the count of those who used the suggested unit of measurement.

Results of Provider Survey in Support of the Washington SCORP 115
Sports Fields (Total for All Sports) (Local Provider Survey)
Region
*Number of Fields
Estimated Percent of Current
Demand Agency Meets
Method Used For Measuring Demand
(Number Giving Response)
Rating of Importance to Recreation in the
Service Area (Number Giving
Response)
Mean Median Mean (%)
Median (%)
Sta
ted
Go
al
or
Fo
rma
l A
sses
smen
t
Use
d
Pro
fess
ion
al
Ju
dg
men
t
Do
n’t
kn
ow
Hig
h
Med
ium
Lo
w
Do
n’t
kn
ow
The Islands (n=4)
6.00 4.5 95.00 95 1 1 0 2 0 0 0
Peninsulas (n=12)
2.17 0 67.00 80 1 2 0 1 1 1 0
The Coast (n=5) 1.00 0 62.50 62.5 0 2 0 1 1 0 0
North Cascades (n=19)
7.16 1 77.50 77.5 3 6 1 7 3 0 0
Seattle-King (n=13)
5.54 6 75.63 80 3 5 1 7 1 1 0
Southwest (n=15)
10.07 0 64.00 70 0 5 1 5 0 1 0
Northeast (n=4) 8.67 4 50.00 50 1 2 0 2 1 0 0
Columbia Plateau (n=4)
6.75 1 25.00 25 1 0 1 1 0 0 1
South Central (n=6)
2.50 0 72.50 72.5 1 1 0 1 0 1 0
The Palouse (n=3)
3.33 0 42.50 42.5 0 1 0 1 0 0 0
Total 5.86 0 68.97 75 11 25 4 28 7 4 1
*Reporting only the count of those who used the suggested unit of measurement.

116 Responsive Management
Sports Fields for Multipurpose Use (Local Provider Survey)
Region
*Number of Fields
Estimated Percent of Current
Demand Agency Meets
Method Used For Measuring Demand
(Number Giving Response)
Rating of Importance to Recreation in the
Service Area (Number Giving
Response)
Mean Median Mean (%)
Median (%)
Sta
ted
Go
al
or
Fo
rma
l A
sses
smen
t
Use
d
Pro
fess
ion
al
Ju
dg
men
t
Do
n’t
kn
ow
Hig
h
Med
ium
Lo
w
Do
n’t
kn
ow
The Islands (n=4)
4.25 1 95.00 95 1 0 1 2 0 0 0
Peninsulas (n=12)
0.08 0 50.00 50 0 1 0 0 1 0 0
The Coast (n=5) 1.40 0 62.50 62.5 0 2 0 1 1 0 0
North Cascades (n=19)
3.58 1 78.89 75 4 5 1 5 4 1 0
Seattle-King (n=13)
4.62 4 76.25 80 3 5 1 7 2 0 0
Southwest (n=15)
9.80 2 70.43 70 1 4 4 4 1 1 3
Northeast (n=4) 0.67 0 50.00 50 1 1 0 1 1 0 0
Columbia Plateau (n=4)
0.25 0 20.00 20 1 0 0 1 0 0 0
South Central (n=6)
4.50 1 60.00 60 1 1 1 1 2 0 0
The Palouse (n=3)
2.67 0 37.50 37.5 0 1 0 1 0 0 0
Total 4.02 0 69.25 75 12 20 8 23 12 2 3
*Reporting only the count of those who used the suggested unit of measurement.

Results of Provider Survey in Support of the Washington SCORP 117
Sports Fields With Football Goals (Local Provider Survey)
Region
*Number of Fields
Estimated Percent of Current
Demand Agency Meets
Method Used For Measuring Demand
(Number Giving Response)
Rating of Importance to Recreation in the
Service Area (Number Giving
Response)
Mean Median Mean (%)
Median (%)
Sta
ted
Go
al
or
Fo
rma
l A
sses
smen
t
Use
d
Pro
fess
ion
al
Ju
dg
men
t
Do
n’t
kn
ow
Hig
h
Med
ium
Lo
w
Do
n’t
kn
ow
The Islands (n=4)
0.00 0 N/A N/A N/A N/A N/A N/A N/A N/A N/A
Peninsulas (n=12)
0.00 0 N/A N/A N/A N/A N/A N/A N/A N/A N/A
The Coast (n=5) 1.20 0 62.50 62.5 0 1 1 1 0 1 0
North Cascades (n=19)
0.21 0 75.00 75 0 0 1 0 0 1 0
Seattle-King (n=13)
0.38 0 87.50 100 2 2 0 2 1 1 0
Southwest (n=15)
0.20 0 60.00 60 0 1 0 0 1 0 0
Northeast (n=4) 0.67 0 75.00 75 1 1 0 0 2 0 0
Columbia Plateau (n=4)
0.00 0 N/A N/A N/A N/A N/A N/A N/A N/A N/A
South Central (n=6)
0.00 0 N/A N/A N/A N/A N/A N/A N/A N/A N/A
The Palouse (n=3)
0.00 0 N/A N/A N/A N/A N/A N/A N/A N/A N/A
Total 0.24 0 76.00 87.5 3 5 2 3 4 3 0
*Reporting only the count of those who used the suggested unit of measurement.

118 Responsive Management
Sports Fields With Lacrosse Goals (If Goals Are Portable, Indicate Number of Fields That Can Be Set Up) (Local Provider Survey)
Region
*Number of Fields
Estimated Percent of Current
Demand Agency Meets
Method Used For Measuring Demand
(Number Giving Response)
Rating of Importance to Recreation in the
Service Area (Number Giving
Response)
Mean Median Mean (%)
Median (%)
Sta
ted
Go
al
or
Fo
rma
l A
sses
smen
t
Use
d
Pro
fess
ion
al
Ju
dg
men
t
Do
n’t
kn
ow
Hig
h
Med
ium
Lo
w
Do
n’t
kn
ow
The Islands (n=4)
0.00 0 N/A N/A N/A N/A N/A N/A N/A N/A N/A
Peninsulas (n=12)
0.00 0 N/A N/A N/A N/A N/A N/A N/A N/A N/A
The Coast (n=5) 0.00 0 N/A N/A N/A N/A N/A N/A N/A N/A N/A
North Cascades (n=19)
2.11 0 71.67 75 1 2 0 2 1 0 0
Seattle-King (n=13)
2.77 1 71.00 87.5 3 3 1 3 3 1 0
Southwest (n=15)
0.53 0 0.00 0 0 0 1 0 1 0 0
Northeast (n=4) 3.25 0 0.00 0 0 1 0 0 1 0 0
Columbia Plateau (n=4)
0.00 0 N/A N/A N/A N/A N/A N/A N/A N/A N/A
South Central (n=6)
0.00 0 N/A N/A N/A N/A N/A N/A N/A N/A N/A
The Palouse (n=3)
0.00 0 N/A N/A N/A N/A N/A N/A N/A N/A N/A
Total 1.14 0 64.10 75 4 6 2 5 6 1 0
*Reporting only the count of those who used the suggested unit of measurement.

Results of Provider Survey in Support of the Washington SCORP 119
Sports Fields With Rugby Goals (Local Provider Survey)
Region
*Number of Fields
Estimated Percent of Current
Demand Agency Meets
Method Used For Measuring Demand
(Number Giving Response)
Rating of Importance to Recreation in the
Service Area (Number Giving
Response)
Mean Median Mean (%)
Median (%)
Sta
ted
Go
al
or
Fo
rma
l A
sses
smen
t
Use
d
Pro
fess
ion
al
Ju
dg
men
t
Do
n’t
kn
ow
Hig
h
Med
ium
Lo
w
Do
n’t
kn
ow
The Islands (n=4)
0.00 0 N/A N/A N/A N/A N/A N/A N/A N/A N/A
Peninsulas (n=12)
0.00 0 N/A N/A N/A N/A N/A N/A N/A N/A N/A
The Coast (n=5) 0.00 0 N/A N/A N/A N/A N/A N/A N/A N/A N/A
North Cascades (n=19)
0.63 0 75.00 75 0 1 0 1 0 0 0
Seattle-King (n=13)
0.08 0 1.00 1 1 0 0 0 0 1 0
Southwest (n=15)
0.27 0 56.50 56.5 0 2 0 1 1 0 0
Northeast (n=4) 0.00 0 N/A N/A N/A N/A N/A N/A N/A N/A N/A
Columbia Plateau (n=4)
0.00 0 N/A N/A N/A N/A N/A N/A N/A N/A N/A
South Central (n=6)
0.00 0 N/A N/A N/A N/A N/A N/A N/A N/A N/A
The Palouse (n=3)
0.00 0 N/A N/A N/A N/A N/A N/A N/A N/A N/A
Total 0.20 0 47.25 54 1 3 0 2 1 1 0
*Reporting only the count of those who used the suggested unit of measurement.

120 Responsive Management
Sports Fields With Soccer Goals (If Goals Are Portable, Indicate Number of Fields That Can Be Set Up) (Local Provider Survey)
Region
*Number of Fields
Estimated Percent of Current
Demand Agency Meets
Method Used For Measuring Demand
(Number Giving Response)
Rating of Importance to Recreation in the
Service Area (Number Giving
Response)
Mean Median Mean (%)
Median (%)
Sta
ted
Go
al
or
Fo
rma
l A
sses
smen
t
Use
d
Pro
fess
ion
al
Ju
dg
men
t
Do
n’t
kn
ow
Hig
h
Med
ium
Lo
w
Do
n’t
kn
ow
The Islands (n=4)
4.00 3 95.00 95 1 1 0 2 0 0 0
Peninsulas (n=12)
0.58 0 70.00 70 0 2 0 1 1 0 0
The Coast (n=5) 1.00 0 100.00 100 0 1 0 1 0 0 0
North Cascades (n=19)
5.68 1 72.73 75 3 6 2 6 5 0 0
Seattle-King (n=13)
4.15 5 67.25 77.5 3 4 2 6 2 1 0
Southwest (n=15)
8.47 0 56.83 61.5 0 4 3 5 0 1 1
Northeast (n=4) 5.67 4 50.00 50 0 3 0 2 1 0 0
Columbia Plateau (n=4)
0.25 0 20.00 20 1 0 0 1 0 0 0
South Central (n=6)
6.50 0.5 40.00 40 0 1 2 2 1 0 0
The Palouse (n=3)
2.67 0 40.00 40 0 1 0 1 0 0 0
Total 4.55 0 64.18 67.5 8 23 9 27 10 2 1
*Reporting only the count of those who used the suggested unit of measurement.

Results of Provider Survey in Support of the Washington SCORP 121
Baseball / Softball Diamonds (Local Provider Survey)
Region
*Number of Diamonds
Estimated Percent of Current
Demand Agency Meets
Method Used For Measuring Demand
(Number Giving Response)
Rating of Importance to Recreation in the
Service Area (Number Giving
Response)
Mean Median Mean (%)
Median (%)
Sta
ted
Go
al
or
Fo
rma
l A
sses
smen
t
Use
d
Pro
fess
ion
al
Ju
dg
men
t
Do
n’t
kn
ow
Hig
h
Med
ium
Lo
w
Do
n’t
kn
ow
The Islands (n=4)
2.67 4 100.00 100 1 1 0 2 0 0 0
Peninsulas (n=12)
3.22 0 83.00 83 1 1 0 0 2 0 0
The Coast (n=5) 2.50 0 100.00 100 0 1 0 1 0 0 0
North Cascades (n=19)
6.21 4 83.64 90 3 7 1 6 4 1 0
Seattle-King (n=13)
7.18 5 78.33 75 3 6 1 5 3 2 0
Southwest (n=15)
10.38 8.5 87.86 90 1 6 2 6 1 1 1
Northeast (n=4) 4.67 5 26.00 20 1 2 0 3 0 0 0
Columbia Plateau (n=4)
3.00 3 80.00 80 0 1 0 1 0 0 0
South Central (n=6)
3.60 1 77.50 77.5 1 1 1 1 2 0 0
The Palouse (n=3)
5.50 5.5 75.00 75 0 1 0 1 0 0 0
Total 5.66 2 79.33 80 11 27 5 26 12 4 1
*Reporting only the count of those who used the suggested unit of measurement.

122 Responsive Management
Golf Courses (Local Provider Survey)
Region
*Number of Courses
Estimated Percent of Current
Demand Agency Meets
Method Used For Measuring Demand
(Number Giving Response)
Rating of Importance to Recreation in the
Service Area (Number Giving
Response)
Mean Median Mean (%)
Median (%)
Sta
ted
Go
al
or
Fo
rma
l A
sses
smen
t
Use
d
Pro
fess
ion
al
Ju
dg
men
t
Do
n’t
kn
ow
Hig
h
Med
ium
Lo
w
Do
n’t
kn
ow
The Islands (n=4)
0.00 0 N/A N/A N/A N/A N/A N/A N/A N/A N/A
Peninsulas (n=12)
3.00 0 72.00 72 0 1 0 0 1 0 0
The Coast (n=5) 0.40 0 100.00 100 0 0 1 0 1 0 0
North Cascades (n=19)
0.11 0 87.50 87.5 0 2 0 1 1 0 0
Seattle-King (n=13)
0.23 0 90.00 90 1 0 1 2 0 0 0
Southwest (n=15)
0.07 0 100.00 100 0 2 0 0 1 1 0
Northeast (n=4) 1.00 0 77.50 77.5 0 2 0 1 0 1 0
Columbia Plateau (n=4)
0.00 0 N/A N/A N/A N/A N/A N/A N/A N/A N/A
South Central (n=6)
0.17 0 70.00 70 0 0 1 0 1 0 0
The Palouse (n=3)
0.00 0 N/A N/A N/A N/A N/A N/A N/A N/A N/A
Total 0.58 0 86.20 85 1 7 3 4 5 2 0
*Reporting only the count of those who used the suggested unit of measurement.

Results of Provider Survey in Support of the Washington SCORP 123
Disc Golf Courses (Local Provider Survey)
Region
*Number of Courses
Estimated Percent of Current
Demand Agency Meets
Method Used For Measuring Demand
(Number Giving Response)
Rating of Importance to Recreation in the
Service Area (Number Giving
Response)
Mean Median Mean (%)
Median (%)
Sta
ted
Go
al
or
Fo
rma
l A
sses
smen
t
Use
d
Pro
fess
ion
al
Ju
dg
men
t
Do
n’t
kn
ow
Hig
h
Med
ium
Lo
w
Do
n’t
kn
ow
The Islands (n=4)
0.00 0 N/A N/A N/A N/A N/A N/A N/A N/A N/A
Peninsulas (n=12)
0.08 0 62.50 62.5 0 2 0 0 1 1 0
The Coast (n=5) 0.20 0 50.00 50 0 1 0 1 0 0 0
North Cascades (n=19)
0.21 0 75.00 75 2 2 0 0 3 1 0
Seattle-King (n=13)
0.25 0 95.00 100 0 3 1 0 3 1 0
Southwest (n=15)
0.08 0 50.00 50 0 1 1 0 1 1 0
Northeast (n=4) Don’t know
Don’t know
80.00 80 0 1 0 0 1 0 0
Columbia Plateau (n=4)
0.25 0 90.00 90 0 1 0 0 0 1 0
South Central (n=6)
0.17 0 50.00 50 0 1 0 0 1 0 0
The Palouse (n=3)
0.33 0 90.00 90 0 1 0 0 1 0 0
Total 0.16 0 75.94 85 2 13 2 1 11 5 0
*Reporting only the count of those who used the suggested unit of measurement.

124 Responsive Management
The State/Federal/Not-for-Profit Survey asked providers about various types of facilities for
outdoor recreation, as tabulated below and on the following pages.
Q8. For each of the following, indicate whether your organization provides opportunities for it. (State/Federal/Not-for-Profit Survey)
Activity Response
Number Giving Response
Conservation or trust
Land use and/or wildlife management
Not-for-profit
activity oriented
Parks Tribal Misc. Total
Sightseeing
Yes 24 6 19 8 4 5 66
No 15 1 29 0 0 5 50
Don’t know 1 0 9 1 0 1 12
Nat
ure
ac
tiv
itie
s
Nature activities
Yes 33 7 21 7 2 4 74
No 6 0 29 1 2 6 44
Don’t know 1 0 7 1 0 1 10
Gardening, flower or vegetable
Yes 5 0 3 1 3 1 13
No 32 7 46 8 1 9 103
Don’t know 3 0 8 0 0 1 12
Fishing or shellfishing
Yes 16 7 7 5 4 0 39
No 22 0 42 4 0 10 78
Don’t know 2 0 8 0 0 1 11
Picnicking, barbecuing, or cooking out
Yes 12 6 19 6 4 1 48
No 27 1 30 2 0 9 69
Don’t know 1 0 8 1 0 1 11
Wat
er-r
elat
ed a
ctiv
itie
s
Beachcombing
Yes 12 6 6 4 3 1 32
No 25 1 42 5 1 9 83
Don’t know 3 0 9 0 0 1 13
Surfboarding
Yes 1 1 3 1 1 0 7
No 37 6 44 7 3 10 107
Don’t know 2 0 10 1 0 1 14
Wind surfing
Yes 1 4 4 1 1 0 11
No 37 3 44 7 3 10 104
Don’t know 2 0 9 1 0 1 13
Inner tubing or floating
Yes 3 5 4 2 3 0 17
No 35 2 44 6 1 10 98
Don’t know 2 0 9 1 0 1 13
Boating: boat access sites (non-motorized only)
Yes 10 7 6 4 3 1 31
No 28 0 44 5 1 9 87
Don’t know 2 0 7 0 0 1 10
Boating: boat access sites (that accommodate motorized craft)
Yes 5 7 1 4 3 0 20
No 33 0 48 5 1 9 96
Don’t know 2 0 8 0 0 2 12
Boating: pump-out stations
Yes 2 3 1 2 1 0 9
No 35 4 48 7 3 10 107
Don’t know 3 0 8 0 0 1 12
Water skiing
Yes 1 5 2 2 2 0 12
No 37 2 45 6 2 10 102
Don’t know 2 0 10 1 0 1 14

Results of Provider Survey in Support of the Washington SCORP 125
Q8. For each of the following, indicate whether your organization provides opportunities for it. (State/Federal/Not-for-Profit Survey)
Activity Response
Number Giving Response
Conservation or trust
Land use and/or wildlife management
Not-for-profit
activity oriented
Parks Tribal Misc. Total
Wat
er-r
elat
ed a
ctiv
itie
s (c
on
tin
ued
)
Scuba or skin diving
Yes 3 3 3 2 1 0 12
No 34 4 44 6 3 9 100
Don’t know 3 0 10 1 0 2 16
Snorkeling
Yes 2 3 3 3 1 0 12
No 36 3 44 5 3 10 101
Don’t know 2 1 10 1 0 1 15
Splash park use
Yes 1 0 1 0 1 0 3
No 37 6 46 8 3 10 110
Don’t know 2 1 10 1 0 1 15
Spray park use
Yes 1 0 1 0 1 1 4
No 37 7 45 8 3 9 109
Don’t know 2 0 11 1 0 1 15
Sn
ow
an
d i
ce
acti
vit
ies
Snow-ice activities
Yes 8 5 24 5 1 3 46
No 30 2 26 3 3 7 71
Don’t know 2 0 7 1 0 1 11
Snowboarding
Yes 0 2 4 4 1 0 11
No 38 5 42 4 3 10 102
Don’t know 2 0 11 1 0 1 15
Air
act
ivit
ies Air activities
Yes 1 3 2 0 1 0 7
No 37 4 47 9 3 10 110
Don’t know 2 0 8 0 0 1 11
Bungee jumping
Yes 0 0 0 0 1 0 1
No 37 7 49 9 3 10 115
Don’t know 3 0 8 0 0 1 12
Wal
kin
g,
hik
ing,
and c
lim
bin
g a
nd
m
ou
nta
inee
rin
g
Walking
Yes 24 5 17 7 4 2 59
No 14 1 31 1 0 8 55
Don’t know 2 1 9 1 0 1 14
Dog park use
Yes 3 1 3 4 1 0 12
No 33 6 47 5 3 10 104
Don’t know 4 0 7 0 0 1 12
Hiking
Yes 24 5 21 7 3 2 62
No 15 2 29 2 1 8 57
Don’t know 1 0 7 0 0 1 9
Climbing
Yes 4 5 2 4 1 0 16
No 32 2 47 5 3 10 99
Don’t know 4 0 8 0 0 1 13
Mountain-eering
Yes 3 5 3 4 1 0 16
No 34 1 43 4 3 10 95
Don’t know 3 1 11 1 0 1 17
Bicycle riding
Yes 11 5 11 6 3 2 38
No 25 1 39 3 1 8 77
Don’t know 4 1 7 0 0 1 13
Horseback riding
Yes 10 5 9 6 1 1 32
No 28 2 40 2 3 8 83
Don’t know 2 0 8 1 0 2 13

126 Responsive Management
Q8. For each of the following, indicate whether your organization provides opportunities for it. (State/Federal/Not-for-Profit Survey)
Activity Response
Number Giving Response
Conservation or trust
Land use and/or wildlife management
Not-for-profit
activity oriented
Parks Tribal Misc. Total
Off-road driving
Yes 0 5 26 1 3 6 41
No 39 2 24 7 1 5 78
Don’t know 1 0 7 1 0 0 9
Camping
Yes 8 6 27 5 3 1 50
No 31 1 23 4 1 9 69
Don’t know 1 0 7 0 0 1 9
Hu
nti
ng
and
sh
oo
tin
g Hunting
Yes 8 5 9 2 4 1 29
No 31 2 39 6 0 9 87
Don’t know 1 0 9 1 0 1 12
Shooting
Yes 1 5 18 0 2 2 28
No 38 2 32 8 2 8 90
Don’t know 1 0 7 1 0 1 10
Rec
reat
ion
al a
ctiv
itie
s
Playground use
Yes 4 2 2 2 4 1 15
No 32 5 46 6 0 9 98
Don’t know 4 0 9 1 0 1 15
Aerobics, fitness, weights
Yes 4 2 9 2 4 2 23
No 33 5 40 7 0 8 93
Don’t know 3 0 8 0 0 1 12
Jogging or running
Yes 10 5 9 5 3 2 34
No 27 2 40 3 1 8 81
Don’t know 3 0 8 1 0 1 13
Swimming in a pool
Yes 0 0 2 1 3 1 7
No 38 7 45 7 1 9 107
Don’t know 2 0 10 1 0 1 14
Swimming in natural waters
Yes 8 7 5 4 4 0 28
No 30 0 42 4 0 10 86
Don’t know 2 0 10 1 0 1 14
Roller or inline skating
Yes 3 0 2 0 1 0 6
No 35 7 45 8 3 10 108
Don’t know 2 0 10 1 0 1 14
Skateboarding
Yes 2 0 3 0 2 0 7
No 36 7 42 8 2 9 104
Don’t know 2 0 12 1 0 2 17
Badminton
Yes 0 0 0 1 1 1 3
No 36 7 49 8 2 8 110
Don’t know 4 0 8 0 1 2 15
Handball
Yes 0 0 0 0 1 0 1
No 38 7 48 9 3 10 115
Don’t know 2 0 9 0 0 1 12
Racquetball
Yes 0 0 1 0 1 0 2
No 38 7 46 8 3 10 112
Don’t know 2 0 10 1 0 1 14
Squash
Yes 0 0 0 0 1 0 1
No 38 7 47 8 3 10 113
Don’t know 2 0 10 1 0 1 14

Results of Provider Survey in Support of the Washington SCORP 127
Q8. For each of the following, indicate whether your organization provides opportunities for it. (State/Federal/Not-for-Profit Survey)
Activity Response
Number Giving Response
Conservation or trust
Land use and/or wildlife management
Not-for-profit
activity oriented
Parks Tribal Misc. Total
Rec
reat
ion
al a
ctiv
itie
s (c
on
tin
ued
)
Volleyball
Yes 0 0 0 2 3 1 6
No 38 7 48 6 1 9 109
Don’t know 2 0 9 1 0 1 13
Basketball
Yes 0 0 0 1 4 1 6
No 37 7 48 8 0 8 108
Don’t know 3 0 9 0 0 2 14
Tennis
Yes 0 0 1 1 1 1 4
No 38 7 46 7 3 9 110
Don’t know 2 0 10 1 0 1 14
Football
Yes 0 0 1 0 2 1 4
No 36 7 48 9 2 9 111
Don’t know 4 0 8 0 0 1 13
Rugby
Yes 0 0 0 0 1 0 1
No 38 7 47 8 3 10 113
Don’t know 2 0 10 1 0 1 14
Lacrosse
Yes 0 0 0 0 1 0 1
No 38 7 47 8 3 10 113
Don’t know 2 0 10 1 0 1 14
Soccer
Yes 2 0 3 1 1 0 7
No 36 7 44 7 3 9 106
Don’t know 2 0 10 1 0 2 15
Baseball
Yes 1 0 1 1 4 1 8
No 36 7 48 8 0 9 108
Don’t know 3 0 8 0 0 1 12
Softball
Yes 1 0 2 1 3 1 8
No 37 7 45 7 1 8 105
Don’t know 2 0 10 1 0 2 15
Golf (includes driving ranges)
Yes 0 0 2 1 1 0 4
No 37 7 47 8 3 9 111
Don’t know 3 0 8 0 0 2 13
Indoor community facility use
Yes 4 0 8 2 4 3 21
No 35 7 40 6 0 7 95
Don’t know 1 0 9 1 0 1 12
Fri
sbee
act
ivit
ies
Disc golf
Yes 1 1 0 1 1 1 5
No 36 6 48 8 3 9 110
Don’t know 3 0 9 0 0 1 13
Ultimate frisbee or frisbee football
Yes 0 0 0 1 1 1 3
No 36 7 49 8 3 9 112
Don’t know 4 0 8 0 0 1 13
Total 40 7 57 9 4 11 128

128 Responsive Management
The tabulations below concern state/federal/not-for-profit providers’ goals and the percent of
goals being met. In general, goals are not being fully met.
Q3. Does your organization have a goal for outdoor recreation, such as number of people it can accommodate or the number of people it serves? (State/Federal/Not-for-Profit Survey)
Category Number Giving Response
Yes No Don’t know Total
Conservation or trust 9 30 1 40
Land use and/or wildlife management 2 5 0 7
Not-for-profit activity oriented 31 17 9 57
Parks 3 6 0 9
Tribal 1 3 0 4
Misc. 4 7 0 11
Total 50 68 10 128
Q5. As a percent, approximately how much of your organization’s goal is currently met? (Of those whose organization has a goal for outdoor recreation.) (State/Federal/Not-for-Profit Survey)
Percent Met
Category (Number Giving Response)
Conservation or trust
Land use and/or wildlife management
Not-for-profit
activity oriented
Parks Tribal Misc. Total
100% 1 0 1 2 0 0 4
76%-99% 1 0 4 0 0 0 5
75% 0 0 1 0 0 0 1
51%-74% 0 0 4 1 0 0 5
50% 3 0 3 0 0 1 7
26%-49% 0 0 2 0 0 0 2
25% 0 0 1 0 0 0 1
Less than 25% 0 0 8 0 1 2 11
Don’t know 4 2 7 0 0 1 14
Mean 68.00 No responses 47.54 86.67 15.00 26.67 51.00
Median 50 No responses 50 100 15 20 50
Total 9 2 31 3 1 4 50

Results of Provider Survey in Support of the Washington SCORP 129
SATISFACTION OF RESIDENTS AND USERS OF RECREATION SERVICES Local providers estimated the percent of residents within their service area that are satisfied
with condition, quantity, and distribution of existing, active park and recreation facilities. In
general, local providers’ estimates of the satisfaction with the condition of facilities is fairly
high; their estimates of satisfaction of the quantity and distribution of facilities is a little
lower, but still, for the most part, above the 50% mark.
Percent of individuals within the agency’s service area that agency estimates are satisfied with the following
factors of existing, active park and recreation facilities. (Local Provider Survey)
Factor
Percent who
are satisfied
with the factor
Th
e Is
lan
ds
(n=
4)
Pen
insu
las
(n=
12
)
Th
e C
oa
st
(n=
5)
No
rth
Ca
sca
des
(n=
19
)
Sea
ttle
-Kin
g
(n=
13
)
So
uth
wes
t
(n=
15
)
No
rth
east
(n=
4)
Co
lum
bia
Pla
tea
u (
n=
4)
So
uth
Cen
tra
l
(n=
6)
Th
e P
alo
use
(n=
3)
To
tal
(n=
85
)
Number Giving Response
Th
e C
on
dit
ion
100% 0 1 0 0 0 1 0 0 0 1 3
76%-99% 2 2 1 10 5 5 2 1 1 1 30
75% 2 5 0 1 0 1 0 1 0 0 10
51%-74% 0 1 1 2 3 4 2 0 2 0 15
50% 0 0 2 4 4 2 0 1 0 1 14
26%-49% 0 2 0 0 0 0 0 1 2 0 5
25% 0 0 1 0 1 0 0 0 0 0 2
Less than 25% 0 1 0 1 0 0 0 0 0 0 2
Don’t know 0 0 0 1 0 2 0 0 1 0 4
Mean 80.00 66.25 56.80 71.33 66.00 74.46 76.25 62.50 61.00 80.00 69.25
Median 77.5 75 50 80 70 75 75 62.5 65 90 75
Th
e Q
ua
nti
ty
100% 0 0 0 0 0 1 0 0 0 1 2
76%-99% 0 3 1 6 5 3 2 1 0 0 21
75% 2 0 0 5 0 2 0 0 2 0 11
51%-74% 0 3 0 3 3 4 1 0 2 0 16
50% 1 2 2 1 3 2 0 0 0 1 12
26%-49% 0 1 0 1 0 0 0 2 1 1 6
25% 0 2 1 1 1 0 0 0 0 0 5
Less than 25% 1 1 1 1 0 0 0 1 0 0 5
Don’t know 0 0 0 1 1 3 1 0 1 0 7
Mean 55.00 53.75 46.80 66.28 64.25 73.33 80.00 42.50 61.00 66.33 62.27
Median 62.5 55 50 75 70 72.5 90 35 65 50 70
Th
e D
istr
ibu
tio
n
100% 0 1 0 1 0 1 0 0 0 1 4
76%-99% 0 2 1 4 3 3 2 1 1 0 17
75% 1 1 0 5 0 1 0 0 1 1 10
51%-74% 0 1 1 1 7 3 1 0 1 0 15
50% 2 5 1 5 2 3 0 0 1 0 19
26%-49% 0 2 1 1 0 1 0 2 1 0 8
25% 0 0 1 0 1 0 0 0 0 0 2
Less than 25% 1 0 0 1 0 0 0 1 0 1 4
Don’t know 0 0 0 1 0 3 1 0 1 0 6
Mean 48.75 59.58 52.80 65.00 62.00 66.92 78.33 40.00 62.00 61.67 61.30
Median 50 50 50 75 60 66.5 80 30 65 75 60
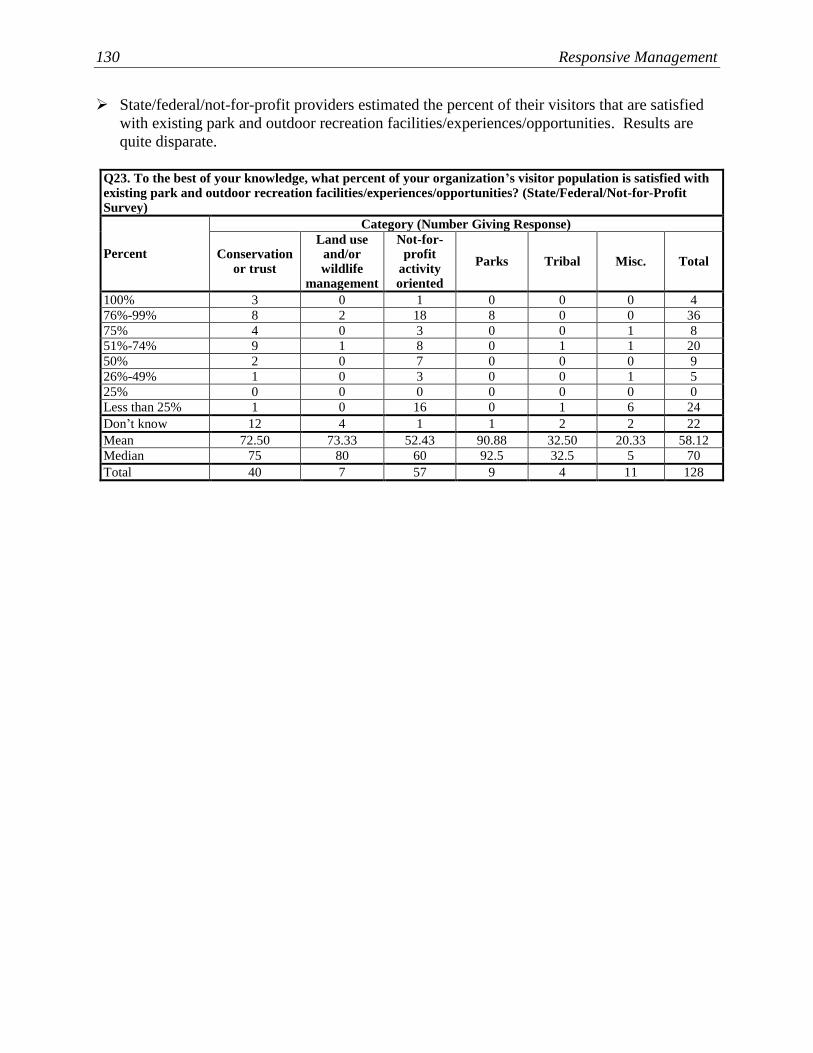
130 Responsive Management
State/federal/not-for-profit providers estimated the percent of their visitors that are satisfied
with existing park and outdoor recreation facilities/experiences/opportunities. Results are
quite disparate.
Q23. To the best of your knowledge, what percent of your organization’s visitor population is satisfied with existing park and outdoor recreation facilities/experiences/opportunities? (State/Federal/Not-for-Profit Survey)
Percent
Category (Number Giving Response)
Conservation or trust
Land use and/or wildlife
management
Not-for-profit
activity oriented
Parks Tribal Misc. Total
100% 3 0 1 0 0 0 4
76%-99% 8 2 18 8 0 0 36
75% 4 0 3 0 0 1 8
51%-74% 9 1 8 0 1 1 20
50% 2 0 7 0 0 0 9
26%-49% 1 0 3 0 0 1 5
25% 0 0 0 0 0 0 0
Less than 25% 1 0 16 0 1 6 24
Don’t know 12 4 1 1 2 2 22
Mean 72.50 73.33 52.43 90.88 32.50 20.33 58.12
Median 75 80 60 92.5 32.5 5 70
Total 40 7 57 9 4 11 128

Results of Provider Survey in Support of the Washington SCORP 131
OTHER OUTDOOR RECREATION ISSUES PROXIMITY TO PARKS AND TRAILS, AND ACCESS TO RECREATION AREAS Proximity and access were addressed in the survey with questions that asked for the percent
of people within the local agency’s service area who live within specific distances from
various parks (0.5 mile from a neighborhood park, 5 miles from a community park, and 25
miles from a regional park). Additionally, the Local Provider Survey asked about the percent
of residents in the local jurisdiction who can access recreation areas safely via foot, bicycle,
or public transportation. Tabulations show the results of these questions.
Percent of individuals within the agency’s service area who live a specific distance from the following parks
or trails. (Local Provider Survey)
Distance
Percent of
residents
living within
given distance Th
e Is
lan
ds
(n=
4)
Pen
insu
las
(n=
12
)
Th
e C
oa
st
(n=
5)
No
rth
Ca
sca
des
(n=
19
)
Sea
ttle
-
Kin
g
(n=
13
)
So
uth
wes
t
(n=
15
)
No
rth
east
(n=
4)
Co
lum
bia
Pla
tea
u
(n=
4)
So
uth
Cen
tra
l
(n=
6)
Th
e
Pa
lou
se
(n=
3)
To
tal
(n=
85
)
Number Giving Response
0.5
Mil
es o
f a
Nei
gh
bo
rho
od
Pa
rk
100% 1 0 0 1 1 0 0 0 1 0 4
76%-99% 0 1 0 1 1 1 1 0 0 0 5
75% 1 0 0 1 2 0 0 0 0 1 5
51%-74% 0 1 0 1 2 6 0 1 1 0 12
50% 0 2 2 6 2 0 1 1 1 0 15
26%-49% 0 1 1 1 3 2 2 1 3 1 15
25% 1 0 1 2 0 1 0 0 0 0 5
Less than 25% 1 7 1 6 2 3 0 1 0 1 22
Don’t know 0 0 0 0 0 2 0 0 0 0 2
Mean 55.00 30.42 37.00 40.05 55.38 45.46 49.50 40.00 52.50 43.00 43.90
Median 50 20 40 50 50 60 41.5 40 45 30 45
5 M
iles
of
a
Co
mm
un
ity
Pa
rk
100% 2 1 1 3 6 3 1 1 1 1 20
76%-99% 1 1 1 5 4 5 2 1 1 1 22
75% 0 1 0 4 0 0 0 0 0 1 6
51%-74% 0 1 1 3 0 0 0 1 2 0 8
50% 1 1 1 3 1 3 1 0 1 0 12
26%-49% 0 3 0 0 1 2 0 0 0 0 6
25% 0 1 0 0 0 0 0 0 0 0 1
Less than 25% 0 3 0 1 1 0 0 1 1 0 7
Don’t know 0 0 1 0 0 2 0 0 0 0 3
Mean 85.00 45.42 75.00 72.16 82.31 73.23 85.25 62.50 62.50 89.00 70.87
Median 95 40 75 75 95 82 95.5 70 57.5 92 80
25
Mil
es o
f a
Reg
ion
al
Pa
rk 100% 4 4 3 13 12 9 3 1 2 2 53
76%-99% 0 6 0 4 0 3 0 2 2 0 17
75% 0 0 1 1 0 1 1 0 1 0 5
51%-74% 0 0 1 0 0 0 0 0 0 1 2
50% 0 0 0 1 0 0 0 0 0 0 1
26%-49% 0 0 0 0 0 0 0 1 0 0 1
25% 0 1 0 0 0 0 0 0 0 0 1
Less than 25% 0 1 0 0 1 0 0 0 1 0 3
Don’t know 0 0 0 0 0 2 0 0 0 0 2
Mean 100.00 82.00 87.00 94.84 93.46 96.15 93.75 76.25 78.33 87.33 90.34
Median 100 90 100 100 100 100 100 87.5 87.5 100 100

132 Responsive Management
Responses regarding the percent of residents in local jurisdiction who can access recreation areas safely via
foot, bicycle, or public transportation. (Local Provider Survey)
Percent who
can access
recreation
areas safely via
foot, bicycle, or
public
transportation
Th
e Is
lan
ds
(n=
4)
Pen
insu
las
(n=
12
)
Th
e C
oa
st
(n=
5)
No
rth
Ca
sca
des
(n=
19
)
Sea
ttle
-Kin
g
(n=
13
)
So
uth
wes
t
(n=
15
)
No
rth
east
(n=
4)
Co
lum
bia
Pla
tea
u (
n=
4)
So
uth
Cen
tra
l (n
=6
)
Th
e P
alo
use
(n=
3)
To
tal
(n=
85
)
Number Giving Response
100% 1 6 1 9 3 5 2 2 3 1 33
76%-99% 1 3 2 3 1 5 2 0 0 0 17
75% 1 0 0 0 3 1 0 0 1 0 6
51%-74% 0 0 0 2 3 0 0 0 1 0 6
50% 0 0 1 3 2 0 0 1 1 1 9
26%-49% 0 0 0 1 1 0 0 0 0 0 2
25% 0 0 0 0 0 0 0 0 0 0 0
1%-24% 1 2 0 1 0 1 0 0 0 0 5
0% 0 0 1 0 0 2 0 1 0 1 5
Don’t know 0 1 0 0 0 1 0 0 0 0 2
Mean 69.50 81.82 65.00 79.05 72.54 75.71 93.25 62.50 80.83 50.00 75.49
Median 86.5 100 80 90 75 95.5 95 75 87.5 50 90

Results of Provider Survey in Support of the Washington SCORP 133
SUSTAINABILITY One question asked providers to indicate the percent of their recreation sites that support
sustainable recreation. In the Local Providers Survey, there is a wide range of answers, with
means for the various regions ranging from only approximately 36% to 81%. In the
State/Federal/Not-for-Profit Survey, mean percentages are all at 75% or higher. The Local
Provider Survey then asked respondents to indicate some of the ways in which their agency
provides sustainable recreation; the answers were categorized and summarized and are
presented in a graph, and the verbatim answers are also presented in a tabulation that follows
the graph.
Responses regarding the percent of sites that support sustainable recreation. (Local Provider Survey)
Approximate
percent of
existing sites
that support
sustainable
recreation
Number Giving Response
Th
e Is
lan
ds
(n=
4)
Pen
insu
las
(n=
12
)
Th
e C
oa
st
(n=
5)
No
rth
Ca
sca
des
(n=
19
)
Sea
ttle
-Kin
g
(n=
13
)
So
uth
wes
t
(n=
15
)
No
rth
east
(n=
4)
Co
lum
bia
Pla
tea
u (
n=
4)
So
uth
Cen
tra
l (n
=6
)
Th
e P
alo
use
(n=
3)
To
tal
(n=
85
)
100% 2 1 2 4 3 4 0 1 0 0 17
76%-99% 0 2 0 3 0 1 0 2 1 0 9
75% 1 0 1 3 0 1 1 0 0 1 8
51%-74% 0 1 0 1 5 0 0 0 1 0 8
50% 1 1 1 2 0 4 0 0 1 0 10
26%-49% 0 3 0 4 4 1 1 0 0 1 14
25% 0 0 1 0 0 0 0 0 1 0 2
1%-24% 0 3 0 0 1 1 2 0 2 0 9
0% 0 0 0 1 0 2 0 1 0 1 5
Don’t know 0 1 0 1 0 1 0 0 0 0 3
Mean 81.25 48.64 70.00 65.44 59.92 57.71 36.25 67.50 44.17 40.00 58.23
Median 87.5 40 75 75 62 50 30 85 37.5 45 60
Q14. What percent of the public park and/or recreation sites managed by your organization provide sustainable outdoor recreation opportunities? (Of those whose organization is currently involved with at least one public park and/or recreation site with a partner.) (State/Federal/Not-for-Profit Survey)
Percent of Sustainable Recreation Opportunities
Number Giving Response
Conservation or trust
Land use and/or wildlife
management
Not-for-profit
activity oriented
Parks Tribal Misc. Total
100% 10 3 22 2 0 2 39
76%-99% 3 2 1 3 0 0 9
75% 0 0 1 1 1 0 3
51%-74% 0 0 3 0 0 0 3
50% 1 1 2 0 0 0 4
26%-49% 1 0 1 1 0 0 3
25% 2 0 0 0 0 0 2
Less than 25% 0 0 1 0 0 0 1
Don’t know 12 0 12 0 0 4 28
Mean 82.06 88.33 87.97 80.43 75.00 100.00 85.78
Median 100 95 100 80 75 100 100
Total 29 6 43 7 1 6 92

134 Responsive Management
Q26. What are some of the ways your agency
provides sustainable outdoor recreation
opportunities?
(Local Provider Survey)
14
13
11
10
9
8
5
4
3
16
8
0 5 10 15 20
Buffer Zone at / Restricting Access to Sensitive
Areas
Best Management Practices Guidelines and
Policies / Sustainable Design / Environmental
Impact Reviews
Providing Recreation Facilities That Require Low
Maintenance
Open Space and Natural Area Preservation
Low Maintenance Materials and Construction
Use of Partnerships and Volunteers
Native Landscaping Plants
Water Runoff Management
Historic and Cultural Preservation
None / Does Not Provide Any
No Answer
Mu
ltip
le R
esp
on
ses A
llo
wed
Number of Respondents
(Note: “Other” responses not shown on graph.)

Results of Provider Survey in Support of the Washington SCORP 135
Q26. What are some of the ways your agency provides sustainable outdoor recreation
opportunities? (Local Provider Survey)
Region Ways Agency Provides Sustainable Recreation T
he
Isla
nds
Hiking.
None.
The South Whidbey Parks and Recreation District has a set of Guiding Principles for District Operations, one of which is that “We develop, operate, and maintain the parks system in an environmentally responsible manner.” Using this principle to guide decisions yields sustainable outdoor recreation opportunities across the District in facilities and programs. For example, during the planning for construction of a new soccer complex, sustainability decisions were made with this Guiding Principle as a reference, including the use of pervious paving materials, the construction of rain gardens, and the connection of the facility to adjacent trails and forests. In another example, extensive environmental impact and sustainability analyses were conducted prior to trail development at a new District property.
Walking and hiking.
Pen
insu
las
We have used Low Impact Development construction practices where possible.
None.
None.
Engineering design and material selection offering minimal impact. Marinas have
extra sanitation pump-outs and both offer free in-slip sewage pump-outs. Beach
habitat restoration projects remove contamination and derelict structures and provide
least-impact access for people.
We work to preserve the integrity of our shorelines.
Wildlife viewing, walking/jogging, and boating.
Interagency agreements and neighboring property easements.
None.
Partner with sailing and rowing group for teaching sailing and competitive events.
Saltaire Beach recreation area and Mike Wallace Memorial Park.
Our largest park is on the estuary, and public access and outdoor education revolves
around the site. Camps and salmon viewing opportunities are managed by staff.
Native plantings whenever appropriate.
The
Coas
t
None.
Ability to view waters of Pacific Ocean and Grays Harbor without having to climb rocks and disturb wildlife in Westport. Ability to access fishing waters of the marina and outside the marina without the use of motorboats.
Water access, possible short trails, and walk-in camping.
Nothing overt, but we do by chance.
Trail, interpretive center, restrooms, showers, picnic area, water access, and scenic viewing areas.

136 Responsive Management
Q26. What are some of the ways your agency provides sustainable outdoor recreation
opportunities? (Local Provider Survey) (continued)
Region Ways Agency Provides Sustainable Recreation N
ort
h C
asca
des
None.
Maintain large waterfront park areas.
None.
Trails in open spaces, preserves, and habitat conservation areas.
Narrative signage.
Through employment of Best Management Practices in the marina, boatyard, and
landscaping beautification programs.
Use of partnerships for acquisition, development, and stewardship of properties. Use
of volunteers for maintenance and improvement projects. Donations and
sponsorships for recreation programs.
Boaters are able to launch their boats and fishermen can fish without eroding the
banks now that our boat ramp is completed. Public access to fishing and beach areas
along the river are now available for users without creating erosion along the dike
system.
Dredge material site renourishment program on Jetty Island. Reestablishment of a
beach.
In partnership with Douglas County PUD, our boat launch facilities, RV park
overflow, and mooring dock were upgraded to provide improved and more efficient
launching of recreational vehicles such as boats and jet skis.
We provide space for others to use at no charge.
None.
Our outdoor recreation areas are open to the public for bicycling, walking, and other
passive recreation. We have a group that plays regular football and baseball on our
fields, despite the condition of the playing surface. We have established a Field
Revitalization volunteer committee to develop plans, raise funds, and execute
necessary hands-on work, and we invited our community to join and support our
parks.
Developing and maintaining trail systems to a high standard. Interpretive signage
and on-site programs related to the resource. Providing adequate support facilities
such as parking, restrooms, and staffing presence where enforcement and monitoring
are needed.
Low Impact Development practices, permeable surfaces, rain gardens, environmental
review, historic preservation, habitat protection, interpretive signage, etc.
Trails and paths in buffers around sensitive areas. Creating a backwater channel in
the Skagit River to protect salmon. Trails in Little Mountain Park.
We incorporate sustainable design into the majority of our projects. We utilize rain
gardens and pervious pavement, retain natural areas, choose durable materials for
construction, use native landscaping, monitor and manage irrigation use, and seek to
generally be as low-impact as possible.
I could better answer this question if you gave me more specific examples of what
this kind of opportunity looks like.

Results of Provider Survey in Support of the Washington SCORP 137
Q26. What are some of the ways your agency provides sustainable outdoor recreation
opportunities? (Local Provider Survey) (continued)
Region Ways Agency Provides Sustainable Recreation S
eatt
le-K
ing
By establishing multi-use activities so no one facility is for only one use.
Building park facilities that use renewable or recyclable materials, ensuring that
there is adequate ongoing maintenance for the facilities, and building a strong
volunteer and park steward base.
The Port provides limited saltwater access, viewing and fishing docks, transient
boater moorage, and a boat launch ramp.
Extensive network of trails through preserved open space areas. Operation of an
environmental education center. Acquisition of environmentally sensitive areas,
such as wetland complexes, and creek and stream systems. Acquisition and
development of shoreline parks, including public access and shoreline ecological
restoration.
Preservation of Puget Sound feeder bluff and public beach access. Nature preserves
providing buffers along fish-bearing streams.
Intensive maintenance, gradual increase in public land available, public education
about impacts, selective area closures, seasonal closures, and prompt repair of
damage.
All sites are developed and managed to maximize the recreation experience and
minimize impacts.
Four historical buildings have been relocated to one of our parks over the past 25
years. The city has recently begun acquiring a large site that will be primarily left as
open space.
Providing trails and beach areas open to the public, but limit recreational impacts by
design.
Trails through natural areas.
Tai chi classes, sailing, nature hikes, wilderness summer camp, kite day, low tide
festivals, and long boat landings.
South
wes
t
Combining public access “viewing” with habitat sites.
None.
None.
Establish, maintain, and expand trail systems and low impact design of new parks.
Design of parking lots and trails. Recycling programs. Invasive weed prevention
program.
None.
Built facilities that minimize maintenance requirements and reduce opportunities for vandalism. Designed and constructed are LEED-certified facilities. Adhere to critical areas regulations in siting park features and facilities. Adopted an Integrated Pest Management Program to reduce reliance on chemical fertilizers and pesticides.
We provide an outdoor area adjacent to our cultural facilities—a memorial garden and picnic table at the Lacey Museum—and walking paths at the Jacob Smith House (oldest house in Lacey still standing).
Development of walking trails along the Little Klickitat River in Goldendale.

138 Responsive Management
Q26. What are some of the ways your agency provides sustainable outdoor recreation
opportunities? (Local Provider Survey) (continued)
Region Ways Agency Provides Sustainable Recreation S
outh
wes
t (c
onti
nued
)
Walking trails through wooded areas and beaches.
Expansion of trail systems and nature education programming. Converting low-use turf areas to native plant areas. Implementation of energy and water-efficient systems and practices.
Keep trails open, limit development of large open-space areas, and include trails in/around active sites.
Our agency provides several opportunities to access water with a riverwalk trail as well as access to a 13-acre lake and a fishing pond and feeder creek. Also an 80-acre wilderness park is available.
Developed trails systems through sensitive habitat areas to minimize volunteer trails.
Nort
hea
st
None.
Volunteer construction and maintenance. Standardized structures, painting, park
equipment, and signage. Resilient surfacing.
Through project planning, deficiencies in existing sites are identified, a plan to
correct is formulated, and, once a decision is made, efforts to secure funding for
implementation follow. This may include trail reroutes; redesigning recreation sites
to pull facilities back from lakes, streams, and rivers; and installing barriers to
prevent vehicle access into fragile riparian areas and meadow systems, etc.
We acquire and manage over 20 conservation futures properties with an emphasis on
balancing habitat protection with public access for passive recreational opportunities.
We work with volunteer organizations to improve trail safety and reduce
environmental impacts.
Colu
mbia
Pla
teau
None at the moment.
None.
None.
Douglas PUD implements its Land Use Policy, which limits private use of Wells
Project lands in order to preserve fish, wildlife, and cultural resources, while
enhancing public access to Wells Reservoir.

Results of Provider Survey in Support of the Washington SCORP 139
Q26. What are some of the ways your agency provides sustainable outdoor recreation
opportunities? (Local Provider Survey) (continued)
Region Ways Agency Provides Sustainable Recreation S
outh
Cen
tral
None.
Enter into contract with soccer leagues for extended use.
Development of new parking areas with storm drains to contain surface run-off and
control contaminants, which previously ran down the steep bank into the Columbia
River. Using reclaimed trees with root wads as shoreline armoring; recycling
concrete and rubble into shoreline armoring; incorporating natural stone, native
plantings, recycled glass, farmed timbers, and light-penetrating ramps and docks in
our projects; and investing in habitat enhancements alongside river shore recreational
trail developments.
We utilize existing resources. For example, we built a skate park, basketball court,
playground and new ball fields around an historic incinerator. We also maintain
appropriate buffers from existing creeks and nature areas adjacent to parks.
Prairie restoration including moving part of the Pine Ridge Trail (National Trails
system) to a more hardened location and restoring the previous trail location with
native plants. Third-grade nature walks of plant and ecological diversity.
The
Pal
ouse
Provide interpretive signs in main park.
Concerts in the park series. Several festivals and celebrations.

140 Responsive Management
ACTIVE AND PASSIVE FORMS OF RECREATION The Local Provider Survey asked respondents to indicate the percent of their recreation sites
that support active and passive recreation. Note that a site may support both. The tabulation
below shows the results among local providers for both questions.
Responses regarding the percent of sites that support active and passive recreation (note that a site may
support both). (Local Provider Survey)
Recreation
type
Approximate
percent of
existing sites
that support
the given
type of
recreation
Th
e Is
lan
ds
(n=
4)
Pen
insu
las
(n=
12
)
Th
e C
oa
st (
n=
5)
No
rth
Ca
sca
des
(n=
19
)
Sea
ttle
-Kin
g
(n=
13
)
So
uth
wes
t
(n=
15
)
No
rth
east
(n
=4
)
Co
lum
bia
Pla
tea
u (
n=
4)
So
uth
Cen
tra
l
(n=
6)
Th
e P
alo
use
(n=
3)
To
tal
(n=
85
)
Number Giving Response
Active
recreation
100% 1 1 1 3 0 1 0 0 2 1 10
76%-99% 0 2 0 2 2 2 0 2 0 0 10
75% 1 0 0 2 0 1 0 0 0 0 4
51%-74% 0 0 0 3 3 2 3 0 2 1 14
50% 2 2 2 5 0 2 0 0 0 0 13
26%-49% 0 2 0 3 5 2 1 0 1 0 14
25% 0 1 1 1 0 2 0 0 1 0 6
1%-24% 0 2 0 0 2 1 0 0 0 0 5
0% 0 1 1 0 1 1 0 2 0 1 7
Don’t know 0 1 0 0 0 1 0 0 0 0 2
Mean 68.75 45.45 45.00 63.37 46.77 50.43 55.00 43.75 65.83 56.00 53.93
Median 62.5 40 50 54 45 50 55 42.5 65 68 50
Passive
recreation
100% 1 2 2 5 2 5 0 2 2 1 22
76%-99% 0 2 0 1 2 3 0 0 0 0 8
75% 0 1 1 1 1 2 0 1 0 0 7
51%-74% 0 1 0 2 5 0 3 0 2 0 13
50% 2 3 1 4 1 1 0 0 0 0 12
26%-49% 0 1 0 4 1 1 1 0 1 1 10
25% 1 0 0 2 0 0 0 0 0 0 3
1%-24% 0 1 0 0 1 1 0 0 0 0 3
0% 0 0 1 0 0 1 0 1 1 1 5
Don’t know 0 1 0 0 0 1 0 0 0 0 2
Mean 56.25 65.00 65.00 62.26 67.23 73.21 56.75 68.75 61.67 44.00 64.47
Median 50 65 75 50 65 82.5 63.5 87.5 70 32 67

Results of Provider Survey in Support of the Washington SCORP 141
CONSERVATION PROJECTS AND ACCESS The Local Provider Survey asked respondents if their agency manages any habitat
conservation projects and then to indicate the percent of those projects that allow public
access. In general, most conservation projects include a public access component.
Q21. Does your agency manage any habitat conservation projects? (Local Provider Survey)
Number Giving Response
Region Yes No Don’t know
The Islands (n=4) 1 3 0
Peninsulas (n=12) 5 7 0
The Coast (n=5) 0 5 0
North Cascades (n=19) 8 10 1
Seattle-King (n=13) 8 5 0
Southwest (n=15) 7 7 1
Northeast (n=4) 3 1 0
Columbia Plateau (n=4) 1 3 0
South Central (n=6) 1 5 0
The Palouse (n=3) 1 2 0
Total (n=85) 35 48 2
Q22. What approximate percent of habitat conservation projects managed by your agency allow public
access? (Of those agencies that manage habitat conservation projects)
(Local Provider Survey)
Percent of
projects
with public
access
Number Giving Response
Th
e Is
lan
ds
(n=
1)
Pen
insu
las
(n=
5)
Th
e C
oa
st
(n=
0)
No
rth
Ca
sca
des
(n=
8)
Sea
ttle
-Kin
g
(n=
8)
So
uth
wes
t
(n=
7)
No
rth
east
(n=
3)
Co
lum
bia
Pla
tea
u
(n=
1)
So
uth
Cen
tra
l
(n=
1)
Th
e P
alo
use
(n=
1)
To
tal
(n=
35
)
100% 0 4 N/A 2 4 1 1 1 1 0 14
76%-99% 0 0 N/A 1 1 1 1 0 0 0 4
75% 0 0 N/A 1 0 0 1 0 0 0 2
51%-74% 0 0 N/A 0 1 0 0 0 0 1 2
50% 0 0 N/A 2 0 3 0 0 0 0 5
26%-49% 0 0 N/A 2 2 1 0 0 0 0 5
25% 0 0 N/A 0 0 0 0 0 0 0 0
1%-24% 0 1 N/A 0 0 1 0 0 0 0 2
0% 1 0 N/A 0 0 0 0 0 0 0 1
Mean 0.00 82.00 N/A 66.00 80.00 54.29 85.00 100.00 100.00 60.00 70.66
Median 0 100 N/A 62.5 97.5 50 80 100 100 60 80

142 Responsive Management
The State/Federal/Not-for-Profit Survey asked its respondents as well about habitat
conservation projects. The results are tabulated below.
Q15. Does your organization manage any habitat conservation projects? (State/Federal/Not-for-Profit Survey)
Category Number Giving Response
Yes No Don’t know Total
Conservation or trust 32 7 1 40
Land use and/or wildlife management 6 0 1 7
Not-for-profit activity oriented 10 41 6 57
Parks 6 2 1 9
Tribal 3 1 0 4
Misc. 2 8 1 11
Total 59 59 10 128
Q16. What approximate percent of habitat conservation projects managed by your organization allow public access? (Of those whose organization manages at least one habitat conservation project.) (State/Federal/Not-for-Profit Survey)
Percent Allow Public Access
Category (Number Giving Response)
Conservation or trust
Land use and/or wildlife
management
Not-for-profit
activity oriented
Parks Tribal Misc. Total
100% 9 2 5 4 0 1 21
76%-99% 3 1 0 2 0 0 6
75% 2 0 0 0 0 0 2
51%-74% 0 0 1 0 0 0 1
50% 6 1 1 0 0 0 8
26%-49% 0 0 1 0 0 1 2
25% 2 0 0 0 0 0 2
Less than 25% 8 1 2 0 2 0 13
Don’t know 2 1 0 0 1 0 4
Mean 57.57 73.00 64.00 93.33 0.00 66.50 62.27
Median 50 95 80 100 0 66.5 75
Total 32 6 10 6 3 2 59

Results of Provider Survey in Support of the Washington SCORP 143
HABITAT TYPES AND RECREATION A tabulation shows responses of local providers regarding the importance of various habitat
types to outdoor recreation in their agency’s service area. The tabulation shows all regions
(and the total). The tabulation is followed by a graph for each region, with the habitat types
ranked on the graphs by importance.
On a scale of 0 - 10 where 0 is not at all important and 10 is extremely important, the mean and median
rating of importance of the following habitat types to outdoor recreation opportunities in the agency’s
service area. (Local Provider Survey)
Habitat
Types
Mean
or
Median
Region
Th
e Is
lan
ds
(n=
4)
Pen
insu
las
(n=
12
)
Th
e C
oa
st
(n=
5)
No
rth
Ca
sca
des
(n=
19
)
Sea
ttle
-Kin
g
(n=
13
)
So
uth
wes
t
(n=
15
)
No
rth
east
(n=
4)
Co
lum
bia
Pla
tea
u (
n=
4)
So
uth
Cen
tra
l
(n=
6)
Th
e P
alo
use
(n=
3)
To
tal
(n=
85
)
Forests Mean 5.75 6.17 6.00 6.11 7.15 6.20 9.00 0.25 3.00 5.67 5.93
Median 6.5 7.5 7 8 8 8 9 0 0 6 8
Woodlands Mean 7.00 5.25 6.00 6.68 7.15 6.60 8.50 1.00 3.00 5.33 6.06
Median 7.5 6 7 8 7 8 8 0.5 0 5 7.5
Shrublands Mean 3.25 3.17 3.60 4.37 4.46 3.53 5.50 5.25 4.17 3.67 4.02
Median 1.5 2 1 4 5 3 6.5 5.5 4.5 2 4
Grasslands Mean 3.67 3.82 2.80 4.05 3.62 4.13 4.75 4.75 2.67 5.33 3.89
Median 3 4 2 4 2 5 5 4 1 6 4
Wetlands Mean 5.75 6.83 7.80 7.16 7.00 7.80 8.75 5.00 5.00 6.33 6.96
Median 6.5 8 10 8 8 9 9 4.5 6 8 8
Desert Lands Mean 1.00 0.33 0.00 1.05 0.50 0.33 3.75 5.25 3.67 3.67 1.29
Median 0 0 0 0 0 0 3.5 5 4 2 0
Alpine Areas Mean 1.00 1.00 0.00 2.37 1.67 0.36 2.00 1.00 0.40 3.67 1.35
Median 0 0 0 0 0 0 0 0 0 2 0
Shorelines Mean 10.00 9.75 9.60 7.58 9.31 9.47 7.50 5.75 5.17 6.00 8.40
Median 10 10 10 10 10 10 8.5 6.5 5.5 9 10
Ocean
Beaches
Mean 2.50 3.58 4.00 2.63 3.58 0.33 0.00 0.00 0.00 0.00 2.09
Median 1.5 0 0 0 0 0 0 0 0 0 0

144 Responsive Management
Mean ratings of importance of the following to
habitat types to recreation in agency's service area.
(Local Provider Survey)
(The Islands)
10.00
7.00
5.75
5.75
3.67
3.25
2.50
1.00
1.00
0.00 2.00 4.00 6.00 8.00 10.00
Shorelines
Woodlands
Wetlands
Forests
Grasslands
Shrublands
Ocean beaches
Alpine areas
Desert lands
Mean

Results of Provider Survey in Support of the Washington SCORP 145
Mean ratings of importance of the following to
habitat types to recreation in agency's service area.
(Local Provider Survey)
(The Peninsulas)
9.75
6.83
6.17
5.25
3.82
3.58
3.17
1.00
0.33
0.00 2.00 4.00 6.00 8.00 10.00
Shorelines
Wetlands
Forests
Woodlands
Grasslands
Ocean beaches
Shrublands
Alpine areas
Desert lands
Mean

146 Responsive Management
Mean ratings of importance of the following to
habitat types to recreation in agency's service area.
(Local Provider Survey)
(The Coast)
9.60
7.80
6.00
6.00
4.00
3.60
2.80
0.00
0.00
0.00 2.00 4.00 6.00 8.00 10.00
Shorelines
Wetlands
Forests
Woodlands
Ocean beaches
Shrublands
Grasslands
Alpine areas
Desert lands
Mean

Results of Provider Survey in Support of the Washington SCORP 147
Mean ratings of importance of the following to
habitat types to recreation in agency's service area.
(Local Provider Survey)
(North Cascades)
7.58
7.16
6.68
6.11
4.37
4.05
2.63
2.37
1.05
0.00 2.00 4.00 6.00 8.00 10.00
Shorelines
Wetlands
Woodlands
Forests
Shrublands
Grasslands
Ocean beaches
Alpine areas
Desert lands
Mean

148 Responsive Management
Mean ratings of importance of the following to
habitat types to recreation in agency's service area.
(Local Provider Survey)
(Seattle-King)
9.31
7.15
7.15
7.00
4.46
3.62
3.58
1.67
0.50
0.00 2.00 4.00 6.00 8.00 10.00
Shorelines
Forests
Woodlands
Wetlands
Shrublands
Grasslands
Ocean beaches
Alpine areas
Desert lands
Mean

Results of Provider Survey in Support of the Washington SCORP 149
Mean ratings of importance of the following to
habitat types to recreation in agency's service area.
(Local Provider Survey)
(Southwest)
9.47
7.80
6.60
6.20
4.13
3.53
0.36
0.33
0.33
0.00 2.00 4.00 6.00 8.00 10.00
Shorelines
Wetlands
Woodlands
Forests
Grasslands
Shrublands
Alpine areas
Desert lands
Ocean beaches
Mean

150 Responsive Management
Mean ratings of importance of the following to
habitat types to recreation in agency's service area.
(Local Provider Survey)
(Northeast)
9.00
8.75
8.50
7.50
5.50
4.75
3.75
2.00
0.00
0.00 2.00 4.00 6.00 8.00 10.00
Forests
Wetlands
Woodlands
Shorelines
Shrublands
Grasslands
Desert lands
Alpine areas
Ocean beaches
Mean

Results of Provider Survey in Support of the Washington SCORP 151
Mean ratings of importance of the following to
habitat types to recreation in agency's service area.
(Local Provider Survey)
(Columbia Plateau)
5.75
5.25
5.25
5.00
4.75
1.00
1.00
0.25
0.00
0.00 2.00 4.00 6.00 8.00 10.00
Shorelines
Shrublands
Desert lands
Wetlands
Grasslands
Woodlands
Alpine areas
Forests
Ocean beaches
Mean

152 Responsive Management
Mean ratings of importance of the following to
habitat types to recreation in agency's service area.
(Local Provider Survey)
(South Central)
5.17
5.00
4.17
3.67
3.00
3.00
2.67
0.40
0.00
0.00 2.00 4.00 6.00 8.00 10.00
Shorelines
Wetlands
Shrublands
Desert lands
Forests
Woodlands
Grasslands
Alpine areas
Ocean beaches
Mean

Results of Provider Survey in Support of the Washington SCORP 153
Mean ratings of importance of the following to
habitat types to recreation in agency's service area.
(Local Provider Survey)
(The Palouse)
6.33
6.00
5.67
5.33
5.33
3.67
3.67
3.67
0.00
0.00 2.00 4.00 6.00 8.00 10.00
Wetlands
Shorelines
Forests
Grasslands
Woodlands
Shrublands
Desert lands
Alpine areas
Ocean beaches
Mean

154 Responsive Management
A tabulation shows responses of state/federal/not-for-profit providers regarding the
importance of various habitat types to outdoor recreation for their organization’s visitors, as
tabulated below.
Q21. On a scale of 0 to 10, where 0 is not at all important and 10 is extremely important, please indicate how important each of the following habitat types are to outdoor recreation opportunities that your organization supports. (State/Federal/Not-for-Profit Survey)
Habitat Type
Type of Agency/Organization
Mean / Median
Conservation or trust
Land use and/or wildlife
management
Not-for-profit
activity oriented
Parks Tribal Misc. Total
Forests Mean 7.93 8.14 8.40 8.25 9.00 7.40 8.17
Median 10 8 10 10 9 8.5 10
Woodlands Mean 7.50 7.57 8.05 7.38 9.00 6.80 7.74
Median 9 7 10 9 9 7.5 10
Shrublands Mean 6.05 7.00 6.91 5.14 7.50 5.78 6.48
Median 7 8 9 4 9 6 8
Grasslands Mean 6.08 6.43 6.77 7.57 8.75 5.50 6.54
Median 7.5 9 9.5 8 9 6 8
Wetlands Mean 8.00 8.29 5.25 8.38 9.25 4.80 6.59
Median 9.5 8 5 10 9.5 4.5 8
Desert lands Mean 2.05 4.71 5.38 3.14 7.00 5.50 4.25
Median 0 4 5 0 9 6 3
Alpine areas Mean 3.84 6.00 5.59 4.29 7.00 4.60 4.96
Median 3 6 7 0 9 4 5
Shorelines Mean 8.23 9.33 3.85 9.25 7.00 6.00 6.16
Median 10 9.5 1 10 9 6 8
Ocean beaches Mean 4.16 6.86 3.23 6.13 5.25 5.67 4.17
Median 1 8 0 9.5 5.5 5 1

Results of Provider Survey in Support of the Washington SCORP 155
GIS Less than half of local providers indicate that their agency uses GIS technology to help
manage their community’s inventory of outdoor recreation facilities. The second tabulation
on this page shows that most agencies are willing to share their GIS files with the RCO. The
next page has the analogous tabulations for state/federal/not-for-profit providers.
Q23. Does your agency use Geographic Information System (GIS) technology to help manage your
community’s inventory of outdoor recreation facilities? (Local Provider Survey)
Region Number Giving Response
Yes No Don’t know
The Islands (n=4) 1 3 0
Peninsulas (n=12) 2 10 0
The Coast (n=5) 0 5 0
North Cascades (n=19) 8 11 0
Seattle-King (n=13) 6 4 3
Southwest (n=15) 10 5 0
Northeast (n=4) 4 0 0
Columbia Plateau (n=4) 1 3 0
South Central (n=6) 1 4 1
The Palouse (n=3) 0 3 0
Total (n=85) 33 48 4
Q24. Is your agency willing to provide, at no cost, the shape files to the Recreation and Conservation Office
to help compile a statewide inventory of outdoor recreation sites and facilities? (Of those agencies that use
Geographic Information System (GIS) technology to help manage their community’s inventory of outdoor
recreation facilities) (Local Provider Survey)
Region Number Giving Response
Yes No Don’t know
The Islands (n=1) 1 0 0
Peninsulas (n=2) 0 0 2
The Coast (n=0) N/A N/A N/A
North Cascades (n=8) 4 0 4
Seattle-King (n=6) 3 0 3
Southwest (n=10) 6 0 4
Northeast (n=4) 3 0 1
Columbia Plateau (n=1) 1 0 0
South Central (n=1) 0 0 1
The Palouse (n=0) N/A N/A N/A
Total (n=33) 18 0 15

156 Responsive Management
Q17. Does your organization use Geographic Information System (GIS) technology to help manage your community’s inventory of outdoor recreation facilities? (State/Federal/Not-for-Profit Survey)
Category Number Giving Response
Yes No Don’t know Total
Conservation or trust 16 23 1 40
Land use and/or wildlife management 6 1 0 7
Not-for-profit activity oriented 15 35 7 57
Parks 6 3 0 9
Tribal 1 2 1 4
Misc. 0 9 2 11
Total 44 73 11 128
Q18. Is your organization willing to provide, at no cost, the shape files to the Recreation and Conservation Office to help compile a statewide inventory of outdoor recreation sites and facilities? (Of those whose organization uses GIS technology to help manage their community’s inventory of outdoor recreation facilities.) (State/Federal/Not-for-Profit Survey)
Category Number Giving Response
Yes No Don’t know Total
Conservation or trust 7 1 7 15
Land use and/or wildlife management 6 0 0 6
Not-for-profit activity oriented 3 3 8 14
Parks 4 1 1 6
Tribal 0 0 1 1
Misc. N/A N/A N/A N/A
Total 20 5 17 42

Results of Provider Survey in Support of the Washington SCORP 157
DATA ON THE AGENCIES AND ORGANIZATIONS IN THE SAMPLE The data obtained about each agency in the local provider sample include:
Number of public parks and recreation sites.
The total acreage of recreation lands.
The number of people living in their service area.
Q14. How many public park and/or recreation sites does your agency currently manage?
(Local Provider Survey)
Number of
Parks
Th
e Is
lan
ds
(n=
4)
Pen
insu
las
(n=
12
)
Th
e C
oa
st
(n=
5)
No
rth
Ca
sca
des
(n=
19
)
Sea
ttle
-Kin
g
(n=
13
)
So
uth
wes
t
(n=
15
)
No
rth
east
(n=
4)
Co
lum
bia
Pla
tea
u (
n=
4)
So
uth
Cen
tra
l
(n=
6)
Th
e P
alo
use
(n=
3)
To
tal
(n=
85
)
Number Giving Response
More than 100
parks 0 0 0 0 2 1 2 0 0 0 5
51-100 parks 0 1 0 2 0 2 0 0 0 0 5
41-50 parks 0 0 0 0 0 0 1 0 0 0 1
31-40 parks 0 0 0 1 1 1 0 0 1 0 4
21-30 parks 0 1 1 2 4 1 0 0 0 0 9
16-20 parks 0 2 0 1 1 1 0 1 0 1 7
11-15 parks 0 1 0 4 2 0 1 0 0 0 8
6-10 parks 3 1 0 2 1 5 0 0 2 0 14
5 parks 0 0 0 1 1 1 0 1 0 0 4
4 parks 1 1 1 0 0 1 0 0 2 0 6
3 parks 0 1 0 0 0 0 0 0 0 1 2
2 parks 0 0 0 2 0 1 0 0 0 0 3
1 park 0 4 3 3 1 0 0 1 1 0 13
Do not manage
any parks 0 0 0 0 0 1 0 1 0 1 3
Don’t know / no
response 0 0 0 1 0 0 0 0 0 0 1
Mean 5.75 14.00 7.00 19.83 56.23 42.47 73.00 6.50 9.33 7.33 27.94
Median 6 6 1 12 22 9 75 3 5 3 8.5

158 Responsive Management
Q15. What is the total acreage of the public park and/or recreation sites managed by your agency?
(Local Provider Survey)
Number of Acres
Th
e Is
lan
ds
(n=
4)
Pen
insu
las
(n=
12
)
Th
e C
oa
st (
n=
5)
No
rth
Ca
sca
des
(n=
19
)
Sea
ttle
-Kin
g (
n=
13
)
So
uth
wes
t (n
=1
5)
No
rth
east
(n
=4
)
Co
lum
bia
Pla
tea
u
(n=
4)
So
uth
Cen
tra
l (n
=6
)
Th
e P
alo
use
(n
=3
)
To
tal
(n=
85
)
Number Giving Response
More than 5,000
acres 0 1 0 2 1 1 1 0 0 0 6
4,001-5,000 acres 0 0 0 0 0 1 1 0 0 0 2
3,001-4,000 acres 0 0 0 1 0 0 0 0 0 0 1
2,001-3,000 acres 0 0 0 2 1 1 0 0 0 0 4
1,001-2,000 acres 0 0 0 0 0 2 0 0 0 0 2
501-1,000 acres 0 2 0 2 2 1 0 0 1 0 8
401-500 acres 0 0 0 0 3 1 0 0 0 0 4
301-400 acres 2 0 0 2 1 1 0 0 2 0 8
201-300 acres 0 0 0 1 1 1 0 0 1 0 4
101-200 acres 0 1 1 1 3 1 0 0 0 1 8
51-100 acres 0 0 0 2 0 2 1 1 0 0 6
41-50 acres 0 0 0 0 0 1 0 0 0 0 1
31-40 acres 0 2 0 1 0 0 0 0 0 0 3
21-30 parks 1 0 0 2 0 0 0 0 0 0 3
11-20 acres 0 0 2 0 0 1 0 0 1 1 5
10 acres or less 0 5 2 1 1 0 0 1 0 0 10
Do not manage
any parks 0 0 0 0 0 1 0 1 0 1 3
Don’t know 1 1 0 2 0 0 1 1 1 0 7
Mean 226.67 744.45 34.00 1705.82 983.46 1317.73 5397.67 20.33 321.60 44.00 1135.68
Median 100 85 80 100 87.5 75 70 92.5 70 50 85

Results of Provider Survey in Support of the Washington SCORP 159
Q4. How many people live in the area your agency serves? (Local Provider Survey)
Number of
People
Th
e Is
lan
ds
(n=
4)
Pen
insu
las
(n=
12
)
Th
e C
oa
st (
n=
5)
No
rth
Ca
sca
des
(n=
19
)
Sea
ttle
-Kin
g
(n=
13
)
So
uth
wes
t (n
=1
5)
No
rth
east
(n
=4
)
Co
lum
bia
Pla
tea
u
(n=
4)
So
uth
Cen
tra
l
(n=
6)
Th
e P
alo
use
(n
=3
)
To
tal
(n=
85
)
Number Giving Response
More than
500,000 people 0 0 0 1 1 1 0 1 0 0 4
401,000-500,000
people 0 0 0 0 0 0 1 0 0 0 1
300,301-400,000
people 0 0 0 1 0 1 1 0 0 0 3
200, 001-300,000
people 0 2 0 1 0 1 1 0 2 0 7
100,001-200,000
people 0 0 0 2 1 0 0 0 1 0 4
50,001-100,000
people 0 3 1 4 1 2 0 0 0 0 11
40,001-50,000
people 0 0 0 1 2 2 0 0 0 0 5
30,001-40,000
people 0 0 1 2 1 1 0 0 1 1 7
20,001-30,000
people 0 1 0 2 0 0 0 1 0 1 5
10,001-20,000
people 3 2 0 0 5 3 1 0 0 1 15
5,001-10,000
people 0 1 0 1 1 2 0 0 2 0 7
5,000 people or
less 1 2 0 2 1 1 0 2 0 0 9
Don’t know 0 1 3 2 0 1 0 0 0 0 7
Mean 12,258 69,601 53,500 205,465 77,268 127,644 259,950 508,882 105,167 23,833 140,819
Median 15,500 20,247 53,500 60,000 20,000 40,041.5 279,000 17,250 71,500 21,000 36,250

160 Responsive Management
The data obtained about each agency in the state/federal/not-for-profit survey provider
sample include:
Area served by the organization.
Population served by the organization.
Number of sites managed by and number of sites in which organization is involved.
Acreage managed by and acreage in which organization is involved.
Q6. Does your organization serve the entire state of Washington? (State/Federal/Not-for-Profit Survey)
Category Number Giving Response
Yes No Don’t know Total
Conservation or trust 7 33 0 40
Land use and/or wildlife management 7 0 0 7
Not-for-profit activity oriented 31 26 0 57
Parks 7 2 0 9
Tribal 2 2 0 4
Misc. 4 6 1 11
Total 58 69 1 128
Q7. What is the population within the area you serve? (Of those whose organization does not serve the entire state of Washington.) (State/Federal/Not-for-Profit Survey)
Population
Category (Number Giving Response)
Conservation or trust
Land use and/or wildlife
management
Not-for-profit
activity oriented
Parks Tribal Misc. Total
More than 1,000,000 4 0 1 0 0 1 6
500,001-1,000,000 1 0 1 0 0 0 2
250, 001-500,000 4 0 2 1 0 0 7
100,001-250,000 4 0 2 0 0 1 7
50,001-100,000 6 0 3 0 0 1 10
25,001-50,000 1 0 4 0 0 0 5
10,001-25,000 3 0 1 0 0 1 5
5,001-10,000 1 0 1 0 0 0 2
5,000 or less 2 0 1 0 2 2 7
Don’t know 7 0 10 1 0 0 18
Mean 620,223.54 No responses 372,950.69 400,000.00 1,490.00 551,183.33 505,943.20
Median 109,050 No responses 67,500 400,000 1,490 51,000 85,000
Total 33 0 26 2 2 6 69

Results of Provider Survey in Support of the Washington SCORP 161
Q9. How many public park and/or recreation sites does your organization currently manage? (State/Federal/Not-for-Profit Survey)
Number of Sites Manage
Category (Number Giving Response)
Conservation or trust
Land use and/or wildlife
management
Not-for-profit
activity oriented
Parks Tribal Misc. Total
More than 4 public sites
4 5 2 2 1 0 14
4 public sites 1 1 0 0 1 0 3
3 public sites 2 0 0 1 0 1 4
2 public sites 3 0 2 1 0 0 6
1 public site 6 0 17 4 0 2 29
None; Do not currently manage any public sites
20 0 17 0 2 3 42
Don’t know 4 1 19 1 0 5 30
Mean 2.64 222.50 3.34 31,272.00 17.25 0.83 2,569.46
Median 0 40 1 1.5 2 0.5 1
Total 40 7 57 9 4 11 128
Q10. How many public park and/or recreation sites is your organization currently involved with as a partner (i.e., sites in which your organization does any kind of work)? (State/Federal/Not-for-Profit Survey)
Number of Sites With a Partner
Category (Number Giving Response)
Conservation or trust
Land use and/or wildlife
management
Not-for-profit
activity oriented
Parks Tribal Misc. Total
More than 40 public sites
1 0 4 0 0 0 5
31-40 public sites 0 0 2 0 0 0 2
21-30 public sites 1 0 0 0 0 0 1
11-20 public sites 4 0 0 0 0 0 4
6-10 public sites 3 1 6 1 0 2 13
5 public sites 1 0 2 0 0 0 3
4 public sites 1 1 1 0 0 0 3
3 public sites 0 0 1 2 0 1 4
2 public sites 5 1 5 0 0 2 13
1 public site 4 0 14 2 0 1 21
None; not currently involved with a partner for any sites
7 0 5 0 1 1 14
Don’t know 13 4 17 4 3 4 45
Mean 8.63 5.33 23.48 3.60 0.00 3.57 14.83
Median 2 4 2 3 0 2 2
Total 40 7 57 9 4 11 128

162 Responsive Management
Q11. What is the total acreage of the public park and/or recreation sites managed by your organization? (Of those whose organization currently manages at least one public park and/or recreation site.) (State/Federal/Not-for-Profit Survey)
Number of Acres
Category (Number Giving Response)
Conservation or trust
Land use and/or wildlife
management
Not-for-profit
activity oriented
Parks Tribal Misc. Total
More than 10,000 acres
0 3 0 4 0 0 7
5,001-10,000 acres 1 0 1 0 0 0 2
1,001-5,000 acres 3 0 2 1 0 0 6
501-1,000 acres 2 0 3 0 0 0 5
101-500 acres 2 1 1 2 0 0 6
51-100 acres 3 0 1 0 0 0 4
26-50 acres 1 0 4 0 0 0 5
11-25 acres 1 0 4 0 0 0 5
10 acres or less 2 0 1 0 1 0 4
Don’t know 2 2 7 1 1 3 16
Mean 1,010.00 2,971,050.00 716.76 178,051.14 3.00 No
responses 299,043.09
Median 283 1,500,000 40 100,000 3 No
responses 291.5
Total 17 6 24 8 2 3 60
Q12. What is the total acreage of the public park and/or recreation sites in which your organization is currently involved with as a partner (i.e., sites in which your organization does any kind of work)? (Of those whose organization is currently involved with at least one public park and/or recreation site with a partner.) (State/Federal/Not-for-Profit Survey)
Number of Acres
Category (Number Giving Response)
Conservation or trust
Land use and/or wildlife
management
Not-for-profit
activity oriented
Parks Tribal Misc. Total
More than 10,000 acres
3 0 3 1 0 0 7
5,001-10,000 acres 0 0 1 0 0 0 1
1,001-5,000 acres 3 0 0 1 0 0 4
501-1,000 acres 4 1 3 0 0 0 8
101-500 acres 2 0 2 1 0 0 5
51-100 acres 2 0 0 0 0 0 2
26-50 acres 0 0 5 0 0 0 5
11-25 acres 0 0 1 0 0 1 2
10 acres or less 1 0 0 0 0 1 2
Don’t know 8 2 24 3 1 4 42
Mean 110,629.47 650.00 39,546.20 17,235.33 No
responses 15.00 64,028.36
Median 950 650 300 1,800 No
responses 15 600
Total 23 3 39 6 1 6 78

Results of Provider Survey in Support of the Washington SCORP 163
EXISTENCE OF OUTDOOR RECREATION PLANS The tabulation below shows that most local agencies concerned with outdoor recreation have
some sort of plans that address the development and use of outdoor resources.
Q1. Does your agency have a planning document(s) (e g , park/recreation master plan, open space master
plan) that addresses the development and use of outdoor resources?
(Local Providers Survey)
Region Number Giving Response
Yes No Don’t know
The Islands (n=4) 4 0 0
Peninsulas (n=12) 11 1 0
The Coast (n=5) 5 0 0
North Cascades (n=19) 17 2 0
Seattle-King (n=13) 13 0 0
Southwest (n=15) 14 1 0
Northeast (n=4) 4 0 0
Columbia Plateau (n=4) 3 0 1
South Central (n=6) 5 1 0
The Palouse (n=3) 2 1 0
Total (n=85) 78 6 1

164 Responsive Management
ABOUT RESPONSIVE MANAGEMENT Responsive Management is an internationally recognized public opinion and attitude survey research firm
specializing in natural resource and outdoor recreation issues. Our mission is to help natural resource and
outdoor recreation agencies and organizations better understand and work with their constituents, customers,
and the public.
Utilizing our in-house, full-service telephone, mail, and web-based survey center with 50 professional
interviewers, we have conducted more than 1,000 telephone surveys, mail surveys, personal interviews, and
focus groups, as well as numerous marketing and communication plans, needs assessments, and program
evaluations.
Clients include the federal natural resource and land management agencies, most state fish and wildlife
agencies, state departments of natural resources, environmental protection agencies, state park agencies,
tourism boards, most of the major conservation and sportsmen’s organizations, and numerous private
businesses. Responsive Management also collects attitude and opinion data for many of the nation’s top
universities.
Specializing in research on public attitudes toward natural resource and outdoor recreation issues, Responsive
Management has completed a wide range of projects during the past 22 years, including dozens of studies of
hunters, anglers, wildlife viewers, boaters, park visitors, historic site visitors, hikers, birdwatchers, campers,
and rock climbers. Responsive Management has conducted studies on endangered species; waterfowl and
wetlands; and the reintroduction of large predators such as wolves, grizzly bears, and the Florida panther.
Responsive Management has assisted with research on numerous natural resource ballot initiatives and
referenda and has helped agencies and organizations find alternative funding and increase their membership
and donations. Additionally, Responsive Management has conducted major organizational and programmatic
needs assessments to assist natural resource agencies and organizations in developing more effective programs
based on a solid foundation of fact.
Responsive Management has conducted research on public attitudes toward natural resources and outdoor
recreation in almost every state in the United States, as well as in Canada, Australia, the United Kingdom,
France, Germany, and Japan. Responsive Management has also conducted focus groups and personal
interviews with residents of the African countries of Algeria, Cameroon, Mauritius, Namibia, South Africa,
Tanzania, Zambia, and Zimbabwe.
Responsive Management routinely conducts surveys in Spanish and has conducted surveys in Chinese,
Korean, Japanese and Vietnamese and has completed numerous studies with specific target audiences,
including Hispanics, African-Americans, Asians, women, children, senior citizens, urban, suburban and rural
residents, large landowners, and farmers.
Responsive Management’s research has been upheld in U.S. District Courts; used in peer-reviewed journals;
and presented at major natural resource, fish and wildlife, and outdoor recreation conferences across the world.
Company research has been featured in most of the nation’s major media, including CNN, The New York
Times, The Wall Street Journal, and on the front pages of USA Today and The Washington Post. Responsive
Management’s research has also been highlighted in Newsweek magazine.
Visit the Responsive Management website at:
www.responsivemanagement.com