survey of salt in processed foods - · pdf filesurvey of salt in processed foods ... meat...
TRANSCRIPT
Institute of Environmental Science & Research Limited Christchurch Science Centre Location address: 27 Creyke Road, Ilam, Christchurch Postal address: P O Box 29 181, Christchurch, New Zealand Website: www.esr.cri.nz
A CROWN RESEARCH INSTITUTE
SURVEY OF SALT IN PROCESSED FOODS
Prepared as part of a New Zealand Food Safety Authority contract for scientific services
by
Dr Barbara Thomson
April 2006

ESR report on Salt in processed foods prepared for the NZFSA, April 2006
Client Report FW0601
SURVEY OF SALT IN PROCESSED FOODS
Dr Stephen On Food Safety Programme Manager
Dr Barbara Thomson Dr Jim Mitchell Project Leader Peer Reviewer

ESR report on Salt in processed foods prepared for the NZFSA, April 2006
DISCLAIMER This report or document (“the Report”) is given by the Institute of Environmental Science and Research Limited (“ESR”) solely for the benefit of the New Zealand Food Safety Authority (“NZFSA”), Public Health Services Providers and other Third Party Beneficiaries as defined in the Contract between ESR and the NZFSA, and is strictly subject to the conditions laid out in that Contract. Neither ESR nor any of its employees makes any warranty, express or implied, or assumes any legal liability or responsibility for use of the Report or its contents by any other person or organisation.

ESR report on Salt in processed foods prepared for the NZFSA, April 2006
TABLE OF CONTENTS
LIST OF TABLES 4
TABLE OF FIGURES 4
GLOSSARY 5
SUMMARY 1
1 INTRODUCTION 2 1.2 Data on sodium levels in New Zealand foods 2 1.3 Project Aim 3
2 MATERIALS AND METHODS 4 2.1 Assessment of available data 4 2.2 Sampling plan 5 2.3 Food sampling and analysis 6
2.3.1 Quality assurance: 6 2.4 Concentration data 7 2.5 Assessment of salt intake 7
2.5.1 Age-gender population groups evaluated 8 2.5.2 Food contributions 8 2.5.3 Areas of uncertainty in estimated dietary exposures 8
3 RESULTS AND DISCUSSION 10 3.1 Concentration of sodium in targeted foods 10 3.2 Dietary exposure to salt from processed foods 11 3.3 Foods contributing to sodium intake 13
4 REFERENCES 18 Appendix 1: Consolidated data of sodium in New Zealand processed foods (mg/kg) 20 Appendix 2: Concentration of sodium (label claim and measured) and moisture content
of targeted processed foods 25 Appendix 3: Quality assurance data 29 Appendix 4: Percentage contribution of individual foods to estimated dietary exposure
to salt from processed food for adult males (25 years +), young males (19-24) and for children 5-6 years. 31
ESR report on Salt in processed foods prepared for the NZFSA, April 2006
LIST OF TABLES
Table 1: Foods selected for sodium analysis 6
Table 2: Population sub-groups assessed for salt intake from processed foods 8
Table 3: Concentration of sodium and moisture in selected processed foods (mg/100g) 10
Table 4: Dietary exposure estimates for sodium and salt for adults (25+ years) and young adults (19-24 years) 11
Table 5: Dietary exposure estimates for children (11-14 years and 5-6 years). 11
TABLE OF FIGURES Figure 1: Food groups contributing 80-90% of estimated sodium intake from
2003/04 NZTDS 5
Figure 2: Distribution of salt intake for 3 population subgroups 12
Figure 3: Food groups contributing more than 2% to salt intake for males 25+ years 13
Figure 4: Food groups contributing more than 2% to salt intake for young males 19-24 years 14
Figure 5: Food groups contributing more than 2% to salt intake for females 25+ years 14
Figure 6: Food groups contributing more than 2% to salt intake for young females 19-24 years 15
Figure 7: Food groups contributing more than 2% to salt intake for 11-14 boy 15
Figure 8: Food groups contributing more than 2% to salt intake for 11-14 girl 16
Figure 9: Food groups contributing more than 2% to salt intake for children 5-6 years 16

ESR report on Salt in processed foods prepared for the NZFSA, April 2006
GLOSSARY CNS National Children’s Nutrition Survey: a 24 hr diet recall survey of 3275 New
Zealand school children 5-14 years of age, conducted in 2002 CV coefficient of variation = standard deviation of results divided by the mean as a
percentage FSANZ Food Standards Australia New Zealand MFD Manufactured Foods Database mg/100g milligrams per 100 grams Na The chemical abbreviation for sodium NNS National Nutrition Survey: a 24 hr diet recall survey of New Zealand consumers
aged over 15 years, conducted in 1997 NZTDS New Zealand Total Diet Survey RM Reference material used for analytical quality control

ESR report on Salt in processed foods 1 prepared for the NZFSA, April 2006
SUMMARY Key data gaps for sodium concentration of processed foods were filled through the analysis of 21 targeted foods to augment existing data from the 2003/04 New Zealand Total Diet Survey and the New Zealand Food Composition Database. Concentration information from these three sources was consolidated into a database of sodium concentrations in 58 processed foods and used as the basis to estimate the intake of non-discretionary salt for seven sub populations. Consumption information for 25+ year males, 25+ females, 19-24 young males and 19-24 young females was obtained from the 1997 National Nutrition Survey. Intakes of salt for 11-14 year boys, 11-14 year girls and children 5-6 years were estimated from consumption information in the 2002 National Children’s Nutrition Survey. Mean salt intakes from processed foods were: 5.9 g/day for 25+ year males, 3.9g/day for 25+ females, 6.9 g/day for 19-24 young males, 5.1 g/day for 19-24 young females, 5.2g/day for 11-14 year boys, 4.2 g/day for 11-14 year girls and 3.5 g/day for children 5-6 years old. Intake data was right skewed for each population group with most respondents consuming less than the mean for that population group. If salt is used as a vehicle of iodine fortification, the range and distribution of the salt intake will impact on iodine intakes. A wide range of processed foods were found to contribute to salt intake with bread clearly accounting for the greatest contribution across each of the 7 sub populations (35 to 43% of total salt intake). Other foods that contributed 2% or more to salt intake and were common across the age groups were sausage, meat pies, pizza, instant noodles (except for the 25+ males) and cheese (except for the 5-6 year old children). Foods that accounted for 2% or more for specific age-gender groups were:
• for the 25+ year old males; bacon, margarine, corned beef, ham and butter • for the 25+ year old females; cake, margarine, muffin, bacon, soup, butter, corned
beef and yeast extract • for the young males; hamburgers, tomato sauce and pasta sauce • for the young females; bacon, tomato sauce, corned beef, soup, margarine and
flavoured snacks • for the 11-14 boy; ham, biscuits, tomato sauce, flavoured snacks, corned beef, and
potato crisps • for the 11-14 girl; flavoured snacks, biscuits, ham, potato crisps, corned beef, and
tomato sauce and • for the children 5-6 years; plain biscuits, flavoured snacks and potato chips, ham,
tomato sauce and canned spaghetti. New Zealand and Australia are currently considering mandatory fortification of iodine as a risk management option to redress the issue of low iodine intake. Appropriate food vehicles and levels are yet to be determined but the salt survey provides useful directions if salt fortification is considered.

ESR report on Salt in processed foods 2 prepared for the NZFSA, April 2006
1 INTRODUCTION Information on the sources and intake of salt in the New Zealand diet is key for two public health issues of current concern, namely, the high intake of sodium and low intake of iodine by most New Zealanders (Vannoort and Thomson, 2005). Dietary salt includes the salt that occurs naturally in most foods, that which is added as an ingredient of processed foods and that, which is added at the time of cooking or at the table. Naturally occurring and salt in processed foods is termed non-discretionary since the consumer cannot choose its occurrence, whereas salt added at the time of cooking, or at the table, is termed “discretionary” because there is an element of consumer choice as to whether they add it or not. Data for sodium, and hence salt, concentrations in New Zealand foods are available from the Food Composition Database (FOODfiles 2004, 2004) and the 2003/04 New Zealand Total Diet Survey (Vannoort and Thomson, 2005). However, not all foods that are consumed in New Zealand have been analysed for salt. The intake of iodine is below recommended levels for all age-sex groups of the New Zealand population (Vannoort and Thomson, 2005) and Food Standards Australia New Zealand (FSANZ) is currently working on proposal P230 for the Mandatory Fortification of Iodine as a risk management option to redress the issue of low iodine intake. New Zealand table salt has been iodised at a low level since 1924 and at the current level of 25-65 mg iodine per kg salt (Food Standard 2.10.2, FSANZ, 2002), since 1939. However non-iodised salt is widely available and almost all salt used in processed foods is non-iodised salt (Thomson, 2003). Processed foods are the major source of salt in our diet, contributing between 60-70% of sodium, and hence, salt intake (BNF, 1994, Mattes and Donnelly 1991). Therefore information on the major contributors of salt from processed foods is important for modeling the impact of iodine fortification and/or for assessing the effects of any public health measures undertaken to reduce the use of salt in processed foods. Chemically, salt is sodium chloride comprising sodium and chloride ions and therefore salt intake could potentially be derived from either sodium or chloride levels in foods. In practice, sodium content has been cited as the basis for estimates of salt intake (Brady 2002, IFST 2003, SACN 2003) with no reports of chloride intakes retrieved. Labelling of foods for sodium is mandatory (FSANZ, 2002) so there is more information on sodium than chloride levels in foods. Sodium makes up 39% of salt by weight and therefore salt intake can be calculated from information on sodium concentrations with an adjustment factor (0.9) to account for non-salt sources of sodium in processed foods. Sources of sodium other than salt are, for example sodium bicarbonate and monosodium glutamate, and have been estimated to contribute in the order of 10% of total sodium intake (Fregly, 1984, NRC, 1989). 1.2 Data on sodium levels in New Zealand foods A collation of data for sodium and chloride levels in food is available from the New Zealand Food Composition Database with the most current version being FOODfiles 2004 (Crop & Food Research, McLauglin, personal communication, Sept. 2005). The source of the data is variable being New Zealand analytical data, Australian, British or USDA data, derived from a related food, computer generated or “guessed”. Sodium was included as a nutrient of interest in the 2003/04 New Zealand Total Diet Survey (NZTDS) (Vannoort and Thomson, 2005a,b). This survey included 121 foods which were either

ESR report on Salt in processed foods 3 prepared for the NZFSA, April 2006
nationally or regionally distributed, sampled at two seasons. Individual and consolidated data have been reported (Vannoort 2004a-d, Vannoort and Thomson, 2005b). 1.3 Project Aim The purpose of the current project was to obtain a database of values for salt in foods and ingredients in the New Zealand food supply to underpin future dietary modelling work and standards development and to derive preliminary estimates of dietary salt intake, including assessment of variability of intake. The values were to be compatible with criteria for inputting into the New Zealand Food Composition Database.

ESR report on Salt in processed foods 4 prepared for the NZFSA, April 2006
2 MATERIALS AND METHODS 2.1 Assessment of available data Sodium was a targeted analyte of the 2003/04 NZTDS. The 121 foods included in the NZTDS were considered and the following foods considered inappropriate for further analysis within the current study:
• foods not processed: milk, egg, beef-mince, lamb/mutton, beef-rump, pork chop, whole peanuts, carrot, silverbeet, lambs liver, water, potatoes, cream, cabbage, tomato, celery, kumara, apple
• seafoods: oysters, mussels, fresh fish • foods that would be inappropriate to fortify: beer, coffee, tea, wine, infant foods • where discretionary sodium is likely to be highly variable: hot potato chips and
takeaways • foods that made a contribution of <0.05% to sodium intake.
The remaining 51 processed foods contributed between 80 and 90% of estimated sodium intake for 8 population subgroups and comprised beverages (4), chicken, eggs, fish and meat (7), dairy products (6), grains (15), oils (2), spreads and sweets (6), takeaways (3) and vegetables (7). The relative contribution of these eight food groups to sodium intake is shown in Figure 1 and clearly shows that the “grains” group accounts for the greatest proportion of sodium intake. The grains food group included chocolate biscuits, cracker biscuits, plain sweet biscuits, bran flake cereal, bread (white, mixed grain and wheatmeal), cake, cornflakes, muesli, muffins, instant noodles and wheatbix. Sodium data in Foodfiles 2004 were interrogated and where New Zealand data existed, were collated with the data from the NZTDS. Processed foods for which there is limited NZ data in Foodfiles but which made a significant contribution to sodium intake from the NZTDS assessment included bacon, ham, chicken and pizza. Processed foods that are high in sodium (from Foodfiles) but were not included in the NZTDS exposure estimates included: anchovies, smoked/dried fish, bottled olives in brine, frozen beef patties, beef tongue, pickled beef tongue, canned beef and sheep tongue, ham steak, jellied veal loaf, black pudding, luncheon, pastrami beef, liver pate, salami, sauces (mustard, pickle, soy, chilli) and non chicken soups.

ESR report on Salt in processed foods 5 prepared for the NZFSA, April 2006
Figure 1: Food groups contributing 80-90% of estimated sodium intake from 2003/04 NZTDS
0
10
20
30
40
50
60
25+ yrs Male
25+ yrs Female
19-24 yrs Male
11-14 yrs Male
11-14 yrsFem
ale
5-6 yrs M&
F
1-3 yrs M&
F
6 mnths M
&F
% c
ontr
ibut
ion
Beverages (4)Chicken, eggs, f ish, meat(7)Dairy products (6)Grains (15)Oils (2)Spreads & Sweets (6)Takeaways (3)Vegetables (7)
2.2 Sampling plan Possible gaps in data on sodium in New Zealand manufactured processed foods were identified by browsing the 5000 foods included in the Manufactured Foods Database (MFD, personal communication, October 2005) along with inspection of products on supermarket shelves for information on the country of origin of potential foods. Samples were restricted to New Zealand manufactured foods. The foods listed in Table 1 were selected for sodium analyses to augment existing data.

ESR report on Salt in processed foods 6 prepared for the NZFSA, April 2006
Table 1: Foods selected for sodium analysis Food
No. of samples
Description
Reason
processed chicken 8 8 8 8
chicken loopys/nuggets/hotdogs stuffed chicken products crumbed chicken KFC
limited data
bacon 8 4 brands, shoulder and middle
limited NZ data, high and variable sodium conc. (1219-1500 mg/100g).
beef pastrami 8 high Na conc. No NZ data. convenience foods 8
8 8 8
processed potato(cheese medallions, farm animals, potao smiles, hash brown nuggets) crumbed meats prepared dinners sushi
no NZ data
frozen beef patties 8 no NZ data, moderately high levels in UK data
ham and ham steaks 8 limited NZ data, high Na conc. and variable (1219-1500 mg/100g).
luncheon 8 very limited NZ data, high conc., commonly consumed
pate 8 no NZ data, moderately high Na concentration
salami 8 various brands no NZ data, high Na conc sauces 8
8 8 8 8
mayonnaise dressings pasta sauces chilli sauces stir-fry sauces piccalilli /chow
limited NZ data
smoked meat/fish 8 various very limited NZ data, high Na concentration
Na = sodium 2.3 Food sampling and analysis Foods were purchased from Christchurch retail outlets in October and November 2005. Individual units, or a minimum of 250g of each sample was purchased. Details of the label claim were recorded as a cross reference for the analytical determination of sodium. A minimum of 250 g of each product was homogenized in a domestic blender. Duplicate 50 ml portions were frozen until analysis. An aliquot of sample was ashed in a muffle furnace at 500ºC, the residue dissolved in concentrated nitric acid, with caesium chloride as an ionization suppressant. Sodium was determined by atomic emission spectroscopy by the ESR Christchurch Science Centre food chemistry laboratory. The laboratory is accredited by IANZ (International Accreditation New Zealand) to the standard NZS/ISO/IEC/17025, 2.72/5 for this analysis.
2.3.1 Quality assurance: A number of quality assurance procedures were followed to ensure the robustness of the analytical results.

ESR report on Salt in processed foods 7 prepared for the NZFSA, April 2006
• Thirty two of the 168 samples (19%) were analysed in duplicate, including samples of each food type, to determine variability. A coefficient of variation (CV = standard deviation of results divided by mean x 100%) of less than 10% is considered good but higher values may be acceptable for some matrices, analyte and concentration combinations (Vannoort, personal communication, 2005). Data for duplicate analyses for sodium are provided in Appendix 3.1. The analytical precision and intra-sample variability, based on duplicate analyses was good with all CVs less than, or equal to, 10%.
• Eleven samples were spiked with sodium to correspond to a spike level equivalent to that in the product (i.e. doubling the amount of sodium in an extract between the spiked and unspiked samples). Recovery compares the amount of sodium measured in the spiked sample corrected for the amount of sodium in the unspiked sample, with the amount of sodium added in the spike. Acceptable recoveries for sodium analyses would generally be 70-125%. The recovery of sodium from spiked samples was good, ranging from 84-102%, except the luncheon sample, confirming the general accuracy of the analytical method (Appendix 3.2). The low recovery for the luncheon sample is most likely a single poor result. Four duplicate analyses for luncheon showed a high degree of reproducibility. A comparison of measured sodium levels with label claim do not show a bias towards a low recovery.
• A milk powder reference sample (RM155), supplied by AgriQuality, was analysed with each batch to ensure precision. RMs are stable and homogenous materials with the level of analyte present and its uncertainty uncertainty being certified by the supplier. The analysis of sodium in the RM was acceptable (93-130%) also confirming the accuracy of the analytical method (Appendix 3).
2.4 Concentration data Mean, minimum and maximum sodium concentration values for each of the 58 selected food items were determined from the aggregated data generated from the results from this study, the 2003/04 NZTDS and Foodfiles 04, where the Foodfile data was sourced within New Zealand. This aggregated data is shown in Appendix 1. 2.5 Assessment of salt intake Estimates of dietary exposure to salt were made by combining mean sodium levels in processed foods with 24-hour dietary recall information from the 1997 National Nutrition Survey (NNS; Russell et al., 1999) and the 2002 National Children’s Nutrition Survey (CNS; MoH, 2003) using Microsoft Foxpro. Food descriptors from the NNS and CNS were mapped to the processed foods of interest for this study. For example, all “muesli bars” in the NNS were mapped to “snack bars”. Where a food of interest may be only a component of a described item, such as the bread component of a filled roll, an estimate of the proportion of the food of interest was specified. Each food of interest was assigned a mean sodium concentration (from Appendix 1). The mean sodium concentrations were multiplied by the amount of that food consumed by each respondent in the two consumption surveys, and summed over all foods assessed to estimate the dietary exposure to sodium from processed foods for each individual surveyed. The estimates of dietary exposure were divided by the body weight of the respondent to give a dietary exposure in mg/kg body weight/day.
ESR report on Salt in processed foods 8 prepared for the NZFSA, April 2006
The sodium intake was converted to a salt intake by adjusting for the difference in molecular weight (58.5/23.0) and to account for non salt sources of sodium (0.9) (Fregly, 1984 and Mattes and Donnelly 1991). Arithmetic mean, selected percentiles, minimum and maximum exposures were determined using Microsoft Excel.
2.5.1 Age-gender population groups evaluated The two consumption surveys include respondents 5-14 years and 19 years and over, allowing for exposure estimates for a variety of age and gender groups. The complete sets of dietary exposure estimates were sub-divided to provide information on seven sub-groupings selected for consistency with the 2003/04 New Zealand Total Diet Survey, with the addition of 19-24 year old females (Table 2). Table 2: Population sub-groups assessed for salt intake from processed foods Group Mean body weight (kg) Number of respondents 25+ year male 82.1 1648 25+ female 70.4 2309 19-24 year male 79.4 141 19-24 year female 67.8 205 11-14 year boy 57.0 567 11-14 year girl 60.1 576 5-6 child 24.6 692
2.5.2 Food contributions The contribution of a particular food to sodium intake was calculated by summing the contributions to exposure to sodium from each food, across all consumers in a particular age-gender group, and dividing by the sum of all sodium exposures for that group. The resulting proportion was converted to a percentage by multiplying by 100.
2.5.3 Areas of uncertainty in estimated dietary exposures Whilst the methodology described is considered to provide a realistic estimate of the actual salt intake for the selected sub populations, the following limitations are recognised:
• Foods analysed. Not all sodium containing processed foods have been included in the assessment. Whilst every effort has been made to include the likely major contributors, it is not practicable to include the complete array of foods that is available. Any contribution from non- included foods has not been accounted for.
• Mapping. The foods included in this study (n= 58) were mapped to a wider range of foods described in the NNS/CNS (n=6382). Assumptions have been made that the mapped foods have similar sodium concentrations to the analysed foods. There is a measure of uncertainty around these assumptions.

ESR report on Salt in processed foods 9 prepared for the NZFSA, April 2006
• Use of 24-hour dietary recall records. The 24-hour dietary recall records from the NNS and CNS are assumed to represent the typical diet for the individual respondent. This is a simplification, as each individual’s diet will vary from day to day. Both studies repeated 24-hour dietary recall questionnaires for a proportion of the respondents. These repeat records were used to examine day-to-day variability in individual’s dietary exposure.

ESR report on Salt in processed foods 10 prepared for the NZFSA, April 2006
3 RESULTS AND DISCUSSION 3.1 Concentration of sodium in targeted foods The choice of foods sampled was limited because of the country of origin. For example, most pasta sauces on supermarket shelves are manufactured in Australia and this study was purposely targeting NZ manufactured foods. Similarly soy, hoisin, Worcester, oyster and chilli sauces are sourced almost exclusively from overseas. A summary of the mean and range of sodium concentration and percentage of moisture for each of the selected food groups is shown in Table 3. Individual results are shown in Appendix 2. Table 3: Concentration of sodium and moisture in selected processed foods (mg/100g)
sodium Range Food type conc. max min % moistureprocessed chicken 636 803 402 56.9stuffed chicken product 464 850 221 61.3crumbed chicken 313 429 202 64.5KFC 630 803 434 44.7bacon 1092 1498 495 59.3pastrami 1160 1437 913 71.3processed potato 307 366 174 65.8crumbed meats 412 557 305 55.5prepared dinners 345 532 216 76.7sushi 453 701 243 60.8beef patties 380 576 100 60.1ham & ham steaks 1227 1476 943 74.5luncheon 1038 1253 836 67.2pate 727 1043 334 55.4salami 1514 2022 731 52.5mayonnaise dressing 689 865 350 49.5pasta sauce 470 767 357 81.3chilli sauce 1317 2155 765 64.5stir fry sauce 596 1888 214 71.0piccalilli 326 548 208 72.1smoked meat/fish 1032 1730 405 65.3 As expected the highest levels of sodium were found in the processed meat products namely bacon, pastrami, ham, luncheon, salami and smoked meat and fish. Compliance with label claim was not an objective for this project but label claim information was recorded as a cross check for the analytical measurement of sodium content. Twelve of the 168 samples exceeded the label claim for sodium by more than 50% and included one sample each of processed chicken, prepared dinners, beef patties, luncheon, salami and mayonnaise. Three of the eight samples of bacon and piccalilli/chow had sodium levels in excess of 50% more than the claim on the label.

ESR report on Salt in processed foods 11 prepared for the NZFSA, April 2006
3.2 Dietary exposure to salt from processed foods The intakes of salt (mg/day) for seven age sex groups are shown in Tables 4 and 5. Various percentile consumers, including mean, median, maximum and minimum consumers are presented to illustrate the variability of salt intake. The 5th percentile values are the intake for the lowest 5% of the population and thus represent very low sodium (and salt) intakes. Conversely, the 95th percentile is the intake for the top 95% of the population and is indicative of very high intakes. Minimum and maximum values represent extreme intakes for the 24 hr period of collection of the consumption data but are likely to underestimate and overestimate respectively the habitual salt intakes for these consumers (FAO/WHO, 2002). Table 4: Dietary exposure estimates for sodium and salt for adults (25+ years) and young
adults (19-24 years) 25+ year male 25+ female 19-24 male 19-24 female Sodium
mg/day Salt mg/day
Sodium mg/day
Salt mg/day
Sodium mg/day
Salt mg/day
Sodium mg/day
Salt mg/day
mean 2600 5952 1714 3925 3040 6958 2252 5156 median 1996 4570 1344 3077 2389 5469 1607 3678 minimum 0 0 0 0 0 0 0 0 5th percentile 401 919 192 439 223 510 160 366 95th percentile 6137 14048 4198 9611 6440 14742 5567 12744 maximum 22574 51674 21530 49284 13848 31699 13151 30104 Table 5: Dietary exposure estimates for children (11-14 years and 5-6 years). 11-14 boy 11-14 girl 5-6 child Sodium
mg/day Salt mg/day
Sodium mg/day
Salt mg/day
Sodium mg/day
Salt mg/day
mean 2291 5245 1838 4208 1548 3544 median 2006 4592 1660 3800 1444 3306 minimum 0 0 0 0 0 0 5th percentile 480 1099 324 742 395 904 95th percentile 5241 11998 4212 9643 3395 7771 maximum 13902 31823 17743 40617 9380 21472 The range of salt intake between the lowest and highest consumers of processed foods (5th and 95th percentiles) varied by a factor of 9 to 35 with the smallest range of intake seen for the younger children, 5-6 years, and the widest range observed for the 19-24 year old female. These intake assessments were based on 24 hr diet recall information that is recognized as tending to overestimate intake by high consumers (FAO/WHO, 2002). A comparison between the main and repeat data for the NNS and CNS showed agreement within 15% at the 95th percentile of consumers for each sub population, apart from the 5-6 year olds (21% difference between the data sets), and were therefore fair assessments of habitual intake for these sub populations. The estimates of the 5-6 year olds would tend to less accurately reflect habitual exposure than for the older consumers because of the slightly poorer agreement between estimates based on main and repeat data. For each sub population, the median was less than the mean, indicative of right skewed distributions of intake, illustrated for each sub population in Figure 2. This showed that estimates of mean intake overestimated the intake of the majority of consumers (>50%).

ESR report on Salt in processed foods 12 prepared for the NZFSA, April 2006
Figure 2: Distribution of salt intake for each population subgroup
0.0
10.0
20.0
30.0
40.0
0-2.5 2.5-5 5-7.5 7.5-10 10-12.5
12.5-15 >15
salt intake (g/day)
% o
f res
pond
ents
mean=5.9g/day
0.0
10.0
20.0
30.0
40.0
50.0
0-2.5 2.5-5 5-7.5 7.5-10 10-12.5
12.5-15
>15
salt intake (g/day)
% o
f res
pond
ents mean=3.9g/day
25+ male 25+ female
0.0
5.010.0
15.0
20.025.0
30.0
0-2.5 2.5-5 5-7.5 7.5-10 10-12.5
12.5-15 >15
salt intake (g/day)
% o
f res
pond
ents
mean=7.0g/day
0.05.0
10.015.020.025.030.035.040.0
0-2.5 2.5-5 5-7.5 7.5-10 10-12.5 12.5-15 >15
salt intake (g/day)
% o
f res
pond
ents
mean=5.2g/day
19-24 male 19-24 female
0.05.0
10.015.020.025.030.035.0
0-2.5 2.5-5 5-7.5 7.5-10 10-12.5
12.5-15 >15
salt intake (g/day)
% o
f res
pond
ents mean=5.2g/day
11-14 boy
0.0
10.0
20.0
30.0
40.0
50.0
0-2.5 2.5-5 5-7.5 7.5-10 10-12.5
12.5-15 >15
salt intake (g/day)
% o
f res
pond
ents mean=4.2g/day
11-14 girl
0.0
10.0
20.0
30.0
40.0
50.0
0-2.5 2.5-5 5-7.5 7.5-10 10-12.5
12.5-15 >15
salt intake (g/day)
% o
f res
pond
ents mean=3.5g/day
5-6 child

ESR report on Salt in processed foods 13 prepared for the NZFSA, April 2006
The implication of the range and skew of salt intakes is that in the event of salt being fortified with iodine, the intake of iodine will similarly vary by factors of 9-35 for different population groups and the distribution of iodine intake will be influenced by the skew observed for salt intakes. 3.3 Foods contributing to sodium intake Foods that contributed more than 2% of total salt exposure across all respondents, for each of the sub populations, are shown in Figures 3-9. A tabulation of the proportion that each food makes to the estimated exposure is shown in Appendix 4. Foods not included in the tabulated results were not consumed by that particular sub population.
Figure 3: Food groups contributing more than 2% to salt intake for males 25+ years
0
5
10
15
20
25
30
bread white
bread wheat
sausage
meat pie
cheese
bacon
margarine
corned beef
pizza
ham
butter
other, <2%
% c
omtri
butio
n

ESR report on Salt in processed foods 14 prepared for the NZFSA, April 2006
Figure 4: Food groups contributing more than 2% to salt intake for young males 19-24 years
Figure 5: Food groups contributing more than 2% to salt intake for females 25+ years
0
5
10
15
20
25
30
bread white
bread wheat
sausage
cheese
meat pie
noodles instant
cake
margarine
muffin
bacon
pizza
soup
butter
corned beef
yeast extract
other, <2%
% c
omtri
butio
n
0
5
10
15
20
25
30
bread white
meat pie
bread wheat
hamburger
sausage
noodlesinstant
pizza
tomato
sauce
pasta sauce
cheese
other, <2%
% c
omtri
butio
n

ESR report on Salt in processed foods 15 prepared for the NZFSA, April 2006
Figure 6: Food groups contributing more than 2% to salt intake for young females 19-24 years
Figure 7: Food groups contributing more than 2% to salt intake for 11-14 boy
0
5
10
15
20
25
30
bread wheat
bread white
meat pie
sausage
ham
noodles instant
pizza
biscuit plain
cheese
tomato sauce
snacks flavoured
corned beef
potato crisps
other, <2%%
com
tribu
tion
0
5
10
15
20
25
30
35
bread white
bread wheat
sausage
meat pie
cheese
noodles instant
bacon
tomato sauce
corned beef
soup
margarine
pizza
snacks flavoured
other, <2%%
com
tribu
tion
ESR report on Salt in processed foods 16 prepared for the NZFSA, April 2006
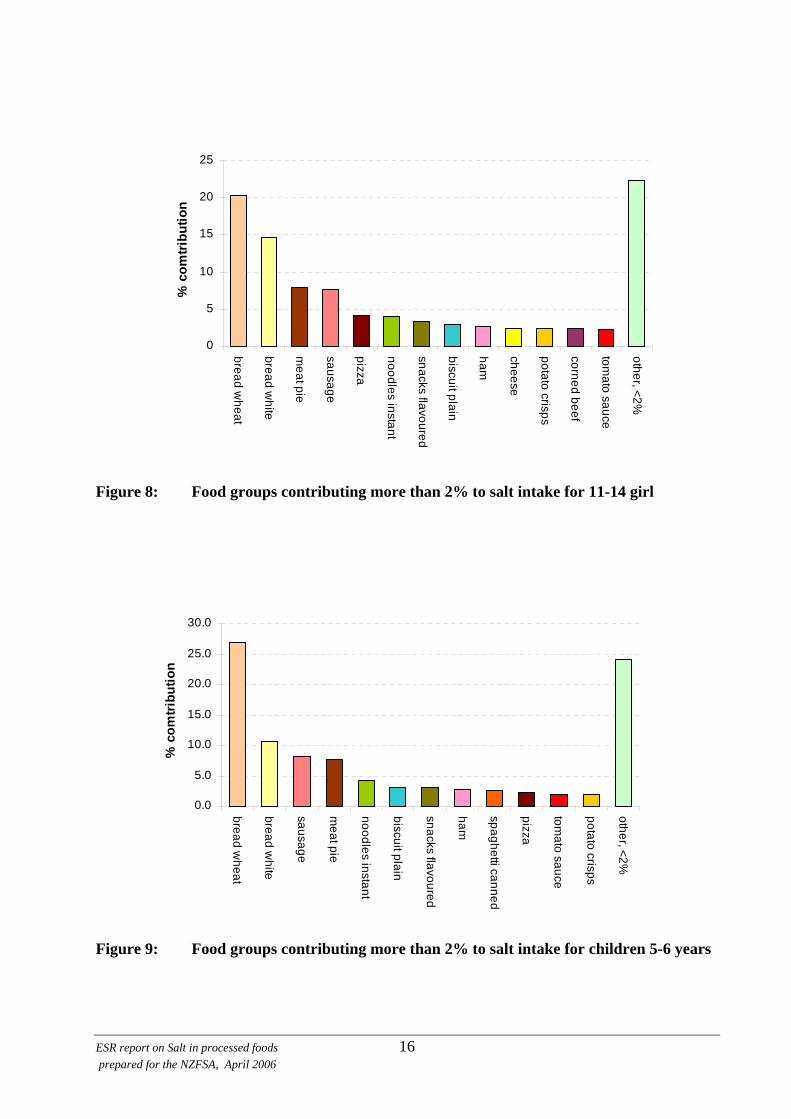
Figure 8: Food groups contributing more than 2% to salt intake for 11-14 girl
Figure 9: Food groups contributing more than 2% to salt intake for children 5-6 years
0.0
5.0
10.0
15.0
20.0
25.0
30.0
bread wheat
bread white
sausage
meat pie
noodles instant
biscuit plain
snacks flavoured
ham
spaghetti canned
pizza
tomato sauce
potato crisps
other, <2%%
com
tribu
tion
0
5
10
15
20
25
bread wheat
bread white
meat pie
sausage
pizza
noodles instant
snacks flavoured
biscuit plain
ham
cheese
potato crisps
corned beef
tomato sauce
other, <2%
% c
omtri
butio
n

ESR report on Salt in processed foods 17 prepared for the NZFSA, April 2006
Salt was spread across a wide range of foods as represented by the percentage contribution of all the “other” foods, individually contributing less than 2 percent but together comprising 21-27 percent of salt intake from processed foods. For each of the sub populations, bread, white and wheat combined, clearly made the greatest contribution accounting for 35 to 43% of salt intake. Other foods that contributed 2% or more to salt intake and were common across the age groups were sausage, meat pies, pizza, instant noodles (except for the 25+ males) and cheese (except for the 5-6 year old children). These foods might be targeted for iodine fortification across all population groups. Foods that were specific to particular age-gender groups were:
• for the 25+ year old males; bacon, margarine, corned beef, ham and butter • for the 25+ year old females; cake, margarine, muffin, bacon, soup, butter, corned
beef and yeast extract • for the young males; hamburgers, tomato sauce and pasta sauce • for the young females; bacon, tomato sauce, corned beef, soup, margarine and
flavoured snacks • for the 11-14 boy; ham, biscuits, tomato sauce, flavoured snacks, corned beef, and
potato crisps • for the 11-14 girl; flavoured snacks, biscuits, ham, potato crisps, corned beef, and
tomato sauce and • for the children 5-6 years; plain biscuits, flavoured snacks and potato chips, ham,
tomato sauce and canned spaghetti
and might be used to address fortification for a specific age-sex group.

ESR report on Salt in processed foods 18 prepared for the NZFSA, April 2006
4 REFERENCES BNF (British Nutrition Foundation), (1994) Salt in the diet, briefing paper. Available at http://www.nutrition.org.uk/home, Brady M. (2002) Sodium, High blood pressure and research needs. British Food Journal; 104 (2): 84-125. FAO/WHO. (2002) Evaluation of certain food additives. Fifty ninth report of the joint FAO/WHO Expert Committee on Food Additives. Geneva: World Health Organization. FOODfiles 2004. (2004) Datafiles of the New Zealand Food Composition Database. Palmerston North, New Zealand: New Zealand Institute of Crop & Food Research. Fregly M (1984) Sodium and Potassium. In: Nutrition Reviews’ Present Knowledge in Nutrition, 5th ed. Washington, DC: The Nutrition Foundation, 1984. pp439-458. FSANZ (Food Standards Australia New Zealand), formerly ANZFA. (2002) Australia New Zealand Food Standards Code, Standard 1.2.8 and 2.10.2. Anstat Pty Ltd: Melbourne, Australia. Available at www.nzfsa.govt.nz/fpolicy-law/legislation IFST (Institute of Food Science & Technology (2003). Salt. Available at http://www.ifst.org/hottop17.htm Mattes RD and Donnelly D. (1991). Relative contributions of dietary sodium sources. Journal of the American College of Nutrition; 10 (4): 383-393. MoH (Ministry of Health). (2003) NZ Food NZ Children. Key results of the 2002 National Children’s Nutrition Survey. Wellington: Ministry of Health. NRC (National Research Council). (1989) Recommended dietary allowances. 10th Edition. Washington, DC: National Academy Press. Russell DG, Parnell WR, Wilson NC et al., (1999). NZ Food:NZ People. Key results of the 1997 National Nutrition Survey. Ministry of Health: Wellington. SACN (UK Scientific Advisory Committee on Nutrition) (2003) Salt and Health. Available at http://www.food.gov.uk/mulitmedia/pdfs/saltandhealth0503.pdf Thomson CD. (2003) The declining iodine status of New Zealanders: Reasons, consequences and possible solutions. Proceedings of the Nutrition Society of New Zealand; 28: 35-42. Vannoort R. (2004a) 2003/04 New Zealand Total Diet Survey. Analytical results-Q1. ESR Client Report FW03/77. Christchurch: ESR Ltd. Vannoort R. (2004b) 2003/04 New Zealand Total Diet Survey. Analytical results-Q2. ESR Client Report FW04/16. Christchurch: ESR Ltd. Vannoort R. (2004c) 2003/04 New Zealand Total Diet Survey. Analytical results-Q3. ESR Client Report FW04/47. Christchurch: ESR Ltd.

ESR report on Salt in processed foods 19 prepared for the NZFSA, April 2006
Vannoort R. (2004d) 2003/04 New Zealand Total Diet Survey. Analytical results-Q2. ESR Client Report FW04/93. Christchurch: ESR Ltd. Vannoort RW and Thomson BM (2005a) 2003/04 New Zealand Total Diet Survey. Agricultural compound residues, selected contaminants & nutrients. ESR Client Report FW0549, Wellington, New Zealand: New Zealand Food Safety Authority. Vannoort RW and Thomson BM (2005b) 2003/04 Auxiliary data. New Zealand Total Diet Survey. Agricultural compound residues, selected contaminants & nutrients. ESR Client Report FW0561, Wellington, New Zealand: New Zealand Food Safety Authority.

ESR report on Salt in processed foods 20 prepared for the NZFSA, April 2006
Appendix 1: Consolidated data of sodium in New Zealand processed foods (mg/kg) (this study, 2003/04 NZTDS 1, Foodfiles 20042)
Bacon
Beans, baked, canned
Beef patty
Beetroot, canned
Biscuit, chocolate
Biscuit, cracker
Biscuits, plain sweet
Biscuits, plain sweet cont'd
Bran flake
cereal, mixed
Bread, mixed grain
Bread, mixed grain cont'd
Bread, wheatmeal
Bread, white Butter
17900 3680 3680 1655 1830 5420 3760 3980 4180 4400 5720 5320 5370 17600 4220 4220 1740 1680 3940 6870 2979 6730 3970 4400 5020 5470 5770 13200 3730 3730 368 1585 2410 2970 1130 1380 4130 4780 5180 5410 18900 3260 3260 3430 610 7680 3390 6870 50 3900 4406 4740 5010 5490 13400 3070 3070 349 2070 3990 3620 7150 4550 3630 5910 4800 5490 12600 5760 5760 1275 1380 6200 2810 1590 5210 6660 4660 5240 5610 14600 5680 5680 1640 2795 3610 2810 2350 5060 4520 4710 5590 13800 1000 1000 2080 1040 3870 2730 1970 4750 4700 4770 5960 14000 3390 3030 2540 3550 4300 6660 5850 8330 4800 14000 3800 3800 1410 7600 2210 8300 6660 5590 5100 4810 29300 1000 1000 1770 1500 8800 3620 9590 3630 5170 5100 24300 5760 5760 349 2520 5400 2670 110 3650 5090 5100 5430
3430 1570 5800 1730 70 3700 5100 5100 4800 16967 2600 3950 3500 150 4920 5320 5700 5960 12600 1600 8800 3470 4890 6410 4690 29300 1710 8850 1130 3409 4860 7460 4700
7500 1820 50 4900 6410 4690 Mean 1808 7300 3000 9590 3660 4800 4700 Min 610 6300 2540 4120 4800 3300 Max 3030 3210 4140 4800 4140 5787 1770 4110 4800 4800 2410 2210 4100 4800 8850 3980 3670 5317 4800 3500 3740 4520 4800 1360 3700 7460 2770 3700 5015 3200 4400 3300 3200 4400 8330

ESR report on Salt in processed foods 21 prepared for the NZFSA, April 2006
Appendix 1 cont’d: Consolidated data of sodium in New Zealand processed foods mg/kg
Cake
Cake cont'd
Cheese
Corn canned
Corned beef
Cornflakes
Crumbed chicken
Crumbed meat
Dairy dessert
Fish fingers
Ham
Hamburger
Icecream
KFC chicken
Luncheon
3750 3250 6160 958 7500 7000 2730 5570 520 3550 12300 4730 647 7630 9110 3270 3230 6940 1020 7930 7630 4290 3440 537 2880 14200 4170 373 6830 11870 3830 1360 6750 1160 8140 8810 3650 3050 693 5670 12100 3760 481 4340 9020 3850 6690 953 7290 5710 3750 4980 507 3150 13300 5090 457 8030 11260 3650 2600 5930 1450 9800 6640 2430 4000 564 3280 13300 4810 391 5900 11230 3870 740 6120 2470 11300 9600 3330 4280 723 4650 12600 6870 460 6550 12530 3750 4040 5840 1550 8810 4460 2020 3470 493 3160 13400 3980 430 5530 8360 3470 6000 1080 8860 6980 2860 4170 516 3920 15000 4550 436 5600 9670 3180 5740 1730 10900 9820 8060 13000 4810 460 7450 740 5700 6200 8300 3133 4120 569 8840 11130 5080 410 6301 12200
3400 6350 1375 6400 2020 3050 493 7240 12320 3510 320 4340 3600 6800 953 7100 7495 4290 5570 723 10000 12060 4080 460 8030 10270 1360 3940 2470 4460 7500 14160 5130 490 7450 1290 5090 8353 9820 4360 9430 5130 500 12530 1500 6380 6200 4520 14760 3490 400 2720 6000 11300 3230 11290 4440 720 4040 6080 4700 13040 600 3120 8130 2760 4602 640 2060 5270 12788 3490 490 2870 13000 5082 9430 6870 340 1620 7700 2760 15000 1230 11400 10000 475 890 16900 320
1170 2600 720 1600 2400 3310 6796 2650 2400 1000 16900

ESR report on Salt in processed foods 22 prepared for the NZFSA, April 2006
Appendix 1 cont’d: Consolidated data of sodium in New Zealand processed foods mg/kg
Margarine Meat pie
Milk, flavoured Muesli Muffin
Noodles, instant Pastrami Pate
Peanut butter Piccallili Pizza
Potato crisps
Prepared meal
Processed chicken
Processed potato
3990 4085 611 230 4980 4520 12550 6670 3580 3430 6010 880 5150 8030 3660 6130 4040 364 2610 4510 2160 10610 9340 6100 2160 6040 6000 2160 4660 3370 6550 4280 400 150 4420 3610 10220 10330 3890 2080 5770 6700 3030 7270 1740 5950 4650 386 910 3760 2800 14370 4620 4190 3580 5250 2880 3270 6020 3510 5920 3840 464 58 4490 1820 10980 9360 1590 2580 5700 6700 5300 4020 3100 5260 5295 352 4820 3690 3600 9130 4030 3340 2730 7240 7600 3010 7840 3590 3450 5280 372 50 3530 2680 10780 3340 5050 5480 5510 7030 2720 6260 3290 6020 5320 334 369 3690 3400 14190 10430 5090 4070 5790 4760 2950 6800 2260 3570 4550 650 470 3420 1300 8540 4350 12000 5450 7760 4550 730 4240 2400 5600 11604 8540 17000 5914 3570 3449 6363 3065 7310 2690 680 1140 7300 2870 9130 4131 5250 3320 2160 4020 1740 2500 4420 640 4660 2200 2740 14370 7520 1590 5511 7240 2570 5300 8030 3660
4520 700 1070 880 3340 6100 2080 1990 5368 4020 360 1620 4033 14370 17000 3210 2500 2580 360 2200 2922 4950 7760 1600 7300 880
4275 494 50 5600 4507 2580 334 4820 880 5320 730 7600

ESR report on Salt in processed foods 23 prepared for the NZFSA, April 2006
Appendix 1 cont’d: Consolidated data of sodium in New Zealand processed foods mg/kg Mayonnaise
dressing
Mayonnaise dressing cont'd
Salami
Sauce chilli/stirfry
Sauce pasta
Sausage
Smoked fish/meat
Snack bar
Snack bar
cont'd Snacks,
flavoured Soup Soup cont'd
Spaghetti in sauce, canned
stuffed chicken Sushi
8220 7930 15230 13650 3620 7455 7490 680 9500 3440 3250 3320 2980 2430 5690 6260 14580 7950 3610 6250 5550 1620 1205 13700 3540 4140 2210 3480 2190 7310 12970 3910 9180 17300 910 220 12800 4990 2779 4790 3900 7010 6290 7685 16650 15640 3890 8030 5700 2260 3550 9860 4140 940 4060 6490 4530 7780 2190 20220 7650 3570 6130 4050 3550 8660 4010 4990 3560 8500 4930 8210 12600 11430 13190 7280 7260 13670 3080 11600 3170 4470 4170 5560 4840 19020 21550 7670 8380 15850 640 5130 3070 4450 4990 4130 4810 16650 12780 4060 6130 12950 718 21300 2920 4330 3880 4170 8840 26200 4700 11800 10100 3130 7840 2920 4470 2780
12600 15136 3620 11900 12800 920 5350 2180 4640 10000 7310 3970 4701 7930 7880 800 7870 2520 4177 2210 4336 6420 20220 2610 3570 11800 15900 620 7100 2450 3320 8500 2430 6070 8370 7670 860 9750 2510 4790 7010 8190 18880 8520 10770 1050 3610
10400 3150 6130 4050 1070 10035 2490 7160 4950 11900 17300 1000 5130 2470
10900 2140 1300 21300 2890 9770 25100 1100 2490
10600 980 2370 7560 11354 950 1620 9310 2140 930 940 7340 26200 1210 2250 6490 1610 2050 8650 220 2260 8590 570 2350 3500 360 3170 8330 390 2220

ESR report on Salt in processed foods 24 prepared for the NZFSA, April 2006
Appendix 1 cont’d: Consolidated data of sodium in New Zealand processed foods mg/kg
Tomato Tomato sauce Wheatbix
Yeast extract Yoghurt
183 5030 3030 34400 404 49 7900 2950 42000 512
1580 7500 50 33100 379 57 7250 3920 41800 434
844 4760 2650 32300 484 1650 8500 2710 40000 425 2330 6960 2810 44000 501 2670 8680 3750 432 1380 6150 2700 38229 260
11500 32300 410 1194 2730 44000 490 49 7423 50 430
2670 4760 3920 340 11500 60 397 60
512

ESR report on Salt in processed foods 25 prepared for the NZFSA, April 2006
Appendix 2: Concentration of sodium (label claim and measured) and moisture content of targeted processed foods
Label* Measured Moisture Food mg/100g mg/100g %
processed chicken 924 803 54.7 430 466 60.8 714 727 54.0 710 602 59.0 364 402 61.6 520 784 57.8 630 626 58.8 872 680 48.3 mean 636 56.9 stuffed chicken product NA 298 61.8 NA 221 65.7 407 390 55.8 625 649 54.0 621 850 56.2 374 417 64.6 472 499 62.8 417 388 69.3 mean 464 61.3 crumbed chicken NA 273 67.8 390 429 60.4 NA 365 62.1 351 375 66.7 545 243 66.8 NA 333 63.0 NA 202 67.4 545 286 61.8 mean 313 64.5 KFC coated chicken pieces NA 763 43.4 NA 683 47.8 NA 434 43.1 NA 803 33.5 NA 590 49.6 NA 655 48.0 NA 553 41.0 NA 560 51.1 mean 630 44.7 bacon, Brand 1 1130 979 60.4 1350 1498 64.9 bacon, Brand 2 580 1014 54.1 1040 1201 67.1 bacon, Brand 3 650 1099 53.8 650 1022 62.8 bacon, Brand 4 580 495 50.2 1040 1425 61.1 mean 1092 59.3 pastrami 1560 1255 70.8 NA 1061 70.1 NA 1022 73.5 NA 1437 73.8 970 1098 71.8 1560 913 69.4

ESR report on Salt in processed foods 26 prepared for the NZFSA, April 2006
Label* Measured Moisture Food mg/100g mg/100g %
NA 1078 67.8 970 1419 73.2 mean 1160 71.3 processed 453 366 65.1 potato 410 337 67.0 230 174 66.8 250 351 60.7 280 310 79.0 360 359 59.3 370 329 68.6 460 226 60.0 mean 307 65.8 crumbed meats 620 557 54.1 NA 344 58.7 NA 305 63.5 450 498 53.6 353 400 49.6 380 428 52.1 NA 347 58.4 450 417 53.6 mean 412 55.5 prepared dinners 330 515 81.4 220 216 80.6 335 303 74.5 415 327 78.0 365 532 77.7 273 301 67.5 259 272 74.7 320 295 79.2 mean 345 76.7 Sushi NA 243 60.7 NA 348 60.6 NA 701 65.0 NA 453 61.1 NA 493 56.6 770 556 63.2 NA 413 61.1 NA 417 58.3 mean 453 60.8 beef patties 155 368 56.9 560 422 57.2 500 373 55.1 275 326 69.6 292 307 60.6 570 576 56.7 550 568 62.6 110 100 61.8 mean 380 60.1 ham and ham steaks 1235 1113 73.3 1100 1232 71.7 1300 1206 75.6 1540 1416 77.3 1100 943 74.5 1420 1476 75.4 1140 1129 74.8

ESR report on Salt in processed foods 27 prepared for the NZFSA, April 2006
Label* Measured Moisture Food mg/100g mg/100g %
1100 1304 73.5 mean 1227 74.5 luncheon 940 911 65.1 950 1187 74.6 950 902 75.3 1100 1126 64.4 650 1123 59.8 1300 1253 667 940 836 934 650 967 1033 mean 1038 462 paté NA 667 936 1140 934 403 NA 1033 334 340 462 1043 980 936 49.5 490 403 59.7 553 334 58.7 964 1043 61.1 mean 727 55.4 salami 1216 1523 42.5 NR 1458 49.7 950 731 55.5 1500 1665 39.4 1300 2022 60.2 1440 1143 52.2 1287 1902 61.0 1277 1665 59.5 mean 1514 52.5 mayonnaise dressing 665 649 49.1 1070 865 44.2 880 859 52.2 190 350 26.4 860 833 67.3 660 642 55.3 890 793 51.8 700 626 49.8 mean 689 49.5 pasta sauce 400 362 85.2 440 361 81.7 430 391 79.7 500 389 77.5 400 357 85.4 790 728 77.5 805 767 80.7 445 406 82.6 mean 470 81.3 chilli containing 1360 1365 57.2 sauces 780 795 69.5 1490 1297 71.6 1710 1564 49.4 780 765 69.9 1490 1319 72.0 1770 2155 68.8 1360 1278 57.5

ESR report on Salt in processed foods 28 prepared for the NZFSA, April 2006
Label* Measured Moisture Food mg/100g mg/100g %
mean 1317 64.5 stir fry sauces 340 362 67.3 395 397 72.4 265 261 78.2 735 837 61.2 2020 1888 57.4 340 315 68.0 645 495 86.2 180 214 77.0 mean 596 71.0 piccalilli, chow 362 343 71.3 121 216 69.2 117 208 70.5 362 358 71.2 121 258 70.3 262 273 71.0 370 548 78.9 330 407 74.2 mean 326 72.1 smoked fish 1656 749 70.5 946 555 67.1 3000 1730 65.5 1365 570 61.3 690 405 52.1 smoked meat NA 1367 75.4 1560 1585 62.1 1570 1295 68.6 mean 1032 65.3
NA=no nutritional information panel available

ESR report on Salt in processed foods 29 prepared for the NZFSA, April 2006
Appendix 3: Quality assurance data A3.1: Duplicate analyses for sodium mg/100g
Food Type Range of results
No. of duplicates mean std dev %CV
chicken nuggets 474-457 1 465.5 12.0 2.6stuffed chicken product 286-870 2 573.7 31.6 5.5crumbed schnitzel 363-366 1 364.5 2.1 0.6KFC 557-563 1 560.0 4.2 0.8middle bacon 1019-1624 3 1315 129 9.9pastrami 1107-1088 1 1097.5 13.4 1.2processed potato 222-229 1 225.5 4.9 2.2meat rissoles 345-342 1 343.5 2.1 0.6chicken chow mein 549-515 1 532.0 24.0 4.5sushi 421-414 1 417.5 4.9 1.2beef patties 307-307 1 307.0 0.0 0.0hamsteak 1231-1232 1 1231.5 0.7 0.1luncheon 905-1256 4 1118.7 58.0 5.2pate 448-475 1 461.5 19.1 4.1salami 1604-1725 2 1665.0 121 7.3mayonnaise dressing 780-848 2 828.7 35.5 4.3tomato pasta sauce 715-819 1 767.0 73.5 9.6chilli sauce 1268-1462 1 1365.0 137.2 10.0stir fry 343-399 2 379.2 37.0 9.8piccalilli 196-348 2 275.3 15.2 5.5smoked meat/fish 732-765 2 748.5 23.3 3.1

ESR report on Salt in processed foods 30 prepared for the NZFSA, April 2006
A3.2: Percentage recovery of sodium from spiked samples. Food type % Recovery
processed chicken 98.9 crumbed chicken 83.9 bacon 98.7 crumbed meat 94.4 prepared dinner 100.5 beef pattie 101.6 luncheon 62.0 mayonnaise dressing 97.1 pasta sauce 102.0 stir fry sauce 95.5 smoked meat/fish 96.1

ESR report on Salt in processed foods 31 prepared for the NZFSA, April 2006
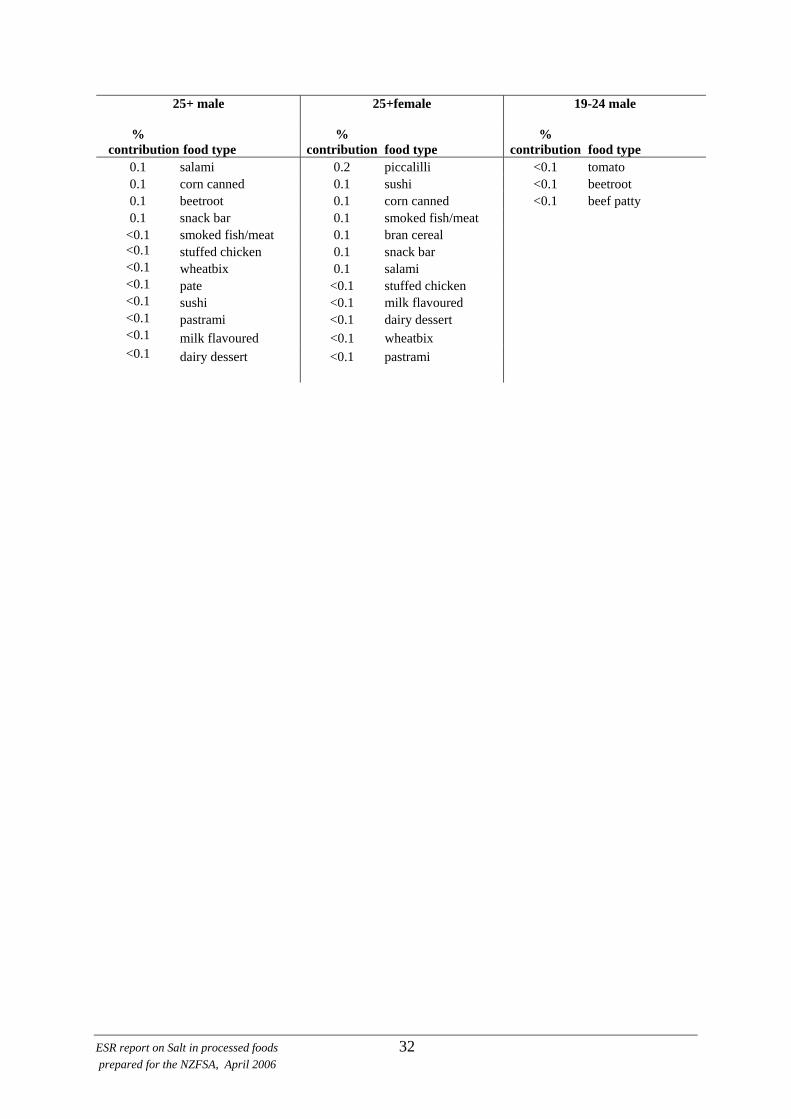
Appendix 4: Percentage contribution of individual foods to estimated dietary exposure to salt from processed food for adult males (25 years +), young males (19-24) and for children 5-6 years.
25+ male
25+female
19-24 male
% contribution food type
% contribution food type
% contribution food type
26.7 bread white 27.3 bread white 24.4 bread white 16.0 bread wheat 16.0 bread wheat 10.9 meat pie 6.1 sausage 4.4 sausage 9.9 bread wheat 5.7 meat pie 4.3 cheese 6.2 hamburger 3.7 cheese 3.5 meat pie 5.5 sausage 2.9 bacon 2.8 noodles instant 4.6 noodles instant 2.6 margarine 2.6 cake 4.3 pizza 2.5 corned beef 2.6 margarine 3.2 tomato sauce 2.5 pizza 2.5 muffin 2.4 sauce pasta 2.3 ham 2.4 bacon 2.3 cheese 2.1 butter 2.2 pizza 1.9 yeast extract 1.9 cake 2.1 soup 1.9 bacon 1.8 noodles instant 2.1 butter 1.8 margarine 1.6 biscuit plain 2.0 corned beef 1.7 butter 1.5 yeast extract 2.0 yeast extract 1.6 potato crisps 1.4 bread mixed 1.8 ham 1.6 spaghetti canned 1.3 soup 1.6 biscuit plain 1.5 KFC chicken 1.3 fish finger 1.3 biscuit cracker 1.5 corned beef 1.3 hamburger 1.2 tomato sauce 1.3 processed potato 1.3 luncheon 1.2 sauce pasta 1.2 snacks flavoured 1.2 muffin 1.1 bread mixed 1.2 ham 1.0 tomato sauce 1.1 fish finger 1.0 crumbed chicken 0.9 sauce pasta 1.1 hamburger 0.9 sauce chilli/stirfry 0.9 spaghetti canned 1.0 salad dressing 0.9 biscuit plain 0.8 beans baked 0.8 sauce chilli/stirfry 0.8 cake 0.8 salad dressing 0.8 processed potato 0.6 crumbed meat 0.8 biscuit cracker 0.7 spaghetti canned 0.5 soup 0.7 crumbed chicken 0.7 luncheon 0.5 fish finger 0.6 sauce chilli/stirfry 0.6 potato crisps 0.5 bread mixed 0.5 KFC chicken 0.6 crumbed chicken 0.5 prepared meal 0.5 processed potato 0.5 KFC chicken 0.4 salad dressing 0.5 snacks flavoured 0.5 beans baked 0.4 luncheon 0.4 potato crisps 0.5 snacks flavoured 0.3 processed chicken 0.4 crumbed meat 0.4 crumbed meat 0.3 cornflakes 0.4 cornflakes 0.4 yoghurt 0.3 peanut butter 0.4 prepared meal 0.3 prepared meal 0.2 icecream 0.3 icecream 0.3 icecream 0.2 biscuit cracker 0.3 beef patty 0.3 processed chicken 0.2 beans baked 0.3 muesli 0.2 muesli 0.1 yoghurt 0.3 processed chicken 0.2 biscuit chocolate 0.1 biscuit chocolate 0.2 peanut butter 0.2 beef patty 0.1 corn canned 0.2 biscuit chocolate 0.2 pate 0.1 milk flavoured 0.2 tomato 0.2 tomato <0.1 muesli 0.2 yoghurt 0.2 beetroot <0.1 muffin 0.2 piccalilli 0.2 peanut butter <0.1 salami 0.1 bran cereal 0.2 cornflakes <0.1 snack bar
ESR report on Salt in processed foods 32 prepared for the NZFSA, April 2006
25+ male
25+female
19-24 male
% contribution food type
% contribution food type
% contribution food type
0.1 salami 0.2 piccalilli <0.1 tomato 0.1 corn canned 0.1 sushi <0.1 beetroot 0.1 beetroot 0.1 corn canned <0.1 beef patty 0.1 snack bar 0.1 smoked fish/meat
<0.1 smoked fish/meat 0.1 bran cereal <0.1 stuffed chicken 0.1 snack bar <0.1 wheatbix 0.1 salami <0.1 pate <0.1 stuffed chicken <0.1 sushi <0.1 milk flavoured <0.1 pastrami <0.1 dairy dessert <0.1 milk flavoured <0.1 wheatbix <0.1 dairy dessert <0.1 pastrami

ESR report on Salt in processed foods 33 prepared for the NZFSA, April 2006
19-24 female
11-14 boy
11-14 girl
%
contributionfood type %
contribution food type %
contribution food type 31.4 bread white 22.5 bread wheat 20.3 bread wheat 10.1 bread wheat 12.8 bread white 14.7 bread white 7.5 sausage 7.9 meat pie 7.9 meat pie 5.7 meat pie 7.4 sausage 7.7 sausage 4.4 cheese 4.0 ham 4.2 pizza 4.4 noodles instant 3.0 noodles instant 4.0 noodles instant 2.2 bacon 2.9 pizza 3.4 snacks flavoured 2.2 tomato sauce 2.6 biscuit plain 3.0 biscuit plain 2.1 corned beef 2.5 cheese 2.7 ham 2.0 soup 2.5 tomato sauce 2.5 cheese 2.0 margarine 2.5 snacks flavoured 2.4 potato crisps 2.0 pizza 2.4 corned beef 2.4 corned beef 2.0 snacks flavoured 2.0 potato crisps 2.3 tomato sauce 1.6 ham 1.8 margarine 1.8 cake 1.6 potato crisps 1.8 cake 1.8 hamburger 1.6 hamburger 1.6 luncheon 1.6 margarine 1.4 biscuit plain 1.6 spaghetti canned 1.3 biscuit cracker 1.4 butter 1.5 bacon 1.3 yeast extract 1.1 sauce pasta 1.1 muffin 1.2 muffin 1.1 KFC chicken 1.0 prepared meal 1.2 KFC chicken 1.0 yeast extract 1.0 biscuit cracker 1.1 fish finger 1.0 cake 1.0 fish finger 0.9 bacon 0.9 luncheon 0.9 hamburger 0.9 spaghetti canned 0.9 muffin 0.9 yeast extract 0.8 crumbed chicken 0.9 biscuit cracker 0.9 crumbed chicken 0.8 sauce pasta 0.7 processed potato 0.8 processed chicken 0.7 beans baked 0.7 crumbed chicken 0.8 salad dressing 0.7 processed chicken 0.7 salad dressing 0.7 beef patty 0.6 icecream 0.6 beans baked 0.7 soup 0.6 salad dressing 0.6 bread mixed 0.6 icecream 0.6 butter 0.6 sauce chilli/stirfry 0.6 beans baked 0.5 processed potato 0.6 cornflakes 0.6 KFC chicken 0.5 luncheon 0.5 fish finger 0.5 butter 0.5 beef patty 0.3 beef patty 0.5 peanut butter 0.5 soup 0.3 spaghetti canned 0.4 processed potato 0.4 biscuit chocolate 0.2 peanut butter 0.4 sauce pasta 0.4 crumbed meat 0.2 tomato 0.4 sauce chilli/stirfry 0.4 snack bar 0.2 icecream 0.4 snack bar 0.3 peanut butter 0.2 yoghurt 0.4 crumbed meat 0.2 prepared meal 0.2 corn canned 0.3 muesli 0.2 sauce chilli/stirfry 0.2 biscuit chocolate 0.3 cornflakes 0.2 cornflakes 0.2 stuffed chicken 0.3 biscuit chocolate 0.2 muesli 0.2 sushi 0.2 smoked fish/meat 0.2 bread mixed 0.1 snack bar 0.2 bread mixed 0.1 milk flavoured 0.1 beetroot 0.2 sushi 0.1 yoghurt 0.1 prepared meal 0.1 tomato 0.1 wheatbix
<0.1 pate 0.1 wheatbix 0.1 salami <0.1 dairy dessert 0.1 milk flavoured 0.1 pastrami <0.1 muesli 0.1 salami <0.1 corn canned

ESR report on Salt in processed foods 34 prepared for the NZFSA, April 2006
19-24 female
11-14 boy
11-14 girl
% contributionfood type
% contribution food type
% contribution food type
<0.1 piccalilli 0.1 yoghurt <0.1 pate <0.1 crumbed meat 0.1 bran cereal <0.1 stuffed chicken
0.1 corn canned <0.1 tomato 0.1 stuffed chicken <0.1 sushi 0.1 pastrami <0.1 dairy dessert <0.1 piccalilli <0.1 piccalilli <0.1 pate <0.1 beetroot <0.1 beetroot <0.1 bran cereal

ESR report on Salt in processed foods 35 prepared for the NZFSA, April 2006
5-6 child
% contribution food type
26.9 bread wheat 10.7 bread white 8.3 sausage 7.8 meat pie 4.2 noodles instant 3.1 biscuit plain 3.1 snacks flavoured 2.7 ham 2.6 spaghetti canned 2.3 pizza 2.0 tomato sauce 2.0 potato crisps 1.8 cheese 1.8 margarine 1.6 luncheon 1.5 muffin 1.4 yeast extract 1.3 corned beef 1.2 hamburger 1.1 processed chicken 1.1 KFC chicken 1.1 cake 0.9 biscuit cracker 0.7 soup 0.6 butter 0.6 fish finger 0.6 snack bar 0.6 icecream 0.5 cornflakes 0.5 sauce pasta 0.5 beans baked 0.5 crumbed chicken 0.4 biscuit chocolate 0.4 peanut butter 0.4 bread mixed 0.3 beef patty 0.3 sauce chilli/stirfry 0.3 sushi 0.3 prepared meal 0.3 salad dressing 0.3 processed potato 0.2 muesli 0.2 wheatbix 0.2 bacon 0.2 yoghurt 0.1 milk flavoured 0.1 bran cereal 0.1 crumbed meat 0.1 tomato
<0.1 dairy dessert

ESR report on Salt in processed foods 36 prepared for the NZFSA, April 2006
5-6 child %
contribution food type <0.1 corn canned <0.1 pastrami <0.1 piccalilli <0.1 beetroot