survey of the economics of hydrogen … of the economics of hydrogen technologies september 1999 •...
TRANSCRIPT
Survey of the Economics ofHydrogen Technologies
September 1999 • NREL/TP-570-27079
C.E.G. Padró and V. Putsche
National Renewable Energy Laboratory1617 Cole BoulevardGolden, Colorado 80401-3393
NREL is a U.S. Department of Energy LaboratoryOperated by Midwest Research Institute •••• Battelle •••• Bechtel
Contract No. DE-AC36-98-GO10337

National Renewable Energy Laboratory1617 Cole BoulevardGolden, Colorado 80401-3393
NREL is a U.S. Department of Energy LaboratoryOperated by Midwest Research Institute •••• Battelle •••• Bechtel
Contract No. DE-AC36-98-GO10337
September 1999 • NREL/TP-570-27079
Survey of the Economics ofHydrogen Technologies
C.E.G. Padró and V. PutschePrepared under Task No. HY921013

NOTICE
This report was prepared as an account of work sponsored by an agency of the United Statesgovernment. Neither the United States government nor any agency thereof, nor any of their employees,makes any warranty, express or implied, or assumes any legal liability or responsibility for the accuracy,completeness, or usefulness of any information, apparatus, product, or process disclosed, or representsthat its use would not infringe privately owned rights. Reference herein to any specific commercialproduct, process, or service by trade name, trademark, manufacturer, or otherwise does not necessarilyconstitute or imply its endorsement, recommendation, or favoring by the United States government or anyagency thereof. The views and opinions of authors expressed herein do not necessarily state or reflectthose of the United States government or any agency thereof.
Available to DOE and DOE contractors from:Office of Scientific and Technical Information (OSTI)P.O. Box 62Oak Ridge, TN 37831
Prices available by calling 423-576-8401
Available to the public from:National Technical Information Service (NTIS)U.S. Department of Commerce5285 Port Royal RoadSpringfield, VA 22161703-605-6000 or 800-553-6847orDOE Information Bridgehttp://www.doe.gov/bridge/home.html
Printed on paper containing at least 50% wastepaper, including 20% postconsumer waste

1
Introduction
A survey of the economics of hydrogen production, storage, transport, and end-use technologies has beencompleted. More than 100 publications concerning the economics of current and near-term hydrogentechnologies were surveyed. Technologies more than 20 years from commercialization were notconsidered.
Table 1: Technologies Included in the SurveyHydrogen Production
Steam Methane ReformingNoncatalytic Partial Oxidation
Coal GasificationBiomass Gasification
Biomass PyrolysisElectrolysis
Hydrogen StorageCompressed Gas
Liquefied GasMetal HydrideCarbon-Based
Chemical HydridesHydrogen Transport
PipelinesTruck Transport
Rail TransportShip Transport
Stationary PowerProton Exchange Membrane Fuel Cells (PEMFC)
Phosphoric Acid Fuel Cells (PAFC)Solid Oxide Fuel Cells (SOFC)
Molten Carbonate Fuel Cells (MCFC)Alkaline Fuel Cells (AFC)
Gas TurbineStationary Internal Combustion Engine
Transportation ApplicationsHydrogen Fuel Cell Vehicles
Hydrogen Internal Combustion EnginesHybrid VehiclesOnboard Storage
Onboard ReformingRefueling Options
Where possible, the results of the studies have been standardized using the methodology described inAppendix A. If standardization was not possible, the literature values were used to provide rough checksagainst the detailed estimates. This report briefly describes each technology, summarizes the status, andpresents the results of the survey and standardization analysis.
In this report, capital costs are shown as the specific total capital investment (TCI) in $/GJ. Specific TCIis a measure of the capital cost of a facility for each unit of hydrogen produced, processed, or stored. Forhydrogen production technologies, this value is the TCI divided by the annual hydrogen productioncapacity. For hydrogen storage technologies, the specific TCI is the TCI divided by the annualthroughput. Another important convention of the report is the energy convention. Unless otherwisespecified, all energy units (e.g., GJ) are reported on a lower heating value (LHV) basis.
2
Hydrogen Production Technologies
Hydrogen may be produced from a variety of feedstocks (e.g., natural gas, biomass, water) using severaltechnologies (e.g., reforming, gasification, electrolysis). For this analysis, commercial and near-commercial technologies, including steam methane reforming (SMR), coal gasification, noncatalyticpartial oxidation, biomass gasification and pyrolysis, electrolysis, and concentrated solar energy, will bediscussed.
Steam Methane Reforming
Steam methane reforming is the most common and least expensive method of producing hydrogen;almost 48% of the world’s hydrogen is produced from SMR (Gaudernack 1998). SMR can also beapplied to other hydrocarbons such as ethane and naphtha. Heavier feedstocks, however, cannot be usedbecause they may contain impurities and the feed to the reformer must be a vapor (Leiby 1994). Otherprocesses such as partial oxidation (POX) are more efficient with higher hydrocarbons.
Steam methane reforming is a well-developed, fully commercialized process. Potential areas fortechnical improvements include the use of prereformers and medium temperature shift reactors (Leiby1994).
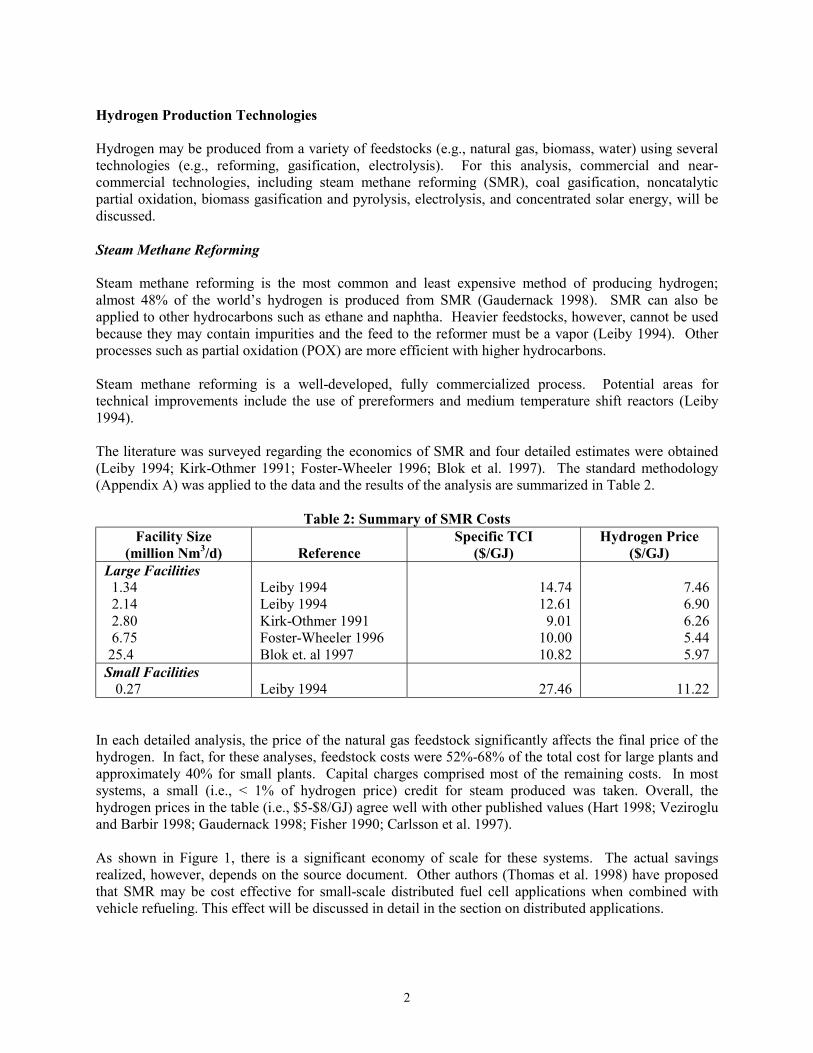
The literature was surveyed regarding the economics of SMR and four detailed estimates were obtained(Leiby 1994; Kirk-Othmer 1991; Foster-Wheeler 1996; Blok et al. 1997). The standard methodology(Appendix A) was applied to the data and the results of the analysis are summarized in Table 2.
Table 2: Summary of SMR CostsFacility Size
(million Nm3/d) ReferenceSpecific TCI
($/GJ)Hydrogen Price
($/GJ)Large Facilities 1.34 2.14 2.80 6.75 25.4
Leiby 1994Leiby 1994Kirk-Othmer 1991Foster-Wheeler 1996Blok et. al 1997
14.7412.619.01
10.0010.82
7.466.906.265.445.97
Small Facilities 0.27 Leiby 1994 27.46 11.22
In each detailed analysis, the price of the natural gas feedstock significantly affects the final price of thehydrogen. In fact, for these analyses, feedstock costs were 52%-68% of the total cost for large plants andapproximately 40% for small plants. Capital charges comprised most of the remaining costs. In mostsystems, a small (i.e., < 1% of hydrogen price) credit for steam produced was taken. Overall, thehydrogen prices in the table (i.e., $5-$8/GJ) agree well with other published values (Hart 1998; Vezirogluand Barbir 1998; Gaudernack 1998; Fisher 1990; Carlsson et al. 1997).
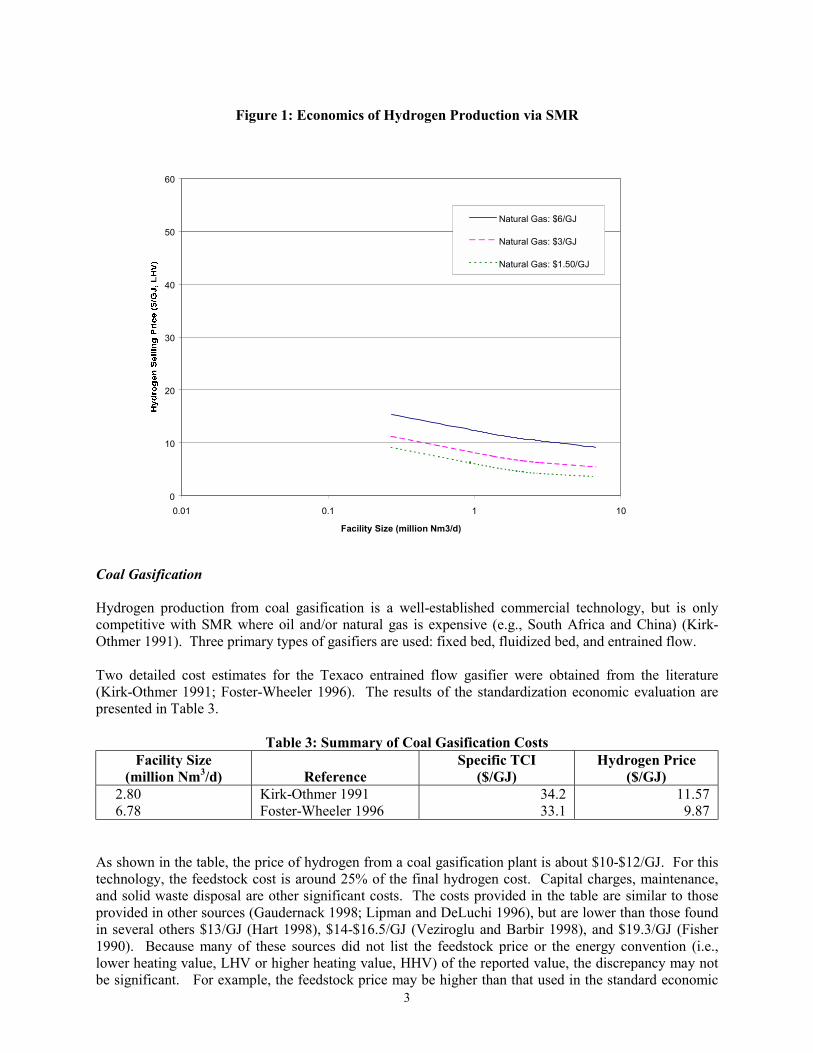
As shown in Figure 1, there is a significant economy of scale for these systems. The actual savingsrealized, however, depends on the source document. Other authors (Thomas et al. 1998) have proposedthat SMR may be cost effective for small-scale distributed fuel cell applications when combined withvehicle refueling. This effect will be discussed in detail in the section on distributed applications.
3
Figure 1: Economics of Hydrogen Production via SMR
0
10
20
30
40
50
60
0.01 0.1 1 10
Facility Size (million Nm3/d)
Natural Gas: $6/GJ
Natural Gas: $3/GJ
Natural Gas: $1.50/GJ
Coal Gasification
Hydrogen production from coal gasification is a well-established commercial technology, but is onlycompetitive with SMR where oil and/or natural gas is expensive (e.g., South Africa and China) (Kirk-Othmer 1991). Three primary types of gasifiers are used: fixed bed, fluidized bed, and entrained flow.
Two detailed cost estimates for the Texaco entrained flow gasifier were obtained from the literature(Kirk-Othmer 1991; Foster-Wheeler 1996). The results of the standardization economic evaluation arepresented in Table 3.
Table 3: Summary of Coal Gasification CostsFacility Size
(million Nm3/d) ReferenceSpecific TCI
($/GJ)Hydrogen Price
($/GJ) 2.80 6.78
Kirk-Othmer 1991Foster-Wheeler 1996
34.233.1
11.579.87
As shown in the table, the price of hydrogen from a coal gasification plant is about $10-$12/GJ. For thistechnology, the feedstock cost is around 25% of the final hydrogen cost. Capital charges, maintenance,and solid waste disposal are other significant costs. The costs provided in the table are similar to thoseprovided in other sources (Gaudernack 1998; Lipman and DeLuchi 1996), but are lower than those foundin several others $13/GJ (Hart 1998), $14-$16.5/GJ (Veziroglu and Barbir 1998), and $19.3/GJ (Fisher1990). Because many of these sources did not list the feedstock price or the energy convention (i.e.,lower heating value, LHV or higher heating value, HHV) of the reported value, the discrepancy may notbe significant. For example, the feedstock price may be higher than that used in the standard economic

4
analysis and if the hydrogen prices were on an LHV basis instead of the assumed HHV basis, the costwould be lower. In any case, the values are all within reasonable bounds of each other, given theuncertainty in the source documents.
Because there are significant coal reserves in many areas of the world, coal could replace natural gas andoil as the primary feedstock for hydrogen production (Kirk-Othmer 1991). However, this technology hasenvironmental impacts (e.g., feedstock procurement) that may prove significant in the future.
Figure 2 summarizes the cost of hydrogen production from coal gasification.
Figure 2: Economics of Hydrogen Production via Coal Gasification
0
10
20
30
40
50
60
0.01 0.1 1 10
Facility Size (million Nm3/d)
Coal: $3/GJ
Coal: $1.50/GJ
Coal: $0.75/GJ
Partial Oxidation of Hydrocarbons
Hydrogen may be formed from the noncatalytic partial oxidation (i.e., gasification) of hydrocarbons suchas residual oil. Any hydrocarbon feedstock that can be compressed or pumped may be used in thistechnology (Kirk-Othmer 1991). However, the overall efficiency of the process (50%) is less than thatfor SMR (65%-75%) and pure oxygen is required (Veziroglu and Barbir 1998; Kirk-Othmer 1991). Twocommercial technologies for this conversion are available: the Texaco Gasification Process and the ShellGasification Process (Kirk-Othmer 1991; Leiby 1994).

5
Table 4 summarizes the results of the economic standardization analysis for noncatalytic partial oxidation.
Table 4: Summary of Hydrogen Production Costs from Noncatalytic Partial Oxidation
Facility Size(million Nm3/d) Reference Feedstock
Specific TCI($/GJ)
Hydrogen Price($/GJ)
Large Facilities 1.34 2.14 2.80
Leiby 1994Leiby 1994Kirk-Othmer 1991
Coker off-gasCoker off-gasResidual oil
11.249.6322.2
7.396.949.83
Small Facilities 0.27 Leiby 1994 Coker off-gas 21.96 10.73
From these analyses, the price of hydrogen from coker off-gas is estimated at $7-$11/GJ based on afeedstock price of $2.7/GJ (HHV). The hydrogen price from residual fuel ($1.4/GJ) is estimated atroughly $10/GJ. These results agree well with other published values (1998$) $10.6/GJ (Hart 1998) and$11.8/GJ (Veziroglu and Barbir 1998).
The specific TCI for the residual oil case is significantly higher than that for a similar facility based oncoker off-gas. This result is expected because of increased equipment for feed handling and impurityremoval. For the facilities based on coker off-gas, there is a significant economy of scale with a resultingreduction in the price of hydrogen. A similar effect is expected for a facility based on residual fuel.
Biomass Gasification
As with coal gasification, biomass may be gasified using a variety of methods, primarily indirect anddirect gasification. Indirect gasification, as exemplified by the Battelle-Columbus Laboratories andFuture Energy Resources Corporation (BCL/FERCO) gasifier, uses a medium such as sand to transferheat from the char combustor to the gasification vessel (Spath and Mann 1998). In direct gasification(e.g., the Institute of Gas Technology, IGT, gasifier) heat to the gasification vessel is supplied by thecombustion of a portion of the feed biomass.
Comprehensive, detailed studies on indirect gasification using the BCL/FERCO gasifier were completed(Mann 1995a; Larson and Katofsky 1992). The Larson and Katofsky (1992) study also presented resultsfor the Wright-Malta (WM) indirect gasifier. Similar studies on the direct gasification method have notbeen obtained, but general information is available (Spath and Mann 1998). In addition, two othersources have reported hydrogen production costs from generic biomass gasification systems (Hart 1998;Lipman and DeLuchi 1996).
Capital costs for a large (0.7-2.0 million Nm3/d) BCL/FERCO indirect biomass gasification are estimatedat $20.6 (Larson and Katofsky 1992) to $38.2/GJ (Mann 1995a). The specific TCI for the WM gasifier isprojected to be $26.91/GJ. The major operating cost, by far, for this technology is the feed. Using theprojected biomass costs of $46.30/dT, the feedstock price is about 40% of the cost of hydrogen from largefacilities producing 0.7-2.2 million Nm3/d. This feedstock price represents the expected feedstock pricefrom dedicated biomass production. Waste biomass, however, may be available for as low as $16.50/dT(Mann 1995a). Another important factor in the price of the hydrogen is the by-product steam credit; thiscredit is roughly equivalent to all the variable operating costs, except feedstock.
The overall price of hydrogen from the BCL/FERCO gasifier is $13.08/GJ for the 0.7 million Nm3/dfacility (Mann 1995a) and $8.69/GJ for the 2.2 million Nm3/day facility (Larson and Katofsky 1992).Costs for the WM gasifier are similar, at $10/GJ. Smaller facilities (0.02 and 0.2 Nm3/d), which couldlikely be supported with waste feedstocks at $16.50/dT, would produce hydrogen for $17.10 and
6
$10.65/GJ, respectively. These costs are similar to others for generic gasification facilities: $15.3/GJ(Hart 1998) and $11-$14/GJ (Lipman and DeLuchi 1996).
In general, hydrogen produced via direct gasification is expected to cost slightly more (i.e., 5%) than thatfrom the indirect mode. Hydrogen produced using the Texaco gasifier is projected to be prohibitivelyexpensive (Spath and Mann 1998).
Biomass Pyrolysis
In this process, biomass is thermally decomposed at a high temperature (450°-550°C) in an inertatmosphere to form a bio-oil composed of about 85% oxygenated organics and 15% water (Mann 1995b).The bio-oil is then steam reformed using conventional technology to produce hydrogen. Alternatively,the phenolic components of the bio-oil can be extracted with ethyl acetate to produce anadhesive/phenolic resin coproduct; the remaining components can be reformed as in the first option. Theproduct gas from both alternatives is purified using a standard pressure swing adsorption (PSA) system.
Several sources (Spath and Mann 1998; Gregoire 1992; Chornet et al. 1995; Mann 1995b) have providedeconomic analyses of biomass pyrolysis processes. Many of the analyses compare purchasing the oil withmaking it in-house. Although making the oil in-house results in a hydrogen price that is lower than whenpurchasing oil, the oils will likely need to be purchased based on a projected market for the oils (Mann1995b). Therefore, in this analysis, the oil was assumed to be purchased at $110/tonne.
Based on the Mann (1995b) analysis and the standard economic methodology, the specific TCI for a largefacility, processing bio-oils equivalent to 907 dTpd of biomass, is estimated at $15-$17/GJ. The highervalue corresponds to the coproduct case because less hydrogen is produced; thus, the capital investmentper unit of hydrogen increases. The overall hydrogen production price is estimated to be $9-$12/GJ forboth cases. As expected, the coproduct option can be more cost-effective than the total reformation case,because the selling price of the coproduct is moderate to high. Costs were also developed for facilitiesprocessing oils based on feedstock rates of 272 and 27 dTpd. The overall hydrogen production prices forthese cases are $10-$15/GJ. Table 5 summarizes the standardized costs for biomass gasification andpyrolysis.

7
Table 5: Summary of Hydrogen Production Costs for Biomass Gasification and Pyrolysis
FacilityType/Size(million Nm3/d) Reference
Specific TotalCapital
Investment($/GJ)
HydrogenPrice
($/GJ)1
BiomassPrice
($/dry tonne)Biomass Gasification 2.26 2.16 0.720 0.215 0.022
Larson 1992Larson 1992Mann 1995Mann 1995Mann 1995
26.9120.6038.1942.0073.85
10.038.69
13.0910.6517.10
46.3046.3046.3016.5016.50
Biomass Pyrolysis All Reformed 1.014 0.304 0.030 Coproduct 0.811 0.243 0.024
Mann 1995aMann 1995aMann 1995a
Mann 1995aMann 1995aMann 1995a
14.9417.1426.05
16.7419.3130.66
12.4212.9215.52
8.8610.1112.73
46.3016.5016.50
46.3016.5016.50
Figures 3 and 4 present the costs for biomass gasification and pyrolysis, respectively.
Figure 3: Economics of Hydrogen Production via Biomass Gasification
0
10
20
30
40
50
60
0.01 0.1 1 10
Facility Size (million Nm3/d)
Biomass: $46/T
Biomass: $13/T
Biomass: $0/T

8
Figure 4: Economics of Hydrogen Production via Biomass Pyrolysis
0
10
20
30
40
50
60
0.01 0.1 1 10
Facility Size (million Nm3/d)
Reformed, Oils: $220/T
Reformed, Oils: $110/T
Reformed, Oils: $55/T
Co-product, Oils: $220/T
Co-product, Oils: $110/T
Co-product, Oils: $55/T
Electrolysis
A small amount (4%) of the world’s hydrogen is produced by electrolysis of water. For users requiringsmall amounts of extremely pure hydrogen, electrolysis can be a cost-effective means of obtaining therequired hydrogen. The major cost factor for electrolysis is the electricity. In some cases, using thestandard electricity price of $0.049/kWh, this cost is more than 80% of the resulting hydrogen sellingprice. For renewable technologies, the capital costs dominate. For example, the annual capital costs ofthe photovoltaic (PV) system could be as much as 85% of the hydrogen price. The cost of the electricityis a major concern because it is three to five times more expensive a “feedstock” than fossil fuels. In fact,the high cost of the electricity is the driving force behind the development of high-temperature steamelectrolysis. In this process, some of the energy driving the process can be from steam instead ofelectricity. For example, at 1000°C, more than 40% of the energy required could be supplied as heat(Kirk-Othmer 1991).
Several detailed studies on the economics of hydrogen production from electrolysis were obtained in theliterature (Foster-Wheeler 1996; Kirk-Othmer 1991; Andreassen 1998; Mann et al. 1998). Some focusedon renewable electricity sources (i.e., wind and PV) and/or on very small-scale systems. Table 6summarizes the standardized costs for hydrogen production via electrolysis.

9
Table 6: Summary of Costs for Hydrogen Production from ElectrolysisFacility Size
(million Nm3/d) ReferenceSpecific TCI
($/GJ)Hydrogen Price
($/GJ)Large Facilities Nonspecific 2.8 6.75
Kirk-Othmer 1991Foster-Wheeler 1996
2.9530.97
20.624.5
Small Facilities Nonspecific 0.096 PV-Based1
0.195 (2000) 0.209 (2010) Wind-Based1
0.247 (2000) 0.279 (2010)
Andreassen 1998
Mann et al. 1998Mann et al. 1998
Mann et al. 1998Mann et al. 1998
31.88
485.8242
158.692.5
28.7
41.824.8
20.211.0
1 The costs shown are for assumed technology improvements for 2000 and 2010.
The cost of hydrogen from water electrolysis (> $20/GJ) is significantly higher than any technologyevaluated thus far. In fact, even when proposed technology improvements for wind and PV systems areimplemented, their costs will still be $11-$25/GJ. However, because the hydrogen is produced on-siteand on demand, no transportation and storage costs are likely to be incurred, resulting in a competitivecost compared to the cost of small amounts of “delivered” hydrogen. The costs in Table 6 agree well withother published values: $4-$24/GJ (Gaudernack 1998), $14-$61/GJ (Fisher 1990), $15-$40/GJ (Hart1998), $20/GJ (Buteau et al. 1992), $31/GJ (Hassmann and Kuhne 1992), and $15/GJ (Carlsson et al.1997).
Costs for proton exchange membrane (PEM) electrolyzer systems are expected to be less thanconventional alkaline electrolyzers. Thomas et al. (1995a) conducted a survey of the capital costs forelectrolyzer systems and projected specific capital investments (1998$) of $42.8/GJ and $13/GJ for 530MWe alkaline and PEM systems, respectively. Carlsson et al. (1997), projected specific capitalinvestments of $32-$55/GJ for alkaline systems of 500 kW to 12 MW and $159/GJ for a 100-kW PEMsystem.

10
Figure 5 presents the costs for hydrogen production using electrolysis.
Figure 5: Economics of Hydrogen Production via Electrolysis
0
10
20
30
40
50
60
0.01 0.1 1 10
Facility Size (million Nm3/d)
Electricity: $0.08/kWh
Electricity: $0.04/kWh
Electricity: $0.02/kWh
PV-based - 2000
PV-based - 2010
Wind-based - 2000
Wind-based - 2010
Concentrated Solar Energy
A promising longer-term technology is concentrated solar energy for hydrogen production viaelectrolysis. Two primary process configurations are used with this method. In the first, ambienttemperature electrolysis, concentrated solar energy is used to generate alternating current (AC) electricity,which is supplied to the electrolyzer. The second is the high-temperature electrolysis of steam. In thissystem, the concentrator supplies both heat and AC electricity to convert steam (1273 K) to hydrogen andoxygen.
Glatzmaier et al. (1998) evaluated two solar energy concentrators for these applications: the dish-Stirlingand power tower. The dish-Stirling was sized at 10 MWac with no thermal storage; the power tower wassized at 200 MWac with thermal storage. The scenarios were evaluated based on 2010 and 2020technology. Cost reductions and efficiency improvements were assumed to occur with time. The capitalcosts for the dish-Stirling system are expected to decrease from $1,660/kWac in 2010 to $1,495/kWac in2020; operating and maintenance (O&M) costs are projected to exhibit a similar decrease from $27/kW/yrto $26/kW/yr. For the power tower case, reductions will also occur for the capital costs ($2,605/kWac to$2,523/kWac) and the O&M costs ($30/kW/yr to $25/kW/yr). In addition, the capacity factor for thistechnology is expected to increase from 65% to 77% over the specified time period.
Using the standard methodology, production costs for hydrogen were developed. For both the 2010 and2020 technology scenarios, the power tower system produced hydrogen at a lower cost than the dish-Stirling. In 2010, the power tower is expected to produce hydrogen at almost $41/GJ; the dish-Stirlingsystem has a hydrogen price of $65/GJ. In 2020, the power tower cost is $34/GJ; the dish-Stirling systemcosts $60/GJ.
11
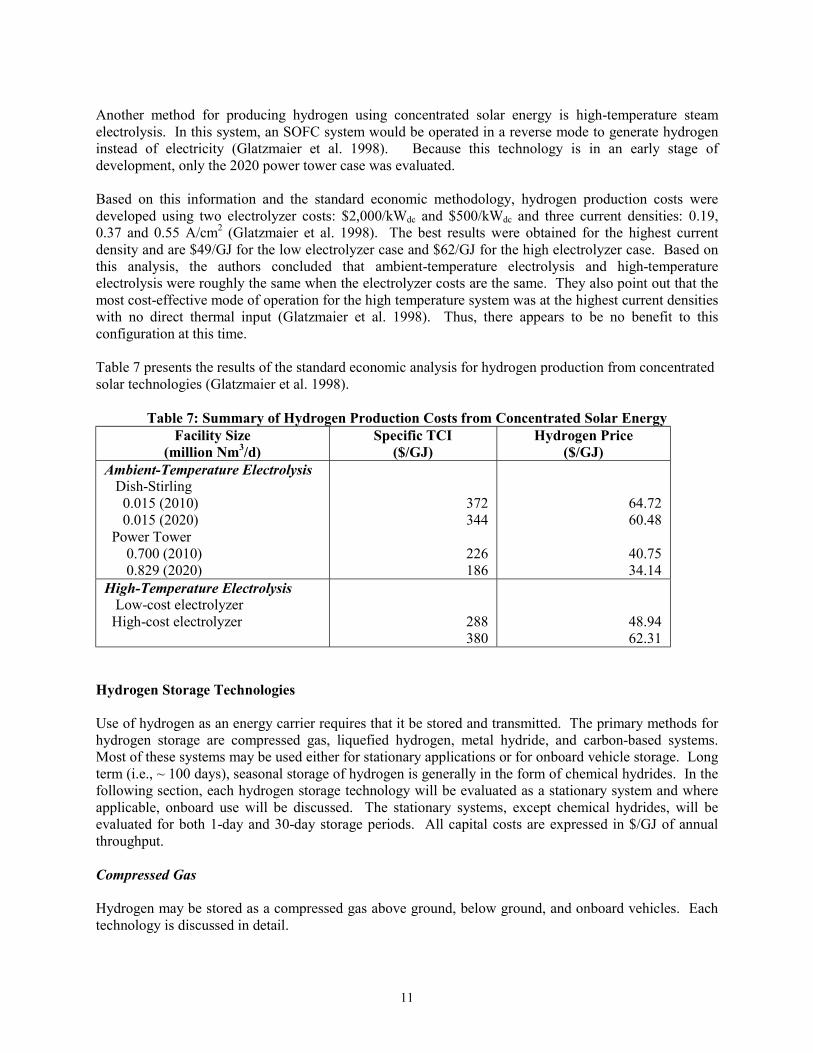
Another method for producing hydrogen using concentrated solar energy is high-temperature steamelectrolysis. In this system, an SOFC system would be operated in a reverse mode to generate hydrogeninstead of electricity (Glatzmaier et al. 1998). Because this technology is in an early stage ofdevelopment, only the 2020 power tower case was evaluated.
Based on this information and the standard economic methodology, hydrogen production costs weredeveloped using two electrolyzer costs: $2,000/kWdc and $500/kWdc and three current densities: 0.19,0.37 and 0.55 A/cm2 (Glatzmaier et al. 1998). The best results were obtained for the highest currentdensity and are $49/GJ for the low electrolyzer case and $62/GJ for the high electrolyzer case. Based onthis analysis, the authors concluded that ambient-temperature electrolysis and high-temperatureelectrolysis were roughly the same when the electrolyzer costs are the same. They also point out that themost cost-effective mode of operation for the high temperature system was at the highest current densitieswith no direct thermal input (Glatzmaier et al. 1998). Thus, there appears to be no benefit to thisconfiguration at this time.
Table 7 presents the results of the standard economic analysis for hydrogen production from concentratedsolar technologies (Glatzmaier et al. 1998).
Table 7: Summary of Hydrogen Production Costs from Concentrated Solar EnergyFacility Size
(million Nm3/d)Specific TCI
($/GJ)Hydrogen Price
($/GJ)Ambient-Temperature Electrolysis Dish-Stirling 0.015 (2010) 0.015 (2020) Power Tower 0.700 (2010) 0.829 (2020)
372344
226186
64.7260.48
40.7534.14
High-Temperature Electrolysis Low-cost electrolyzer High-cost electrolyzer 288
38048.9462.31
Hydrogen Storage Technologies
Use of hydrogen as an energy carrier requires that it be stored and transmitted. The primary methods forhydrogen storage are compressed gas, liquefied hydrogen, metal hydride, and carbon-based systems.Most of these systems may be used either for stationary applications or for onboard vehicle storage. Longterm (i.e., ~ 100 days), seasonal storage of hydrogen is generally in the form of chemical hydrides. In thefollowing section, each hydrogen storage technology will be evaluated as a stationary system and whereapplicable, onboard use will be discussed. The stationary systems, except chemical hydrides, will beevaluated for both 1-day and 30-day storage periods. All capital costs are expressed in $/GJ of annualthroughput.
Compressed Gas
Hydrogen may be stored as a compressed gas above ground, below ground, and onboard vehicles. Eachtechnology is discussed in detail.

12
Above-ground compressed gas storage
In a compressed gas system, hydrogen is compressed to about 20.7 MPa and stored in standard-pressure(50-L) gas cylinders and greater than 15,000 Nm3 in spherical containers. One source (Taylor et al.1986), states that compressed gas storage in high-pressure tubes is generally confined to systems of14,000 Nm3 or less because of their high cost.
Detailed costs for above-ground compressed gas storage have been estimated by several sources (Amos1998; Taylor et al. 1986; Schwarz and Amankwah 1993). Using the standard methodology, the TCI fordaily storage is $1,700-$9,000/GJ for stationary vessel storage and $16,600/GJ for pressurized tubestorage. Operating costs for this option include power and O&M charges. In general, power charges arethe most significant and are estimated at 7-18 kW/GJ.
The overall storage cost is projected to be $1.50-$4.20/GJ and more than $30/GJ for tube storage for astorage period of 1 day. The tube storage costs are for a specific application; thus, extrapolating the datamay not be appropriate. The cost of hydrogen storage as a compressed gas is highly dependent on theturnover rate. For example, at low turnover rates (e.g., 30 days), the capital cost can be 70%-90% of thestorage costs (Amos 1998). At high turnover rates (e.g., daily storage), each volume of storage is usedmore than 300 times per year such that the capital cost, hence the total storage cost for each unit ofstorage is decreased. This trend is exemplified by looking at 30-day storage costs, which increase to$7.40-$36.90/GJ overall.
The costs resulting from this analysis compare well with storage costs from other sources (Carpetis 1994;Newson et al. 1998; Huston 1984; Ledjeff 1990; Carlsson et al. 1997). In general, these papers providedcapital cost estimates of $4,000-$16,700/GJ. One source, Newson et al. (1998), estimated costs that weresignificantly lower at $150-$190/GJ. The estimates were not documented and so the discrepancy was notresolved.
Underground compressed gas storage
In general, underground compressed gas systems are most suitable for large quantities and/or long storagetimes. There are several large-scale underground hydrogen storage systems. The city of Kiel, Germanyhas been storing town gas (60%-65% hydrogen) in a gas cavern since 1971; Gaz de France, the FrenchNational Gas company, has stored hydrogen-rich refinery product gases in an aquifer structure nearBeynes, France; and Imperial Chemical Industries stores hydrogen in salt mine caverns near Teeside, UK.
Several studies (Taylor et al. 1986; Amos 1998; Carpetis 1994) evaluate the storage of hydrogen belowground. Taylor et al. analyzed hydrogen storage in salt caverns (dry and wet mode), a mined cavern, anda depleted gas well. Amos evaluated storage in a generic cavern; Carpetis provided capital cost estimatesfor several applications.
Capital costs for underground storage have been estimated at $16-$80/GJ (Carpetis 1994) depending onthe type of storage used with solution-mined salt caverns or mechanically excavated caverns at the highend of the range. Amos (1998) estimated the capital costs at $73/GJ. Taylor et al. (1986) projected thelowest capital investments for salt caverns ($6.6/GJ) and the highest for depleted gas wells ($18/GJ).Operating costs for underground storage are primarily for compression power.
As with all storage technologies, the overall cost of hydrogen storage depends on throughput and storagetime. Using the standard costing methodology (Appendix A), costs for underground storage of hydrogenwere developed. The incremental costs of hydrogen storage were $1-$4.7/GJ for daily storage; analysisof 30-day storage resulted in a 50%-80% increase in costs. For the cases analyzed by Taylor et al.(1986), storage in a depleted gas well ($3.5/GJ) was the most expensive and storage in a salt cavern

13
($1.7/GJ) was the least. However, Taylor et al. point out that the analysis was very specific andextrapolation of the results may not be valid.
Compressed gas storage for vehicles
Compressed gas storage (20.7-55.2 MPa) is the simplest and least expensive alternative for onboardhydrogen storage (Lipman and DeLuchi 1996). However, this method also has a very low volumetricenergy density (1.3-3.4 MJ/L) compared to gasoline (32.4 MJ/L). Although the energy density may beimproved by increasing the storage pressure, safety issues become important. Fiber-reinforced composite(e.g., aluminum-carbon) tanks have been developed to address this issue. An aluminum-carbon tank witha design pressure of 55.1 MPa is estimated to cost $5,100/GJ (1998$) with an energy density of 3.4 MJ/L(Lipman and DeLuchi 1996).
Liquefied Hydrogen
Hydrogen may also be liquefied for storage as a stationary system or for use in onboard vehicle systems.In this system, the hydrogen is compressed, cooled, and expanded in a variety of sequences to form aliquid. Most liquid hydrogen systems (LH2) are stored at -253°C (Veziroglu and Barbir 1998). Thelargest storage system (3,800 m3 capacity) is at the U.S. National Aeronautics and Space Administration(NASA). Because of the low temperatures used in this technology, boil-off is a significant concern. Boil-off can be 2%-3%/d for small vessels, or as little as 0.1%/d for large spherical vessels (Carpetis 1994).
Stationary storage
Costs for stationary liquefied hydrogen were obtained from several sources, including three detailedassessments (Amos 1998; Schwarz and Amankwah 1993; Taylor et al. 1986). Capital costs for thesesystems are $1,830-$7,200/GJ for daily storage of 13,100-20,300 GJ. For 30-day storage, the costs are$170-$1,690/GJ for 3,900-3.9 million GJ.
Electricity for compression is by far the largest operating expense. This demand ranges from 82.4 kW/GJ(Amos 1998) to 165 kW/GJ (Taylor et al. 1986). For the standard electricity cost of $0.049/kWh, thisannual cost is 60%-82% of the hydrogen cost for large (> 13,000 GJ) daily storage systems and 32%-68%of 30-day systems >100,000 GJ.
For large (>13,000 GJ) liquefied hydrogen storage systems, the price of storage is relatively insensitive tothe system size, $5-$8/GJ. Smaller systems of 131 and 3,919 GJ have considerably higher storage costsof $17-$23/GJ for daily and monthly storage, respectively. One analysis by Taylor (1986) projected aprice of storage of $25/GJ for a large (108,000 GJ) system. This high cost is due primarily to the highenergy demand used in the analysis. In addition, Taylor assumed much higher O&M costs than did Amos(1998). The estimated costs using the standard methodology are similar to those found in other studies(Carpetis 1994; Fisher 1990).
Methods for reducing the energy requirement of this technology are ongoing. One method, magneticliquefaction, is a potential solution that is under development (Veziroglu and Barbir 1998).
Onboard storage
Onboard liquefied gas storage has been suggested for vehicles, but there are significant drawbacks,including, as noted earlier, fuel losses as high as 3%/d. Not only would this fuel loss be a significant cost,but safety issues are of concern with confined-space parking (Lipman and DeLuchi 1996). The onboardstorage tank is projected to cost from $1,280-$2,550/GJ (1998$) (Lipman and DeLuchi 1996).

14
Metal Hydride
Metal hydrides are compounds that store hydrogen in the interatomic lattice of a metal. Absorption of thehydrogen into the lattice (hydriding) is an exothermic process and requires cooling. Release of thehydrogen (dehydriding) is endothermic and requires heating. The temperature and pressure of thesereactions depend on the specific composition of the hydride. In general, metal hydride systems forhydrogen storage can be classified as either high (~300°C) or low (<150°C) temperature, depending ontheir operating temperatures at modest pressures (0.1-1.0 MPa). Because hydrides require heat to releasehydrogen, the chance of accidental releases is slight. Thus, they are considered a safe hydrogen storagetechnology. However, these systems also are heavy, have low gravimetric hydrogen densities (1%-7%),and are generally expensive. Stationary and onboard systems have been examined and are discussed here.
Stationary storage
Detailed cost estimates of metal hydride systems were not obtained. Some authors specified the cost ofthe individual alloys (Huston 1984; Sandrock 1997); others provided broad-based capital and operatingcosts for a generic “hydride” (Amos 1998; Carpetis 1994). Two sources (Schwarz and Amankwah 1993;Newson et al. 1998) did provide an estimate of a specific metal hydride, iron-titanium (FeTi), but theywere significantly lower than other estimates. This lack of estimates is likely due to the paucity ofcommercial, large-scale metal hydride systems for hydrogen storage.
Operating costs for metal hydrides include heating and cooling for the dehydriding and hydridingreactions, respectively. The amount of heating required depends on the type of metal hydride selectedand its application. For example, if the metal hydride storage system is integrated with a fuel cell, theheating demand could be met by the cooling load of the fuel cell and the cost would thus be minimal.Low-temperature hydrides would thus integrate well with PEM fuel cells that operate at 80°C; high-temperature hydrides would integrate well with the high-temperature fuel cells such as SOFC and MCFC,operating at 1,000°C and 650°C, respectively. Other storage systems do not enjoy (or rely on) thisintegration advantage.
The overall cost of hydrogen storage is dominated by the capital costs of the metal hydride. Thesesystems are further penalized because there is no economy of scale. That is, the capital cost of the systemincreases linearly with the amount of storage required, so that the specific capital cost (i.e., $/GJ stored)remains the same.
Two analyses from the literature (Amos 1998; Schwarz and Amankwah 1993) were evaluated using thestandard methodology. These analyses projected a specific capital cost of $4,200/GJ (Schwarz andAmankwah) to $18,400/GJ (Amos). The reason for the significant difference in the costs between thesetechnologies could not be determined. Both are based on a low-temperature FeTi metal hydride. For alarge storage system (30-day), the storage costs are prohibitive (i.e., >$200/GJ) (Amos), a cost that is 20times the cost of the original hydrogen. Daily storage systems, although still expensive, incur costs ofonly $2.90-$7.50/GJ (Schwarz and Amankwah; Amos). Very small systems are expected to be costcompetitive with other storage technologies.
The costs obtained using the detailed methodology agree well with costs from other sources (Vosen 1997;Carpetis 1994). However, Newson et al. (1998) projected capital costs of $150-$200/GJ, which aresignificantly lower than any other estimates.
There is considerable uncertainty regarding the costs of metal hydride systems. Supply considerationsalso cause concern. Although the price of the component alloys can be determined today, there is nogood method for projecting manufacturing costs. Sandrock (1997) projects a manufacturing markup of100%; Huston (1994) states that manufacturing costs could increase the alloy costs by 200%-400%.Because many of the alloys are not used in significant quantities today, however, large-scale use of the
15
metals could cause shortages and increased prices. Thus, the usual decreases in prices seen withincreased output may not occur with metal hydrides.
Onboard Storage
Onboard hydrogen storage using metal hydrides has been evaluated in several sources. Lipman andDeLuchi (1996) estimated that an Fe-Ti metal hydride onboard storage system would cost $4,200-$7,020/GJ (1998$).
Carbon-Based Storage
Two sources were obtained regarding the costs of carbon-based hydrogen storage systems (Fisher 1990;Schwarz and Amankwah 1993). At cryogenic temperatures (70-113 K) and moderate pressures (42-54atm), activated carbon can reversibly adsorb 0.043-0.072 kg H2/kg activated carbon (Schwarz andAmankwah 1993; Carpetis 1994). The National Renewable Energy Laboratory (NREL) recently reporteda gravimetric storage capacity of 5%-10% at room temperature, using carbon nanotubes.
Carbon-based hydrogen storage materials that can store significant amounts of hydrogen at roomtemperature are also under investigation. Carbon nanostructures could provide the needed technologicalbreakthrough that makes hydrogen-powered vehicles practical. Two carbon nanostructures, single-wallednanotubes and graphite nanofibers, are of interest. Single-walled carbon nanotubes, elongated pores withdiameters of molecular dimensions (12 Å), adsorb hydrogen by capillary action at noncryogenictemperatures. Single-walled nanotubes have recently been produced and tested at NREL in high yieldsusing a number of production techniques, and have demonstrated hydrogen uptake of 5-10 wt % at roomtemperature. Graphite nanofibers are a set of materials that are generated from the metal catalyzeddecomposition of hydrocarbon-containing mixtures. The solid consists of an ordered stack ofnanocrystals that are evenly spaced at 0.34-0.37 nanometers, which are bonded together by van der Waalsforces to form a “flexible wall” nanopore structure. Northeastern University estimates that excellenthydrogen storage capacities are possible in these structures.
Using the standard methodology and the information from Schwarz and Amankwah (1993), the specificcapital cost of hydrogen storage on activated carbon (cryogenic) is estimated at $4,270/GJ for dailystorage. For a before-tax 10% internal rate of return (IRR), the storage cost is $3.50/GJ. About one-thirdof this cost is for electricity for compression and cooling, assuming a demand of 26.63 kW/GJ ofhydrogen stored. Carbon nanostructure systems are expected to have significantly reduced costs becausethere is no cryogenic requirement, but the technology is still in the early development stages and so costshave not yet been developed.
Currently, there are no commercial applications of carbon-based hydrogen storage. However, researchersare continuing to look into increasing the gravimetric capacity of these systems and to improve the overallsystem engineering.
Chemical Hydrides
Chemical hydrides constitute another method for storing hydrogen, primarily for seasonal storage (i.e., >100 days). Seasonal storage would be an option for countries such as Canada that have a surplus ofhydropower during the summer, but an energy deficit during the winter (Newson et al. 1998). Numerouschemical hydrogen carriers, including methanol, ammonia, and methyl-cyclohexane, have been proposed.Use of a chemical system is advantageous because the transport and storage infrastructure is already inplace, the technology is commercial, and liquid storage and handling are easier.
Newson et al. (1998) analyzed seasonal storage using a methylcyclohexane-toluene-hydrogen (MTH)storage system. This analysis assumes that the capital cost for a single day of storage with this system

16
would be $1,400/GJ, dropping to $15/GJ at 100 days. This significant drop is because thedehydrogenation plant is the same size whether the storage is daily or seasonal (Newson et al. 1998).Thus, a tremendous economy of scale can be realized.
An integrated hydropower-electrolysis-MTH storage and fuel cell system was also analyzed. Based oncurrent bench-scale testing of the dehydrogenation system and projected fuel cell costs, the authorsconcluded that electricity generated from this system at $0.24/kWh would be competitive with electricitygenerated from new hydropower projects at $0.21/kWh (Newson et al. 1998).
Berry (1996) also estimated the costs of chemical hydrides for vehicle refueling. Hydrogen frommethanol is estimated to cost $29.50/GJ based on methanol costs of $11/GJ (HHV). The cost ofhydrogen from ammonia is estimated at $38.9/GJ based on an ammonia cost of $250/ton.
Summary of Hydrogen Storage Costs
Table 8 contains a summary of the hydrogen storage costs for stationary applications as described earlier.
Table 8: Summary of Hydrogen Storage Costs for Stationary ApplicationsStorage System/
Size (GJ)Specific TCI($/GJ capacity)
Storage Cost($/GJ)
Compressed Gas Short term (1-3 days) 131 147 (1)
13,100 20,300 130,600 Long term (30 days) 3,900 391,900 3,919,000
9,00816,6002,9922,2851,726
3,2351,028
580
4.2133.001.991.841.53
36.9312.347.35
Liquefied HydrogenShort term (1-3 days) 131 13,100 20,300 130,600 Long term (30 days) 3,900 108,000 391,900 3.9 million
35,6497,2001,8273,235
1,6871,055
363169
17.126.685.135.26
22.8125.348.095.93
Metal HydrideShort term (1-3 days) 131–130,600 Long term (30 days) 3,900-3.9 million
4,191-18,372
18,372
2.89-7.46
205.31Cryogenic Carbon (1-day) 4,270 26.63Underground (1-day) 7-1,679 1.00-5.00
1 This value is based on storage in pressurized tubes in a specific application and may not beappropriate for extrapolating (Taylor et al. 1986)

17
Figure 6 shows the cost of hydrogen storage as a function of amount stored and type of storage.
Figure 6: Economics of Hydrogen Storage
Utility Sector Applications
Two major stationary end-use applications are available for hydrogen: fuel cells and conventionalcombustion. Fuel cell technologies include PEM, PAFC, MCFC, SOFC and AFC. Combustion turbinesand internal combustion engines (ICE) are two conventional technologies that could be modified forhydrogen use. The technical and economic characteristics of each technology will be discussed in thissection. Large-scale utility applications and smaller distributed applications (e.g., building or residential)will be described.
Distributed stationary applications use small-scale fuel cells or ICEs to supply electricity and/or heat tocommercial buildings such as hospitals or residences, which are located at the site. This concept has beenevaluated by several authors (Garche 1998; Ogden et al. 1996) and has been examined in conjunctionwith vehicle refueling (Thomas and James 1998). These studies have focused on PEM fuel cell systems,but PAFC systems are a possibility. Other fuel cell types are less suited to these applications because oftheir limited ability for load following. For example, SOFC and MCFC systems require 1-3 days forstartup (Garche 1998).
Fuel Cells
As described earlier, five major fuel cell technologies are currently under development or commerciallyavailable for hydrogen use.

18
Proton exchange membrane fuel cell
The PEM fuel cell has an efficiency of 40%-60% and operates at near ambient temperatures (80°C) usingan ion exchange membrane (e.g., fluorinated sulfonic acid) as the electrolyte. Platinum-based catalystsare used at both the cathode and anode. Because of its low operating temperatures, internal reforming isnot possible, but it has excellent load following capabilities and has a startup time of 1-3 seconds (Garche1998).
Several studies have been conducted on the economics of PEM fuel cells; however, many were conductedfor their use in the transportation sector. These studies will be discussed in the transportation section.
One study (Barbir and Gomez 1997) evaluated stationary PEM fuel cells for the current technology andprojected improvements. A prototype 10-kW PEM fuel cell with an efficiency of 40% is currentlyprojected to cost $3,000/kW. Assuming a hydrogen cost of $20/GJ, electricity from this system wouldcost $0.25-$0.30/kWh for a 5-year lifetime, 90% capacity factor, and 7% discount factor. This costwould decrease to $0.09-$0.095/kWh after a doubling of cell performance, a decrease of 50% in the fuelcost, and a reduction in the capital cost to $1,150/kW because of mass production.
The current capital costs are significantly lower than those reported by Carlsson et al. (1997) and Wurster(1998) at $100,000/kW and $10,000/kW, respectively. The ultimate future capital costs from all sourcesis consistent at about $1,000/kW. The reason for the discrepancy is not known; however, the moreexpensive systems could include fuel reforming.
Garche (1998) evaluated the use of a 5-kW PEM fuel cell to provide electricity and heat for a familyhome. The analysis showed that if the PEM supplied 100% of the electricity demands of the home, only40% of the heating demand would be met. Thus, during the winter, the fuel cell would presumablyoperate above the electricity demand in order to meet the heating demand. Excess electricity would besold to the grid. The author concluded that a system driven by the electricity demand (and not the heat)would be economical if the specific capital costs were below $1,200/kW. No information on theeconomics of the heat-driven scenario was provided.
Since distributed fuel cell systems are currently not competitive with conventional electricity sources,Thomas and James (1998) evaluated a third product from the stationary fuel cell system: hydrogen for usein a fuel cell vehicle (FCV). Because of the daily and seasonal variations in electricity demand in homesand buildings, numerous electricity/hydrogen production scenarios can be evaluated. The report lookedat the economics of building fuel cell systems to deliver heat, electricity, and hydrogen.
From these analyses, the authors concluded that commercial building stationary fuel cell systems havesome economic merit, but residential fuel cell systems are not promising. Specifically, for commercialbuildings, if hydrogen is produced during off-peak periods and sold for use in vehicles, the return oninvestment can be improved by 10%-15%. In residential units, the cost of electricity would need to be$0.38/kWh before a 3.4-kW unit would return 10% on the investment in avoided electricity costs alone.
A similar result was obtained by Ogden et al. (1996). A PEM fuel cell was evaluated for a residentialapplication to supply electricity and hot water and compared to the cost of electricity from a combinedcycle gas turbine. In all cases, the combined cycle system provided power at a lower cost than did thefuel cell. The authors suggested that credits should be given for distributed generation, fuel diversity, orenvironmental impacts.
Recently, Plug Power and General Electric formed a joint venture, GE Fuel Cell Systems, to sell PEM fuelcells in the residential and commercial markets. They expect to sell residential systems starting in 2001 andsmall business-sized units in 2002 (Plug Power 1999). The retail units will be 7-kW and will retail for about

19
$8,500 in 2001 and are expected to decrease to $4,000 by 2003 (Plug Power 1999). Electricity prices fromthese units are projected to be $0.07-0.10/kWh (Plug Power 1999).
Phosphoric acid fuel cell
The PAFC is available commercially for stationary applications (i.e., the 200-kW system by ONSI, adivision of International Fuel Cells) (Garche 1998). More than 100 of these systems have been sold at theprototype price of $3,000/kW (Hart 1998). In addition, portable units have been demonstrated (Garche1998). Other developers include Fuji Electric Corporation, Toshiba Corporation, and Mitsubishi ElectricCorporation (Hirschenhofer et al. 1994).
The PAFC uses platinum-based catalysts at both electrodes, and as the name suggests, the electrolyte isconcentrated phosphoric acid. PAFC systems operate at 150°-220°C and can achieve 37%-42%efficiency (HHV) on natural gas. Because of the relatively low temperatures, hydrocarbons must bereformed externally. In addition, CO is a catalyst poison and must be below 3-5 vol% (Hirschenhofer etal. 1994).
Several sources (Simader and Kordesch 1994; Carlsson 1997; Mugerwa and Blomen 1993) haveprojected costs for PAFC systems. A detailed estimate was obtained for PAFC systems of 25 and 250kW (Mugerwa and Blomen). In this analysis, cost estimates were developed for the entire range ofdevelopment, from the initial plant to mass production. Cost reductions were specified based on the stageof development.
The cost estimates were based on natural gas fuel. To project the cost of a hydrogen-based system, thecost of the reformer was subtracted out and the efficiency of the system was increased by 15%. Thereformer represented 14.9% of the equipment cost of the 25-kW system and 21.6% of the cost of the 250-kW system. Using these assumptions and full commercial production, the standardized capitalinvestment for the 25-kW plant was estimated at $2,253/kW. That for the 250-kW plant was $2,442/kW.The electricity prices necessary to achieve a 10% before tax IRR based on a hydrogen cost of $10/GJ are$0.13/kWh for both plants. The specific TCI for the 25-kW system is less than that for the 250-kWsystem because the authors assumed that the 25-kW systems could be produced robotically (Mugerwa andBlomen 1993).
These specific capital costs and electricity prices agree well with other reported values. Simader andKordesch (1994) reported an electricity price of $0.11-$0.16/kWh for a generic PAFC; Hirschenhofer etal. (1994) and Carlsson et al. (1997) projected installed capital costs of $3,500/kW and $3,000/kW,respectively. These studies did not specify the fuel, but is probably natural gas, and so the higher capitalinvestment would be expected. Finally, the Electric Power Research Institute (EPRI) (1988) projected theinstalled capital cost of a 100-MW facility to be around $1,000/kW.
Solid oxide fuel cell
The SOFC uses a solid-state system that operates at high temperatures (1,000°C). Because it is a two-phase system (solid and gaseous) instead of the three found with other fuel cells, it is a simpler design.Other advantages of this system include the absence of noble metal electrocatalysts; CO is not a poisonand can be directly oxidized; and high-grade waste heat is available for steam generation or otherapplications (Murugesamoorthi et al. 1993). In addition, because of the high operating temperatures, theSOFC can reform hydrocarbon fuels internally without a catalyst. Thus, it is expected to operate onhydrocarbons rather than on pure hydrogen (Garche 1998).
The SOFC is not currently commercially available, although many companies are currently developingthese systems. Detailed designs and costs for SOFC were not found in the literature. Three sources(Murugesamoorthi et al. 1993; Ippommatsu et al. 1996; Gas Research Institute (GRI) 1999), however,

20
reported current and projected SOFC costs. Murugesamoorthi et al. (1993) reported electricity prices of$0.06-$0.08/kWh based on an efficiency of 50%, natural gas costs of $1.90/GJ and an operating period of7,000 h/yr. They project the ultimate capital cost of SOFC power plant systems to be $1,000/kW.
Ippommatsu et al. (1996) evaluated SOFC production costs using six methods. The cost estimates assumedmass production (i.e., 1 million cells/facility) and included costs for raw materials, depreciation, labor, andmaintenance. Cell production costs ranged from $54/kW to $170/kW for the sintering and supported planartype cells, respectively. The authors concluded that yield was the most important factor in the cost. Theyalso projected that the target cost for SOFCs should be $2,000/kW for the whole system and $700/kW forthe cell alone.
Finally, GRI and EPRI formed a consortium for the commercialization of planar SOFCs. The consortiumwill use SOFC technology developed by the University of Utah and Materials and Systems Research Inc.(MSRI), which is expected to achieve a total system cost of less than $700/kW. This cost goal is assumedachievable even with small production volumes and small-size units (GRI 1999).
Solid oxide fuel cell systems could be used to supply the electrical and thermal requirements ofcommercial buildings. They could probably provide a better match for the thermal-to-electric ratio forbuildings than current cogeneration systems. In fact, an economic analysis of SOFCs for commercialbuildings showed that they are competitive with reciprocating engines in low thermal-to-electric and lowload factor sites (Minh and Takahashi 1995). SOFC systems would also likely be good candidates forindustrial cogeneration applications because of its high thermal load and the potential for integration.
Costs for SOFC systems for distributed power systems were not found. Because of the modularity of thefuel cells, however, the capital costs would likely be similar to those for the utility application. Theoperating costs, of course, would depend significantly on the thermal-to-electric load.
Molten carbonate fuel cell
The MCFC uses a mixture of alkali (sodium and potassium) carbonates as its electrolyte, contained in aceramic matrix. Inexpensive nickel and nickel oxide are used as the anode and cathode, respectively.With an operating temperature of 600°-700°C, internal reforming is possible with the addition of acatalyst. Another advantage of the high temperature is the potential for heat integration or steamgeneration. Although CO is not a system poison, sulfur (H2S) is detrimental at greater than ppm levels(Hirschenhofer et al. 1994). One of the most significant drawbacks to the use of this fuel cell with purehydrogen is its requirement for CO2 at a 1:1 molar ratio with hydrogen at the cathode. Recycling CO2
from the anode to the cathode would meet most of this demand, but not all the CO2 could be recovered.Obtaining the makeup CO2 for a pure hydrogen feed could prove unworkable.
All the economic evaluations for MCFC systems obtained were based on hydrocarbon, primarily naturalgas, fuel. Two of the studies (Mugerwa and Blomen 1993; Bohme et al. 1994) presented detailed costestimates. Mugerwa and Blomen evaluated the impact of mass production on fuel cell costs as well as theestimated cost of current prototype systems. Assuming mass production, they estimated the specificcapital cost of natural gas-based MCFC systems to be $1,355/kW for a 25-kW system; $1,740/kW for a250-kW system; $1,330/kW for a 3.25-MW system; and $600/kW for a 100-MW system. Using thestandard methodology, the necessary electricity prices would be $0.12/kWh, $0.11/kWh, $0.10/kW and$0.06/kW for the 25-kW, 250-kW, 3.25-MW and 100-MW systems, respectively. As with the PAFCsystems, the authors assumed that the specific TCI ($/kW) of the 25-kW system is less than that for the250-kW system because of robotic production.
Bohme et al. also evaluated three MCFC processing schemes: (a) external reforming, (b) internalreforming with steam, and (c) internal reforming with fuel recycle. The capital costs for a 100-MWfacility are estimated at $2,900/kW for external reforming, $2,000/kW for internal reforming, and

21
$1,700/kW for internal reforming and fuel recycle. Using the standard methodology, the expectedelectricity prices for these systems are $0.12/kWh, $0.10/kWh and $0.08/kWh for schemes a, b, and c,respectively. These values are higher than those by Mugerwa and Blomen because of the higher initialinvestment. Based on this analysis, the authors concluded that fuel (and oxidant) recycle is an importantcost consideration in MCFC systems.
The Electric Power Research Institute (1995) completed a detailed design of a 2-MW MCFC system.This technology sheet estimated that the cost of a pre-commercial 2-MW MCFC system would be1,700/kW and would fall to $1,200/kW for commercial units. No electricity costs were provided.
Alkaline fuel cell
Alkaline fuel cells use an alkaline electrolyte such as sodium hydroxide (NaOH) or potassium hydroxide(KOH). They operate at atmospheric pressure and 70°C. Unfortunately, CO2 will react with the electrolyteand render it ineffective and so it must be removed. Currently, AFC systems are used primarily in space andsubmarine applications.
Lindstrom and Lavers (1997) suggest that the AFC can be integrated into existing ammonia productionfacilities. The AFC can be substituted for the ammonia synthesis section or can be operated in parallel. Theammonia production facility, however, would need to be modified for the AFC because it does not requirenitrogen. Using conventional costs for ammonia-processing facilities, the authors project that a 163-MWAFC plant, which is comparable in size to a 1,000 Tpd ammonia plant, could produce electricity at$0.07/kWh.

22
Table 9 summarizes the economics of fuel cells.
Table 9: Economics of Fuel CellsFuel Cell Type/
Size SourceSpecific TCI
($/kW)Electricity Price
($/kWh)PEMFC 10 kW (today) (future) 7 kW (2001) (2003)
Barbir and Gomez 1997Barbir and Gomez 1997Plug Power 1999Plug Power 1999
$3,000$1,150$8,500$4,000
$0.25-0.30$0.09-0.095
Not provided$0.07-0.10
PAFC 25 kW (future) 200 kW (today) 250 kW (future) Not specified
100 MW
Mugerwa et al. 1993Garche 1998Mugerwa et al. 1993Simader et al. 1994Hirschenhofer 1994Carlsson et al. 1997EPRI 1988
$2,250$3,000$2,440
Not provided$3,500$3,000$1,000
$0.13Not provided
$0.13$0.11-0.16
Not providedNot providedNot provided
SOFC Not specified(future) Not specified(future)
Not specified(future)
Murugesamoorthi 1996Ippommatsu et al. 1996
GRI 1999
$1,000$2,000 (system)
$700 (cell alone)$700 (system)
$0.06-0.08Not providedNot providedNot provided
MCFC 25 kW (future) 250 kW (future) 2 MW pre-commercial commercial 3.25 MW (future) 100 MW (future) 100 MW external reforming internal reforming w/ fuel recycle
Mugerwa et al. 1993Mugerwa et al. 1993
EPRI 1995EPRI 1995Mugerwa et al. 1993Mugerwa et al. 1993Bohme et al. 1994
$1,355$1,740
$1,700$1,200$1,330
$600
$2,900$2,000$1,700
$0.12$0.11
Not providedNot provided
$0.10$0.06
$0.12$0.10$0.08
AFC 163 MW Lindstrom et al. 1997 Not provided $0.07
Internal Combustion Engine Generator Sets
Research on hydrogen-fueled ICEs is currently underway (Aceves 1996; Johnson et al. 1996; VanBlarigan and Keller 1998). Most of this research is directed at the transportation sector, but theinformation should be transferable to the utility sector. No specific costs on the use of hydrogen-poweredstationary ICEs was found in the literature. However, the cost of these systems is not likely to differsignificantly different from conventional diesel-powered ICEs.

23
Gas Turbines
Gas turbine technology is well known and commercialized for a variety of fuels, including natural gas andfuel oils. Operation of gas turbines on hydrogen fuels, however, is still relatively new, but one sourcereports that European Gas Turbines (GEC Ahlsthom) have more than 72,000 operating hours with aheavy-duty gas turbine with a refinery gas of 70% hydrogen (Foster-Wheeler 1998). Sources differ onthe impact hydrogen fuel will have on system design and operation.
The government of Japan, under its World Energy Network (WE-Net) program is currently working withseveral turbine manufacturers (Westinghouse, Mitsubishi Heavy Industries, and Toshiba) to develophydrogen-based power systems that include combustion turbines (Bannister et al. 1997). The overall goalof this 28-year program is the demonstration of a hydrogen-power system with 70.9% efficiency orgreater by 2020. Literature was obtained on the approach taken to this problem by two of the turbinemanufacturers (Bannister 1997 et al.; Sugishita and Mori 1998). Much of the information describes thepower system configuration (e.g., Rankine cycle versus Topping Extraction cycle) rather than specifichardware concerns.
Sources suggest that the higher flame speed of hydrogen would require burner modifications (Foster-Wheeler 1998; Johansson 1999). Foster-Wheeler (1998), however, does not expect that these wouldrepresent a significant technical or economic hurdle. Another potential technical hurdle for hydrogen-fueledgas turbines is the high operating temperature. Temperature-resistant materials and better coolingtechniques will be required, especially when operated on pure oxygen. Finally, turbines using hydrogen willlikely be more efficient than those using natural gas because of the potential for higher inlet gastemperatures (Johansson 1999).
Specific costs for gas turbines using hydrogen could not be obtained, but costs for gas turbines using naturalgas were obtained as a baseline. The performance and/or costs of the turbines will probably not besignificantly affected by the use of hydrogen (Foster-Wheeler 1998). The cost of gas turbines for naturalgas use range from $200-$600/kW (Gas Turbine World 1997). Costs were also obtained for turnkeycombined cycle systems. These costs ranged from $320-$1,200/kW (1997$) with efficiencies of 40.3%-58.0% (Gas Turbine World 1997).
Grid-Independent Renewable Power Systems
An interesting application of hydrogen technology is as grid-independent hydrogen production, storage,and usage systems that use renewable power (e.g., wind, solar). Several authors (Vosen 1997, Fairlie etal. 1998) have explored this possibility. These papers primarily include the technical and modelingaspects of these systems, but some provide limited economic information.
In these applications, the renewable power source would provide electric power to meet the entire demandof a remote village or community with no other source of power. Because renewable resources areintermittent and variable, some method of supplying energy must be provided when the resource cannotmeet the demand (e.g., nighttime for a PV system). Typically, the backup source of power has beendiesel generators (Fairlie et al. 1998). However, these systems are expensive and may have adverseenvironmental impacts. A promising alternative would be a hydrogen system. In this option, anelectrolyzer is used to generate hydrogen when the renewable power source exceeds the base load. Thehydrogen is stored as a compressed gas or possibly in a metal hydride system. When the renewablesystem cannot meet the base load, the hydrogen is used to power a fuel cell or an ICE generator.
Vosen (1997) compared energy storage options for a stand-alone PV-electrolyzer-PEM fuel cell system,for storage in a metal hydride, battery storage, and a combination of the two systems. Each system wassimulated for a year to determine the storage requirements. Normalized costs (based on the hydrogen-

24
only scenario) were projected assuming 0% interest. The individual costs, efficiencies, and lifetimes foreach component are shown in Table 10.
Table 10: Economic Assumptions for Stand-Alone PV SystemComponent Efficiency (%) Cost Lifetime (yrs)
PV 14 $2500/kW 20Fuel Cell 47 $2500/kW 5Electrolyzer 74 $1900/kW 5Hydride 100 $4/kWh 10Power Conditioning 92 $1000/kW 10Batteries 90 $200/kWh 4
The least expensive system is battery storage for daily fluctuations and hydrogen storage for longer-termstorage.
In the Fairlie et al. study, a wind-hydrogen power system for a remote Arctic village was examined. Aconceptual design of a wind-electrolysis-hydrogen-generator (e.g., fuel cell) system was developed. Thedesign was based on an electricity price of $0.045/kWh, an average electrical demand of 780 kW, a peakdemand of 1,367 kW and an average wind speed of 21.8 km/h. The design assumed that at some times(i.e., during high winds), a significant amount of power is generated, but cannot be used. During thesetimes, the power is dumped to a resistive water heater, which can be used for district heating. Based onthese parameters, the fuel cell capacity was sized at 1.4 MW with an energy storage capacity of 920 GJ (3million scf) of hydrogen. The wind farm was sized at 8 MW and the electrolyzer at 4 MW with theability to operate as a controllable load to 6 MW. For a projected system cost of $25 million, the annualenergy saving alone would be $4 million/yr.
Transportation Sector Applications
Hydrogen use in transportation applications has been evaluated by numerous sources. Light-duty (e.g.,automobiles) and heavy-duty (e.g., buses) applications have been examined. In addition, liquid hydrogenis being considered as an aviation fuel.
An important consideration unique to hydrogen use in the transportation sector is whether the hydrogenshould be stored on the vehicles or generated by onboard reforming from a liquid fuel such as methanol.Results from studies on both options are also summarized in this section.
Light Duty (automobiles)
Hydrogen can be used in light-duty vehicles (LDVs) in a variety of applications, including ICEVs,hydrogen fuel cell vehicles (FCEVs), and hydrogen hybrid vehicles (HHEVs). These vehicles have beenevaluated using both onboard storage of hydrogen and onboard reforming. Each of these scenarios isdiscussed below.
Fuel cells
Because of their high power density, fast start up at a wide range of temperatures, and simpleconstruction, most of the literature on fuel cells in the transportation sector focuses PEM fuel cells(Ekdunge and Raberg 1998). The operating conditions and design constraints of fuel cells in this sectordiffer considerably from those in utility applications. Transportation applications have power density,space, safety, and reliability requirements that are more challenging than those for utility applications, but

25
they have an advantage in that the required lifetime is only about 5,000 hours on an intermittent basis(Appleby 1993). Thus, many sources consider that this sector may provide the breakthrough for fuel cells.
Hydrogen FCEVs have several potential advantages over conventional gasoline ICEVs including higherfuel efficiency, lower greenhouse gas and conventional pollutant emissions, longer lifetimes, and lowerdrive train maintenance costs (Ekdunge and Raberg 1998; DeLuchi 1992; Birkle et al. 1994). DeLuchi(1992) estimates the efficiency of an FCEV at 40% based on a fuel cell efficiency of 46% and a drivetrain efficiency of 88%. This value compares favorably with a conventional gasoline ICEV at 13%-14%.In addition, the hydrogen FCEV is projected to have excellent fuel economy at 66 mpg, gasolineequivalent (Thomas et al. 1998).
Wurster (1998) provides an overview of companies developing LDVs based on PEM fuel cells. Vehiclesdescribed in the article include the Daimler-Benz Necar II, the Renault Laguna Break, the PSA Peugeot806 van, the Toyota RAV4LV, and the Energy Partners Gator, Genesis, and Green Car.
Although PEM fuel cells are considered the front-runner for LDVs, other fuel cell systems are also beingconsidered for this market. For example, Zevco has developed AFC vehicles. Zevco recently sold its firstAFC vehicle, a van, to Westminster Council in London (Fuel Cell 2000 1999) and it is testing other vehiclesas taxis in London. The taxis are estimated to cost about $7,400 more than a conventional diesel taxi (FuelCell 2000 1999). SOFCs are also being developed by Delphi and BMW as an automotive auxiliary powersource for gasoline vehicles (Delphi Automotive Systems 1999). This arrangement will increase the electricpower and efficiency of the vehicles as well as reduce the emissions.
Internal combustion engines
Vehicles using ICEs can be operated on either hydrogen or hydrogen/natural gas blends. One blend,Hythane, (a mixture of hydrogen (30%) and natural gas) has been studied in several applications.
Use of hydrogen in an ICEV has several potential advantages, including increased efficiency (25%-30%),a wide range of ignition limits, and high flame and diffusion speeds (Lipman and DeLuchi 1996; Hart1998). On the other hand, these vehicles have lower power output and because of hydrogen’s lowignition energy, they are prone to pre-ignition.
Hydrogen-hybrid electric vehicle
A third hydrogen vehicle is the hybrid hydrogen electric vehicle (HHEV) that uses hydrogen either in anICE or in a fuel cell and a generator. Two primary types of HHEVs are proposed: parallel and series. Ina parallel hybrid vehicle, both the electric motor and the ICE are coupled through the transmission to thewheels. In a series hybrid, the ICE is not connected to the wheels and all power to the wheels comes fromthe electric motors. Overall efficiencies for these vehicles are estimated at 39% for the ICE series versionand 35% for the fuel cell series version (Lipman and DeLuchi 1996). Thomas et al. (1998) estimatessimilar (38%-39%) efficiency for series hybrid ICEVs; for a parallel hybrid, it is almost 25%. In general,these values compare favorably with the 30% efficiency projected for an electric vehicle and the 13% forconventional gasoline ICEVs (Lipman and DeLuchi 1996). Thomas et al. (1998) projects the fueleconomy of an HHEV at 50 mpg, gasoline equivalent. Other advantages of this vehicle include its lowemissions and technical feasibility (Lipman and DeLuchi 1996).
Onboard hydrogen storage versus onboard reforming
Several methods of onboard storage of hydrogen are available: compressed gas, metal hydride, and liquidhydrogen. Other methods such as a cryoadsorbed gas, a cooled and compressed gas, and ironoxidation/reduction have also been proposed (DeLuchi 1992). In addition, the fuel can be carried
26
onboard in another form such as methanol or methyl cyclohexane and be reformed or gasified (i.e., partialoxidation) within the vehicle.
Ogden et al. (1997) evaluated several methods for supplying hydrogen to a vehicle, including onboardreforming and onboard POX. Based on this analysis, the authors concluded that mass-produced vehicleswith onboard reforming or POX will cost more than hydrogen FCEVs. A methanol fuel cell system isprojected to cost $500-$600 more than a FCEV while gasoline POX FCEVs will cost an additional $800-$1,200.
Although the vehicle costs for the onboard reforming/gasification systems for gasoline and methanolFCEVs would be greater than those for hydrogen FCEVs, the refueling infrastructure costs would be lower.No infrastructure costs would be incurred for the gasoline case and the infrastructure costs would beminimal (i.e., $12-$15/car) to retrofit a gasoline station for methanol because excess methanol productioncapacity could be used (Ogden 1998). When new methanol production capacity is required (i.e., after a fewmillion cars), the methanol refueling infrastructure would cost $400-$800/car. This cost is the same as thatfor a hydrogen refueling infrastructure.
The total infrastructure (all equipment on and off the vehicle) required for a hydrogen FCEV would be$400-$800. In the case of methanol, this cost would be $500-$600 for the initial million or so vehicles, butit would increase to $900-$1,400 after excess capacity was used. Finally, total costs for a gasoline POXvehicle would be $800-$1,200/vehicle. These costs translate into a delivered cost of hydrogentransportation fuel, which is roughly $1.60-$5.20/gal of gasoline-equivalent energy (Ogden 1998).
Comparison of light-duty vehicle costs
Several sources (Thomas 1998; Lipman and DeLuchi 1996; Ogden et al. 1997; DeLuchi et al. 1991) haveevaluated the costs of hydrogen LDVs. These analyses have concentrated on the specific costs of thevehicle, including fuel storage and the life cycle costs. Brief discussions of these sources follow.
Thomas et al. (1998) estimated the costs and air emissions for three types of vehicles using three types offuels: conventional ICEVs (gasoline, natural gas, and hythane), hybrid vehicles (natural gas, hydrogen,and diesel) and FCEVs (hydrogen, methanol and gasoline). In addition, three types of hybrids wereanalyzed for each fuel: a parallel hybrid and two types of series hybrid options (thermostat and load-following).
The cost of a direct hydrogen FCEV is estimated at $20,200; that for a hydrogen parallel hybrid is$19,900. The comparable conventional gasoline-powered vehicle would cost $18,000. These costs arelower than those projected by Lipman and DeLuchi (1996) of $19,300 for a gasoline ICEV and $26,900for an FCEV (see Table 11).
As noted earlier, the hydrogen FCEVs have the best fuel economy (66 mpg, gasoline equivalent), buthybrid vehicles are close behind at 57 mpg, gasoline equivalent. When air pollution and greenhousegases are considered, the direct hydrogen FCEV has the lowest total emission and greenhouse gas costs.However, hydrogen parallel hybrids and hythane ICEVs have similar environmental impacts, but loweroverall costs.
Lipman and DeLuchi (1996) developed life cycle costs for ICEVs using several methods of onboardhydrogen storage, gasoline vehicles, and a hydrogen-based FCEV. The life cycle cost is the sum of allyearly operating costs (e.g., fuel, registration) and all annualized initial costs (e.g., vehicle) divided by theaverage distance driven per year. Table 11 provides a summary of these costs. The costs in the originalreference were provided in 1991$, but have been converted to 1998$.

27
Table 11: Hydrogen Vehicle Costs
Item GasolineH2 ICEV
LH2H2 ICEVHydride
H2 ICEVGH2
H2
FCEVFuel Retail Price,excl. taxes($/gal gasolineeq)
1.26 3.89 1.65 1.92 1.92
$/GJ 11.31 34.80 14.76 17.19 17.19Full retail price ofvehicle, incl.taxes ($) 19,255 21,765 25,930 26,296 26,876Levelized annualmaintenance cost(c/km) 424 420 420 420 403Total life cyclecost (4/km) 22.5 28.15 26.15 26.32 21.52Break-evengasoline price($/gal) N/A 3.95 3.12 3.18 1.19
The costs in the table were not standardized. They are based on mass production of the components and ahydrogen price of $9.70/GJ. Assumptions for the ICEVs are considered optimistic but plausible (Lipmanand DeLuchi 1996). The lowest overall life cycle costs are predicted for the FCEVs, which are lowerwithout taxes, than the assumed price of gasoline with taxes (i.e., $1.19/gal versus $1.26/gal).
A similar result was obtained by Birkle et al. (1994), who concluded that the drive-specific costs of thegaseous hydrogen-fueled vehicles would be competitive with gasoline ICEVs. The lower costs are due tothe higher net efficiency of the vehicles (i.e., 40% versus 14%), the lower annual maintenance costs, and,most importantly, the longer life of the electric drive train (Lipman and DeLuchi 1996). These factorsmore than compensate for the disadvantages (e.g., more expensive fuel and fuel storage) of the hydrogenFCEVs. Ogden et al. (1997) also concluded that the life cycle costs of a hydrogen FCEV are slightlylower than those for methanol or gasoline FCEVs (with onboard reformers) because of their lower initialcost and 50% higher fuel economy. A different result was obtained by DeLuchi et al. (1991) whoconcluded that methanol FCEVs would have the lowest total life cycle costs, followed by gasoline ICEVsand hydrogen FCEVs. Both FCEVs, however, would have life cycle costs that were comparable togasoline FCEVs (DeLuchi et al. 1991).
The hydrogen ICEV systems have the highest life cycle costs primarily because of the higher initialvehicle costs and higher fuel costs (Lipman and DeLuchi 1996). Of the ICEVs, the hydride system hasthe lowest cost because it has the lowest delivered hydrogen costs (i.e., high compression or liquefactionare not required). Although liquid hydrogen ICEVs have the lowest vehicle costs of the three systemsexamined, the study assumed high boil-off losses (i.e., 3% at three transfer points), and so the fuel costsare significant. The compressed gas ICEV option has relatively low delivered hydrogen costs, but thehighest vehicle costs of the three ICEV options.
Heavy-duty Applications
Hydrogen use in heavy-duty transportation applications (e.g., buses) is being demonstrated. Commercialproduction is expected in the near future. Very few data are available on the costs in this area.

28
Fuel cells
Several companies, including Ballard, H Power, Neoplan, and MAN/Siemens are currently developingcity and transit buses that are based on PEM fuel cells. In addition, PAFC and SOFC systems are beingconsidered for heavy-duty applications such as railroads (Wurster 1998; Minh and Takahashi 1995). Thissection summarizes some efforts in this area.
In 1993, the world’s first hydrogen fuel cell-powered light-duty bus (93 kW) was commissioned. Thecommercial prototype, a 40-foot heavy-duty bus (205-kW) was introduced in 1995. Both systems werepowered by PEM fuel cells developed by Ballard. In 1997, Daimler-Benz commercialized the NEBUS(New Electric Bus), which also uses Ballard PEM fuel cells. The fuel cell has an efficiency of 55% anddelivers enough power for the fully loaded bus to travel as fast as 80 km/h (Ballard 1999).
Three Ballard Commercial Prototype Fuel Cell buses were delivered to the Chicago Transit Authority; theBC (British Columbia) Transit will take delivery of three more in 1998. These buses are part of a two-year testing program that will provide performance, cost, and reliability data. Ballard is developing acommercial bus that is expected to be available by 2002. The commercial buses will be equipped with the205 kW fuel cell engine with a range of 560 km and a capacity of 75 passengers (Ballard 1999).
In 1997, the prototype Ballard bus had a price of $1.4 million (Wurster 1998). The goal for the smallfleets (i.e., Chicago and Vancouver) is roughly $600,000/bus, a price that is double that for a natural gasbus (Wurster 1998).
H Power Corporation has also developed a transit bus that is fueled by a PEM fuel cell. It has an onboardreformer for the methanol fuel. Neoplan, MAN/Siemens, and Daimler-Benz also have PEM buses. BothNeoplan and MAN/Siemens are expected to demonstrate their buses in Bavaria. Daimler-Benz has ademonstration in southern Germany (Wurster 1998).
Minh and Takahashi (1995) contend that SOFC systems may be the most practical of all fuel cell systemsfor heavy-duty applications. Because of onboard fuel processing, these systems can internally reformmethanol or other hydrocarbon fuels. An SOFC system would also be compact because it can operate athigh current and power densities. And because it is solid state, it can be designed in a variety ofconfigurations. The major drawback to the SOFC in transportation applications is its high temperatureand its corresponding lengthy power-up time. Thus, these systems would be best suited for applicationssuch as locomotives, trucks, and barges that have long duty cycles (i.e., infrequent startups andshutdowns) (Minh and Takahashi 1995). No costs for SOFC systems in the transportation sector wereobtained.
Internal combustion engines
Heavy-duty vehicles equipped with ICEs are also in operation. Hart (1998) reports that a Hythane bus hasbeen operating in Quebec since late 1995. The bus, which was manufactured by Novabus, is powered by a180 kW Cummins ICE and has a range of 400 km. The bus can store 1,500-L of fuel as a compressed gason the roof. MAN Nutzfahrzeuge Akriengesellschaft has also developed a hydrogen-fueled bus based on a4-stroke Otto ICE. The bus can operate on either hydrogen or gasoline, with maximum outputs (at 2,200rpm) of 140 kW and 170 kW, respectively. This bus was demonstrated during 1996 and 1998 in city service(Johansson 1999). No costs for heavy-duty hydrogen powered systems with ICEs were obtained.
Onboard hydrogen storage versus onboard reforming
The Ballard buses use compressed gas cylinder storage located on the roof (Ballard 1998). The gas isstored at 24.8 MPa and is delivered at 0.207 MPa. Complete fuel use is ensured by recirculating unusedhydrogen. As described earlier, heavy-duty vehicles that are based on an SOFC system would use

29
onboard reforming. This option would likely be the most economical for these applications, given thatinternal reforming without a catalyst is possible.
Other Transportation Uses
Hydrogen has been proposed for use as an aviation fuel (Hart 1998; Contreras et al. 1997). The jointRussian-German Cryoplane project is evaluating the use of liquid hydrogen in a modified Airbus A310where the fuel would be stored on the roof of the aircraft (Hart 1998; Contreras et al. 1997). NASA isalso developing a hydrogen-fueled plane as part of its National Aerospace Plane Program (NASP). Thisaircraft would operate at hypersonic speeds with slush hydrogen, a mixture of liquid and frozen hydrogen(Contreras et al. 1997). In addition, several other companies have studied hydrogen as an aviation fuel.
Contreras et al. developed cost estimates for liquid hydrogen as an aviation fuel for 1995 and 2000,assuming technology improvements. The direct operating cost (DOC) for an aircraft using liquidhydrogen was $12.60/GJ in 1995 (1998$) and $11.90/GJ in 2000 (1998$). This cost was based onelectrolysis. The DOC for liquid hydrogen was 1.55 times that of Synjet in 1995. When environmentalconstraints and efficiency gains are taken into consideration, this ratio drops to 1.43 in 1995 and 1.39 in2000. Clearly, other cost reductions or carbon taxes would be necessary for liquid hydrogen to becompetitive.
Hydrogen Transport and Distribution
Hydrogen may be transported using several methods: pipeline, truck, rail, and ship. The method selecteddepends not only on the distance transported, but also on the production method and/or the use.
Pipelines
Several authors have examined hydrogen transport by pipeline. However, in most cases, the costsprovided were based on extant natural gas pipelines or were very rough estimates (e.g., $1 million/miwith no specification on diameter). The cost of natural gas pipelines varies by the pipe diameter. Forexample, the construction cost of a 4-in. pipeline would cost $100,000/mi; the cost of a 42-in. pipelinewould cost $1.5 million/mi (True 1996). Veziroglu and Barbir (1998) state that the cost of a hydrogenpipeline would be 50%-80% higher than that of a natural gas pipeline and Kirk-Othmer (1991b) suggeststhat regional transportation could be as much as five times higher than natural gas, primarily because ofthe lower volumetric energy density of hydrogen. Ogden et al. (1997) estimates the capital cost of ahydrogen pipeline at $1 million/km.
Several reports discuss the use of extant natural gas pipelines to transmit hydrogen or hydrogen-naturalgas blends. Kirk-Othmer (1991b) notes that embrittlement may be a problem with high pressuretransmission of hydrogen and that although some components of a natural gas system could be used forhydrogen transmission, compressors and meters would not be applicable.
Oney et al. (1994) provided a detailed analysis of pipeline transport of hydrogen and hydrogen-natural gasmixtures. An analysis was conducted to find the minimum transmission cost based on the optimaldiameter. Transporting 0.5 GW of pure hydrogen was projected to cost $0.89/GJ for a distance of 100 kmup to $2.60/GJ for a distance of 500 km. The authors also looked at the effect of the energy delivery rateon the economics. Transmission of hydrogen for 100 km was projected to cost $1.30/GJ for 0.1 GWdelivery rate and $0.83/GJ for 1.0 GW delivery rate. In all cases, the transmission costs of hydrogen wereapparently in line (i.e., 50%-80% higher than natural gas) with the value proposed by Veziroglu andBarbir (1998). The paper did state, however, that although hydrogen transmission is more expensive thannatural gas, this cost differential could be eliminated if the hydrogen were produced at 0.65 MPa insteadof atmospheric. This conclusion was based on a transportation distance of 500 km and an energy deliveryrate of 1.0 GW.

30
Amos (1998) also provided detailed pipeline transmission costs. For a distance of about 100 km, the costof transmission is $0.50-$0.58/GJ for energy delivery rates of 1.5 GW and 0.15 GW, respectively. At 300km, these costs are $0.75-$2.17/GJ for 1.5 GW and 0.5 GW, respectively. The costs by Amos were basedon an installed capital cost of $1 million/mile and compressor costs of $1,000/kW.
The detailed estimates by Amos (1998) and Oney et al. (1994) were standardized using the economicmethodology outlined earlier. Several different pipeline lengths and energy transmission rates wereevaluated. Interestingly, the standard methodology increased the projected costs by Amos and decreasedthose by Oney et al. The results of this analysis are shown in Table 12.
Table 12: Summary of Hydrogen Transmission Costs via Pipeline
Transmission Rate(GW)
Distance(km) Reference
Specific TCI($/GJ delivered)
HydrogenTransmission Cost
($/GJ)0.15
161
805
1609
Amos 1998Oney et al. 1994Amos 1998Oney et al. 1994Amos 1998Oney et al. 1994
21.2214.14
106.2467.53
210.32134.18
2.832.03
13.848.87
27.2317.41
0.51618051609
Oney et al. 1994Oney et al. 1994Oney et al. 1994
4.8020.8138.82
0.832.885.44
1.01618051609
Oney et al. 1994Oney et al. 1994Oney et al. 1994
2.6610.8020.80
0.571.602.88
1.5161
805
1609
Amos 1998Oney et al. 1994Amos 1998Oney et al. 1994Amos 1998Oney et al. 1994
2.832.13
11.597.47
22.3014.13
0.830.492.091.173.532.03
The assumptions used by Oney et al. result in lower pipeline hydrogen transmission costs compared tothose by Amos. In general, this difference is due to the lower capital investment costs proposed by Oneyet al. The difference could become greater if the diameter was optimized as described by Oney et al. Thediameter was not optimized was not done to ensure a level comparison, as the report by Amos had a fixeddiameter (0.25 m). In both cases, as expected, the cost of transmission increases with pipeline length anddecreases with the amount transmitted.
Truck Transport
Hydrogen may be transported on trucks as a compressed gas, liquefied hydrogen, metal hydride, or othermedia such as glass microspheres. Two studies (Amos 1998; Berry 1996) looked at the transportation ofhydrogen via trucks. The Amos report evaluated numerous scenarios, including those with very lowquantities for transport such that the initial truck was not fully used, which resulted in high capital

31
charges. In these cases, the transporter would likely rent the truck and incur only operating expenses. Forthis analysis, only scenarios where at least one truck is fully used are evaluated.
Both Amos and Berry evaluated liquid hydrogen transport on trucks. The Amos report looked atnumerous scenarios for varying quantities and distances. The Berry study looked at a single case. TheAmos study was based on a liquid hydrogen storage tank with a capacity of 500 GJ and a cost of$410,000. The Berry report used a truck trailer with a capacity of 420 GJ and a cost of $400,000. Thetruck cost for the Amos report was $90,000; that for the Berry report was $60,000.
The Berry study was based on transporting 10.38 million GJ of hydrogen/yr, a delivery distance of 410km, and an annual truck mileage of 164,000 km. The Amos study evaluated several delivery distances(16 km-1,609 km) and quantities (5,000-50 million GJ/yr). The costs in the Berry study weresignificantly higher than those for a comparable scenario in the Amos study. The Berry study had moreconservative estimates for O&M costs, fuel costs, and capital charges. The Berry study estimated thattransport would cost about $5.60/GJ in capital charges and would add almost $6/GJ to the cost ofhydrogen. For the scenarios evaluated in the Amos study, the transportation costs increase both withdistance and quantity transported. At some point, however, the quantity ceases to affect the costs - thecosts are affected only by the distance. Table 13 presents the range of transportation costs for several tripdistances evaluated by Amos. Each distance was evaluated for quantities of 45,418-45.6 million GJ/yr.In each case, the lower end of the range corresponds to the higher quantity transported.
Table 13: Hydrogen Transport as a Liquefied Gas via TruckTrip Distance
(km)TCI
($/GJ)Transport Cost
($/GJ)16 0.44-11.0 0.24-1.60161 0.77-11.0 0.52-1.84322 2.20-11.0 1.0-2.20805 2.70-11.0 2.00-3.101,609 5.10-11.0 3.90-4.70
The Amos report also evaluated hydrogen transport on trucks as a compressed gas. Costs were based on atruck tube unit with a capacity of 21.72 GJ and a capital cost of $160,000. A major cost component forthis method is labor. When the trucks are fully used, the major cost factor is the distance traveled. Table14 summarizes the cost for compressed gas transport via truck for several distances. The ranges shownare due to slight differences in capital charges based on the percentage used.
Table 14: Hydrogen Transport as a Compressed Gas via TruckTrip Distance
(km)Quantity
Transported(GJ/yr)
TCI($/GJ)
Transport Cost($/GJ)
16 458,000-45.8 million 4.10 4.70161 458,000-45.8 million 8.20 10.60322 45,800-45.8 million 13.7-16.4 18.30-18.60805 45,800-45.8 million 30.20 41.101,609 45,800-45.8 million 57.60 79.10-79.70
In the Amos study, truck transport using metal hydrides was based on a truck cost of $100,000 and ahydride cost of $18,375/GJ hydrogen stored. Because there is no economy of scale for the metal hydridestorage containers, once the trucks are fully used, the cost of transportation depends only on the distancetraveled. If the first truck is not fully used, both the amount transported and the distance would impact

32
the costs. Table 15 summarizes the transportation costs for metal hydride systems, assuming that eachtruck is fully used.
Table 15: Hydrogen Transport via Truck in Metal HydridesTrip Distance
(km)Quantity
Transported(GJ/yr)
TCI($/GJ)
Transport Cost($/GJ)
16 458,000-45.8 million 7.54 2.63161 458,000-45.8 million 15.08 5.75322 45,800-45.8 million 25.13 9.80805 45,800-45.8 million 55.28 21.921,609 45,800-45.8 million 105.54 42.11
Other Transport
Amos evaluated rail and ship transport of hydrogen. Rail shipment was assumed to be viable forcompressed gas, liquefied hydrogen, and metal hydride; only liquefied hydrogen was evaluated for shiptransport.
Capital costs for rail transport were estimated to be $3,670/GJ for the rail tube assembly for compressedgas transport; $370/GJ for a liquefied gas unit; and $18,300/GJ for a metal hydride system. The rail carundercarriage was assumed to cost $100,000. Various scenarios were evaluated using these assumptionsas well as specific assumptions for operating costs, including the average speed (40 km/h), availability(99%), and freight charge ($400/wagon) to project the rail transport costs. These assumptions were usedin the standard economic methodology to project the cost of each type of transport. In each case, thespecific TCI (i.e., $/GJ transported/yr) and the cost/unit hydrogen transported depends primarily on theamount transported. This result is due to the flat shipping charge. The only exception to this is forsituations in which the distance traveled takes longer than a single day. In these cases, the capital cost isincreased by the number of travel days because more railcars would presumably be required. Table 16summarizes the costs for shipping via rail (Amos 1998).

33
Table 16: Costs for Hydrogen Transport via RailTransport Method/
Transport TimeAmount Transported
(GJ/yr)Specific TCI
($/GJ transported)Transport Costs
($/GJ)Liquid Hydrogen 1 day (< 984 km)
2 days (< 1970 km)
45,600455,600
45.6 million
45,600455,600
45.6 million
10.974.393.95
10.976.580.07
2.141.301.24
2.141.580.75
Compressed Gas 1 day (< 984 km)
2 days (< 1970 km)
45,800457,600
45.8 million
45,800457,600
45.8 million
52.4447.2047.20
78.6778.6778.67
21.4120.7320.73
24.7724.7724.77
Metal Hydride 1 day (< 984 km)
2 days (< 1970 km)
45,700457,00
45.7 million
45,700457,00
45.7 million
183.76165.38165.38
275.63275.63275.63
30.9028.5528.55
42.6842.6842.68
Transport by ship will likely be feasible only for liquefied hydrogen because of the long transport times.The cost of ship transport was estimated based on a specific capital cost of $715/GJ. Operating costswere based on an average ship speed of 16 km/h, an availability of 98.6%, and a freight charge of$3,000/unit. Based on these assumptions and the standard methodology, the cost to transport hydrogenvia ship will increase the cost by $13-$25/GJ. The cost of ship transport, over the range studied, dependsprimarily on the distance traveled. For a given distance, the specific TCI and the transportation pricewere insensitive to the amount transported. This relationship is due to the linear relationship between theTCI and the quantity transported. This remains constant for a given distance, and so the only factoraffecting the costs is the distance traveled. Based on the standard methodology, the cost to ship 0.46million-46 million GJ/yr of LH2 1,609 km has a specific TCI of almost $25/GJ transported and an overallcost of $15/GJ. The corresponding costs for other distances are summarized in Table 17.
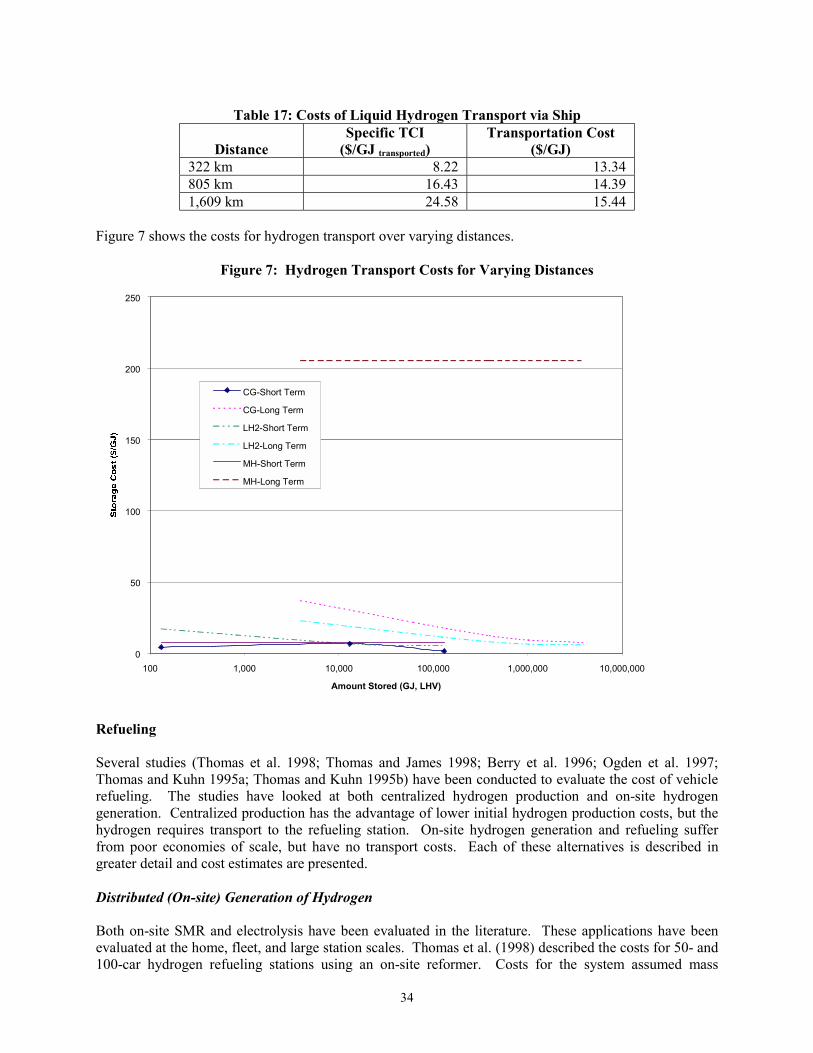
34
Table 17: Costs of Liquid Hydrogen Transport via Ship
DistanceSpecific TCI
($/GJ transported)Transportation Cost
($/GJ)322 km 8.22 13.34805 km 16.43 14.391,609 km 24.58 15.44
Figure 7 shows the costs for hydrogen transport over varying distances.
Figure 7: Hydrogen Transport Costs for Varying Distances
0
50
100
150
200
250
100 1,000 10,000 100,000 1,000,000 10,000,000
Amount Stored (GJ, LHV)
CG-Short Term
CG-Long Term
LH2-Short Term
LH2-Long Term
MH-Short Term
MH-Long Term
Refueling
Several studies (Thomas et al. 1998; Thomas and James 1998; Berry et al. 1996; Ogden et al. 1997;Thomas and Kuhn 1995a; Thomas and Kuhn 1995b) have been conducted to evaluate the cost of vehiclerefueling. The studies have looked at both centralized hydrogen production and on-site hydrogengeneration. Centralized production has the advantage of lower initial hydrogen production costs, but thehydrogen requires transport to the refueling station. On-site hydrogen generation and refueling sufferfrom poor economies of scale, but have no transport costs. Each of these alternatives is described ingreater detail and cost estimates are presented.
Distributed (On-site) Generation of Hydrogen
Both on-site SMR and electrolysis have been evaluated in the literature. These applications have beenevaluated at the home, fleet, and large station scales. Thomas et al. (1998) described the costs for 50- and100-car hydrogen refueling stations using an on-site reformer. Costs for the system assumed mass

35
production of components with an annual volume of at least 10,000 units/yr. These costs are summarizedin Table 18.
Table 18: Capital Costs for Refueling Stations (Mass Production)Component 50-Car Station 100-Car Station
Natural gas reformer 10,900 15,187Hydrogen compressor 5,795 6,446Hydrogen storage 9,672 19,344Hydrogen dispenser 4,846 4,846Total 31,213 45,823
Based on this analysis, the cost of hydrogen at each station was also projected. The 50-car station had ahydrogen cost of about $0.82/gal gasoline equivalent and the 100-car station had a hydrogen cost of about$0.75/gal gasoline equivalent. These estimates are based on a natural gas cost of $3.80/GJ and electricitycosts $0.06/kWh. Also, the estimate assumes that an FCEV has a fuel economy 2.2 times that of aconventional gasoline ICEV using a 1.25 factor for the EPA driving cycles (Thomas et al. 1998). Thus,the authors concluded that distributed hydrogen systems were competitive with current gasoline ICEVtechnology. Not enough backup information on the operating costs was provided in the document forstandardization.
Thomas and James (1998) evaluated hydrogen for refueling in conjunction with and SMR/PEM fuel cellsystem for heat and electricity. During off-peak periods, the SMR would produce hydrogen for vehiclerefueling. Their assumptions were standardized to determine the cost of the hydrogen produced forvehicle refueling for a residence and for a 50-car refueling station located at a commercial building with a50-kW PEM fuel cell. All components were assumed to be mass produced. Using the standard economicmethodology, the specific TCI of the 50-car station is roughly $17/GJ/yr with a hydrogen price of $9/GJ.A single-car station was projected to cost $40/GJ/yr with a hydrogen price of almost $22/GJ.
Berry et al. (1996) also evaluated the cost of refueling systems with distributed hydrogen generation. Thesystems were evaluated using the standard methodology. On-site SMR, alkaline electrolysis, PEMelectrolysis, and steam electrolysis were evaluated; a residential electrolysis system was also presented.Based on the standard methodology, an on-site SMR system could deliver 39,240 GJ/yr of hydrogen for300 cars/d at slightly more than $18/GJ. An on-site alkaline system would produce hydrogen at $25-$29/GJ for a size range of 1,700-51,200 GJ/yr. This cost range is expected to decrease to $23-$27/GJ forPEM electrolysis, primarily because of lower capital costs. Further capital cost reductions are assumedfor steam electrolysis, which would lower the delivered hydrogen costs to $18-$21/GJ. The residentialsystem would provide 35 GJ/yr at a specific TCI of $100/GJ and a hydrogen price of $42/GJ.
Ogden et al. (1997) also estimated the delivered cost of hydrogen at refueling stations. These estimatesare based on a natural gas cost of $2.80/GJ, an off-peak power cost of $0.03/kWh, and a capital recoveryfactor of 15%. Refueling stations serving 800 cars/d with centralized production of H2 via SMR wereprojected to cost $700,000 for LH2 delivery and $1.7 million for pipeline delivery. Refueling stations(800 cars/d) with on-site reforming were estimated to cost $3.4-$5.4 million for conventional and fuel cellreforming, respectively. Refueling stations with on-site advanced electrolysis were projected to be themost expensive at $5.7 million for an 800-car station. Not enough detail was provided in the report forstandardization. However, for comparison, the results of the analysis are presented in Table 19.

36
Table 19: Delivered Hydrogen Costs at Refueling Stations
Station TypeDelivered Cost
of Hydrogen ($/GJ)a
On-site conventional reforming 14-47On-site fuel cell reforming 14-31On-site advanced electrolysis 30-41
a The author did not specify the basis for the estimates and so they were assumed to be forHHV and they were converted to LHV. The low range of costs in the table arefor a 53,600 Nm3/d facility and the high end of the range is for 2,700 Nm3/d.
Thomas and Kuhn (1995a) looked at a single-car refueling station based on an electrolyzer under threeeconomic schemes: (1) a business with a 10% real rate of return over 15 years; (2) a utility with a 6.3%real rate of return; and (3) inclusion of the system in a 30-year mortgage at 9%. The home refuelingstation was assumed to have excess capacity of 50% to account for daily mileage variations. The fleetsystem requires a smaller excess capacity of 20%.
The total capital cost for each alternative was projected to be $3,413 based on a mass-producedelectrolyzer cost of $300/kWout, a compressor cost of $115/kWout, and a storage cost of $50/lb H2. Basedon these economic parameters, the report concluded that electrolytic hydrogen would be cost-competitivewith fully taxed gasoline if electricity were available at $0.03-$0.045/kWh. If hydrogen fuel were taxedas gasoline, electricity prices must be less than $0.01-$0.025/kWh. Under these conditions (i.e., equaltaxation), the benefits of hydrogen fuel, such as lower O&M vehicle charges, should be considered.Given the economic assumptions, the home refueling station was the most economic and the 15-yearbusiness loan, the least.
Thomas and Kuhn (1995a) added to their previous work by evaluating the effect of station size on the costof hydrogen for refueling. They evaluated a two-car home refueling station, a 50-car fleet (11 cars/d), anda 1,300-car station (160 cars/d). All were evaluated assuming a 15-year lifetime, a real discount rate of8.86%, and the capital cost assumptions used in the previous study except that hydrogen storage wasprojected to cost $60/lb. The authors concluded that the larger systems can compete with fully taxedgasoline using electricity at $0.05/kWh; the small systems require electricity at $0.03/kWh. Thisconclusion conservatively takes no economies of scale for the capital components of the larger systems.If there is an economy of scale, the allowable electricity price would likely be higher.
The cost information provided by Thomas and Kuhn (1995b) was evaluated using the standardmethodology. This analysis showed, as in the original analysis, the cost of home refueling ($49/GJ) issignificantly greater than that for the fleet ($35/GJ) or large refueling ($31/GJ) stations. The difference inthis analysis is greater than that projected by the authors because, as noted earlier, the on-line factor forthe home station is only 52% and that for the other stations is 76%. The source document assumed 70%on-line factor for all cases.

37
A summary of the standardized costs for on-site hydrogen production is provided in Table 20.
Table 20: Standardized Costs for On-Site Hydrogen ProductionTechnology/Size (GJ/yr) Reference
Specific TCI($/GJ)
Hydrogen Price($/GJ)
SMR 39,240 1,752
Berry et al. 1996Thomas et al. 1998
56.5816.70
18.318.62
Alkaline Electrolysis 51,246 10,249 1,708
Berry et al. 1996Berry et al. 1996Berry et al. 1996
41.3564.3065.29
25.3628.7929.07
PEM Electrolysis 51,246 37,230 10,249 1,708 1,432
Berry et al. 1996Thomas et al. 1995Berry et al. 1996Berry et al. 1996Thomas et al. 1995
25.7229.2738.5850.4549.06
22.9130.7424.8226.8434.84
Steam Electrolysis 51,246 10,249
Berry et al. 1996Berry et al. 1996
18.0043.53
17.5321.39
Residential 35 (Electrolysis) 298 (SMR) 57.3 (Electrolysis)
Berry et al. 1996Thomas et al. 1998Thomas et al. 1995
101.2740.1779.64
42.4221.7348.80
The costs estimated by Thomas and James (1998) are significantly lower than those from any othersource. This cost differential is primarily due to the significantly lower capital investment projected. Theother values show good agreement among themselves as well as with the values by Ogden et al. (1997)that were summarized in Table 19.
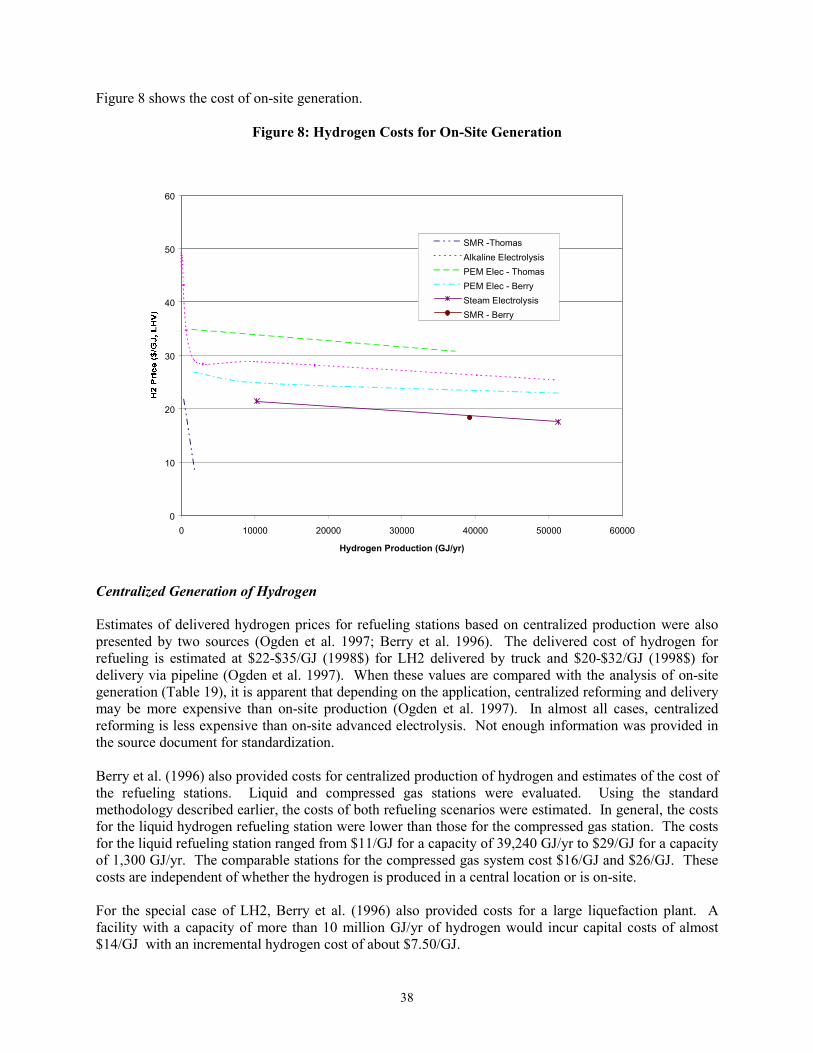
38
Figure 8 shows the cost of on-site generation.
Figure 8: Hydrogen Costs for On-Site Generation
0
10
20
30
40
50
60
0 10000 20000 30000 40000 50000 60000
Hydrogen Production (GJ/yr)
SMR -Thomas
Alkaline Electrolysis
PEM Elec - Thomas
PEM Elec - Berry
Steam Electrolysis
SMR - Berry
Centralized Generation of Hydrogen
Estimates of delivered hydrogen prices for refueling stations based on centralized production were alsopresented by two sources (Ogden et al. 1997; Berry et al. 1996). The delivered cost of hydrogen forrefueling is estimated at $22-$35/GJ (1998$) for LH2 delivered by truck and $20-$32/GJ (1998$) fordelivery via pipeline (Ogden et al. 1997). When these values are compared with the analysis of on-sitegeneration (Table 19), it is apparent that depending on the application, centralized reforming and deliverymay be more expensive than on-site production (Ogden et al. 1997). In almost all cases, centralizedreforming is less expensive than on-site advanced electrolysis. Not enough information was provided inthe source document for standardization.
Berry et al. (1996) also provided costs for centralized production of hydrogen and estimates of the cost ofthe refueling stations. Liquid and compressed gas stations were evaluated. Using the standardmethodology described earlier, the costs of both refueling scenarios were estimated. In general, the costsfor the liquid hydrogen refueling station were lower than those for the compressed gas station. The costsfor the liquid refueling station ranged from $11/GJ for a capacity of 39,240 GJ/yr to $29/GJ for a capacityof 1,300 GJ/yr. The comparable stations for the compressed gas system cost $16/GJ and $26/GJ. Thesecosts are independent of whether the hydrogen is produced in a central location or is on-site.
For the special case of LH2, Berry et al. (1996) also provided costs for a large liquefaction plant. Afacility with a capacity of more than 10 million GJ/yr of hydrogen would incur capital costs of almost$14/GJ with an incremental hydrogen cost of about $7.50/GJ.

39
Table 21 and Figure 9 summarize the standardized costs for hydrogen refueling stations from Berry et al.(1996).
Table 21: Standardized Costs for Hydrogen Refueling StationsTechnology/
SizeNumber ofCars/day
TCI($/GJ)
Hydrogen Cost($/GJ)
LH2 39,420 7,884 1,314
3006010
9.0526.49
121.94
11.2713.9628.71
Compressed Gas 39,420 7,884 1,314
3006010
29.3248.8796.45
15.9418.9726.32
Liquefaction Plant 10,380,600 N/A 13.67 7.55
Figure 9: Hydrogen Costs for Vehicle Refueling Stations
10
15
20
25
30
0 50 100 150 200 250 300 350Number of Cars per Day
CG Refueling
LH2 Refueling
Hydrogen’s Role in Reducing Anthropogenic Carbon Emissions
Several authors (Fisher 1990; Okken 1992; Okken et al. 1995) have evaluated the use of hydrogen as amethod for minimizing greenhouse gas emissions to the environment. Two primary methods have beenproposed: (1) hydrogen production using renewable resources (e.g., PV-electrolysis, biomass); and (2) thecapture and sequestration of CO2 from conventional hydrogen production technologies (e.g., SMR).Although the use of renewable technologies such as PV- and wind-electrolysis or biomass gasification

40
would have minimal emissions of greenhouse gases, these technologies are still expensive. As notedearlier, the most common method of hydrogen production is SMR. In this technology, the CO2 isseparated from the hydrogen and vented to the atmosphere. To reduce emissions using this technology,then, the CO2 must be captured and sequestered.
Several methods are available to remove greenhouse gases, primarily CO2, from hydrogen productionstreams. The most commonly proposed methods are amine scrubbing and PSA. Details on theeconomics of specific applications of both methods are provided here.
Sequestration Options
After CO2 is removed from the process stream, it must be sequestered so it is not released to theatmosphere. The two most commonly proposed methods for sequestration are ocean disposal andunderground injection. In ocean disposal, several options are available. Liquid CO2 may be releasedfrom pipelines at depths of 2,000 m or more; solid CO2 can be disposed of by ships; or CO2 can beconverted into clathrates/hydrates for disposal (Okken 1992). With underground sequestration, the CO2 isinjected into depleted natural gas reservoirs or other geologic formations such as aquifers (Okken 1992).
The ocean has a CO2 uptake capacity that is almost 7,000 times greater than current carbon emissions.However, the CO2 will not remain in the ocean forever and there has been little investigation into theimpacts on marine ecosystems (Okken 1992). Okken (1992) estimates that there is a total of 5 yearsworth of capacity in old natural gas wells and an additional 15 years capacity in sedimentary basins.
Costs for ocean disposal are expected to be twice those of underground injection (Okken 1992).
Economics
Two studies (Foster-Wheeler 1996; Blok et al. 1997) evaluated the economic and technical feasibility ofcapturing the CO2 from SMR and sequestering it. The Foster-Wheeler study, which was commissionedby IEA, also looked at CO2 removal and sequestration from coal gasification. Ocean disposal of the CO2
was evaluated in the Foster-Wheeler study; the Blok study evaluated underground sequestration. TheFoster-Wheeler study projected a CO2 removal of 85% for the CH4 case and 97% for the coal gas and theBlok study projected a CO2 removal of 70%. In the Foster Wheeler SMR process, most CO2 is removedwith amine scrubbing prior to the PSA unit where the remaining CO2 is removed. In the Blok et al. study,only that CO2 already removed from the hydrogen in the PSA unit was sequestered. Carbon dioxideremovals were higher for the coal process because all the fuel is gasified within the process so CO2 maybe removed in-situ. The CH4 process requires an external fuel source and some methane is lost. Bothfactors decrease the removal efficiency (Foster-Wheeler 1996).
The CO2 disposal costs for the Foster-Wheeler ocean disposal scenario assumed a seaside location, apipeline length of 30 km, well head facilities, and a disposal well. The capital cost of the CO2 disposalsystem was estimated at $23.8 million for the natural gas SMR and $29.9 million for the coal gasification.The overall capital increase for CO2 capture and sequestration was $198 million (76%) for the SMRsystem and $314 million (36%) for coal gasification. Operating costs for disposal were assessed as $2million/yr for both cases. The CO2 capture added costs for the amine solution, increased maintenance,and additional fuel costs caused by efficiency losses.
Using the methodology outlined earlier, the cost of hydrogen from an SMR plant increases by 26% to$6.83/GJ. The increase from the coal-based plant is 24% to $12.26/GJ. On a CO2 basis, the cost of CO2
removal for the SMR case is $22.72/T and $13.80/T for the coal gasification case. The primary reasonsfor the difference in costs are the higher carbon content of coal and the higher CO2 removal efficiency(i.e., 97% versus 85%).
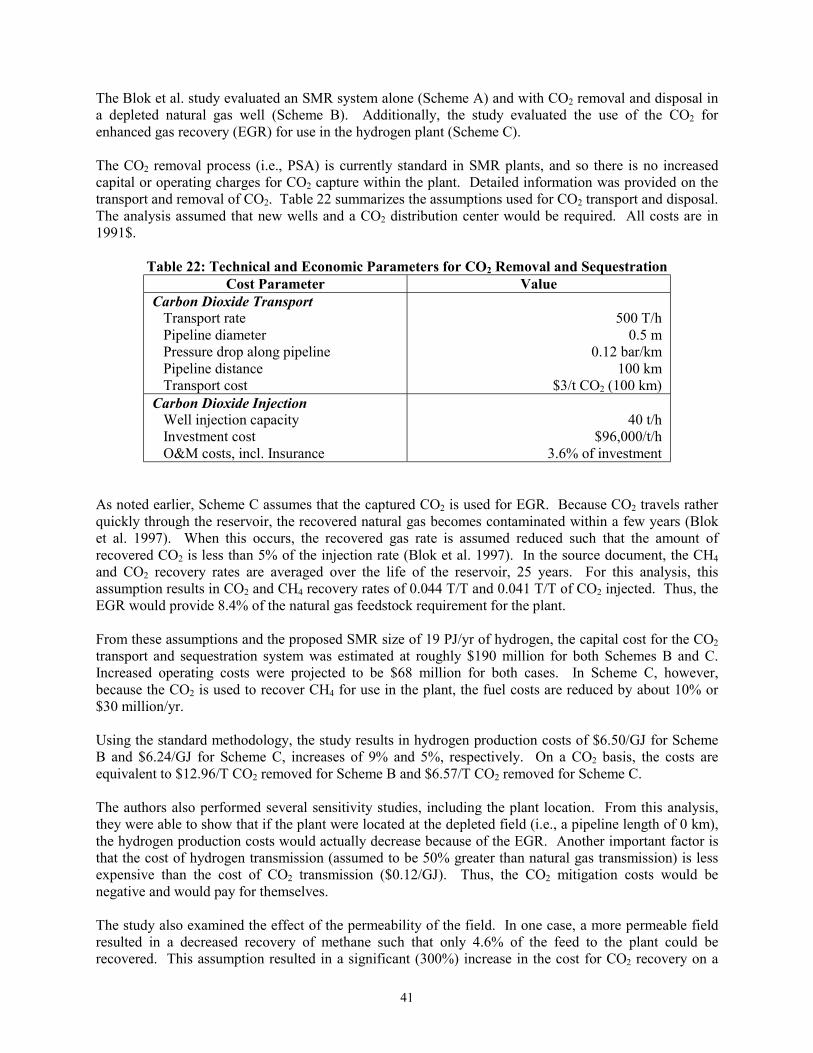
41
The Blok et al. study evaluated an SMR system alone (Scheme A) and with CO2 removal and disposal ina depleted natural gas well (Scheme B). Additionally, the study evaluated the use of the CO2 forenhanced gas recovery (EGR) for use in the hydrogen plant (Scheme C).
The CO2 removal process (i.e., PSA) is currently standard in SMR plants, and so there is no increasedcapital or operating charges for CO2 capture within the plant. Detailed information was provided on thetransport and removal of CO2. Table 22 summarizes the assumptions used for CO2 transport and disposal.The analysis assumed that new wells and a CO2 distribution center would be required. All costs are in1991$.
Table 22: Technical and Economic Parameters for CO2 Removal and SequestrationCost Parameter Value
Carbon Dioxide Transport Transport rate Pipeline diameter Pressure drop along pipeline Pipeline distance Transport cost
500 T/h0.5 m
0.12 bar/km100 km
$3/t CO2 (100 km)Carbon Dioxide Injection Well injection capacity Investment cost O&M costs, incl. Insurance
40 t/h$96,000/t/h
3.6% of investment
As noted earlier, Scheme C assumes that the captured CO2 is used for EGR. Because CO2 travels ratherquickly through the reservoir, the recovered natural gas becomes contaminated within a few years (Bloket al. 1997). When this occurs, the recovered gas rate is assumed reduced such that the amount ofrecovered CO2 is less than 5% of the injection rate (Blok et al. 1997). In the source document, the CH4
and CO2 recovery rates are averaged over the life of the reservoir, 25 years. For this analysis, thisassumption results in CO2 and CH4 recovery rates of 0.044 T/T and 0.041 T/T of CO2 injected. Thus, theEGR would provide 8.4% of the natural gas feedstock requirement for the plant.
From these assumptions and the proposed SMR size of 19 PJ/yr of hydrogen, the capital cost for the CO2
transport and sequestration system was estimated at roughly $190 million for both Schemes B and C.Increased operating costs were projected to be $68 million for both cases. In Scheme C, however,because the CO2 is used to recover CH4 for use in the plant, the fuel costs are reduced by about 10% or$30 million/yr.
Using the standard methodology, the study results in hydrogen production costs of $6.50/GJ for SchemeB and $6.24/GJ for Scheme C, increases of 9% and 5%, respectively. On a CO2 basis, the costs areequivalent to $12.96/T CO2 removed for Scheme B and $6.57/T CO2 removed for Scheme C.
The authors also performed several sensitivity studies, including the plant location. From this analysis,they were able to show that if the plant were located at the depleted field (i.e., a pipeline length of 0 km),the hydrogen production costs would actually decrease because of the EGR. Another important factor isthat the cost of hydrogen transmission (assumed to be 50% greater than natural gas transmission) is lessexpensive than the cost of CO2 transmission ($0.12/GJ). Thus, the CO2 mitigation costs would benegative and would pay for themselves.
The study also examined the effect of the permeability of the field. In one case, a more permeable fieldresulted in a decreased recovery of methane such that only 4.6% of the feed to the plant could berecovered. This assumption resulted in a significant (300%) increase in the cost for CO2 recovery on a

42
$/T basis. Thus, the specific characteristics of the field are important components of the cost analysis.The results of all three studies are summarized in Table 23.
Table 23: Summary of Hydrogen Costs and CO2 Removal Costs for Hydrogen Production
TechnologySize
M Nm3/dTCI
($/GJ)
HydrogenCost
($/GJ)
CO2
Removal Cost($/T)
Steam Methane Reforming Ocean disposal Depleted well EGR
6.7525.3825.38
17.313.613.6
6.836.506.24
22.7212.96
6.57Coal Gasification Ocean disposal 6.75 44.9 12.26 13.80
Except in the special case of CO2 use for EGR at the depleted gas field, CO2 recovery and sequestrationfrom hydrogen production increases the price of the hydrogen. Decarbonized hydrogen is about twice asexpensive as CH4 on an energy basis, and so these cost increases will not be competitive with standardfossil fuel use followed by flue gas cleanup (Foster Wheeler 1998). Thus, the end-use of the hydrogenshould perhaps be combined with the hydrogen production and CO2 removal strategy (Foster Wheeler1998). Several processing alternatives were evaluated by Foster-Wheeler (1998) and three wereidentified for further study.
Option 1 is the reduction of carbon emissions from the reformer furnace by the use of 25% of the gasturbine exhaust and 30% of the hydrogen-rich fuel gas product as combustion gases in the reformer.
In Option 2, pressurized (22 bar) reforming is used and the combustion air for the reformer is supplied bythe gas turbine compressors. Additionally, hydrogen-rich gas is used to fuel the reformer. In bothoptions 2 and 3, a hydrogen-rich (95%) gas is combusted in the turbine.
Finally, Option 3 uses catalytic partial oxidation (CAPO), in which air and steam are used to partiallyoxidize natural gas. The air is taken from the air compressor of the gas turbine (20 bar) and the gasburned in the turbine is about 53% hydrogen and 43% nitrogen.
No significant technical hurdles were identified for Option 1. The components required for Option 2represent significant changes from current technology and significant process development would berequired. Option 3 has had limited experience on a large scale (i.e., several days), but would requirefurther demonstration to be commercially acceptable.
As noted earlier, all three options would require a gas turbine that could be operated on hydrogen-rich gas(53%-95%). The authors obtained conflicting information regarding the significance of this detail.However, they concluded that only minor modifications would be necessary (i.e., burner modificationsfor higher flame speed) and the cost impact would be insignificant.
Using the proposed methodology, each option was evaluated and compared to a standard natural gascombined cycle (NGCC) plant. Each plant had a nominal size of 500 MWe and each option removed84% of the CO2 compared to the NGCC. Based on this analysis, the cost of CO2 removal was estimatedat $33.4/T for Option 1, $42.6/T for Option 2, and $26.5/T for Option 3. These results, as well as therequired electricity prices and other parameters, are summarized in Table 24. Costs for CO2
disposal/sequestration were not included in the evaluation.

43
Table 24: Summary of Results for CO2 Removal via Hydrogen Production and Integration withElectricity Production
Base CaseNGCC
Option 1Gas Turbine
Exhaust Recycle
Option 2PressurizedReforming
Option 3CAPO
Facility size GWh/yEfficiency 59%
4,19648%
4,16149%
4,28450%
Capital costs Fixed capital investment FCI ($/kWh)
$311 million642
$505 million1,054
$583 million1,227
$467 million954
Required electricity pricea
($/kWh) 0.031 0.043 0.046 0.041CO2 removal costs ($/T) N/A 33.40 42.6 26.5
a Price required for a before-tax 10% IRR.
As in the original study, the cost of electricity increased by 33%-50% over that from an NGCC. Thecosts appeared to be most favorable, both on the electricity price and CO2 removal costs for Option 3,CAPO. Close behind, however, is Option 1, which has less technical uncertainty. The least favorableoption from both a technical and an economic standpoint is the pressurized reforming system, Option 2.
44
References
Aceves, S. 1996. “Analysis of Experimental Hydrogen Engine Data and Hydrogen Vehicle Performanceand Emissions Simulation,” in Proceedings of the 1996 U.S. DOE Hydrogen Program Review, Vol. 2,National Renewable Energy Laboratory, NREL/CP-430-21968, October.
Amos, W. 1998. “Costs of Storing and Transporting Hydrogen,” National Renewable Energy Laboratory,NREL/TP-570-25106, May.
Andreassen, K. 1998. “Hydrogen Production by Electrolysis,” Hydrogen Power: Theoretical andEngineering Solutions, Kluwer Academic Publishers, the Netherlands, pp. 91-102.
Appleby, A.J. 1993. “Characteristics of Fuel Cell Systems,” Fuel Cell Systems, ed. Leo J.M.J. Blomenand Michael N. Mugerwa, Plenum Press, New York, pp. 157-199.
Ballard 1999. Ballard Web Page. http://www.ballard.com/
Bannister, R.L., Newby, R.A., Yang, W.C. 1997. “Final Report on the Development of Hydrogen-FueledCombustion Turbine Cycle for Power Generation,” Westinghouse Electric Corporation, Orlando, FL32826-2399, Draft, September.
Barbir, F., Gomez, T. 1997. “Efficiency and Economics of Proton Exchange Membrane (PEM) FuelCells,” International Journal of Hydrogen Energy, Vol. 22, No. 10/11, pp. 1027-1037.
Berry, G. 1996. “Hydrogen as a Transportation Fuel: Costs and Benefits,” Lawrence LivermoreLaboratory, UCRL-ID-123465, March.
Birkle, S., R. Kircher, C. Nolscher, H. Voigt. 1994. “Electric drives. Toward a cost-effective alternative tothe internal combustion engine,” Siemens’ Corp Research and Development Department’s EnergyInnovation Cent., Siemens Review, Vol. 61, No. 4, July-Aug, pp. 27-32.
Blok, K., Williams, R., Katofsky, R., Hendriks, C. 1997. “Hydrogen Production from Natural Gas,Sequestration of Recovered CO2 in Depleted Gas Wells and Enhanced Natural Gas Recovery,”International Journal of Hydrogen Energy, Vol. 22, No. 2/3, pp.161-168.
Bohme, O., Haus, U., Leidlich, F., Salge, H., Wendt, H. 1994. “Process Engineering and Cost Estimationof MCFC Power Plants,” 1994 Fuel Cell Seminar, Program and Abstracts, pp. 61-64.
Buteau, F.P., Demange, C., Moreau, R., Gros-Bonnivard, J.M. 1992. “Development status of an advancedelectrolyzer,” Hydrogen Energy Progress IX. Vol. 1, pp. 345-354.
Carlsson, P., Grondalen, O., Steinwall, P., Svensson, J. 1997. “Executive Summary of Feasibility Study,Automated solar-hydrogen-fuel-cell autarkic electricity supply system ASHFAES,” presented at the 1998Study Group on Hydrogen and Working Committee 2 Executive Meeting of the International Gas Union,May 1998.
Carpetis, C. 1994. “Technology and costs of hydrogen storage,” TIDE (TERI Information Digest onEnergy), Vol.: 4:1, March, pp. 1-13.
Chemical Engineering 1983. “Economic Indicators,” December 26.
Chemical Engineering 1990. “Economic Indicators,” December.

45
Chemical Engineering 1998. “Economic Indicators,” September.
Chornet, E., Mann, M., Wang, D., Montane, D., Czernik, S., Johnson, D. 1995. “Hydrogen from Biomassvia Fast Pyrolysis,” 1995 EPA Greenhouse Gas Emissions and Mitigation Research Symposium,Washington D.C., June 27-29.
Contreras, A., S. Yigit, Ozay, K., Veziroglu, T. 1997. “Hydrogen as Aviation Fuel: A Comparison withHydrocarbon Fuels,” International Journal of Hydrogen Energy, 10/11, pp. 1053-1060.
DeLuchi, M. 1992. “Hydrogen Fuel-Cell Vehicles,” Research Report, Institute of Transportation Studies,University of California, Davis, UCD-ITS-RR-92-14, September.
DeLuchi, M.A., Larson, E.D., Williams, R.H. 1991. “Hydrogen and Methanol: Production from Biomassand Use in Fuel Cell and Internal Combustion Engine Vehicles, A Preliminary Assessment,” The Centerfor Energy and Environmental Studies, Princeton University, PU/CEES Report No. 263, August.
Energy Information Agency. 1998. Annual Energy Outlook, DOE\EIA-0383(98), December 1997.
Ekdunge, P., Raberg, M. 1998. “The Fuel Cell Vehicle Analysis of Energy Use, Emissions and Cost,”International Journal of Hydrogen Energy, Vol. 23, No. 5, pp. 381-385.
Electric Power Research Institute. 1995. “Technical Brief: 2-MW Direct Carbonate Fuel CellDemonstration,” EPRI TB-105733, October.
Electric Power Research Institute. 1988. “Conceptual Design of a 100-MW Fuel Cell Power Plant forUrban Utility Applications,” Prepared by International Fuel Cells, EPRI AP-5609, December.
Fairlie, M.J., Scott, P.B., Stewart, W., Stuart, A.T.B. 1998. “Stand-Alone Solar Hydrogen Production,”ed. T.O. Saetre, Hydrogen Power: Theoretical and Engineering Solutions, Kluwer Academic Publishers,the Netherlands, pp. 119-128.
Fisher, D. (ed.) 1990. “Options for Reducing Greenhouse Gas Emissions,” The Stockholm EnvironmentInstitute, 1990.
Foster-Wheeler. 1996. IEA Greenhouse Gas R&D Programme, “Decarbonisation of Fossil Fuels,” ReportNo. PH2/2, March.
Foster-Wheeler. 1998. IEA Greenhouse Gas R&D Programme, “Precombustion Decarbonisation,” ReportNo. PH2/19, June.
Fuel Cells 2000 1999. Fuel Cell 2000 Website, http://wwww/fuelcells.org.
Garche, J. 1998. “Application of Small Scale Fuel Cells in Combined Heat/Power Cogeneration,”Hydrogen Power: Theoretical and Engineering Solutions, Kluwer Academic Publishers, the Netherlands,pp. 563-574.
Gas Research Institute (GRI), 1999. GRI/EPRI Unite to Commercialize Advanced Fuel Cells for PowerSystems,” press release, February 25, http://www.gri.com.
Gas Turbine World. 1997. 1997 Handbook.
Gaudernack, B. 1998. “Hydrogen Production from Fossil Fuels,” Hydrogen Power: Theoretical andEngineering Solutions, Kluwer Academic Publishers, the Netherlands, pp. 75-89.
46
Glatzmaier, G., Blake, D., Showalter, S. 1998. “Assessment of Methods for Hydrogen Production UsingConcentrated Solar Energy,” National Renewable Energy Laboratory, NREL/TP-570-23629, January.
Gregoire, C.E. 1992. “Technoeconomic Analysis of the Production of Biocrude from Wood,” MilestoneCompletion Report, NREL Report TP-430-5435, October.
Hart, D. 1998. Hydrogen Power, The commercial future of ‘the ultimate fuel’. Financial Times EnergyPublishing, London.
Hassmann, K., Kuhne, H. 1992. “Primary Energy Sources for Hydrogen Production,” Hydrogen EnergyProgress IX.
Himmelblau, D. 1982. Basic Principles and Calculations in Chemical Engineering, 4th edition, Prentice-Hall, Inc. Englewood Cliffs, NJ.
Hirschenhofer, J.H., Stauffer, D.B., Engleman, R.R. 1994. Fuel Cells, A Handbook (Revision 3),Gilbert/Commonwealth, Inc., U.S. Department of Energy, Morgantown Energy Technology Center,DOE/METC-94/1006, January.
Huston, E.L. 1984. “Liquid and Solid Storage of Hydrogen,” Hydrogen Energy Progress V, Proceedingsof the 5th World Hydrogen Energy Conference, Toronto, Canada, July.
Ippommatsu, M., Sasaki, H., Otoshi, S. 1996. “Evaluation of the Cost Performance of the SOFC Cell inthe Market”, International Journal of Hydrogen Energy, Vol. 2, pp. 129-135.
Johansson, K. 1999. “Hydrogen as a fuel for turbines and engines”, Sycon Energikonsult AB, Turbin &Processteknik Report, February 24.
Johnson, N.L., Amsden, A., Butler, T.D. 1996. “Numerical Modeling of Hydrogen-Fueled InternalCombustion Engines,” 1996 Annual Hydrogen Peer Review for DOE, Miami, FL, May 1-3, CONF-9605195.
Kirk-Othmer. 1991a. “Hydrogen,” in Encyclopedia of Chemical Technology, 4th edition, Vol. 13: HeliumGroup to Hypnotics, John Wiley & Sons, New York.
Kirk-Othmer. 1991b. “Pipelines,” in Encyclopedia of Chemical Technology, 4th edition, Vol. 19,Pigments to Powders, Handling, John Wiley & Sons, New York.
Larson, E.D., Katofsky, R.E. 1992. “Production of Methanol and Hydrogen from Biomass,” The Centerfor Energy and Environmental Studies, Princeton University, PU/CEES Report no. 217, July.
Ledjeff, K. 1990. “Comparison of Storage Options for Photovoltaic Systems,” International Journal ofHydrogen Energy,” Vol. 15, pp. 629-633.
Leiby, S. 1994. “Options for Refinery Hydrogen,” A private report by the Process Economics Program,Report No. 212, SRI International, Menlo Park, CA., February.
Lindstrom, O., Lavers, W. 1997. “Cost Engineering of Power Plants with Alkaline Fuel Cells”,International Journal of Hydrogen Energy, Vol. 22, No. 8, pp. 815-823.
Lipman, T.E., DeLucchi, M.A. 1996. “Hydrogen-fuelled vehicles,” International Journal of VehicleDesign, Vol. 17:5-6, pp. 562-589.

47
Mann, M.K. 1995a. “Technical and economic assessment of producing hydrogen by reforming syngasfrom the Battelle indirectly heated biomass gasifier,” National Renewable Energy Lab, NREL/TP-431-8143.
Mann, M.K. 1995b. “Technical and economic analyses of hydrogen production via indirectly heatedgasification and pyrolysis,” in Proceedings of the 1995 US DOE Hydrogen Program Review, Vol. 1,NREL/CP-430-20036-Vol. 1, pp. 205-236.
Mann, M., DiPietro, J.P., Iannucci, J., Eyer, J. 1998. “Exploring the Technical and Economic Feasibilityof Producing Hydrogen from Sunlight and Wind,” XII World Hydrogen Energy Conference, June 21-26,Buenos Aires.
Minh, N. and Takahashi, T. 1995. Science and Technology of Ceramic Fuel Cells, Elsevier Science,Amsterdam.
Mugerwa, M.N. , Blomen, L.J.M.J. 1993. “Fuel Cell System Economics,” Fuel Cell Systems, ed. L.J.M.J.Blomen and M.N. Mugerwa, Plenum Press, New York, 1993.
Murugesamoorthi,K., Srinivasan, S., and Appleby, A. 1993. “Research, Development, and Demonstrationof Solid Oxide Fuel Cell Systems,” Fuel Cell Systems, edited by L. Blomen and M. Mugerwa, PlenumPress, New York.
Newson, E., Haueter, TH., Hottinger, P., Von Roth, F. Scherer, G.W., Schucan, TH. H. 1998. “SeasonalStorage of Hydrogen in Stationary Systems with Liquid Organic Hydrides,” International Journal ofHydrogen Energy, Vol. 23, No. 10, pp. 905-909.
OANDA 1998. Cheat Sheet for Travelers, http://www.oanda.com, October 6, 1998.
Ogden, J. Steinbugler, M., Dennis, E., Kartha, S, Iwan, L., Jones, A. 1996. “Hydrogen Energy SystemsStudies,”
Ogden, J., M. Steinbugler, T. Kreutz. 1997. “Hydrogen as a Fuel for Fuel Cell Vehicles: A Technical andEconomic Comparison” presented at the National Hydrogen Association, 8th Annual Conference,Arlington, VA, March.
Ogden, J. 1998. “Synopsis: Hydrogen Energy Systems Studies”.
Okken, P.A. 1992. “Costs of Reducing CO2 Emissions by Means of Hydrogen Energy,” InternationalJournal of Hydrogen Energy, Vol. 18, No. 4, pp. 319-323.
Okken, P.A., Lako, P., Ybema, J.R. 1995. “Cost Effective Integration of Hydrogen in Energy Systemswith CO2 Constraints,” International Journal of Hydrogen Energy, Vol. 20, No. 12, pp. 975-985.
Oney, F., Veziroglu, T.N., Dulger, Z. 1994. “Evaluation of Pipeline Transportation of Hydrogen andNatural Gas Mixtures,” International Journal of Hydrogen Energy, Vol. 19, No. 10, pp. 813-822.
Plug Power, 1999. “Flint Energies Partners with GE Fuel Cell Systems to Market Fuel Cells in Georgia”,press release June 23, http://www.plugpower.com/press.html.
Sandrock, G. 1997. “State-of-the-Art Review of Hydrogen Storage in Reversible Metal Hydrides forMilitary Fuel Cell Applications,” Final Report, prepared for Department of the Navy, Office of NavalResearch, Contract N00014-97-M-0001, July.

48
Schwarz, J., Amankwah, K.. 1993. “Hydrogen Storage Systems,” The Future of Energy Gases, U.S.Geological Survey Professional Paper 1570. United States Government Printing Offices, WashingtonD.C.
Simader, G., Kordesch, K. 1994. “Technological, ecological and economic differences betweenphosphoric acid fuel cell plants (PAFC) and conventional gas-engine power plants,” 1994 Fuel CellSeminar, Program and Abstracts, pp. 613-618.
Spath, P., Mann, M. 1998. “Technoeconomic Assessment of Four Biomass-to-Hydrogen ConversionTechnologies,” XII World Hydrogen Energy Conference, June 21-26, Buenos Aires.
Sugishita, H., Mori, H. 1998. “A Study of Advanced Hydrogen/Oxygen Combustion Turbines,”Hydrogen Power: Theoretical and Engineering Solutions, ed. T.O. Saetre, 1998 Kluwer AcademicPublishers, the Netherlands, pp. 511-516.
Taylor, J., Alderson, J., Kalyanam, K., Lyle, A., Phillips, L. 1986. “Technical and Economic Assessmentof Methods for the Storage of Large Quantities of Hydrogen,” International Journal of Hydrogen Energy,Vol. 11, No. 1.
Thomas, C.E., Kuhn, Jr., I.F. 1995a. “Electrolytic Production and Dispensing of Hydrogen,” inProceedings of the 1995 U.S. DOE Hydrogen Program Review, Vol. 1, NREL/CP-430-20036.
Thomas, C.E., Kuhn, Jr., I.F. 1995b. “Electrolytic Hydrogen Production Infrastructure OptionsEvaluation,” Final Subcontract Report, National Renewable Energy Laboratory, NREL/TP-463-7903.
Thomas, C., James, B. 1998. “Analysis of Utility Hydrogen Systems,” prepared for the NationalRenewable Energy Laboratory, Subcontract No. ACG-8-18012-01, May.
Thomas, C.E., James, B., Lomax, Jr., F., Kuhn, Jr., I. 1998. “Integrated Analysis of Hydrogen PassengerVehicle Transportation Pathways,” Draft Final Report, National Renewable Energy Laboratory,Subcontract AXE-6-16685-01, March.
True, W. 1996. “U.S. Pipelines continue gains into 1996,” Oil and Gas Journal, November 25, pp. 39-58.
Van Blarigan, P., Keller, K.O. 1998. “A Hydrogen Fuelled Internal Combustion Engine Designed forSingle Speed/Power Operation,” International Journal of Hydrogen Energy, Vol. 23, No. 7, pp. 603-609.
Veziroglu, T., Barbir, F. 1998. “Hydrogen Energy Technologies,” Emerging Technology Series, preparedfor the United Nations Industrial Development Organization, Vienna, 1998.
Vosen, S.R. 1997. “A Design Tool for the Optimization of Stand-alone Electric Power Systems withCombined Hydrogen-Battery Energy Storage,” Sandia National Laboratories, SAND97-8601, June.
Wurster, R. 1998. “PEM Fuel Cells in Stationary and Mobile Applications,” HyWeb.

49
Appendix A
Economic Basis and Methodology
.
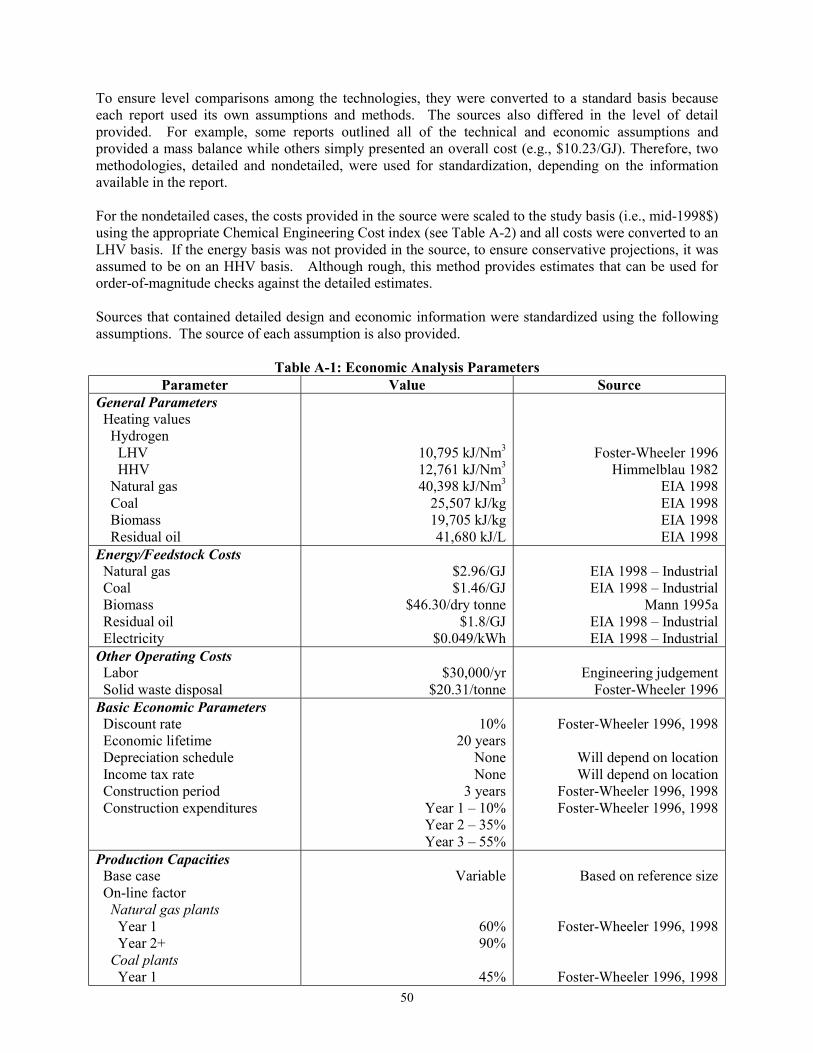
50
To ensure level comparisons among the technologies, they were converted to a standard basis becauseeach report used its own assumptions and methods. The sources also differed in the level of detailprovided. For example, some reports outlined all of the technical and economic assumptions andprovided a mass balance while others simply presented an overall cost (e.g., $10.23/GJ). Therefore, twomethodologies, detailed and nondetailed, were used for standardization, depending on the informationavailable in the report.
For the nondetailed cases, the costs provided in the source were scaled to the study basis (i.e., mid-1998$)using the appropriate Chemical Engineering Cost index (see Table A-2) and all costs were converted to anLHV basis. If the energy basis was not provided in the source, to ensure conservative projections, it wasassumed to be on an HHV basis. Although rough, this method provides estimates that can be used fororder-of-magnitude checks against the detailed estimates.
Sources that contained detailed design and economic information were standardized using the followingassumptions. The source of each assumption is also provided.
Table A-1: Economic Analysis ParametersParameter Value Source
General Parameters Heating values Hydrogen LHV HHV Natural gas Coal Biomass Residual oil
10,795 kJ/Nm3
12,761 kJ/Nm3
40,398 kJ/Nm3
25,507 kJ/kg19,705 kJ/kg41,680 kJ/L
Foster-Wheeler 1996Himmelblau 1982
EIA 1998EIA 1998EIA 1998EIA 1998
Energy/Feedstock Costs Natural gas Coal Biomass Residual oil Electricity
$2.96/GJ$1.46/GJ
$46.30/dry tonne$1.8/GJ
$0.049/kWh
EIA 1998 – IndustrialEIA 1998 – Industrial
Mann 1995aEIA 1998 – IndustrialEIA 1998 – Industrial
Other Operating Costs Labor Solid waste disposal
$30,000/yr$20.31/tonne
Engineering judgementFoster-Wheeler 1996
Basic Economic Parameters Discount rate Economic lifetime Depreciation schedule Income tax rate Construction period Construction expenditures
10%20 years
NoneNone
3 yearsYear 1 – 10%Year 2 – 35%Year 3 – 55%
Foster-Wheeler 1996, 1998
Will depend on locationWill depend on location
Foster-Wheeler 1996, 1998Foster-Wheeler 1996, 1998
Production Capacities Base case On-line factor Natural gas plants Year 1 Year 2+ Coal plants Year 1
Variable
60%90%
45%
Based on reference size
Foster-Wheeler 1996, 1998
Foster-Wheeler 1996, 1998

51
Parameter Value Source Year 2 Year 3 Year 4+Biomass1
Year 1 Year 2+Electrolysis Year 1 Year 2+Storage Year 1 Year 2+Transport Year 1+Refueling Fleet and larger (Year 1+) Home (Year 1+)
73.3%83.3%
85%
45%90%
60%90%
61%98.6%
98.6%
76%52%
Mann 1995a
Foster-Wheeler 1996, 1998
Engineering judgement
Engineering judgement
Berry 1996Berry 1996
Storage Parameters Storage period 1 day and 30 days Engineering judgement1 To be consistent with other analyses, the initial year of 50% production was scaled to be 50% of maximum annual production,90% or 45%. This differs from Mann (1995a)
Only the capital and major operating costs for each technology were standardized. Unit operating costs(e.g., fuel price) were modified to match the standard value and capital costs were scaled to mid-1998U.S. dollars using the Chemical Engineering C&E index of 387. If a source did not provide the dollar-year of the estimate, then it was assumed the same as the publication year. For miscellaneous operatingcosts, the unit basis was not changed, but the costs were converted to the standard dollar-basis.
Table A-2 presents the annual C&E indices used for this analysis (Chemical Engineering 1983, 1990,1998). The annual cost index was assumed to represent the entire year. Thus, even if the publicationlisted mid-1995 as the dollar-year, the annual index was used rather than the index for June 1995. This isnot expected to introduce significant error because the annual fluctuations of the index should not belarge.

52
Table A-2: Annual Cost Index
Year C&E Index1982 314.0
1983 316.9
1984 322.7
1985 325.3
1986 318.4
1987 323.8
1988 342.5
1989 355.4
1990 357.6
1991 361.3
1992 358.2
1993 359.2
1994 368.1
1995 381.1
1996 381.7
1997 386.5
Mid-1998 387
The original methodology used to develop the costs in the source document was not changed. Forexample, if Source 1 estimated the O&M charges of a steam methane reforming plant to be 3% of thefixed capital investment and Source 2 itemized these costs, the method for each technology remainedunchanged. Of course, the costs projected by each method in the new study would be different than in theoriginal because the base costs (e.g., fixed capital investment or labor) are likely different.
Another important area in which differing cost methodologies were apparent was in the projection of thefixed capital investment (FCI) and the working capital. Some sources used a factored method for the FCI;others itemized the costs. Even if a factored approach was used, the factors differed among as well aswithin technology classifications. These cost parameters were not standardized because the originalanalyst was presumably working with a methodology that was internally consistent. That is, the methodof estimating each component of the costs used the same assumptions, and so unless the entire plant wasto be re-estimated, the assumptions should remain the same.
The methods for calculating working capital were also highly variable. Some were calculated as apercentage of the FCI; others were based on sales or feedstock inventory. In several cases, no methodwas provided for calculating the working capital, and so the TCI was equivalent to the FCI. Even if theauthors did not project a working capital, the methodology was unchanged. This will not likely be asignificant source of error when comparing two technologies because, in general, working capital is not amajor determinant of the economic viability of a process.
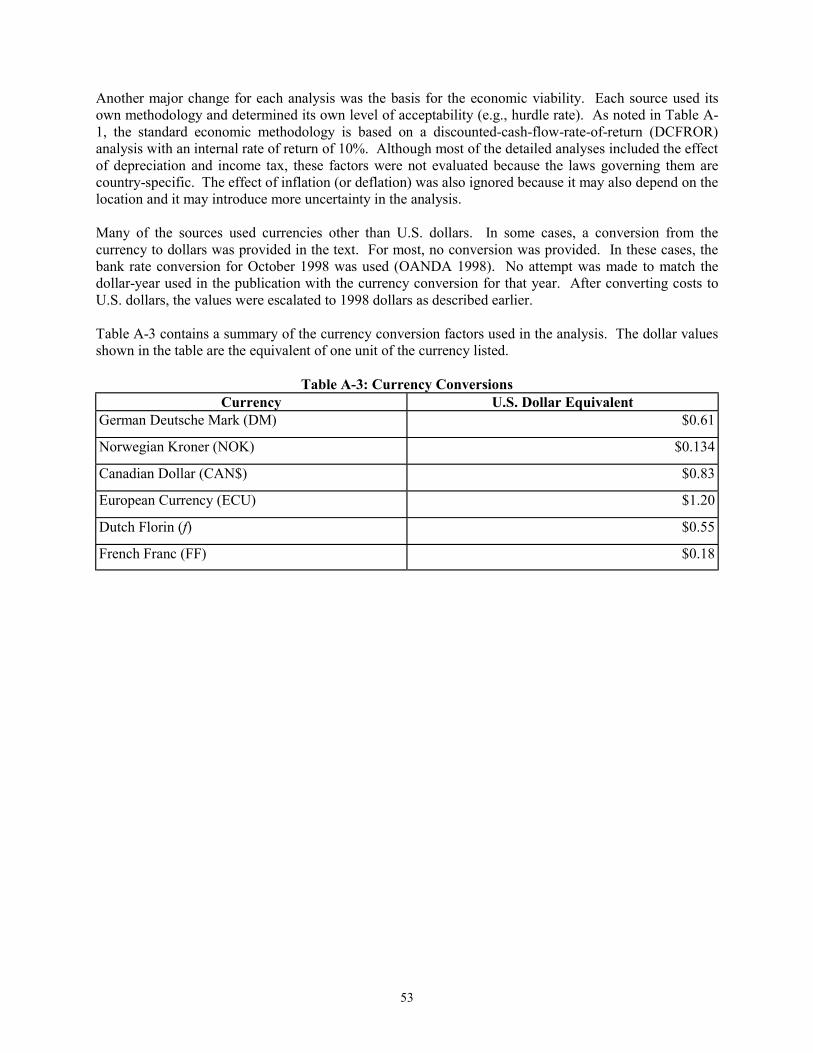
53
Another major change for each analysis was the basis for the economic viability. Each source used itsown methodology and determined its own level of acceptability (e.g., hurdle rate). As noted in Table A-1, the standard economic methodology is based on a discounted-cash-flow-rate-of-return (DCFROR)analysis with an internal rate of return of 10%. Although most of the detailed analyses included the effectof depreciation and income tax, these factors were not evaluated because the laws governing them arecountry-specific. The effect of inflation (or deflation) was also ignored because it may also depend on thelocation and it may introduce more uncertainty in the analysis.
Many of the sources used currencies other than U.S. dollars. In some cases, a conversion from thecurrency to dollars was provided in the text. For most, no conversion was provided. In these cases, thebank rate conversion for October 1998 was used (OANDA 1998). No attempt was made to match thedollar-year used in the publication with the currency conversion for that year. After converting costs toU.S. dollars, the values were escalated to 1998 dollars as described earlier.
Table A-3 contains a summary of the currency conversion factors used in the analysis. The dollar valuesshown in the table are the equivalent of one unit of the currency listed.
Table A-3: Currency ConversionsCurrency U.S. Dollar Equivalent
German Deutsche Mark (DM) $0.61
Norwegian Kroner (NOK) $0.134
Canadian Dollar (CAN$) $0.83
European Currency (ECU) $1.20
Dutch Florin (f) $0.55
French Franc (FF) $0.18

REPORT DOCUMENTATION PAGEForm Approved
OMB NO. 0704-0188
Public reporting burden for this collection of information is estimated to average 1 hour per response, including the time for reviewing instructions, searching existing data sources,gathering and maintaining the data needed, and completing and reviewing the collection of information. Send comments regarding this burden estimate or any other aspect of thiscollection of information, including suggestions for reducing this burden, to Washington Headquarters Services, Directorate for Information Operations and Reports, 1215 JeffersonDavis Highway, Suite 1204, Arlington, VA 22202-4302, and to the Office of Management and Budget, Paperwork Reduction Project (0704-0188), Washington, DC 20503.
1. AGENCY USE ONLY (Leave blank) 2. REPORT DATE
September 1999
3. REPORT TYPE AND DATES COVERED
Technical Report
4. TITLE AND SUBTITLE
Survey of the Economics of Hydrogen Technologies
5. FUNDING NUMBERS HY921013
6. AUTHOR(S)
C.E.G. Padro and V. Putsche
7. PERFORMING ORGANIZATION NAME(S) AND ADDRESS(ES)
National Renewable Energy Laboratory1617 Cole BoulevardGolden, CO 80401-3393
8. PERFORMING ORGANIZATION REPORT NUMBER
9. SPONSORING/MONITORING AGENCY NAME(S) AND ADDRESS(ES)
National Renewable Energy Laboratory1617 Cole BoulevardGolden, CO 80401-3393
10. SPONSORING/MONITORING AGENCY REPORT NUMBER
NREL/TP-570-27079
11. SUPPLEMENTARY NOTES
12a. DISTRIBUTION/AVAILABILITY STATEMENT
National Technical Information ServiceU.S. Department of Commerce5285 Port Royal RoadSpringfield, VA 22161
12b. DISTRIBUTION CODE
13. ABSTRACT (Maximum 200 words) A survey of the economics of hydrogen production, storage, transport, and end-use technologies has been completed. More than100 publications concerning the economics of current and near-term hydrogen technologies were surveyed. Technologies more than 20 years from commercializationwere not considered.
14. SUBJECT TERMS
hydrogen, economics, total capital investment
15. NUMBER OF PAGES
16. PRICE CODE
17. SECURITY CLASSIFICATION OF REPORT
18. SECURITY CLASSIFICATION OF THIS PAGE
19. SECURITY CLASSIFICATION OF ABSTRACT
20. LIMITATION OF ABSTRACT
NSN 7540-01-280-5500 Standard Form 298 (Rev. 2-89) Prescribed by ANSI Std. Z39-18
298-102