survey of the labor market - cber.uark.edu · this year, the survey questionnaire was sent to 393...
TRANSCRIPT

SURVEY OF THE LABOR MARKET FOR NEW PH.D. HIRES IN ECONOMICS
2017-2018
SURVEY OF THE LABOR MARKET FOR NEW PH.D. HIRES IN ECONOMICS
2017-18
SUMMARY OF RESULTS
Mervin Jebaraj Assistant Director
Center for Business and Economic Research
Katherine A. Deck Director
Center for Business and Economic Research
William P. Curington Chair, Department of Economics
Sam M. Walton College of Business University of Arkansas Fayetteville, Arkansas
January 7, 2017
Questions and comments are welcome and may be addressed to: Katherine A. Deck Mervin Jebaraj Center for Business and Economic Research
CBER-WCOB-WJWH 549 1 University of Arkansas Fayetteville, Arkansas 72701-1201 (479) 575-4151 Phone
Detailed Results Available at: http://cber.uark.edu

Center for Business and Economic Research—page 3
SURVEY OF THE LABOR MARKET FOR NEW PH.D. HIRES IN ECONOMICS
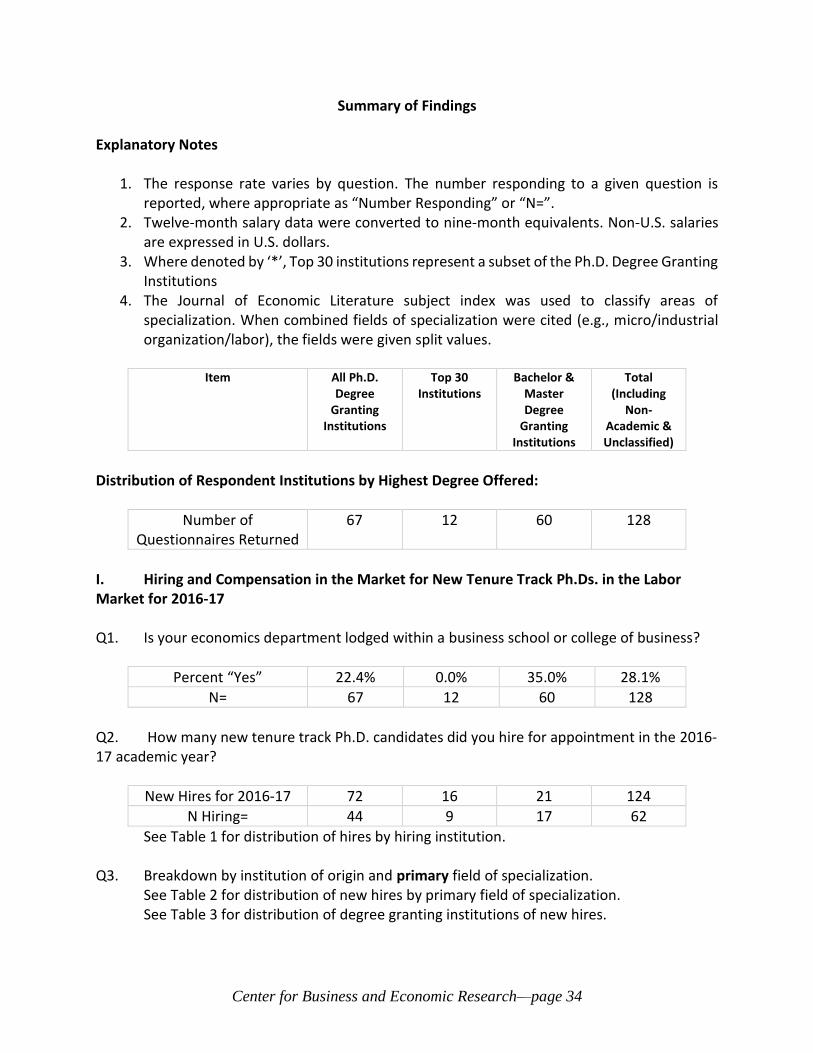
2017-18 This year, the survey questionnaire was sent to 393 organizations. Questionnaires were returned by 128 organizations (33.7 percent). Of this year’s responses, 85 (66.4 percent) were from those who responded to the last survey conducted for the 2016-17 academic year; 43 (33.6 percent) came from new respondents. Among the academic institutions responding, the distribution of highest degrees offered was as follows: Ph.D.—52.3 percent; Master—12.5 percent and Bachelor—34.4 percent. The responses are reported for all respondents, and separately for Ph.D. degree granting institutions and for schools whose highest degree offered is the Bachelor or Master degree. Data for the top 30 institutions in the revised National Research Council’s Research Doctorate Report, 2011, are reported as a subset of Ph.D. degree granting schools. They are referred to as the Top 30. I. Outcomes of the Labor Market for New Ph.D.s in 2016-17 Sixty-three departments reported 427 new Ph.D.s who sought employment for the 2016-17 academic year. Of these job seekers, 401 (93.9 percent) were successful. Within the reported supply, 149 (34.9 percent) were from the 10 Top 30 departments responding to the question. Among the successful job seekers, 58.6 percent found employment in academic institutions as compared to 60.9 percent in the 2015-16 year. Of the 128 responding institutions, 62 reported hiring a total of 124 new tenure track Ph.D.s for the 2016-17 academic year. Table 1 shows the number hired by each of the 62 institutions hiring tenure track Ph.Ds. As seen in Table 2, 25.8 percent of the new tenure track hires in 2016-17 had specialties in macro/monetary economics, followed by financial economics (14.5 percent), microeconomics (11.3 percent), and labor and demographic economics (8.9 percent). Table 3 shows the degree granting institutions of the new tenure track Ph.D.s hired for 2016-17. 35 institutions reported hiring a total of 59 new non-tenure track Ph.D.s for the 2016-17 academic year. Table 4 shows the number hired by each of the 35 institutions hiring non-tenure track Ph.Ds. As seen in Table 5, 8.9 percent of the new non-tenure track hires in 2016-17 had specialties in macro/monetary economics, followed by 7.3 percent in microeconomics, and 6.5 percent in general economics. Table 6 shows the degree granting institutions of the new non-tenure track Ph.D.s hired for 2016-17.
Center for Business and Economic Research—page 4
Table 1 New Tenure Track Ph.D.s Hired for 2016-17 by Hiring Institution
Board of Governors of the Federal Reserve System 31 Emory University 1
Harvard University 4 Florida State University 1
University of Notre Dame 4 Georgia College and State University 1
University of Chicago 3 Hope College 1
University of Colorado-Boulder 3 Illinois State University 1
University of South Carolina 3 Kansas State University 1
University of Toronto 3 Lewis & Clark College 1
University of Western Ontario 3 Louisiana State University 1
Unversity of Miami 3 Northeastern University 1
American University 2 Rensselaer Polytechnic Institute 1
Georgia State University 2 Saint Mary's College of California 1
Lehigh University 2 State University of New York-Fredonia 1
McMaster University 2 Texas A&M University 1
Miami University 2 Trinity University 1
Mount Holyoke College 2 University of Arkansas 1
Pennsylvania State University 2 University of California-Irvine 1
Saint Vincent College 2 University of California-Santa Barbara 1
Syracuse University 2 University of Houston 1
University of British Columbia 2 University of Iowa 1
University of Virginia 2 University of Kentucky 1
University of Wisconsin-Oshkosh 2 University of Maryland 1
Virginia Tech 2 University of Massachusetts-Amherst 1
Wabash College 2 University of Nebraska-Lincoln 1
Baylor University 1 University of New Mexico 1
Binghamton University 1 University of Oklahoma 1
Brandeis University 1 University of Pittsburgh 1
Bucknell University 1 University of South Alabama 1
Cornell University 1 University of Tennessee-Knoxville 1
Duke University 1 University of Vermont 1
East Carolina University 1 Vanderbilt University 1
Eastern Washington University 1 Washington University-St. Louis 1
Total 124 *Number of institutions responding, 128; number of institutions hiring, 62; number of hires, 124.

Center for Business and Economic Research—page 5
Table 2 New Tenure Track Ph.D.s Hired for 2016-17
By Type of Hiring Institution and Field of Specialization
Field of Specialization
PhD Granting Institution
Top 30*
Bachelor & Master Degree Granting Institutions
Total
1. General Economics 0 0 2 2
2. Method and History of Thought 0 0 0 0
3. Math. & Quantitative Methods 4 0 2 6
4. Microeconomics 11 5 2 14
5. Macro/Monetary Economics 14 2 4 32
6. International Economics 5 2 0 5
7. Financial Economics 1 0 1 18
8. Public Economics 8 0 2 10
9. Health, Education, & Welfare Economics 3 0 1 4
10. Labor & Demographic Economics 10 0 1 11
11. Law & Economics 0 0 0 0
12. Industrial Organization 4 2 0 4
13. Business Administration 0 0 0 0
14. Economic History 1 0 0 1
15. Economic Development 5 2 3 8
16. Economic Systems 0 0 0 0
17. Agricultural & Natural Resource 3 1 1 4
18. Urban, Rural, & Regional Economics 0 0 1 1
19. Other Special Topics 2 2 0 2
Total 71 16 20 122
*The Top 30 represent a subset of the Ph.D. Degree Granting Institutions.
Center for Business and Economic Research—page 6
Table 3 Degree Granting Institutions of New Tenure Track Ph.D.s Hired for 2016-17
University of Michigan 6 Georgia Institute of Technology 1
New York University 5 Kenyon College 1
University of Pennsylvania 5 Louisiana State University 1
Columbia University 4 Mississippi State University 1
London School of Economics 3 Northwestern University 1
Princeton University 3 Pennsylvania State University 1
University of Chicago 3 Purdue University 1
University of Maryland 3 Queen's University 1
University of Minnesota 3 State University of New York-Buffalo 1
University of Texas-Austin 3 Texas A&M University 1
Yale University 3 Tulane University 1
Boston College 2 University of Arkansas 1
Brown University 2 University of Bonn 1
Carnegie Mellon University 2 University of British Columbia 1
Cornell University 2 University of California-Riverside 1
Duke University 2 University of California-San Diego 1
Harvard University 2 University of Florida 1
Massachusetts Institute of Technology 2 University of Iowa 1
Stanford University 2 University of Kansas 1
University of California-Berkeley 2 University of Lausanne 1
University of California-Los Angeles 2 University of North Carolina-Chapel Hill 1
University of California-Santa Cruz 2 University of Notre Dame 1
University of Toronto 2 University of Oregon 1
University of Virginia 2 University of Siena-Italy 1
Boston University 1 University of Texas-Dallas 1
California Institute of Technology 1 University of Warwick 1
Cambridge University 1 University of Wisconsin 1
Charles III University of Madrid, 1 University of Wisconsin-Madison 1
European University Institute 1 University of Wyoming 1
George Mason University 1 Vanderbilt University 1
George Washington University 1 Warsaw School of Economics 1

Center for Business and Economic Research—page 7
Table 4 New Non-Tenure Track Ph.D.s Hired for 2016-17 by Hiring Institution
University of Pittsburgh 4 Brandeis University 1
University of Toronto 4 Eastern Washington University 1
Hamilton College 3 Furman University 1
Mount Holyoke College 3 Ithaca College 1
Tulane University 3 Louisiana State University 1
Appalachian State University 2 McMaster University 1
Boston University 2 Michigan State University 1
Colby College 2 Northeastern University 1
Howard University 2 Pitzer College 1
Loyola Marymount University 2 University of Akron 1
Pacific Lutheran University 2 University of British Columbia 1
Purdue University-Northwest 2 University of Delaware 1
University of South Carolina 2 University of Kentucky 1
University of Virginia 2 University of Massachusetts-Boston 1
Vanderbilt University 2 University of Memphis 1
Wabash College 2 University of Nebraska-Lincoln 1
Weber State University 2 Wellesley College 1
Binghamton University 1 Total 59 *Number of institutions responding, 126; number of institutions hiring, 35; number of hires, 59.

Center for Business and Economic Research—page 8
Table 5 New Non-Tenure Track Ph.D.s Hired for 2016-17
By Type of Hiring Institution and Field of Specialization
Field of Specialization
PhD Granting Institution
Top 30*
Bachelor & Master Degree Granting Institutions
Total
1. General Economics 5 1 3 8
2. Method and History of Thought 0 0 0 0
3. Math. & Quantitative Methods 0 0 2 2
4. Microeconomics 6 1 3 9
5. Macro/Monetary Economics 5 2 6 11
6. International Economics 2 0 0 2
7. Financial Economics 0 0 0 0
8. Public Economics 2 1 0 2
9. Health, Education, & Welfare Economics 0 0 2 2
10. Labor & Demographic Economics 2 0 0 2
11. Law & Economics 0 0 0 0
12. Industrial Organization 0 0 0 0
13. Business Administration 0 0 0 0
14. Economic History 1 0 0 1
15. Economic Development 1 0 0 1
16. Economic Systems 0 0 0 0
17. Agricultural & Natural Resource 3 1 1 4
18. Urban, Rural, & Regional Economics 0 0 1 1
19. Other Special Topics 4 0 1 5
Total 31 6 19 50
*The Top 30 represent a subset of the Ph.D. Degree Granting Institutions.

Center for Business and Economic Research—page 9
Table 6 Degree Granting Institutions of New Non-Tenure Track Ph.D.s Hired for 2016-17
University of Illinois-Chicago 3 Queen's University 1
Georgia State University 2 Southern Illinois University-Carbondale 1
University of Tennessee-Knoxville 2 State University of New York-Buffalo 1
Washington State University 2 Syracuse University 1
American University 1 University of California-Los Angeles 1
Auburn University 1 University of Delaware 1
Brown University 1 University of Helsinki 1
City University of New York-Queens 1 University of Kansas 1
Claremont Graduate University 1 University of Massachusetts-Amherst 1
Howard University 1 University of Minnesota 1
Jackson State University 1 University of Nebraska 1
Kenyon College 1 University of Wisconsin-Madison 1
Louisiana State University 1 University of Wisconsin-Milwaukee 1
McGill University 1 Western University 1
Ohio State University 1 Yale University 1
Pennsylvania State University 1
Center for Business and Economic Research—page 10
2016-17 Salary Offers for New Tenure Track Ph.Ds.—Expected vs. Actual. Respondents to the survey conducted in the fall of 2015 reported a mean expected salary offer of $111,460 for academic year 2016-17. Respondents to the current survey report a mean actual salary for the 2016-17 academic year of $118,082 or 5.9 percent higher than what was expected. As seen in Panel A of Table 7, the difference between actual and expected salary offers ranged from an over-estimation of 5.9 percent for all respondents to an overestimation of 2.1 percent for Bachelor and Master degree granting schools. These differences may, to some degree, be a result of compositional differences between the two samples. See Figure 1 for salary distributions. Panel B of Table 7 shows the mean expected offer for 2016-17, as reported in the survey conducted in the fall of 2015, and the actual offer, as reported in the current survey, for the 85 institutions that responded to both surveys. Top 30 institutions made actual offers 6.6 percent above what was expected. For all 85 respondents, the average actual offer was 6.4 percent above the average expected offer. See Figure 2 for salary distributions. 2016-17 Salary Offers for New Non-Tenure Track Ph.Ds.—Expected vs. Actual. Respondents to the survey conducted in the fall of 2015 reported a mean expected salary offer of $70,000 for academic year 2016-17. Respondents to the current survey report a mean actual salary for the 2016-17 academic year of $70,587 or 0.8 percent higher than what was expected. As seen in Panel A of Table 8, the difference between actual and expected salary offers ranged from an over-estimation of 2.4 percent for Ph.D. granting institutions to an underestimation of 4.2 percent for Bachelor and Master degree granting schools. These differences may, to some degree, be a result of compositional differences between the two samples. See Figure 3 for salary distributions. Panel B of Table 8 shows the mean expected offer for 2016-17, as reported in the survey conducted in the fall of 2015, and the actual offer, as reported in the current survey, for the 85 institutions that responded to both surveys. Top 30 institutions made actual offers 8.7 percent above what was expected while Bachelor and Master degree granting schools made offers 1.7 percent under what was expected. For all 85 respondents, the average actual offer was 0.6 percent under the average expected offer. See Figure 4 for salary distributions. II. Demand and Supply of New Ph.Ds. for 2017-18 125 of the institutions responding to the current survey are expecting to hire 128 new tenure track Ph.Ds. for the 2017-18 academic year. Meanwhile, 123 of the institutions responding to the current survey are expecting to hire 41 new non-tenure track Ph.Ds. for the 2017-18 academic year. The greatest demand is for the field of macro/monetary economics at 19.1 percent, followed by general economics at 15.9 percent, and financial economics at 8.9 percent. See Tables 9, 10, and 11. The most common reason reported by the other institutions for not hiring for the 2017-18 academic year was lack of a vacancy (63.9 percent).

Center for Business and Economic Research—page 11
Sixty seven of the Ph.D. degree granting institutions responding to the survey report that they will have a total of 380 new Ph.Ds. seeking employment for the 2017-18 academic year. About 3.9 percent of the job seekers are holdovers from the 2016-17 market. Top 30 schools account for 30.8 percent of the total reported supply. Table 12 shows the supply of new Ph.Ds. by field of specialization and type of Ph.D. degree granting institution. Job seekers with specialties in macro/monetary economics (21.1 percent) constitute the greatest share of the supply followed by labor and demographic economics (10.0 percent) and health, education, and welfare economics (8.4 percent).
Center for Business and Economic Research—page 12
Table 7 Expected and Actual Offers for New Tenure Track Ph.Ds. the 2016-17 Academic Year
All Ph.D. Degree Granting Institutions
N Top 30* N Bachelor & Master Degree Granting Institutions
N All Respondents
N
Panel A: Complete results of Fall 2016 survey compared with complete results of Fall 2015 survey. (Expected Hires=163; Actual Hires=124)
Mean Actual Offer (2016 Survey)
$128,125 41 $151,000 9 $88,800 14 $118,082 56
Mean Expected Offer (2015 Survey)
$124,620 48 $147,800 11 $86,981 26 $111,460 75
Actual Less Expected
$3,505 $3,200 $1,819 $6,622
Percent Difference
2.8% 2.2% 2.1% 5.9%
Panel B: 85 Respondents to the Fall 2016 survey who also responded to the Fall 2015 survey. (Expected Hires=104; Actual Hires=93)
Mean Actual Offer (2016 Survey)
$129,204 29 $154,250 8 $87,655 11 $117,740 41
Mean Expected Offer (2015 Survey)
$122,525 30 $144,750 8 $82,962 13 $110,693 44
Actual Less Expected
$6,679 $9,500 $4,693 $7,047
Percent Difference
5.5% 6.6% 5.6% 6.4%
*The Top 30 represent a subset of the Ph.D. Degree Granting Institutions.
Center for Business and Economic Research—page 13
Table 8 Expected and Actual Offers for New Non-Tenure Track Ph.Ds. the 2016-17 Academic Year
All Ph.D. Degree Granting Institutions
N Top 30* N Bachelor & Master Degree Granting Institutions
N All Respondents
N
Panel A: Complete results of Fall 2016 survey compared with complete results of Fall 2015 survey. (Expected Hires=47; Actual Hires=59)
Mean Actual Offer (2016 Survey)
$75,118 17 $72,500 2 $62,885 10 $70,587 27
Mean Expected Offer (2015 Survey)
$73,353 17 $73,750 4 $65,615 13 $70,000 30
Actual Less Expected
$1,765 ($1,250) ($2,730) $587
Percent Difference
2.4% (1.7%) (4.2%) 0.8%
Panel B: 85 Respondents to the Fall 2016 survey who also responded to the Fall 2015 survey. (Expected Hires=31; Actual Hires=46)
Mean Actual Offer (2016 Survey)
$74,167 12 $72,500 2 $63,206 9 $69,469 21
Mean Expected Offer (2015 Survey)
$72,643 14 $66,667 3 $64,286 7 $69,857 21
Actual Less Expected
$1,524 $5,833 ($1,080) ($388)
Percent Difference
2.1% 8.7% (1.7%) (0.6%)
*The Top 30 represent a subset of the Ph.D. Degree Granting Institutions.

Center for Business and Economic Research—page 14
Center for Business and Economic Research—page 15
Center for Business and Economic Research—page 16

Center for Business and Economic Research—page 17

Center for Business and Economic Research—page 18
Table 9 Supply of and Demand for New Ph.D.s by Respondents
for the 2017-18 Academic Year
Field of Specialization Tenure-Track
Demand for 2017-2018
Non-Tenure Track
Demand for 2017-2018
Percent of Demand
Supply for 2017-2018
Percent of Supply
1. General Economics 10 16.8 15.9% 10 2.6%
2. Method and History of Thought 0 0 0.0% 3 0.8%
3. Math. & Quantitative Methods 12 3.3 9.1% 25 6.6%
4. Microeconomics 11.5 3.3 8.8% 25 6.6%
5. Macro/Monetary Economics 27 5.3 19.1% 80 21.1%
6. International Economics 8 2.2 6.0% 19 5.0%
7. Financial Economics 14 1 8.9% 16 4.2%
8. Public Economics 6.5 1 4.4% 29 7.6%
9. Health, Education, & Welfare Economics 6.5 0 3.8% 32 8.4%
10. Labor & Demographic Economics 9.5 2 6.8% 38 10.0%
11. Law & Economics 0 0 0.0% 9 2.4%
12. Industrial Organization 2.5 0 1.5% 23 6.1%
13. Business Administration 0 0 0.0% 1 0.3%
14. Economic History 2 0 1.2% 3 0.8%
15. Economic Development 4 0 2.4% 25 6.6%
16. Economic Systems 0 0 0.0% 2 0.5%
17. Agricultural & Natural Resource 4 1 3.0% 14 3.7%
18. Urban, Rural, & Regional Economics 3 0 1.8% 8 2.1%
19. Other Special Topics 2.5 2 2.7% 18 4.7%
Not Reported 5 3 4.8%
Total 128 41 100.0% 380 100.0%

Center for Business and Economic Research—page 19
Table 10 Expected Tenure Track Hires for 2017-18 by Type of Institution and Field of Specialization
Ph.D. Degree Granting Institutions
Top 30* Bachelor & Master Degree Granting Institutions
All Institutions
1. General Economics 6 1 4 10
2. Method & History of Thought 0 0 0 0
3. Math. & Quantitative Methods 11 3 1 12
4. Microeconomics 6 1 3.5 11.5
5. Macro/Monetary Economics 11 2 4 27
6. International 7 2 1 8
7. Financial Economics 2 0 1 14
8. Public Economics 4.5 1 2 6.5
9. Health, Education, & Welfare Economics 3.5 0 3 6.5
10. Labor & Demographic Economics 8.5 2 0 9.5
11. Law & Economics 0 0 0 0
12. Industrial Organization 1.5 0 1 2.5
13. Business Administration 0 0 0 0
14. Economic History 2 1 0 2
15. Economic Development 4 0 0 4
16. Economic Systems 0 0 0 0
17. Agricultural & Natural Resource Economics 2 1 2 4
18. Urban, Rural, & Regional Economics 1 0 2 3
19. Other Special Topics 1 1 1.5 2.5
Not Reported 3 3 2 5
Total 74 23 28 128
*The Top 30 represent a subset of the Ph.D. Degree Granting Institutions.

Center for Business and Economic Research—page 20
Table 11 Expected Non-Tenure Track Hires for 2016-17 by Type of Institution and Field of Specialization
Ph.D. Degree Granting Institutions
Top 30* Bachelor & Master Degree Granting Institutions
Total
1. General Economics 11 2 5.8 16.8
2. Method & History of Thought 0 0 0 0
3. Math. & Quantitative Methods 3.3 1 0 3.3
4. Microeconomics 2.3 1 1 3.3
5. Macro/Monetary Economics 2.3 0 3 5.3
6. International 2 1 0.2 2.2
7. Financial Economics 1 1 0 1
8. Public Economics 0 0 1 1
9. Health, Education, & Welfare Economics 0 0 0 0
10. Labor & Demographic Economics 2 1 0 2
11. Law & Economics 0 0 0 0
12. Industrial Organization 0 0 0 0
13. Business Administration 0 0 0 0
14. Economic History 0 0 0 0
15. Economic Development 0 0 0 0
16. Economic Systems 0 0 0 0
17. Agricultural & Natural Resource Economics 1 0 0 1
18. Urban, Rural, & Regional Economics 0 0 0 0
19. Other Special Topics 1 0 1 2
Not Reported 3 3 0 3
Total 29 10 12 41
*The Top 30 represent a subset of the Ph.D. Degree Granting Institutions.

Center for Business and Economic Research—page 21
Table 12 New Ph.D.s Seeking Employment for 2017-18
By Type of Degree Granting Institution and Field of Specialization1
Other Ph.D. Degree Granting Institutions
Top 30 All Institutions
Percent of Supply
1. General Economics 10 0 10 2.6%
2. Method & History of Thought 3 0 3 0.8%
3. Math. & Quantitative Methods 17 8 25 6.6%
4. Microeconomics 11 14 25 6.6%
5. Macro/Monetary Economics 50 30 80 21.1%
6. International 12 7 19 5.0%
7. Financial Economics 6 10 16 4.2%
8. Public Economics 25 4 29 7.6%
9. Health, Education, & Welfare Economics 26 6 32 8.4%
10. Labor & Demographic Economics 28 10 38 10.0%
11. Law & Economics 9 0 9 2.4%
12. Industrial Organization 15 8 23 6.1%
13. Business Administration 0 1 1 0.3%
14. Economic History 3 0 3 0.8%
15. Economic Development 20 5 25 6.6%
16. Economic Systems 2 0 2 0.5%
17. Agricultural & Natural Resource Economics 7 7 14 3.7%
18. Urban, Rural, & Regional Economics 5 3 8 2.1%
19. Other Special Topics 14 4 18 4.7%
Total 263 117 380 100%
1 Number of institutions responding 67; number of Top 30 institutions responding, 12.

Center for Business and Economic Research—page 22
III. Salary, Research, and Other Financial Support Expected Salary Offer for 2017-18. Responses from 61 institutions indicate that the average expected salary offer for new tenure track Ph.Ds. for the 2017-18 academic year is $111,244, a 5.8 percent decrease from the actual offer for the 2016-17 academic year for the sample of institutions. The average expected offer to new tenure track Ph.Ds. by Ph.D. degree granting institutions, $123,113, is 3.9 percent below the 2016-17 average offer. The Top 30 institutions in the sample report an average expected offer of $141,563 which is 6.3 percent lower than the average 2016-17 offer to new tenure track Ph.Ds. Bachelor and Master degree granting institutions report an expected offer of $85,368 which is 3.9 percent less than the 2016-17 average offer to new tenure track Ph.Ds. Responses from 27 institutions indicate that the average expected salary offer for new non tenure track Ph.Ds. for the 2017-18 academic year is $86,141, a 22.0 percent increase from the actual offer for the 2016-17 academic year for the sample of institutions. The average expected offer to new non-tenure track Ph.Ds. by Ph.D. degree granting institutions, $91,540, is 21.9 percent above the 2016-17 average offer. The Top 30 institutions in the sample report an average expected offer of $94,200, which is 29.9 percent higher than the average 2016-17 offer to new non-tenure track Ph.Ds. Bachelor and Master degree granting institutions report an expected offer of $70,714 which is 12.5 percent higher than the 2016-17 average offer to new non-tenure track Ph.Ds. For Ph.D. degree granting institutions, 95.1 percent of expected offers to new tenure track Ph.Ds. are above $80,000; while for institutions offering Bachelor and Master degrees, only 68.4 percent of expected offers to new tenure track Ph.Ds. exceed $80,000. On the other hand, for Ph.D. degree granting institutions hiring new non-tenure track Ph.Ds., 65.0 percent of expected offers are above $80,000; while for institutions offering Bachelor and Master degrees, none of the expected offers to new non-tenure track Ph.Ds. exceed $80,000. Figures 5 through 9 present salary data of actual offers in 2016-17 and expected offers in 2017-18 for Ph.D. degree granting institutions, Top 30 institutions, Bachelor and Master degree granting institutions, and all hiring institutions, respectively. 2016-17 Research Support in the Market for New Tenure Track Ph.Ds. For tenure track assistant professors hired for the 2016-17 academic year, summer support was available more often from Ph.D. degree granting institutions than from others (74.4 percent vs. 56.3 percent). The average summer support percentage of nine-month salary offers (17.4 percent vs. 8.6 percent) was also higher for Ph.D. degree granting institutions as was the average number of summers of support (2.8 summers vs. 1.7 summers). A startup package is offered by 97.6 percent of Ph.D. degree granting institutions, and is offered by 56.3 percent of other institutions. The average startup package at Ph.D. degree granting institutions was $34,908 and was $9,429 at other institutions. The average teaching load is lower in Ph.D. degree granting institutions compared to non-Ph.D. degree granting institutions (4 vs. 5 semester courses per year). New faculty members are more
Center for Business and Economic Research—page 23
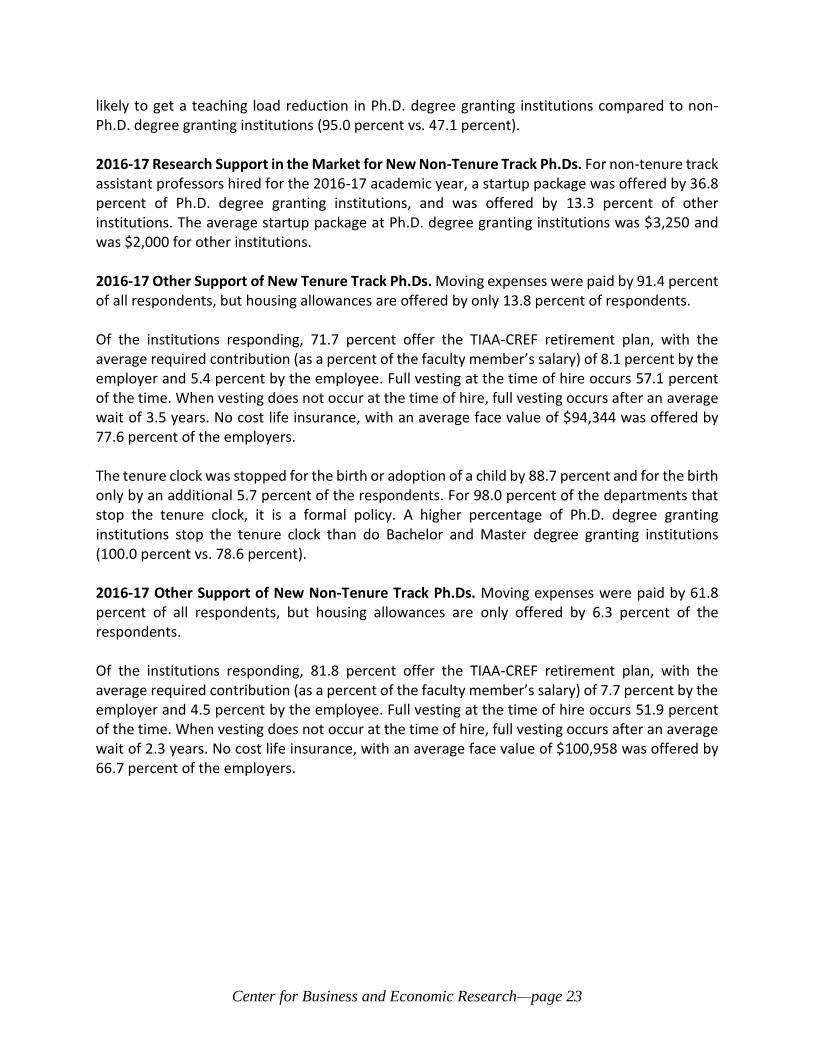
likely to get a teaching load reduction in Ph.D. degree granting institutions compared to non-Ph.D. degree granting institutions (95.0 percent vs. 47.1 percent). 2016-17 Research Support in the Market for New Non-Tenure Track Ph.Ds. For non-tenure track assistant professors hired for the 2016-17 academic year, a startup package was offered by 36.8 percent of Ph.D. degree granting institutions, and was offered by 13.3 percent of other institutions. The average startup package at Ph.D. degree granting institutions was $3,250 and was $2,000 for other institutions. 2016-17 Other Support of New Tenure Track Ph.Ds. Moving expenses were paid by 91.4 percent of all respondents, but housing allowances are offered by only 13.8 percent of respondents. Of the institutions responding, 71.7 percent offer the TIAA-CREF retirement plan, with the average required contribution (as a percent of the faculty member’s salary) of 8.1 percent by the employer and 5.4 percent by the employee. Full vesting at the time of hire occurs 57.1 percent of the time. When vesting does not occur at the time of hire, full vesting occurs after an average wait of 3.5 years. No cost life insurance, with an average face value of $94,344 was offered by 77.6 percent of the employers. The tenure clock was stopped for the birth or adoption of a child by 88.7 percent and for the birth only by an additional 5.7 percent of the respondents. For 98.0 percent of the departments that stop the tenure clock, it is a formal policy. A higher percentage of Ph.D. degree granting institutions stop the tenure clock than do Bachelor and Master degree granting institutions (100.0 percent vs. 78.6 percent).
2016-17 Other Support of New Non-Tenure Track Ph.Ds. Moving expenses were paid by 61.8 percent of all respondents, but housing allowances are only offered by 6.3 percent of the respondents. Of the institutions responding, 81.8 percent offer the TIAA-CREF retirement plan, with the average required contribution (as a percent of the faculty member’s salary) of 7.7 percent by the employer and 4.5 percent by the employee. Full vesting at the time of hire occurs 51.9 percent of the time. When vesting does not occur at the time of hire, full vesting occurs after an average wait of 2.3 years. No cost life insurance, with an average face value of $100,958 was offered by 66.7 percent of the employers.

Center for Business and Economic Research—page 24

Center for Business and Economic Research—page 25

Center for Business and Economic Research—page 26

Center for Business and Economic Research—page 27

Center for Business and Economic Research—page 28
Center for Business and Economic Research—page 29
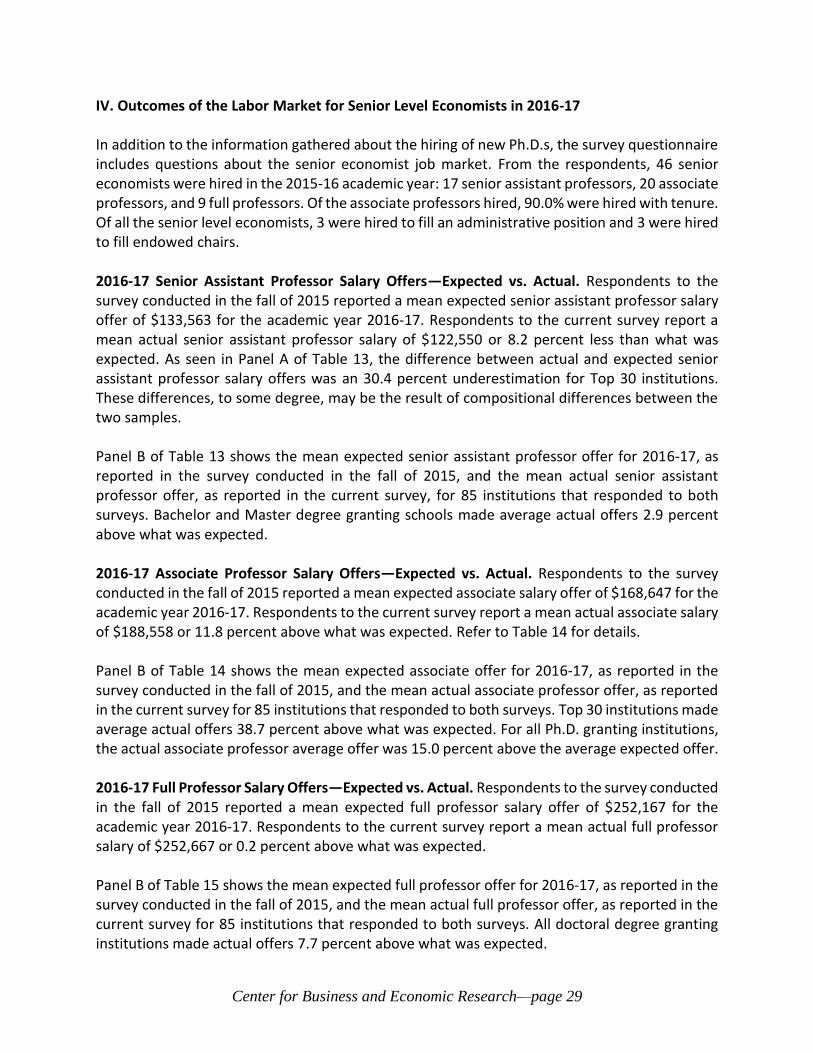
IV. Outcomes of the Labor Market for Senior Level Economists in 2016-17 In addition to the information gathered about the hiring of new Ph.D.s, the survey questionnaire includes questions about the senior economist job market. From the respondents, 46 senior economists were hired in the 2015-16 academic year: 17 senior assistant professors, 20 associate professors, and 9 full professors. Of the associate professors hired, 90.0% were hired with tenure. Of all the senior level economists, 3 were hired to fill an administrative position and 3 were hired to fill endowed chairs. 2016-17 Senior Assistant Professor Salary Offers—Expected vs. Actual. Respondents to the survey conducted in the fall of 2015 reported a mean expected senior assistant professor salary offer of $133,563 for the academic year 2016-17. Respondents to the current survey report a mean actual senior assistant professor salary of $122,550 or 8.2 percent less than what was expected. As seen in Panel A of Table 13, the difference between actual and expected senior assistant professor salary offers was an 30.4 percent underestimation for Top 30 institutions. These differences, to some degree, may be the result of compositional differences between the two samples. Panel B of Table 13 shows the mean expected senior assistant professor offer for 2016-17, as reported in the survey conducted in the fall of 2015, and the mean actual senior assistant professor offer, as reported in the current survey, for 85 institutions that responded to both surveys. Bachelor and Master degree granting schools made average actual offers 2.9 percent above what was expected. 2016-17 Associate Professor Salary Offers—Expected vs. Actual. Respondents to the survey conducted in the fall of 2015 reported a mean expected associate salary offer of $168,647 for the academic year 2016-17. Respondents to the current survey report a mean actual associate salary of $188,558 or 11.8 percent above what was expected. Refer to Table 14 for details. Panel B of Table 14 shows the mean expected associate offer for 2016-17, as reported in the survey conducted in the fall of 2015, and the mean actual associate professor offer, as reported in the current survey for 85 institutions that responded to both surveys. Top 30 institutions made average actual offers 38.7 percent above what was expected. For all Ph.D. granting institutions, the actual associate professor average offer was 15.0 percent above the average expected offer. 2016-17 Full Professor Salary Offers—Expected vs. Actual. Respondents to the survey conducted in the fall of 2015 reported a mean expected full professor salary offer of $252,167 for the academic year 2016-17. Respondents to the current survey report a mean actual full professor salary of $252,667 or 0.2 percent above what was expected. Panel B of Table 15 shows the mean expected full professor offer for 2016-17, as reported in the survey conducted in the fall of 2015, and the mean actual full professor offer, as reported in the current survey for 85 institutions that responded to both surveys. All doctoral degree granting institutions made actual offers 7.7 percent above what was expected.

Center for Business and Economic Research—page 30
V. Results of the Senior Economists Market for the 2016-17 Academic Year and the Expected Demand for the 2017-18 Academic Year The average salary paid for senior assistant professors in 2016-17 was $122,550, which was 3.8 percent higher than the mean salary paid to new assistant professors. For associate professors with and without tenure, the average salary offers were $188,588 and $180,000 respectively. Full professors were offered $252,667 on average. A total of 58 senior economists is expected to be hired by all institutions in the academic year 2017-18. Of this number, 44 are expected to be hired by Ph.D. degree granting institutions. Out of the expected hires, 9 are expected to fill endowed chairs, while 2 are being hired for administrative positions. The average expected salary in 2017-18 for senior assistant professors is $118,438; for associate professors, $162,086; and for full professors, $231,645. Ph.D. degree granting institutions are expecting to pay $167,500 for senior assistant professors, $168,926 for associate professors and $230,115 for full professors.

Center for Business and Economic Research—page 31
Table 13 Expected and Actual Offers for Senior Assistant Professors for the 2016-17 Academic Year
All Ph.D. Degree Granting Institutions
N Top 30* N Bachelor & Master Degree Granting Institutions
N All Respondents
N
Panel A: Complete results of Fall 2015 survey compared with complete results of Fall 2016 survey. (Expected Hires=20; Actual Hires=17)
Mean Actual Offer (2016 Survey)
$139,667 3 - 0 $70,000 1 $122,550 5
Mean Expected Offer (2015 Survey)
$151,400 10 168,000 3 $100,600 5 $133,563 16
Actual Less Expected
($11,733) - (30,600) ($11,013)
Percent Difference
(7.7%) - (30.4%) (8.2%)
Panel B: 85 respondents to the Fall 2016 survey who also responded to the Fall 2015 survey. (Expected Hires=11; Actual Hires=14)
Mean Actual Offer (2016 Survey)
- 0 - 0 70,000 1 $96,875 2
Mean Expected Offer (2015 Survey)
$140,571 7 168,000 3 $68,000 1 $130,222 9
Actual Less Expected
- - $2,000 ($33,347)
Percent Difference
- - 2.9% (25.6%)
*The Top 30 represent a subset of the Ph.D. Degree Granting Institutions.

Center for Business and Economic Research—page 32
Table 14 Expected and Actual Offers for Associate Professors for the 2016-17 Academic Year
All Ph.D. Degree Granting Institutions
N Top 30* N Bachelor & Master Degree Granting Institutions
N All Respondents
N
Panel A: Complete results of Fall 2016 survey compared with complete results of Fall 2015 survey. (Expected Hires=16; Actual Hires=18)
Mean Actual Offer (2016 Survey)
$195,438 12 $235,000 2 $106,000 1 $188,558 13
Mean Expected Offer (2015 Survey)
$173,467 15 $171,000 7 $132,500 2 $168,647 17
Actual Less Expected
$21,971 $64,000 (26,500) $19,911
Percent Difference
12.7% 37.4% (20.0%) 11.8%
Panel B: 85 respondents to the Fall 2016 survey who also responded to the Fall 2015 survey (Expected Hires=9; Actual Hires=14)
Mean Actual Offer (2016 Survey)
$198,525 10 $235,000 2 - 0 $198,525 10
Mean Expected Offer (2015 Survey)
$172,700 10 $169,400 5 - 0 $172,700 10
Actual Less Expected
$25,825 $65,600 - $25,825
Percent Difference
15.0% 38.7% - 15.0%
*The Top 30 represent a subset of the Ph.D. Degree Granting Institutions.

Center for Business and Economic Research—page 33
Table 15 Expected and Actual Offers for Full Professors for the 2016-17 Academic Year
All Ph.D. Degree Granting Institutions
N Top 30* N Bachelor & Master Degree Granting Institutions
N All Respondents
N
Panel A: Complete results of Fall 2016 survey compared with complete results of Fall 2015 survey. (Expected Hires=27; Actual Hires=9)
Mean Actual Offer (2016 Survey)
$273,000 8 $332,500 2 $90,000 1 $252,667 9
Mean Expected Offer (2015 Survey)
$258,688 16 $291,800 5 $200,000 2 $252,167 18
Actual Less Expected
$14,312 $40,700 ($110,000) $500
Percent Difference
5.5% 13.9% (55.0%) 0.2%
Panel B: 85 respondents to the Fall 2016 survey who also responded to the Fall 2015 survey (Expected Hires=15; Actual Hires=9)
Mean Actual Offer (2016 Survey)
$273,000 8 $332,500 2 $90,000 1 $252,667 9
Mean Expected Offer (2015 Survey)
$253,400 10 $319,667 3 - 0 $253,400 10
Actual Less Expected
$19,600 $12,833 - $19,600
Percent Difference
7.7% 4.0% - 7.7%
*The Top 30 represent a subset of the Ph.D. Degree Granting Institutions.
Center for Business and Economic Research—page 34
Summary of Findings Explanatory Notes
1. The response rate varies by question. The number responding to a given question is reported, where appropriate as “Number Responding” or “N=”.
2. Twelve-month salary data were converted to nine-month equivalents. Non-U.S. salaries are expressed in U.S. dollars.
3. Where denoted by ‘*’, Top 30 institutions represent a subset of the Ph.D. Degree Granting Institutions
4. The Journal of Economic Literature subject index was used to classify areas of specialization. When combined fields of specialization were cited (e.g., micro/industrial organization/labor), the fields were given split values.
Item All Ph.D.
Degree Granting
Institutions
Top 30 Institutions
Bachelor & Master Degree
Granting Institutions
Total (Including
Non-Academic & Unclassified)
Distribution of Respondent Institutions by Highest Degree Offered:
Number of Questionnaires Returned
67 12 60 128
I. Hiring and Compensation in the Market for New Tenure Track Ph.Ds. in the Labor Market for 2016-17 Q1. Is your economics department lodged within a business school or college of business?
Percent “Yes” 22.4% 0.0% 35.0% 28.1%
N= 67 12 60 128
Q2. How many new tenure track Ph.D. candidates did you hire for appointment in the 2016-17 academic year?
New Hires for 2016-17 72 16 21 124
N Hiring= 44 9 17 62
See Table 1 for distribution of hires by hiring institution. Q3. Breakdown by institution of origin and primary field of specialization.
See Table 2 for distribution of new hires by primary field of specialization. See Table 3 for distribution of degree granting institutions of new hires.

Center for Business and Economic Research—page 35
Item All Ph.D. Degree
Granting Institutions
Top 30*
Institutions
Bachelor & Master Degree
Granting Institutions
Total (Including
Non-Academic & Unclassified)
Q4. For a new tenure track Ph.D. with degree-in-hand, what DID you offer as a 9-month
salary for appointment in the 2016-17 academic year? If this varied across people, please give an average.
<$60,000 0 0 0 0
>$60,000 to $65,000 0 0 0 0
>$65,000 to $70,000 0 0 1 1
>$70,000 to $75,000 0 0 1 1
>$75,000 to $80,000 0 0 0 0
>$80,000 to $85,000 0 0 4 4
>$85,000 to $90,000 0 0 3 3
>$90,000 to $95,000 1 0 2 3
>$95,000 to $100,000 1 0 2 3
>$100,000 to $105,000 6 0 0 6
>$105,000 to $110,000 3 0 0 3
>$110,000 to $115,000 4 0 1 5
>$115,000 to $120,000 4 0 0 5
>$120,000 to $125,000 4 2 0 4
>$125,000 to $130,000 5 1 0 5
>$130,000 to $135,000 3 1 0 3
>$135,000 to $140,000 3 1 0 3
>$140,000 to $145,000 3 1 0 3
>$145,000 to $150,000 0 0 0 0
>$150,000 to $155,000 0 0 0 0
>$155,000 to $160,000 0 0 0 0
>$160,000 to $165,000 1 1 0 1
>$165,000 to $170,000 0 0 0 0
>$170,000 3 2 0 3
MEAN $ 128,125 $ 151,000 $ 88,800 $ 118,082
STD DEV $ 27,367 $ 31,780 $ 10,430 $ 29,392
MIN $ 94,000 $ 125,000 $ 70,000 $ 70,000
MAX $ 222,000 $ 222,000 $ 112,000 $ 222,000
Also see Figures 1 through 9.

Center for Business and Economic Research—page 36
Item All Ph.D. Degree
Granting Institutions
Top 30*
Institutions
Bachelor & Master Degree
Granting Institutions
Total (Including
Non-Academic & Unclassified)
Q5. For new tenure track assistant professors hired for the 2016-17 academic year, did you
offer summer research support?
a. Yes [ ] No [ ]
Percent offering support 74.4% 88.9% 56.3% 69.5%
N= 43 9 16 59
b. If YES, for how many summers was support offered?
Average No. of Summers 2.8 3.4 1.7 2.6
N= 31 7 9 40
c. For any summer research support, what percentage of the academic year salary was
offered?
As a percent of 9 months 17.4% 17.3% 8.6% 15.6%
N= 31 7 8 39
Q6. For new tenure track assistant professors hired for the 2016-17 academic year, did you
offer:
a. Moving expenses to your university?
Percent “Yes” 97.6% 100.0% 75.0% 91.4%
N= 41 8 16 58
Mean Amount $7,703 $9,750 $4,591 $7,225
N= 38 8 11 50
b. A startup package?
Percent “Yes” 97.6% 100.0% 56.3% 86.4%
N= 42 9 16 59
Mean Amount $34,908 $68,750 $9,429 $30,225
N= 37 6 7 45
c. Housing allowance or any other type of housing or home purchase subsidy?
Percent “Yes” 14.6% 12.5% 6.3% 13.8%
N= 41 8 16 58
Mean Amount $157,314* $312,500* $5,000 $126,522*
N= 7 2 1 9
*Three institutions offered a subsidy of more than $250,000.

Center for Business and Economic Research—page 37
Item All Ph.D. Degree
Granting Institutions
Top 30*
Institutions
Bachelor & Master Degree
Granting Institutions
Total (Including
Non-Academic & Unclassified)
Q7. Does your university or institution offer the TIAA-CREF pension plan?
Percent “Yes” 76.2% 88.9% 64.7% 71.7%
N= 42 9 17 60
Q8. What percentage of the new tenure track assistant professor salary is required as a
contribution to your university’s pension plan by:
a. The university or institution:
Percent 8.3% 11.7% 8.2% 8.1%
N= 37 8 14 52
b. The new employee:
Percent 5.9% 7.9% 4.4% 5.4%
N= 37 8 13 51
Q9. When does full vesting occur in this pension plan?
a. At time of hire [ ] or later?
Percent at time of hire 55.3% 50.0% 64.7% 57.1%
N= 38 8 17 56
b. If later, when? _____years.
Mean years when later 3.1 3.3 4.0 3.45
N= 15 4 6 22
Q10. Does your institution offer a term life insurance package at no cost to the new tenure
track assistant professor?
Percent “Yes” 75.0% 62.5% 82.4% 77.6%
N= 40 8 17 58
a. If YES, what is its face value?
Mean Face Value $97,750 $73,750 $81,388 $94,344
N= 24 4 8 33

Center for Business and Economic Research—page 38
Item All Ph.D. Degree
Granting Institutions
Top 30*
Institutions
Bachelor & Master Degree
Granting Institutions
Total (Including
Non-Academic & Unclassified)
Q11. a. Does your institution permit faculty to stop the tenure clock if a faculty member has a
baby or adopts?
Percent “Yes, for birth of child”
7.7% 12.5% 0.0% 5.7%
Percent “Yes, for birth or adoption of child”
92.3% 87.5% 78.6% 88.7%
N= 39 8 14 53
a. ____ women stopped the tenure clock in the past 10 years out of the ____ who have
been eligible to do so.
Stopped Clock/Eligible 57/94 11/18 8/15 65/109
N= 33 6 12 45
a. ____ men stopped the tenure clock in the past 10 years out of the ____ who have
been eligible to do so.
Stopped Clock/Eligible 84/201 13/30 1/20 85/221
N= 35 7 12 50
b. If faculty have the option to stop the tenure clock, is it a [ ] formal policy or an [ ]
informal policy?
Percent “formal policy” 100.0% 100.0% 91.7% 98.0%
N= 38 7 12 50
c. If your institution has a stop the clock policy, what is the maximum number of times
the clock can be stopped?
Average times 1.8 1.7 1.5 1.8
No maximum 39.4% 50.0% 20.0% 36.8%
N= 33 6 5 38
Center for Business and Economic Research—page 39
Item All Ph.D. Degree
Granting Institutions
Top 30*
Institutions
Bachelor & Master Degree
Granting Institutions
Total (Including
Non-Academic & Unclassified)
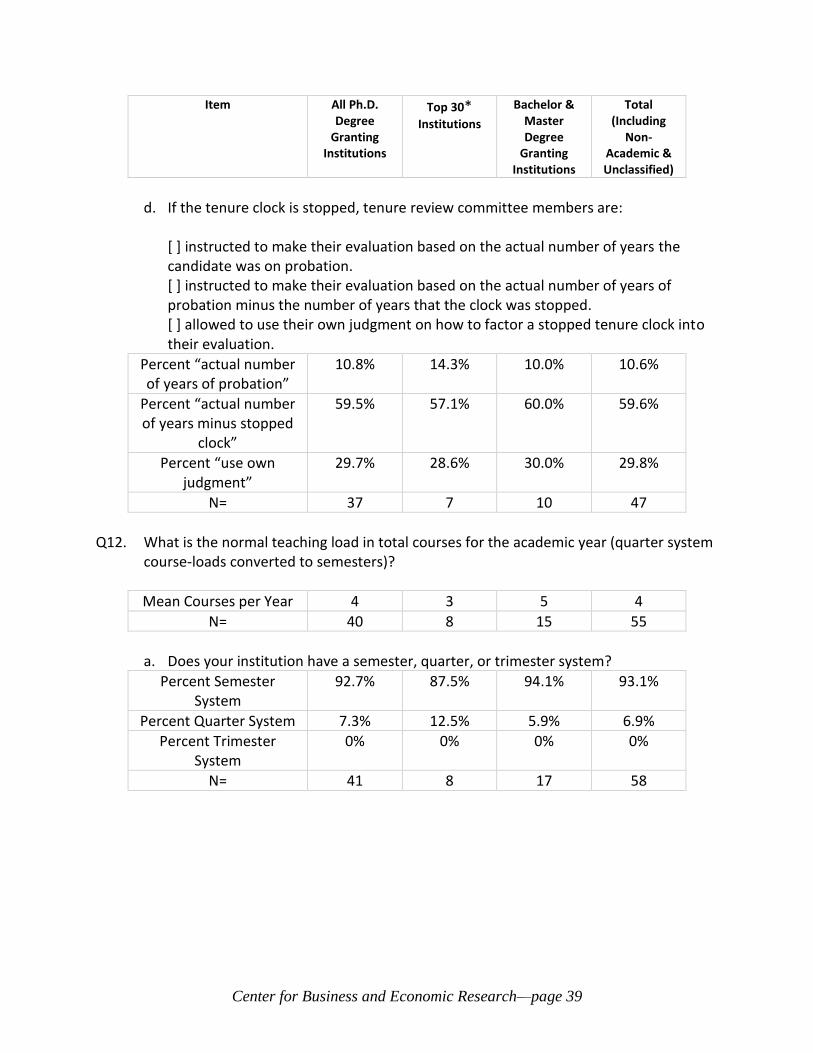
d. If the tenure clock is stopped, tenure review committee members are:
[ ] instructed to make their evaluation based on the actual number of years the candidate was on probation. [ ] instructed to make their evaluation based on the actual number of years of probation minus the number of years that the clock was stopped. [ ] allowed to use their own judgment on how to factor a stopped tenure clock into their evaluation.
Percent “actual number of years of probation”
10.8% 14.3% 10.0% 10.6%
Percent “actual number of years minus stopped
clock”
59.5% 57.1% 60.0% 59.6%
Percent “use own judgment”
29.7% 28.6% 30.0% 29.8%
N= 37 7 10 47
Q12. What is the normal teaching load in total courses for the academic year (quarter system
course-loads converted to semesters)?
Mean Courses per Year 4 3 5 4
N= 40 8 15 55
a. Does your institution have a semester, quarter, or trimester system?
Percent Semester System
92.7% 87.5% 94.1% 93.1%
Percent Quarter System 7.3% 12.5% 5.9% 6.9%
Percent Trimester System
0% 0% 0% 0%
N= 41 8 17 58

Center for Business and Economic Research—page 40
Item All Ph.D. Degree
Granting Institutions
Top 30*
Institutions
Bachelor & Master Degree
Granting Institutions
Total (Including
Non-Academic & Unclassified)
Q13. Does an incoming junior tenure track faculty member typically get any reduction from this normal load?
Percent “Yes” 95.0% 100.0% 47.1% 80.7%
N= 40 8 17 57
a. Number of courses reduced?
Mean Courses Reduced 1 1 1 1
N= 38 8 8 46
b. For how many years?
Mean Number of Years 2 2 1 2
N= 38 8 8 46
II. Hiring and Compensation in the Market for New Non-Tenure Track Ph.Ds. in the Labor Market for 2016-17 Q14. How many new non-tenure track Ph.D. candidates did you hire for appointment in the 2015-16 academic year?
New Hires for 2016-17 31 6 28 59
N Hiring= 18 2 17 35
See Table 4 for distribution of hires by hiring institution.
Q15. Breakdown by institution of origin and primary field of specialization.
See Table 5 for distribution of new hires by primary field of specialization. See Table 6 for distribution of degree granting institutions of new hires.

Center for Business and Economic Research—page 41
Item All Ph.D. Degree
Granting Institutions
Top 30*
Institutions
Bachelor & Master Degree
Granting Institutions
Total (Including
Non-Academic & Unclassified)
Q16. For a new non-tenure track Ph.D. with degree-in-hand, what DID you offer as a 9-month
salary for appointment in the 2016-17 academic year? If this varied across people, please give an average.
<$45,000 0 0 0 0
>$45,000 to $50,000 0 0 0 0
>$50,000 to $55,000 0 0 2 2
>$55,000 to $60,000 3 0 3 6
>$60,000 to $65,000 4 1 3 7
>$65,000 to $70,000 0 0 1 1
>$70,000 to $75,000 1 0 0 1
>$75,000 to $80,000 4 1 1 5
>$80,000 to $85,000 1 0 0 1
>$85,000 to $90,000 3 0 0 3
>$90,000 to $95,000 0 0 0 0
>$95,000 to $100,000 1 0 0 1
>$100,000 0 0 0 0
MEAN $ 75,118 $ 72,500 $ 62,885 $ 70,587
STD DEV $ 12,647 $ 10,607 $ 7,076 $ 12,329
MIN $ 57,500 $ 65,000 $ 54,000 $ 54,000
MAX $ 100,000 $ 80,000 $ 78,000 $ 100,000
Also see Figure 9.

Center for Business and Economic Research—page 42
Item All Ph.D. Degree
Granting Institutions
Top 30*
Institutions
Bachelor & Master Degree
Granting Institutions
Total (Including
Non-Academic & Unclassified)
Q17. For new non-tenure track assistant professors hired for the 2016-17 academic year, did
you offer:
d. Moving expenses to your university?
Percent “Yes” 63.2% 33.3% 60.0% 61.8%
N= 19 3 15 34
Mean Amount $5,500 - $2,083 $4,294
N= 11 - 6 17
e. A startup package?
Percent “Yes” 36.8% 0.0% 13.3% 26.5%
N= 19 3 15 34
Mean Amount $3,250 - $2,000 $3,071
N= 6 - 1 7
f. Housing allowance or any other type of housing or home purchase subsidy?
Percent “Yes” 5.6% 0.0% 7.1% 0.0%
N= 18 2 14 32
Mean Amount $5,000 - $24,000 $14,500
N= 1 - 1 2
Q18. Does your university or institution offer the TIAA-CREF pension plan?
Percent “Yes” 70.6% 50.0% 93.8% 81.8%
N= 17 2 16 33
Q19. What percentage of the new non-tenure track assistant professor salary is required as a
contribution to your university’s pension plan by:
c. The university or institution:
Percent 7.4% 8.0% 8.1% 7.7%
N= 12 1 12 24
d. The new employee:
Percent 5.0% 8.0% 4.0% 4.5%
N= 12 1 11 23

Center for Business and Economic Research—page 43
Item All Ph.D. Degree
Granting Institutions
Top 30*
Institutions
Bachelor & Master Degree
Granting Institutions
Total (Including
Non-Academic & Unclassified)
Q20. When does full vesting occur in this pension plan?
c. At time of hire [ ] or later?
Percent at time of hire 57.1% 0.0% 46.2% 51.9%
N= 14 2 13 27
d. If later, when? _____years.
Mean years when later 2.8 2.5 2.0 2.3
N= 4 2 7 11
Q21. Does your institution offer a term life insurance package at no cost to the new non-
tenure track assistant professor?
Percent “Yes” 66.7% 50.0% 66.7% 66.7%
N= 15 1 15 30
b. If YES, what is its face value?
Mean Face Value $117,750 - $84,167 $100,958
N= 6 - 6 12

Center for Business and Economic Research—page 44
Item All Ph.D. Degree
Granting Institutions
Top 30*
Institutions
Bachelor & Master Degree
Granting Institutions
Total (Including
Non-Academic & Unclassified)
III. Demand for Ph.Ds. for 2017-18 Q22. Please estimate the number of new tenure track Ph.Ds. you expect to hire for the 2017-
18 academic year. a. Total expected new Ph.D. hires.
Total Expected Hires 74 23 28 128
N Hiring 43 9 23 67
b. Distribution of new Ph.D. hires by primary field of specialization. See Tables 9 and 10 for the distribution of expected hires by primary field of
specialization.

Center for Business and Economic Research—page 45
Item All Ph.D. Degree
Granting Institutions
Top 30*
Institutions
Bachelor & Master Degree
Granting Institutions
Total (Including
Non-Academic & Unclassified)
Q23. For a new tenure track Ph.D. with degree-in-hand, what is the 9-month salary you
EXPECT to offer for the 2017-18 academic year?
<$60,000 0 0 1 1
>$60,000 to $65,000 0 0 0 0
>$65,000 to $70,000 1 0 3 4
>$70,000 to $75,000 1 0 1 2
>$75,000 to $80,000 0 0 1 1
>$80,000 to $85,000 0 0 5 5
>$85,000 to $90,000 0 0 2 2
>$90,000 to $95,000 1 0 2 3
>$95,000 to $100,000 2 0 2 4
>$100,000 to $105,000 2 0 1 3
>$105,000 to $110,000 6 0 1 7
>$110,000 to $115,000 3 1 0 3
>$115,000 to $120,000 2 0 0 3
>$120,000 to $125,000 3 0 0 3
>$125,000 to $130,000 4 3 0 4
>$130,000 to $135,000 7 0 0 7
>$135,000 to $140,000 3 0 0 3
>$140,000 to $145,000 2 1 0 2
>$145,000 to $150,000 2 1 0 2
>$150,000 to $155,000 0 0 0 0
>$155,000 to $160,000 1 1 0 1
>$160,000 to $165,000 0 0 0 0
>$165,000 to $170,000 0 0 0 0
>$170,000 1 1 0 1
MEAN $ 123,113 $ 141,563 $ 85,368 $ 111,244
STD DEV $ 21,066 $ 19,316 $ 13,512 $ 25,678
MIN $ 70,000 $ 115,000 $ 55,000 $ 55,000
MAX $ 175,000 $ 175,000 $ 110,000 $ 175,000

Center for Business and Economic Research—page 46
Item All Ph.D. Degree
Granting Institutions
Top 30*
Institutions
Bachelor & Master Degree
Granting Institutions
Total (Including
Non-Academic & Unclassified)
Q24. Please estimate the number of new non-tenure track Ph.Ds. you expect to hire for the
2017-18 academic year. a. Total expected new Ph.D. hires.
Total Expected Hires 29 10 12 41
N Hiring 21 5 9 30
a. Distribution of new Ph.D. hires by primary field of specialization. See Tables 11 and 12 for the distribution of expected hires by primary field of
specialization.
Q25. For a new non-tenure track Ph.D. with degree-in-hand, what is the 9-month salary you EXPECT to offer for the 2017-18 academic year?
<$45,000 0 0 0 0
>$45,000 to $50,000 0 0 0 0
>$50,000 to $55,000 0 0 1 1
>$55,000 to $60,000 0 0 0 0
>$60,000 to $65,000 2 0 1 3
>$65,000 to $70,000 2 1 2 4
>$70,000 to $75,000 2 1 1 3
>$75,000 to $80,000 1 1 2 3
>$80,000 to $85,000 2 0 0 2
>$85,000 to $90,000 6 1 0 6
>$90,000 to $95,000 1 0 0 1
>$95,000 to $100,000 1 0 0 1
>$100,000 3 1 0 3
MEAN $ 91,540 $ 94,200 $ 70,714 $ 86,141
STD DEV $ 26,575 $ 37,792 $ 8,864 $ 24,914
MIN $ 61,000 $ 66,000 $ 55,000 $ 55,000
MAX $ 160,000 $ 160,000 $ 80,000 $ 160,000

Center for Business and Economic Research—page 47
Item All Ph.D. Degree
Granting Institutions
Top 30*
Institutions
Bachelor & Master Degree
Granting Institutions
Total (Including
Non-Academic & Unclassified)
Q26. If you are not hiring new Ph.Ds. for the 2017-18 academic year, please indicate the
primary reason why you are not hiring.
No Vacant Positions 44.0% 50.0% 77.8% 63.9%
Budget Problems 32.0% 0.0% 11.1% 19.7%
Falling Enrollments - - 2.8% 1.6%
Seeking Senior Hires 20.0% 50.0% 5.6% 11.5%
Other 4.0% - 2.8% 3.3%
N 25 2 36 61
Q27. What is the highest degree offered by your institution?
See Distribution of Respondent Institutions by Highest Degree Offered, above. IV. Results of the 2016-17 New Ph.D. Market and Expected Supply for 2017-18. Q28. How many candidates from your department sought employment for the 2016-17
academic year (or, for the year 2016)?
Number of Job Seekers 427 149 427
From Number of Depts. 63 10 63
Q29. Of the Ph.D. candidates from your department who sought employment for the 2016-17
academic year (or for 2016), how many actually found employment by August 31, 2016?
Number 401 143 401
Percent of Job Seekers 93.9% 96.0% 93.9%
From Number of Depts. 63 10 63
Q30. What was the distribution of employment across academic and non-academic positions?
Academic 58.6% 51.0% 58.6%
Non-Academic 37.2% 38.5% 37.2%

Center for Business and Economic Research—page 48
Item All Ph.D. Degree
Granting Institutions
Top 30*
Institutions
Bachelor & Master Degree
Granting Institutions
Total (Including
Non-Academic & Unclassified)
Q31. Please estimate the number of Ph.D. candidates from your department who will be
seeking employment for the 2017-18 academic year.
Number of Job Seekers 380 117 380
From Number of Depts. 67 12 67
Q32. How many of the candidates listed above are holdovers from the 2015-16 market who
could not get a permanent position?
Number of Holdovers 15 2 15
Percent of Job Seekers 3.9% 1.7% 3.9%
V. Results of the Senior Economists Market for the 2016-17 Academic Year and the
Expected Demand for the 2017-18 Academic Year Q33. How many and what level senior economists did you hire for appointment for the 2016-
17 academic year?
Senior Asst. Professor 3 0 2 17
Assoc. Prof. With Tenure 17 2 1 18
Assoc. Prof. No Tenure 2 0 0 2
Full Professor 8 2 1 9
Total 30 4 4 46
Q34. How many of these hires filled administrative positions?
Administrative Positions 1 0 2 3
Q35. How many of these hires filled endowed chairs?
Endowed Chairs 3 0 0 3

Center for Business and Economic Research—page 49
Q36. What DID you offer as a 9-month salary for appointment in the 2016-17 academic year?
Senior Asst. Professor $139,667 - $70,000 $122,550
N= 3 - 1 5
Assoc. Prof. With Tenure $195,438 $235,000 $106,000 $188,558
N= 12 2 1 13
Assoc. Prof. No Tenure $180,000 - - $180,000
N= 1 - - 1
Full Professor $273,000 $332,500 $90,000 $252,667
N= 8 2 1 9
Q37. Please estimate the number of senior assistant, associate, and full professors you expect
to hire for the 2017-18 academic year.
Senior Asst. Professor 7 1 3 18
N= 10 1 5 16
Associate Professor 19 6 1 20
N= 16 5 3 19
Full Professor 18 5 2 20
N= 19 5 3 22
Q38. How many of these hires are intended to fill administrative positions?
Administrative Positions 2 0 0 2
Q39. How many of these hires are intended to fill endowed chairs?
Endowed Chairs 8 2 1 9
Q40. What do you expect to offer as an average 9-month salary for appointment in the 2017-
18 academic year?
Senior Asst. Professor $167,500 - $75,000 $135,357
N= 4 - 2 7
Associate Professor $168,926 $198,333 $80,000 $162,086
N= 12 3 1 13
Full Professor $230,115 $325,000 $250,000 $231,645
N= 12 3 1 13
Item All Ph.D. Degree
Granting Institutions
Top 30*
Institutions
Bachelor & Master Degree
Granting Institutions
Total (Including
Non-Academic & Unclassified)