survey of travel surveys ii - transportation research board
TRANSCRIPT
TRANSPORTA TION RESEARCH RECORD 1271 23
Survey of Travel Surveys II
CHARLES L. PURVIS
A survey of large metropolitan planning organizations was conducted to ascertain past, current, and future data collection plans with respect to household travel surveys and related, auxiliary surveys. Thirty-eight metropolitan areas responded to this survey of travel surveys, including the largest 20 metropolitan areas in the United States. Responses to the survey can be grouped into five general patterns: (a) regions conducting household surveys on a 10-year census cycle; (b) regions conducting household surveys on a 10-year off-census cycle; (c) regions on a 15-plus-year cycle; (d) regions conducting surveys on a tracking and continual cycle; and (e) regions not conducting household travel surveys. The survey provides a springboard to establish a network of metropolitan transportation planners involved in household travel survey analysis. Cooperation between regional agencies will foster greater awareness of the necessary tools and procedures to weight and expand survey results, develop and apply trip-linking procedures, and integrate survey results into updated, reestimated travel demand models.
This survey of metropolitan area data collection plans was intended to develop a dialogue between regional agency staffs planning and conducting household travel surveys from 1989 to 1992. This dialogue may then evolve into an informal network of regional transportation planners and engineers involved in transportation data collection, analysis, and travel demand forecasting. The methods and procedures-the insights and experiences-can perhaps be transferred to other regions, as well.
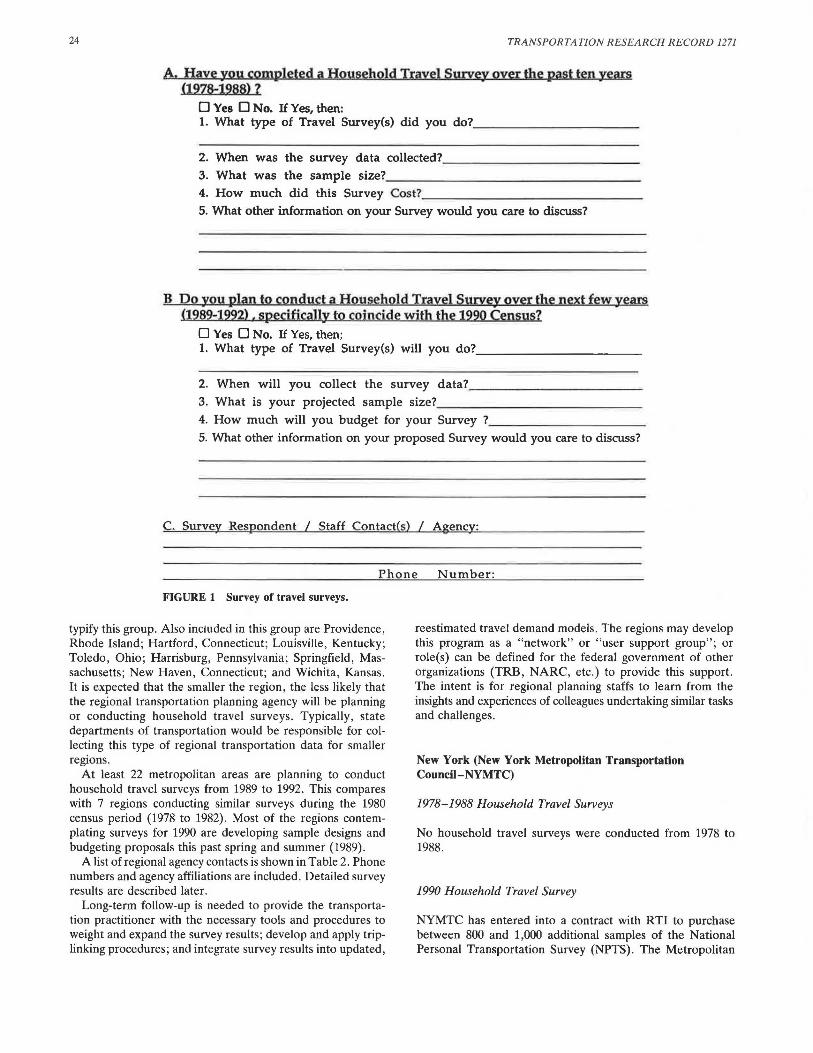
This "survey of travel surveys" was originally conducted as a mail-out, mail-back survey during March and April 1989. Telephone follow-up for late responses was necessary. The survey instrument (Figure 1) included questions on past travel surveys conducted from 1978 to 1988 and planned travel surveys for 1989 to 1992. Respondents volunteered answers on household travel surveys , truck and goods movement surveys, external cordon surveys, and on-board transit user surveys. Questions were asked about sample size, survey costs, and projected budgets. Surveys were sent to the 37 largest metropolitan areas in the United States with more than 1 million population (Table 1). The "Survey of Travel Survey II" resurveyed the largest metropolitan areas about changes in data collection plans and surveyed all 80 metropolitan areas with greater than 430,000 population.
SURVEY RESULTS
Thirty-eight metropolitan areas responded to this survey of travel surveys, including the largest 20 metropolitan areas in the United States. Only eight of the 43 smaller metropolitan
Metropolitan Transportation Commission, 101 Eighth Street, Oakland, Calif. 94607.
areas (430,000 to 1,000,000 population) responded to this survey.
Responses can be grouped into five general patterns:
1. Regions conducting household surveys on a 10-year census cycle,
2. Regions conducting household surveys on a 10-year off-census cycle,
3. Regions conducting household surveys on a 15-plus-year cycle,
4. Regions conducting household surveys on a tracking and continual cycle, and
5. Regions not conducting household surveys.
The first group is composed of 8 regions which conducted their last household survey between 1978 and 1982 and are planning to conduct a new household travel survey between 1989 and 1992, coincident with the 1990 Census. The regions include: Chicago (last survey in 1979), the San Francisco Bay Area (1981), Detroit (1980), Cleveland (1978), Atlanta (1980), Pittsburgh (1978 to 1980), and Minneapolis-St. Paul (1982). Milwaukee conducted a small-scale travel survey in 1984 and 1985 and is planning a household survey in 1991 and 1992. These eight represent the 10-year census cycle survey group
The 10-year off-census cycle group is composed of 6 regions that conducted major household travel surveys from 1985 to 1988 and are not planning household travel surveys for 1989 to 1992. They include (with their last household travel survey in parentheses) Philadelphia (1986 and 1988) , Washington, D.C. (1987 to 88), Baltimore (1988), San Diego (1986), Phoenix (1986 and 1988), and Denver (1985).
The third group includes regions where household travel surveys are conducted infrequently-every 14 to 26 years. The ten regions included here in this group are: New York (1963 to 1964), Los Angeles (1976), Boston (1963) , St. Louis (1965 to 1966), Buffalo (1973), and Albuquerque (1962). Also included in this group are Kansas City, Missouri; San Antonio, Texas; Columbus, Ohio; and Tucson, Arizona.
A new pattern of household travel survey data collection is emerging in which travel data is collected on an ongoing or "tracking" basis. These regions are either planning or conducting longitudinal surveys or "panel surveys" (same group of respondents). The four regions in this group include DallasFort Worth (1984), Houston (1984), Seattle (1987 to 1988), and Portland (1985 and 1988). All plan to conduct travel surveys between 1989 and 1992. The Bay Area also has plans to conduct a panel survey to complement a standard one-day trip diary travel survey.
The last and fifth group of regions includes those not using the household travel survey as a tool in travel demand model development or for their regional transportation data base. Miami (population 2.64 million) and Norfolk (1.16 million)
24 TRANSPORTATION R ESEA RCH RECORD 1271
A. Haye you completed a Household Travel Survey over tbe past ten years 0978-1988) ?
0 Yes 0 No. If Yes, then: 1. What type of Travel Survey(s) did you do? __________ _
2. When was the survey data collected? _____________ _ 3. What was the sample size? ____ _____________ _ 4. How much did this Survey Cost? _____ __________ _
5. What other information on your Survey would you care to discuss?
B Do you plan to conduct a Household Travel Survey over the next few years (1989-1992) , specifically to coincide with the 1990 Census?
D Yes 0 No. If Yes, then: 1. What type of Travel Survey(s) will you do? __________ _
2. When will you collect the survey data? ___________ _ 3. What is your projected sample size? ___ ___________ _
4. How much will you budget for your Survey ? __________ _
5. What other information on your proposed Survey would you care to discuss?
C. Survey Respondent I Staff Contact(s) I Agency:
Phone Number:
FIGURE 1 Survey of travel surveys.
typify this group. Also included in this group are Providence, Rhode Island; Hartford, Connecticut; Louisville, Kentucky; Toledo, Ohio; Harrisburg, Pennsylvania; Springfield, Massachusetts; New Haven, Connecticut; and Wichita, Kansas. It is expected that the smaller the region, the less likely that the regional transportation planning agency will be planning or conducting household travel surveys. Typically , state departments of transportation would be responsible for collecting this type of regional transportation data for smaller regions.
At least 22 metropolitan areas are planning to conduct household travel surveys from 1989 to 1992. This compares with 7 regions conducting similar surveys during the 1980 census period (1978 to 1982). Most of the regions contemplating surveys for 1990 are developing sample designs and budgeting proposals this past spring and summer (1989) .
A list of regional agency contacts is shown in Table 2. Phone numbers and agency affiliations are included . Detailed survey results are described later.
Long-term follow-up is needed to provide the transportation practitioner with the necessary tools and procedures to weight and expand the survey results; develop and apply triplinking procedures; and integrate survey results into updated ,
reestimated travel demand models . The regions may develop this program as a "network" or "user support group" ; or role(s) can be defined for the federal government of other organizations (TRB, NARC, etc.) to provide this support. The intent is for regional planning staffs to learn from the insights and experiences of colleagues undertaking similar tasks and challenges.
New York (New York Metropolitan Transportation Council-NYMTC)
1978- 1988 Household Travel Surveys
No household travel surveys were conducted from 1978 to 1988.
1990 Household Travel Survey
NYMTC has entered into a contract with RTI to purchase between 800 and 1,000 additional samples of the National Personal Transportation Survey (NPTS). The Metropolitan

TABLE 1 METROPOLITAN AREAS RANKED BY 1988 POPULATION (440,000+POPULATION)
R-ion Ae.enl'V Staff Contact(s) Teleohone 1 NewYork NYMTC Lawrence Hammel (212} 938-3341 2 Los Angeles SCAG Hong Kim (213) 385-1000 3 Chicago CATS Ed Christopher (312) 793-3467 4 San Francisco Bay MTC Chuck Purvis; Patrick Hackett (415} 464-7731 5 Philadelphia DVRPC Thabet Zakaria (215) 592-1800 6 Detroit SEMCOG Robert Newhouser (313) 961-4266 7 Boston CTPS Ian Harrington; I<en Miller (617) 973-7080 8 Dallas/Ft.Worth NCTCOG Gordon Shunk; Michael Morris (817) 640-3300 9 Washington, D.C. Metro Wash COG George Wickstrom (202)223~
10 Houston HGAC Alan Clark (713) 627-3200 11 Miami MetroDade Jose-Luis Mesa (305) 375-4507 12 Cleveland NOA CA Joe Cole (216) 241-2414 13 Atlanta ARC Patti Schropp (404) 656-7737 14 St. Louis E-WGCC Martin Altman; Al Boudreau (314) 421-4220 15 Seattle PSCOG Elaine Murakami; Bob Sicko; Tim Watterson (206) 464-5355 16 Minneapolis/St.Paul Metro Council Stephen Alderson (612) 291-6337 17 San Diego SAND AG Lois Fonseca (619) 236-5354 18 Baltimore BR COG Gene Bandy (301) 554-5628 19 Pittsburgh SPRPC Wade Fox; Chuck DiPietro; Ted Treadway (412) 391-5593 20 Phoenix MAGTPO Mark Schlappi (602) 255-7867 22 Denver DRCOG George Scheuemstahl; Chuck Green (303) 455-1000 24 Kansas City MARC Fred Schwartz (816) 474-4240 25 Milwaukee SEWRPC Ken Yunker (414) 547-6721 26 Portland METRO Keith Lawton (503) 221-1646 28 Norfolk SVPOC John Crosby; Dwight Farmer (804) 420-8300 29 Columbus MORPC Robert Lawler (614) 228-2663 30 San Antonio BC-COG David F. Pearson (512) 227-8651 33 Buffalo NFl'C Tim Trabold (716) 856-2026 34 Providence RI-Dept Admin D. M. Tonnessen (401) 277-2656 36 Hartford CR COG Tom Maziarz (203) 522-2217 42 Louisville KIPDA Norman Nezelkewicz (502) 589-4406 59 Tucson ADOT-PAGTPD T.R. Buick (602) 628-5314 63 Toledo 1MACOG William Knight (419) 241-9155 66 Harrisburg T-CRPC Dave Royer (717) 234-2639 69 New Haven SCRCOG Herbert Burstein (203) 234-7555 70 Springfield PVPC James P. Cope (413) 781-6045 75 Albuquerque - MRGCCXl John Hoffmeister (505) 247-1750 77 Wichita W-SCMAPD David Peterson (316) 268-4457
TABLE 2 METROPOLITAN AREA TRAVEL SURVEYS-CONTACT LIST
1980 1980 1986 1988 %·Change Rank Metropalitan Area Pooulation Rank Pooulation Pooulation 1980-88
1 New York 17,539,532 1 17,967,800 18,120,200 3.3% 2 Los Angeles 11,497,549 2 13,074,800 13,769,700 19.8o/c 3 Chicago 7,937,307 3 8,116,100 8,180,900 3.1% 4 San Francisco-Oakland 5,367,900 5 5,877,800 6,041 ,800 12.63 5 Philadelphia 5,680,509 4 5,832,600 5,963,300 5.0% 6 Detroit 4,752,764 6 4,600,700 4,620,200 -2.8% 7 Boston 3,971,792 7 4,055,700 4,109,900 3.5% 8 Dallas-Fort Worth 2,930,568 10 3,655,300 3,766,100 28.5% 9 Washington, DC 3,250,921 8 3,563,000 3,734,200 14.9%
10 Houston 3,099,942 9 3,634,300 3,641,500 17.5% 11 Miami 2,643,766 12 2,912,000 3,000,500 13.5% 12 Cleveland 2,834,062 11 2,765,600 2,769,000 -2.3% 13 Atlanta 2,138,143 16 2,560,500 2,736,600 28.0% 14 St Louis 2,376,971 14 2,438,000 2,466,700 3.8% 15 Seattle 2,093,285 18 2,284,500 2,420,800 15.6% 16 Minneapolis-St Paul 2,137,133 17 2,295,200 2,387,500 11.7% 17 San Diego 1,861,846 19 2,201,300 2,370,400 27.3% 18 Baltimore 2,199,497 15 2,280,000 2,342,500 6.5% 19 Pittsburgh 2,423,311 13 2,316,100 2,284,100 -5.7% 20 Phoenix 1,509,227 24 1,900,200 2,029,500 34.5% 21 Tampa-St Petersburg 1,613,600 22 1,914,300 1,995,100 23.6%
TABLE 2 (continued on next page)
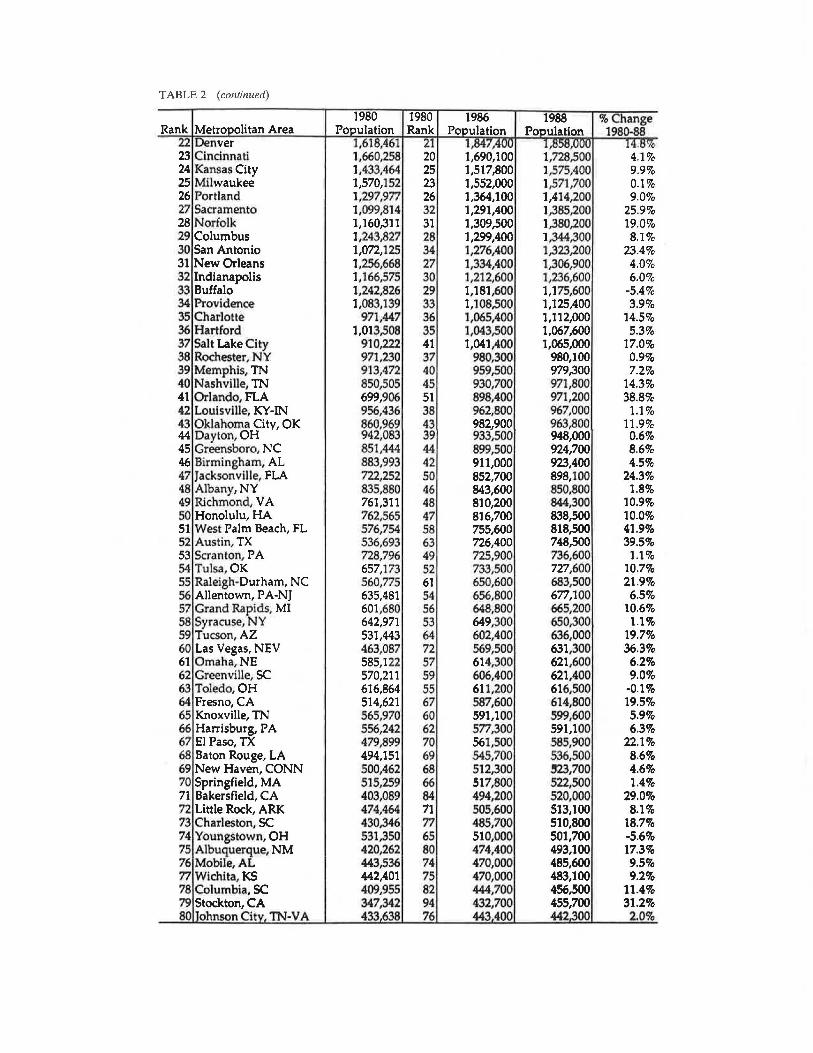
TABLE 2 (continued)
1980 1980 1986 1988 3 Change Rank Metropolitan Area Population Rank Population Pooulation 1980-88
22 Denver 1,618,461 21 1,847,400 1,ts::ii:s,uuu J4.0'/o 23 Cincinnati 1,660,258 20 1,690,100 1,728,500 4.1% 24 Kansas City 1,433,464 25 1,517,800 1,575,400 9.9% 25 Milwaukee 1,570,152 23 1,552,000 1,571,700 0.1% 26 Portland 1,297,977 26 1,364,100 1,414,200 9.0% 27 Sacramento 1,099,814 32 1,291,400 1,385,200 25.9% 28 Norfolk 1,160,311 31 1,309,500 1,380,200 19.0% 29 Columbus 1,243,827 28 1,299,400 1,344,300 8.1% 30 San Antonio 1,072,125 34 1,276,400 1,323,200 23.4% 31 New Orleans 1,256,668 27 1,334,400 1,306,900 4.0% 32 Indianapolis 1,166,575 30 1,212,600 1,236,600 6.0% 33 Buffalo 1,242,826 29 1,181,600 1,175,600 -5.4% 34 Providence 1,083,139 33 1,108,500 1,125,400 3.9% 35 Charlotte 971,447 36 1,065,400 1,112,000 14.5% 36 Hartford 1,013,508 35 1,043,500 1,067,600 5.3% 37 Salt Lake City 910,222 41 1,041,400 1,065,000 17.0% 38 Rochester, NY 971,230 37 980,.300 980,100 0.9% 39 Memphis, TN 913,472 40 959,500 979,300 7.2% 40 Nashville, TN 850,505 45 930,700 971,800 14.3% 41 Orlando, FLA 699,906 51 898,400 971,200 38.8% 42 Louisville, KY-IN 956,436 38 962,800 967,000 1.1% 43 Oklahoma City, OK 860,969 43 982,900 963,800 11.9% 44 Dayton, OH 942,083 39 933,500 948,000 0.6% 45 Greensboro, NC 851,444 44 899,500 924,700 8.6% 46 Birmingham, AL 883,993 42 911,000 923,400 4.5% 47 Jacksonville, FLA 722,252 50 852,700 898,100 24.3% 48 Albany, NY 835,880 46 843,600 850,800 1.8% 49 Richmond, VA 761,311 48 810,200 844,300 10.9% 50 Honolulu, HA 762,565 47 816,700 838,500 10.0% 51 West Palm Beach, FL 576,754 58 755,600 818,500 41.9% 52 Austin, TX 536,693 63 726,400 748,500 39.5% 53 Scranton, PA 728,796 49 725,900 736,600 1.1% 54 Tulsa, OK 657,173 52 733,500 727,600 10.7% 55 Raleigh-Durham, NC 560,775 61 650,600 683,500 21.9% 56 Allentown, PA-NJ 635,481 54 656,800 677,100 6.5% 57 Grand Rapids, MI 601,680 56 648,800 665,200 10.6% 58 Syracuse, NY 642,971 53 649,300 650,300 1.1% 59 Tucson, AZ 531,443 64 602,400 636,000 19.7% 60 Las Vegas, NEV 463,087 72 569,500 631,300 36.3% 61 Omaha, NE 585,122 57 614,300 621,600 6.2% 62 Greenville, SC 570,211 59 606,400 621,400 9.0% 63 Toledo, OH 616,864 55 611,200 616,500 -0.1% 64 Fresno, CA 514,621 67 587,600 614,800 19.5% 65 Knoxville, TN 565,970 60 591,100 599,600 5.9% 66 Harrisburg, PA 556,242 62 577,300 591,100 6.3% 67 El Paso, TX 479,899 70 561,500 585,900 22.1% 68 Baton Rouge, LA 494,151 69 545,700 536,500 8.6% 69 New Haven, CONN 500,462 68 512,300 '23,700 4.6% 70 Springfield, MA 515,259 66 517,800 522,500 1.4% 71 Bakersfield, CA 403,089 84 494,200 520,000 29.0% 72 Little Rock, ARK 474,464 71 505,600 513,100 8.1% 73 Charleston, SC 430,346 77 485,700 510,800 18.7% 74 Youngstown, OH 531,350 65 510,000 501,700 -5.6% 75 Albuquerque, NM 420,262 80 474,400 493,100 17.3% 76 Mobile, AL 443,536 74 470,000 485,600 9.5% 77 Wichita, KS 442,401 75 470,000 483,100 9.2% 78 Columbia, SC 409,955 82 444,700 456,500 11.4% 79 Stockton, CA 347,342 94 432,700 455,700 31.2% 80 TohnsonCitv. TN-VA 433638 76 443 400 442.300 2.0%
Purvis
Transportation Authority (MT A) conducted a telephone home interview survey of more than 20,500 households during April and May 1989-a Total Travel Survey (TIS). The TIS obtained the total diary for one adult member (aged 16 or older) in each household. Preliminary findings on the TIS are beginning to be received. In addition, the MTA will conduct a fall 1989 intercept survey of riders on its subways in New York City (including the heavy rail operation on Staten Island) and the Long Island Rail Road. Surveys of riders on the MetroNorth Commuter Railroad were done recently and do not require updating. The total cost for all current survey work is $3 million. Origin-destination surveys of passenger cars and commercial vehicles were just completed for vehicles entering and leaving part of the Manhattan CBD as part of a highway corridor study. NYMTC coordinates an annual Hub-Bound Travel Survey which is a count of all persons and vehicles entering and leaving the Manhattan CBD.
Los Angeles (Southern California Association of Governments-SCAG)
1976 Household Travel Survey
A telephon survey sampled 6,947 hou 'eholds out of 4.028 million regional housholds (0.17 percent). Used in a travel demand model update, the survey was conducted as part of the California Statewide Travel Survey (1976 to 1980) in which 18,300 household samples were collected statewide.
1990 Household Travel Survey
A sample design was completed under contract to UC IrvineInstitute for Transportation Studies (ITS). Budget and sample size are to be determined, and a truck survey for development of truck models is being considered.
Chicago (Chicago Area Transportation Study-CATS)
1979 Household Travel Survey
Home interviews were conducted in 1979 and 1980, 300 household samples regionwide.
1988-1992 Household Travel Surveys
A fjve-year program is using self-administered mail-back surveys and 1 to 2 percent of all households are being surveyed.
Officials budgeted $500,000 for the project. The method, adapted from work done in Ithaca and Albany, New York, has been ce ted with positive resu lts. Chicago CBD used it in November 1988; McHenry County in the spring of 1989; Lake and Will Counties in the fall of 1989; DuPage County in the spring of 1990; and Cook County in the fall of 1990 (tentative). The mail-out, mail-back method captured the expected 20 percent or 400 travel surveys (Chicago CBD). Overall, 1 out of every 15.5 households was surveyed with the total data base representing 1 out of every 76.7 households, or 1.3 per-
27
cent (2,000 questionnaires mailed in a population of 31,000 households).
San Francisco Bay Area (Metropolitan Transportation Commission- MTC)
1981 Household Travel Survey
A telephone survey with mail-out trip diary cards was conducted in the spring of 1981, including 7 ,091 total households and 6,209 households for weekday travel. Officials budgeted $365,000 for survey consulting. The survey was used in estimating full set of auto ownership, trip generation, trip distribution, and mode choice models. Several major reports focused on trip-linking, sample weighting, and trip characteristics. Comparisons were made between 1965 and 1980 trip rates.
1990 Household Travel Survey
A telephone survey similar to the 1981 survey was conducted . In the spring of 1990, a household panel survey of 1,500 households will complement the main sample. The panel survey (at $210,000) will include a multi-day trip diary component. The main survey will include one-day trip diaries for about 9,900 household samples (at $700,000). BART is adding on $100,000 to the MTC surveys for a "BART User and Non-User Panel Survey." Truck and external cordon surveys are postponed indefinitely. Officials have budgeted about $500,000 for transit operator on-board and marketing surveys, and about $75,000 for HOV-lane users survey (fall 1989). A sample design working paper for the 1990 household survey is complete. The RFP for the two MTC surveys and the BART Panel Survey ($1.01 million) will be released mid-November 1989. A Survey Advisory Panel of University of California, Berkeley, University of California, Davis and Stanford academicians has met periodically.
Philadelphia (Delaware Valley Regional Planning Commission-DVRPC)
1986 and 1988 Household Travel Surveys
Done in the fall of 1986 and fall of 1988, the survey looked at 2,500 sample households . The $260,000 survey was conducted by a consultant. Design, analysis, and application were completed by DVRPC staff.
1989-1992 Household Travel Surveys
No household travel surveys are planned from 1989 to 1992. External cordon surveys are planned for this period.
Detroit (Southeast Michigan Council of GovernmentsSEMCOG)
1980 Household Travel Survey
This trip diary and home interview survey sampled 2,500 households. The survey generated socioeconomic character-
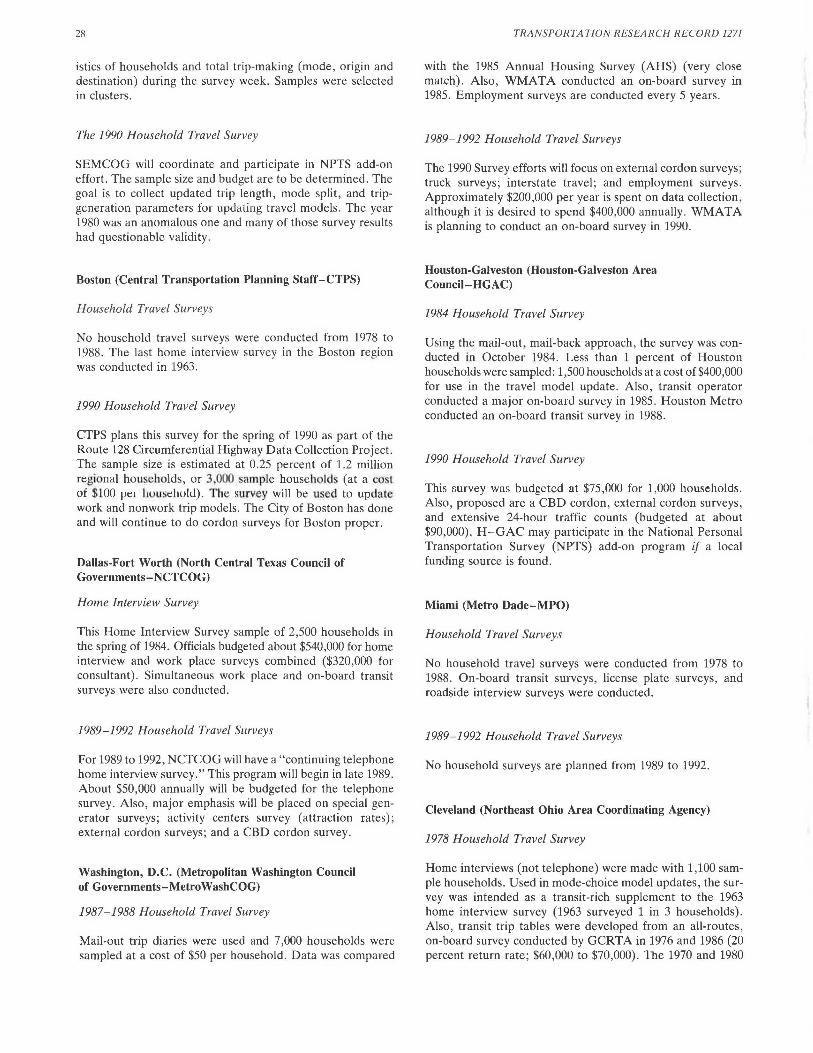
28
istics of households and total trip-making (mode, origin and destination) during the survey week. Samples were selected in clusters.
The 1990 Household Travel Survey
SEMCOG will coordinate and participate in NPTS add-on effort. The sample size and budget are to be determined. The goal is to collect updated trip length, mode split, and tripgeneration parameters for updating travel models. The year 1980 was an anomalous one and many of those survey results had questionable validity.
Boston (Central Transportation Planning Staff-CTPS)
Household Travel Surveys
No household travel surveys were conducted from 1978 to 1988. The last home interview survey in the Boston region was conducted in 1963.
1990 Household Travel Survey
CTPS plans this survey for the spring of 1990 as part of the Route 128 Circumferential Highway Data Collection Project. The sample size is estimated at 0.25 percent of 1.2 million regional hou ·cholds, or 3 000 sample households (at a co. t of $100 ve1 liuusehulu). The survey will be used to update work and nonwork trip models. The City of Boston has done and will continue to do cordon surveys for Boston proper.
Dallas-Fort Worth (North Central Texas Council of Governments-NCTCOG)
Home Interview Survey
This Home Interview Survey sample of 2,500 households in the spring of 1984. Officials budgeted about $540,000 for home interview and work place surveys combined ($320,000 for consultant) . Simultaneous work place and on-board transit surveys were also conducted.
1989-1992 Household Travel Surveys
For 1989 to 1992, NCTCOG will have a "continuing telephone home interview survey." This program will begin in late 1989. About $50,000 annually will be budgeted for the telephone survey. Also, major emphasis will be placed on special generator surveys; activity centers survey (attraction rates); external cordon surveys; and a CBD cordon survey.
Washington, D.C. (Metropolitan Washington Council of Governments-MetroWashCOG)
1987-1988 Household Travel Survey
Mail-out trip diaries were used and 7 ,000 households were sampled at a cost of $50 per household. Data was compared
TRANSPORTATION RESEARCH RECORD 1271
with the 1985 Annual Housing Survey (AHS) (very close match). Also, WMATA conducted an on-board survey in 1985. Employment surveys are conducted every 5 years .
1989-1992 Household Travel Surveys
The 1990 Survey efforts will focus on external cordon surveys; truck surveys; interstate travel; and employment surveys. Approximately $200,000 per year is spent on data collection, although it is desired to spend $400,000 annually. WMATA is planning to conduct an on-board survey in 1990.
Houston-Galveston (Houston-Galveston Area Council-HGAC)
1984 Household Travel Survey
Using the mail-out, mail-back approach, the survey was conducted in October 1984. Less than 1 percent of Houston households were sampled: 1,500 households at a cost of $400,000 for use in the travel model update. Also, transit operator conducted a major on-board survey in 1985. Houston Metro conducted an on-board transit survey in 1988.
1990 Household Travel Survey
This survey was budgeted at $75,000 for 1,000 households. Also, proposed are a CBD cordon, external cordon surveys, and extensive 24-hour traffic counts (budgeted at about $90,000). H-GAC may participate in the National Personal Transportation Survey (NPTS) add-on program if a local funding source is found.
Miami (Metro Dade-MPO)
Household Travel Surveys
No household travel surveys were conducted from 1978 to 1988. On-board transit surveys, license plate surveys, and roadside interview surveys were conducted.
1989-1992 Household Travel Surveys
No household surveys are planned from 1989 to 1992.
Cleveland (Northeast Ohio Area Coordinating Agency)
1978 Household Travel Survey
Home interviews (not telephone) were made with 1,100 sample households. Used in mode-choice model updates, the survey was intended as a transit-rich supplement to the 1963 home interview survey (1963 surveyed 1 in 3 households). Also, transit trip tables were developed from an all-routes, on-board survey conducted by GCRTA in 1976 and 1986 (20 percent return rate; $60,000 to $70,000). The 1970 and 1980
Purvis
journey-to-work packages were used extensively in work trip model application (would desire an Ohio statewide package in 1990).
1989-1992 Household Travel Survey
Data will be collected in three phases: Phase I-fiscal year 1989 to 1990-at $30,000 for a needs assessment and questionnaire development. Phase II-fiscal year 1990 to 1991-to test sample survey, computer coding, and so forth at $60,000. Phase III-fiscal year 1991 to 1992-to conduct full sample (at least 2,000 sample households are desired). Phase III has not yet been budgeted. The survey will probably be conducted in 1992. Also, a 3-year work program for urban goods movement (UGM) may include a truck survey component. The last comprehensive truck-taxi and external cordon surveys were done in 1963.
Atlanta (Atlanta Regional Commission-ARC)
1980 Household Travel Survey
Horne interviews with completion of travel logs were done with 4,900 household samples at a cost of about $100,000. The data collected were: person travel by mode and purpose , availability of alternative modes , and choices being made; and an origin-destination subsample.
1990 Household Travel Survey
ARC plans to issue an RFP and let a contract this year to determine survey needs for 1990.
St. Louis (East-West Gateway Coordinating Council)
Household Travel Surveys
No household travel surveys were conducted from 1978 to 1988. The last home interview survey conducted in the St. Louis region was in 1965 and 1966.
1990 Household Travel Survey
The council is currently undertaking an in-house review of data needs with respect to 1990 data collection efforts. Activities are being coordinated with Missouri and Illinois State Departments of Transportation.
Seattle (Puget Sound Council of Governments-PSCOG)
1985-1988 Household Travel Surveys
The sample included 4,831 households at $97 ,500 contract costs plus $172,000 other costs. The surveys were Kitsap County, spring 1985 (783 households, $74,500 total costs); Seattle,
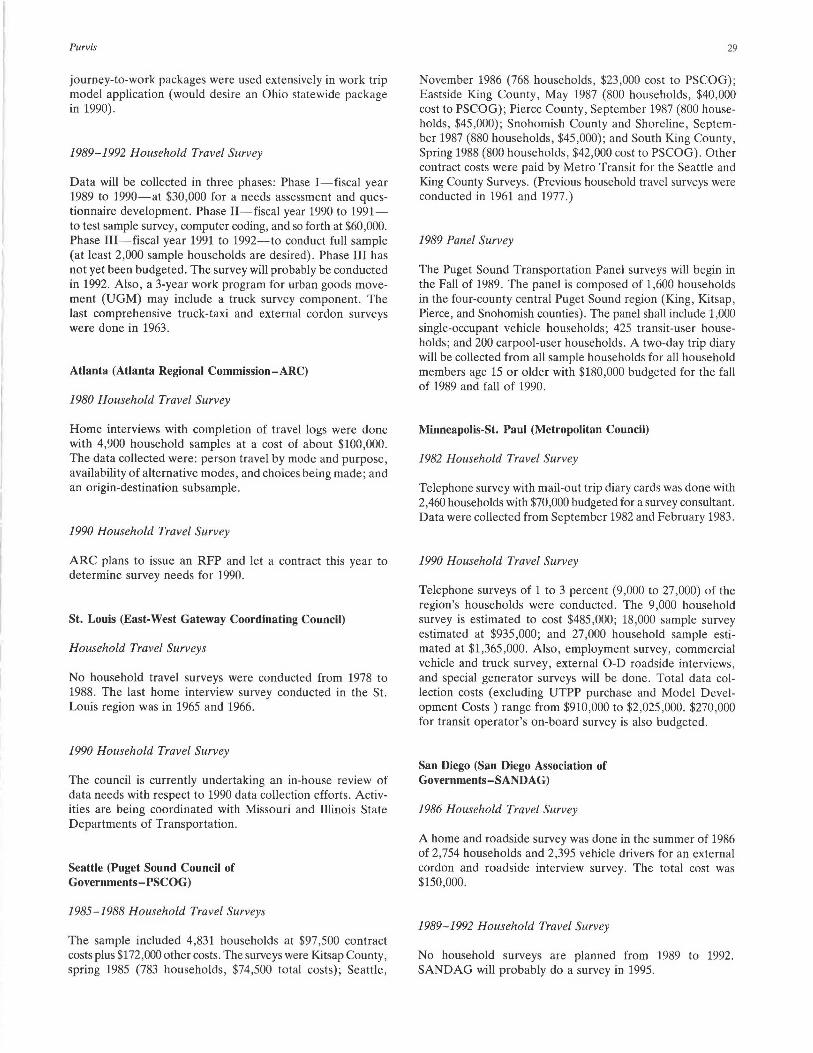
29
November 1986 (768 households, $23,000 cost to PSCOG); Eastside King County, May 1987 (800 households, $40,000 cost to PSCOG); Pierce County, September 1987 (800 households , $45,000); Snohomish County and Shoreline, September 1987 (880 households, $45,000) ; and South King County, Spring 1988 (800 households, $42,000 cost to PSCOG). Other contract costs were paid by Metro Transit for the Seattle and King County Surveys. (Previous household travel surveys were conducted in 1961 and 1977.)
1989 Panel Survey
The Puget Sound Transportation Panel surveys will begin in the Fall of 1989. The panel is composed of 1,600 households in the four-county central Puget Sound region (King, Kitsap, Pierce, and Snohomish counties). The panel shall include 1,000 single-occupant vehicle households; 425 transit-user households; and 200 carpool-user households . A two-day trip diary will be collected from all sample households for all household members age 15 or older with $180,000 budgeted for the fall of 1989 and fall of 1990.
Minneapolis-St. Paul (Metropolitan Council)
1982 Household Travel Survey
Telephone survey with mail-out trip diary cards was done with 2,460 households with $70,000 budgeted for a survey consultant. Data were collected from September 1982 and February 1983.
1990 Household Travel Survey
Telephone surveys of 1 to 3 percent (9 ,000 to 27 ,000) of the region's households were conducted. The 9,000 household survey is estimated to cost $485,000; 18,000 sample survey estimated at $935,000; and 27,000 household sample estimated at $1,365,000. Also, employment survey, commercial vehicle and truck survey, external 0-D roadside interviews, and special generator surveys will be done. Total data collection costs (excluding UTPP purchase and Model Development Costs) range from $910,000 to $2,025,000. $270,000 for transit operator's on-board survey is also budgeted.
San Diego (San Diego Association of Governments-SAND AG)
1986 Household Travel Survey
A home and roadside survey was done in the summer of 1986 of 2,754 households and 2,395 vehicle drivers for an external cordon and roadside interview survey. The total cost was $150,000.
1989-1992 Household Travel Survey
No household surveys are planned from 1989 to 1992. SANDAG will probably do a survey in 1995.
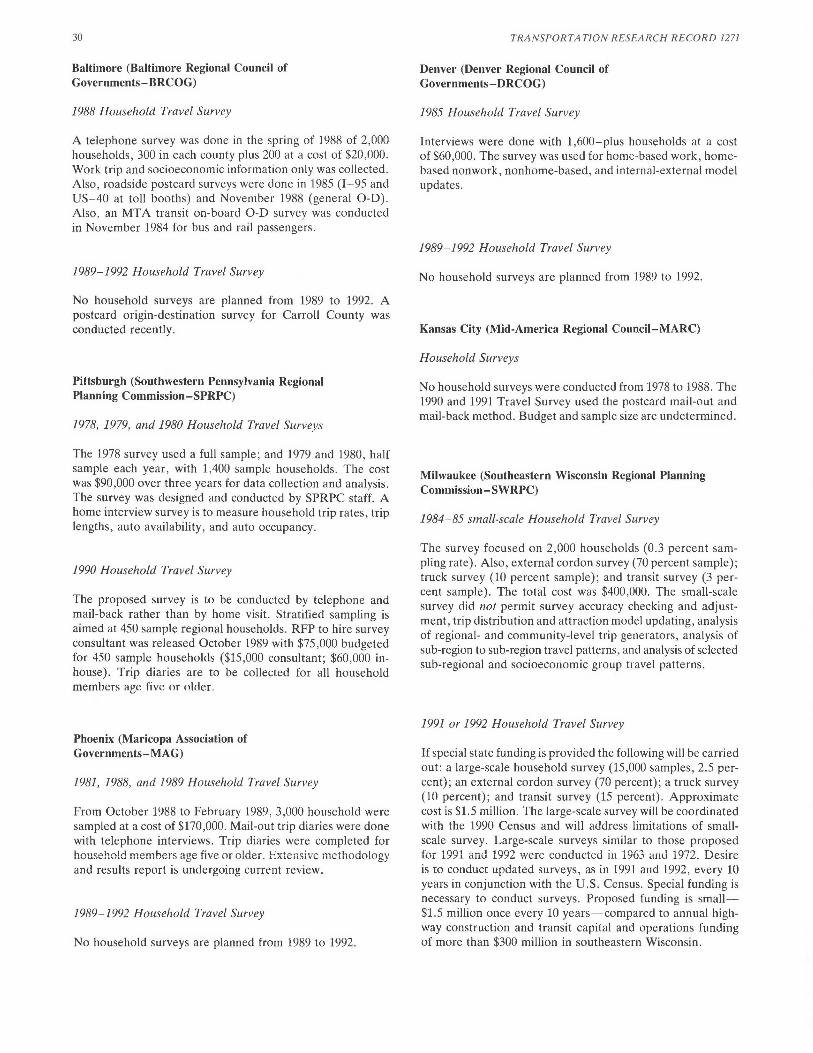
30
Baltimore (Baltimore Regional Council of Governments-BR COG)
1988 Household Travel Survey
A telephone survey was done in the spring of 1988 of 2,000 households, 300 in each county plus 200 at a cost of $20,000. Work trip and socioeconomic information only was collected. Also, roadside postcard surveys were done in 1985 (I - 95 and US-40 at toll booths) and November 1988 (general 0-D). Also, an MTA transit on-board 0-D survey was conducted in November 1984 for bus and rail passengers.
1989-1992 Household Travel Survey
No household surveys are planned from 1989 to 1992. A postcard origin-destination survey for Carroll County was conducted recently.
Pittsburgh (Southwestern Pennsylvania Regional Planning Commission-SPRPC)
1978, 1979, and 1980 Household Travel Surveys
The 1978 survey used a full sample; and 1979 and 1980, half sample each year, with 1,400 sample households. The cost was $90,000 over three years for data collection and analysis. The survey was designed and conducted by SPRPC staff. A home interview survey is to measure household trip rates, trip lengths, auto availability, and auto occupancy.
1990 Household Travel Survey
The proposed survey is to be conducted by telephone and mail-back rather than by home visit. Stratified sampling is aimed at 450 sample regional households. RFP to hire survey consultant was released October 1989 with $75,000 budgeted for 450 sample households ($15,000 consultant; $60,000 inhouse). Trip diaries are to be collected for all household members age five or older.
Phoenix (Maricopa Association of' Governments-MAG)
1981 , 1988, and 1989 Household Travel Survey
From October 1988 to February 1989, 3,000 household were sampled at a cost of $170,000. Mail-out trip diaries were done with telephone interviews. Trip diaries were completed for household members age five or older. Extensive methodology and results report is undergoing current review.
1989-1992 Household Travel Survey
No household surveys are planned from 1989 to 1992.
TRA NSPORTA TION RESEARCH R ECORD 1271
Denver (Denver Regional Council of Governments-DR COG)
1985 Household Travel Survey
Interviews were done with 1,600-plus households at a cost of $60,000. The survey was used for home-based work, homebased nonwork, nonhome-based, and internal-external model updates.
1989-1992 Household Travel Survey
No household surveys are planned from 1989 to 1992.
Kansas City (Mid-America Regional Council-MARC)
Household Surveys
No household surveys were conducted from 1978 to 1988. The 1990 and 1991 Travel Survey used the postcard mail-out and mail-back method. Budget and sample size are undetermined.
Milwaukee (Southeastern Wisconsin Regional Planning Commissiun-SWRPC)
1984-85 small-scale Household Travel Survey
The survey focused on 2,000 households (0.3 percent sampling rate). Also , external cordon survey (70 percent sample); truck survey (10 percent sample); and transit survey (3 percent sample). The total cost was $400,000. The small-scale survey did not permit survey accuracy checking and adjustment , trip distribution and attraction model updating, analysis of regional- and community-level trip generators, analysis of sub-region to sub-region travel patterns, and analysis of selected sub-regional and socioeconomic group travel patterns.
1991 or 1992 Household Travel Survey
If special state funding is provided the following will be carried out: a large-scale household survey (15,000 samples, 2.5 percent); an external cordon survey (70 percent) ; a truck survey (10 percent); and transit survey (15 percent). Approximate cost is $1.5 million. The large-scale survey will be coordinated with the 1990 Census and will address limitations of smallscale survey. Large-scale surveys similar to those proposed for 1991 and 1992 were conducted in 1963 and 1972. Desire is to conduct updated surveys, as in 1991 and 1992, every 10 years in conjunction with the U.S. Census. Special funding is necessary to conduct surveys. Proposed funding is small$1.5 million once every 10 years-compared to annual highway construction and transit capital and operations funding of more than $300 million in southeastern Wisconsin.
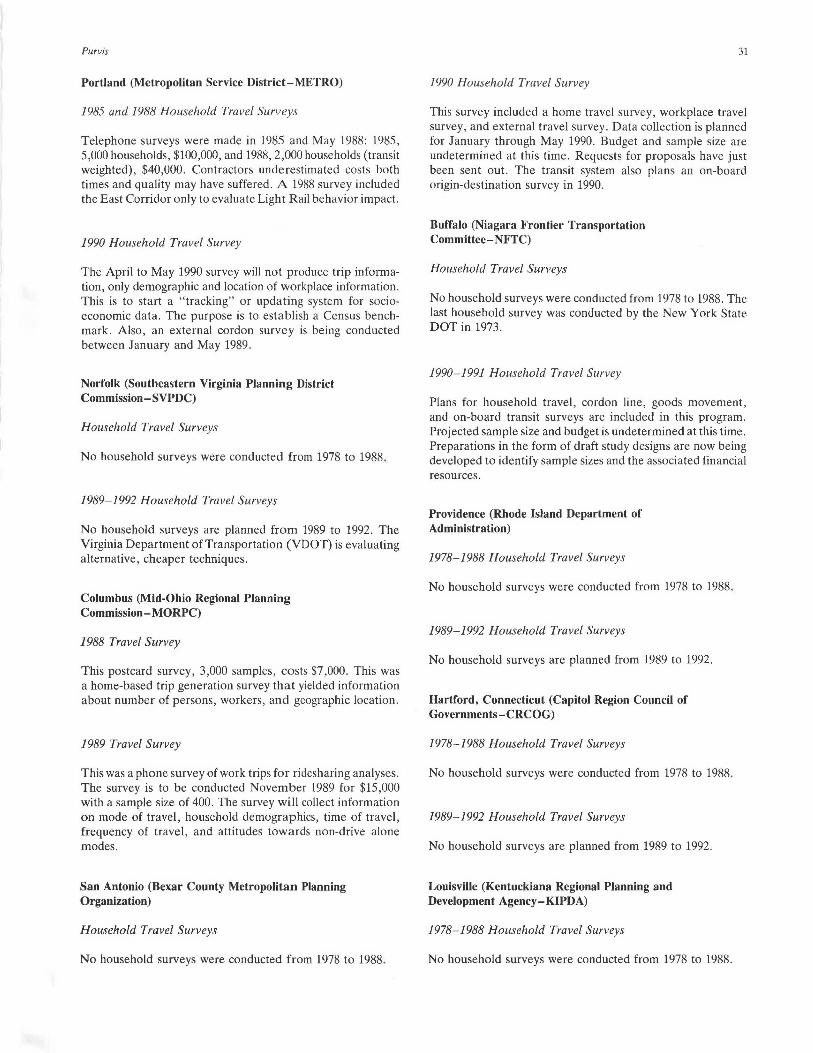
Purvis
Portland (Metropolitan Service District-METRO)
1985 and 1988 Household Travel Surveys
Telephone surveys were made in 1985 and May 1988: 1985, 5,000 households, $100,000, and 1988, 2,000 households (transit weighted) , $40,000. Contractors underestimated costs both times and quality may have suffered . A 1988 survey included the East Corridor only to evaluate Light Rail behavior impact.
1990 Household Travel Survey
The April to May 1990 survey will not produce trip information, only demographic and location of workplace information. This is to start a "tracking" or updating system for socioeconomic data. The purpose is to establish a Census benchmark. Also, an external cordon survey is being conducted between January and May 1989.
Norfolk (Southeastern Virginia Planning District Commission-SVPDC)
Household Travel Surveys
No household surveys were conducted from 1978 to 1988.
1989-1992 Household Travel Surveys
No household surveys are planned from 1989 to 1992. The Virginia Department of Transportation (VDOT) is evaluating alternative, cheaper techniques.
Columbus (Mid-Ohio Regional Planning Commission-MORPC)
1988 Travel Survey
This postcard survey, 3,000 samples , costs $7,000. This was a home-based trip generation survey that yielded information about number of persons, workers, and geographic location.
1989 Travel Survey
This was a phone survey of work trips for ridesharing analyses. The survey is to be conducted November 1989 for $15,000 with a sample size of 400. The survey will collect information on mode of travel, household demographics, time of travel, frequency of travel, and attitudes towards non-drive alone modes.
San Antonio (Bexar County Metropolitan Planning Organization)
Household Travel Surveys
No household surveys were conducted from 1978 to 1988.
31
1990 Household Travel Survey
This survey included a home travel survey, workplace travel survey, and external travel survey. Data collection is planned for January through May 1990. Budget and sample size are undetermined at this time. Requests for proposals have just been sent out. The transit system also plans an on-board origin-destination survey in 1990.
Buffalo (Niagara Frontier Transportation Committee-NFTC)
Household Travel Surveys
No household surveys were conducted from 1978 to 1988. The last household survey was conducted by the New York State DOT in 1973.
1990-1991 Household Travel Survey
Plans for household travel, cordon line , goods movement, and on-board transit surveys are included in this program. Projected sample size and budget is undetermined at this time. Preparations in the form of draft study designs are now being developed to identify sample sizes and the associated financial resources.
Providence (Rhode Island Department of Administration)
1978-1988 Household Travel Surveys
No household surveys were conducted from 1978 to 1988.
1989-1992 Household Travel Surveys
No household surveys are planned from 1989 to 1992.
Hartford, Connecticut (Capitol Region Council of Governments-CR COG)
1978-1988 Household Travel Surveys
No household surveys were conducted from 1978 to 1988.
1989-1992 Household Travel Surveys
No household surveys are planned from 1989 to 1992.
Louisville (Kentuckiana Regional Planning and Development Agency-KIPDA)
1978-1988 Household Travel Surveys
No household surveys were conducted from 1978 to 1988.
32 TRANSPORTATION RESEARCH RECORD 1271
1989-1992 Household Travel Surveys Harrisburg (Tri-County Regional Planning ~~~~~~~~~~~~~~~~~~~~~~~~~~~~~--\,;ommissio1o+-~~~~~~-
No household surveys are planned from 1989 to 1992.
Tucson (Arizona DOT-Pima Association of Governments-ADOT-PAGTPD)
1978-1988 Household Travel Surveys
No household surveys were conducted from 1978 to 1988.
1989 Household Travel Survey
The survey will be conducted in the fall of 1989. The survey will collect travel logs of 1,000 sample households. The budget is $176,000.
Toledo (Toledo Metropolitan Area Council of Governments-TMACOG)
1978-1988 Household Travel Surveys
No household surveys were conducted from 1978 to 1988.
1989-1992 Household Travel Surveys
No household surveys are planned from 1989 to 1992. In fiscal years 1989, 1990, and 1991. TMACOG will be collecting other information and data on 1990 base year. Included are aerial photos, traffic counts, cordonline counts, transit ridership survey, and employment information.
1978-1988 Household Travel Surveys
No household surveys were conducted for 1978-1988.
1989-1992 Household Travel Surveys
No household surveys are planned from 1989 to 1992.
Springfield, Massachusetts (Pioneer Valley Planning Commission)
1978-1988 Household Travel Surveys
No household surveys were conducted from 1978 to 1988.
1989-1992 Household Travel Surveys
No household surveys are planned from 1989 to 1992.
New Haven (South Central Regional Council of Governments)
1978-1988 Household Travel Surveys
No household surveys were conducted from 1978 to 1988.
1989-1992 Household Travel Surveys
No household surveys are planned from 1989 to 1992.