survey on fdmn aspirations, perception and influence agents
TRANSCRIPT

2
Sample Survey on
FDMN Aspirations, Perception and Influence Agents
Dated:January2018.
by
ResearchandEvaluationDivision(RED),BRAC
Inpartnershipwith
AmnestyInternational

3
4
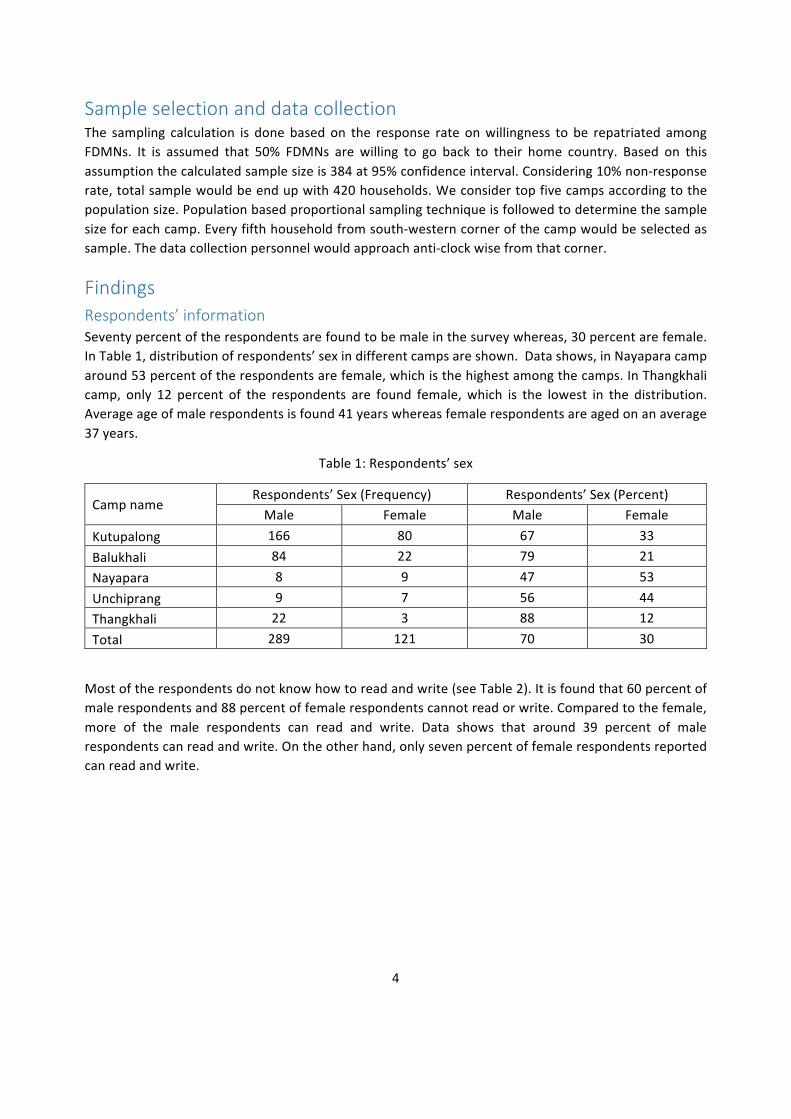
SampleselectionanddatacollectionThe sampling calculation is done based on the response rate onwillingness to be repatriated amongFDMNs. It is assumed that 50% FDMNs are willing to go back to their home country. Based on thisassumptionthecalculatedsamplesizeis384at95%confidenceinterval.Considering10%non-responserate,totalsamplewouldbeendupwith420households.Weconsidertopfivecampsaccordingtothepopulationsize.Populationbasedproportionalsamplingtechniqueisfollowedtodeterminethesamplesizeforeachcamp.Everyfifthhouseholdfromsouth-westerncornerofthecampwouldbeselectedassample.Thedatacollectionpersonnelwouldapproachanti-clockwisefromthatcorner.
FindingsRespondents’informationSeventypercentoftherespondentsarefoundtobemaleinthesurveywhereas,30percentarefemale.InTable1,distributionofrespondents’sexindifferentcampsareshown.Datashows,inNayaparacamparound53percentoftherespondentsarefemale,whichisthehighestamongthecamps.InThangkhalicamp, only 12 percent of the respondents are found female,which is the lowest in the distribution.Averageageofmalerespondentsisfound41yearswhereasfemalerespondentsareagedonanaverage37years.
Table1:Respondents’sex
CampnameRespondents’Sex(Frequency) Respondents’Sex(Percent)Male Female Male Female
Kutupalong 166 80 67 33Balukhali 84 22 79 21Nayapara 8 9 47 53Unchiprang 9 7 56 44Thangkhali 22 3 88 12Total 289 121 70 30
Mostoftherespondentsdonotknowhowtoreadandwrite(seeTable2).Itisfoundthat60percentofmalerespondentsand88percentoffemalerespondentscannotreadorwrite.Comparedtothefemale,more of the male respondents can read and write. Data shows that around 39 percent of malerespondentscanreadandwrite.Ontheotherhand,onlysevenpercentoffemalerespondentsreportedcanreadandwrite.

5
Table2:Literacystatusoftherespondents
SexPercent
Read Write Both None TotalMale 0 1 39 60 100Female 5 0 7 88 100
HouseholdinformationA total of 410 FDMNhouseholds are surveyed in six camps. Table 3 shows campwisedistributionofsamplehouseholds.Around60percentoftotalsamplehouseholdsliveinKutupalongcamp,whichisthehighest among six camps.Data also shows, around26percent samplehouseholds are fromBalukhalicamp,whichisthesecondhighest.Apartfromthat,sixpercenthouseholdsliveinThangkhalicampandaroundfourpercenthouseholdsliveineachofNayaparaandUnchiprangcamps.Averagehouseholdsizeisfound6.3inthesurvey.
Table3:Campwisedistributionofsamplehouseholds
Campname Frequency PercentKutupalong 246 60Balukhali 106 26Nayapara 17 4Unchiprang 16 4Thangkhali 25 6Total 410 100
Table4showsarrivalyearsofsamplehouseholdsinBangladesh.Datashows,FDMNhouseholds,livinginthecampsinBangladesh,firstcamein1992.Aroundthreepercentofthehouseholdsreportedthattheyarrived in Bangladesh in 1992. Apart from that, according to data, around five percent householdsreported2012astheirarrivalyearandsixpercenthouseholdsarrivedinBangladeshin2016.Mostofthehouseholds,whichisaround86percent,enteredintoBangladeshaftertheMyanmarmilitaryinsurgentsinAugustof2017.
Table4:ArrivalyearofsamplehouseholdsinBangladesh
Arrivalyear Frequency Percent1992 11 32012 20 52016 25 62017(afterAugust) 354 86Total 410 100

6
Samplehouseholdswereresidedindifferentdistricts inMyanmar,however,mostofthem(around85percent)livedinMuangdawdistrict(seeTable5).Apartfromthis,datashowsthataboutsevenpercentofsamplehouseholdslivedinButthiduangdistrict.AroundonepercentsamplehouseholdscamefromRatheduangdistrictandeightpercentcamefromotherdifferentdistrictsofMyanmar.Itisworthtonotethatbeforeleavingtheirhomedistrictstheiraveragehouseholdsizewas7.5.
Table5:HomedistrictofsamplehouseholdsinMyanmar
HomedistrictinMyanmarArrivalyear
Total Percent1992 2012 2016 2017
Muangdaw 1 9 18 320 348 84.9Butthiduang 5 3 2 18 28 6.8Ratheduang 0 0 2 0 2 0.5Others 5 8 3 16 32 7.8Total 11 20 25 354 410 100.0
Table6presentstheoccupationaldistributionofsamplehouseholds.Agriculturewasthemostpreferredoccupationamongsamplehouseholds.Aroundhalfofthem(45percent)choseagricultureasthemainoccupationofhousehold.About15percenthouseholds reportedbusinessofnon-food itemwas theirmain occupation in Myanmar. Apart from that, business of food items (nine percent), fishing (ninepercent),day-labourer (eightpercent), andprivate service (threepercent) includingotherswere theirmainoccupations.
Table6:Households’mainoccupationatMyanmar
Mainoccupation Frequency PercentAgriculture 183 45Fishing 36 9Daylabourer 31 8Business(Food) 37 9Business(non-food) 63 15Craftsmanship 1 0Privateservice 11 3Govt.service 3 1Mason 10 2Others 35 9Total 410 100
AveragemonthlyincomeofsamplehouseholdsinMyanmarwas1,088,428Kyat(USD805)1.InTable7,data shows that householdswhich leftMyanmar in 1992 earned 611,091 Kyat (USD452) permonth.Sample households which left Myanmar in 2012 and 2016 earned significantly higher in a monthcomparedtotheothers.AveragemonthlyincomeofsamplehouseholdswhicharrivedBangladeshin2012
11USD=1351Kyat.Ref.:www.xe.com.Dated:8January2018.

7
and 2016 are 2,715,500 Kyat (USD 2,009) and 2,499,733 Kyat (USD 1,850), respectively. SamplehouseholdswhicharrivedBangladeshin2017reportedtheiraveragemonthlyincomeinMyanmarwas1,088,428Kyat(USD805).
Table7:MonthlyincomeofsamplehouseholdsinMyanmar2
Arrivalyear MeanIncome(Kyat) MeanIncome(USD)1992 611,091 4522012 2,715,500 2,0092016 2,499,733 1,8502017(afterAugust) 911,667 675Total 1,088,428 805
Table8presentsthemonetaryvaluationofpropertylossofsamplehouseholds.Itisobservedfromdatathatonanaveragehouseholdslosttheirpropertyworthof51,073,732Kyat(USD37,795).
Table8:LossofpropertyinMyanmarduetothemilitaryinsurgents
Arrivalyear Meanloss(Kyat) Meanloss(USD)1992 13,775,455 10,1942012 9,355,000 6,9232016 100,472,000 74,3492017(afterAugust) 51,101,130 37,815Totalsample 51,073,732 37,795
Despitetheproperty loss,around19percentofsamplehouseholdsreportedthatat leastoneoftheirhouseholdmemberswaskilledinMyanmarduringtheatrocitybeforefleeingtoBangladesh(seeTable9). Apart from this, about half of sample households (48 percent) reported that at least one of theirhouseholdmemberswasphysicallytorturedduringthemilitaryinsurgents.Mostimportanttonotethat,nineoutofhundredhouseholdsreportedatleastoneoftheirfemalehouseholdmemberswasrapedinMyanmar.AccordingtothelatestfigurepublishedbyIOMinJanuary2018,theestimatedtotalnumberof Rohingya in Cox’s Bazaar to be 867,5003. Considering the estimated household size 6.25 from thissurveythereshouldbearound138,800householdsarecurrentlylivingindifferentcampsinBangladesh.So,itcanbesaidthatin26,372householdslostatleastoneoftheirhouseholdmembers,membersof66,624 households were physically tortured, and at least one female member from each of 12,492householdswererapedduringthemilitarycrackdowninMyanmar.
Table9:Householdmemberswerekilled
Arrivalyear Yes(percent) No(Percent) TotalN1992 0 100 112012 15 85 20
2Incomespresentedinthetablearenotinflationadjusted.3See:https://iom.org.bd/news/rohingya-arrivals-bangladesh-hit-655000-winter-weather-brings-new-shelter-health-challenges/

8
2016 16 84 252017(afterAugust) 19 81 354Total 19 81 410
PresentsituationincampsItisnotedearlierthat,onanaveragethereare6membersineachhouseholdlivinginthecampsinCox’sBazar.Eightyeightpercentofsurveyedhouseholdsreportedthattheyarehappyorsomewhathappywiththe current living condition in their camps (see Table 10). Twelve percent household expressed theirdissatisfaction about camps’ living condition. Data shows that, dissatisfaction is comparatively higheramong the households who arrived Bangladesh in 1992. More of the newer households expressedsatisfactionregardingcamps’livingcondition.
Table10:Perceptionaboutcamps’livingcondition
Arrivalyear Happy(%) Somewhathappy(%) Nothappy(%)1992 18.2 36.4 45.52012 45.0 50.0 5.02016 48.0 44.0 8.02017(afteraugust) 59.6 29.1 11.3Total 57.1 31.2 11.7
This surveycollectedaveragemonthly incomeofhouseholds.Householdsearnmainly fromreliefandsomepettyjobsaroundthehostcommunities.Datashowsthathouseholds’averagemonthlyincomeis4,248BDT(USD51)4.Around76percentofmonthlyincomecomesfromreliefandrest24percentcomesfrommembers’ jobs. However, only 23 percent of sample households reported that currentmonthlyincomeisadequatetolivewell(seeTable11).
Table11:Perceptionaboutincomeadequacy
Incomeadequacy Frequency PercentYes 96 23.4No 314 76.6Total 410 100.0
Seventysevenpercentofsamplehouseholdsfeelthatcurrentconditionofthecampswillbeimprovinggradually.Theyopinedthatprovidingmorerelief,improvebasicandhealthservices,openingschoolsfortheirkids,andcreatingjobopportunitiescanimprovetheircurrentlivingconditionsignificantly(seeTable12).
4USD1=83.26BDT.Ref.:www.xe.com.Dated:9January2018.

9
Table12:Households’perceptiononhowcamps’livingconditioncanbeimproved
Strategy PercentMorerelief 52Jobopportunitiesinthecamp 10Improvedbasicservices 56Improvedhealthservices 50Openedschools 24Expandedcooperationfromthehost 10
Others 26
RepatriationMostofthesamplehouseholdsdonotdiscussabouttheirreturnstotheMyanmar(seeTable13).Datashows that around 43 percent of the households do not discuss about repatriation. Only 18 percenthouseholdsarefoundtobediscussingaboutrepatriation.
Table13:Frequencyofdiscussionaboutrepatriationamonghouseholds
Frequencyofdiscussion PercentOften 18Sometimes 39No 43Total 100
Anotherdata shows,onlyhalfof samplehouseholdsareawareabout the ‘repatriationdeal’betweenMyanmarandBangladesh.Theylearneditfromdifferentsourceslikefriendsorrelatives,Majhi,andsocialmedialikeYouTube(table14).
Table14:Sourcesofinformationabouttherepatriationdeal
Sourceofinformation PercentFromMajhi 14FromFriend/Relatives 68FromImam 3FromNewspaper 3FromYouTube/Radio/etc. 23Others 20
Onlyaboutfourpercentofsamplehouseholdssaid‘yes’replyingthequestion‘areyouplanningtoreturnsoon?’ (see Table 15). Sixty four percent opined that they plan to return back toMyanmar if someconditionslikecitizenship,securityofprotection,compensationforlosses,assuranceofjusticearemet(seeTable16).

10
On the other hand, which households do not want to repatriate are planning to setup their lives inBangladeshbygettingjobs,startnewbusiness,andsendtheirchildreninschools(seeTable17).However,abouthalfofthemdonothaveanyplanbuttostayinBangladesh.
Table15:Perceptionaboutrepatriationplan
Frequency PercentYes 15 3.7Conditionally 263 64.2Notsure 59 14.4No 73 17.8Total 410 100.0
Table16:EncouragingfactorsregardingFDMNhouseholdsforrepatriation
Encouragingfactor PercentCitizenship 87Compensationforloss 52Assuranceofjustice 37FreemovementandPassport 33SecurityandProtection 54Livelihoodsupport 14Others 26
Table17:Planningofhouseholdswhichhavenoplantorepatriate
Plan PercentIhopetogetajob 31Iwanttolearnnewskills 3Iplantostartabusiness 11Iplantosendmychildrentoschool 11Ihavenoplan 46Others 20
DataanalysesshowthathouseholdswithcomparativelymuchhighermonthlyincomeinMyanmarwantto repatriatewith expectation ofmeeting some conditions (presented in Table 16). AveragemonthlyincomeinMyanmarofrepatriationinterestedandnon-interestedhouseholdsarefoundtobe1,318,436Kyat(USD976)and604,015Kyat(USD447),respectively.Inadditiontothat,61percentofhouseholdswhicharrivedBangladeshbeforeAugust2017and67percentofhouseholdswhicharrivedBangladeshafterAugust2017want to repatriate.Apart from this, anoccupationwisedistributionof repatriationinterestedhouseholdsisgivenintheTable18.

11
Table18:Occupationwisedistributionofrepatriationinterestedhouseholds
OccupationRepatriationplan(percent)
Yes NoFrequency Percent Frequency Percent
Agriculture 118 64 65 36Fishing 28 78 8 22Daylabourer 20 64 11 36Business(Food) 27 73 10 27Business(non-food) 42 67 21 33Craftsmanship 1 100 0 0Privateservice 6 55 5 45Govt.service 2 67 1 33Mason 7 70 3 30Others 28 80 7 20
Households,whichhaveplantorepatriateuponmeetingsomeconditions(seeTable16),areaskedtoexpress their perceptionwhether these conditionwill bemet or not. Interestingly, only nine percenthouseholdsthinkthattheseconditionmaymeetinMyanmar.Ontheotherhand,66percentthinkthattheseconditionwillnotbemet.Twentyfivepercenthouseholdsdonothaveanyidea.
HouseholdsrepliedthatwhenrepatriationmomentwillappeartheywilldiscusswithMajhi,familyandfriendsincampandMyanmar,andRohingyaleadersincludingotherstotakedecision(seeTable19).
Table19:Withwhomhouseholdwilldiscussaboutrepatriation
PercentMajhi 53.9Family/Friendsinthecamp 37.6Family/FriendsinMyanmar 5.9Imam 4.2Rohingyaleaders 15.1Aidworkers 6.8Others 19.0
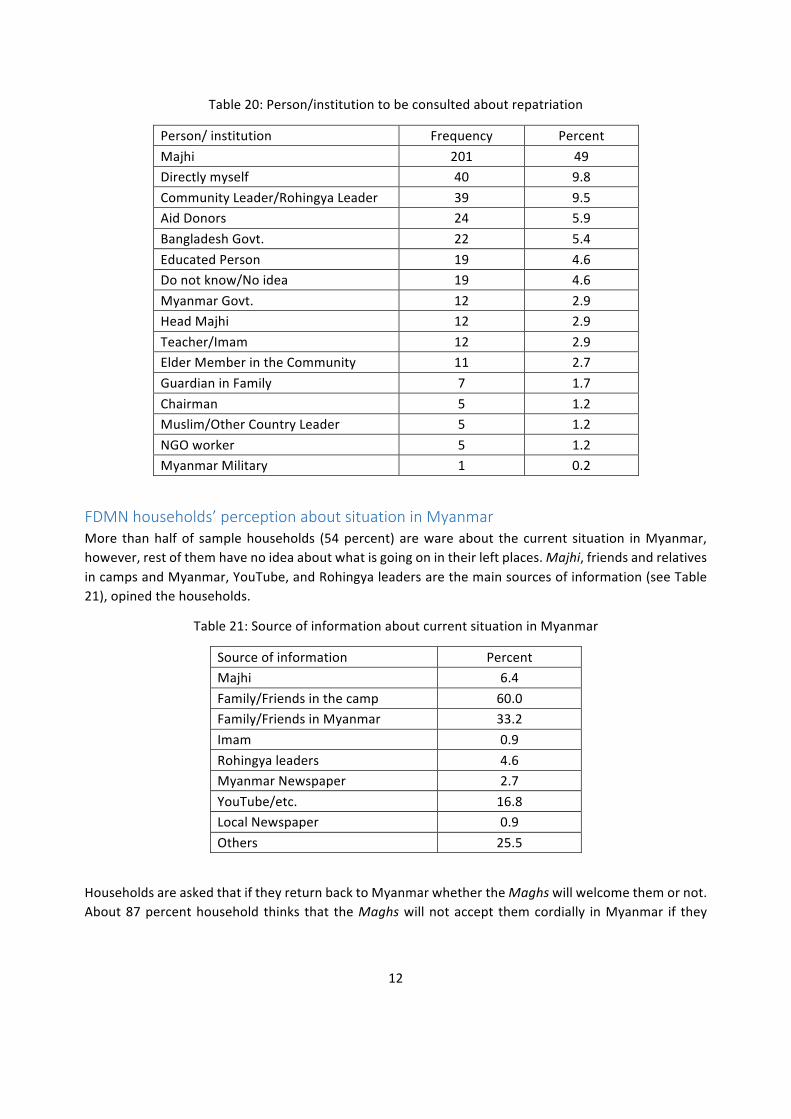
Answeringthequestion‘iftheGoB/UNwantstoconsultaboutyourreturninMyanmarwhoshouldtheyconsultto’,samplehouseholdsnoteddifferentnameswhicharepresentedintheTable20.Itisfoundthatthe householdswill consult about repatriationwithMajhi, own self, community/Rohingya leader, aiddonors,GoBincludingothers.
12
Table20:Person/institutiontobeconsultedaboutrepatriation
Person/institution Frequency PercentMajhi 201 49Directlymyself 40 9.8CommunityLeader/RohingyaLeader 39 9.5AidDonors 24 5.9BangladeshGovt. 22 5.4EducatedPerson 19 4.6Donotknow/Noidea 19 4.6MyanmarGovt. 12 2.9HeadMajhi 12 2.9Teacher/Imam 12 2.9ElderMemberintheCommunity 11 2.7GuardianinFamily 7 1.7Chairman 5 1.2Muslim/OtherCountryLeader 5 1.2NGOworker 5 1.2MyanmarMilitary 1 0.2
FDMNhouseholds’perceptionaboutsituationinMyanmarMore thanhalfof samplehouseholds (54percent) arewareabout the current situation inMyanmar,however,restofthemhavenoideaaboutwhatisgoingonintheirleftplaces.Majhi,friendsandrelativesincampsandMyanmar,YouTube,andRohingyaleadersarethemainsourcesofinformation(seeTable21),opinedthehouseholds.
Table21:SourceofinformationaboutcurrentsituationinMyanmar
Sourceofinformation PercentMajhi 6.4Family/Friendsinthecamp 60.0Family/FriendsinMyanmar 33.2Imam 0.9Rohingyaleaders 4.6MyanmarNewspaper 2.7YouTube/etc. 16.8LocalNewspaper 0.9Others 25.5
HouseholdsareaskedthatiftheyreturnbacktoMyanmarwhethertheMaghswillwelcomethemornot.About87percenthousehold thinks that theMaghswillnotaccept themcordially inMyanmar if they

13
returnback.Tenpercentof samplehouseholds isunsureabout theattitudeofMaghsandonly threepercentthinksthattheMaghsmaywelcometheminMyanmar.
Mostofthehouseholds(89percent)donothopethattheycouldreturntotheirnormallifeiftheygetchances to return back in Myanmar. Security threats, atrocity by Myanmar military, hostility ofneighbours,anddestructionofassetsandlivelihoodsarethemainimpedimentstoliveanormallifeinMyanmar(seeTable22).
Table22:MajorimpedimentstoliveanormallifeinMyanmar
Impediments PercentHostileneighbours 48.6Hostilegovernmentagents 58.2Destructionofassets/Livelihood 30.1Morerestrictiontobasicservices 15.0Securitythreats 71.9Others 19.1