survival enumerationofthe fecal indicators …aem.asm.org/content/50/2/468.full.pdf · three liters...
TRANSCRIPT

APPLIED AND ENVIRONMENTAL MICROBIOLOGY, Aug. 1985, p. 468-476 Vol. 50, No. 20099-2240/85/080468-09$02.00/0Copyright © 1985, American Society for Microbiology
Survival and Enumeration of the Fecal Indicators Bifidobacteriumadolescentis and Escherichia coli in a Tropical
Rain Forest WatershedMARTHA CARRILLO,t EDDIE ESTRADA,t AND TERRY C. HAZEN*
Microbial Ecology Laboratory, Department of Biology, University ofPuerto Rico, Rio Piedras, Puerto Rico 00931
Received 28 January 1985/Accepted 10 May 1985
The density of Bifidobacterium spp., fecal coliforms, Escherichia coli, and total anaerobic bacteria, acridineorange direct counts, percentages of total bacterial community activity and respiration, and 12 physical andchemical parameters were measured simultaneously at six sites for 12 months in the Mameyes River rain forestwatershed, Puerto Rico. The densities of all bacteria were higher than those reported for uncontaminatedtemperate rivers, even though other water quality parameters would indicate that all uncontaminated siteswere oligotrophic. The highest densities for all indicator bacteria were at the site receiving sewage effluent;however, the highest elevation site in the watershed had the next highest densities. Correlations betweenbacterial densities, nitrates, temperature, phosphates, and total phosphorus indicated that all viable countswere related to nutrient levels, regardless of the site sampled. In situ diffusion chamber studies at two differentsites indicated that E. coli could survive, remain physiologically active, and regrow at rates that weredependent on nutrient levels of the ambient waters. Bifidobacterium adolescentis did not survive at either sitebut did show different rates of decline and physiological activity at the two sites. Bifidobacteria show promiseas a better indicator of recent fecal contamination in tropical freshwaters than E. coli or fecal coliforms,however, the YN-6 medium did not prove to be effective for enumeration of bifidobacteria. The coliformmaximum contaminant levels for assessing water usability for drinking and recreation appear to be unworkablein tropical freshwaters.
Since 1914, coliforms have been used as the standardindicator of recent fecal contamination in the United States(1). The coliform has proved to be an acceptable indicatorunder most conditions in temperate freshwater. However,more and more, the "maximum contaminant levels"(MCL)established for temperate areas have been accepted withoutquestion by tropical nations. Despite this trend, there is agrowing body of evidence that the underlying assumptions ofthe assays being used are not valid in tropical climates (4).The waters of Puerto Rico are believed to be grossly
contaminated by human waste. The U.S. Water ResourcesCouncil reported that 96% of all sampling stations on 26rivers in Puerto Rico demonstrated violations of the coliformstandards (31). As proof of the contamination problem, theycite 7,800 cases of acute gastroenteritis that occurred theprevious year, 1977, in Comerio, Puerto Rico due to im-proper chlorination of drinking water. In fact, few epidemicslike this have occurred on the island in the last 10 years,despite the contamination indicated by the coliform assays.Other studies in tropical freshwater have shown that a highproportion of fecal coliform-positive isolates are of nonfecalorigin (4, 20). In Puerto Rico, less than 30% of the fecalcoliform-positive isolates from a variety of sites around theisland are identified as Escherichia coli (14, 16; T. C. Hazen,unpublished data). One such site is the Luquillo Experimen-tal Forest, in which the upper parts of some of the forestwatersheds are known to have high fecal coliform counts inthe absence of any identifiable fecal source (14).Recent studies have suggested that bifidobacteria may be
* Corresponding author.t Present address: Department of Microbiology, Ohio State Uni-
versity, Columbus, OH 43210.t Present address: School of Medicine, University of Puerto Rico,
San Juan, PR 00936.
an excellent candidate as an alternative indicator of fecalcontamination (9, 28). It is found in the gut of all humanswithin the first 6 days of neonatal life (24, 27). It also is oneof the dominant anaerobes in the gut of humans, typicallyreaching densities greater than 1010 cells per g of feces. Sincebifidobacteria are also obligate anaerobes, they are incapableof surviving in the oxygenated extraenteral environment. Arecently developed medium was reported to allow rapid andaccurate enumeration of bifidobacteria from environmentalsamples (28). Thus, it would seem that bifidobacteria wouldfit all criteria for a good indicator bacterium as described byBonde (4). The present study examines the distribution,density, and in situ survival of E. coli and Bifidobacteriumspp. in a tropical rain forest watershed in Puerto Rico.
MATERIALS AND METHODS
Study site. The Mameyes river watershed is on thenortheast corner of the island of Puerto Rico, lat. 18° 15' Nand long. 65° 45' W (Fig. 1). This watershed has a drainagearea of 27.3 km2 and a total length of 17.1 km (14). Annualaverage precipitation in the upper third ofthe watershed is 395cm. This area is classified as a cloud rain forest and isprotected as part of the Luquillo Experimental Forest, U.S.Forest. The middle third of the watershed is dominated byagricultural land and several housing projects that dump theirsewage into the Mameyes River. The lower third of thewatershed is dominated by two small towns which contributemunicipal, domestic, and light industry wastes to the river.The Mameyes River empties into the Atlantic Ocean near thelargest public beach in Puerto Rico, Luquillo. Average dailyattendance at Luquillo Beach exceeds 1,000 persons, withholiday crowds sometimes exceeding 10,000. Samples weretaken from 6 of 12 sites previously established andcharacterized in detail by Hazen and Aranda (14). These sites
468
on July 8, 2018 by guesthttp://aem
.asm.org/
Dow
nloaded from

FECAL INDICATORS IN TROPICAL WATERS 469
FIG. 1. Map showing location of study sites in Mameyes Riverwatershed, Puerto Rico.
were sampled seven different times during the course of 12consecutive months, beginning January 1983 with ca. 3 weeksbetween sampling. Previous studies have shown that thiswatershed exhibits no seasonal differences in water quality(14).Water quality. Seven water quality parameters were mea-
sured simultaneously with water collection for bacterialdensity. Dissolved oxygen, pH, air temperature, water tem-perature, and conductivity were measured in situ with a
model 4041 Hydrolab Surveyor (Hydrolab Corp., Austin,Tex.). Measurements for alkalinity and hardness were doneat the sampling site with Spectrokits and a mini-spectrophotometer (Bausch & Lomb, Inc., Rochester,N.Y.). Three liters of water were collected and divided intovarious bottles, and small amounts of the following preser-
vatives were added: sulfuric acid, zinc acetate, and mercuricchloride. Amber bottles were used for samples to be ana-lyzed for chlorophyll. All samples were then placed on icefor transport to the laboratory. The appropriately preservedsamples were then analyzed for the following parameters:nitrates plus nitrites, sulfates, phosphates (Pi), total phos-phorus, and chlorophyll a (using standard methods [2]; fordetails, see M. Carrillo, M.S. thesis, University of PuertoRico, Rio Piedras, 1983).
Bacteriological methods. Water samples for Bifidobacter-ium spp. analysis were collected by grab sampling slightlybelow the surface with sterile, 180-ml Whirl-Pak bags(NASCO, Ft. Wilkinson, Wis.). Samples were transportedto the laboratory at ambient temperature; we found this togive better results than transport on ice (M. Carrillo, unpub-lished data). The time from collection to analysis in thelaboratory never exceeded 5 h. Sample portions of 1, 10, 20,50, and 100 ml were filtered in triplicate with 0.45-p.m (poresize), 47-mm-diameter type GN-6 membrane filters (Gelman
Instrument Co., Ann Arbor, Mich.). The 1-ml sample wasdiluted with filter-sterilized phosphate-buffered saline (pH 7)to give better spread on the filter. Each filter was then placedon YN-6 medium (28) in 47-mm, tight-fitting petri plates.YN-6 is a differential, selective medium for Bifidobacteriumspp. All media preparation, incubation, and enumerationwas as described by Resnick and Levin (28). A hot pin wasused to put several holes in the cover of each petri dish toallow gas exchange. The plates were incubated at 37°C for 48h under anaerobic conditions in BBL GasPak jars (BBLMicrobiology Systems, Cockeysville, Md.). After incuba-tion, colonies that were 1 to 2 mm in diameter, green,circular, smooth, and butyrous were considered presump-tive Bifidobacterium spp. Confirmation was based on gram-positive, bifid rod-shaped morphology, i.e., colonies werenoncatalase producing, nonnitrate reducing, nonmotile, andable to ferment lactose without gas production. Speciesidentification was confirmed by measuring amounts of aceticand lactic acid produced as by-products of glucose fermen-tation by gas chromatography (17). A model 3920 TCD gaschromatograph (The Perkin-Elmer Corp., Norwalk, Conn.)fitted with a Chromosorb 1000 stainless steel column(Supelco, Belafonte, Pa.) was used for determining carbo-hydrate fermentation patterns. The following reference cul-tures, obtained directly from American Type Culture Col-lection, were used as controls: Bifidobacterium adolescentisATCC 15703 and Bifidobacterium longum ATCC 15707.
Fecal coliform and E. coli counts were made from grabsamples collected in 180-ml Whirl-Pak bags and transportedto the laboratory on ice. Samples of 1, 10, and 100 ml werefiltered, with the 1-ml sample diluted with phosphate-buffered saline as before. Filtration was with 0.7-pum (poresize), 47-mm-diameter type HC membrane filters (MilliporeCorp., Bedford, Mass.). The filters were placed on mTECmedium (7) and incubated for 2 h at 35°C. After this period ofresuscitation, the plates were incubated at 44.5°C for 20 h.After incubation, yellow, yellow-green, and yellow-browncolonies were recorded as fecal coliforms (26). The count-able filters were transferred to petri dishes with pads satu-rated with urea to test for urease production (7). After 15 minof incubation, all yellow colonies were counted as presump-tive E. coli. Confirmation was with API 20E strips (AnalytabProducts, Plainview, N.Y.) and citrate utilization. A cultureof E. coli ATCC 11775 was used as a control for all mediaand tests.
Total anaerobe counts were made by collecting subsurfacewater in 180-ml Whirl-Pak bags and transporting them atambient temperature to the laboratory for analysis. Sampleswere diluted to 10 ml with anaerobic salt solution as de-scribed previously (6) to give effective concentrations of10-5, 10-3, 10-2, 10-1, and 1 ml. Diluted samples werefiltered through 0.45-,um (pore size), 47-mm-diameter typeHA membrane filters (Millipore), placed on supplementedanaerobic brain heart infusion agar (BBL), and incubated at25°C for 24 h, followed by incubation at 35°C for another 24h. All incubations were under anaerobic conditions withBBL GasPaks, as described by Daily et al. (6).
Cell activity, respiration, and total direct counts weredetermined by acridine orange direct counting (AODC) andthe respiring count technique of Zimmerman et al. (34). Tenmilliliters of water sample from each site was incubated with1 ml of 0.2% 2-(p-iodophenyl)-3(p-nitrophenyl)-5-phenyltetrazolium chloride (INT) for 30 min in the dark. Thereaction was stopped by fixing with 0.1 ml of 37% formalde-hyde. In the laboratory, samples were stained with acridineorange and filtered through 0.22-p.m (pore size), 47-mm-
VOL. 50, 1985
on July 8, 2018 by guesthttp://aem
.asm.org/
Dow
nloaded from

470 CARRILLO, ESTRADA, AND HAZEN
diameter, sudan black B-stained polycarbonate filters(Nuclepore Corp., Pleasanton, Calif.). Filters were exam-ined under oil immersion with a model 2071 epifluorescencemicroscope fitted with transmitted bright-field illumination(American Optical Corp., Buffalo, N.Y.). The total numberof bacteria was determined by counting all fluorescing cells.The percentage of active cells was determined by dividingthe number of red fluorescing cells by the total number offluorescing cells. The percentage of cells that were respiringwas determined by dividing fluorescing cells that also hadintracellular INT-formazan granules (when viewed bybright-field microscopy) by the total number of fluorescingcells.
Diffusion chamber studies. Pure cultures of B. adolescentis(isolated from a sewage outfall on the Mameyes River nearsite 9) were grown in peptone-yeast-glucose broth (DifcoLaboratories, Detroit, Mich.) at 37°C anaerobically for 48 h.Pure cultures of E. coli ATCC 11775 were grown in nutrientbroth at 37°C for 24 h. Cells were harvested by centrifugationand washed in sterile phosphate-buffered saline. The numberof cells per milliliter was determined with a model ZFCoulter Counter (Coulter Electronics, Hialeah, Fla.) andadjusted to 108 cells ml-'.The final bacteria suspension was placed into a sterile
diffusion chamber just before immersion at the study site.The chamber had a capacity of 100 ml and a total diffusionsurface area of 16,515 mm2, both of which are modifications(3, 15) of the MSU-DME chamber (22). The diffusion surfacefor this study was created by a 0.2-mm (pore size), 142-mm-diameter, nylon-reinforced Versapor membrane filter(Gelman Instrument Co.).Four chambers for each bacteria studied were suspended
0.5 m below the surface at sites 1 and 4 (Fig. 1). Samples (1ml) were taken with a sterile syringe from each chamber atregular intervals for 72 h. Half of each sample was immedi-ately fixed in 10% phosphate-buffered Formalin (pH 7) andrefrigerated for later reading with the Coulter Counter, asdescribed by Hazen and Esch (15). The other 0.5 ml wasincubated with INT in the dark for 30 min at the in situtemperature and then fixed with formaldehyde as describedabove. Later, these samples were enumerated for percentactivity, percent respiration, and AODC as described above.Data analysis. Programs developed on Apple II Plus and
IBM 370-148 computers were used for all statistical tests.Two-factor analysis of variance was used to test differencesbetween sites and times. Multiple correlation and regressionwere used to determine relationships between densities ofbacteria and water quality parameters. Heteroscedastic dataas determined by skew and kurtosis were made morehomoscedastic by transformation with log (x + 1). Anystatistical probability greater than or equal to 0.05 wasconsidered significant (33).
RESULTSWater quality. As reported in other studies (14; A. J.
Lopez-Torres, M.S. thesis, University of Puerto Rico, RioPiedras, 1982; N. Perez-Rosas, M.S. thesis, University ofPuerto Rico, Rio Piedras, 1983), water quality in theMameyes River watershed does not vary seasonally butrather as a function of catastrophic rainfalls which occurirregularly all year. Thus, variability in most of the parame-ters (e.g., water temperature) is less than 5% (Table 1). Ingeneral, there was a gradient in parameter concentrationsfrom the upper parts of the watershed to the lower parts.Water temperature, air temperature, and conductivity werelowest at site 1 and increased up to site 9. Sites 4, 5, and 9
Lz
0
4L)
.0
r-
Co
3
m)4)
.0
0'
4)
E-
v)
-4
+1
0
40
.24)
4)
su
4)
.0u
U
X4e
0.
H-
z
u
o0m
az0u
0,
wF
0,
I.qLLEz4
6c4)
.-0CO)
APPL. ENVIRON. MICROBIOL.
O "00-l r--l00 r- r--
+1 +1 +1 +1 +1 +1
^enmen dN ot
+l +1 +1 +1+1 +1o ') " emWn c
t 'ITOON
+l +1 +1 +1 +1 +1000a% 000 WI
000
x-- o " r H H
tl tl tl tl tl +l0+1 +1 +1 +1 +1 +1
000 a- ; "'I'IC 000 0%
N o%en tn ) cnoo.
0o 00 ON
+l +1 +1 +1 +1 +1Wf en~
CD O Ir en r-b
. .
+l +1 +1 +1 +1 +1
W) en00 W 0OO
C 0 00 en C r-4
-i-i-i -4
CD C0 e)00
~. . .
+1 +1+1 +1 +1+1
+1 +1 +1+1+1 +1
- -
l00'IT
+1 +1+1 +1 +1+1
Cl o o00
WlCl Cl Cl C+
+1 +1 +1 +1+1+1
T "it 00 0
m O 0
+1 +1+1 +1 +1+1
_N N. o
+l +1 +1 +1 +1 +1ON o o.0 Cl
r0 00%
+l Cl Cl Cl Cl Cl
+1 +1+1 +1 +1+1
en ON IR <o cn
r-4 114 '.0 N-
tl Cl Cl Cl Cl Cl
W N oo O o
"e4 W) ^ t- " r-
.4 .1 . . . .
tl en 'tl VI) tl- tl
& 0Q_ z <4) -
a-.0
0
co
' E
40.
4-2c
00
CQ 0
U4)Q-.
40
,.0
o.o0
0.<
H_ v<2E
£o -o.0 U
Ct o l^)40cn
hE.4'*_.4)000
0E4E
° 0S.0a-a' 0.
4) ,a- 0..-eoS Q
-40c.E,0
3) 0 @<oU @.0 C
032<4)cO .Z Z ;>C, a-4)
4Y;>)
20.yi
U40
243) ;
o ' 0.U<0v eW
on July 8, 2018 by guesthttp://aem
.asm.org/
Dow
nloaded from

FECAL INDICATORS IN TROPICAL WATERS 471
TABLE 2. Densities of bacteria and their ratios by siteaDensity (mean t 1 SE) of:
Site no.FC EC B TAC B/F B/E B/TA
1 1.3 ± 0.8 1.0 ± 0.7 5.6 ± 1.9 453.0 ± 44.9 11.3 ± 4.3 16.6 ± 7.5 24.4 ± 14.33 0.7 ± 0.2 0.3 ± 0.1 3.4 ± 1.4 9.5 ± 7.1 4.2 ± 1.6 22.7 ± 11.2 15.6 ± 13.94 0.2 ± 0.2 0.1 0.0 0.3 ± 0.1 1.2 ± 0.5 1.8 0.9 3.9± 1.9 6.2 ± 2.85 0.1 ± 0.0 0.1 + 0.0 0.6 ± 0.3 3.6 ± 2.0 3.5 ± 1.5 4.0 1.4 3.7 ± 2.57 1.9 ± 1.2 0.4 ± 0.2 1.3 ± 0.9 2.0 ± 0.6 2.1 ± 1.1 17.1 ± 15.3 12.0 ± 5.79 184.0 ± 87.0 134.0 ± 66.0 6.5 ± 1.6 126.0 ± 64.0 0.2 ± 0.1 0.4 ± 0.2 5.9 ± 3.5
a Abbreviations: FC, fecal coliform; EC, E. coli; B, bifidobacteria; TAC, total anaerobes x 102; B/F, bifidobacteria/fecal coliform; B/E, bifidobacteria/E. coli;and B/TA, bifidobacteria/total anaerobes x 10-3. All units are in CFU per milliliter.
had high values for alkalinity and hardness. Site 5 had thehighest pH, whereas sites 1 and 3 had the lowest pH. Site 9had the lowest concentration of dissolved oxygen and chlo-rophyll a but was high in phosphates, total phosphorus,nitrates plus nitrites, and sulfates. Site 9 receives effluentdirectly from a primary sewage treatment plant and thus wasthe most polluted, as indicated by water quality (Table 1).Site 1 had higher nitrates plus nitrites, phosphates, sulfates,and chlorophyll a concentrations than the sites immediatelybelow it in the watershed. Other studies by our laboratory(C. F. Aranda, M.S. thesis, University of Puerto Rico, RioPiedras, 1982) have shown that incident radiation is higher atsite 1 due to a less well-developed forest canopy.
Bacteria distribution and abundance. The highest densitiesof fecal coliforms, E. coli, and Bifidobacterium spp. werefound at site 9, the sewage point source (Table 2). However,site 1 had significantly higher densities for each of thesebacteria than the sites below it in the watershed, except forsite 9. In addition, site 1 had the highest density of totalanaerobes of any of the sites. The ratio of bifidobacteria to E.coli and the ratio of bifidobacteria to fecal coliform bacteriawas significantly lower at site 9 than any of the other sites.The ratios of bifidobacteria to total anaerobic bacteria werenot significantly different between sites. Direct counts ofbacteria increased through the watershed, with site 1 having
-J'I-
Uu
the lowest AODC and site 9 the highest. However, percentbacterial respiration as measured by INT was greatest at site1 (Table 1). Percent activity of the bacterial community wasnot significantly different between sites.A total of 116 presumptive Bifidobacterium spp. colonies
were isolated and analyzed; 105 (90.5%) were confirmed bymorphological and biochemical tests. Gas chromatographywas used to analyze 22 presumptive and biochemicallyconfirmed isolates; 86.2% of these were confirmed by the gaschromatograph method. Thus, the YN-6 medium gave 21.8%false-positives. All 20 presumptive negative colonies testedwere confirmed as negative; thus, YN-6 showed 0% false-negatives. The Mameyes River watershed showed the fol-lowing bifidobacteria species from the 105 isolates: B.adolescentis (88.9%), B. angulatum (5%), B. infantis (5%),and Bifidobacterium spp. (unknown) (1.1%).
Bacterial survival in situ. The density of E. coli as mea-sured by the Coulter Counter increased significantly overtime (F = 16.5, df = 10 and 21, P < 0.0001) but was notsignificantly different between sites (Fig. 2). Densities of B.adolescentis, on the other hand, decreased significantly overtime (F = 47.5, df = 10 and 21, P < 0.0001), and there wereno significant differences between sites (Fig. 2). Densities asmeasured by AODC for E. coli were significantly different bysite (F = 9.83, df = 1 and 21, P < 0.01), with site 4 having a
12 24 3S 48 80
HOURSFIG. 2. Survival in situ of B. adolescentis and E. coli at site 1 and site 4 (mean density by Coulter Counter + 1 standard error, n = 4).
VOL. 50, 1985
on July 8, 2018 by guesthttp://aem
.asm.org/
Dow
nloaded from
472 CARRILLO, ESTRADA, AND HAZEN
L) 1008< 6
4 -- XNz-.> /
D-- £7 a2OV-5Z /
2-7_- _ 'Zt-5A'2 v
0 612 24 36 46 60
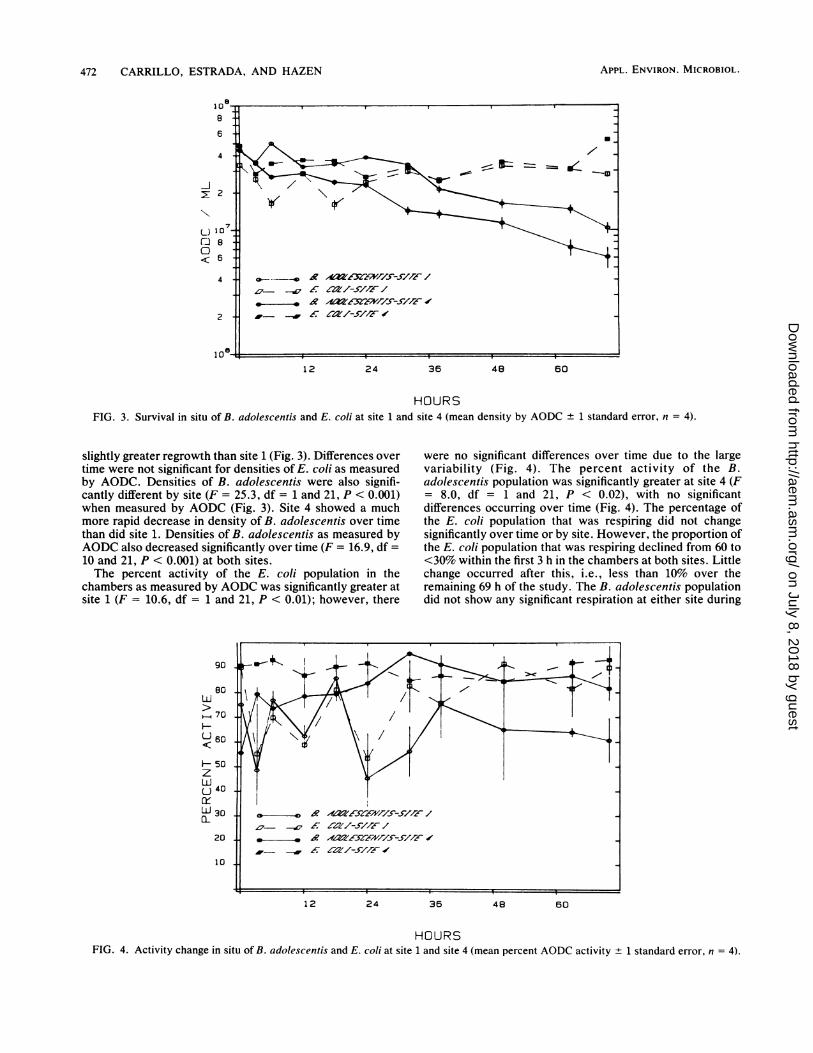
HOURSFIG. 3. Survival in situ of B. adolescentis and E. coli at site 1 and site 4 (mean density by AODC ±
slightly greater regrowth than site 1 (Fig. 3). Differences overtime were not significant for densities of E. coli as measuredby AODC. Densities of B. adolescentis were also signifi-cantly different by site (F = 25.3, df = 1 and 21, P < 0.001)when measured by AODC (Fig. 3). Site 4 showed a muchmore rapid decrease in density of B. adolescentis over timethan did site 1. Densities of B. adolescentis as measured byAODC also decreased significantly over time (F = 16.9, df =10 and 21, P < 0.001) at both sites.The percent activity of the E. coli population in the
chambers as measured by AODC was significantly greater atsite 1 (F = 10.6, df = 1 and 21, P < 0.01); however, there
W 30 o o ZDSL2'S-J
70
n E~ £7 01Z-5A-2' /20 _ _ , ZX %.2q,75,-.b
_.- _~ E 121M-5A2' v10
1 standard error, n = 4).
were no significant differences over time due to the largevariability (Fig. 4). The percent activity of the B.adolescentis population was significantly greater at site 4 (F= 8.0, df = 1 and 21, P < 0.02), with no significantdifferences occurring over time (Fig. 4). The percentage ofthe E. coli population that was respiring did not changesignificantly over time or by site. However, the proportion ofthe E. coli population that was respiring declined from 60 to<30% within the first 3 h in the chambers at both sites. Littlechange occurred after this, i.e., less than 10% over theremaining 69 h of the study. The B. adolescentis populationdid not show any significant respiration at either site during
12 24 36 48 60
HOURSFIG. 4. Activity change in situ of B. adolescentis and E. coli at site 1 and site 4 (mean percent AODC activity + 1 standard error, n = 4).
APPL. ENVIRON. MICROBIOL.
on July 8, 2018 by guesthttp://aem
.asm.org/
Dow
nloaded from

FECAL INDICATORS IN TROPICAL WATERS 473
000000000000000000
0 000 0 0 00 000 0 0> 0 0>N-00.4 - £ m 4 w 0AO
4 O -A D0% %O
P,
o Doo oo o ooo o. o oo
vWJ o .s a
oa0 %o 00 P. wJ%'Ooooooo oooooooo oooo~~~~~~~'o bs£oXooX>sr in o £
0000 000 0 0
I- 00C)~ 0
.
000 0 0 0 0101 0
0~~:4---ij= J-a, 0 ~ CN (. AO
000 A 00A 00
o 00aN Po-I
00 0l 0 00 00
w0000 0 4 000
-J 4 10 1J
00 00 '-A
O OO O OalOOl 10
0.- \ 00 -0
~00. 0\t-.
. . . .~ . . . .
0000 0000--
000%0%-a
000Y1-000
10 \o o0 o \o oo
i
O 01 0 0% 0 0 00 0
oI oI ooo
0000-bXD0001
011
-1 oo lx
0C
'0-
0T
It
z0
W
co0
'Ti
the entire study period, i.e., less than 4% at either site at anytime measured.Water quality and bacterial abundance. A multiple corre-
lation analysis revealed that Bifidobacterium spp. werepositively correlated with hardness, phosphates, and densi-ties of fecal coliforms, E. coli, and total anaerobes (Table 3).These same bacteria were negatively correlated with dis-solved oxygen and pH. Fecal coliforms were correlated tothe same parameters in the same way but were also posi-tively correlated with water and air temperature, conductiv-ity, alkalinity, hardness, nitrates plus nitrites, phosphates,and total phosphorus. Densities of E. coli and totalanaerobes showed the same correlations with water qualityas did fecal coliforms. AODC was positively correlated withalkalinity and density of fecal coliforms. The percentage ofthe bacterial community that was respiring was negativelycorrelated with sulfate concentration and positively corre-lated with the percentage of the bacterial community thatwas active, as measured by AODC.
DISCUSSION
The Mameyes River watershed is relatively oligotrophicdespite the fact that the source of the watershed is a cloud
> tropical rain forest. (For a complete description of all sitesand a thorough discussion of trophic status of this watershed
mTi see Hazen and Aranda [14] and C. F. Aranda, M.S. thesis,University of Puerto Rico, Rio Piedras, 1982.) Concentra-
g~ tions of total phosphorus, alkalinity, phosphates, and ni-0 trates plus nitrites are within the range of values foroligotrophic-mesotrophic freshwaters (32). Site 9 and site 1were the only sites that were not low in nutrients, e.g.,phosphates, total phosphorus, and nitrates plus nitrites. Site9 was the point source for a primary sewage treatment planteffluent; thus, the eutrophic nature of this site is obvious.Site 1, on the other hand, is the highest point sampled in thewatershed. The increased concentrations of some nutrientsat this site may be explained by the higher algal densitiesobserved. Higher algal densities at this site could be theresult of a thinner forest canopy in the upper part of the rainforest which allows sunlight to reach the river. Further downin the watershed, the forest canopy is dense enough toinhibit algal growth (C. F. Aranda, M.S. thesis, Universityof Puerto Rico, Rio Piedras, 1982). Another possibility isthat slightly more nutrients are leached into the river at thetop of the watershed because of higher levels of biodegrada-tion of leaf litter and lower levels of nutrient adsorption bythe forest standing crop (25). This is indicated by the dwarfnature of the forest. Trees that normally reach >20 m are 5m or less in the dwarf forest at the top of the watershed.Wind action appears to be primarily responsible for thisdwarfing, which also increases leaf fall rate (M. Byer,University of Puerto Rico, personal communication).
Torrential rainfalls (>10 cm h-1), which can cause theriver level to change more than 2 m in less than an hour, arethe principal cause of the low densities of resident flora andfauna and the lack of seasonality in all parameters (C. F.Aranda, M.S. thesis, University of Puerto Rico, Rio Piedras,1982). Temperature is quite constant throughout the year,and rainfall does not exhibit any consistent pattern in thearea.
Bacteria distribution and abundance. The highest densitiesof fecal coliforms, E. coli, and Bifidobacterium spp. wererecorded at site 9, the sewage outfall. In addition, the lowestratios between bifidobacteria and fecal coliforms and be-tween bifidobacteria and E. ccli were at site 9. Densities of
VOL. 50, 1985
Apt.
P:a6aa
0
-3
PO
Ct-
CD
CD_Z.
CD(a
CIQ
E.
on July 8, 2018 by guesthttp://aem
.asm.org/
Dow
nloaded from

474 CARRILLO, ESTRADA, AND HAZEN
fecal coliforms reported in this study were lower than thosereported by Evison and James (8) for river samples taken intwo countries in tropical Africa and much higher than thosereported for river samples taken in England. In general, thesite which received sewage effluent had densities of fecalcoliforms and E. coli that were 2 orders of magnitude higherthan uncontaminated sites. However, the densities of fecalcoliforms and E. coli at all sites exceeded recommendedcoliform MCL for potable waters, i.e., 0.04 CFU ml-1 (10).Site 9 also exceeded the recommended fecal coliform MCLfor primary contact recreational waters, i.e., 2 CFU ml-' (5).Note that while the MCL is for total coliforms, our measure-ments were of fecal coliforms and E. coli. Both are consid-ered subsets of total coliforms. Indeed, in this study and inprevious studies, we have found that analyses for totalcoliforms are consistently overgrown at the dilutions used inthis study. Lavoie (20) found that total and fecal coliformassays did not have good resolution in tropical climates.Thus, standard indicators such as fecal coliforms and E. colifunction only in terms of relative numbers in this tropicalsystem, not in terms of absolute densities when comparedwith temperate systems.
Bifidobacteria as enumerated with the YN-6 medium gavehigh background counts and did not show large increases atsites known to contain sewage contamination. Gyllenberg etal. (11) and Evison and James (8) showed that densities ofbifidobacteria were always greater than densities of E. coli orfecal coliforms in contaminated waters. In the rain forest, allsites had higher densities of bifidobacteria than E. coli andfecal coliforms, except site 9, the sewage outfall. Studies ofisolates suggested that much of the difficulty may be inherentin the YN-6 medium itself, since 21.8% false-positives werefound. Resnick and Levin (29) obtained 100% confirmationof 53 environmental isolates obtained in temperate areas.The bifidobacteria/E. coli ratio obtained by Resnick andLevin (29) at sewage outfalls was between 2.3 and 14.4, andthe ratio was always less than 1.0 for nonpoint sourcewaters. Our study showed quite the opposite. Only the pointsource had bifidobacteria/E. coli ratios of less than 1,whereas all of the nonpoint source samples hadbifidobacteria/E. coli ratios that were greater than 1.0. Thesame pattern was seen when a less specific indicator likefecal coliform density was compared with bifidobacteriadensities.
Total anaerobic counts were highest at site 1. This alsosuggests increased biodegradation and leaching from thedwarf forest at the top of the watershed. Since the ground issaturated with water and therefore anoxic, the dominant soilbacterial component is anaerobic. Higher rates of bacterialcommunity respiration and activity at site 1 also suggest arecent source of nutrients, especially since the total bacterialdensity (AODC) is significantly lower at site 1 than the sitesfarther down in the watershed. In comparison to temperatetotal anaerobic counts, Daily et al. (6), using the sametechniques, found 2 x 10² to 9 x 10³ CFU ml-1 in theAnacostia River, Washington, D.C. This grossly polluted,cold, temperate river had lower densities of total anaerobesthan most of the rain forest sites. Indeed, sites 1 and 9 hadhigher densities of total anaerobic counts than any reportedby Daily et al. (6).
Survival of bifidobacteria and water quality. Both directcounting methods of the in situ diffusion chamber densitiesdemonstrated that E. coli could survive indefinitely in therain forest watershed. Regrowth was evident by both meth-ods. Other studies have suggested that E. coli may be able tosurvive and regrow for extended periods in tropical habitats
(4, 8). In temperate environments, it is well documented thatE. coli does not survive well in freshwater (21, 22, 30). Thischaracteristic of nonsurvival in extraenteral environments isone of the major underlying assumptions of the use ofcoliforms as indicators of fecal contamination (4). Thus, E.coli and therefore coliforms would seem to be invalid asindicators of recent fecal contamination in tropical waters.In contrast, densities of B. adolescentis decreased signifi-cantly over time in the chambers as measured by eitherdirect count method. Densities of B. adolescentis declinedmore than 50% in 48 h. Resnick and Levin (29) showed thatbifidobacteria in the laboratory (held in filter-sterilized fresh-water at 4, 12, and 20°C) declined more than 80% in celldensity in only 24 h. The in situ conditions of the tropicalrain forest river seem much more conducive to prolongingbifidobacteria survival.
Site 1, which had higher nutrient levels (i.e., total phos-phorus, phosphates, and nitrates plus nitrites), supportedlower densities of E. coli but had higher rates of survival ofB. adolescentis. Since nutrient levels and algal density werehigher at site 1, the best possible explanation is that micro-bial antagonism was a major factor. It has been establishedthat bifidobacteria and other anaerobes can inhibit E. coli(23, 27). Site 1 also had the highest densities of totalanaerobes. This, coupled with a slight nutrient advantage forB. adolescentis at site 1, would explain the between-sitedifferences observed in bacterial survival.The diffusion chamber activity and respiration measure-
ments showed that E. coli is active (>50% at any time) andrespiring (>10% at any time). The percentage of the popu-lation that was respiring was quite high, i.e., 5 to 36%,compared with environmental samples taken by others (33).The respiration and activity of both bacteria in the diffusionchambers was also greater than the ambient bacterial com-munity rates. This would indicate that either acclimation wasincomplete for the chamber populations or that large num-bers of other bacteria with much lower rates of respirationand activity were present in the ambient community. Thepercentage of the E. coli population that was active wasgreatest at site 4, even though this site supported lowerdensities of E. coli as measured by direct count. This furthersuggests microbial antagonism. The activity of B.adolescentis was also highest at site 4. The large variabilitybetween sampling times for site 1 for both bacteria indicatesthat this site is quite unstable compared with site 4. At site 4,the bacteria seem to physiologically stabilize after only 24 h.Other studies by our laboratory have shown that mostbacteria measured by these techniques physiologically sta-bilize quite quickly in unpolluted tropical waters but havemuch greater difficulties in grossly contaminated waters (N.Perez-Rosas, M.S. thesis, University of Puerto Rico, RioPiedras, 1984; A. J. Lopez-Torres, M.S. thesis, Universityof Puerto Rico, Rio Piedras, 1982; I. Lopez de Cardona,M.S. thesis, University of Puerto Rico, Rio Piedras, 1984).
Analysis of water quality and viable counts revealedcorrelations between viable counts of fecal coliforms andtemperature, alkalinity, nitrates plus nitrites, and total phos-phorus. Since these parameters are indirectly or directlysources of nutrients for these bacteria the relationship wouldseem to be one of cause and effect. Numerous other modelshave shown similar relationships (12, 13, 15, 16). However,it is possible that sewage effluents, which are high in thesesame parameters and high in coliforms of fecal origin, couldcause the observed correlations in the absence of a truecause-effect correlation. In this study, only site 9 had sewageinput, and if this site were eliminated from the data matrix,
APPL. ENVIRON. MICROBIOL.
on July 8, 2018 by guesthttp://aem
.asm.org/
Dow
nloaded from

FECAL INDICATORS IN TROPICAL WATERS 475
the correlation matrix would not be significantly changed.Indeed, higher nutrients at site 1 resulted in higher densitiesof all viable counts in the absence of sewage. Thus, theprimary regulator of densities of indicator bacteria in thistropical environment is probably the nutrient concentrationof the water. The correlation between bifidobacteria andwater hardness is explained by the work of Kojima et al.(19), who found that calcium ions can be a significant growthfactor for bifidobacteria in culture.
This study suggests that coliforms may not only survivebut become normal flora in tropical freshwater environ-ments. Certainly coliforms would seem to be poor indicatorsof recent human fecal contamination, according to the crite-ria of Bonde (4). These findings raise serious doubts as to theefficacy of coliform MCL as the sole criteria for determiningthe usability of tropical freshwaters. Bifidobacteria showpromise as an indicator of recent fecal contamination interms of lack of survival in situ and specificity as a humanfecal indicator. Unfortunately, the currently available me-dium for enumeration (YN-6) is hampered by a lack ofspecificity and insufficient resolution when background bac-terial densities are high. Considering the importance of fecalcontamination of freshwater in the dissemination of diseasesto humans in tropical areas, we must continue to search forbetter methods and indicators that work over a range ofdifferent tropical environments.
ACKNOWLEDGMENTS
We are grateful to Ivette Garcia-Castro, Raymond T. Bauer,Gerald Larson, Guillermo Martinez, and Noemi Diaz for the use oftheir facilities and equipment and their generous assistance. We alsothank Luis Del Valle, Juan Suarez, David Hernandez, GladysRamos, Ileana I. Lopez, Millie Medina, Jesus Santiago, FranciscoFuentes, Enid Elias, and the U.S. Forest Service for theircooperation and assistance.
This work was supported by Public Health Service grant 8102from the National Institutes of Health to the University of PuertoRico. Additional support was received in part from Sea Grant(National Oceanic and Atmospheric Administration, U.S. Depart-ment of Commerce) UPR SG 04F15844030 project EN/P-45, theoffice of Fondo Institucional para Investigacion, University ofPuerto Rico, Rio Piedras, and the Water Resources ResearchInstitute of the University of Puerto Rico at Mayaguez (U.S.Department of Interior).
LITERATURE CITED1. Allen, M. J., and E. E. Geldreich, Jr. 1978. Evaluating the
microbial quality of potable waters, p. 3-11. In C. W. Hendricks(ed.), Evaluation of the microbiology standards of drinkingwater. U.S. Environmental Protection Agency. National Tech-nical Information Service, Springfield, Va.
2. American Public Health Association. 1981. Standard methods forthe examination of water and wastewater, 15th ed. AmericanPublic Health Association, Washington, D.C.
3. Biamon, E. J., and T. C. Hazen. 1983. The distribution andsurvival of Aeromonas hydrophila in tropical near-shore coastalwaters receiving rum distillery effluents. Water Res. 17:319-326.
4. Bonde, G. J. 1977. Bacterial indicators of water pollution. Adv.Aquatic Microbiol. 1:273-364.
5. Cabelli, V. J., A. P. Dufour, L. J. McCabe, and M. A. Levin.1983. A marine recreational water quality criterion consistentwith indicator concepts and risk analysis. J. Water Pollut. Cont.Fed. 55:1306-1314.
6. Daily, 0. P., S. W. Joseph, J. D. Gillmore, R. R. Colwell, andR. J. Seidler. 1981. Identification, distribution, and toxigenicityof obligate anaerobes in polluted waters. Appl. Environ. Micro-biol. 41:1074-1077.
7. Dufour, A. P., E. R. Strickland, and V. J. Cabelli. 1981.
Membrane filter method for enumerating Escherichia coli. Appl.Environ. Microbiol. 41:1152-1158.
8. Evison, L. M., and A. James. 1975. Bifidobacterium as anindicator of human fecal pollution in water. Prog. WaterTechnol. 7:57-66.
9. Evison, L. M., and A. James. 1973. A comparison of thedistribution of intestinal bacteria in British and East Africanwater sources. J. Appl. Bacteriol. 36:109-118.
10. Federal Register. 1983. Fed. Regist. 48:45502-45521.11. Gyllenberg, H., S. Niemela, and T. Sormunen. 1960. Survival of
bifid bacteria in water as compared with that of coliformbacteria and enterococci. Appl. Environ. Microbiol. 8:20-22.
12. Hazen, T. C. 1979. The ecology of Aeromonas hydrophila in aSouth Carolina cooling reservoir. Microb. Ecol. 5:179-195.
13. Hazen, T. C. 1983. A model for the density of Aeromonashydrophila in Albemarle Sound, North Carolina. Microb. Ecol.9:137-153.
14. Hazen, T. C., and C. F. Aranda. 1981. The relationship betweenthe distribution and abundance of bacteria and the water qualityin the Rio Mameyes watershed, p. 87-111. In J. L. Vivaldi (ed.),Seventh Annual Natural Resources Symposium Puerto Rico.Department of Natural Resources, Commonwealth of PuertoRico, San Juan.
15. Hazen, T. C., and G. W. Esch. 1983. Effect of effluent from anitrogen fertilizer factory and a pulp mill on the distribution andabundance of Aeromonas hydrophila in Albemarle Sound,North Carolina. Appl. Environ. Microbiol. 45:31-42.
16. Hazen, T. C., L. Prieto, A. Lopez, and E. Biamon. 1982. Survivaland activity of fecal coliforms bacteria in near-shore coastalwaters, p. 128-161. In J. L. Vivaldi (ed.), Eighth Annual NaturalResources Symposium Puerto Rico. Department of NaturalResources, Commonwealth of Puerto Rico, San Juan.
17. Holdeman, L. V., E. P. Cato, and W. E. C. Moore (ed.). 1977.Anaerobe laboratory manual, 4th ed. Virginia Polytechnic In-stitute and State University, Blacksburg.
18. Kay, D., and A. McDonald. 1983. Predicting coliform concen-trations in upland impoundments: design and calibration of amultivariate model. Appl. Environ. Microbiol. 46:611-618.
19. Kojima, M., S. Suda, S. Hotta, K. Hamada, and A. Suganuma.1970. Necessity of calcium ion for cell division in Lactobacillusbifidus. J. Bacteriol. 104:1010-1013.
20. Lavoie, M. C. 1983. Identification of strain isolates as total andfecal coliforms and comparison of both groups as indicators offecal pollution in tropical climates. Can. J. Microbiol.29:689-693.
21. McFeters, G. A., G. K. Bissonnette, J. J. Jezeski, C. A.Thomson, and D. G. Stuart. 1974. Comparative survival ofindicator bacteria and enteric pathogens in well water. Appl.Microbiol. 27:823-829.
22. McFeters, G. A., and D. G. Stuart. 1972. Survival of coliformbacteria in natural waters: field and laboratory studies withmembrane-filter chambers. Appl. Environ. Microbiol.24:805-811.
23. Miller, L. G., and S. M. Finegold. 1967. Antibacterial sensitivityof Bifidobacterium (Lactobacillus bifidus). J. Bacteriol.93:125-130.
24. Mitsuoka, T., and C. Kaneuchi. 1977. Ecology of thebifidobacteria. Am. J. Clin. Nutr. 30:1799-1810.
25. Odum, H. T. 1970. Rain forest structure and mineral-cyclinghomeostasis, p. H3-52. In H. T. Odum and R. F. Pigeon (ed.),A tropical rain forest, a study of irradiation and ecology at ElVerde, Puerto Rico. U.S. Atomic Energy Commission. Na-tional Technical Information Service, Springfield, Va.
26. Pagel, J. E., A. A. Oureshi, D. M. Young, and L. T. Vlassoff.1982. Comparison of four membrane filter methods for fecalcoliform enumeration. Appl. Environ. Microbiol. 43:787-793.
27. Poupard, J. A., I. Husain, and R. F. Norris. 1973. Biology of thebifidobacteria. Bacteriol. Rev. 37:136-165.
28. Resnick, I. G., and M. A. Levin. 1981. Quantitative procedurefor enumeration of bifidobacteria. Appl. Environ. Microbiol.42:427-432.
29. Resnick, I. G., and M. A. Levin. 1981. Assessment ofbifidobacteria as indicators of human fecal pollution. Appl.
VOL. 50, 1985
on July 8, 2018 by guesthttp://aem
.asm.org/
Dow
nloaded from

476 CARRILLO, ESTRADA, AND HAZEN
Environ. Microbiol. 42:433-438.30. Sjogren, R. E., and M. J. Gibson. 1981. Bacterial survival in a
dilute environment. Appl. Environ. Microbiol. 41:1331-1336.31. U.S. Water Resources Council. 1978. Caribbean region. U.S.
Water Resources Council, Washington, D.C.32. Wetzel, R. G. 1975. Limnology. Saunders, Philadelphia, Pa.
APPL. ENVIRON. MICROBIOL.
33. Zar, J. H. 1984. Biostatistical analysis. Prentice-Hall Inc.,Englewood Cliffs, N.J.
34. Zimmerman, R., R. Iturriaga, and J. Becker-Birck. 1978. Simul-taneous determination of the total number of aquatic bacteriaand the number thereof involved in respiration. Appl. Environ.Microbiol. 36:926-934.
on July 8, 2018 by guesthttp://aem
.asm.org/
Dow
nloaded from