survival of the facility manager - greater phoenix chapter...
TRANSCRIPT

Survival of the Facility Manager
PBSRG GLOBAL
Dean T. Kashiwagi, PhD, IFMA Fellow Director, Professor
Performance Based Studies Research Group
CIB W117 Coordinator Fulbright Scholar
Pbsrg.com
August 14, 2013

What pressures are the FM community facing?
• Cost cutting
• Procurement forcing low price awards
• Increased transactions
• A new model is required
• Lack time and funding
2

We Are Supply Chains P
are
nts
Myself a
nd m
y W
ife
Child
ren
Child
ren’s
Futu
re F
am
ilies
Child
ren’s
Futu
re J
obs
Ch
ildre
n's
Futu
re C
hild
ren
Sim
plic
ity/D
om
inant
Info
rmation
Technical Details
30K Foot Level

Practices
• Minimize MDC
• Minimize communications
• Use dominant information [early, no analysis required, no – brainer]
4

Practices
• Minimize MDC
• Minimize communications
• Use dominant information [early, no analysis required, no – brainer]
• Helps if the information is accurate
• Utilize expertise
5

Initial
conditions
Final
conditions
Natural Laws identify the future outcome [marriage or business]
6
Time
Laws Laws

Industry Structure
High
I. Price Based
II. Value Based
IV. Unstable Market
III. Negotiated-Bid
Wrong person talking
Management, direction, and control [MDC]
No transparency
Buyer selects based on price and performance
Utilization of expertise
Vendor uses schedule, risk management, and quality control to track deviations
Buyer practices quality assurance
Perceived Competition
Pe
rfo
rman
ce
Low
High
Minimized competition
Long term
Relationship based
Vendor selected based on performance
Contractor minimizes risk
Client minimizes risk

PBSRG Best Value Research (Performance Based Studies Research Group)
“Win-win” , common sense, logical
• 1992-present, $12.8M research (20 year research program, 1600+ tests)
• Delivered $5.7 Billion Services • 100% increase in Vendor profit • Minimize up to 90% of client/buyer
transactions • 98% Customer satisfaction and LT 1% vendor
deviations • Testing: Finland, Netherlands, Canada, Malaysia,
Africa and U.S. • ASU – investments of over $100M over 10 years
due to “change in paradigm

Overall MEDCOM Performance by NTP 2007-2011
Completed Projects NTP 2007 NTP 2008 NTP 2009 NTP 2010 NTP 2011
# of Projects 110.00 129.00 122.00 92.00 27.00
Original Awarded Cost ($$) $181,945,282.27 $177,275,551.80 $183,989,041.03 $107,091,486.62 $16,278,439.41
Final Awarded Cost ($$) $193,881,007.60 $187,844,708.77 $192,602,961.59 $110,952,677.38 $16,352,909.79
Total Over Budget ($$) $11,935,725.33 $10,569,156.97 $8,613,920.56 $3,861,190.76 $74,470.38
Total % Over Budget 6.56% 5.96% 4.68% 3.61% 0.46%
% due to owner 4.58% 5.59% 3.61% 2.36% 0.46%
% due to Designer 0.00% 0.14% 0.00% 0.21% 0.00%
% due to contractor 0.11% -0.17% -0.01% 0.08% 0.00%
% due to unforeseen 1.88% 0.40% 1.09% 0.96% 0.00%
Total % Delayed 51.56% 48.43% 36.77% 28.53% 3.31%
% due to owner 41.38% 39.96% 28.51% 16.53% 9.20%
% due to Designer 0.00% 0.49% 0.00% 1.32% 0.00%
% due to contractor 1.86% -0.02% 1.29% 0.12% -6.40%
% due to unforeseen 8.32% 8.01% 6.97% 10.56% 0.51%

Performance in Minnesota Best Value records sources of all deviations
Overview Overall Group A Group B Group C Group D Group E Group F Group G Group H
Total Number of Projects 415 355 7 10 3 4 33 2 1
Total Awarded Cost ($M) $483.0 $330.9 $37.7 $37.4 $29.5 $4.1 $29.6 $1.6 $12.4
Projects BV lowest cost 59% 55% 57% 60% 67% 75% 55% 100% 0%
Awarded Below Budget 4% 1% 17% -5% 12% 9% 7% -26% 29%
Cost Increases
Change Order Rate 8.2% 10.5% 5.1% 0.4% 2.5% 0.7% 4.0% 2.1% 4.8%
Client 7.0% 9.6% 3.1% 0.1% 0.3% 0.0% 1.5% 0.1% 1.2%
Vendor 0.0% 0.0% -0.2% 0.0% 0.0% 0.0% -0.1% 0.0% 0.2%
Designer 0.7% 0.3% 2.0% 0.2% 1.6% 0.0% 1.5% 1.6% 2.5%
Unforeseen 0.5% 0.5% 0.1% 0.1% 0.6% 0.7% 1.1% 0.3% 0.9%
Schedule Increases
Delay Rate 38.5% 48.4% 33.0% 14.5% 7.4% 2.2% 1.5% 214.1% 12.7%
Client 28.1% 36.3% 21.7% 2.8% 3.9% 2.2% 1.0% 83.9% 5.5%
Vendor 2.1% 2.4% 5.6% 0.0% 3.5% 0.0% 0.0% 0.0% 0.0%
Designer 3.9% 4.5% 4.3% 9.2% 0.0% 0.0% 0.3% 0.0% 7.3%
Unforeseen 4.4% 5.1% 1.3% 2.6% 0.0% 0.0% 0.2% 130.2% 0.0%
Satisfaction Ratings
# of Surveys 240 214 2 0 3 1 18 1 1
Overall Satisfaction 9.6 9.6 9.1 N/A 9.3 9.9 9.9 8.1 9.4

Which approach costs less and takes less time? MDC or Utilizing Expertise
• FM must be continually educated
• FM is “educated” expert
• FM is certified in technical areas
• FM is decision maker
• MDC
• No performance metrics
• Contract becomes more important
• Silo based “me vs. them”
• FM knows they don’t know
• Recruits experts
• Experts bring measurements
• BV expert [know, do, measure, increase quality and value]
• Environment becomes transparent
• Supply chain based
11

Best Value Delivers in Short Summer Schedules
Rochester Public Schools

Background • 16,427 students; 2,148 staff
• 23 schools over 225 square
miles
• First project in April 2009
• Tight summer break construction schedule (~3 months)
• Very high contractor performance

Highest performance results
Performance Criteria Rating
Total number of completed and in-progress projects 33
Total awarded cost $29.6M
Average number of proposals per project 4
Percentage of awards where Best Value was the lowest price 55%
Average Contractor Change Order Rate 0%
Average Contractor Delay Rate 0%
Average Customer Satisfaction Rating (1-10) 9.9

Construction Director’s Comments
• “In low-bid, you’re getting a low number, you’re getting low performance, you get low quality. Sometimes it works out, sometimes it doesn’t… I feel much more comfortable with the PIPS process because of the consistent higher level of performance…”
• “I wish we would have started using PIPS much sooner… before best value, we’ve had a really high-percentage of change orders…”
• “Because of the high success of best value, we are now looking at using the philosophy in curriculum, HR, Technology, and other services…”

Expansion into other services
• Application of best value into other services
– Use the philosophy in education of students.
• Major milestones:
– High success on projects
– Board member attends meeting – “this should be used in student education”
– Presentation to partial board
– Presentation to full board and cabinet

Best Value for the Lowest Cost
Plymouth, Minnesota

Keys to Success
18
“Preplanning is key for the contractors in order to
have a successful project. Using best value on
the NEC project has saved me a lot of
headaches, time, and decisions. Get educated
in the process because it’s definitely not ‘magic
words’ in an RFP; it’s truly a system that aligns
experts to the project.”
-Tom Shultz, Director of FacilitiesIFMA Member, Minneapolis/St. Paul Chapter

North Education Center
• Completed Projects ($29.5M)
– General construction: $25.9M
– Technology systems: $1.6M
– Demountable walls: $2.0M
• Overall Change Order & Schedule Delays
Criteria Overall General Technology Demountable
Client 0.3% 0.2% 5.2% 0.2%
Contractor 0.0% 0.0% 0.7% 0.0%
Design 1.6% 0.9% 0.2% 0.1%
Unforeseen 0.6% 0.3% 0.0% 0.0%

Best Value vs. Low Bid
Construction Project
# of Change Orders
Total Cost of Change Orders
% Contingency of Budget
Contingency Budget
NEC (best value) 110 $1,448,243 4.8% $1,357,613
SEC (low bid) 422 $1,523,902 8.0% $2,051,597
20
74% fewer change orders
Savings of $2M
NEC contingency budget 40% less than SEC

Awards
• 2013 MCA Choice Award
• 2013 IFMA President’s Award (Tom Shultz)
• 2011 Facility Practitioner of the Year (Tom Shultz)
21

Model of the Future: Performance Information Procurement System (details documented in manuals at pbsrg.com and ksm-inc.com)
22
Expertise identified by natural law
BV expert’s proposal must be acceptable to user
Expertise is utilized
Identify expertise Dominant Simple Differential (non-technical performance measurements)
Clarification Technical review Detailed project schedule Resource & Man- power schedule
Risk Management Quality Control Quality Assurance
SELECTION CLARIFICATION/
PRE-AWARD
MANAGEMENT
BY
RISK MINIMIZATION

BV Approach
• Procurement system
• Project management model
• Risk management model
• Value added model
• Use logic, common sense and observation
• Constraint is time and money [optimize]
23

What is an Expert?
• See into the future
• Communicates with dominant language
• Project manager first, technical expert second
• Utilize expertise
• Accountable using dominant information
– Before the event happens
– Has a plan that can be measured against
– Plan comes before coordination with stakeholders
24

Language of Metrics
• How essential is in the method of BVP the role
of verifiable performance information or metrics?
• Dominant information
• Transparency (clear, simple, no decision making)
• Need for trust is minimized
• Need for relationships is minimized
• Utilizing metrics is easier than making decisions
25

Non-Transparency
• Relationships
• Trust
• Complexity
• Costs may be 20 – 30 % higher
26

Risk Mitigation
• Decision Less Structure
• No management, direction and control (MDC) Approach (use expertise)
• Results
– Transparency
– Accountability
– Experience and expertise
– Detailed pre-planning
27

Risk Model
28
50% 50%
Whose Fault? • Decision Making • Transparency • Risk • Accountability
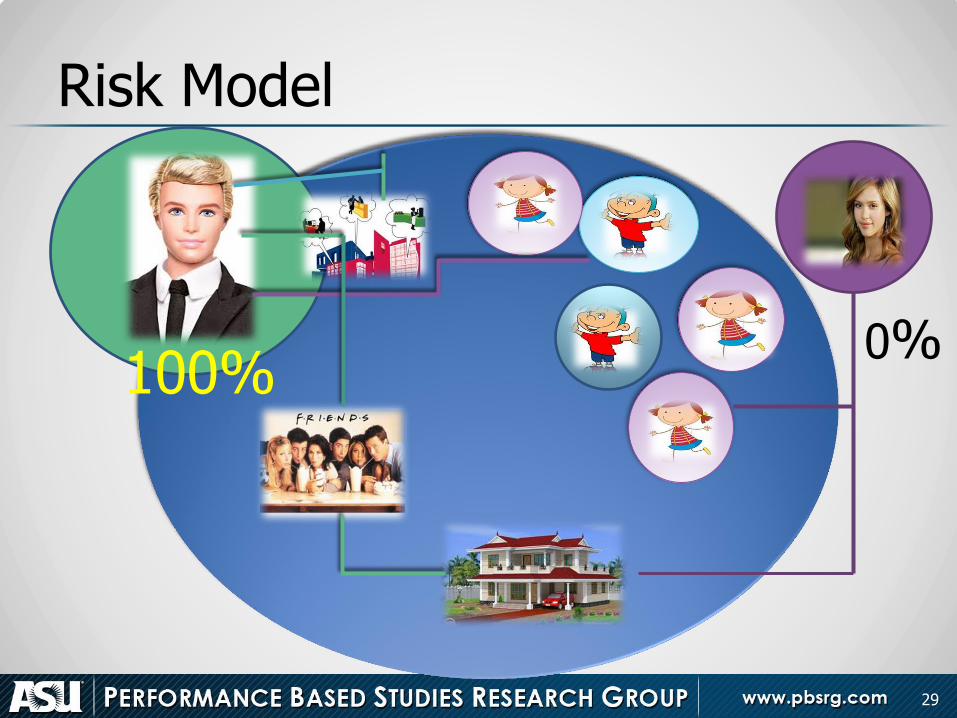
Risk Model
29
100% 0%
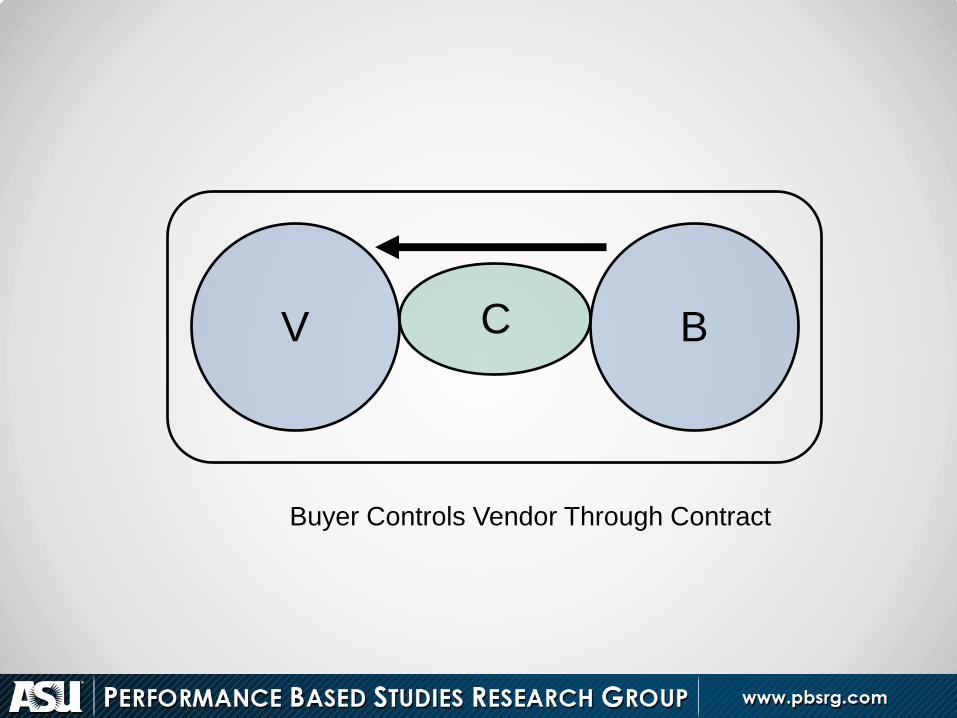
V B C
Buyer Controls Vendor Through Contract

V B C
Vendor Manages/Minimizes Risk With Contract

Plan
• Detailed schedule from beginning to end
• Expertise used in areas where there is insufficient information
• Risk that cannot be controlled [requirements]
32
Deliverables [metrics]
Milestones [metrics]

Paradigm Change: MDC to Utilizing Expertise of the Vendor
Client Defines Project Management, Direction and Control (MDC)
Utilize Expertise of Expert Vendors
Owner / Consultants Identify intent
Traditional MDC
Best Value
Hire vendor for lowest cost
Planning Risk management
Owner tries to decrease cost Owner tries to minimize risk Specifying solution to contractors

Confusion
• Expert is more expensive
• Expert’s profit is too high
• Transfer risk to vendor
• MDC experts
• Vendors are not experts and only think in their own best interest
• FM must be an expert in all areas [education, certification, MDC, know all the answers]
34

Other Efforts
• Dutch
• DRC
• India
• Australia
• Canada
35

Interest in India
• Bangalore
• Mysore
• Chennai
• Pune
• New Delhi
• Indian Railways • SJCE [Sri Jayachamarajendra College
of Engineering] • Supply Chain Management • ITT Madras

INGA3 “Hope of Africa” Project (Hydro-Electric Dam)
Expected to light up all of Africa Inga3 is first phase of seven phases ($60B) 4,800 megawatts Power Plant will produce two times more power than the 3 Gorges Dam[40,000 megawatts]

Current Performance of the Delivery of Construction in Congo
• 16 current projects [avg value $162M]
• Time and cost deviation: 50%
• Average delay: 2.3 years, max: 4 years
• None of the projects are currently completed; performance could worsen
• All countries have the same problem
• Problem has been there for the past 20 years
• No good solution has been proposed
• The problem is not technical, it is process/ structural
38

Existing Inga 3 Project Situation
• Traditional approach will deliver financial closing in 2016-2017 if everything goes right [2022-2023]
• Past performance of delivering construction using traditional methodology identifies that being on time and on budget may be an issue
• A methodology is needed to speed up the procurement and the administration of the delivery of the service
• The cost of not meeting delivery of construction is $4.8M/day [$164M/month, $1.958B/year]
39

Potential Impact of BV Approach on Inga3
• Improve delivery times by 50%
• Minimize transactions by up to 90%
• Minimize cost and time deviations by 50%
• Increase service performance and value
• Utilize expertise instead of MDC to minimize risk of late delivery
• Minimize cost of late delivery by $4-$8B
40

DRC Request for Assistance
• Minister Bruno Kalala announced on July 15th that ASU’s construction process will help DRC deliver INGA3.
• During July 23rd official INGA3 meeting. Dr. Dean briefed all participants of the BV PIPS process.
Major stakeholders
• DRC
• DRC energy minister and agency
• DRC project management team [not officially identified]
• Orrick [contracted to integrate project delivery]
• DRC representatives [Max Munga and Emmanuel Moteng]
• International banks [including World Bank and African Development Bank]
42

Presenting at WWP:
October 4th at 8:00am to 9:00am
Avoiding Risky Projects: A Closer
Look at Value Based Contracting and
Performance Measurements
Visit ASU Booth at EXPO!

Best Value Annual Conference January 13-16, 2014 in Tempe, AZ
I am on Linked In & Youtube [email protected] Can’t get a hold of me please contact Sylvia Romero at (480) 965-1252
Books for Sale &
Conference details at:
www.pbsrg.com

THANK YOU FOR ATTENDING!
Want to learn more please contact
3