survival-time classification of breast cancer patients and chemotherapy ismp-2003 copenhagen august...
TRANSCRIPT

Survival-Time Classification of Breast Cancer Patients
and ChemotherapyISMP-2003
Copenhagen August 18-22, 2003
Y.-J. Lee, O. L. Mangasarian & W.H. Wolberg
Data Mining Institute
University of Wisconsin - Madison

Breast Cancer Estimates American Cancer Society & World Health Organization
Breast cancer is the most common cancer among women in the United States. 212,600 new cases of breast cancer will be diagnosed in the United States in 2003: 211,300 in women, 1,300 in men 40,200 deaths will occur from breast cancer in the United States in 2003: 39,800 in women, 400 in menWHO estimates: More than 1.2 million people worldwide were diagnosed with breast cancer in 2001 and 0.5 million died from breast cancer in 2000.

Key Objective
Identify breast cancer patients for whom chemotherapy prolongs survival time Main Difficulty: Cannot carry out comparative
tests on human subjects Similar patients must be treated similarly Our Approach: Classify patients into:
Good, Intermediate & Poor groups such that: Good group does not need chemotherapy Intermediate group benefits from chemotherapy Poor group not likely to benefit from chemotherapy

Outline
Tools used Support vector machines (Linear & Nonlinear SVMs)
Feature selection & classification Clustering (k-Median algorithm not k-Means)
Cluster into chemo & no-chemo groups Cluster chemo patients into 2 groups: good & poor Cluster no-chemo patients into 2 groups: good & poor Merge into three final classes
Good (No-chemo) Poor (Chemo) Intermediate : Remaining patients (chemo & no-chemo)
Generate survival curves for three classes Use SSVM to classify new patients into one of above three classes
Data description

Cell Nuclei of a Fine Needle Aspirate

Thirty Cytological FeaturesCollected at Diagnosis Time

Two Histological Features Collected at Surgery Time

Features Selected by Support Vector Machine

1- Norm Support Vector MachinesMaximize the Margin between Bounding Planes
x0w= í +1
x0w= í à 1
A+
A-
jjwjj12
w
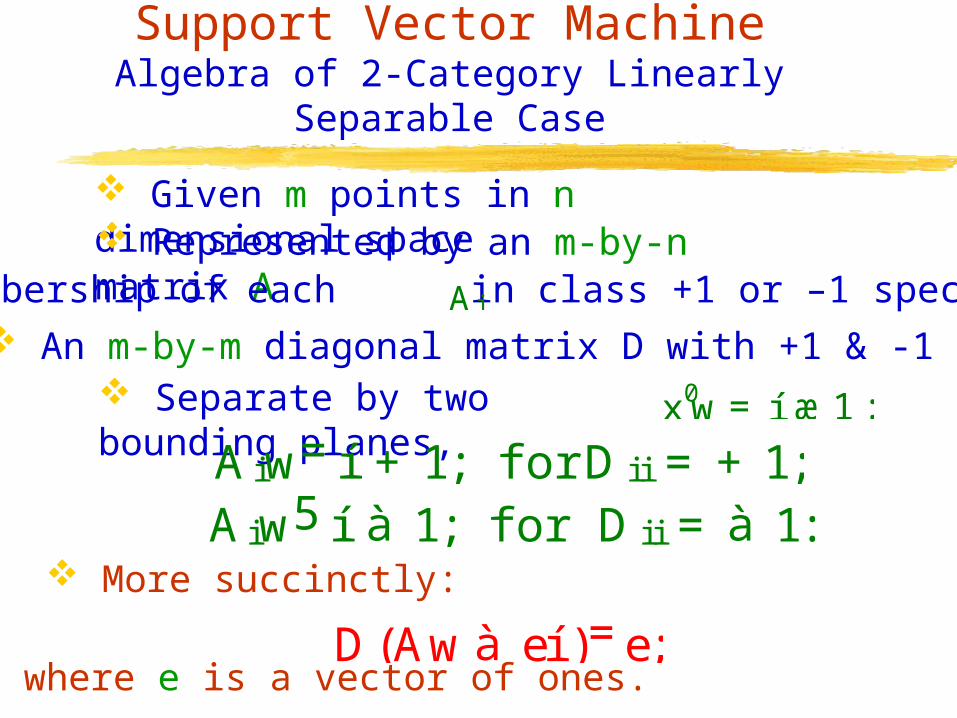
Support Vector MachineAlgebra of 2-Category Linearly Separable Case
Given m points in n dimensional space Represented by an m-by-n matrix A Membership of each in class +1 or –1 specified by:A i
An m-by-m diagonal matrix D with +1 & -1 entries
D(Awà eí )=e;
More succinctly:
where e is a vector of ones.
x0w= í æ1: Separate by two bounding planes,
A iw=í +1; for D i i =+1;A iw5í à 1; for D i i = à 1:

Feature SelectionUsing 1-Norm Linear SVM
Classification Based on Lymph Node Status
Features selected: 6 out of 31 by above SVM:
Feature selection: 1-norm SVM: SVM jjájj1
s. t.
÷e0y+kwk1
D(Awà eí ) +y> e
y> 0;w;ímin
,
, denotes Lymph node > 0 or where D ii =æ1Lymph node =0
5 out 30 cytological features that describe nuclear size, shape and texture from fine needle aspirate
Tumor size from surgery

Nonlinear SVM for Classifying New Patients
Linear SVM: (Linear separating surface: x0w= í )
(LP)÷e0y+kwk1y> 0;w;í
D(Awà eí ) +y> e
min
s.t.
y>0;u; í
K (A;A0) Replace AA0 by a nonlinear kernel :÷e0y+kuk1
D(K (A;A0)Duà eí ) + y>e
min
s.t.
in the “dual space” , gives:
By QP duality: w= A0Du. Maximizing the margin
÷e0y+kuk1y>0;u; í
D(AA0Duà eí ) + y>e
min
s.t.

The Nonlinear Classifier
K (A;A0) : Rmân â Rnâm7à! Rmâm
K (x0;A0)Du = í
The nonlinear classifier:
Where K is a nonlinear kernel, e.g.: Gaussian (Radial Basis) Kernel :
"àökA iàA jk22; i; j = 1;. . .;mK (A;A0)ij =
The ij -entry of K (A;A0) represents “similarity” between the data points A i A jand

Clustering in Data Mining
General Objective
Given: A dataset of m points in n-dimensional real space
Problem: Extract hidden distinct properties by clustering the dataset into k clusters

Concave Minimization Formulationof 1-Norm Clustering Problem (k-Median)
, and a numberA 2 Rmân
Given: Set A of m points in Rn represented by the matrixk of desired clusters
k Objective Function: Sum of m minima of linear functions,hence it is piecewise-linear concave
Difficulty: Minimizing a general piecewise-linear concavefunction over a polyhedral set is NP-hard
C1;C2; . . .;CkFind: Cluster centers that minimizethe sum of 1-norm distances of each point: A1;A2; . . .;Am; to its closest cluster center.

Clustering via Finite Concave Minimization
Equivalent bilinear reformulation:
i = 1;. . .;m; ` = 1;. . .;k
C`;D i ` 2 R n;Ti ` 2 R
P
i=1
m P
`=1
kTi`e0D i`
à D i` ô A0i à C` ô D i`
P`=1k Ti`=1; Ti` õ 0
min
s.t.
à D i` ô A0i à C` ô D i`
i = 1;. . .;m;` = 1;. . .;k
C`;D i `
P
i=1
m
` = 1; . . .; kf e0D i `gmin min
s.t.
Minimize the sum of 1-norm distances between each dataA ipoint C` :and the closest cluster center

K-Median Clustering AlgorithmFinite Termination at Local Solution
Step 1 (Cluster Assignment): Assign points to the cluster withthe nearest cluster center in 1-norm
Step 2 (Center Update) Recompute location of center for eachcluster as the cluster median (closest point to all clusterpoints in 1-norm)
Step3 (Stopping Criterion) Stop if the cluster centers are unchanged, else go to Step 1
=Step 0 (Initialization): Pick 2 initial cluster centers
(L=0 & T<2) & (L 5 or T 4)=

Feature Selection & Initial Cluster Centers
6 out of 31 features selected by 1-norm SVM ( SVM jjájj1) SVM separating lymph node positive (Lymph > 0)
from lymph node negative (Lymph = 0)
Perform k-Median algorithm in 6-dimensional input space
Initial cluster centers used: Medians of Good1 & Poor1
Good1: Patients with Lymph = 0 AND Tumor < 2
Poor1: Patients with Lymph > 4 OR Tumor õ 4 Typical indicator for chemotherapy

Overall Clustering Process
253 Patients(113 NoChemo, 140 Chemo)
Cluster 113 NoChemo PatientsUse k-Median Algorithm with Initial Centers:
Medians of Good1 & Poor1
69 NoChemo Good 44 NoChemo Poor 67 Chemo Good 73 Chemo Poor
Good PoorIntermediate
Cluster 140 Chemo PatientsUse k-Median Algorithm with Initial Centers:
Medians of Good1 & Poor1
Good1:Lymph=0 AND Tumor<2
Compute Median Using 6 Features
Poor1:Lymph>=5 OR Tumor>=4
Compute Median Using 6 Features
Compute InitialCluster Centers

Survival Curves forGood, Intermediate & Poor Groups
(Classified by Nonlinear SSVM)

Survival Curves for Intermediate Group:Split by Chemo & NoChemo

Survival Curves for Overall Patients:With & Without Chemotherapy

Survival Curves for Intermediate GroupSplit by Lymph Node & Chemotherapy

Survival Curves for Overall PatientsSplit by Lymph Node Positive & Negative

Conclusion
Used five cytological features & tumor size to clusterbreast cancer patients into 3 groups: Good – No chemotherapy recommended Intermediate – Chemotherapy likely to prolong survival Poor – Chemotherapy may or may not enhance survival
3 groups have very distinct survival curves First categorization of a breast cancer group for which
chemotherapy enhances longevity
SVM- based procedure assigns new patients into one of above three survival groups

Talk & Paper Available on Web
www.cs.wisc.edu/~olvi
Y.-J. Lee, O. L. Mangasarian & W. H. Wolberg: “Computational Optimization and Applications” Volume 25, 2003, pages 151-166”