susan g. komen tulsakomentulsa.org/wp-content/uploads/2013/10/komen-tulsa-2015... · susan g. komen...
TRANSCRIPT
SUSAN G. KOMEN® TULSA
2 | P a g e Susan G. Komen® Tulsa
Table of Contents ........................................................................................................................ 2
Acknowledgments ...................................................................................................................... 3
Executive Summary .................................................................................................................... 5
Introduction to the Community Profile Report ........................................................................... 5
Quantitative Data: Measuring Breast Cancer Impact in Local Communities ............................. 5
Health Systems and Public Policy Analysis .............................................................................. 7
Qualitative Data: Ensuring Community Input ............................................................................ 9
Mission Action Plan ................................................................................................................. 10
Introduction ............................................................................................................................... 15
Affiliate History ........................................................................................................................ 15
Affiliate Organizational Structure ............................................................................................. 15
Affiliate Service Area ............................................................................................................... 16
Purpose of the Community Profile Report ............................................................................... 18
Quantitative Data: Measuring Breast Cancer Impact in the Local Community ................... 19
Quantitative Data Report ......................................................................................................... 19
Additional Quantitative Data Exploration ................................................................................. 37
Selection of Target Communities ............................................................................................ 39
Health Systems and Public Policy Analysis ........................................................................... 42
Health Systems Analysis Data Sources .................................................................................. 42
Health Systems Overview ....................................................................................................... 43
Public Policy Overview ............................................................................................................ 53
Health Systems and Public Policy Analysis Findings .............................................................. 56
Qualitative Data: Ensuring Community Input ........................................................................ 57
Qualitative Data Sources and Methodology Overview ............................................................ 57
Qualitative Data Overview ....................................................................................................... 60
Qualitative Data Findings ........................................................................................................ 72
Mission Action Plan .................................................................................................................. 75
Breast Health and Breast Cancer Findings of the Target Communities .................................. 75
Mission Action Plan ................................................................................................................. 76
References ................................................................................................................................. 89
Table of Contents

3 | P a g e Susan G. Komen® Tulsa
The Community Profile Report could not have been accomplished without the exceptional work, effort, time and commitment from many people involved in the process. Susan G. Komen® Tulsa would like to extend its deepest gratitude to the Board of Directors and the following individuals who participated on the 2015 Community Profile Team:
Syeachia N. Dennis, MD Assistant Professor, Department of Family Medicine OU School of Community Medicine
Luisa Krug, MPH Epidemiologist Tulsa Health Department Dinah Manns, Ed.D. Research Lead and Core Faculty in Social Science and Behavioral Sciences Capella University Jerri Schoats-Stoutermire, M.Ed., Ed.D. Uzma Syed M.S, M.P.H Sherri Jones Tapp, Ed.D. Professor, Graduate School of Education Oral Roberts University College of Education Audrey H. Thompson, PhD., RN Associate Professor Oral Roberts University Anna Vaughn College of Nursing Christy Southard Executive Director Komen Tulsa Abbi Lee, MPH Community Health Manager Komen Tulsa
Acknowledgments
4 | P a g e Susan G. Komen® Tulsa
A special thank you to the following entities for their assistance with data collection and analyses, as well as for providing information included in this report:
Coweta Public Library Good Samaritan Health Services Indian Health Care Resource Center Morton Comprehensive Health Services Oklahoma Project Woman Rogers State University Rudisill Regional Library Soulful Survivors Tulsa Health Department Thomas Boxley Judy Bush Matt Gleason Susan Lamb Dr. Regina Lewis Judy McIntyre Amy Nelson Anne Pate Hayley Rose Janice Ruh Amber Sheikh Kristen Turley Tia Yancey Dr. Frances Wen
Report Prepared by:
Susan G. Komen Tulsa 1560 East 21st Street, Suite 202 Tulsa, Oklahoma 74114 918-392-2745 www.komentulsa.org Contact: Abbi Lee
5 | P a g e Susan G. Komen® Tulsa
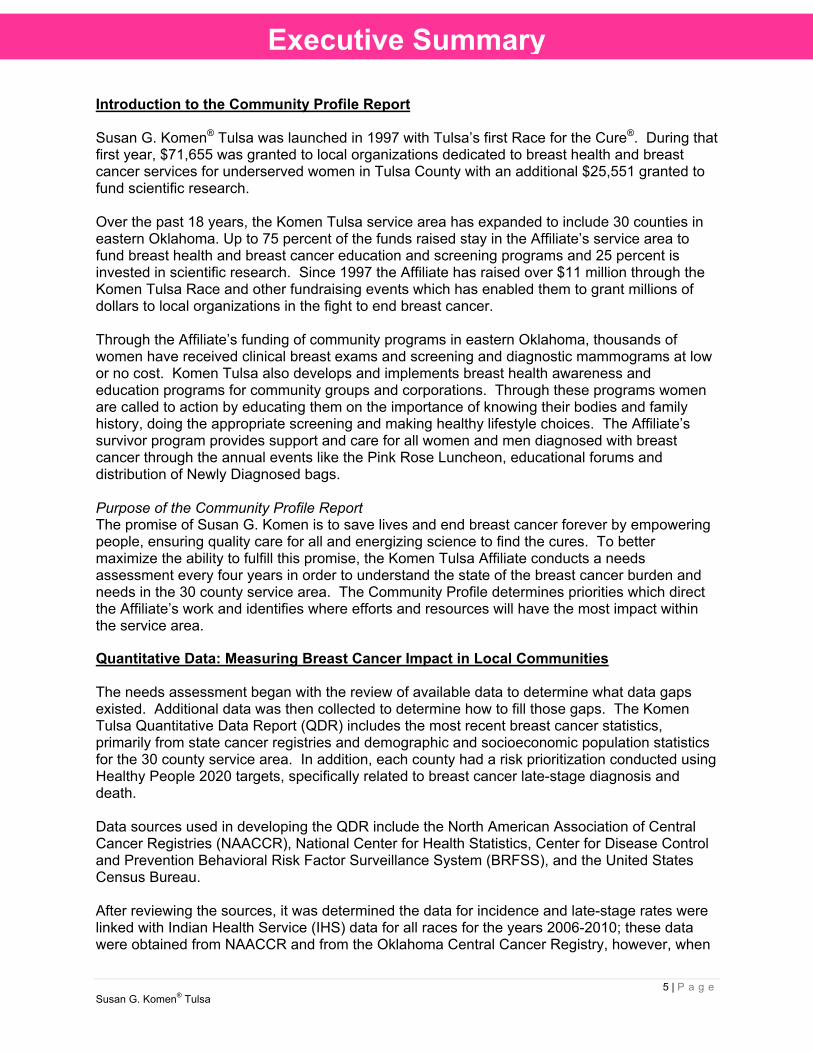
Introduction to the Community Profile Report Susan G. Komen® Tulsa was launched in 1997 with Tulsa’s first Race for the Cure®. During that first year, $71,655 was granted to local organizations dedicated to breast health and breast cancer services for underserved women in Tulsa County with an additional $25,551 granted to fund scientific research. Over the past 18 years, the Komen Tulsa service area has expanded to include 30 counties in eastern Oklahoma. Up to 75 percent of the funds raised stay in the Affiliate’s service area to fund breast health and breast cancer education and screening programs and 25 percent is invested in scientific research. Since 1997 the Affiliate has raised over $11 million through the Komen Tulsa Race and other fundraising events which has enabled them to grant millions of dollars to local organizations in the fight to end breast cancer. Through the Affiliate’s funding of community programs in eastern Oklahoma, thousands of women have received clinical breast exams and screening and diagnostic mammograms at low or no cost. Komen Tulsa also develops and implements breast health awareness and education programs for community groups and corporations. Through these programs women are called to action by educating them on the importance of knowing their bodies and family history, doing the appropriate screening and making healthy lifestyle choices. The Affiliate’s survivor program provides support and care for all women and men diagnosed with breast cancer through the annual events like the Pink Rose Luncheon, educational forums and distribution of Newly Diagnosed bags. Purpose of the Community Profile Report The promise of Susan G. Komen is to save lives and end breast cancer forever by empowering people, ensuring quality care for all and energizing science to find the cures. To better maximize the ability to fulfill this promise, the Komen Tulsa Affiliate conducts a needs assessment every four years in order to understand the state of the breast cancer burden and needs in the 30 county service area. The Community Profile determines priorities which direct the Affiliate’s work and identifies where efforts and resources will have the most impact within the service area.
Quantitative Data: Measuring Breast Cancer Impact in Local Communities The needs assessment began with the review of available data to determine what data gaps existed. Additional data was then collected to determine how to fill those gaps. The Komen Tulsa Quantitative Data Report (QDR) includes the most recent breast cancer statistics, primarily from state cancer registries and demographic and socioeconomic population statistics for the 30 county service area. In addition, each county had a risk prioritization conducted using Healthy People 2020 targets, specifically related to breast cancer late-stage diagnosis and death. Data sources used in developing the QDR include the North American Association of Central Cancer Registries (NAACCR), National Center for Health Statistics, Center for Disease Control and Prevention Behavioral Risk Factor Surveillance System (BRFSS), and the United States Census Bureau. After reviewing the sources, it was determined the data for incidence and late-stage rates were linked with Indian Health Service (IHS) data for all races for the years 2006-2010; these data were obtained from NAACCR and from the Oklahoma Central Cancer Registry, however, when
Executive Summary
6 | P a g e Susan G. Komen® Tulsa
investigating the American Indian and Alaska Native (AIAN) death data, obtained from the State Cancer Profiles website, it was apparent that it was not linked to IHS data. Due to Oklahoma’s large American Indian population, the Affiliate wanted to ensure the breast cancer death rates were accurately reflected for this population and worked with the Oklahoma State Department of Health (OSDH) to access linked race-specific death data. The Affiliate compared the non-linked age-adjusted death rate (AAMR) data in the QDR with the linked data from OSDH’s OK2Share website and found only slight variances in reported numbers for the White and Black/African-American populations. The greatest variance was found in the AIAN population. Non-linked AAMR reported as 20.3 per 100,000, while the linked data was 31.1 per 100,000. The variance confirmed that the AAMR is an under-reported number for the AIAN population and may be due to potential race misclassification. Once misclassification was accounted for, it was determined the rates were higher but still followed similar trends. IHS-linked death data, QDR incidence and late-stage rates provided justification for the Affiliate to focus on AIAN and the Black/African-American population within the target communities. Selection of Target Communities By exploring the breast cancer statistics in the service area, the Affiliate was able to determine target communities. Key indicators the Affiliate reviewed when selecting target communities included, but are not limited to breast cancer incidence, death and late-stage rates and trends, as well as urban and rural classification, poverty, the medically underserved and access to care. The Affiliate’s selected target communities are Tulsa, Osage, Rogers and Wagoner counties. The Affiliate also focused on Black/African-American and AIAN females due to the Black/African-American population trends showing slight increases and the AIAN death rates being higher than the Affiliate service area. Additionally, these counties were selected based upon geographic proximity, existing partnerships and ability for the Affiliate to efficiently and effectively utilize its resources for services. These counties contain a little over half of the Komen Tulsa Affiliate’s female population and have large populations of Black/African-American, AIAN, and rural residents. According to the Centers for Disease Control and Prevention, “People living in rural areas may have greater financial burden, social isolation, stress and lower accessibility to health care, which may contribute to health behaviors and health outcomes (Schootman, Homan, Weaver, Jeffe, & Yun, 2013).” This is thought to be part of the contributing factors leading to poor breast health outcomes. Tulsa County Tulsa County has been selected as a target community because it is not likely to meet HP2020 targets for death rate or late-stage incidence rate and has a higher-than-average Black/African-American population. Tulsa County is the largest population of all the counties in the Affiliate service area with a Black/African-American population at 12.4 percent that is almost double the average of the service area. The county’s late-stage incidence rate is significantly higher than the service area as a whole and the annual percentage change is trending up for the county. While the death rate is higher than the Affiliate service area the percentage change rate is trending down 1.2 percent. Osage County Osage County, home of the Osage Nation, is the largest county in Oklahoma by area size. The City of Tulsa is located primarily in Tulsa County, but portions extend into Osage County. Osage county was selected as a target community due to its larger female Black/African-
7 | P a g e Susan G. Komen® Tulsa
American and AIAN populations, and the amount of time needed to meet the HP 2020 target for late-stage incidence rates. Nearly 60 percent of the female population in Osage County lives in rural areas, compared to that of the Affiliate as a whole at 38.5 percent. The Black/African-American population is almost twice that of the Affiliate, and AIAN females make up 16.6 percent of the population. The incidence and late-stage rates are lower than the Affiliate service area, but their annual percent change rates are trending up with late-stage climbing 12.5 percent. Rogers County Half the population of Rogers County, located on the northeast border of Tulsa County, is rural and not likely to meet the HP 2020 targets for death or late-stage incidence rates. The county has a higher AIAN female population when compared to the Affiliate service area as a whole. In addition, Rogers County has a higher death rate than the Affiliate service area, factors which contributed to this county’s selection as a target community. The incidence rate for Rogers County is lower than the service area as a whole, while the annual percentage change is trending up 4.5 percent. Wagoner County Wagoner County adjoins the southeastern portion of Tulsa County. Its second largest population is AIAN at 11.8 percent and it was selected as a target community because it is not likely to meet the HP 2020 targets for death or late-stage incidence rates. The county’s breast cancer death rate is higher than the Affiliate service area. While the incidence and late-stage rates are lower than the service area as a whole, both categories show annual percentage change trends increasing, with incidence rates at 9.1 percent and late-stage at 5.0 percent.
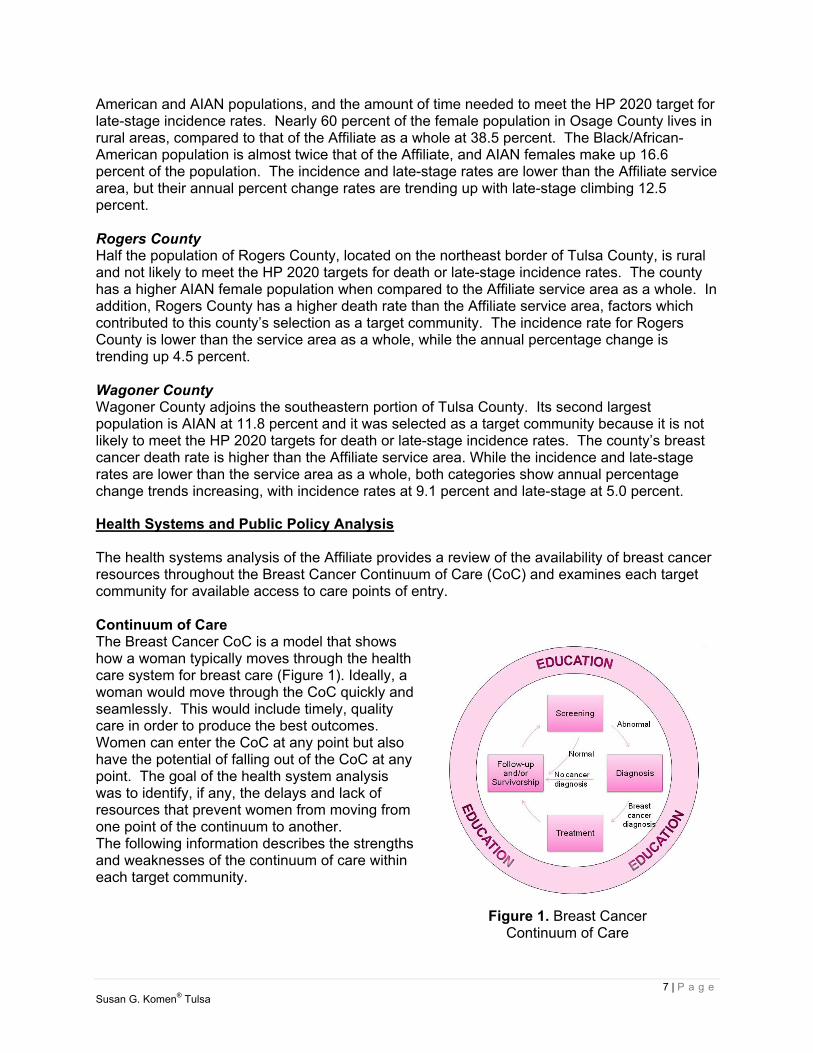
Health Systems and Public Policy Analysis The health systems analysis of the Affiliate provides a review of the availability of breast cancer resources throughout the Breast Cancer Continuum of Care (CoC) and examines each target community for available access to care points of entry. Continuum of Care The Breast Cancer CoC is a model that shows how a woman typically moves through the health care system for breast care (Figure 1). Ideally, a woman would move through the CoC quickly and seamlessly. This would include timely, quality care in order to produce the best outcomes. Women can enter the CoC at any point but also have the potential of falling out of the CoC at any point. The goal of the health system analysis was to identify, if any, the delays and lack of resources that prevent women from moving from one point of the continuum to another. The following information describes the strengths and weaknesses of the continuum of care within each target community.
Figure 1. Breast Cancer Continuum of Care

8 | P a g e Susan G. Komen® Tulsa
Tulsa County Tulsa County, the Affiliate’s largest county, houses many resources including three hospitals that provide breast cancer services along the entire CoC and a number of Federally Qualified Health Centers (FQHCs) that serve the AIAN and Black/African-American populations, located near vulnerable populations and provides transportation to their facilities. While women in Tulsa County have many options, there still appears to be a challenge with access to care and retaining women in the CoC in certain areas of the county. Some identified barriers include, no access to mobile mammography, a lack of adequate transportation for the underserved population, lack of child care to keep appointments, lack of insurance coverage, fear, and real and perceived stigmas. Osage County Osage county has its own advantages including a Cherokee Nation operated clinic, one of the only American Indian tribes who administer a National Breast and Cervical Cancer Early Detection Program (NBCCEDP). The already established relationship between the Affiliate and the tribe has resulted in development of cultural and language-appropriate materials on breast self-awareness and mammography. Overall, however, a lack of resources exists. Osage County only has resources that cover two of the four stages of the CoC forcing residents to travel outside of the county to receive care. No Affiliate work has been done in this county to date. Relationships exist with county partners but they need to be made stronger in order to fill the gaps of care within the county. Rogers County Rogers County has within its borders two branch locations of major hospitals, however, many barriers still exist for women to enter into the CoC. Existing organizations do not go beyond screening and diagnostics for breast health in Rogers County. Rogers County does have the advantage of housing a health department that has partnered with the organization Oklahoma Project Woman, an organization that works throughout Oklahoma in order to provide resources for women throughout the CoC, in order to provide mammography screenings. Additionally, the Affiliate has strong partnerships with the major hospitals’ main locations giving a possible opportunity to the Affiliate to continue to partner and meet the needs of the county. Wagoner County Wagoner County contains within it a community hospital and an AIAN clinic operated by the Muscogee Creek Nation. While these facilities cover the first two points of care on the CoC, no organization offers treatment or follow-up services for residents forcing them to be referred out of the county for care. The local health department is the only county health department located within the Affiliate’s four target communities that does not partner with Oklahoma Project Woman. Therefore, there are no available mammography screening options for women in need through the health department. Additionally, the Affiliate has no strong ties with existing organizations. Public Policy Implications for Oklahoma In total, an estimated 623,000 Oklahoma residents remain uninsured even after the Affordable Care Act (ACA) was implemented. Oklahoma, along with 38 percent of the nation, chose not to expand Medicaid throughout the state (Kaiser Family Foundation, 2014). Currently, Oklahoma offers its own plan to provide affordable health care called Insure Oklahoma, which has guaranteed funding through 2015 (Insure Oklahoma, 2013). However, over 144,480 of Oklahoma’s population fall into the coverage gap (Kaiser Family Foundation, 2014).
9 | P a g e Susan G. Komen® Tulsa
Oklahoma has two federally funded programs that play a large role in influencing breast health in Oklahoma: Oklahoma’s BCCEDP (Take Charge!) for screening and the Oklahoma Cares Program. Continued funding of these programs will be vital in order to screen, diagnose, and treat breast cancer for those who remain uninsured. In many respects, it is too soon to tell what sort of implications the ACA will have on the Affiliate. Utilization of Oklahoma’s BCCEDP has remained consistent since before the open enrollment period of the ACA (Oklahoma State Department of Health, personal communication, July 1, 2014), but possible implications on the Affiliate could include a shift in a need for funds to cover diagnostic services given the possible increase of insured women who have access to screening but not diagnosis. Additionally, in the 2013, the Oklahoma legislature created the Advancement of Wellness Advisory Council to advance the health of all Oklahomans. The Affiliate’s Executive Director was appointed to a three-year term by the Governor of Oklahoma to represent the state’s Breast and Cervical Cancer program on the Council. This appointment provides the Affiliate with an opportunity to play a role in policy on breast health in the state of Oklahoma. Health Systems and Public Policy Analysis Findings The health systems and public policy analysis findings allowed the Affiliate to recognize strengths and weaknesses within the four target communities. It has provided opportunities for the Tulsa Affiliate to find solutions for access to care using what health systems exist today. It will help the Affiliate to strengthen existing partners and create new opportunities for new collaborations in order to provide sustainable implementations of programs and resources that provide women access to all stages of care. The Affiliate will continue to create bridges where gaps exist through Komen Tulsa’s Executive Director’s involvement on the state’s Wellness Advisory Council and other likeminded organizations. From what has been discovered through the health systems analysis, barriers exist in all four target communities. While Tulsa County has the strongest programs in place to address each stage of the CoC, the Affiliate will seek to strengthen relationships and support the already identified resources and organizations to fill the needs. As for the remaining three target communities, the Affiliate will begin to implement solutions to address breast health care, discovered during collection and analysis of the qualitative data.
Qualitative Data: Ensuring Community Input In order to further explore breast health issues including attitudes, beliefs and behaviors within the Affiliate’s target communities, the Affiliate conducted qualitative research through focus groups and key informant interviews within each target community. Participants included women who sought out and/or obtained breast health services in the selected counties or individuals, community leaders, health care professionals, patients, survivors, and co-survivors who had firsthand knowledge of the community. The breakdown of key informant and focus groups’ demographic data is included within the qualitative data section of this report. Each key informant or focus group was asked a total of ten questions. Key informant questions dealt with the functions performed by their organization, the participant’s degree of knowledge and their role in the CoC. Participants answered questions regarding where women are most likely to obtain breast health care information and the most effective way to educate them as well as the process for a patient to access care and what follow up care existed in their area. In addition, they were asked their views regarding barriers to care, which existing programs and

10 | P a g e Susan G. Komen® Tulsa
policies were effective and ineffective at delivering breast health care and what new programs and policies were needed. An analysis of the key informant data revealed three patterns: a) there is little to no follow-up care especially in rural areas; b) the most common barriers to care included transportation, funding, fear, distance, and cultural issues (language, lack of cultural competence); and c) there is lack of education in both patients and health care professionals. The focus group data analysis produced five themes and subthemes including: a) the need for accurate health information; b) the need for more access to health services; c) barriers to health care; d) motivations to seek care; and e) community health problems. The subthemes that were revealed included inconsistent information, limited medical facilities, lack of time, finances, fear, and distrust of the medical profession. Other findings included the discovery that for 44.0 percent of the respondents, it took more than four weeks to receive treatment from the time of diagnosis. Qualitative Data Findings Through conducting key informant interviews and focus groups, the Affiliate has gained a better understanding of the breast cancer burden and needs within each target community. As seen by the themes and subthemes during the analysis process, overall care, particularly breast health care, has many issues that are interrelated and multifaceted which is effecting the breast health disparities in incidence, late-stage and death rates, especially among the Black/African-American and AIAN populations. Findings show that barriers to care include poverty, lack of transportation, lack of physicians and issues with access to care. The quantitative data and HSA led the Affiliate to seek out information about services, roles, processes/protocols, strengths/weaknesses, and recommendations. The data collected from those responses highlighted the need for more accurate health information, access to health services, motivation to seek care, and an increase in health status within the target communities in order to positively affect breast health care in the target communities
Mission Action Plan Based off of the data collected and the analysis of that data, the findings led the Affiliate to create a mission action plan for the four target communities in order to guide in next steps. The following includes county specific mission action plans. Tulsa County Problem Statement – According to key informant interviews and focus groups for Tulsa County, breast health care disparities in Tulsa County continue to result in late-stage breast cancer diagnosis and high death rate particularly in Black/African-American and American Indian/Alaskan Native (AIAN) populations due to barriers to adequate breast health care including lack of insurance, lack of education, lack of financial resources, fear, distrust and the need for mobile mammography.
Priority 1: Education - Provide educational resources for health care providers in Tulsa County to facilitate an increase in knowledge about breast health awareness and access points for care for vulnerable populations.
11 | P a g e Susan G. Komen® Tulsa
Objective 1: Beginning in 2016, conduct annual collaboration meetings in Tulsa County with health care providers, pharmacies, coalition partners and community leaders to share current guidelines and local resources for under and uninsured women.
Objective 2: Work with Tulsa County health science and culturally specific
community organizations in 2017 to develop a peer education program targeting vulnerable women that can be taken into communities of influence, such as places of worship and community centers.
Objective 3: In 2016-2017, develop and distribute a resource kit for Tulsa County
health care providers and clinics to utilize with vulnerable patients needing information on available breast health services.
Priority 2: Financial Barriers - Decrease financial barriers that prevent women from receiving screening, treatment and diagnosis in Tulsa County.
Objective 1: In 2017, create and distribute brochures about financial services
available to the uninsured and underinsured in Tulsa County.
Objective 2: Develop new collaborative relationships by 2018 with at least three Tulsa County community-based organizations whose target populations are Black/African-American and AIAN to help meet the identified financial needs.
Objective 3: Investigate ways to work with Tulsa Healthcare Coverage Project by
2016 to educate vulnerable populations regarding financial resources available for breast health services.
Priority 3: Cultural Mindset - Address trust issues and build rapport between Tulsa County community members and health care professionals through the development of a culturally competent peer volunteer program to support under and uninsured, Black/African-American, and AIAN populations along the breast cancer continuum of care.
Objective 1: As part of the annual collaboration meetings in Tulsa County,
implement a cultural competency workshop for health care professionals, pharmacies, coalition partners and community leaders followed up with Tulsa County specific resources for more extensive training by 2017.
Objective 2: By 2018, develop and implement a culturally competent peer
volunteer program in Tulsa County to support local women along the breast cancer continuum of care.
Priority 4: Transportation - Explore and develop a baseline for services that are available within Tulsa County to address transportation needs.
Objective 1: Explore existing and potential options for transportation within Tulsa
County for distribution to health care professionals to utilize with their vulnerable patients in 2016.

12 | P a g e Susan G. Komen® Tulsa
Objective 2: In 2016 create a coalition of community and health care partners to explore the option of reinstating mobile mammography for Tulsa County.
Priority 5: Advocacy - Leverage relationships in Tulsa County with elected officials, community leaders and existing partnerships to increase breast health awareness.
Objective 1: Recruit Tulsa community and elected leaders to attend the state
breast cancer advocacy day starting in 2016.
Objective 2: Organize local advocacy day by 2018 to bring community leaders, elected officials, and tribal government representatives together to educate on the impact of breast cancer in Tulsa County.
Osage County Problem Statement – According to key informant interviews and focus groups for Osage County, breast health care disparities in Osage County continue in rural areas due to physician shortages, financial barriers and transportation issues extending late-stage breast cancer incidence rates.
Priority 1: Education - Provide educational resources for women and health care providers in Osage County to facilitate an increase in knowledge about breast health awareness and access points for care.
Objective 1: Work with community organizations in Osage County in 2016 to
develop a peer education program targeting vulnerable women that be taken into communities of influence such as places of worship and community centers.
Objective 2: By 2017, conduct at least 2 breast health awareness seminars for
Black/African-American and AIAN populations and seek out opportunities to participate health fairs in Osage County each year.
Objective 3: In 2016-2017, develop and distribute a resource kit for Osage County health care providers and clinics to utilize with vulnerable patients needing information on local available breast health services.
Priority 2: Financial Barriers - Decrease financial barriers that prevent women from receiving screening, treatment and diagnosis in Osage County.
Objective 1: Beginning in 2016, utilize brochures from existing partners
regarding available financial assistance, including access to free breast cancer screening, and distribute to the uninsured and underinsured through low income community centers, low income housing, and libraries in Osage County.
Objective 2: By 2016, identify at least five providers, community organizations
and local pharmacies that work with vulnerable women in Osage County zip codes with high populations below the poverty level and collaborate by providing information through the resource kit about financial barriers.
13 | P a g e Susan G. Komen® Tulsa
Priority 3: Collaborative Relationships - Create and strengthen relationships within Osage County in order to break down barriers and provide needed resources.
Objective 1: In 2016, develop at least three new partnerships with Osage Nation
community leaders, elected officials, and Black/African-American community leaders in Osage County to increase breast health awareness and invite them to be a part of the annual collaboration meetings aimed at health care providers, pharmacies, coalition partners and community leaders.
Rogers County Problem Statement - According to key informant interviews and focus groups for Rogers County, breast health care disparities in Rogers County are due to logistical barriers and lack of insurance, knowledge, and time as well as fear/anxiety have led to a higher than average breast cancer death rate.
Priority 1: Education - Provide educational resources for women and health care providers in Rogers County in order to mitigate fear and facilitate an increase in knowledge about breast health awareness and access points for care.
Objective 1: In 2016, work with Rogers County health science and culturally
specific community organizations to develop a peer education program targeting vulnerable women that can be taken into communities of influence, such as places of worship and community centers.
Objective 2: In 2016-2017, develop and distribute a resource kit for health care providers, clinics, churches, universities and the health department in Rogers County to be utilized with vulnerable patients needing information on available breast health services within Rogers County.
Objective 3: By 2017, conduct at least 2 breast health awareness seminars for AIAN populations and seek out opportunities to participate in health fairs in Rogers County each year.
Priority 2: Financial Barriers - Decrease financial barriers that prevent women from receiving screening, treatment and diagnosis in Rogers County.
Objective 1: Beginning in 2016, utilize brochures from existing partners
regarding available financial assistance, including access to free breast cancer screening and distribute to the underinsured and uninsured though low income community centers, low income housing, and libraries in Rogers County.
Objective 2: By 2016, identify at least five providers, community organizations
and local pharmacies that work with uninsured and underinsured women in Rogers County zip codes with high populations below the poverty level and collaborate by providing information through the resource kit about financial barriers.
Objective 3: By 2017, identify a solution to bring mobile mammography into
Rogers County.
14 | P a g e Susan G. Komen® Tulsa
Priority 3: Advocacy - Leverage relationships in Rogers County with elected officials, community leaders and existing partnerships to increase breast health awareness.
Objective 1: Recruit Rogers County community and elected leaders to attend the
state breast cancer advocacy day starting in 2016. Wagoner County Problem Statement - According to key informant interviews and focus groups for Wagoner County, breast health care disparities in Wagoner County continue to lead to higher than average breast cancer death rates due to barriers including insufficient finances, transportation, fear and distrust.
Priority 1: Education - Provide educational resources for women and health care providers in Wagoner County in order to mitigate fear and facilitate an increase in knowledge about breast health awareness and access points for care.
Objective 1: Work with area health science and culturally specific community
organizations in Wagoner County in 2016 to develop a peer education program targeting vulnerable women that can be taken into communities of influence, such as places of worship and community centers that have an impact on vulnerable populations.
Objective 2: In 2016-2017, develop and distribute a resource kit for health care providers, clinics, churches, universities and the health department in Wagoner County to utilize with vulnerable patients needing information on available breast health services and transportation options within Wagoner County.
Objective 3: By 2017, conduct at least 2 breast health awareness seminars and seek out opportunities to participate in health fairs in Wagoner County each year.
Priority 2: Financial Resources - Identify resources and build relationships that decrease financial barriers and address transportation needs that limit and prevent women in Wagoner County from receiving screening, treatment, and diagnosis.
Objective 1: Develop relationships with at least two organizations to determine
feasibility of providing mobile breast health services in Wagoner County by 2017.
Objective 2: Beginning in 2016, utilize brochures from existing partners regarding available financial assistance, including assess to free breast cancer screening, and distribute to the uninsured and underinsured through low income community centers, low income housing, and libraries in Wagoner County.
Objective 3: By 2016, identify at least five providers, community organizations
and local pharmacies that work with uninsured and underinsured women in Wagoner County and collaborate by providing information through the resource kit about available financial assistance.
Disclaimer: Comprehensive data for the Executive Summary can be found in the 2015 Susan G. Komen® Tulsa Community Profile Report.

15 | P a g e Susan G. Komen® Tulsa
Affiliate History Susan G. Komen® Tulsa was established in 1997. During that first year, $71,655 was granted to local organizations dedicated to providing breast health and breast cancer services for underserved women in Tulsa County, Oklahoma. In addition, $25,551 was granted to fund scientific research. Over the past 18 years, Komen Tulsa has grown considerably, and in 2011, expanded its service area to include an additional 29 counties in eastern Oklahoma. Since 1997, the Tulsa Affiliate has granted over $5 million to local organizations in the fight to end breast cancer. The Affiliate’s signature fundraiser, Race for the Cure®, has been voted by Tulsa People Magazine readers as one of the top five nonprofit events in the city for three consecutive years. Fundraising from this and other events enable the Affiliate to invest in community breast health programs in eastern Oklahoma. Through these community grants, thousands of women have received screening and diagnostic mammograms at low or no cost, as well as life-saving breast health education. The Affiliate’s mission programs focus on empowering people by raising awareness and educating them about breast cancer through their speakers bureau and health fairs, as well as providing thousands of education packets to businesses, community organizations and associations, churches, universities and schools. Through a partnership with the Cherokee Nation, Komen breast health education materials are translated into the Cherokee language in order to impact the high number of late-stage diagnoses for American Indian women. The Affiliate advocates at the local, state, and federal level, fighting for screening and treatment programs that save lives. Komen Tulsa’s Executive Director served two years as a member and one year as chair of The Oklahoma Breast and Cervical Cancer Prevention and Treatment (BCCPT) Advisory Committee. In 2014, the Executive Director was appointed to a three-year term on the Oklahoma Advancement of Wellness Advisory Council advocating for breast and cervical cancer issues. Komen Tulsa’s Community Health Manager serves as a member of the Oklahoma Strategic Tribal Alliance for Health whose purpose is to address the cancer rates among the American Indian population.
Affiliate Organizational Structure Komen Tulsa is a nonprofit 501(c)(3) corporation managed by an executive director who manages three staff and reports to a 15-member Affiliate board of directors (Figure 1.1). This grassroots organization relies on community activists and partnerships to address the breast cancer needs in the service area.
Introduction

16 | P a g e Susan G. Komen® Tulsa
Figure 1.1. Komen Tulsa organizational structure
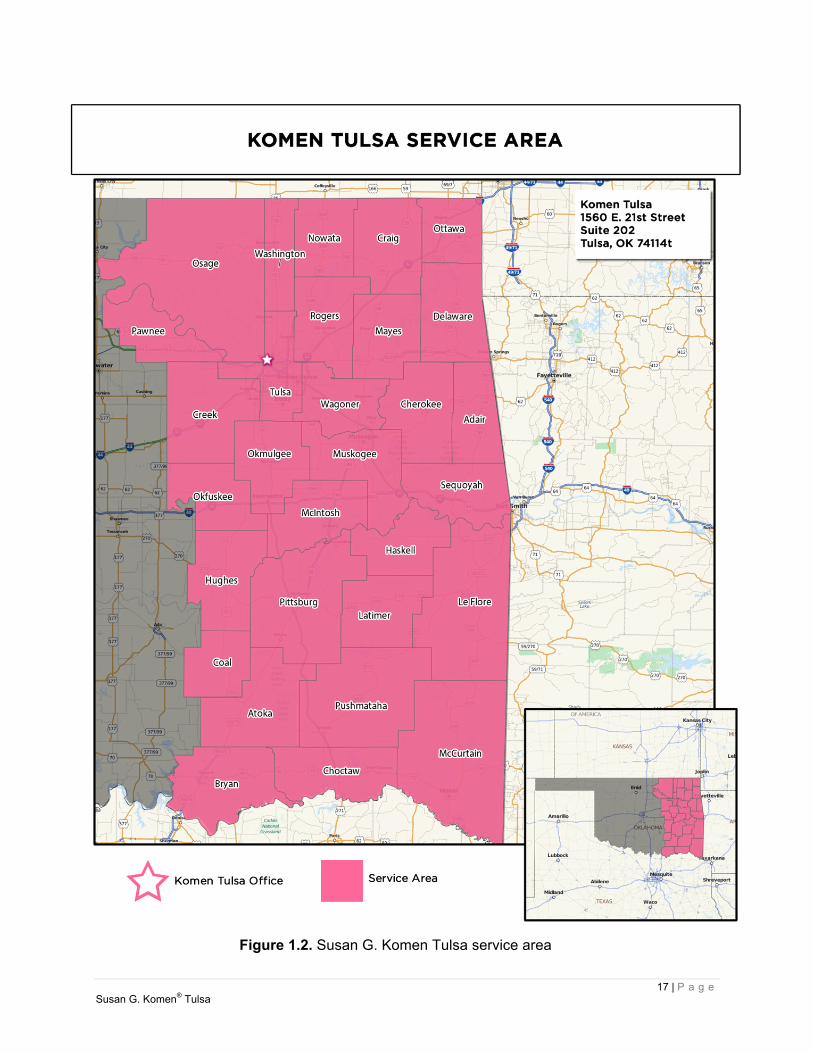
Affiliate Service Area Komen Tulsa service area encompasses 30 counties in eastern Oklahoma including the counties of Adair, Atoka, Bryan, Cherokee, Choctaw, Coal, Craig, Creek, Delaware, Haskell, Hughes, Latimer, Le Flore, McCurtain, McIntosh, Mayes, Muskogee, Nowata, Okfuskee, Okmulgee, Osage, Ottawa, Pawnee, Pittsburg, Pushmataha, Rogers, Sequoyah, Tulsa, Wagoner, and Washington (Figure 1.2). Oklahoma continues to have a growing problem with health among its rural communities. All but six of Oklahoma’s 77 counties, including most of the Affiliate’s service area, are considered medically underserved. This is thought to be due to the state experiencing a shortage of physicians (Wertz, 2012). The Komen Tulsa service area has 44.0 percent of the state’s new cases of breast cancer and late-stage diagnosis. The Affiliate service area’s age-adjusted rate of late-stage diagnosis is comparable with that of the state, however, the age adjusted death rate is higher than both the national and state average resulting in 46.9 percent of the state’s annual deaths.
17 | P a g e Susan G. Komen® Tulsa
Figure 1.2. Susan G. Komen Tulsa service area

18 | P a g e Susan G. Komen® Tulsa
Purpose of the Community Profile Report The Promise of Susan G. Komen is to save lives and end breast cancer forever by empowering people, ensuring quality care for all, and energizing science to find the cures. To better maximize the ability to fulfill this promise, Komen Tulsa conducts a Community Profile every four years to assess the breast health needs of women in the Affiliate service area. Through the Community Profile, Komen Tulsa will begin to align their strategic and operational plans, in addition to establishing granting priorities, educational needs, and direction for marketing and outreach. The results of this profile will be used to direct Komen’s work and identify where efforts and resources will have the most impact within the 30 counties.
19 | P a g e Susan G. Komen® Tulsa
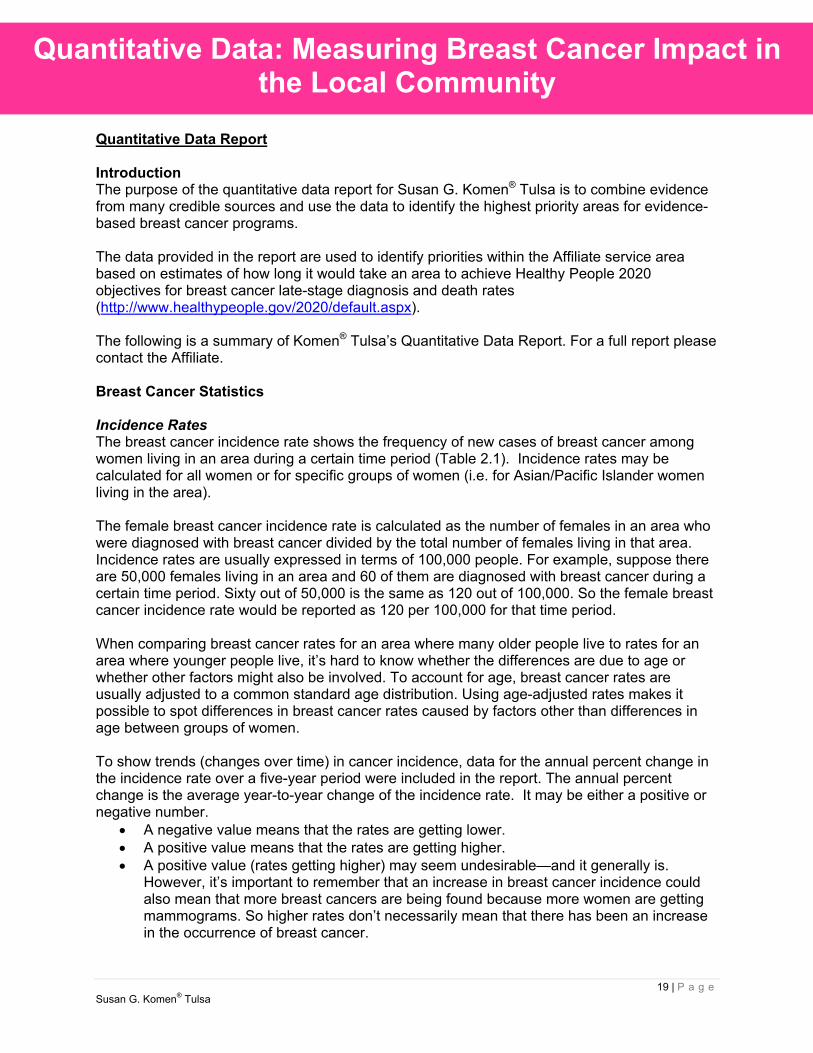
Quantitative Data Report Introduction The purpose of the quantitative data report for Susan G. Komen® Tulsa is to combine evidence from many credible sources and use the data to identify the highest priority areas for evidence-based breast cancer programs. The data provided in the report are used to identify priorities within the Affiliate service area based on estimates of how long it would take an area to achieve Healthy People 2020 objectives for breast cancer late-stage diagnosis and death rates (http://www.healthypeople.gov/2020/default.aspx). The following is a summary of Komen® Tulsa’s Quantitative Data Report. For a full report please contact the Affiliate. Breast Cancer Statistics Incidence Rates The breast cancer incidence rate shows the frequency of new cases of breast cancer among women living in an area during a certain time period (Table 2.1). Incidence rates may be calculated for all women or for specific groups of women (i.e. for Asian/Pacific Islander women living in the area). The female breast cancer incidence rate is calculated as the number of females in an area who were diagnosed with breast cancer divided by the total number of females living in that area. Incidence rates are usually expressed in terms of 100,000 people. For example, suppose there are 50,000 females living in an area and 60 of them are diagnosed with breast cancer during a certain time period. Sixty out of 50,000 is the same as 120 out of 100,000. So the female breast cancer incidence rate would be reported as 120 per 100,000 for that time period. When comparing breast cancer rates for an area where many older people live to rates for an area where younger people live, it’s hard to know whether the differences are due to age or whether other factors might also be involved. To account for age, breast cancer rates are usually adjusted to a common standard age distribution. Using age-adjusted rates makes it possible to spot differences in breast cancer rates caused by factors other than differences in age between groups of women. To show trends (changes over time) in cancer incidence, data for the annual percent change in the incidence rate over a five-year period were included in the report. The annual percent change is the average year-to-year change of the incidence rate. It may be either a positive or negative number.
A negative value means that the rates are getting lower. A positive value means that the rates are getting higher. A positive value (rates getting higher) may seem undesirable—and it generally is.
However, it’s important to remember that an increase in breast cancer incidence could also mean that more breast cancers are being found because more women are getting mammograms. So higher rates don’t necessarily mean that there has been an increase in the occurrence of breast cancer.
Quantitative Data: Measuring Breast Cancer Impact in the Local Community
20 | P a g e Susan G. Komen® Tulsa
Death Rates The breast cancer death rate shows the frequency of death from breast cancer among women living in a given area during a certain time period (Table 2.1). Like incidence rates, death rates may be calculated for all women or for specific groups of women (i.e. Black/African-American women). The death rate is calculated as the number of women from a particular geographic area who died from breast cancer divided by the total number of women living in that area. Death rates are shown in terms of 100,000 women and adjusted for age. Data are included for the annual percent change in the death rate over a five-year period. The meanings of these data are the same as for incidence rates, with one exception. Changes in screening don’t affect death rates in the way that they affect incidence rates. So a negative value, which means that death rates are getting lower, is always desirable. A positive value, which means that death rates are getting higher, is always undesirable. Late-stage Incidence Rates For this report, late-stage breast cancer is defined as regional or distant stage using the Surveillance, Epidemiology and End Results (SEER) Summary Stage definitions (http://seer.cancer.gov/tools/ssm/). State and national reporting usually uses the SEER Summary Stage. It provides a consistent set of definitions of stages for historical comparisons. The late-stage breast cancer incidence rate is calculated as the number of women with regional or distant breast cancer in a particular geographic area divided by the number of women living in that area (Table 2.1). Late-stage incidence rates are shown in terms of 100,000 women and adjusted for age.
21 | P a g e Susan G. Komen® Tulsa
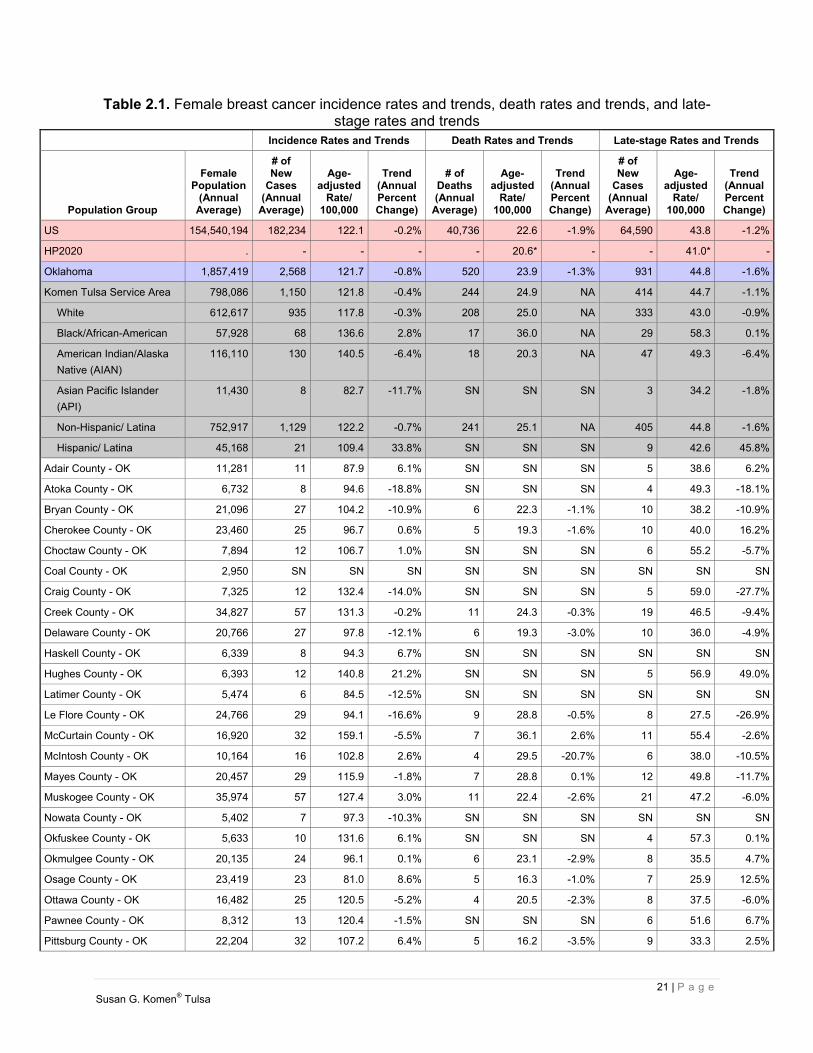
Table 2.1. Female breast cancer incidence rates and trends, death rates and trends, and late-stage rates and trends
Incidence Rates and Trends Death Rates and Trends Late-stage Rates and Trends
Population Group
Female Population
(Annual Average)
# of New
Cases (Annual
Average)
Age- adjusted
Rate/ 100,000
Trend (AnnualPercentChange)
# of Deaths(Annual
Average)
Age- adjusted
Rate/ 100,000
Trend (Annual Percent Change)
# of New
Cases (Annual
Average)
Age- adjusted
Rate/ 100,000
Trend (AnnualPercentChange)
US 154,540,194 182,234 122.1 -0.2% 40,736 22.6 -1.9% 64,590 43.8 -1.2%
HP2020 . - - - - 20.6* - - 41.0* -
Oklahoma 1,857,419 2,568 121.7 -0.8% 520 23.9 -1.3% 931 44.8 -1.6%
Komen Tulsa Service Area 798,086 1,150 121.8 -0.4% 244 24.9 NA 414 44.7 -1.1%
White 612,617 935 117.8 -0.3% 208 25.0 NA 333 43.0 -0.9%
Black/African-American 57,928 68 136.6 2.8% 17 36.0 NA 29 58.3 0.1%
American Indian/Alaska
Native (AIAN)
116,110 130 140.5 -6.4% 18 20.3 NA 47 49.3 -6.4%
Asian Pacific Islander
(API)
11,430 8 82.7 -11.7% SN SN SN 3 34.2 -1.8%
Non-Hispanic/ Latina 752,917 1,129 122.2 -0.7% 241 25.1 NA 405 44.8 -1.6%
Hispanic/ Latina 45,168 21 109.4 33.8% SN SN SN 9 42.6 45.8%
Adair County - OK 11,281 11 87.9 6.1% SN SN SN 5 38.6 6.2%
Atoka County - OK 6,732 8 94.6 -18.8% SN SN SN 4 49.3 -18.1%
Bryan County - OK 21,096 27 104.2 -10.9% 6 22.3 -1.1% 10 38.2 -10.9%
Cherokee County - OK 23,460 25 96.7 0.6% 5 19.3 -1.6% 10 40.0 16.2%
Choctaw County - OK 7,894 12 106.7 1.0% SN SN SN 6 55.2 -5.7%
Coal County - OK 2,950 SN SN SN SN SN SN SN SN SN
Craig County - OK 7,325 12 132.4 -14.0% SN SN SN 5 59.0 -27.7%
Creek County - OK 34,827 57 131.3 -0.2% 11 24.3 -0.3% 19 46.5 -9.4%
Delaware County - OK 20,766 27 97.8 -12.1% 6 19.3 -3.0% 10 36.0 -4.9%
Haskell County - OK 6,339 8 94.3 6.7% SN SN SN SN SN SN
Hughes County - OK 6,393 12 140.8 21.2% SN SN SN 5 56.9 49.0%
Latimer County - OK 5,474 6 84.5 -12.5% SN SN SN SN SN SN
Le Flore County - OK 24,766 29 94.1 -16.6% 9 28.8 -0.5% 8 27.5 -26.9%
McCurtain County - OK 16,920 32 159.1 -5.5% 7 36.1 2.6% 11 55.4 -2.6%
McIntosh County - OK 10,164 16 102.8 2.6% 4 29.5 -20.7% 6 38.0 -10.5%
Mayes County - OK 20,457 29 115.9 -1.8% 7 28.8 0.1% 12 49.8 -11.7%
Muskogee County - OK 35,974 57 127.4 3.0% 11 22.4 -2.6% 21 47.2 -6.0%
Nowata County - OK 5,402 7 97.3 -10.3% SN SN SN SN SN SN
Okfuskee County - OK 5,633 10 131.6 6.1% SN SN SN 4 57.3 0.1%
Okmulgee County - OK 20,135 24 96.1 0.1% 6 23.1 -2.9% 8 35.5 4.7%
Osage County - OK 23,419 23 81.0 8.6% 5 16.3 -1.0% 7 25.9 12.5%
Ottawa County - OK 16,482 25 120.5 -5.2% 4 20.5 -2.3% 8 37.5 -6.0%
Pawnee County - OK 8,312 13 120.4 -1.5% SN SN SN 6 51.6 6.7%
Pittsburg County - OK 22,204 32 107.2 6.4% 5 16.2 -3.5% 9 33.3 2.5%
22 | P a g e Susan G. Komen® Tulsa
Incidence Rates and Trends Death Rates and Trends Late-stage Rates and Trends
Population Group
Female Population
(Annual Average)
# of New
Cases (Annual
Average)
Age- adjusted
Rate/ 100,000
Trend (AnnualPercentChange)
# of Deaths(Annual
Average)
Age- adjusted
Rate/ 100,000
Trend (Annual Percent Change)
# of New
Cases (Annual
Average)
Age- adjusted
Rate/ 100,000
Trend (AnnualPercentChange)
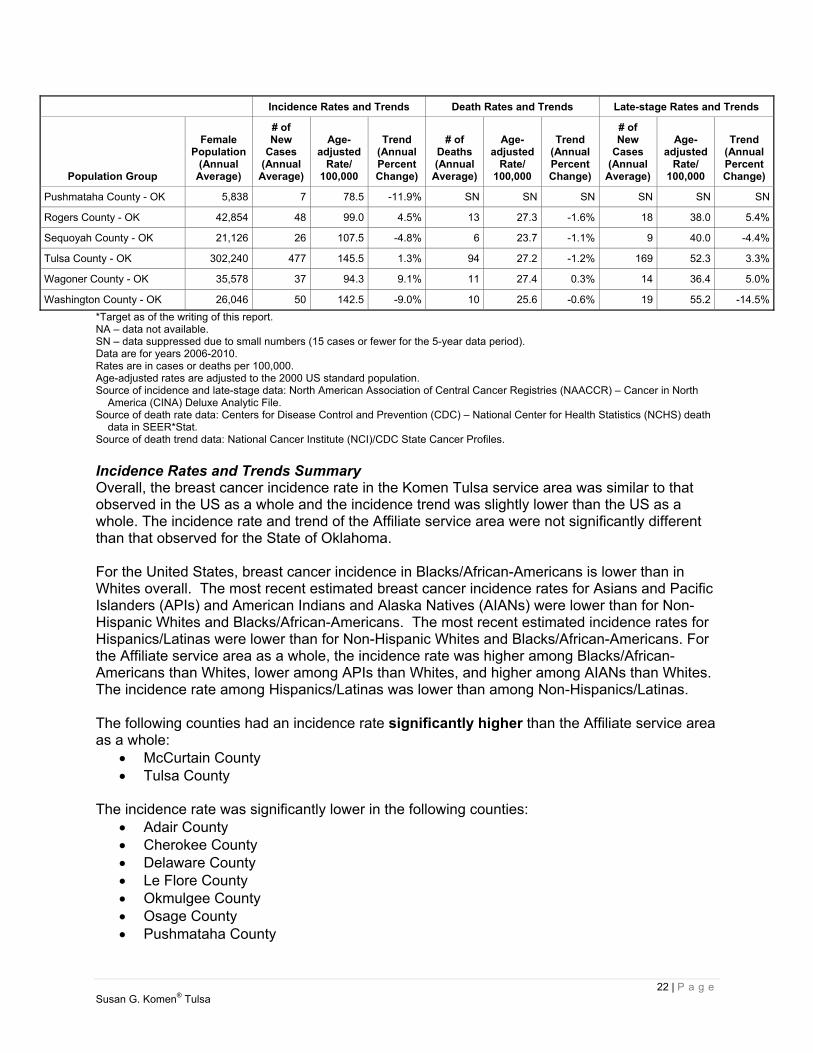
Pushmataha County - OK 5,838 7 78.5 -11.9% SN SN SN SN SN SN
Rogers County - OK 42,854 48 99.0 4.5% 13 27.3 -1.6% 18 38.0 5.4%
Sequoyah County - OK 21,126 26 107.5 -4.8% 6 23.7 -1.1% 9 40.0 -4.4%
Tulsa County - OK 302,240 477 145.5 1.3% 94 27.2 -1.2% 169 52.3 3.3%
Wagoner County - OK 35,578 37 94.3 9.1% 11 27.4 0.3% 14 36.4 5.0%
Washington County - OK 26,046 50 142.5 -9.0% 10 25.6 -0.6% 19 55.2 -14.5%
*Target as of the writing of this report. NA – data not available. SN – data suppressed due to small numbers (15 cases or fewer for the 5-year data period). Data are for years 2006-2010. Rates are in cases or deaths per 100,000. Age-adjusted rates are adjusted to the 2000 US standard population. Source of incidence and late-stage data: North American Association of Central Cancer Registries (NAACCR) – Cancer in North
America (CINA) Deluxe Analytic File. Source of death rate data: Centers for Disease Control and Prevention (CDC) – National Center for Health Statistics (NCHS) death
data in SEER*Stat. Source of death trend data: National Cancer Institute (NCI)/CDC State Cancer Profiles.
Incidence Rates and Trends Summary Overall, the breast cancer incidence rate in the Komen Tulsa service area was similar to that observed in the US as a whole and the incidence trend was slightly lower than the US as a whole. The incidence rate and trend of the Affiliate service area were not significantly different than that observed for the State of Oklahoma. For the United States, breast cancer incidence in Blacks/African-Americans is lower than in Whites overall. The most recent estimated breast cancer incidence rates for Asians and Pacific Islanders (APIs) and American Indians and Alaska Natives (AIANs) were lower than for Non-Hispanic Whites and Blacks/African-Americans. The most recent estimated incidence rates for Hispanics/Latinas were lower than for Non-Hispanic Whites and Blacks/African-Americans. For the Affiliate service area as a whole, the incidence rate was higher among Blacks/African-Americans than Whites, lower among APIs than Whites, and higher among AIANs than Whites. The incidence rate among Hispanics/Latinas was lower than among Non-Hispanics/Latinas. The following counties had an incidence rate significantly higher than the Affiliate service area as a whole:
McCurtain County Tulsa County
The incidence rate was significantly lower in the following counties:
Adair County Cherokee County Delaware County Le Flore County Okmulgee County Osage County Pushmataha County
23 | P a g e Susan G. Komen® Tulsa
Rogers County Wagoner County
The rest of the counties had incidence rates and trends that were not significantly different than the Affiliate service area as a whole or did not have enough data available. It’s important to remember that an increase in breast cancer incidence could also mean that more breast cancers are being found because more women are getting mammograms. Death Rates and Trends Summary Overall, the breast cancer death rate in the Komen Tulsa service area was slightly higher than that observed in the US as a whole and the death rate trend was not available for comparison with the US as a whole. The death rate of the Affiliate service area was not significantly different than that observed for Oklahoma. For the United States, breast cancer death rates in Blacks/African-Americans are substantially higher than in Whites overall. The most recent estimated breast cancer death rates for APIs and AIANs were lower than for Non-Hispanic Whites and Blacks/African-Americans. The most recent estimated death rates for Hispanics/Latinas were lower than for Non-Hispanic Whites and Blacks/African-Americans. For the Affiliate service area as a whole, the death rate was higher among Blacks/African-Americans than Whites and lower among AIANs than Whites. There were not enough data available within the Affiliate service area to report on APIs so comparisons cannot be made for this racial group. Also, there were not enough data available within the Affiliate service area to report on Hispanics/Latinas so comparisons cannot be made for this group. Significantly less favorable trends in breast cancer death rates were observed in the following county:
McCurtain County The rest of the counties had death rates and trends that were not significantly different than the Affiliate service area as a whole or did not have enough data available. Late-stage Incidence Rates and Trends Summary Overall, the breast cancer late-stage incidence rate and trend in the Komen Tulsa service area were similar to that observed in the US as a whole. The late-stage incidence rate and trend of the Affiliate service area were not significantly different than that observed for the State of Oklahoma. For the United States, late-stage incidence rates in Blacks/African-Americans are higher than among Whites. Hispanics/Latinas tend to be diagnosed with late-stage breast cancers more often than Whites. For the Affiliate service area as a whole, the late-stage incidence rate was higher among Blacks/African-Americans than Whites, lower among APIs than Whites, and higher among AIANs than Whites. The late-stage incidence rate among Hispanics/Latinas was slightly lower than among Non-Hispanics/Latinas. The following county had a late-stage incidence rate significantly higher than the Affiliate service area as a whole:
Tulsa County
24 | P a g e Susan G. Komen® Tulsa
The late-stage incidence rate was significantly lower in the following counties: Le Flore County Osage County
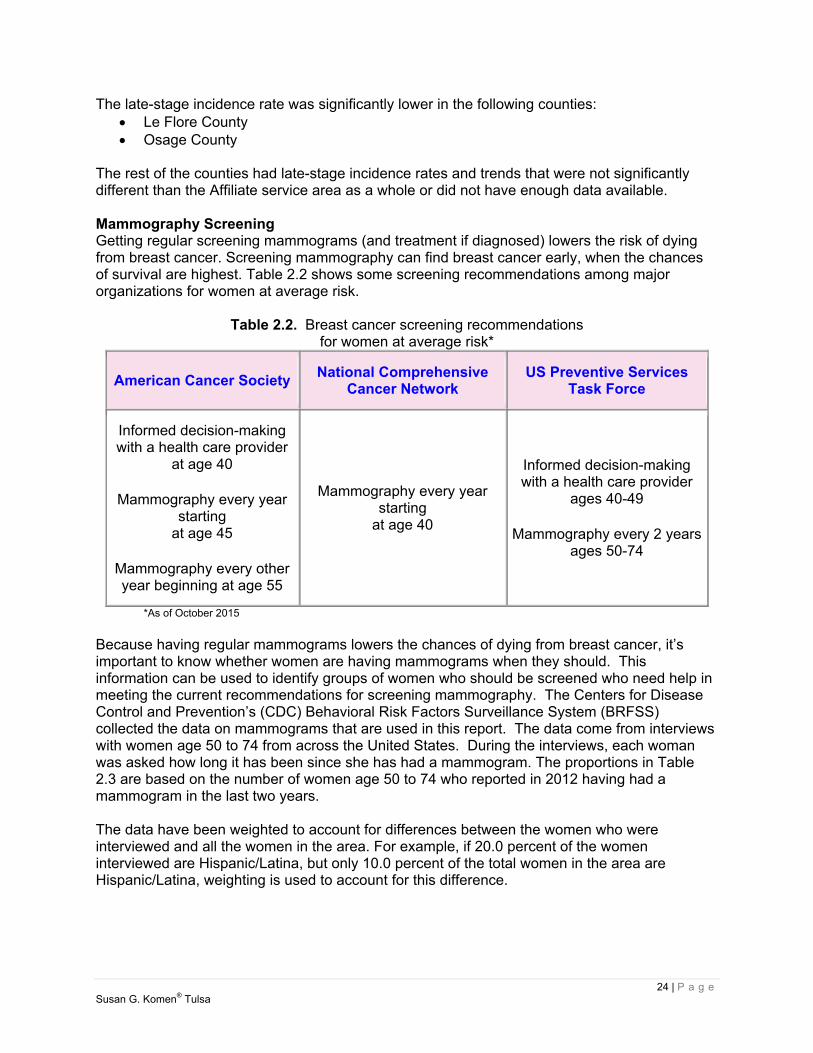
The rest of the counties had late-stage incidence rates and trends that were not significantly different than the Affiliate service area as a whole or did not have enough data available. Mammography Screening Getting regular screening mammograms (and treatment if diagnosed) lowers the risk of dying from breast cancer. Screening mammography can find breast cancer early, when the chances of survival are highest. Table 2.2 shows some screening recommendations among major organizations for women at average risk.
Table 2.2. Breast cancer screening recommendations for women at average risk*
American Cancer Society
National Comprehensive Cancer Network
US Preventive Services Task Force
Informed decision-making with a health care provider
at age 40
Mammography every year starting
at age 45
Mammography every other year beginning at age 55
Mammography every year starting
at age 40
Informed decision-making with a health care provider
ages 40-49
Mammography every 2 yearsages 50-74
*As of October 2015
Because having regular mammograms lowers the chances of dying from breast cancer, it’s important to know whether women are having mammograms when they should. This information can be used to identify groups of women who should be screened who need help in meeting the current recommendations for screening mammography. The Centers for Disease Control and Prevention’s (CDC) Behavioral Risk Factors Surveillance System (BRFSS) collected the data on mammograms that are used in this report. The data come from interviews with women age 50 to 74 from across the United States. During the interviews, each woman was asked how long it has been since she has had a mammogram. The proportions in Table 2.3 are based on the number of women age 50 to 74 who reported in 2012 having had a mammogram in the last two years. The data have been weighted to account for differences between the women who were interviewed and all the women in the area. For example, if 20.0 percent of the women interviewed are Hispanic/Latina, but only 10.0 percent of the total women in the area are Hispanic/Latina, weighting is used to account for this difference.
25 | P a g e Susan G. Komen® Tulsa
The report uses the mammography screening proportion to show whether the women in an area are getting screening mammograms when they should. Mammography screening proportion is calculated from two pieces of information:
The number of women living in an area whom the BRFSS determines should have mammograms (i.e. women age 50 to 74).
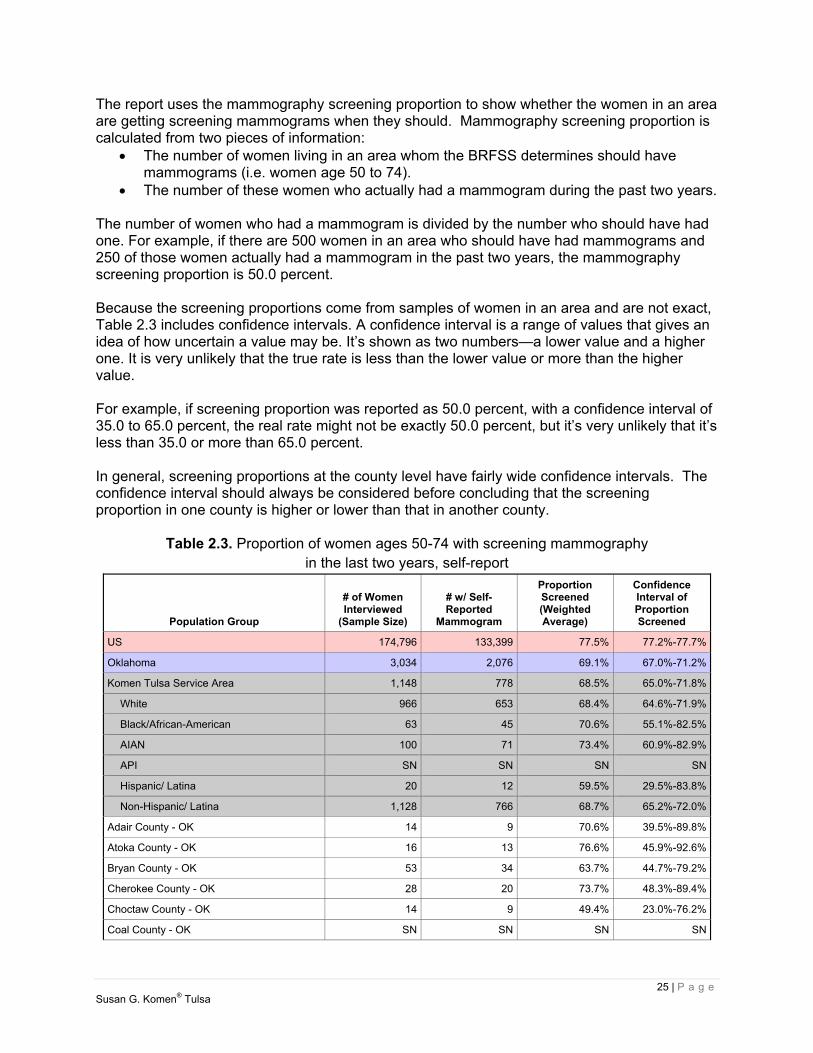
The number of these women who actually had a mammogram during the past two years. The number of women who had a mammogram is divided by the number who should have had one. For example, if there are 500 women in an area who should have had mammograms and 250 of those women actually had a mammogram in the past two years, the mammography screening proportion is 50.0 percent. Because the screening proportions come from samples of women in an area and are not exact, Table 2.3 includes confidence intervals. A confidence interval is a range of values that gives an idea of how uncertain a value may be. It’s shown as two numbers—a lower value and a higher one. It is very unlikely that the true rate is less than the lower value or more than the higher value. For example, if screening proportion was reported as 50.0 percent, with a confidence interval of 35.0 to 65.0 percent, the real rate might not be exactly 50.0 percent, but it’s very unlikely that it’s less than 35.0 or more than 65.0 percent. In general, screening proportions at the county level have fairly wide confidence intervals. The confidence interval should always be considered before concluding that the screening proportion in one county is higher or lower than that in another county.
Table 2.3. Proportion of women ages 50-74 with screening mammography in the last two years, self-report
Population Group
# of Women Interviewed
(Sample Size)
# w/ Self- Reported
Mammogram
Proportion Screened (Weighted Average)
Confidence Interval of Proportion Screened
US 174,796 133,399 77.5% 77.2%-77.7%
Oklahoma 3,034 2,076 69.1% 67.0%-71.2%
Komen Tulsa Service Area 1,148 778 68.5% 65.0%-71.8%
White 966 653 68.4% 64.6%-71.9%
Black/African-American 63 45 70.6% 55.1%-82.5%
AIAN 100 71 73.4% 60.9%-82.9%
API SN SN SN SN
Hispanic/ Latina 20 12 59.5% 29.5%-83.8%
Non-Hispanic/ Latina 1,128 766 68.7% 65.2%-72.0%
Adair County - OK 14 9 70.6% 39.5%-89.8%
Atoka County - OK 16 13 76.6% 45.9%-92.6%
Bryan County - OK 53 34 63.7% 44.7%-79.2%
Cherokee County - OK 28 20 73.7% 48.3%-89.4%
Choctaw County - OK 14 9 49.4% 23.0%-76.2%
Coal County - OK SN SN SN SN

26 | P a g e Susan G. Komen® Tulsa
Population Group
# of Women Interviewed
(Sample Size)
# w/ Self- Reported
Mammogram
Proportion Screened (Weighted Average)
Confidence Interval of Proportion Screened
Craig County - OK SN SN SN SN
Creek County - OK 39 22 59.4% 39.8%-76.4%
Delaware County - OK 39 30 75.7% 57.3%-87.9%
Haskell County - OK SN SN SN SN
Hughes County - OK 20 10 45.3% 19.3%-74.2%
Latimer County - OK SN SN SN SN
Le Flore County - OK 49 35 74.7% 54.1%-88.0%
Mayes County - OK 28 18 69.6% 43.7%-87.1%
McCurtain County - OK 38 25 55.6% 36.1%-73.5%
McIntosh County - OK 28 15 58.9% 36.8%-77.9%
Muskogee County - OK 48 36 77.1% 58.5%-88.9%
Nowata County - OK SN SN SN SN
Okfuskee County - OK SN SN SN SN
Okmulgee County - OK 23 16 72.8% 48.2%-88.5%
Osage County - OK 27 17 66.9% 43.3%-84.3%
Ottawa County - OK 21 13 54.2% 30.2%-76.4%
Pawnee County - OK SN SN SN SN
Pittsburg County - OK 43 30 63.0% 43.2%-79.2%
Pushmataha County - OK SN SN SN SN
Rogers County - OK 49 35 77.2% 60.2%-88.4%
Sequoyah County - OK 26 16 65.3% 40.8%-83.7%
Tulsa County - OK 435 303 70.6% 65.0%-75.5%
Wagoner County - OK 44 35 75.5% 56.4%-88.0%
Washington County - OK 50 32 67.9% 51.6%-80.8%
SN – data suppressed due to small numbers (fewer than 10 samples). Data are for 2012. Source: CDC – Behavioral Risk Factor Surveillance System (BRFSS).
Breast Cancer Screening Proportions Summary The breast cancer screening proportion in the Komen Tulsa service area was significantly lower than that observed in the US as a whole. The screening proportion of the Affiliate service area was not significantly different than the state of Oklahoma. For the United States, breast cancer screening proportions among Blacks/African-Americans are similar to those among Whites overall. APIs have somewhat lower screening proportions than Whites and Blacks/African-Americans. Although data are limited, screening proportions among AIANs are similar to those among Whites. Screening proportions among Hispanics/Latinas are similar to those among Non-Hispanic Whites and Blacks/African-Americans. For the Affiliate service area as a whole, the screening proportion was not significantly different among Blacks/African-Americans than Whites and not significantly different among AIANs than Whites. There were not enough data available within the Affiliate service area to report on APIs so comparisons cannot be made for this racial group. The

27 | P a g e Susan G. Komen® Tulsa
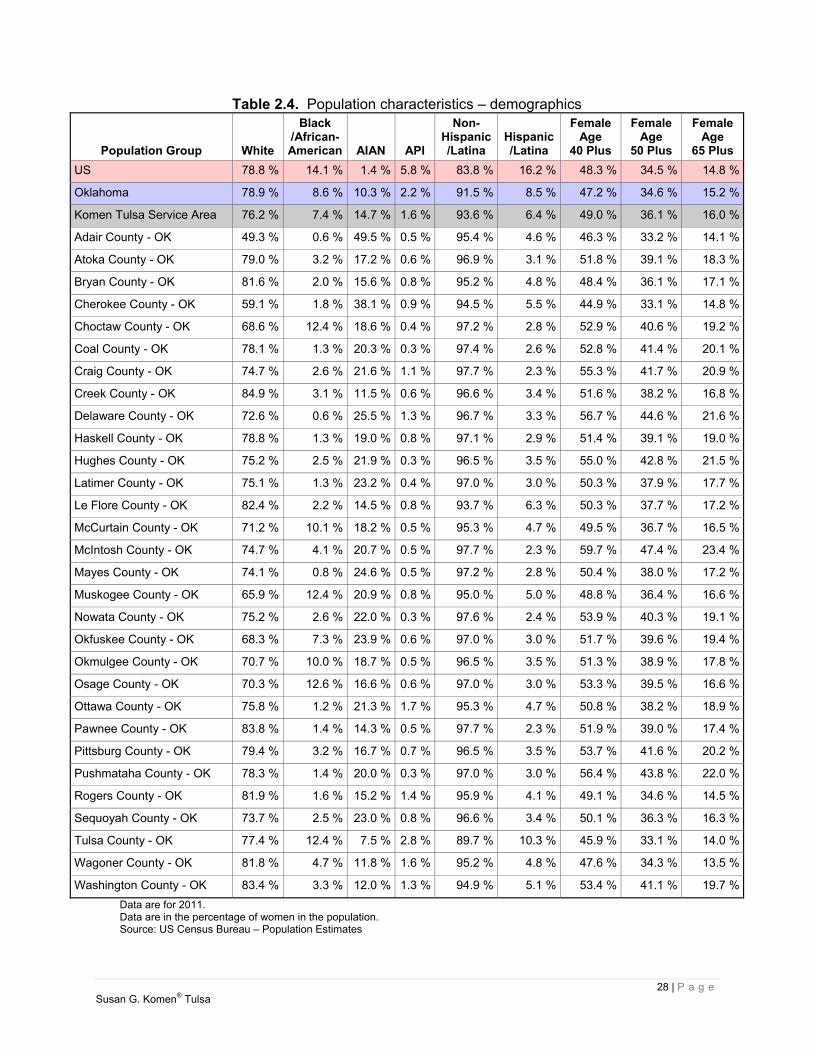
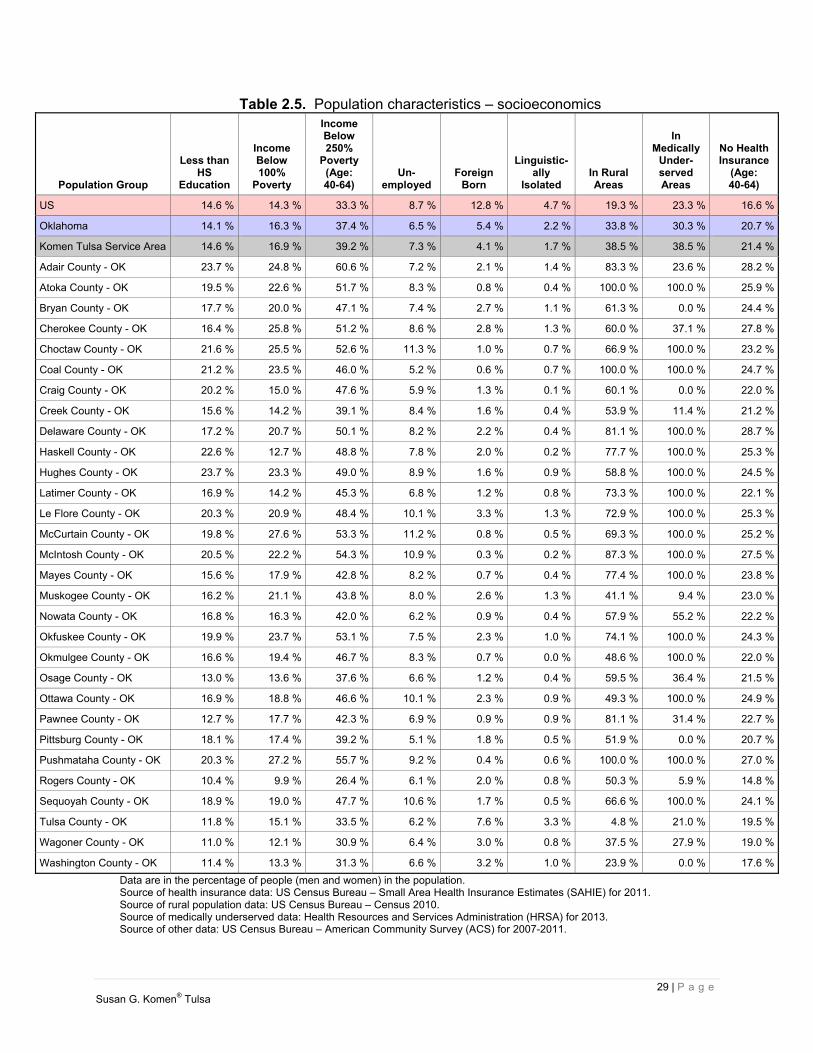
screening proportion among Hispanics/Latinas was not significantly different than among Non-Hispanics/Latinas. None of the counties in the Affiliate service area had substantially different screening proportions than the Affiliate service area as a whole. Population Characteristics The report includes basic information about the women in each area (demographic measures) and about factors like education, income, and unemployment (socioeconomic measures) in the areas where they live (Tables 2.4 and 2.5). Demographic and socioeconomic data can be used to identify which groups of women are most in need of help and to figure out the best ways to help them. It is important to note that the report uses the race and ethnicity categories used by the US Census Bureau, and that race and ethnicity are separate and independent categories. This means that everyone is classified as both a member of one of the four race groups as well as either Hispanic/Latina or Non-Hispanic/Latina. The demographic and socioeconomic data in this report are the most recent data available for US counties. All the data are shown as percentages. However, the percentages weren’t all calculated in the same way.
The race, ethnicity, and age data are based on the total female population in the area (i.e. the percent of females over the age of 40).
The socioeconomic data are based on all the people in the area, not just women. Income, education and unemployment data don’t include children. They’re based on
people age 15 and older for income and unemployment and age 25 and older for education.
The data on the use of English, called “linguistic isolation”, are based on the total number of households in the area. The Census Bureau defines a linguistically isolated household as one in which all the adults have difficulty with English.
28 | P a g e Susan G. Komen® Tulsa
Table 2.4. Population characteristics – demographics
Population Group White
Black /African-American AIAN API
Non- Hispanic/Latina
Hispanic/Latina
Female Age
40 Plus
FemaleAge
50 Plus
FemaleAge
65 Plus
US 78.8 % 14.1 % 1.4 % 5.8 % 83.8 % 16.2 % 48.3 % 34.5 % 14.8 %
Oklahoma 78.9 % 8.6 % 10.3 % 2.2 % 91.5 % 8.5 % 47.2 % 34.6 % 15.2 %
Komen Tulsa Service Area 76.2 % 7.4 % 14.7 % 1.6 % 93.6 % 6.4 % 49.0 % 36.1 % 16.0 %
Adair County - OK 49.3 % 0.6 % 49.5 % 0.5 % 95.4 % 4.6 % 46.3 % 33.2 % 14.1 %
Atoka County - OK 79.0 % 3.2 % 17.2 % 0.6 % 96.9 % 3.1 % 51.8 % 39.1 % 18.3 %
Bryan County - OK 81.6 % 2.0 % 15.6 % 0.8 % 95.2 % 4.8 % 48.4 % 36.1 % 17.1 %
Cherokee County - OK 59.1 % 1.8 % 38.1 % 0.9 % 94.5 % 5.5 % 44.9 % 33.1 % 14.8 %
Choctaw County - OK 68.6 % 12.4 % 18.6 % 0.4 % 97.2 % 2.8 % 52.9 % 40.6 % 19.2 %
Coal County - OK 78.1 % 1.3 % 20.3 % 0.3 % 97.4 % 2.6 % 52.8 % 41.4 % 20.1 %
Craig County - OK 74.7 % 2.6 % 21.6 % 1.1 % 97.7 % 2.3 % 55.3 % 41.7 % 20.9 %
Creek County - OK 84.9 % 3.1 % 11.5 % 0.6 % 96.6 % 3.4 % 51.6 % 38.2 % 16.8 %
Delaware County - OK 72.6 % 0.6 % 25.5 % 1.3 % 96.7 % 3.3 % 56.7 % 44.6 % 21.6 %
Haskell County - OK 78.8 % 1.3 % 19.0 % 0.8 % 97.1 % 2.9 % 51.4 % 39.1 % 19.0 %
Hughes County - OK 75.2 % 2.5 % 21.9 % 0.3 % 96.5 % 3.5 % 55.0 % 42.8 % 21.5 %
Latimer County - OK 75.1 % 1.3 % 23.2 % 0.4 % 97.0 % 3.0 % 50.3 % 37.9 % 17.7 %
Le Flore County - OK 82.4 % 2.2 % 14.5 % 0.8 % 93.7 % 6.3 % 50.3 % 37.7 % 17.2 %
McCurtain County - OK 71.2 % 10.1 % 18.2 % 0.5 % 95.3 % 4.7 % 49.5 % 36.7 % 16.5 %
McIntosh County - OK 74.7 % 4.1 % 20.7 % 0.5 % 97.7 % 2.3 % 59.7 % 47.4 % 23.4 %
Mayes County - OK 74.1 % 0.8 % 24.6 % 0.5 % 97.2 % 2.8 % 50.4 % 38.0 % 17.2 %
Muskogee County - OK 65.9 % 12.4 % 20.9 % 0.8 % 95.0 % 5.0 % 48.8 % 36.4 % 16.6 %
Nowata County - OK 75.2 % 2.6 % 22.0 % 0.3 % 97.6 % 2.4 % 53.9 % 40.3 % 19.1 %
Okfuskee County - OK 68.3 % 7.3 % 23.9 % 0.6 % 97.0 % 3.0 % 51.7 % 39.6 % 19.4 %
Okmulgee County - OK 70.7 % 10.0 % 18.7 % 0.5 % 96.5 % 3.5 % 51.3 % 38.9 % 17.8 %
Osage County - OK 70.3 % 12.6 % 16.6 % 0.6 % 97.0 % 3.0 % 53.3 % 39.5 % 16.6 %
Ottawa County - OK 75.8 % 1.2 % 21.3 % 1.7 % 95.3 % 4.7 % 50.8 % 38.2 % 18.9 %
Pawnee County - OK 83.8 % 1.4 % 14.3 % 0.5 % 97.7 % 2.3 % 51.9 % 39.0 % 17.4 %
Pittsburg County - OK 79.4 % 3.2 % 16.7 % 0.7 % 96.5 % 3.5 % 53.7 % 41.6 % 20.2 %
Pushmataha County - OK 78.3 % 1.4 % 20.0 % 0.3 % 97.0 % 3.0 % 56.4 % 43.8 % 22.0 %
Rogers County - OK 81.9 % 1.6 % 15.2 % 1.4 % 95.9 % 4.1 % 49.1 % 34.6 % 14.5 %
Sequoyah County - OK 73.7 % 2.5 % 23.0 % 0.8 % 96.6 % 3.4 % 50.1 % 36.3 % 16.3 %
Tulsa County - OK 77.4 % 12.4 % 7.5 % 2.8 % 89.7 % 10.3 % 45.9 % 33.1 % 14.0 %
Wagoner County - OK 81.8 % 4.7 % 11.8 % 1.6 % 95.2 % 4.8 % 47.6 % 34.3 % 13.5 %
Washington County - OK 83.4 % 3.3 % 12.0 % 1.3 % 94.9 % 5.1 % 53.4 % 41.1 % 19.7 %
Data are for 2011. Data are in the percentage of women in the population. Source: US Census Bureau – Population Estimates
29 | P a g e Susan G. Komen® Tulsa
Table 2.5. Population characteristics – socioeconomics
Population Group
Less than HS
Education
Income Below 100%
Poverty
Income Below 250%
Poverty (Age: 40-64)
Un- employed
Foreign Born
Linguistic-ally
Isolated In Rural Areas
In Medically
Under- served Areas
No HealthInsurance
(Age: 40-64)
US 14.6 % 14.3 % 33.3 % 8.7 % 12.8 % 4.7 % 19.3 % 23.3 % 16.6 %
Oklahoma 14.1 % 16.3 % 37.4 % 6.5 % 5.4 % 2.2 % 33.8 % 30.3 % 20.7 %
Komen Tulsa Service Area 14.6 % 16.9 % 39.2 % 7.3 % 4.1 % 1.7 % 38.5 % 38.5 % 21.4 %
Adair County - OK 23.7 % 24.8 % 60.6 % 7.2 % 2.1 % 1.4 % 83.3 % 23.6 % 28.2 %
Atoka County - OK 19.5 % 22.6 % 51.7 % 8.3 % 0.8 % 0.4 % 100.0 % 100.0 % 25.9 %
Bryan County - OK 17.7 % 20.0 % 47.1 % 7.4 % 2.7 % 1.1 % 61.3 % 0.0 % 24.4 %
Cherokee County - OK 16.4 % 25.8 % 51.2 % 8.6 % 2.8 % 1.3 % 60.0 % 37.1 % 27.8 %
Choctaw County - OK 21.6 % 25.5 % 52.6 % 11.3 % 1.0 % 0.7 % 66.9 % 100.0 % 23.2 %
Coal County - OK 21.2 % 23.5 % 46.0 % 5.2 % 0.6 % 0.7 % 100.0 % 100.0 % 24.7 %
Craig County - OK 20.2 % 15.0 % 47.6 % 5.9 % 1.3 % 0.1 % 60.1 % 0.0 % 22.0 %
Creek County - OK 15.6 % 14.2 % 39.1 % 8.4 % 1.6 % 0.4 % 53.9 % 11.4 % 21.2 %
Delaware County - OK 17.2 % 20.7 % 50.1 % 8.2 % 2.2 % 0.4 % 81.1 % 100.0 % 28.7 %
Haskell County - OK 22.6 % 12.7 % 48.8 % 7.8 % 2.0 % 0.2 % 77.7 % 100.0 % 25.3 %
Hughes County - OK 23.7 % 23.3 % 49.0 % 8.9 % 1.6 % 0.9 % 58.8 % 100.0 % 24.5 %
Latimer County - OK 16.9 % 14.2 % 45.3 % 6.8 % 1.2 % 0.8 % 73.3 % 100.0 % 22.1 %
Le Flore County - OK 20.3 % 20.9 % 48.4 % 10.1 % 3.3 % 1.3 % 72.9 % 100.0 % 25.3 %
McCurtain County - OK 19.8 % 27.6 % 53.3 % 11.2 % 0.8 % 0.5 % 69.3 % 100.0 % 25.2 %
McIntosh County - OK 20.5 % 22.2 % 54.3 % 10.9 % 0.3 % 0.2 % 87.3 % 100.0 % 27.5 %
Mayes County - OK 15.6 % 17.9 % 42.8 % 8.2 % 0.7 % 0.4 % 77.4 % 100.0 % 23.8 %
Muskogee County - OK 16.2 % 21.1 % 43.8 % 8.0 % 2.6 % 1.3 % 41.1 % 9.4 % 23.0 %
Nowata County - OK 16.8 % 16.3 % 42.0 % 6.2 % 0.9 % 0.4 % 57.9 % 55.2 % 22.2 %
Okfuskee County - OK 19.9 % 23.7 % 53.1 % 7.5 % 2.3 % 1.0 % 74.1 % 100.0 % 24.3 %
Okmulgee County - OK 16.6 % 19.4 % 46.7 % 8.3 % 0.7 % 0.0 % 48.6 % 100.0 % 22.0 %
Osage County - OK 13.0 % 13.6 % 37.6 % 6.6 % 1.2 % 0.4 % 59.5 % 36.4 % 21.5 %
Ottawa County - OK 16.9 % 18.8 % 46.6 % 10.1 % 2.3 % 0.9 % 49.3 % 100.0 % 24.9 %
Pawnee County - OK 12.7 % 17.7 % 42.3 % 6.9 % 0.9 % 0.9 % 81.1 % 31.4 % 22.7 %
Pittsburg County - OK 18.1 % 17.4 % 39.2 % 5.1 % 1.8 % 0.5 % 51.9 % 0.0 % 20.7 %
Pushmataha County - OK 20.3 % 27.2 % 55.7 % 9.2 % 0.4 % 0.6 % 100.0 % 100.0 % 27.0 %
Rogers County - OK 10.4 % 9.9 % 26.4 % 6.1 % 2.0 % 0.8 % 50.3 % 5.9 % 14.8 %
Sequoyah County - OK 18.9 % 19.0 % 47.7 % 10.6 % 1.7 % 0.5 % 66.6 % 100.0 % 24.1 %
Tulsa County - OK 11.8 % 15.1 % 33.5 % 6.2 % 7.6 % 3.3 % 4.8 % 21.0 % 19.5 %
Wagoner County - OK 11.0 % 12.1 % 30.9 % 6.4 % 3.0 % 0.8 % 37.5 % 27.9 % 19.0 %
Washington County - OK 11.4 % 13.3 % 31.3 % 6.6 % 3.2 % 1.0 % 23.9 % 0.0 % 17.6 %
Data are in the percentage of people (men and women) in the population. Source of health insurance data: US Census Bureau – Small Area Health Insurance Estimates (SAHIE) for 2011. Source of rural population data: US Census Bureau – Census 2010. Source of medically underserved data: Health Resources and Services Administration (HRSA) for 2013. Source of other data: US Census Bureau – American Community Survey (ACS) for 2007-2011.
30 | P a g e Susan G. Komen® Tulsa
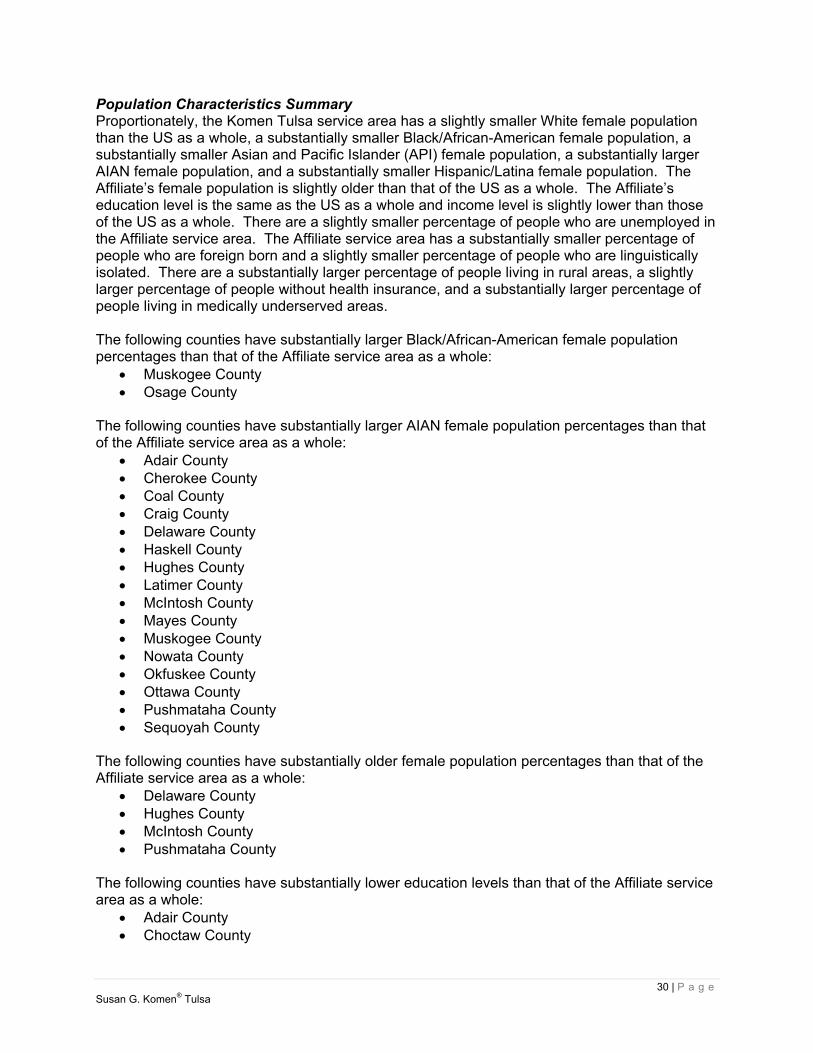
Population Characteristics Summary Proportionately, the Komen Tulsa service area has a slightly smaller White female population than the US as a whole, a substantially smaller Black/African-American female population, a substantially smaller Asian and Pacific Islander (API) female population, a substantially larger AIAN female population, and a substantially smaller Hispanic/Latina female population. The Affiliate’s female population is slightly older than that of the US as a whole. The Affiliate’s education level is the same as the US as a whole and income level is slightly lower than those of the US as a whole. There are a slightly smaller percentage of people who are unemployed in the Affiliate service area. The Affiliate service area has a substantially smaller percentage of people who are foreign born and a slightly smaller percentage of people who are linguistically isolated. There are a substantially larger percentage of people living in rural areas, a slightly larger percentage of people without health insurance, and a substantially larger percentage of people living in medically underserved areas. The following counties have substantially larger Black/African-American female population percentages than that of the Affiliate service area as a whole:
Muskogee County Osage County
The following counties have substantially larger AIAN female population percentages than that of the Affiliate service area as a whole:
Adair County Cherokee County Coal County Craig County Delaware County Haskell County Hughes County Latimer County McIntosh County Mayes County Muskogee County Nowata County Okfuskee County Ottawa County Pushmataha County Sequoyah County
The following counties have substantially older female population percentages than that of the Affiliate service area as a whole:
Delaware County Hughes County McIntosh County Pushmataha County
The following counties have substantially lower education levels than that of the Affiliate service area as a whole:
Adair County Choctaw County

31 | P a g e Susan G. Komen® Tulsa
Coal County Craig County Haskell County Hughes County Le Flore County McCurtain County McIntosh County Okfuskee County Pushmataha County
The following counties have substantially lower income levels than that of the Affiliate service area as a whole:
Adair County Atoka County Cherokee County Choctaw County Coal County Hughes County McCurtain County McIntosh County Okfuskee County Pushmataha County
The following counties have substantially lower employment levels than that of the Affiliate service area as a whole:
Choctaw County McCurtain County McIntosh County Sequoyah County
The following counties have substantially larger percentage of adults without health insurance than does the Affiliate service area as a whole:
Adair County Cherokee County Delaware County McIntosh County Pushmataha County
Priority Areas Healthy People 2020 Forecasts Healthy People 2020 (HP2020) is a major federal government initiative that provides specific health objectives for communities and for the country as a whole. Many national health organizations use HP2020 targets to monitor progress in reducing the burden of disease and improve the health of the nation. Likewise, Komen believes it is important to refer to HP2020 to see how areas across the country are progressing towards reducing the burden of breast cancer.
32 | P a g e Susan G. Komen® Tulsa
HP2020 has several cancer-related objectives, including: Reducing women’s death rate from breast cancer (Target as of the writing of this report:
20.6 cases per 100,000 women). Reducing the number of breast cancers that are found at a late-stage (Target as of the
writing of this report: 41.0 cases per 100,000 women). To see how well counties in the Komen Tulsa service area are progressing toward these targets, the report uses the following information:
County breast cancer death rate and late-stage diagnosis data for years 2006 to 2010. Estimates for the trend (annual percent change) in county breast cancer death rates and
late-stage diagnoses for years 2006 to 2010. Both the data and the HP2020 target are age-adjusted.
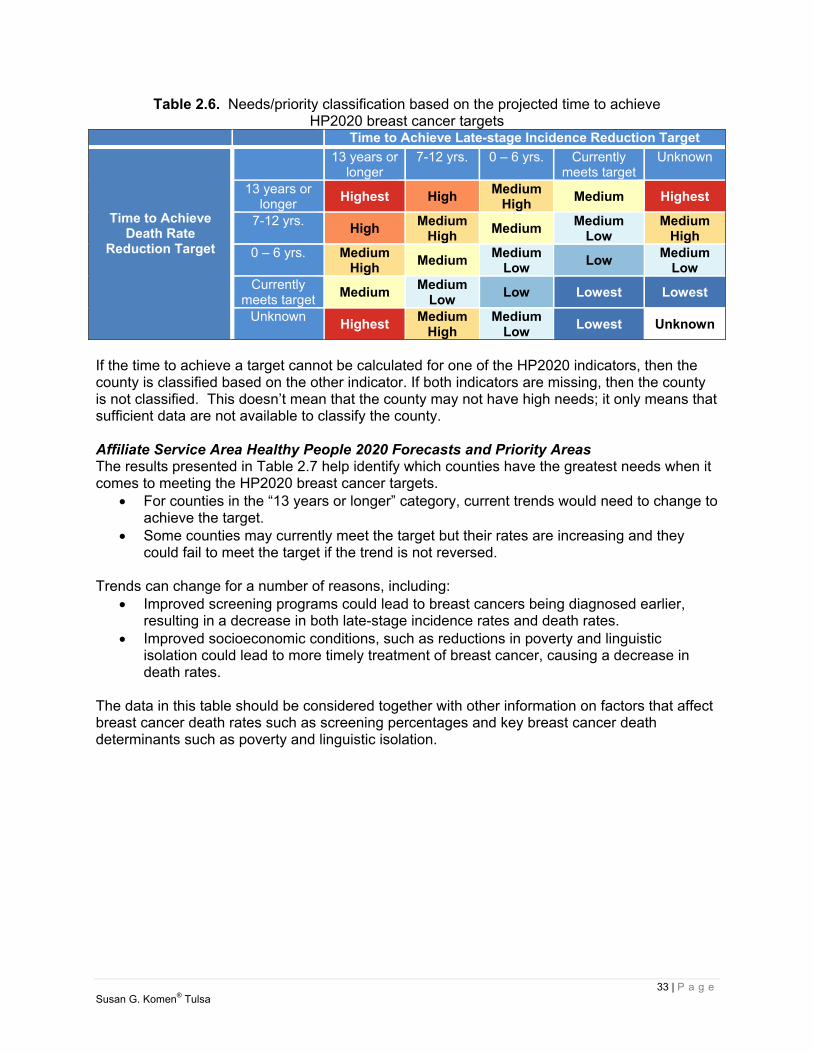
These data are used to estimate how many years it will take for each county to meet the HP2020 objectives. Because the target date for meeting the objective is 2020, and 2008 (the middle of the 2006-2010 period) was used as a starting point, a county has 12 years to meet the target. Death rate and late-stage diagnosis data and trends are used to calculate whether an area will meet the HP2020 target, assuming that the trend seen in years 2006 to 2010 continues for 2011 and beyond. Identification of Priority Areas The purpose of this report is to combine evidence from many credible sources and use the data to identify the highest priority areas for breast cancer programs (i.e. the areas of greatest need). Classification of priority areas are based on the time needed to achieve HP2020 targets in each area. These time projections depend on both the starting point and the trends in death rates and late-stage incidence. Late-stage incidence reflects both the overall breast cancer incidence rate in the population and the mammography screening coverage. The breast cancer death rate reflects the access to care and the quality of care in the health care delivery area, as well as cancer stage at diagnosis. There has not been any indication that either one of the two HP2020 targets is more important than the other. Therefore, the report considers them equally important. Counties are classified as follows (Table 2.6):
Counties that are not likely to achieve either of the HP2020 targets are considered to have the highest needs.
Counties that have already achieved both targets are considered to have the lowest needs.
Other counties are classified based on the number of years needed to achieve the two targets.
33 | P a g e Susan G. Komen® Tulsa
Table 2.6. Needs/priority classification based on the projected time to achieve HP2020 breast cancer targets
Time to Achieve Late-stage Incidence Reduction Target
Time to Achieve Death Rate
Reduction Target
13 years or longer
7-12 yrs. 0 – 6 yrs. Currently meets target
Unknown
13 years or longer
Highest High Medium
High Medium Highest
7-12 yrs. High
Medium High
Medium Medium
Low Medium
High 0 – 6 yrs. Medium
High Medium
Medium Low
Low Medium
Low Currently
meets target Medium
Medium Low
Low Lowest Lowest
Unknown Highest
Medium High
Medium Low
Lowest Unknown
If the time to achieve a target cannot be calculated for one of the HP2020 indicators, then the county is classified based on the other indicator. If both indicators are missing, then the county is not classified. This doesn’t mean that the county may not have high needs; it only means that sufficient data are not available to classify the county. Affiliate Service Area Healthy People 2020 Forecasts and Priority Areas The results presented in Table 2.7 help identify which counties have the greatest needs when it comes to meeting the HP2020 breast cancer targets.
For counties in the “13 years or longer” category, current trends would need to change to achieve the target.
Some counties may currently meet the target but their rates are increasing and they could fail to meet the target if the trend is not reversed.
Trends can change for a number of reasons, including:
Improved screening programs could lead to breast cancers being diagnosed earlier, resulting in a decrease in both late-stage incidence rates and death rates.
Improved socioeconomic conditions, such as reductions in poverty and linguistic isolation could lead to more timely treatment of breast cancer, causing a decrease in death rates.
The data in this table should be considered together with other information on factors that affect breast cancer death rates such as screening percentages and key breast cancer death determinants such as poverty and linguistic isolation.
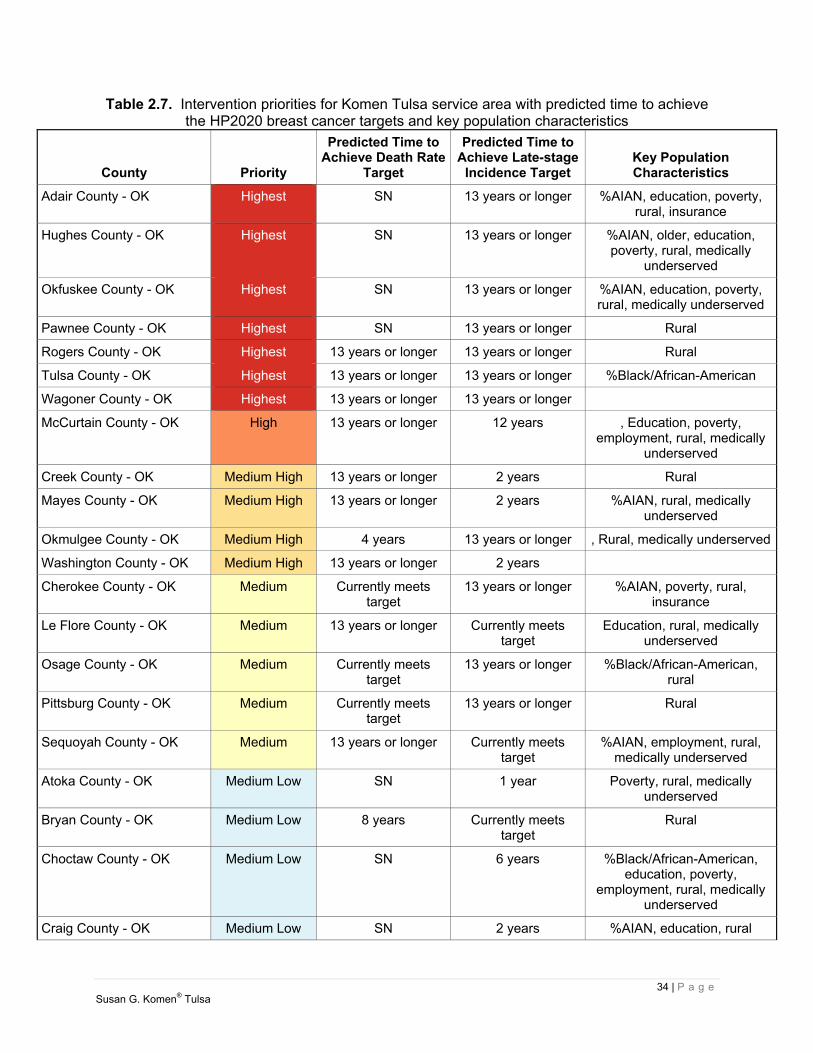
34 | P a g e Susan G. Komen® Tulsa
Table 2.7. Intervention priorities for Komen Tulsa service area with predicted time to achieve the HP2020 breast cancer targets and key population characteristics
County Priority
Predicted Time toAchieve Death Rate
Target
Predicted Time to Achieve Late-stage
Incidence Target Key Population Characteristics
Adair County - OK Highest SN 13 years or longer %AIAN, education, poverty, rural, insurance
Hughes County - OK Highest SN 13 years or longer %AIAN, older, education, poverty, rural, medically
underserved
Okfuskee County - OK Highest SN 13 years or longer %AIAN, education, poverty, rural, medically underserved
Pawnee County - OK Highest SN 13 years or longer Rural
Rogers County - OK Highest 13 years or longer 13 years or longer Rural
Tulsa County - OK Highest 13 years or longer 13 years or longer %Black/African-American
Wagoner County - OK Highest 13 years or longer 13 years or longer
McCurtain County - OK High 13 years or longer 12 years , Education, poverty, employment, rural, medically
underserved
Creek County - OK Medium High 13 years or longer 2 years Rural
Mayes County - OK Medium High 13 years or longer 2 years %AIAN, rural, medically underserved
Okmulgee County - OK Medium High 4 years 13 years or longer , Rural, medically underserved
Washington County - OK Medium High 13 years or longer 2 years
Cherokee County - OK Medium Currently meets target
13 years or longer %AIAN, poverty, rural, insurance
Le Flore County - OK Medium 13 years or longer Currently meets target
Education, rural, medically underserved
Osage County - OK Medium Currently meets target
13 years or longer %Black/African-American, rural
Pittsburg County - OK Medium Currently meets target
13 years or longer Rural
Sequoyah County - OK Medium 13 years or longer Currently meets target
%AIAN, employment, rural, medically underserved
Atoka County - OK Medium Low SN 1 year Poverty, rural, medically underserved
Bryan County - OK Medium Low 8 years Currently meets target
Rural
Choctaw County - OK Medium Low SN 6 years %Black/African-American, education, poverty,
employment, rural, medically underserved
Craig County - OK Medium Low SN 2 years %AIAN, education, rural

35 | P a g e Susan G. Komen® Tulsa
County Priority
Predicted Time toAchieve Death Rate
Target
Predicted Time to Achieve Late-stage
Incidence Target Key Population Characteristics
Muskogee County - OK Medium Low 4 years 3 years %Black/African-American, %AIAN
McIntosh County - OK Low 2 years Currently meets target
%AIAN, older, education, poverty, employment, rural,
insurance, medically underserved
Delaware County - OK Lowest Currently meets target
Currently meets target
%AIAN, older, rural, insurance, medically underserved
Ottawa County - OK Lowest Currently meets target
Currently meets target
%AIAN, rural, medically underserved
Coal County - OK Undetermined SN SN %AIAN, education, poverty, rural, medically underserved
Haskell County - OK Undetermined SN SN %AIAN, education, rural, medically underserved
Latimer County - OK Undetermined SN SN %AIAN, rural, medically underserved
Nowata County - OK Undetermined SN SN %AIAN, rural, medically underserved
Pushmataha County - OK Undetermined SN SN %AIAN, older, education, poverty, rural, insurance, medically underserved
SN – data suppressed due to small numbers (15 cases or fewer for the 5-year data period).
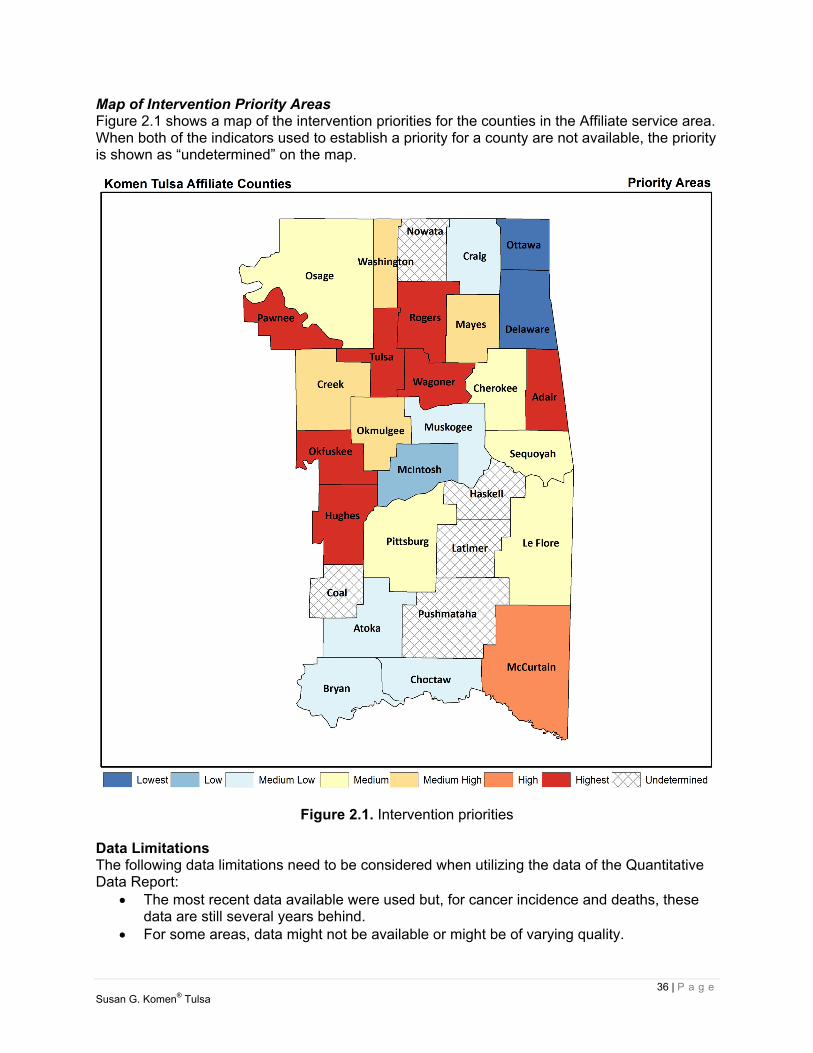
36 | P a g e Susan G. Komen® Tulsa
Map of Intervention Priority Areas Figure 2.1 shows a map of the intervention priorities for the counties in the Affiliate service area. When both of the indicators used to establish a priority for a county are not available, the priority is shown as “undetermined” on the map.
Figure 2.1. Intervention priorities
Data Limitations The following data limitations need to be considered when utilizing the data of the Quantitative Data Report:
The most recent data available were used but, for cancer incidence and deaths, these data are still several years behind.
For some areas, data might not be available or might be of varying quality.
37 | P a g e Susan G. Komen® Tulsa
Areas with small populations might not have enough breast cancer cases or breast cancer deaths each year to support the generation of reliable statistics.
There are often several sources of cancer statistics for a given population and geographic area; therefore, other sources of cancer data may result in minor differences in the values even in the same time period.
Data on cancer rates for specific racial and ethnic subgroups such as Somali, Hmong, or Ethiopian are not generally available.
The various types of breast cancer data in this report are inter-dependent. There are many factors that impact breast cancer risk and survival for which quantitative
data are not available. Some examples include family history, genetic markers like HER2 and BRCA, other medical conditions that can complicate treatment, and the level of family and community support available to the patient.
The calculation of the years needed to meet the HP2020 objectives assume that the current trends will continue until 2020. However, the trends can change for a number of reasons.
Not all breast cancer cases have a stage indication. Quantitative Data Report Conclusions Highest Priority Areas Seven counties in the Komen Tulsa service area are in the highest priority category. Three of the seven, Rogers County, Tulsa County and Wagoner County, are not likely to meet either the death rate or late-stage incidence rate HP2020 targets. Four of the seven, Adair County, Hughes County, Okfuskee County and Pawnee County, are not likely to meet the late-stage incidence rate HP2020 target. The incidence rates in Tulsa County (145.5 per 100,000) are significantly higher than the Affiliate service area as a whole (121.8 per 100,000). The late-stage incidence rates in Tulsa County (52.3 per 100,000) are significantly higher than the Affiliate service area as a whole (44.7 per 100,000). Adair County has a relatively large AIAN population, low education levels and high poverty rates. Hughes County has a relatively large AIAN population, an older population, low education levels and high poverty rates. Okfuskee County has a relatively large AIAN population, low education levels and high poverty rates. High Priority Areas One county in the Komen Tulsa service area is in the high priority category. McCurtain County is not likely to meet the death rate HP2020 target. The incidence rates in McCurtain County (159.1 per 100,000) are significantly higher than the Affiliate service area as a whole (121.8 per 100,000). McCurtain County has low education levels, high poverty rates and high unemployment.
Additional Quantitative Data Exploration In the original Quantitative Data Report (QDR), the data for incidence and late-stage rates were linked with Indian Health Service (IHS) for all races for the years 2006-2010. Data were obtained from the North American Association of Central Cancer Registries (NAACCR), in addition to data from the Oklahoma Central Cancer Registry. However, the death data,

38 | P a g e Susan G. Komen® Tulsa
obtained from the State Cancer Profiles website, are not linked to IHS data. Due to the state’s large American Indian population, the Affiliate wanted to ensure the breast cancer death rates were accurately reflected for this population and worked with the Oklahoma State Department of Health (OSDH) to access linked race-specific death data. “Linked Data refers to a set of best practices for publishing and connecting structured data” (Heath, Hepp, & Bizer, 2009, para. 3). IHS-linked data helped produce a more thorough picture of the AIAN population by utilizing both state profiles and IHS data. IHS-Linked Data The Affiliate compared the non-linked age-adjusted death rate (AAMR) data in the QDR with the linked data from OK2Share and found only slight variances in reported numbers for the White and Black/African-American populations. OK2Share is an interactive website created by the OSDH to provide health and medical information from numerous agencies in the state. Both the QDR and OK2Share data for the White population show the AAMR rate to be 25.0 per 100,000. There was a slight variance in the Black/African-American population, with non-linked data showing a rate of 36.0 per 100,000 and linked data as 37.8 per 100,000. The greatest variance was found in the AIAN population. Non-linked AAMR reported as 20.3 per 100,000, while the linked data was 31.1 per 100,000. The variance would confirm that the AAMR is an under-reported number for the AIAN population and may be due to potential race misclassification. The OSDH also provided linked AAMR data for AIAN, Black/African-American and White populations in the Komen Tulsa Affiliate’s four target counties during the period of 2005-2009, which is the most current data available (Table 2.8).
Table 2.8. IHS-Linked data by race for Komen Tulsa target communities
AIAN Black/African
-American White
County Total # Deaths AAMR
Avg.# Deaths Total # Deaths AAMR
Avg.# Deaths
Total # Deaths AAMR
Avg.# Deaths
2005-2009 Annually 2005-2009 Annually 2005-2009 Annually
Osage 0 0 * 39.5 * 17 14.8 3.4
Rogers * 46.0 * 0 0 54 26.2 10.8
Tulsa 26 39.5 5.2 44 33.6 8.8 396 27.1 79.2
Wagoner 0 0 0 0 39 23.9 7.8 *Cells with small case count have been suppressed Ref: Oklahoma State Department of Health
Data Limitations The AIAN rates reported above may be low due to misclassification. This is especially true in urban areas where AIANs are less likely to use IHS facilities and, therefore, may not be identified as AIAN in death data. An additional limitation is the small cell size due to population. Conclusions According to the American Journal of Public Health, AIANs are more likely to be racially misclassified in cancer registries thus resulting in lower cancer incidences and death estimates (Jim et al., 2014). Once misclassification was accounted for, it was determined the rates were higher but still followed similar trends. IHS-linked death data, QDR incidence and late-stage rates provide justification for the selection of AIAN as one of the Affiliate’s target communities.
39 | P a g e Susan G. Komen® Tulsa
Selection of Target Communities The selected target communities are Tulsa, Osage, Rogers and Wagoner counties. Considered a part of the Tulsa metro area, these counties were selected based upon geographical proximity, existing partnerships and ability for the Affiliate to efficiently and effectively utilize its resources for services. The Affiliate will also focus on target populations within these communities, which are underserved Black/African-American and AIAN females. While all other populations in Tulsa County are showing decreases in incidence and late-stage trends, the Black/African-American population trends are showing slight increases. AIAN death rates are higher than the Affiliate service area. Key indicators the Affiliate reviewed when selecting target communities included, but are not limited to:
Incidence rates and trends Death rates and trends Late-stage rates and trends Urban and rural classification Poverty Medically underserved Access to care
A little over half of the Komen Tulsa Affiliate’s female population lives in the four target counties. In addition, there is a larger population of Black/African-American and AIAN communities living in these counties. Within these target counties, rural population characteristics are found, such as race and poverty, among other factors, contributing to the higher risk profile for breast cancer and poor health outcomes. According to the Centers for Disease Control and Prevention, “People living in rural areas may have greater financial burden, social isolation, stress and lower accessibility to health care, which may contribute to health behaviors and health outcomes (Schootman, Homan, Weaver, Jeffe, & Yun, 2013).” Half of Rogers and Wagoner counties and sections of Tulsa and Osage counties are rural and considered medically underserved, according to the Health Resources and Services Administration (HRSA) (OSDH, 2013). With a shortage of personal health services, residents of these counties are challenged with access to health care. In addition, death is found to be higher in the AIAN and Black/African-American populations. While there may not be a direct correlation, it is easy to assume it is related to poor screening and later-stage diagnosis. AIAN populations have greater health disparities when compared to other ethnic and racial groups (Jim et al., 2014). Since 1990 breast cancer death rates have been declining for all women, except for AIAN, which have remained stable (DeSantis, 2011). Tulsa County Tulsa County has been selected as a target community because it is not likely to meet HP2020 targets for death rate or late-stage incidence rate and has a higher-than-average Black/African-American population. Tulsa County is the largest population of all the counties in the Affiliate service area, with a female population of 302,240. The Black/African-American population is 12.4 percent, which is almost double the average of the Affiliate service area. The county’s late-stage incidence rate of 52.3 per 100,000 is significantly higher than the Affiliate service area as

40 | P a g e Susan G. Komen® Tulsa
a whole at 44.7 per 100,000. It is also noted the county’s death rate of 27.2 per 100,000 is higher than the Affiliate service area at 24.9 per 100,000. Both the incidence and late-stage incidence rate annual percentage changes are trending up for the county while the death rate is trending down 1.2 percent. The City of Tulsa makes up the majority of the population for Tulsa County. It is an urban county, but there are pockets that are considered rural and lacking in health care and other services. A study conducted in 2005 (Lewin Group, 2006) regarding safety-net services for the medically indigent in Tulsa County showed a 14 year shorter life span difference in Tulsa neighborhoods. Unmet needs and gaps identified in the study included, but were not limited to, primary care, diagnostic and specialty care, limited focus on prevention and geographic and financial access barriers. Much work has been done by the health care community in the intervening years to address these needs and gaps. A health systems review will look at the availability of breast cancer screening services for the county to determine the impact on the incidence, death and late-stage rates; particular focus will be given to services available to residents in the northern areas where the highest percentage of the Black/African-American population reside. Osage County Osage County, home of the Osage Nation, is the largest county in Oklahoma by area size. The City of Tulsa is located primarily in Tulsa County, but portions extend into Osage County. Two zip codes that have predominantly Black/African-American populations cross county lines between Osage and Tulsa. Osage County is in the medium priority category, but this county was selected as a target community due to its larger female Black/African-American and AIAN populations, and the amount of time needed to meet the HP2020 target for late-stage incidence rates. Nearly 60.0 percent of the female population in Osage County lives in rural areas, compared to that of the Affiliate as a whole at 38.5 percent. The proportion of Black/African-American population is almost twice that of the Affiliate. AIAN females make up 16.6 percent of the population. The incidence and late-stage rates are lower than the Affiliate service area, but their annual percent change rates are trending up with late-stage climbing to 12.5 percent. While increases in incidence rates could be attributed to an increase in screening mammography, it will be important to investigate this further. Osage County is made up of open prairie and primary care physicians number six per 100,000 (OSDH, 2010). Access to care should be a focus during the health systems review and may provide information about factors impacting the increasing trend in late-stage rates. Rogers County Half the population of Rogers County, located on the northeast border of Tulsa County is rural and is not likely to meet the HP2020 targets for death or late-stage incidence rates. The county’s average female population is 42,854 and has a higher AIAN female population when compared to the Affiliate service area as a whole. Rogers County has a higher death rate of 27.3 per 100,000 than the Affiliate’s service area at 24.9 per 100,000. All of these factors contributed to this county’s selection as a target community. The incidence rate for Rogers County is lower than the service area as a whole, while the annual percentage change is trending up 4.5 percent. Women in Rogers County, ages 50-74, have reported obtaining a screening mammogram at a rate higher than the Affiliate service area average; this positive incidence trend may be the result of more women getting mammograms and, in turn, finding more breast cancer cases. The late-stage incidence rate annual
41 | P a g e Susan G. Komen® Tulsa
percentage change is also trending up by 5.4 percent. The health systems analysis will review the available breast health services in Rogers County. Because half its population lives in rural areas, there may not be adequate access to health facilities or resources. Wagoner County Wagoner County adjoins the southeastern portion of Tulsa County. It has an average female population of 26,046; its second largest population is AIAN at 11.8 percent. Wagoner County was selected as a target community because it is not likely to meet the HP2020 targets for death or late-stage incidence rates. The county’s breast cancer death rate of 27.4 per 100,000 is higher than the Affiliate service area at 24.9 per 100,000. Wagoner County’s incidence and late-stage rates are lower than the Affiliate service area as a whole. Both categories show annual percentage change trends increasing, with incidence rates at 9.1 percent and late-stage at 5.0 percent. There were no discernible socioeconomic population characteristics, such as medically underserved, poverty, or those lacking health insurance. Further investigation into the reasons for increasing trends for incidence and late-stage breast cancer cases, as well as higher death rates, is needed. Wagoner County has only one community hospital. The health systems analysis will explore other health facilities and breast cancer screening options in the area.

42 | P a g e Susan G. Komen® Tulsa
Health Systems Analysis Data Sources The health systems analysis of the Affiliate provides a review of the availability of breast cancer resources throughout the Breast Cancer Continuum of Care (CoC) and explores access to care as it relates to the target communities. Methodology The ability to access care is a complex idea that depends on a multitude of factors in any given community. The capability of receiving care extends beyond availability of services and includes adequate supply of relevant and effective services, and financial, organizational, social, and cultural barriers. Equality of access must be measured in terms of obtainability, utilization, and/or outcome of services (Gulliford, Figueroa-Munoz, Morgan, Hughes, Gibson, Beech, & Hudson, 2002). To gain a comprehensive understanding of the breast health resources in the Affiliate’s targeted communities, the following resources were utilized:
Mammography Center Database http://www.accessdata.fda.gov/scripts/cdrh/cfdocs/cfMQSA/mqsa.cfm This site provides a listing of all mammography facilities certified by the FDA or Certifying State as meeting baseline quality standards under the Mammography Quality Standards Act of 1992 (MQSA) and subsequent Mammography Quality Standards Reauthorization Act (MQSRA) amendments. Medicare Hospital Database https://data.medicare.gov/Hospital-Compare/Hospital-General-Information/v287-28n3 This is a list of all hospitals that have been registered with Medicare. National Association of County and City Health Officials Health Department Database www.naccho.org/about/lhd/ The National Association of County and City Health Officials has a directory of local health departments across the country. Health Resources and Services Administrations Community Health Center Database http://findahealthcenter.hrsa.gov/Search_HCC.aspx This site, administered by the Health Resources and Services Administrations (HRSA), provides a searchable listing of community health centers (CHCs) that provide medical resources to the underserved. National Cancer Institute Designated Cancer Centers www.cancer.gov/researchandfunding/extramural/cancercenters/find-a-cancer-center The National Cancer Institute provides a list of cancer centers throughout the United States.
Health Systems and Public Policy Analysis
43 | P a g e Susan G. Komen® Tulsa
Susan G. Komen Tulsa Affiliate Breast Health Directory www.komentulsa.org/assets/images/pdf-documents/tul-breast-health-directory.pdf Komen Tulsa Affiliate provides a list of resources for regional Tulsa to assist those who have been diagnosed with breast cancer in the journey to recovery. Susan G. Komen Grants eManagement System (GeMS) Database https://affiliategrants.komen.org GeMS provides a central location for grantee and grantee applicants’ information of Komen Affiliates. Oklahoma Project Woman www.oklahomaprojectwoman.org/ Oklahoma Project Woman provides free mammograms, diagnostic procedures and surgical services for Oklahomans of any age with no health insurance and limited financial resources by partnering with Oklahoma organizations who already provide Continuum of Care services. Google Search Engine www.google.com Google Search provides a way to look for publicly available documents offered by web servers. Oklahoma State Department of Health www.ok.gov/health/ This site is the official web portal for the Oklahoma State Health Department that houses the state of Oklahoma’s statistical and narrative information on the health of the state.
The Affiliate health systems analysis data were obtained through the utilization of internet searches, phone calls, faxed surveys, interviews and networking with existing partners and previously acquired data from past and current grantees. The Affiliate began with its working knowledge of the health systems within Tulsa, Osage, Rogers, and Wagoner counties. Then, with committee members and volunteers, conducted internet searches, phone calls, faxed surveys, and created communication with existing partners, through both phone and email, in order to acquire the needed information and expertise to make an accurate assessment of the available resources within the four target communities. Once findings were documented, the Tulsa Affiliate and committee members observed gaps along the CoC within the systems. After a final observation was made by the Affiliate, evaluations of the health systems were sent back to appropriate community partners to check for accuracy and missing data.
Health Systems Overview The Breast Cancer CoC is a model that shows how a woman typically moves through the health care system for breast care (Figure 3.1). A woman would ideally move through the CoC quickly and seamlessly, receiving timely, quality care in order to have the best outcomes. Education can play an important role throughout the entire CoC.

44 | P a g e Susan G. Komen® Tulsa
While a woman may enter the continuum at any point, ideally, a woman would enter the CoC by getting screened for breast cancer with a clinical breast exam or a screening mammogram. If the screening test results are normal, she would loop back into follow-up care, where she would get another screening exam at the recommended interval. Education plays a role in both encouraging women to get screened and reinforcing the need to continue to get screened routinely thereafter.
Figure 3.1. Breast Cancer Continuum of Care (CoC) If a screening exam resulted in abnormal results, diagnostic tests would be needed to determine if the abnormal finding is in fact breast cancer. These tests might include a diagnostic mammogram, breast ultrasound or biopsy. If the tests were negative (or benign) and breast cancer was not found, she would go into the follow-up loop, and return for screening at the recommended interval. The recommended intervals may range from three to six months for some women to 12 months for most women. Education plays a role in communicating the importance of proactively getting test results, keeping follow-up appointments and understanding what it all means. Education can empower a woman and help manage anxiety and fear. If breast cancer is diagnosed, she would proceed to treatment. Education can cover topics such as treatment options, how a pathology report determines the best options for treatment, understanding side effects and how to manage them, and helping to formulate questions a woman may have for her providers. For some breast cancer patients, treatment may last a few months and for others, it may last years. While the CoC model shows that follow-up and survivorship come after treatment ends, they actually may occur at the same time. Follow-up and survivorship may include things like navigating insurance issues, locating financial assistance, and symptom management, such as pain, fatigue, sexual issues, bone health, etc. Education may address topics such as making healthy lifestyle choices, long-term effects of treatment, managing side effects, the importance of follow-up appointments and communication with their providers. Most women will return to screening at a recommended interval after treatment ends, or for some, during treatment (such as those taking long-term hormone therapy).
45 | P a g e Susan G. Komen® Tulsa
There are often delays in moving from one point of the continuum to another – at the point of follow-up of abnormal screening exam results, starting treatment, and/or completing treatment – that can all contribute to poorer outcomes. There are also many reasons why a woman does not enter or continue in the breast cancer CoC. These barriers can include things such as lack of transportation, system issues including long waits for appointments and inconvenient clinic hours, language barriers, fear, and lack of information - or the wrong information (myths and misconceptions). Education can address some of these barriers and help a woman progress through the CoC more quickly. Health Systems Analysis by County Since publication of the 2011 Community Profile, the Tulsa Affiliate has expanded its service area to 30 counties in eastern Oklahoma, including the four target populations of Tulsa, Osage, Rogers and Wagoner counties. The counties were chosen based on data previously reported in the QDR section. The collection of data for the Affiliate’s health systems analysis has identified strengths and weaknesses along the CoC for each of these target communities and will be used to identify opportunities for new partnerships and collaborations. Tulsa County Tulsa County, the Affiliate’s largest county, houses three hospitals that provide breast cancer services along the entire CoC (Figure 3.2). Two of the hospitals are in close proximity to the zip codes that have predominantly Black/African-American populations. In addition, there are a number of Federally Qualified Health Centers (FQHCs) that serve the AIAN and Black/African-American populations that provide breast cancer screening services and referrals for additional services along the CoC. As stated in the QDR, the Black/African-American and AIAN populations are the most vulnerable for breast cancer incidence and deaths in Tulsa County. The FQHCs are located in close geographical proximity to these populations, as well as, provide transportation to their facilities. While there are many options for women, there appears to still be a challenge with access to care and keeping women in the CoC in certain areas of the county. There is a mobile clinic option that provides clinical breast exams, but there is no access to mobile mammography, which poses a potential barrier for screening mammography. There is still a need for adequate transportation for the underserved population, in addition to other potential barriers, including lack of child care, lack of insurance coverage, fear and real or perceived stigmas. These will need to be studied further to understand the potential impact on the county’s late-stage and death rate trends. Over the past 17 years, the Affiliate has funded breast cancer screening and education programs in Tulsa County. Through these mission partnerships, thousands of underserved women have received screening, diagnostic mammograms and life-saving breast cancer education. The Affiliate will continue its support of these breast cancer programs and organizations as they currently operate and prepare for potential, future implications that could arise with the Affordable Care Act (ACA).

46 | P a g e Susan G. Komen® Tulsa
Figure 3.2. Breast cancer services available in Tulsa County
47 | P a g e Susan G. Komen® Tulsa
Osage County Osage County has the advantage of housing a clinic operated by the Cherokee Nation, one of the only American Indian tribes who administers a National Breast and Cervical Cancer Early Detection Program (NBCCEDP). Due to this, a relationship exists between the Affiliate and the tribe, which has resulted in development of cultural and language-appropriate materials on breast self-awareness and mammography; however, breast health services are limited and are only available to that particular tribe’s members. Overall, a lack of resources exists (Figure 3.3). Only two of the CoC’s four stages are available within Osage County, which forces residents to travel outside of the county to receive treatment and follow-up services. While Osage County borders Tulsa County which provides all four stages of care for breast cancer, access to care still remains an issue for its residents. No Affiliate work has been done in this county to date. Reasons for lack of access to care, particularly for the Black/African-American and AIAN population, are still unknown. While relationships exist with Morton Comprehensive Health Services and the Cherokee Nation in Osage County, they could be made stronger. The Affiliate also seeks to build new relationships with the Osage Nation, which is another American Indian tribe that is rooted in Osage County and other appropriate community partners that have a long presence in the county. These new relationships will help to break down silos among the few existing organizations that provide breast health services to Osage County residents.

48 | P a g e Susan G. Komen® Tulsa
Figure 3.3. Breast cancer services available in Osage County
49 | P a g e Susan G. Komen® Tulsa
Rogers County While Rogers County has within its borders branch locations of two major hospitals, there is a lack of ability to take a woman through the entire breast cancer CoC (Figure 3.4). Organizations do not go beyond screening and diagnostics for breast health in Rogers County. Since the Rogers County Health Department is paid for out of a Title X grant, mammography screenings are still available to women through the health department’s partnership with the organization Oklahoma Project Woman. Due to a lack of facilities and opportunities, the Affiliate has very little presence within the target community; however, there exists a strong relationship with the local hospitals’ main locations and partners of the local organizations. For example, the Indian Health Care Resource Center, located in Tulsa County, has a solid partnership with the Claremore Indian Hospital, a local health care organization in Rogers County. The goal is to use existing relationships with these entities’ partners in order to build a stronger rapport in Rogers County in hopes to gain a better understanding of why late-stage incidence and death rates are trending up in this county.
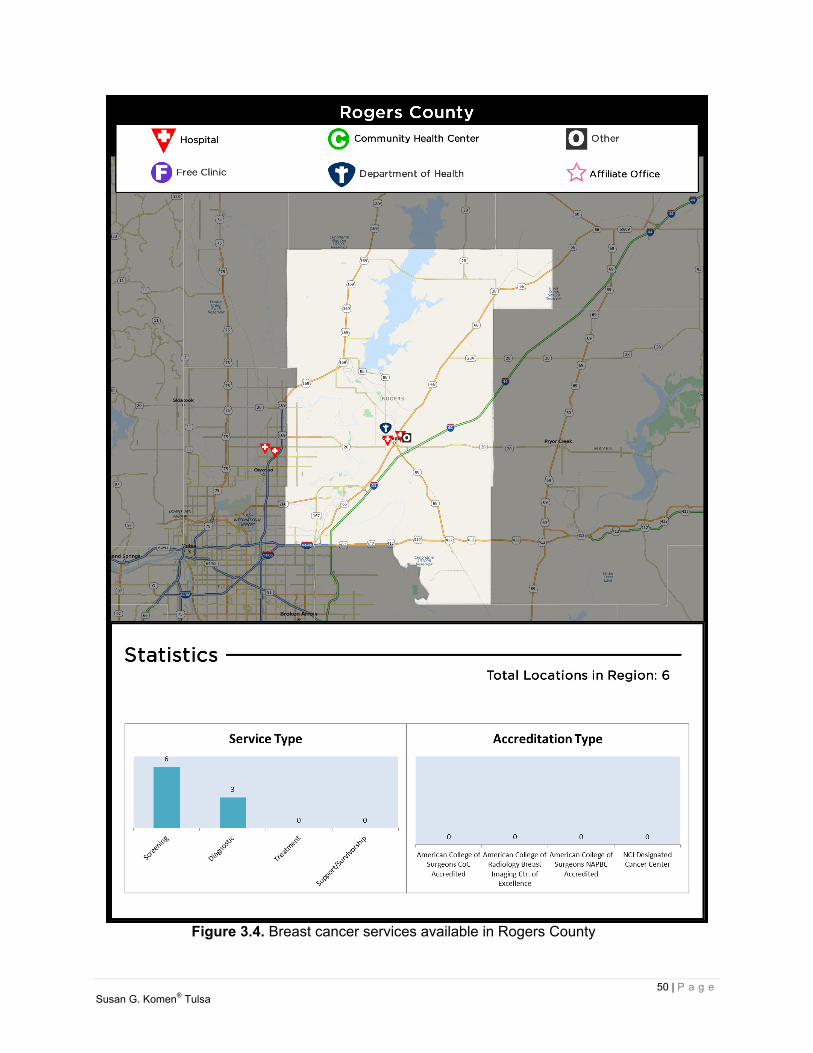
50 | P a g e Susan G. Komen® Tulsa
Figure 3.4. Breast cancer services available in Rogers County
51 | P a g e Susan G. Komen® Tulsa
Wagoner County Wagoner County, like the other target communities, has an American Indian clinic, Koweta Indian Health Center, which is operated by the Muscogee Creek Nation. The county also contains a community hospital, which only offers screening and diagnostic services (Figure 3.5). No facility in Wagoner County offers treatment or follow-up services for those residents who struggle with breast cancer, causing them to be referred out-of-county for care. This can be a deterrent for women who are diagnosed with breast cancer to not continue in the CoC after diagnosis, and could be one cause for the high death rates in the county. The local health department is the only county health department located within the Affiliate’s four target communities that does not partner with Oklahoma Project Woman. Therefore, there are no available mammography screening options for women in need through the health department. The Affiliate has no strong ties to the community, but plans to increase partnerships with the few existing health care organizations serving breast cancer in Wagoner County in order to increase understanding and decrease the high rates of breast cancer deaths within the target community.

52 | P a g e Susan G. Komen® Tulsa
Figure 3.5. Breast cancer services available in Wagoner County
53 | P a g e Susan G. Komen® Tulsa
Public Policy Overview National Breast and Cervical Cancer Early Detection Program (NBCCEDP) The Centers for Disease Control’s (CDC) National Breast and Cervical Cancer Early Detection Program (NBCCEDP) provides access to breast and cervical cancer screening services to underserved women through grants that support the implementation of state programs. The Oklahoma NBCCEDP, called Take Charge! provides breast and cervical cancer screening for eligible Oklahoma women. It is funded through a CDC grant and a three-to-one match from the state. In addition, the Oklahoma Breast and Cervical Cancer Act established the Breast and Cervical Cancer Act Revolving Fund. The monies in the revolving fund consist of gifts or donations and contributions from individual income tax returns, as well as monies from the sale of breast cancer license plates. These funds pay for breast and cervical cancer screening and diagnostic services for women enrolled in the Take Charge! program. Take Charge! services are provided through contracts with health care providers, FQHCs, health care organizations, laboratories, surgical consultants, mammography facilities, and colposcopy providers. To enroll in the program, women call a toll-free number and speak with a patient navigator who will help them determine if they meet the eligibility requirements based upon income, insurance status and age, for the services they are seeking. Women with abnormal findings on breast and/or cervical cancer screening examinations through Take Charge! receive a referral and access to diagnostic services. Some women will be eligible for these services through Oklahoma Cares, a Medicaid program administered through the Oklahoma Health Care Authority. The Oklahoma Cares Program is a product of the National Breast and Cervical Cancer Prevention and Treatment Act of 2000. The program is a partnership between the OSDH, the Oklahoma Health Care Authority (OHCA), the Cherokee Nation, the Kaw Nation of Oklahoma, and the Oklahoma Department of Human Services (OKDHS) to provide treatment for breast and cervical cancer and pre-cancerous conditions to eligible women. Eligibility requirements include uninsured women who meet income qualifications and are between the ages of 19-65 with an abnormal breast or cervical finding or diagnosis of breast or cervical cancer (OSDH, 2014). Women enrolled in the Oklahoma Cares program receive full-scope Medicaid coverage inclusive of diagnostic and treatment services (Oklahoma Breast and Cervical Cancer Prevention & Treatment Advisory Committee Annual Report, FY2012). For those women who are screened but not eligible for Oklahoma Cares, diagnostic services are provided through Take Charge!. The Oklahoma Breast and Cervical Cancer Prevention and Treatment (BCCPT) Advisory Committee was formed to provide oversight for the Oklahoma Breast and Cervical Cancer Act. The Affiliate’s Executive Director was appointed by the Governor of Oklahoma to serve as a member of the BCCPT Committee for two years and was subsequently appointed by the Oklahoma Commissioner of Health to serve an additional year as the chairperson. Through its work on the BCCPT and other projects, the Affiliate has developed and maintained a good and productive working relationship with the Take Charge! program staff. Sharing information on the Take Charge! program, the annual Komen Tulsa Race for the Cure®, utilizing Komen education materials and serving on the Community Profile project team are just some examples of how the two organizations work together to educate and address the breast health needs of the underserved women of Oklahoma.
54 | P a g e Susan G. Komen® Tulsa
The state of Oklahoma has chosen not to expand Medicaid since the implementation of the Affordable Care Act (ACA). Because of this, the Take Charge! program will continue to provide breast cancer screening for eligible women for the foreseeable future. State Comprehensive Cancer Control Coalition Comprehensive cancer control (CCC) is a process through which communities and partner organizations pool resources to reduce the burden of cancer. These combined efforts help to reduce cancer risk, find cancers earlier, increase treatment effectiveness and increase the number of people who survive cancer. In 2003, the OSDH took the administrative initiative to form the Oklahoma Comprehensive Cancer Network (OCCN) to address the cancer burden in Oklahoma. The coalition is comprised of representatives of organizations who have cancer prevention and control as a major focus of their mission. Working together, the coalition members created the Oklahoma Cancer State Plan (2006-2010) in order to decrease cancer-related morbidity and death by focusing on the priority areas of:
Prevention Early Detection Diagnosis & Treatment Quality of Life Survivorship
The Cancer Plan identifies goals to advance cancer control in Oklahoma. Following are the objectives related to breast cancer:
1. Increase public knowledge and understanding regarding breast cancer risk factors, signs and symptoms and importance of routine screening to survival.
2. Ensure primary care providers are recommending and/or conducting appropriate breast cancer screening tests according to established guidelines.
3. Identify and incorporate strategies to overcome barriers to breast cancer screening for all women age 40 and older.
4. Identify and target counties with disparities in breast cancer screening percentages either by location or by race/ethnicity in Oklahoma.
5. Ensure that women with abnormal breast cancer screening results receive timely and appropriate follow-up.
6. Each breast cancer objective will use cancer surveillance data to re-evaluate incidence rates, screening percentages and changes in prevalence every four years (OSDH, 2009).
From 2006-2008 the Affiliate was a member of the OCCN serving on the Diagnosis & Treatment work group. Due to resource limitations, the Affiliate was no longer able to actively participate in coalition meetings but has maintained communication with the coordinator and provided support as resources and time allow. After a period of inactivity, the coalition has recently formed a core steering committee that is currently reviewing the CDC grant and supporting documents, which funds the Oklahoma Comprehensive Cancer Control Program (OKCCC) and coalition implementation. This review will increase the steering committee’s knowledge and understanding of what must be achieved by both the coalition and the program in order to meet the grant requirements and provides a solid base upon which to build.
55 | P a g e Susan G. Komen® Tulsa
Priorities for the steering committee and program staff include: Revise the program’s FY15 action plan to include the enhancement of current
implementations that impact cancer. Revise the mission statement and invitation to potential stakeholders. Revise the Oklahoma Cancer State Plan with a focus on gaps not addressed in the
Oklahoma Health Improvement Plan and Coordinated Chronic Disease Plan. Prepare a media plan and evaluation plan (Oklahoma State Department of Health,
personal communication, August 4, 2014). As the steering committee and program staff determine next steps for the coalition, the addition of resources will allow the Affiliate to once again take an active role as needed. Affordable Care Act (ACA) In total, an estimated 623,000 Oklahoma residents remain uninsured even after the Affordable Care Act (ACA) established a new minimum of Medicaid eligibility for non-disabled adults who live 138 percent below the poverty line. Oklahoma, along with 38 percent of the nation, chose not to expand Medicaid throughout the state (Kaiser Family Foundation, 2014). Currently, Oklahoma offers its own plan to provide affordable health care called Insure Oklahoma. This program is guaranteed funding through 2015 (Insure Oklahoma, 2013). Uninsured and privately self-insured patients have also been directed to the federal website to sign up for insurance through the federally-organized health insurance exchange. About 69,000 of Oklahoma’s previously uninsured residents selected and joined an ACA Marketplace Plan, leaving more than 58,000 people who qualify for coverage through the ACA, but did not sign up (Kaiser Family Foundation, 2014). Over 144,480 of Oklahoma’s population fall into the coverage gap. They do not qualify for financial assistance via the health exchanges and are ineligible for Medicaid due to non-expansion of Medicaid (Kaiser Family Foundation, 2014). Since before the implementation of the ACA, Oklahoma has two federally funded programs that play a large role in influencing breast health in Oklahoma: Oklahoma’s BCCEDP (Take Charge!) and the Oklahoma Cares Program. Continued funding of these programs will be vital in order to screen, diagnose, and treat breast cancer for those who remain uninsured. At this time, under the ACA, a total of 22 different preventative services are provided to insured women without requiring them to pay an out-of-pocket expense through their insurance provider. Mammography screenings every one to two years for women over 40 are one of the preventative services included. Providers are now promised that they will receive reimbursement for this service without collecting money from the patient (US Department of Health and Human Services, 2014). Providers now have the responsibility to inform their patients that preventative health services are now covered under the ACA so that patients are aware that cost is no longer a barrier to accessing care. However, while the ACA has provided increased insurance coverage, it has not guaranteed access for all. While screening is now covered with no out-of-pocket expense to those who are insured, gaps may remain in diagnosis and treatment. Many women who purchase high deductible insurance plans through the federal exchange may be unable to pay for the needed diagnostic services if an abnormality is found on their screening mammogram. If diagnosed with breast cancer, treatment expenses for those with high deductible plans might be unaffordable. The 69,000 newly-insured patients in Oklahoma will highlight the need for additional primary care providers in the state, especially in rural parts of the Affiliate’s target populations. Oklahoma faces a primary care provider shortage. As of April 2014, the amount of primary
56 | P a g e Susan G. Komen® Tulsa
health care professionals in Oklahoma only met 63.8 percent of the need for the state. (Kaiser Family Foundation, 2014). In many respects, it is too soon to tell what sort of implications the ACA will have on the Affiliate. Utilization of Oklahoma’s BCCEDP has remained consistent since before the open enrollment period of the ACA (OSDH, personal communication, July 1, 2014), but possible implications on the Affiliate could include a shift in a need for funds to cover diagnostic services given the possible increase of insured women who have access to screening but not diagnosis. The Affiliate will continue to monitor the situation and keep up-to-date with community partners to determine if Affiliate mission activities need to be adjusted in the future to keep up with the changing needs. Affiliate’s Public Policy Activities In the 2013 Legislative Session, Oklahoma House Bill 1467 was enacted to consolidate several state health department advisory committees into a fewer number of newly-established councils. The BCCPT Advisory Committee was consolidated into the Advancement of Wellness Advisory Council and legislation directed the Governor to appoint two members to the Council, one of which must be a member who is knowledgeable about breast and cervical cancer issues. The Affiliate’s Executive Director was recently appointed by the Governor of Oklahoma to serve on the Council for a three year term. In addition to its representation on the Wellness Advisory Council, the Affiliate conducts in-district meetings with Oklahoma’s Members of Congress as scheduling permits. These meetings provide an opportunity for the Affiliate to discuss issues that are important to the breast cancer community, as well as the challenges and opportunities that exist within the Affiliate’s service area that the legislators represent.
Health Systems and Public Policy Analysis Findings The primary goal of the Affiliate is to find solutions for access to care where the health systems exist today. It will continue to seek out new opportunities for partnerships and collaborations in order to provide a realistic and sustainable approach to providing women access to all stages of the CoC, whether within their county of residence or within the Tulsa metro area. Building upon existing partnerships and developing new partnerships in the target communities will allow the Affiliate to find ways to create bridges where gaps exist. With the Executive Director’s involvement on the state’s Wellness Advisory Council, there will be opportunities to address insufficiencies in the breast cancer CoC. In addition, the Affiliate will continue its work to educate state and federal legislators on the breast cancer needs in its service area and the best ways to serve women along the CoC in eastern Oklahoma. As seen by the health systems analysis of the four target communities, Tulsa County has strong programs in place to address each stage of the CoC, however, the issue of access to care still remains. As for the remaining three target communities, Osage, Rogers, and Wagoner, there are limited resources with little to no access to all stages of the CoC. Potential barriers will be explored further by the Affiliate as it relates to each target area, within the four points of the CoC.
57 | P a g e Susan G. Komen® Tulsa
Qualitative Data Sources and Methodology Overview To further explore the breast health and breast cancer issues highlighted by the quantitative data and potential barriers within the Continuum of Care (CoC), discovered through the Health Systems Analysis (HSA), the Affiliate collected and analyzed qualitative data. This process provides insight into the attitudes, beliefs and behaviors within the Affiliate’s target communities about disparities, access to services, utilization of services and quality of care among other breast health and breast cancer issues. In addition, the Affiliate was able to gain insight and perspective into what is working, what is not working and various barriers that lead to gaps in access, utilization and quality of services. Methodology “The procedures by which researchers go about their work of describing, explaining and predicting phenomena are called research methodology” (Rajasekar, Philominathan, & Chinnathambi, 2013, p. 5). The methodology for this research was qualitative because the purpose of the study was to understand the perceptions and experience of the participants (Creswell, 2009). A generic qualitative design was used; this design was appropriate since the phenomena explored was external and involved both non-psychological and psychological aspects (Creswell). The purpose of the research was to understand breast health care in the counties of Tulsa, Rogers, Wagoner and Osage. The specific variables addressed were access to care, barriers to care, education/awareness and quality of care. As previously stated in the quantitative section of this report, the counties were selected based on breast cancer statistics and because they were identified as counties based in close proximity to the Affiliate, their existing partnerships, and the Affiliate’s ability to effectively utilize its resources to address the variables and provide services. A purposeful sampling was used to select participants. Data Collection Generic qualitative studies use structured and unstructured interviews, open-ended qualitative surveys, participant observations, focus groups and field notes (Glicken, 2003). Two data collection methods were selected: focus groups and key informant interviews. Focus groups allow a group of participants to provide information and in-depth feelings about a topic (Glicken, 2003). Discussing a sensitive issue such as breast health care requires a format where participants can disclose both information and feelings. Focus groups also afford the researcher the ability to “collect very important data in a short period of time (p.162)”. In accordance with qualitative research best practices (Ritchie, Lewis, Nicholls, and Ormston, 2013), each focus group did not exceed nine participants. Responses from participants in the focus groups were audiotaped with two recorders and transcribed during and after the sessions. All participants in both the focus groups and key informant interviews completed a consent form either verbally or written before participating in the study. Key informants took part in the data collection method of structured interviews. Structured face-to-face or phone interviews were used with open-ended, non-directional questions that focused on the concepts of seeking and using (Creswell, 2009) breast health services. Notes were taken during the interview and reviewed to ensure clarity after the session ended. Regardless of the method (phone or face-to-face), the same questions were given to the participants to answer. Primary data were collected from two groups of participants: key informants and focus group participants. Participants were women who sought out and/or obtained breast health services in the selected counties. Key informants included a diverse group of individuals, such as community leaders, health professionals, patients, survivors, and co-survivors who have a
Qualitative Data: Ensuring Community Input
58 | P a g e Susan G. Komen® Tulsa
firsthand knowledge of the community. Focus group inclusion criteria included women age 35 and up, who reside or receive breast health services in Tulsa, Rogers, Wagoner, and Osage counties in northeast Oklahoma. Data were collected by the Affiliate staff, Community Profile Team, and the Qualitative Research Team. The Affiliate staff included: Abbi Lee, MPH, Community Health Manager, and Christy Southard, Executive Director. The Community Profile Team included: Uzma Syed, MPH, Community Profile Team Leader and Syeachia Dennis, M.D, Affiliate Board Member. The Qualitative Research team included: Jerri Stoutermire, Ed.D., Audrey Thompson, PhD., Sherri Tapp, Ed.D., and Dinah Manns, Ed.D. Incentives Payment for research participation must not invalidate the principles of voluntary participant and ethical consideration. Incentives should be given to only compensate time and expenses (Economic and Social Research Council, 2014). Therefore, participants were given a $50 gift card from a local convenience store or $50 cash if a convenience store was not located in close proximity. Since participants in the focus groups were mostly from rural areas and may have to drive over 30 miles to reach the focus group location, it was determined they should receive an incentive. Focus groups were conducted in the following locations: Tulsa County (Rudisill Library, Indian Health Care Resource Center, and Morton Comprehensive Health Services), Rogers County (Rogers State University campus), Wagoner County (Coweta Public Library) and Osage County (Charles Page Library). Key informants did not receive an incentive since these interviews were conducted at their place of business or over the phone. Triangulation There are many forms of triangulation. Data triangulation is achieved by using different sources to provide information (Grulon David, Diehl & McDonald, 2013). To achieve data triangulation two groups of participants were used: key informant interviews of community stakeholders and focus groups comprised of women in the community. Methodological triangulation incorporates various qualitative data collection methods to confirm conclusions. If the conclusions are the same, the validity is established. Triangulation results in greater assurance in collected data and yields a broader comprehension of the phenomena (Grulon et al., 2013). This assessment used focus group data and key informant interviews to attain methodological triangulation. Sampling Sampling is an essential component of qualitative inquiry (O’Brien, Bayouni, Davis, Young & Strike, 2009). Purposive, also known as purposeful sampling, is widely used in qualitative studies and has been defined by Koeber and McMichael as “…having the characteristics necessary to answer questions about a certain matter…” (2008). For this study, data was collected with two groups of participants: key informants and women who seek and/or obtain breast health services in the target communities known as focus group participants. Because the inclusion criteria were broad, participants were selected that had received a breast cancer diagnosis, survived breast cancer, supported survivors, or supported those who died from breast cancer. Also, because Susan G. Komen messaging includes mammograms beginning at age 40 (Komen, 2014), the inclusion criteria was set at women ages 35 years or older. Finally, participants were included who were AIAN and Black/African-American as those were the target groups of women who reported to be medically underserved and suffer late-stage diagnosis and death at rates above the state averages for such groups. Key informants were directly recruited in the target communities of Rogers, Tulsa, Wagoner, and Osage Counties by Komen staff, utilizing the HSA list of health care organizations in the target communities, support groups, and other Komen Tulsa Affiliate community partners. The

59 | P a g e Susan G. Komen® Tulsa
Affiliate staff called and/or emailed the potential participants, described the study and asked if they would be willing to serve as a key informant by completing a face-to-face interview or an interview by phone. Focus group participants were recruited in the target communities by a key community member or a professional recruiter. When help was solicited from a key player in the community, they recruited participants from community organizations with whom they had relationships. Once participants were found, Affiliate staff screened each participant for appropriate fit of the focus group. A majority of participants were recruited through a professional recruiting agency. A professional recruiter sought out, contacted, and screened each individual for participation in the study. Once staff found a destination and time within each county to conduct the focus groups, the recruiter confirmed that the participant met the inclusion criteria and then assigned them to a particular focus group. Over the two month recruiting period, more than 100 women were screened for inclusion in the focus groups. A total of 12 semi-structured focus groups were conducted between September 1st and October 15th, 2014. Releases were signed and submitted by each participant prior to the beginning of each focus group. Focus group data were collected by the Affiliate staff and the Qualitative Research Team. All focus group facilitators had credentials and training in facilitating group settings. All focus groups were recorded and those recordings were transcribed verbatim. The focus group protocol was established by the Affiliate with input from the Qualitative Research Team. Each focus group was comprised of six to nine participants. The protocol included open-ended questions designed to elicit the experiences of the members. Ethics This research adhered to the Belmont Report (1979) principles for working with human subjects. The following principles were covered in the research design, data collection, and data analysis.
I. Justice – Fairness of distribution (Belmont Report, 1979, para. 3) was achieved as each participant was treated equally and in accordance with the same research guidelines.
II. Beneficence – Because the subject matter, data collection methods and the participants were not vulnerable, the study was considered minimal risk.
III. Respect for persons – Because all participants were over 18 years old and adults and did not have any known mental handicaps, they were able to give consent and make the decision to participate in the study. Participants were informed that participation was voluntary and that they could quit at any time.
Anonymity was provided to all participants. Focus group participants’ names were not mentioned on the recording or in the transcripts. Audios that were sent to the transcriptionists did not include any participant names. Key informant interviews were not recorded, however, participants were given aliases and these were assigned to the key informant notes. Data was kept confidential and only viewed by the Affiliate staff working on the research. Once data was de-identified, the Qualitative Research team and the staff began the analysis process. All data, including signed consent forms and interview notes, remained secure in the locked office of the Community Health Manager, Abbi Lee. Due to time constraints, the 12 focus group recordings were transcribed by two services: one locally and one located out of state. The local transcriptionist received the audio files through hand delivery and returned in the same way. Transcripts were sent over email with no identifying information attached. In sending the remaining recorded focus group interviews to
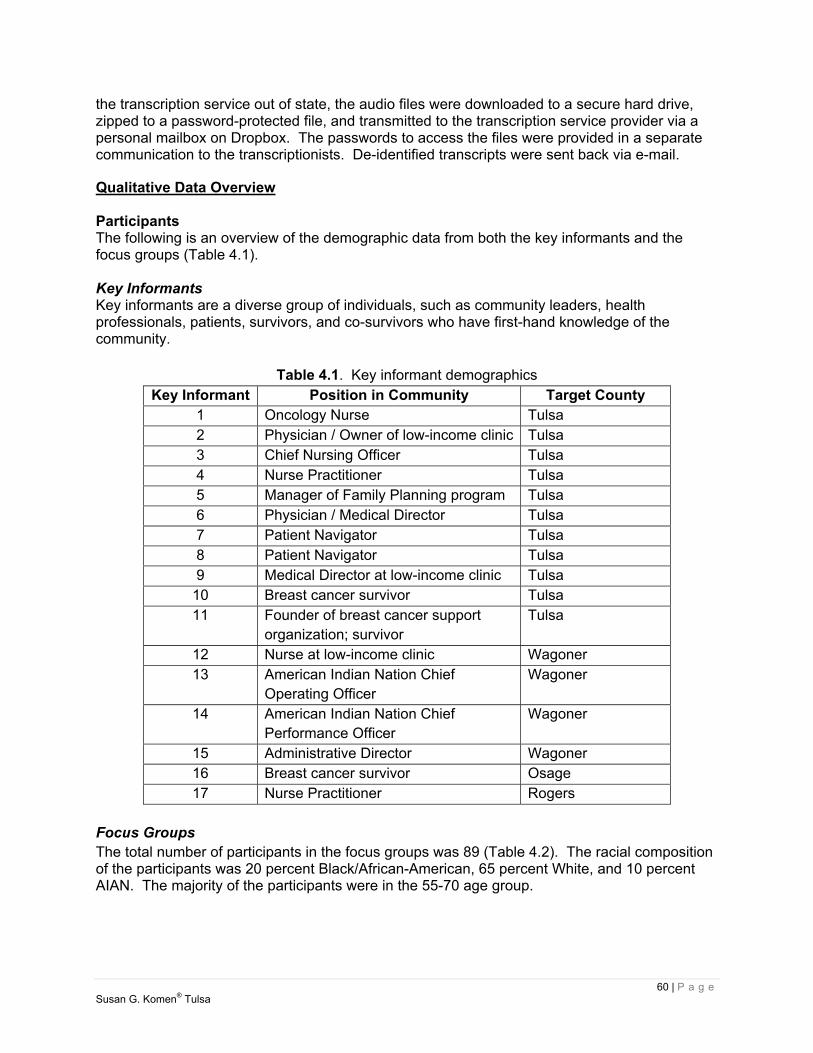
60 | P a g e Susan G. Komen® Tulsa
the transcription service out of state, the audio files were downloaded to a secure hard drive, zipped to a password-protected file, and transmitted to the transcription service provider via a personal mailbox on Dropbox. The passwords to access the files were provided in a separate communication to the transcriptionists. De-identified transcripts were sent back via e-mail.
Qualitative Data Overview Participants The following is an overview of the demographic data from both the key informants and the focus groups (Table 4.1). Key Informants Key informants are a diverse group of individuals, such as community leaders, health professionals, patients, survivors, and co-survivors who have first-hand knowledge of the community.
Table 4.1. Key informant demographics
Key Informant Position in Community Target County 1 Oncology Nurse Tulsa 2 Physician / Owner of low-income clinic Tulsa 3 Chief Nursing Officer Tulsa 4 Nurse Practitioner Tulsa 5 Manager of Family Planning program Tulsa 6 Physician / Medical Director Tulsa 7 Patient Navigator Tulsa 8 Patient Navigator Tulsa 9 Medical Director at low-income clinic Tulsa
10 Breast cancer survivor Tulsa 11 Founder of breast cancer support
organization; survivor Tulsa
12 Nurse at low-income clinic Wagoner 13 American Indian Nation Chief
Operating Officer Wagoner
14 American Indian Nation Chief Performance Officer
Wagoner
15 Administrative Director Wagoner 16 Breast cancer survivor Osage 17 Nurse Practitioner Rogers
Focus Groups The total number of participants in the focus groups was 89 (Table 4.2). The racial composition of the participants was 20 percent Black/African-American, 65 percent White, and 10 percent AIAN. The majority of the participants were in the 55-70 age group.
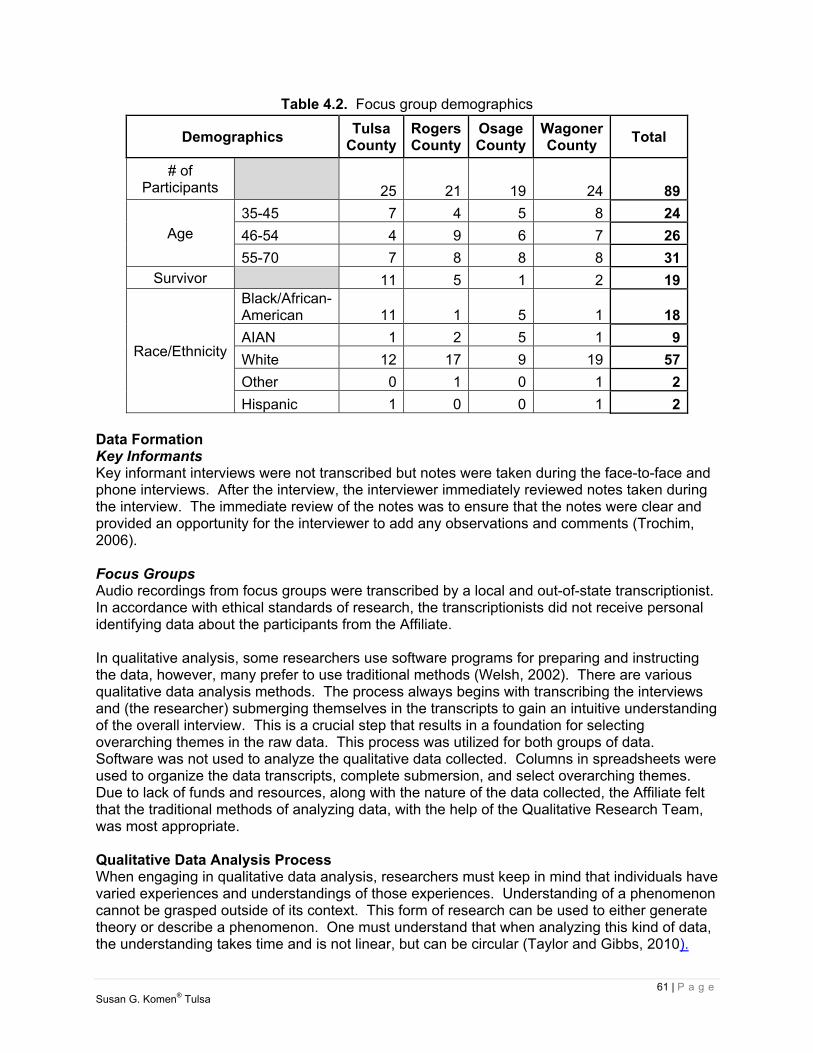
61 | P a g e Susan G. Komen® Tulsa
Table 4.2. Focus group demographics
Demographics Tulsa
CountyRogers County
Osage County
Wagoner County
Total
# of Participants 25 21 19 24 89
Age 35-45 7 4 5 8 24
46-54 4 9 6 7 26
55-70 7 8 8 8 31Survivor 11 5 1 2 19
Race/Ethnicity
Black/African-American 11 1 5 1 18
AIAN 1 2 5 1 9
White 12 17 9 19 57
Other 0 1 0 1 2
Hispanic 1 0 0 1 2 Data Formation Key Informants Key informant interviews were not transcribed but notes were taken during the face-to-face and phone interviews. After the interview, the interviewer immediately reviewed notes taken during the interview. The immediate review of the notes was to ensure that the notes were clear and provided an opportunity for the interviewer to add any observations and comments (Trochim, 2006). Focus Groups Audio recordings from focus groups were transcribed by a local and out-of-state transcriptionist. In accordance with ethical standards of research, the transcriptionists did not receive personal identifying data about the participants from the Affiliate. In qualitative analysis, some researchers use software programs for preparing and instructing the data, however, many prefer to use traditional methods (Welsh, 2002). There are various qualitative data analysis methods. The process always begins with transcribing the interviews and (the researcher) submerging themselves in the transcripts to gain an intuitive understanding of the overall interview. This is a crucial step that results in a foundation for selecting overarching themes in the raw data. This process was utilized for both groups of data. Software was not used to analyze the qualitative data collected. Columns in spreadsheets were used to organize the data transcripts, complete submersion, and select overarching themes. Due to lack of funds and resources, along with the nature of the data collected, the Affiliate felt that the traditional methods of analyzing data, with the help of the Qualitative Research Team, was most appropriate. Qualitative Data Analysis Process When engaging in qualitative data analysis, researchers must keep in mind that individuals have varied experiences and understandings of those experiences. Understanding of a phenomenon cannot be grasped outside of its context. This form of research can be used to either generate theory or describe a phenomenon. One must understand that when analyzing this kind of data, the understanding takes time and is not linear, but can be circular (Taylor and Gibbs, 2010).

62 | P a g e Susan G. Komen® Tulsa
Detailed, in-depth individual key informant and focus groups interviews were conducted by Komen Tulsa Affiliate staff and the Qualitative Research Team. Each participant in the focus groups and key informant interviews were provided a consent form prior to answering any interview questions. Both the key informant interviews and focus groups lasted from 30 minutes to an hour depending on the response(s) of the interviewees. Questions were drawn from the Komen Headquarters question bank. According to Merriam (1998), “the main purpose of an interview is to obtain a special kind of information” (p.71). Merriam asserted that data analysis is revealing the meaning represented by the data. Words, phrases, or sentences that appear repeatedly in the text can provide an awareness of a phenomenon according to MacMillan and Schumacher (2001). They further stated that “categories and patterns emerge from the data …” (p.462). The interview notes and focus group transcripts were thoroughly read for recurring words, sentences, and phrases. These words, sentences, and phrases are called data sets. The data sets comprised of all the raw data obtained in the interviews. The responses were initially analyzed individually by question. Informant answers were read, reflected upon, and re-read in order to gain the essence of the meaning of the answers. Significant words, phrases, and sentences were noted on separate sheets of paper for each question after the answer was read. Some questions required several sheets of paper in order to document all of the meaningful text. The data sets were grouped into categories and were analyzed; categories that were related became Patterns. This process involved coding corresponded to each question to identify commonalities among responses. Key Informants – Data Analysis This purposeful sample included physicians, nurse practitioners, nurses, patient navigators, breast cancer survivors, business owners, and health care administrators. Out of the total key informants, 64.7 percent came from Tulsa County, 23.5 percent came from Wagoner County, 5.9 percent came from Osage County, and 5.9 percent came from Rogers County. Due to lack of health care workers in the rural counties of Rogers, Wagoner, and Osage, key informant interviews were unevenly distributed among the target communities, however, they corresponded to the amount of available health care workers and facilities within each county. This is indicative of the physician shortage in Oklahoma. “Oklahoma has 76 doctors per 100,000 residents, far fewer than the 220 doctors per capita nationally and the state ranks 43rd in doctors per capita and 41st in primary-care physicians” (Adcock, 2013, para. 1). This shortage is more apparent in rural areas of Oklahoma (Adcock). Question one, 1a and 1b, had to do with functions performed by the organization for which the interviewee worked. Categories that emerged were Orientation, Screening, Outreach and Service Coordination and are represented in Figure 4.1.
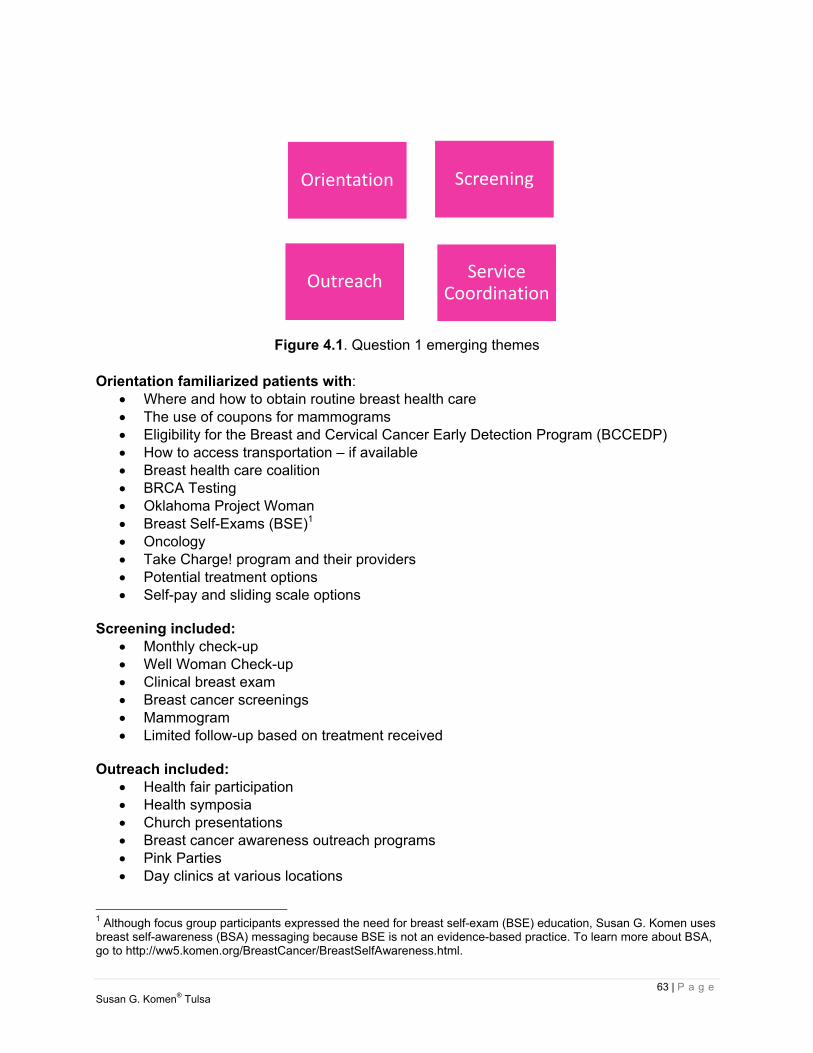
63 | P a g e Susan G. Komen® Tulsa
Figure 4.1. Question 1 emerging themes
Orientation familiarized patients with:
Where and how to obtain routine breast health care The use of coupons for mammograms Eligibility for the Breast and Cervical Cancer Early Detection Program (BCCEDP) How to access transportation – if available Breast health care coalition BRCA Testing Oklahoma Project Woman Breast Self-Exams (BSE)1 Oncology Take Charge! program and their providers Potential treatment options Self-pay and sliding scale options
Screening included:
Monthly check-up Well Woman Check-up Clinical breast exam Breast cancer screenings Mammogram Limited follow-up based on treatment received
Outreach included:
Health fair participation Health symposia Church presentations Breast cancer awareness outreach programs Pink Parties Day clinics at various locations
1 Although focus group participants expressed the need for breast self-exam (BSE) education, Susan G. Komen uses breast self-awareness (BSA) messaging because BSE is not an evidence-based practice. To learn more about BSA, go to http://ww5.komen.org/BreastCancer/BreastSelfAwareness.html.
Orientation Screening
Outreach Service Coordination
64 | P a g e Susan G. Komen® Tulsa
Service Coordination included: Coordinating with Komen Tulsa to ensure patient gets to next appointment
Maintaining memorandum with various providers Keeping Oklahoma Project Woman contract current Helping uninsured access Medicaid, Sooner Plan via Sooner Care, and other programs Advocating for patients Partnering with other agencies/programs Coordinating in-services with Komen Tulsa
Question number two explored the role of the informant. The categories that arose from this analysis were education, screening, service coordination and some follow-up. Education included:
Possible side effects of treatment Management of side effects Chemotherapy education Dietary education How to perform/literature for BSE
Screening included:
Monthly check-up Well Woman check-up Clinical breast exam Breast cancer screenings Mammogram Limited follow-up based on treatment received
Service Coordination included:
Coordinating with Komen Tulsa to ensure patient gets to next appointment Maintaining memorandum with various providers Keeping Oklahoma Project Woman contract current Helping uninsured access Medicaid, Sooner Plan via Sooner Care, and other programs Advocating for patients Partnering with other agencies/programs Coordinating in-services with Komen Tulsa
Although follow-up is limited, when it was available, it generally involved referral services back to the primary care physician or the medical oncologist. The third question asked informants to describe the process for patient access to breast health care and treatment. The first category that arose from this inquiry had to do with the difference in protocols between women with insurance and those who are uninsured. Those with insurance have a more seamless experience, moving from screening to diagnosis to treatment and follow-up. Uninsured patients usually have to be referred to any number of programs in order to obtain a mammogram, and should there be a finding that requires further attention, additional referrals may be needed. Additionally, transportation may be an issue for uninsured patients. Generally, there is not much difference in time frames between insured and uninsured patients. Most interviewees agreed that both uninsured and insured patients made it through the breast cancer CoC in the same amount of time. The second category that emerged was that women should value their

65 | P a g e Susan G. Komen® Tulsa
health and make it a top priority. Respondents stated that when there is a delay in diagnosis or subsequent treatment, it most likely occurs when patients do not consider their own health a top priority. Question four inquired about the degree of knowledge held by physicians, nurses, and staff caring for this patient population. Interviewees asserted that the amount of experience these service providers possessed had a direct impact on how knowledgeable they were. Nurses were deemed to have the most knowledge, followed closely by social workers. Respondents stated that the more experienced staff assisted those with less experience. It was reported that most of those serving patients knew about Oklahoma Project Woman and the Affiliate, but were limited in their awareness of other resources available for this population. The fifth question asked how and where women were most likely to obtain their breast health care information. Respondents reported five primary sources: the Internet, outreach services that include health fairs and church-based educational opportunities, the health department, friends and family, and their primary care physician. Question six asked contributors their thoughts on the most effective ways to educate women about breast health care. Following are the resulting categories from the analysis of this question: First, key informants believe that there should be much more health education occurring in high schools and colleges. Specifically, they assert that younger women need to be taught about breast health care because breast cancer occurs in women under the age of 40. Secondly, interviewees want more demonstrations conducted on BSE for women in the community at events including health fairs, church health care events, and in-services. The next category that emerged centered on the importance of going where the people are. Many respondents said that the doctors, nurses, technicians, and other providers should be going to the communities instead of waiting for women to come in. They felt that with the challenges of child care, transportation, and work, it is not always reasonable to expect women to be able to get to a clinic. These challenges seem to be greater for those living in more rural areas. Lastly, respondents believe strongly that cultural competence in all forms of patient interaction is essential for effectiveness in educating women about breast health care. Interviewees stated repeatedly that it is critical to establish trust with patients. They believe that this may be enhanced when patients can see someone who looks like them during examinations and treatment. Question seven asked informants which existing programs, services, and policies were effective and ineffective in delivering breast health services in their areas. Most believe that the following have been effective:
Affordable Care Act Oklahoma Project Woman Komen Tulsa grants BCCEDP Take Charge! at free clinics Including ALL family members in patient education and treatment One-on-one patient education
66 | P a g e Susan G. Komen® Tulsa
Literature available at front counters of physician offices/health fairs Doctors and nurses donating time
Furthermore, they assert that the following are not effective:
Jobs that do not provide employee health insurance Local clinics that serve few patients in a day Lack of education for younger women about breast health care Oklahoma declining Medicaid Expansion Episodic health care - only seeking out health care when there is a problem (no
preventative care) Patients failing to get annual exams Lack of funding Lack of transportation Lack of emphasis on AIAN Population (except for Diabetes education) Tamoxifen not covered under insurance
The eighth question sought to answer what new programs, services, or policies are needed in the informants’ area. Additional funding topped the list of three categories from this inquiry. Sub-categories under the heading of funding include:
More free clinics Mobile units to treat women in their communities Better prescription programs Access to a doctor for everyone Programs in rural areas
The two remaining categories emphasized the need for Cultural Competence among providers and the desperate need for transportation assistance for patients. Question 9 explored respondents’ views regarding barriers (cultural, environmental, and socioeconomic) that keep women from seeking breast health care. Primary categories that arose from the responses were transportation, language and cultural barriers, fear, and spiritual/religious barriers. In addition to the growing Spanish speaking population, informants reported increasing Burmese and Russian communities in their areas as well. More translators and/or multi-lingual health care providers were found to be sorely needed. Question ten asked respondents’ thoughts regarding whether or not follow-up care is available at satellite sites for those living in rural areas. Most of the respondents stated that there was little to no follow-up available to patients living in rural areas. Some follow-up consisted of going back to the original primary care physician to receive a referral for follow-up care. Transportation was again reported as an impediment to follow-up care. Due to lack of resources, patients have to make their way to the “main” office for follow-up care. An analysis of the categories revealed three patterns. Those patterns are:
A) Little to no follow-up care available particularly for rural patients B) Barriers to obtaining breast health care
a. Transportation b. Funding c. Fear d. Distance e. Cultural (Language, Lack of Cultural Competence)

67 | P a g e Susan G. Komen® Tulsa
C) Education a. Doctors and nurses should maintain current knowledge of treatment options for
patients and how patients can access them. b. Service providers should maintain current knowledge of community service
resources and how patients can access them. c. Patients need to be taught about breast health care and how to perform BSE2 d. Patients need to be taught about treatment options e. Patients need to be taught about possible side effects of treatment f. Patients need to be taught how to manage treatment side effects g. Family members need to be taught how to help patients
These patterns are shown in Figure 4.2.
Figure 4.2. Patterns of analysis
A second analysis was conducted to reveal recurrent patterns across all of the interviews. This two-step process ensures that individual participants’ themes are considered as well as overarching themes from the data sets. The five patterns are: Services, Roles, Processes/Protocols, Strengths/Weaknesses and Recommendations. Questions were grouped according to pattern alignment. Figure 4.3 depicts these patterns.
2 Although focus group participants expressed the need for breast self-exam (BSE) education, Susan G. Komen uses breast self-awareness (BSA) messaging because BSE is not an evidence-based practice. To learn more about BSA, go to http://ww5.komen.org/BreastCancer/BreastSelfAwareness.html.
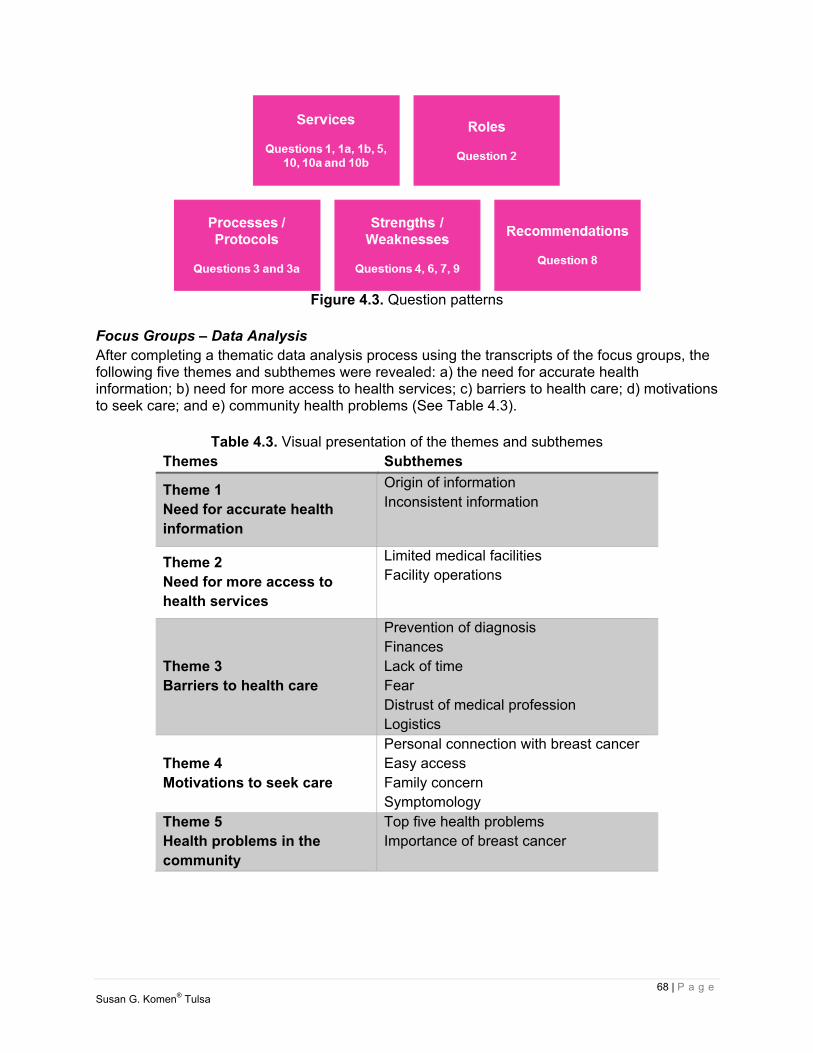
68 | P a g e Susan G. Komen® Tulsa
Figure 4.3. Question patterns
Focus Groups – Data Analysis After completing a thematic data analysis process using the transcripts of the focus groups, the following five themes and subthemes were revealed: a) the need for accurate health information; b) need for more access to health services; c) barriers to health care; d) motivations to seek care; and e) community health problems (See Table 4.3).
Table 4.3. Visual presentation of the themes and subthemes Themes Subthemes
Theme 1 Need for accurate health information
Origin of information Inconsistent information
Theme 2 Need for more access to health services
Limited medical facilities Facility operations
Theme 3 Barriers to health care
Prevention of diagnosis Finances Lack of time Fear Distrust of medical profession Logistics
Theme 4 Motivations to seek care
Personal connection with breast cancer Easy access Family concern Symptomology
Theme 5 Health problems in the community
Top five health problems Importance of breast cancer

69 | P a g e Susan G. Komen® Tulsa
Theme 1 - Need for Accurate Health Information Each focus group in each target community expressed a desire and true need for more accurate health information (Figure 4.4). The present age of information provides easy and instant access to various and many types of knowledge; however it is often hard to validate the information. Despite the participants having access to both print (Internet, Google, WebMD, magazines and billboards) and broadcast media (TV commercials, TV talk shows, National Public Radio, and other radio stations), participants expressed confusion about knowing how often mammograms should be conducted, the difference between physician screening and self-checks and how hormone replacement therapy affects breast cancer rates. Participants stated that their second source of health information is provided by physicians. They stated asking their OB/GYN or physician any questions they have. In addition, information from physicians and media, word of mouth, and health fairs were other places where participants sought information. Word of mouth sources included neighbors, family, and friends. Participants stated that health fairs were often located at churches, company screenings, community centers, insurance companies, and the Affiliate. Participants expressed that they would like to see more consistent information about breast health care from the medical community. Participants questioned “How often should I get a mammogram?” “Is it every year or every five years?” “Does that change if my family has a history of breast cancer?” and “Why did they change it anyway?”. While many health websites, like Mayo Clinic, address changing evidence and how it affects individuals (Pruthi, 2013), there remains a lot of conflicting information in digital and print media. In addition, participants expressed the need to access information in the places they frequent the most. Brochures and print documents at churches, shopping locations (large discount warehouse stores, malls), children’s schools (back to school night, daycares, childcare centers) and religious and community centers were listed by participants as suitable locations. Each focus group specifically expressed the desire to learn about breast cancer screenings, mammograms, and the disease itself.
Figure 4.4. Theme 1 – Need for health information
22
17
8 8
0
5
10
15
20
25
Media Medical Word of Mouth Health Fairs
Per
cent
age
Source of Information
Theme 1Need for Health Information
70 | P a g e Susan G. Komen® Tulsa
Theme 2 – Need for More Access to Health Services In the four target communities, participants stated that they needed more access to breast health care services. There are three main hospitals where participants received services. Sixty-four percent of participants received breast health care services at hospital breast centers, 18 percent received care at cancer clinics, and 14 percent received care at various other locations. One participant stated they go to Texas to receive their care because they trust their physician there. Another participant says they receive all their care at the Indian hospital or clinic. A revelation by four percent of participants was that they do not seek or receive any breast health care services. Lack of insurance was stated as the cause. Participants also expressed that facility operations prevent optimal care. Limited appointments, long waiting lists, physician/staff miscommunication, physician error, and being lost in the “big health care system” results in inefficient care. Participants made statements like, “I called and called and didn’t get through for four days.” “My doctor was on vacation for two weeks and my test was not reviewed.” “My doctor didn’t complete my preauthorization right the first time.” Facilities that provided breast health care services are centrally located in the state, but often a long distance from the target communities and these facilities do not provide extended operation hours. As noted in the HSA, the majority of the resources for breast health services are only available in Tulsa County. Residents from Rogers or Wagoner Counties may have to travel up to 40 miles for breast health care. Participants traveling from Osage County may have to travel over 50 miles. Some participants expressed they may even have to travel as much as two hours to receive care. To further complicate the issue, if the facilities do not have extended hours then participant appointments may require an entire day of lost wages and still may struggle with transportation. In Oklahoma, public transportation is limited. Theme 3 – Barriers to Health Care The participants discussed numerous barriers to receiving breast health care (Figure 4.5). The most commonly mentioned barriers were financial in nature. Forty-four percent of the difficulties stated were related to finances. They included the following: lack of health insurance, cost of medical care, and high copays. One participant expressed that before they finished treatment their medical bill was sent to a collection agency. Due to a layoff, they were only able to pay $25 a month. Another participant stated that their last chemotherapy treatment was the first day of January and a large out of pocket expense was due. Unless the amount was paid, no services would be rendered. For others (23.0 percent) barriers included lack of time due to work schedules and family obligations. Many participants stated that their fear of possibly having cancer kept them from seeking attention; 15 percent of participants allowed fear to keep them from scheduling a mammogram or other preventive screenings. The need for accurate information, as discussed in Theme 2, was also a barrier to care. Ten percent of participants stated that they did not know when to schedule mammograms. “Is it every five years or every year? I don’t know anymore.” A small percentage (8.0 percent) of participants also stated that they do not trust the medical profession and therefore seek care only in emergencies.
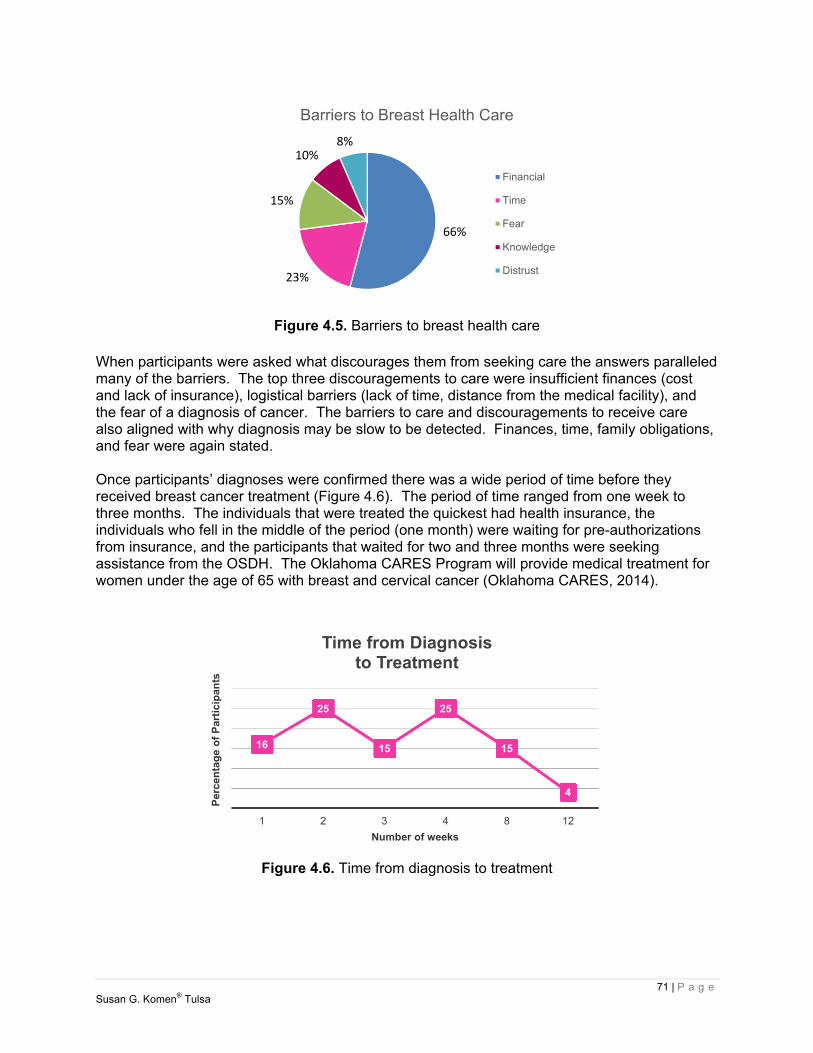
71 | P a g e Susan G. Komen® Tulsa
Figure 4.5. Barriers to breast health care
When participants were asked what discourages them from seeking care the answers paralleled many of the barriers. The top three discouragements to care were insufficient finances (cost and lack of insurance), logistical barriers (lack of time, distance from the medical facility), and the fear of a diagnosis of cancer. The barriers to care and discouragements to receive care also aligned with why diagnosis may be slow to be detected. Finances, time, family obligations, and fear were again stated. Once participants’ diagnoses were confirmed there was a wide period of time before they received breast cancer treatment (Figure 4.6). The period of time ranged from one week to three months. The individuals that were treated the quickest had health insurance, the individuals who fell in the middle of the period (one month) were waiting for pre-authorizations from insurance, and the participants that waited for two and three months were seeking assistance from the OSDH. The Oklahoma CARES Program will provide medical treatment for women under the age of 65 with breast and cervical cancer (Oklahoma CARES, 2014).
Figure 4.6. Time from diagnosis to treatment
66%
23%
15%
10%8%
Barriers to Breast Health Care
Financial
Time
Fear
Knowledge
Distrust
16
25
15
25
15
4
1 2 3 4 8 12
Per
cen
tag
e o
f P
arti
cip
ants
Number of weeks
Time from Diagnosis to Treatment
72 | P a g e Susan G. Komen® Tulsa
Theme 4 - Motivations to Seek Care As expected, many of the barriers to care, if alleviated, would motivate a participant to seek care. However, these did not parallel with every barrier. For example, although insurance and transportation were regularly mentioned barriers to care, only 12.0 percent of participants stated that they were motivated by having insurance and transportation. Participants were most motivated (40 percent) by personal knowledge or experience with the disease. One participant stated they worked at a cancer treatment center and due to seeing people suffer, it made them never want to put off care. Another participant said she saw her mom suffer and it motivated her to get care. Thirty percent of the respondents said that the ease of making appointments would motivate them to seek care. Possible solutions discussed were to extend clinic hours, mobile units, and pre-scheduling. Physicians could pre-schedule a mammogram appointment a year in advance and send a reminder. Twelve percent of respondents said they are motivated by their children stating they wanted to be around for them and see them grow up. Participants were also motivated to seek breast health care when symptoms were present. The top symptoms stated were lumps in the breast, nipple irregularity (discharge or inverted), low energy levels, and coughing up blood. Others sought breast care treatment when referred by a physician or because a negative outcome was discovered by a mammogram. This theme along with themes from barrier to care is far-reaching. Simply relieving barriers to care will not motivate a person to seek care. Motivation must be coupled with the removal of barriers (finances, transportation and access to care) in order for women to seek care. Theme 5 - Health Problems in the Community The participants highlighted five health problems in their communities: heart problems, diabetes, high blood pressure, breast cancer and stress (and stress-related disorders such as obesity and smoking). These health issues align with both Oklahoma’s leading causes of death and disease rates as indicated in the Oklahoma State of the State Health Report (Oklahoma State Department of Health, 2014). While not the leading cause of death, participants ranked breast cancer and cancer (all types) as the most important health issue in their communities. According to the OSDH (2014), specific leading causes of death that contribute to Oklahoma’s high death rate include cancer, heart disease, stroke, diabetes, and obesity. Oklahoma has the 12th highest rate of death due to cancer in the nation. Upon seeing these statistics, it would appear that the participants seemed in tune with Oklahoma’s health landscape and health challenges.
Qualitative Data Findings While many similarities exist among qualitative findings within each county, slight differences did occur that will drive the Affiliate’s Mission Action Plan. Tulsa County Participants from Tulsa County expressed several barriers to breast health care within their county. They encompass a more diverse range of factors compared with the other counties but the most common were culture and language, lack of insurance, lack of education, fear, distrust, and financial resources. The growing Burmese and Russian populations have added to the resources needed for this county including more translators and/or multi-lingual health care providers. Informants stated that most county residents seek out health information from community resources like churches and health fairs, in addition to the county health department and the internet.

73 | P a g e Susan G. Komen® Tulsa
Motivators to seek care within Tulsa County included affordability, access to insurance, after hour clinics, and transportation. The greatest needs discovered for the county were for more breast health education particularly through health fairs and one-on-one conversations, transportation, resources to help cover those who are underinsured or lack insurance, and mobile mammography. Osage County Osage County focus group participants and key informants alike reported the barriers that kept women from seeking breast health care included financial barriers, a lack of time to seek out services, lack of insurance, and lack of education. Additionally, concern was expressed that women in rural areas are at greater disadvantage due to transportation issues and the challenges of childcare and work. Breast health information was said to be obtained through the Internet and their primary care physician. Motivators of care for this county included an easier ability to make appointments by extending clinic hours and pre-scheduling. Lastly, respondents expressed the need and the importance of going where the people are within the county. More information and services need to be made available particularly among low income housing and the community centers. Rogers County Rogers County participants stated the biggest barriers to care included lack of insurance, lack of time, ignorance, and fear/anxiety. Many women need to leave the county to receive care due to the lack of resources within the county. Participants stated that much of the main source of breast health information comes from friends and family, their primary care physician, and the internet. The main motivator to seek breast health care for participants in Rogers County was the desire to see their children grow up. Others included location of the clinic, easy access, mobile services, and family history. The greatest needs expressed within Rogers County were more breast health education within churches and the availability of more free screenings. Wagoner County A large portion of participants within this county stated that fear and transportation were driving barriers to seeking out care. Other barriers included lack of insurance, financial resources, distrust of physicians, and lack of time. A majority of respondents said that most women receive their breast health education through the Internet, in addition to their primary care provider. A main motivator for participants to seek care included family history. Barriers to care that were cited included time and money, particularly for copays and other service costs. Wagoner County’s greatest needs include more education and more availability of services including extended clinic hours and going where people are through the use of mobile mammography and other mobile services. Strengths and Limitations Limitations and weaknesses in qualitative research are inherently evident in recruitment, data collection, and the final data analysis (Creswell, 2003). Generalizability is one limitation of the study. Generalizability from the focus study groups will be limited to women age 35 and up who seek breast health care in the target communities. Likewise generalizability from the key informant interviews will be limited to individuals who have first-hand knowledge of the target area and are community leaders, health professionals, patients, survivors and co-survivors.

74 | P a g e Susan G. Komen® Tulsa
The sampling plan was designed to recruit participants from the target communities and represent populations that have the highest breast health care disparity. However, using purposeful sampling with voluntary recruitment limits the number of individuals who are willing to volunteer. This was especially apparent in the group of key informants in the rural counties of Osage and Wagoner. These counties have minimal health care organizations and health care providers. This significantly reduced the population of key informants from which to select participants. Therefore the number of key informant interviews only totaled 17 participants overall. Studies show that using a mixed methods approach, triangulation, as an effort to research a certain phenomenon can provide complementary results. By applying multiple reference points to find an answer, the process can provide a greater, more accurate explanation (Jick, 1979). Upon using the quantitative data and the HSA in this report, findings guided the questions asked to both the key informants and focus groups. Strengths of the qualitative research has produced results that have shown a positive correlation between the two methods. Conclusion Qualitative research has many strengths that allow a researcher to solicit information from a participant about a phenomena. Using interviews and focus groups allowed the participants to provide their point of view and describe personal experiences on breast health care within their communities. This sort of qualitative approach has allowed the Affiliate to find understanding of local situations and conditions and to explore why certain phenomena may be occurring (Madrigal & McClain, 2012). As evidenced by the themes and subthemes during the data analysis process, overall health, breast health care, and access are complicated issues that are interrelated and multifaceted. As seen in the quantitative data section and the HSA, the counties of Tulsa, Rogers, Wagoner, and Osage contain breast health disparities in incidence, late-stage, and death rates, especially among the Black/African-American and AIAN populations. These results are thought to be due to barriers of care, including poverty, lack of transportation, lack of physicians and access to care. After analysis of the quantitative data and the HSA, questions were formed that addressed services, roles, processes/protocols, strengths/weaknesses, and recommendations. The answers given have allowed the Affiliate to discover the types of implementations needed, including the need for more accurate health information, access to health services, motivation to seek care, and an increase in health status within the target communities, in order to positively affect breast health care in the target communities and guide the Affiliate in next steps.

75 | P a g e Susan G. Komen® Tulsa
Breast Health and Breast Cancer Findings of the Target Communities As discussed in the Quantitative Data Section of this report, the Affiliate identified four target communities of focus: Tulsa, Osage, Rogers and Wagoner counties. The purpose in selecting these counties was due to the breast health disparities that lead to higher than average incidence, late-stage diagnosis, and death rates, especially among the Black/African-American and AIAN populations. Tulsa County was chosen for its death and late-stage rates and its large Black/African-American population. Osage County was targeted because of the physician shortage due to large rural areas and the rising rate of late-stage diagnoses. Additionally, Osage County has a large Black/African-American and AIAN population. Rogers County was included in the areas of focus because of its high death and late-stage incidence rates. Lastly, Wagoner County was chosen as a target population also because of its high late-stage and death rates. After analysis of the quantitative data, a HSA was conducted in order to provide a review of the available breast cancer resources and services throughout the Breast Cancer Continuum of Care (CoC) as it relates to each target community. The HSA revealed the need for the Affiliate to build upon existing partnerships and develop new relationships within the target counties. Tulsa County revealed it had strong programs in place to address each stage of the CoC, however, residents still struggle with access to care. The remaining three counties, Osage, Rogers, and Wagoner, showed to have limited resources with little to no access to all stages of the CoC. The Qualitative Data Section of this report allowed the Affiliate to see county specific barriers of care. Key informant and focus groups were conducted asking questions that addressed services, roles, processes/protocols, strengths/weaknesses, and recommendations. The findings revealed specific implementations needed to positively affect breast health care in the target communities and guide the Affiliate in next steps. Qualitative data findings included: Tulsa County Participants from Tulsa County expressed several barriers to breast health care. The most common were culture and language, lack of insurance, lack of education, fear, distrust, and financial resources with the greatest identified need being mobile mammography and more breast health education to help inform those who are underinsured or lack insurance. Motivators to seek care within Tulsa County included affordability, access to insurance, after hour clinics, and transportation. Osage County Barriers within Osage County that kept women from seeking breast health care included financial barriers, lack of time to seek out services, lack of insurance, and lack of education. Additionally, it was expressed that women in rural areas are at greater disadvantage due to transportation issues, the challenges of childcare and taking time away from work. Participants conveyed a helpful motivator would be an easier ability to make appointments by extending clinic hours and pre-scheduling. Rogers County Roger County participants stated the biggest barriers to care included lack of insurance, lack of time, ignorance and fear/anxiety. Many women need to leave the county to receive care due to lack of resources and expressed the need for a larger availability of free screenings within the
Mission Action Plan

76 | P a g e Susan G. Komen® Tulsa
county. The main motivators to seek breast health care for participants in Rogers County were the desire to see their children grow up, easy access, mobile services, and family history. Wagoner County Participants of Wagoner County stated that fear, transportation, lack of insurance, financial resources, distrust of physicians, and lack of time were prominent barriers to care. Wagoner County’s greatest needs included more education and more availability of services through the use of mobile mammography and other mobile services. A main motivator for participants to seek care included family history. As evidenced by the themes and subthemes during the data analysis process, overall health, breast health care and access are complicated issues that are interrelated and multifaceted. These findings have driven the Affiliate’s newest Mission Action Plan.
Mission Action Plan Based off of the data collected and the analysis of that data, the findings led the Affiliate to create a mission action plan for the four target communities in order to guide in next steps. The following includes county specific mission action plans.
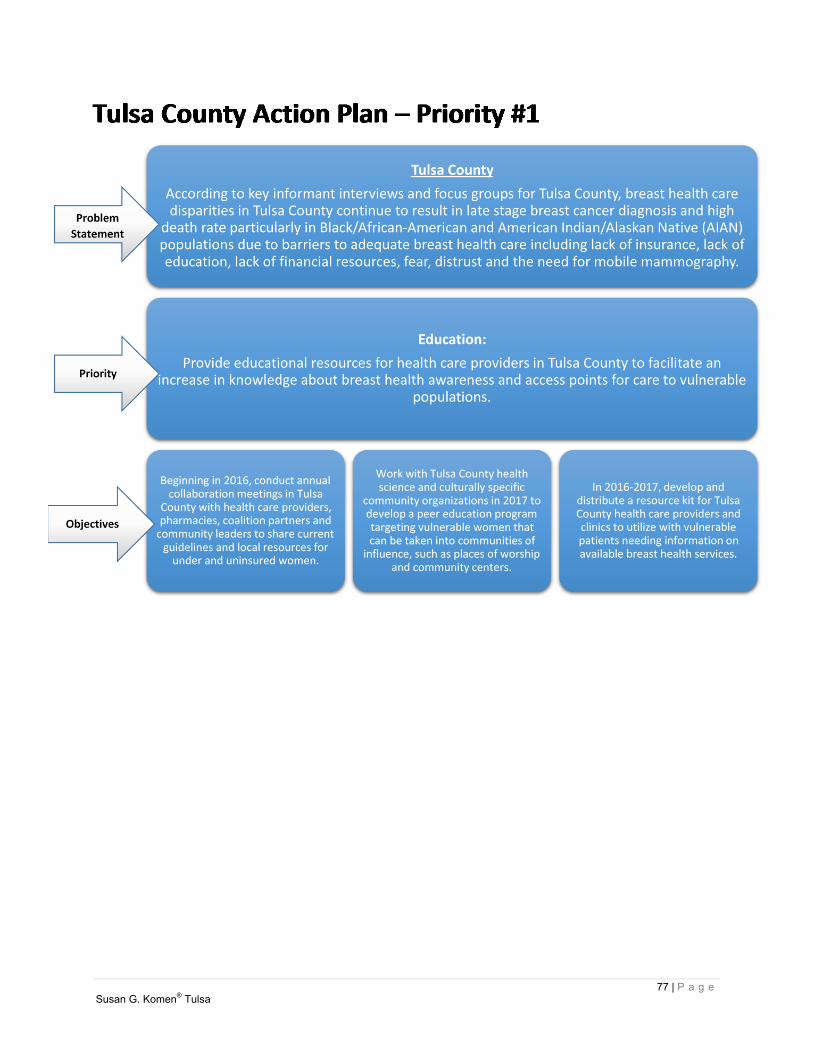
77 | P a g e Susan G. Komen® Tulsa
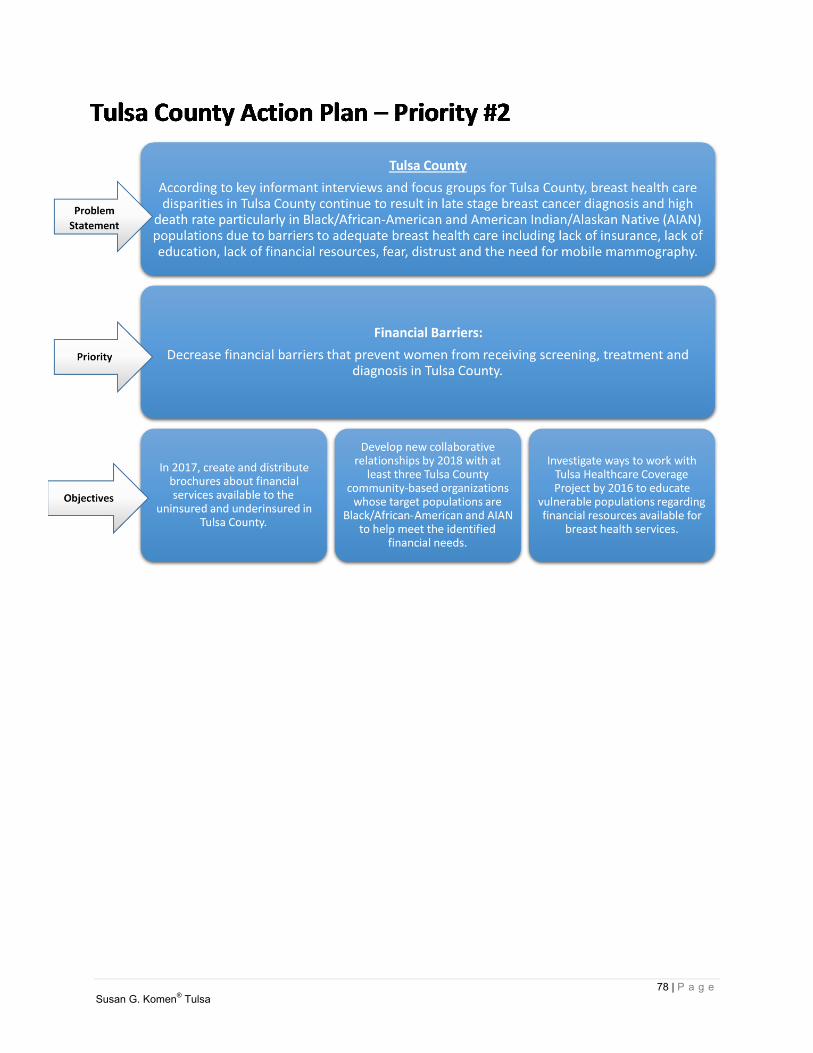
78 | P a g e Susan G. Komen® Tulsa

79 | P a g e Susan G. Komen® Tulsa
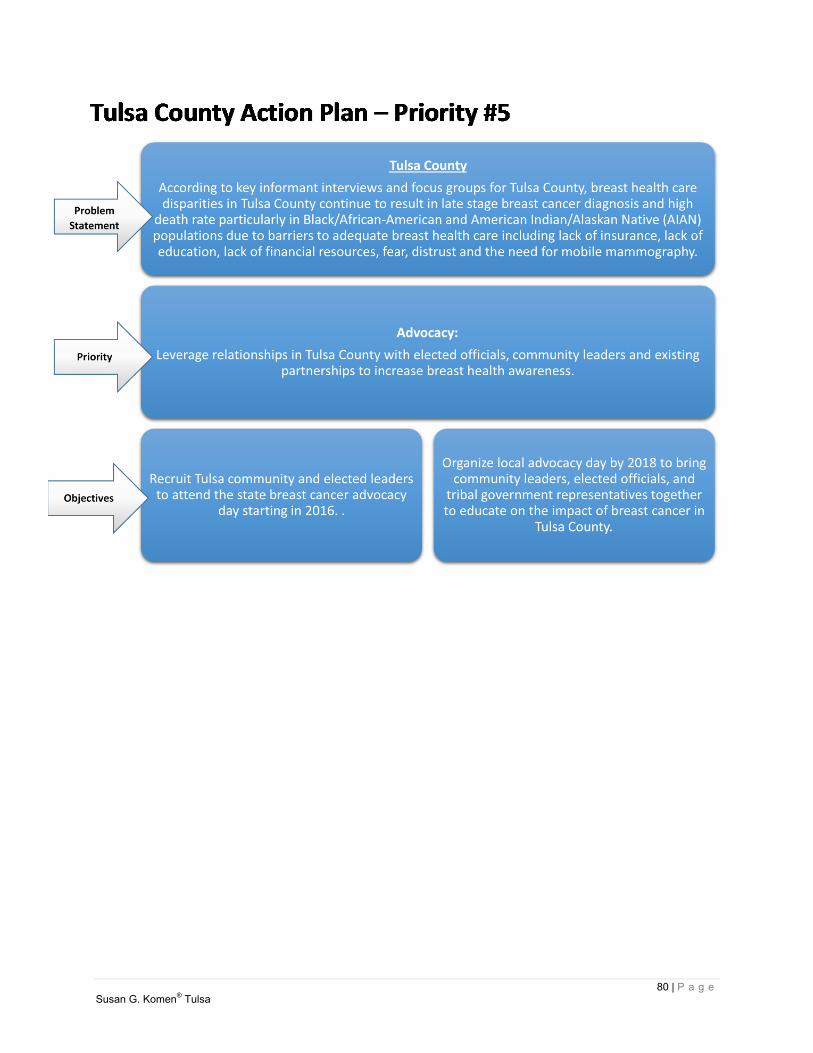
80 | P a g e Susan G. Komen® Tulsa
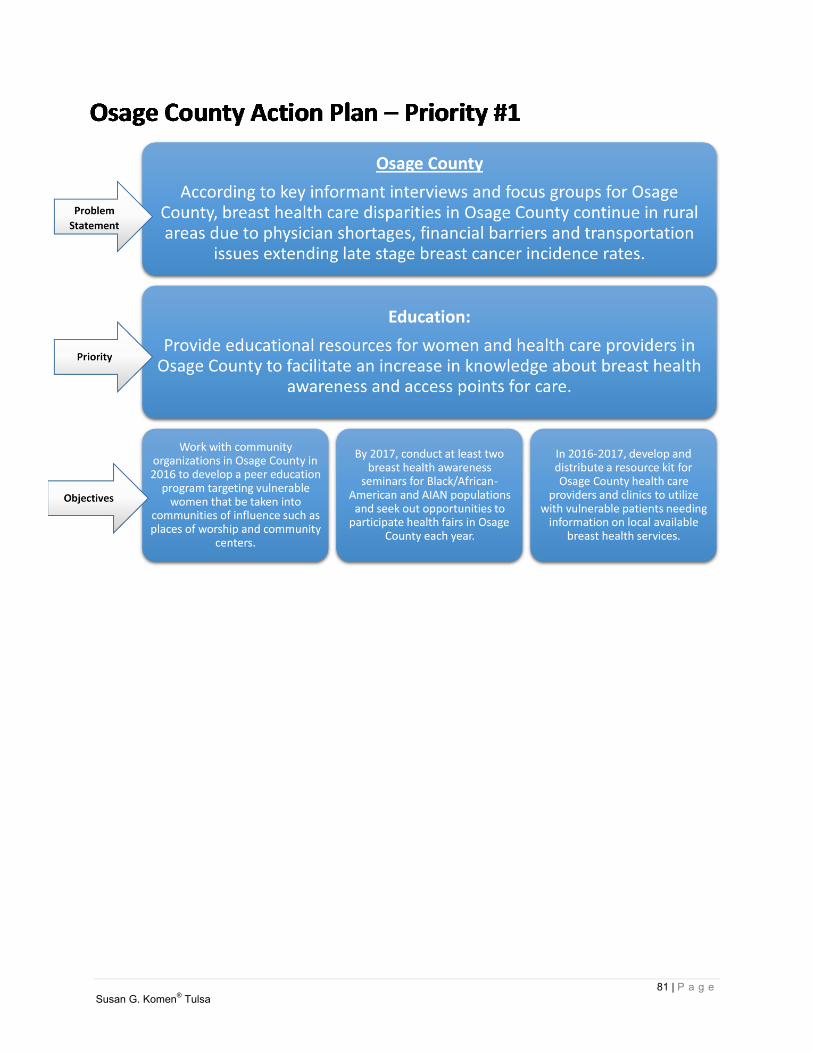
81 | P a g e Susan G. Komen® Tulsa

82 | P a g e Susan G. Komen® Tulsa
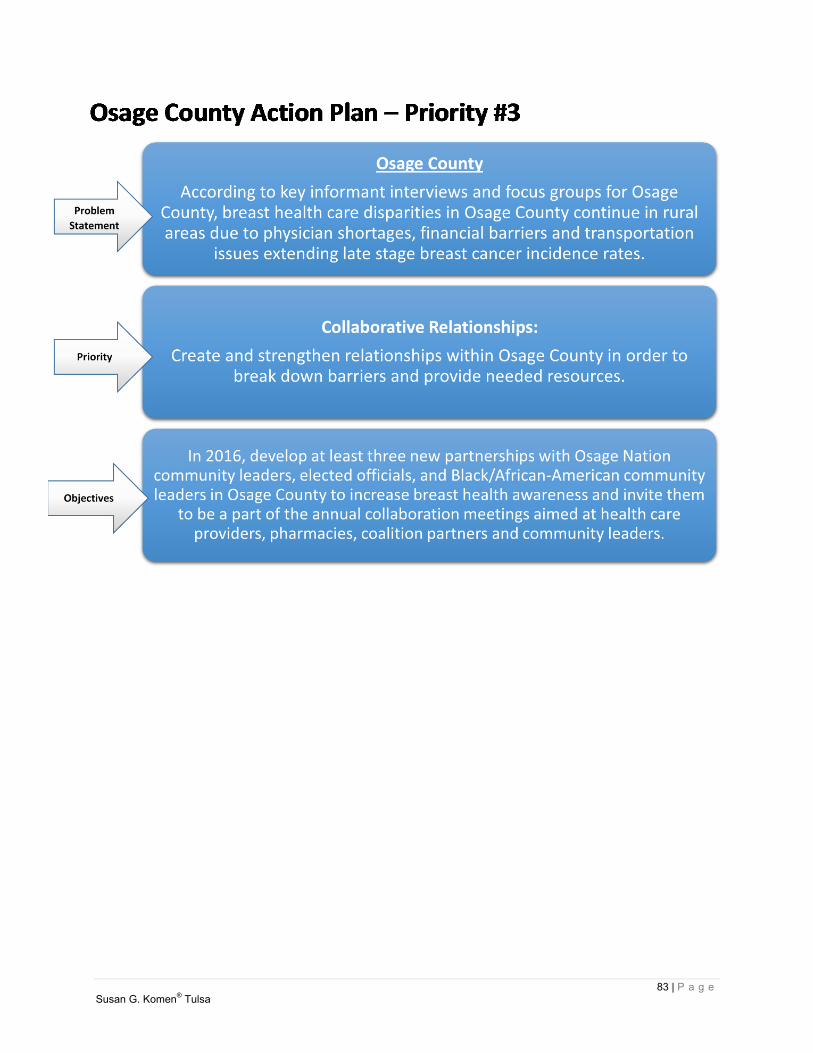
83 | P a g e Susan G. Komen® Tulsa

84 | P a g e Susan G. Komen® Tulsa
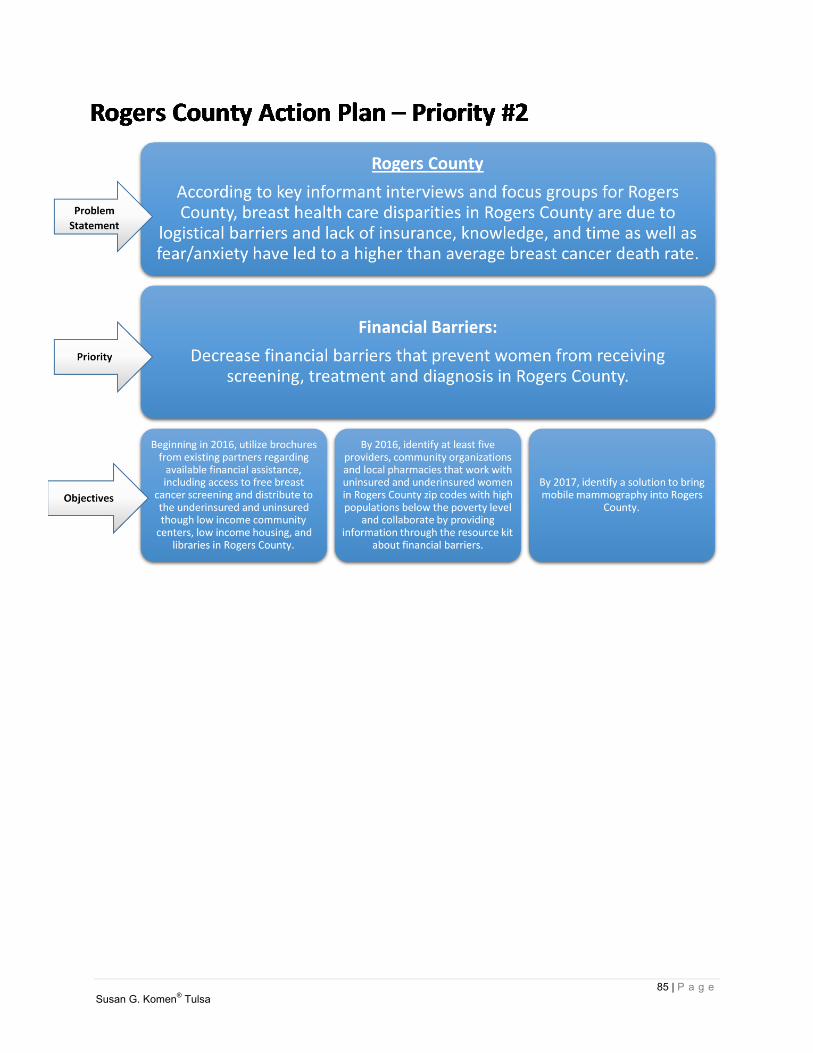
85 | P a g e Susan G. Komen® Tulsa

86 | P a g e Susan G. Komen® Tulsa

87 | P a g e Susan G. Komen® Tulsa
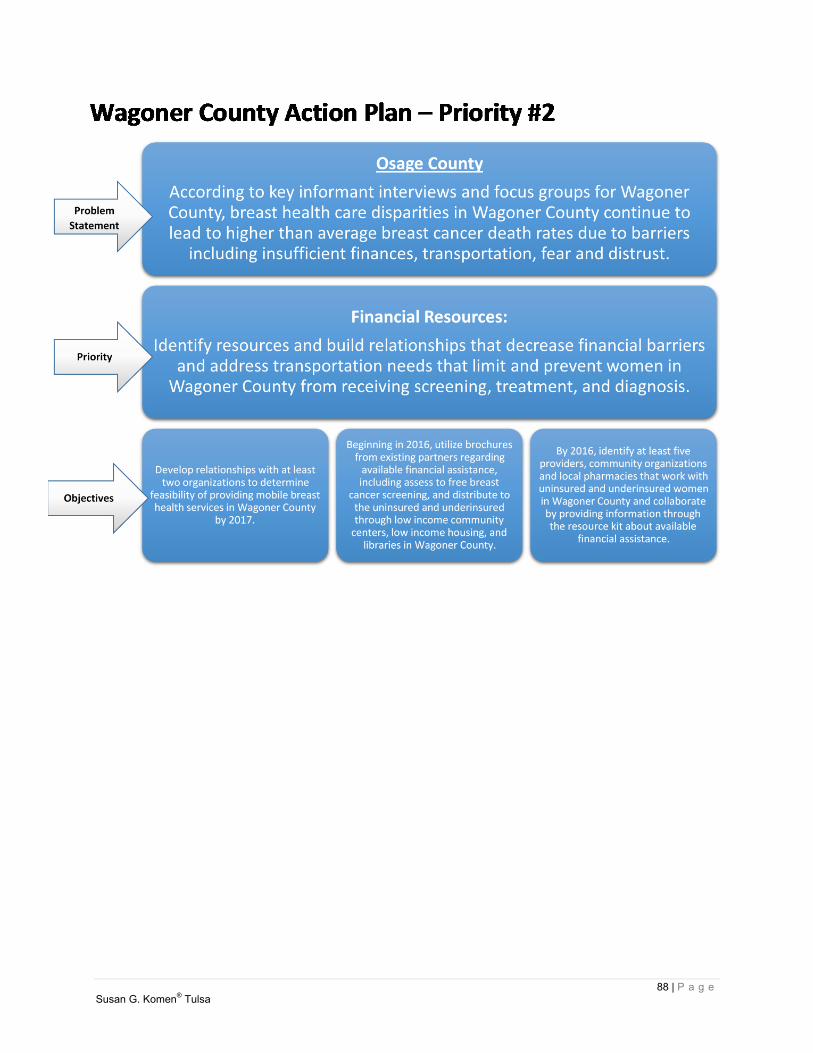
88 | P a g e Susan G. Komen® Tulsa

89 | P a g e Susan G. Komen® Tulsa
Adcock, Clifton (2013). The doctor is not in. Oklahoma Watch. Retrieved on http://oklahomawatch.org/2013/08/31/the-doctor-is-not-in/
Bizer, C., Heath, T., & Berners-Lee, T. (2009). Linked data-the story so far. Centers for Medicare and Medicaid Services (2014). Your Medicare coverage: Mammograms.
Department of Health and Human Services. Retrieved from http://www.medicare.gov/coverage/mammograms.html
Creswell, J. (2009). Research design qualitative, quantitative, and mixed methods Approaches, 3rd ed. Sage: California. Desantis et al.; 2011 Breast Cancer Statistics, 2011. 2011 American Cancer Society. Vol.6.
no.6. Nov/Dec.2011 Pg. 409-418. Glicken, M. (2003). Social research a simple guide. Pearson Education, Inc.: Boston. Grulon, L., David, C., Diehl, C. & McDonald, D. (2013). Triangulation: establishing validity of
qualitative studies. University of Florida: 2013. Gulliford, M., Figueroa-Munoz, J., Morgan, M., Hughes, D., Gibson, B., Beech, R., & Hudson, M.
(2002). What does' access to health care mean?. Journal of health services research & policy, 7(3), 186-188.
HP 2020. Healthy People 2020. US Department of Health and Human Services. December 2,
2010. Available online at http://www.healthypeople.gov/2020/about/ (accessed 8/2/2013).
Insure Oklahoma (2013). Fast facts. Retrieved from
http://www.insureoklahoma.org/IOaboutus.aspx?id=4096 Jick, T. D. (1979). Mixing qualitative and quantitative methods: Triangulation in action.
Administrative science quarterly, 602-611. Jim et al; 2014. Racial Misclassification of American Indians and Alaska Natives by Indian
Health Service Contract Health Service Delivery Area. American Journal of Public Health. Pg. 1-8
Kaiser Family Foundation (2014). The coverage gap: uninsured poor adults in states that do not
expand Medicaid. Retrieved from http://kff.org/health-reform/issue-brief/the-coverage-gap-uninsured-poor-adults-in-states-that-do-not-expand-medicaid/
Koerber, A. and McMichael, L. (2008) “Qualitative Sampling Methods A Primer for Technical
Communicators” Journal of Business and Technical Communication, Vol 22 No. 4, October 2008, 454-473.
Madrigal & McClain (2012). Strengths and weaknesses of quantitative and qualitative research.
Retrieved on http://www.uxmatters.com/mt/archives/2012/09/strengths-and-weaknesses-of-quantitative-and-qualitative-research.php#sthash.FmlvXXzB.dpuf
References
90 | P a g e Susan G. Komen® Tulsa
McMillian & Schumacher (2001). Research in Education: A Conceptual Introduction. Longman: 2001. Merriam, S. (1998). Qualitative research and case study applications in education. Josey Bass:1988. O’Brien, Bayouni, Davis, Young & Strike. (2009). “Putting episodic disability into context: A
qualitative study exploring factors that influence disability experienced by adu7lts living with HIV/AIDS” Journal of the International AIDS Society 2009, 12:30
Office of the Secretary. (1979). The national commission for the protection of human subjects of
biomedical and behavioral research (45 CFR 46). Washington, DC: US Government Printing Office.
Oklahoma State Department of Health (2014). 2009-2010 physicians survey. Office of Primary
Care and Rural Health Community Development Service. Retrieved from http://www.ok.gov/health/Organization/Center_for_Health_Innovation_and_Effectiveness/Data_&_Reports_/index.html
Oklahoma State Department of Health (2013). Chronic disease in Oklahoma data book. State of Oklahoma, Oklahoma City. Oklahoma State Department of Health (2013) NAVTEQ 2012 chronic disease in Oklahoma data
book. Health Resources and Service Administration Data Warehouse. Retrieved from http://www.ok.gov/health2/documents/CDS-Chronic%20data%20book%20AUG2013.pdf
Oklahoma State Department of Health (2012). Oklahoma breast and cervical cancer prevention
and treatment advisory committee annual report, fy2012. Retrieved from http://www.ok.gov/health2/documents/AR%20Final.pdf
Oklahoma State Department of Health (2014). Oklahoma cares program. Retrieved from
http://www.ok.gov/health/Disease,_Prevention,_Preparedness/Chronic_Disease_Service/Cancer_Prevention_Programs_/Oklahoma_Breast_and_Cervical_Cancer_Treatment_Program.html
Oklahoma Health State Department (2014). State of the state’s health. Oklahoma: State of Oklahoma. Pruthi, S (2013). With differing mammogram guidelines, i’m not sure when to begin
mammogram screening. What does Mayo Clinic recommend? Mayo Clinic. Retrieved from http://www.mayoclinic.org/tests-procedures/mammogram/expert-answers/mammogram-guidelines/faq-20057759
Rajasekar, S, Philominathan, P. & Chinnathambi, V. (2013). Research methodology. Simon Foundation: New York City. Ritchie, J., Lewis, J., Nicholls, C. M., & Ormston, R. (Eds.). (2013). Qualitative research
practice: A guide for social science students and researchers. Sage.
91 | P a g e Susan G. Komen® Tulsa
Schootman, M., Homan, S., Weaver, K. E., Jeffe, D. B., & Yun, S. (2013). Peer Reviewed: The Health and Welfare of Rural and Urban Cancer Survivors in Missouri. Preventing chronic disease, 10.
SEER Summary Stage. Young, J.L. Jr., Roffers, S.D., Ries, L.A.G., Fritz, A.G., Hurlbut, A.A.
(eds). SEER Summary Staging Manual - 2000: Codes and Coding Instructions, National Cancer Institute, NIH Pub. No. 01-4969, Bethesda, MD, 2001. Available online at http://seer.cancer.gov/tools/ssm/ (accessed 8/2/2013).
Singer, E., & Bossarte, R. M. (2006). Incentives for survey participation: When are they
“coercive”?. American Journal of Preventive Medicine, 31(5), 411-418. Susan G. Komen Foundation (n.d.). Key informant interview process. Qualitative data toolkit.
Komen: Dallas. Taylor, C. and Gibbs, G. (2010). “What is qualitative data analysis (QDA)?” Online QDA
Website. Retrieved from http://onlineqda.hud.ac.uk/Intro_QDA/what_is_qda.php The Lewis Group (2006). Strategic Planning for Safety-Net Services Final Report.
https://www.ou.edu/content/dam/Tulsa/wtshc/doc/Lewin.pdf , 5/20/14 Trochim, W. (2006). Research methods knowledge base. Social researchmethods. Retrieved
from http://www.socialresearchmethods.net/kb/index.php Welsh, E. (2002, May). Dealing with data: Using NVivo in the qualitative data analysis process.
In Forum Qualitative Sozialforschung/Forum: Qualitative Social Research (Vol. 3, No. 2).