susceptibility of distribution systems to negative ... of distribution systems to negative pressure...
TRANSCRIPT

Susceptibility of Distribution Systems to
Negative Pressure Transients
Presenters: Kala Fleming and Mark Le Chevallier
Moderator: Jian Zhang

Housekeeping
•Please mute your phone lines•Type in questions at any time•Press F5 to toggle full-screen view

Project info online: www.awwarf.org | Research | Project Center

Presenters
Kala Fleming is an environmental engineer in the
innovation and environmental stewardship group
at American Water.

Presenters
Mark Le Chevallier is director of innovation and
environmental excellence at American Water.

Susceptibility of Distribution Susceptibility of Distribution
Systems Low/Negative Systems Low/Negative
Pressure TransientsPressure Transients
Kala Fleming & Mark LeChevallier
AWWARF Webcast
January 17, 2007

7
Distribution System Challenges
� Increased water quality regulations, security
concerns, and cross-connection control while
managing an aging infrastructure
� Maintenance of pressure is a critical activity for
protection of quality and service delivery
� Spatial and temporal complexity requires collecting
and managing data from many points in the distribution system
� Cost-effective approaches, based on sound
decision-making processes that add value to the
customer, are required

8
Presentation Overview
� Transient Pressures:
– Steady state pressure vs. transient pressure
– Description of transient pressure origins
� Project #3008 Review:
– How susceptible are distribution systems to
low/negative transient pressures?
� Consequences & Control of Transient Pressures

9
Pump station 5-min Pressure Recording
0
10
20
30
40
50
6/22/2004 6/23/2004 6/24/2004 6/25/2004 6/26/2004 6/27/2004 6/28/2004
Time
Pre
ssu
re (
psi)
10
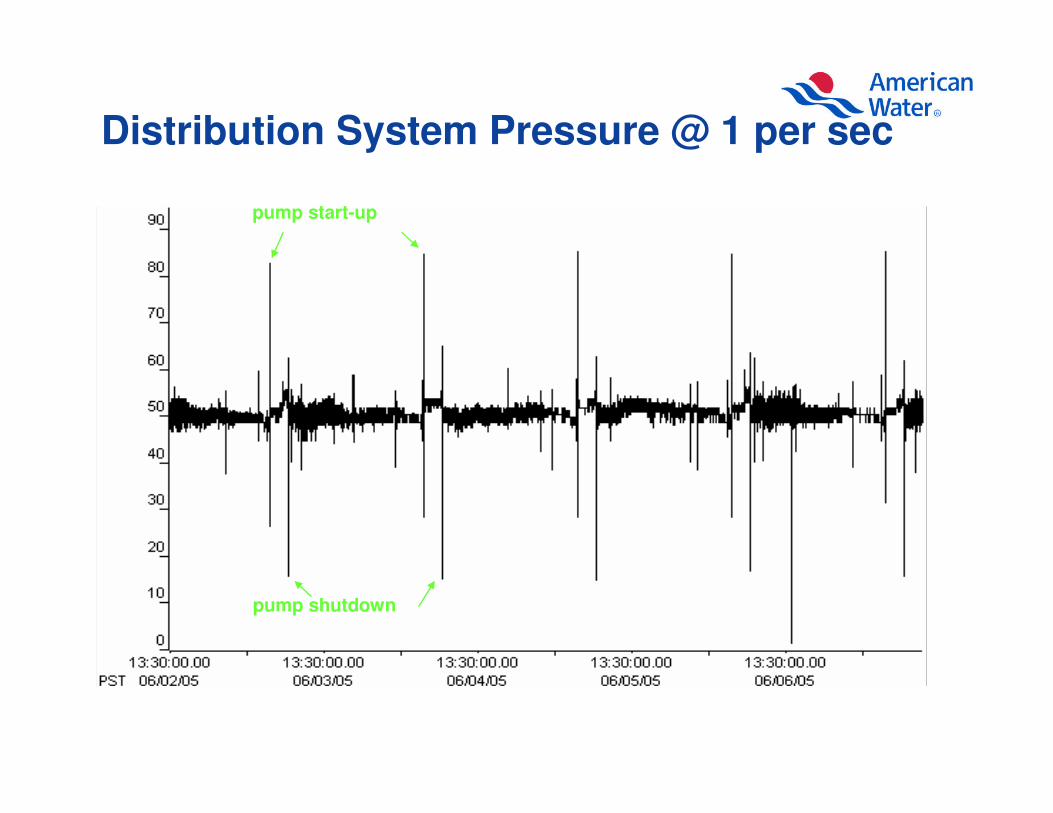
Distribution System Pressure @ 1 per sec
pump start-up
pump shutdown
11
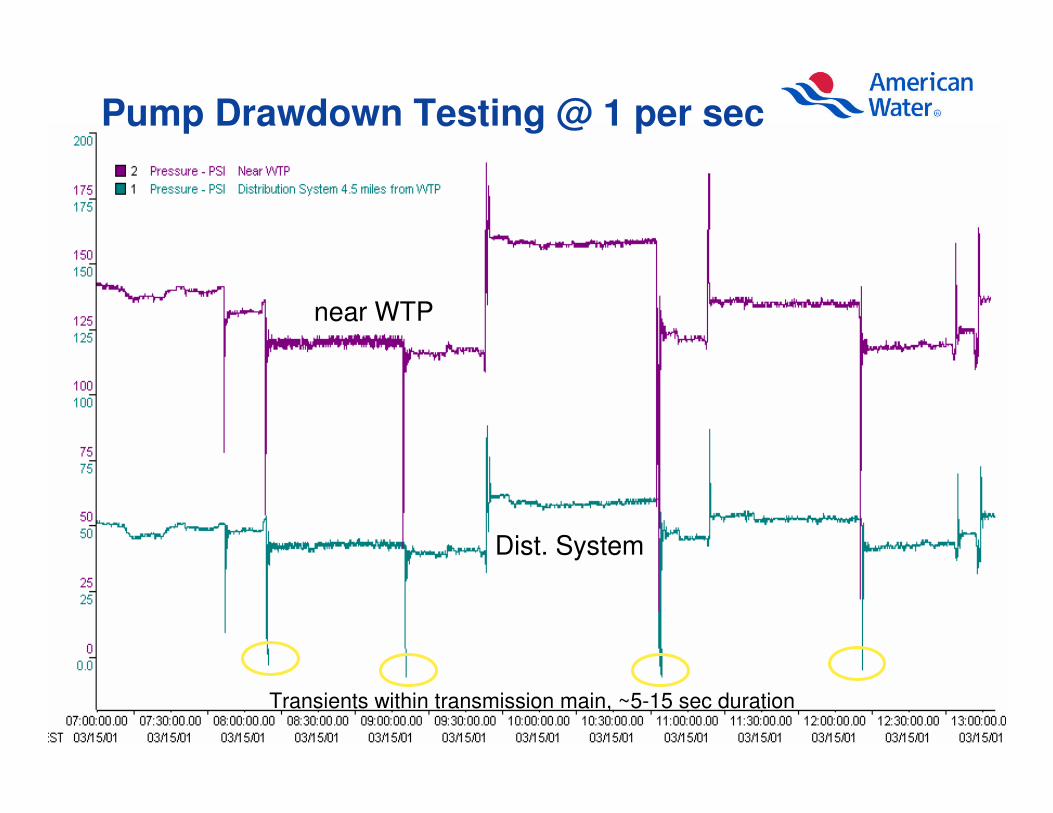
Transients within transmission main, ~5-15 sec duration
near WTP
Dist. System
Pump Drawdown Testing @ 1 per sec

12
Negative for > 16 sec;as low as –10.1 psi (-69 kPa)
Gullick et al. 2005. J. Water Supply & Technol. – AQUA 54(2): 65-81.
Pump Drawdown Testing @ 1 per sec

13
Transient Pressure From Sudden Flow Change
� Pressure wave travels through distribution system
� Can cause temporary low or negative pressure
� May last for several seconds
� Waves may be additive
Time
Pre
ss
ure

14
� Longitudinal pressure wave
initiated by change in water flow
velocity
� Note: a wave is a disturbance
that transmits energy and
momentum from one point to
another through a medium
without significant displacement
of matter between the two
points
∆H = (c / g) ∆V∆H = Joukowsky pressure head
c = wave propagation speed in pipe
g = acceleration due to gravity
∆V = change in velocity
Time
Pre
ssu
reTransient Pressure From Sudden Flow Change

15
Pressure Wave in Single Pipeline
HGL-steady state
Adapted from Thorley 2006. Fluid Transients in Pipelines .
9 sec after failure
DISTANCE (mile)
50 10
12 sec after failure
Reflection increases
pressure after ~ 14 sec
450 ft
HGL 7 sec after power failure
4.6 miles in 7 seconds
Wave front 7 sec after power failure
∆H
hL
232 ftminimum head envelope
during power failure
HGL-pumping
pump runs down in 7 seconds
Wave speed is 3,500 ft/s or ~0.66 mile/sec
g = 32.174 ft/s2 & V = 2 ft/s
∆∆∆∆H = (c / g) ∆∆∆∆V

16
Pressure Wave in Single Pipeline
TIME (seconds)
100
200
300
400
500
4020
600
60 800
pump run down in 7 seconds
additional headloss until reflected wave
approaches
PR
ES
SU
RE
HE
AD
(fe
et)

17
Negative for > 16 sec;as low as –10.1 psi (-69 kPa)
Gullick et al. 2005. J. Water Supply & Technol. – AQUA 54(2): 65-81.
Pump Drawdown Testing @ 1 per sec
In more complex systems, reflections occur with changes in
diameter, changes in pipe material and at dead ends or other
discontinuities

18
Need Models for Network of Pipes
negative pressure
pressure > 20 psi
Pressure KeyPressure Key
0 to 20 psi

19
Sudden change in demand – Flushing operations– Opening and closing a fire hydrant
Sources of Pressure Transients
Service interruptions
– Power failure
– Main breaks
Routine distribution system operation– Pump startup and shut down
– Feed tank draining
– Surge tank draining
– Valve operation: open/close
routineoperations
routineoperations
service interruptions
service interruptions
demandchange
demandchange
How susceptible are distribution
systems to transient low and
negative pressures ?
21
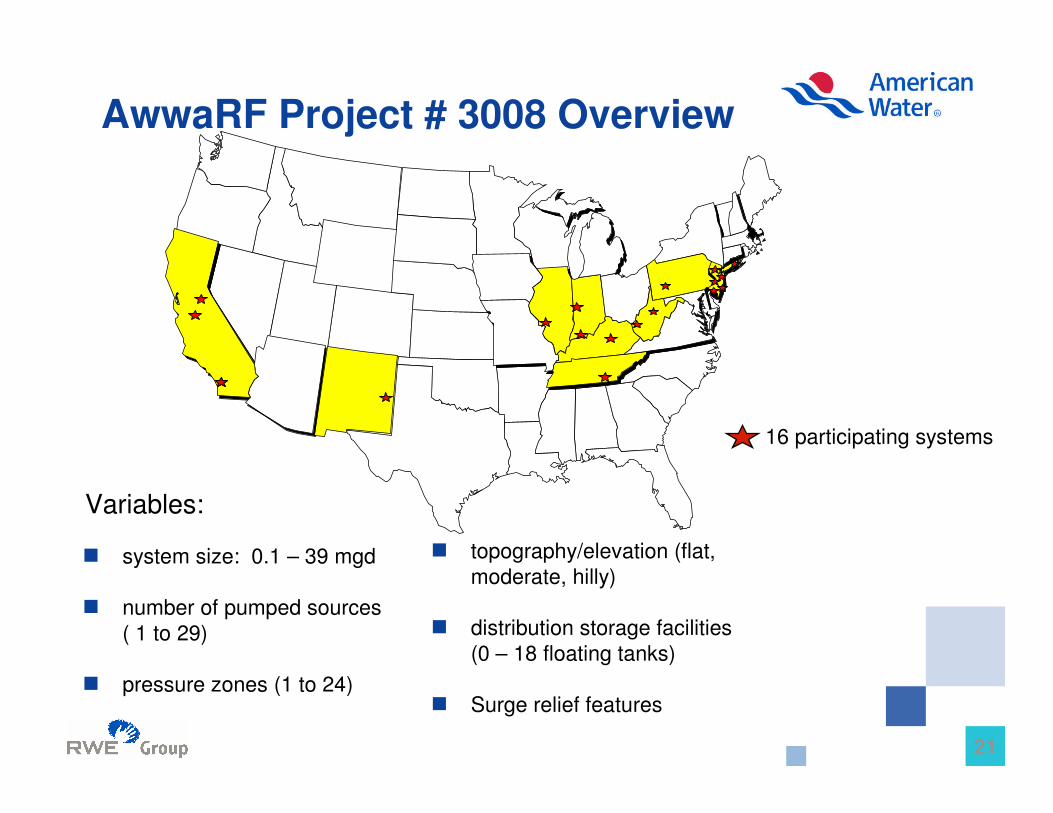
AwwaRF Project # 3008 Overview
16 participating systems
� system size: 0.1 – 39 mgd
� number of pumped sources
( 1 to 29)
� pressure zones (1 to 24)
� topography/elevation (flat,
moderate, hilly)
� distribution storage facilities
(0 – 18 floating tanks)
� Surge relief features
Variables:

22
Hydraulic Modeling in Project # 3008
Steady StateModel
Steady StateModel
EPSModel
EPSModel
Distribution
System
Maps
Distribution
System
Maps
SurgeModel
SurgeModel
33
Key step for all other modeling steps
Establishes physical system
Snapshot of only one time
Key step for all other modeling steps
Establishes physical system
Snapshot of only one time
Extended period simulations typically capture system operation over 24 hours
Extended period simulations typically capture system operation over 24 hours
Steady State ModelSteady State Model33
2211
EPS ModelEPS Model2211
Determines how sudden changes in flow impact system pressures
Determines how sudden changes in flow impact system pressures
Surge ModelSurge Model

23
Project # 3008 Significant Findings
� In the absence of surge mitigation at pump
stations, all distribution systems were
susceptible to low/negative pressure
fluctuations
� Susceptibilities ranged from 1% to 98%
– water velocity, number of floating storage facilities, number of source inputs and system configuration influence system vulnerability
– Velocities greater that 3 ft/s downstream of pump stations increase the risk of low/negative transient pressures

24
Storage Reduces Susceptibility
R2 = 0.9
0%
10%
20%
30%
40%
50%
60%
0 20 40 60 80 100 120
Miles of Main per Floating Storage
Perc
en
t N
od
es w
ith
Neg
ati
ve P
ressu
re
at time of max flow to storage
at time of max flow from storage

25
System SizeSystem Size
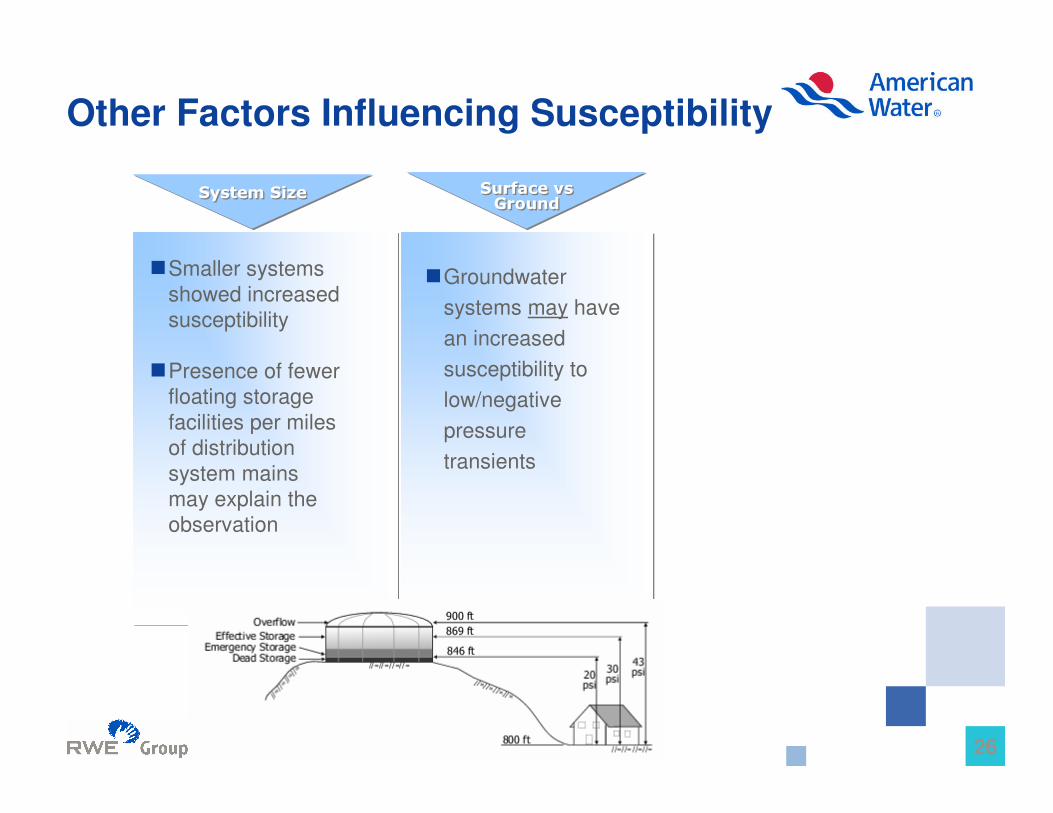
Other Factors Influencing Susceptibility
�Smaller systems
showed increased
susceptibility
�Presence of fewer
floating storage
facilities per miles
of distribution
system mains
may explain the
observation
�Hilly distribution
systems (> 150 ft
elevation difference)
showed less
susceptibility
�Locations at or near
dead ends were
more susceptible to
negative pressures
�Groundwater
systems may have
an increased
susceptibility to
low/negative
pressure
transients
0%
20%
40%
60%
80%
100%
Pe
rce
nt
No
de
s w
ith
Ne
ga
tiv
e P
res
su
re
5 10 15 20 25 30 35 40 45
Average System Delivery (MGD)
median value = 27%
26
System SizeSystem Size
Other Factors Influencing Susceptibility
�Smaller systems
showed increased
susceptibility
�Presence of fewer
floating storage
facilities per miles
of distribution
system mains
may explain the
observation
Surface vsGroundSurface vsGround
�Groundwater
systems may have
an increased
susceptibility to
low/negative
pressure
transients

27
Surface vs Ground Water Source
0%
20%
40%
60%
80%
100%P
erc
en
t N
od
es
wit
h N
eg
ati
ve
Pre
ss
ure
Ground Water Surface Water Both
median value = 27%
28
System SizeSystem Size
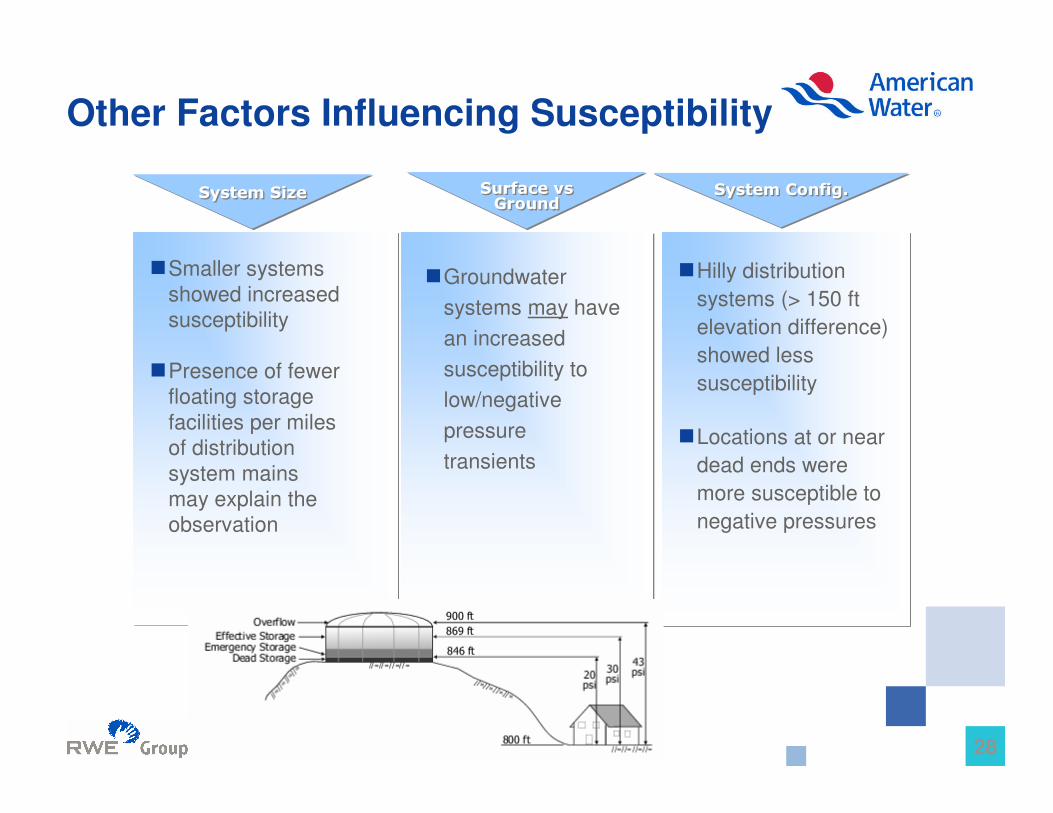
Other Factors Influencing Susceptibility
�Smaller systems
showed increased
susceptibility
�Presence of fewer
floating storage
facilities per miles
of distribution
system mains
may explain the
observation
Surface vsGroundSurface vsGround
System Config.System Config.
�Hilly distribution
systems (> 150 ft
elevation difference)
showed less
susceptibility
�Locations at or near
dead ends were
more susceptible to
negative pressures
�Groundwater
systems may have
an increased
susceptibility to
low/negative
pressure
transients

29
System Configuration
0%
20%
40%
60%
80%
100%P
erc
en
t N
od
es
wit
h N
eg
ati
ve
Pre
ss
ure
Flat Moderately Hilly Hilly
median value = 27%

30
Project # 3008 Significant Findings
� Modeling tools are available for utilities to
perform routine surge analyses
� Modeling can be used to identify susceptible
distribution system locations and identify
appropriate mitigation strategies
– In modeling simulations, relatively small
hydropneumatic tanks (1,000 gal or less) reduced
the magnitude of down surges in many systems

31
Hydropneumatic Tanks
air
water
pipeline under
steady-state
conditions
compressor
air
water
pipeline
experiencing
downsurge
compressor
water leaves tank to maintain pipeline pressure

32
Hydropneumatic tanks as a surge mitigation option
hydropneumatic
tanks installed on 4/5/05

Transient pressures can cause
backflow of contaminants into
the distribution system

34
Pathogen Intrusion
� Intrusion of outside water into the distribution system
may potentially occur during periods of low or
negative pressures if there is an opening in the pipe
(e.g., a hole or crack) and the external head > internal
head
� Studies (Karim et al. JAWWA 95(5): 134-146, 2003) have
shown that soil and non-potable water surrounding
distribution pipes can contain a variety of
microbiological pathogens, including fecal indicators
and culturable human viruses

35
Microbial Occurrence
0
20
40
60
80
100
% O
ccu
rren
ce
Total
Col
iform
Feca
l Col
iform
Clo
strid
ium
Bac
illus
Viru
s
RT-
PCR
Pha
ge
Water
Soil
Overall 63% (20/32) of samples were positive for viruses:
enteroviruses (Sabin strain), Norwalk, and Hepatitis A virus

36
Microbes Water
CFU or PFU/100 mlSoil
CFU or PFU/100 gm
Total coliform 2 - > 1.6 x 10³
20 - > 1.6 x 10⁴
Fecal coliform 2 - 5 x 10²
20 - > 1.6 x 10⁴
Clostridium 5 x 10² - 2.5 x 10
35 x 10
3 - 1 x 10
5
Bacillus 5 x 10² - 4.6 x 10
66 x 10
4 - 1.2 x 10
8
Phages 2.5 x 10² - 1 x 10
40
Karim et al. 2003. JAWWA 95(5): 134-146.
Microbe Concentrations
37
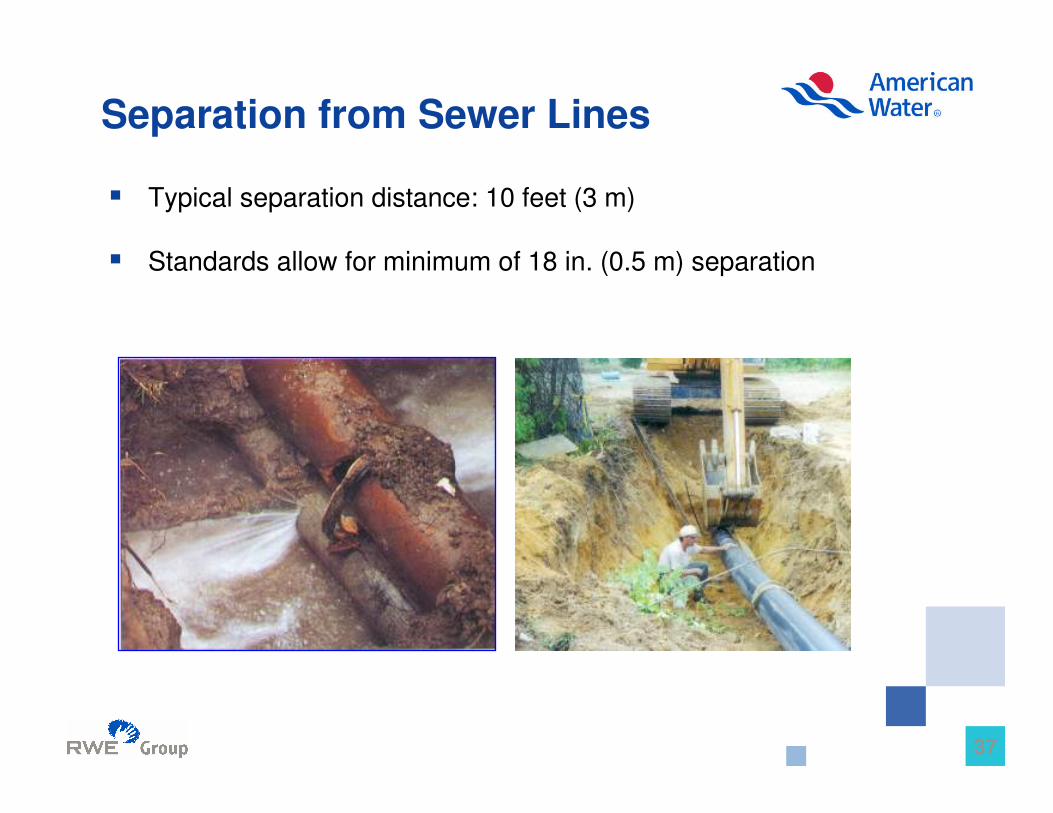
� Typical separation distance: 10 feet (3 m)
� Standards allow for minimum of 18 in. (0.5 m) separation
Separation from Sewer Lines

38
Leakage Facilitates Intrusion
2 4
< 10,000
10,000 – 50,000
Source: AWWA 2005 –Benchmarking Performance
Indicators for Water and
WasteWater Utilities
*121 Participants*
14 1612106 80
50,001 – 100,000
100,001 – 500,000
> 500,000
West
South
Midwest
Northeast
Distribution System Water Loss
(Median Range, 25th – 75th Percentile)
Distribution System Water Loss
(Median Range, 25th – 75th Percentile)
+
ddistribute volume
)authorizedbut unbilled volume billed (volume - ddistribute volume100
distribution water loss (%)
=
Percent

39
Intrusion Summary
222
leaking pipe
Transient low/negative
pressure
Pathogens near
but external to pipe
333
sewer mainsewer main
leaking pipe
leaking pipe
111

Several measures reduce
susceptibility to transient pressures
and transitory contamination
41
Be Cognizant of Risks
� Recognize that intrusion can occur
� Maintain effective disinfectant residual
throughout distribution system
� Identify regions of system where negative
pressures develop, and prioritize O&M
activities in these areas

42
Modeling & Monitoring are Important
� Determine effect of routine operations on system
pressures
� Use models to determine system vulnerability and
place monitoring devices
� Use models to determine most appropriate mitigation
measure
� slow valve closure times, air vessels, surge tanks,
pressure relief valves, surge anticipation valves,
air release valves, combination two-way air valves,
vacuum break valves, surge suppressors, and by-
pass lines with check valves

43
Conclusions
� Control of variations in pressure requires additional
attention by water utilities:
� Low pressures may cause backflow
� Pressure variations may impact infrastructure reliability
� Important research questions need to be addressed:
� What are the health risks posed by intruded water ?
� How effective are disinfectant residuals? Are chloraminated
systems more susceptible to transitory contamination?
� What is impact of sewer exfiltration on pathogen
occurrence?

44
Contact InformationKala K. Fleming, PhDEnvironmental EngineerAmerican Water1025 Laurel Oak RoadVoorhees, NJ 08043 USAphone: (856) 309-4556fax: (856) 782-3603e-mail: [email protected]
AcknowledgementsFunding for transient pressure research was provided by the utility subsidiaries of
American Water, as well as by the American Water Works Association Research
Foundation (AwwaRF) and the New Jersey Department of Environmental Protection.
Paul Boulos -- MWHSoft
Project Advisor -- Don Wood
AwwaRF PAC -- Peter Gaewski, Walter Grayman, Ken Rotert, Jeff Swertferger
Project Manager -- Jian Zhang
Mark LeChevallier, PhDDirector, Innovation and Environmental StewardshipAmerican Water1025 Laurel Oak RoadVoorhees, NJ 08043 USAphone: (856) 346-8261fax: (856) 782-3603e-mail: [email protected]