suspended particle property variations in gaoping submarine canyon ray t. hsu and james t. liu...
Post on 21-Dec-2015
214 views
TRANSCRIPT

Suspended particle property variations in Gaoping Submarine Canyon
Ray T. Hsu and James T. LiuInstitute of Marine Geology and Chemistry, National Sun Yat-sen University, Kaohsiung, Taiwan, R.O.C.
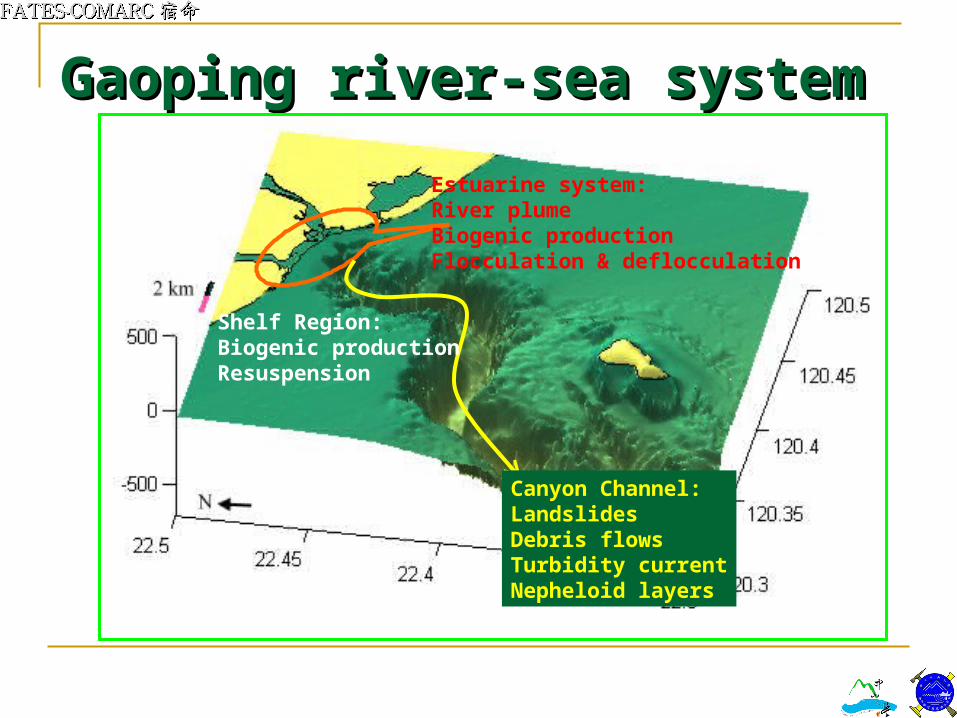
Gaoping river-sea systemGaoping river-sea system
Estuarine system:River plumeBiogenic productionFlocculation & deflocculation
Canyon Channel:LandslidesDebris flowsTurbidity currentNepheloid layers
Shelf Region:Biogenic productionResuspension

Particle settlingParticle settling
Internal tide
Shelf margin
C. Benthic nepheloid layerC. Benthic nepheloid layer
A. Hypopycnal plumeA. Hypopycnal plumeB. Hyperpycnal plum
e
B. Hyperpycnal plume

Diversities of suspended particles in Diversities of suspended particles in coastal watercoastal waterDiversities of suspended particles in Diversities of suspended particles in coastal watercoastal water> 500 μm
> 63 μm
> 250 μm
> 10 μm
Optical microscopyOptical microscopyOptical microscopyOptical microscopy

Study areaStudy area
Gaoping RiverGaoping River
8/27-28/2006
Gaoping Gaoping Submarine Submarine CanyonCanyon
Taiwan StraitTaiwan Strait
6/18/2004

Investigation schemeInvestigation schemeDate 6/18/2004 8/27-28/2006
Water Sampling
Sampling Periods 8 Hours 24 Hours
Sampling intervals 1 Hour About 3 hours
Sampling volume
10 L at 6 different depths
60 L (at 20 m and 15 m above bed)
Number of profiling 16 8
CTD and LISST-100 profiling
Sampling intervals 1 Hour About 1 hour
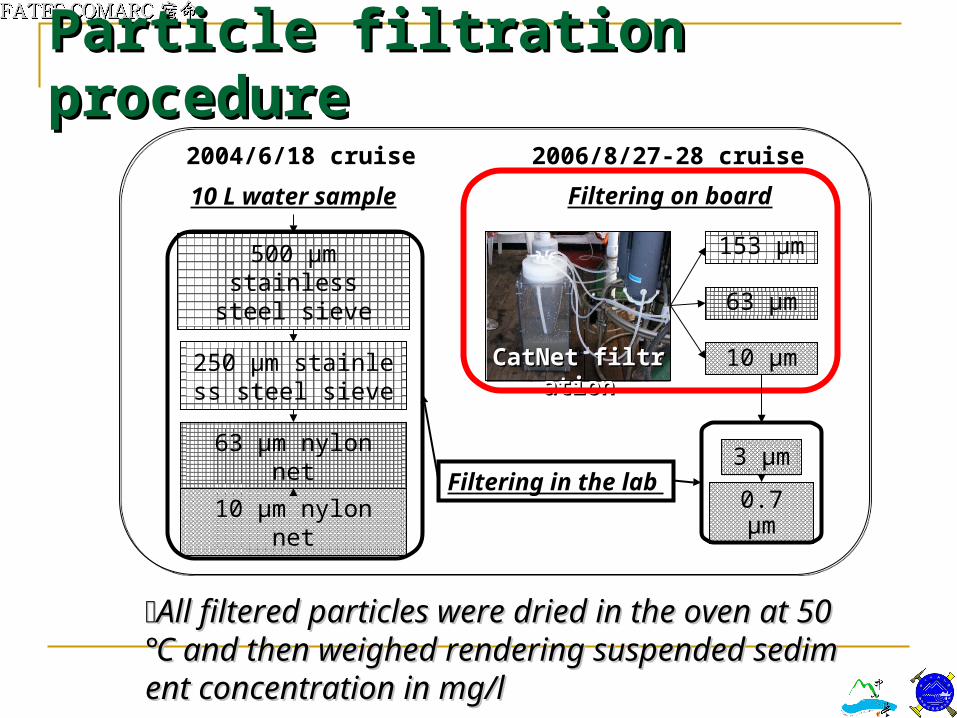
500 µm stainless steel sieve
250 µm stainless steel sieve
63 µm nylon net
10 µm nylon net
10 L water sample
3 µm
0.7 µm
2004/6/18 cruise 2006/8/27-28 cruise
All filtered particles were dried in the oven at 50 All filtered particles were dried in the oven at 50 ℃℃ a and then weighed rendering suspended sediment concennd then weighed rendering suspended sediment concentration in mg/ltration in mg/l
CatNet filtrationCatNet filtration
Filtering in the lab
Filtering on board
153 µm
10 µm
63 µm
Particle filtration Particle filtration procedureprocedure

Results:Results:
Mean diameter profile Floc porosity profile Floc density profile
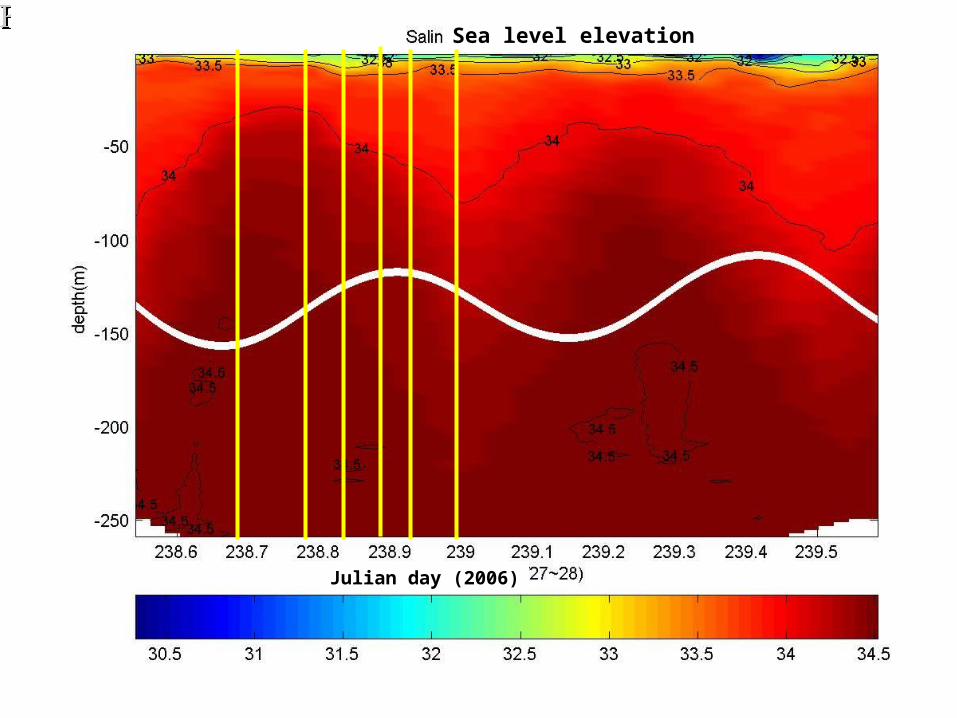
Sea level elevation
Julian day (2006)

Sea level elevation
Julian day (2006)

Floc modelFloc model
( Krone, 1986. From W. Van Leussen, 1989. Estuarine macroflocs and their roles in fine-grained sediment transport. )
quartz) (as g/cm 2.65=density paritcleprimary asume :
eunit volum :
processweight -dry-fillteringby
determinedion concentratsediment suspended :
LISSTby measuredion concentrat volume:
/*
*
3p
i
pip
if
V
SSC
VC
VSSCV
VVCV
Volume of interstitial water( VIS):
VIS V f Vp
VC Vi SSC Vi /p
Avoid in floc (VIS)
Floc volume (Vf)

Formula for floc porosity (Formula for floc porosity () ) estimationestimation
VIS V f
V f Vp V f
VC Vi SSC Vi /p
VC Vi
1 1p
SSCVC
quartz) (as g/cm 2.65=density paritcleprimary asume :
eunit volum :
processweight -dry-fillteringby
determinedion concentratsediment suspended :
LISSTby measuredion concentrat volume:
/* *
3p
i
pipif
V
SSC
VC
VSSCVVVCV
Bulk volume of floc (Vf)
Interstial volume in floc (VIS)

Compare floc porosity data in Compare floc porosity data in two cruisestwo cruises
Percentage of negative porosity values
Year of data collected
2004 2006
Grain size
0.45-10 µm 56 % 0 %
10-63 µm 32 % 0 %
63-250 µm 6 % 0 %
Summary of all grain sizes
35 % 0 %

Averaged floc porosity profileAveraged floc porosity profile
< 10 µm
10-63 µm
> 63 µm
Average floc porosityAverage floc porosity• 0.4-10 µm:
46.96 %• 10-63 µm:
63.95 %• 63-250 µm:
85.87 %

Floc density estimation
Deduced density formula
Two assumptions: 1. The primary particle density (p) was 2.65 g/cm3
2. The pore water in flocs was sea water (w=1.025 g/cm3)
f M p Msw
V f
M p
V f
Vswsw
V f
SSCVi
VC Vi
VC SSC p Visw
VCVi
SSC
VC
VC SSC p sw
VC
SSC
VC sw
sw
p
SSC
VC
sw 1
sw
p
SSC
VC

Average bulk density Average bulk density profileprofile
< 10 µm
10-63 µm
> 63 µm
Average Bulk density• 0.4-10 µm:
1.89 g/cm3
• 10-63 µm:
1.61 g/cm3
• 63-250 µm:
1.25 g/cm3

Bulk floc densityBulk floc density 0.4-10 µm: 1.89 g/cm3
10-63 µm: 1.61 g/cm3
63-250 µm: 1.25 g/cm3
Properties of suspended aggregates (Krone, 1978)Density in salt water 1.025 g/cm3
1.2051.1061.0781.065
Gulfport Channel
1.2691.1791.1371.1131.0981.087 1.079
San Francisco Bay
1.2121.1091.0791.065
White River
(in salt water)
1.1641.0901.0671.056
1.2501.1321.0931.074
01 23456
Brunswick Harbor
Wilmington District
Order of Aggregation

SummarySummary Particles in river plume can be identified from its gr
ain size distribution. The results from the 2004 data were not as good as
those from 2006 due to the difference of on-board filtration which reduces the chance of breakage of fragile flocs storage and transport.
The average calculated floc densities of 0.4-10, 10-63, 63-250 µm were 1.89, 1.61, 1.25 g/cm3, respectively. And the floc porosities were 46.96, 63.95, 85.87 %, respectively.
This approach is different from the traditional floc density estimation derived from settling velocity according to Stokes law.