sustainability assessment of the university of oregon...early stages: christine thompson, chris...
TRANSCRIPT

Phone: (541) 341-GOOD (4663)Fax: (541) 341-6412www.goodcompany.cc sustainable: community | economy | environment
Sustainability Assessmentof the University of Oregon
based on Good Company’s Sustainable Pathways Toolkit
Final Report
Report prepared by:
Good Company435 Lincoln StreetEugene, OR 97401
May 15, 2002
2Final Report
Good Company © 2002
Contents
I. INTRODUCTION 3Benchmarking 4Accuracy 4Acknowledgements 4
II. CAMPUS SUSTAINABILITY PERFORMANCE: OUR METHODOLOGY 5Defining Sustainability 5The Selection of Indicators 5Vision and Priorities 6
III. OVERVIEW OF FINDINGS 7General Observations 7General Strengths 7Areas for Improvement 8A note on priorities 9A call for collaboration 9Areas for Improvement (detailed descriptions) 11
IV. SUSTAINABLE PATHWAYS TOOLKIT ASSESSMENT RESULTS 15Road map to reading the indicator results 15Core Indicators 16Supplementary Indicators 34

3Final Report
Good Company © 2002
I. Introduction
Universities and colleges have broad missions and activities, as well as broad impacts andresponsibilities. Every institution faces the challenge of meeting its core mission while participatingresponsibly in its community and in society as a whole.
We see this challenge as an opportunity for leadership. The University of Oregon has seized thisopportunity in many ways. This report – an evaluation based on Good Company’s SustainablePathways Toolkit – is a product of the University’s commitment to sustainability.
This report is a snapshot of the University’s progress toward sustainability. The findings showcaseareas of both exemplary performance and potential improvement. The next section, Overview ofFindings, provides concrete recommendations for how the University can reinforce its strengths andprogress, and shore up key shortcomings.
Some shortcomings demand action. Others, however, reflect the constraints of our time:sustainability is a systemic problem that no single individual or institution can achieve alone withoutprogress by the society as a whole. Indeed, we do not yet know what a “sustainable society” will haveto look like. Nonetheless, individuals and institutions that understand the urgency – such as theUniversity of Oregon’s leadership, and many individuals in the campus community – must take thefirst steps.
In creating and disseminating the Sustainable Pathways Toolkit, Good Company provides a broad andintegrated set of benchmarks for the social and environmental impacts of campuses. Our assessment(and its product, this report) gives structure and direction to the widespread movement to assess theimpacts that campuses have on communities and the world. The Toolkit does not probe everypossible variable; instead, it provides a solid, well-researched starting point for a comprehensiveassessment that is streamlined and meaningful. Its target audience is the campus community in itsentirety: administrators, staff, faculty, and students.
As this report rolls off the press, the University’s faculty, staff, and administration are facing urgentchallenges: the University’s enrollment is at record highs, and budget cuts loom as the state dealswith on-going fiscal challenges. But there are always urgent challenges at our doorstep. The on-going challenge is to build a vision for the long run – a vision that addresses important concernsbefore they become urgent.
Please join us as we assemble that vision and work toward a sustainable world.
Joshua Skov April 30, 2002Research and DevelopmentGood Company435 Lincoln St.Eugene, OR 97401(541) [email protected]

4Final Report
Good Company © 2002
Benchmarking
A central goal of the Toolkit-based assessment is benchmarking. However, the University of Oregon isour first client. The University has gone where no institution has gone before, so there is no one elsethere. Thus, the current report is missing the benchmarking elements. As our pilot study continuesand we amass comparison data, we will provide benchmarking reports to the University of Oregon.
We also aim to include the University of Oregon in future waves of our assessment; it is ourexpectation and goal that our evaluation will become a regular benchmarking exercise for manyuniversities and colleges. This regular participation will provide valuable comparison data for allinstitutions.
Our goal is do annual or semi-annual assessments at participating institutions. We expect that earlyfeedback from our pilot study will inform the structure of the assessment and timeframe of repeatwork.
Accuracy
We gathered the information contained herein from numerous individuals (thanked below) over thecourse of several weeks. We take responsibility for all errors in understanding the data provided to us,and all errors in transcription or calculation. We do not, however, certify the authenticity of the dataprovided to us in its raw form. This assessment was voluntary on the part of the University of Oregon,so any false or inaccurate information, provided to us deliberately or in error, simply compromises theusefulness of the report. We ask all readers to contact us with corrections or perspectives.
Acknowledgements
Good Company would like to extend its gratitude to Dan Williams; his office funded this report, and heprovided valuable guidance at early stages of the development of the Toolkit. We also thank theBusiness Alliances division of the Oregon University System for providing seed funding for ourresearch. We are especially grateful to individuals who offered perspectives, input, and/or support atearly stages: Christine Thompson, Chris Ramey, Dave Frohnmayer, Karyn Kaplan, Anne Leavitt, BillKasper, Amy Lake, and Kay Coots.
Last, we offer thanks to the many individuals at the University who cooperated with us as weconducted our assessment, and/or who offered feedback on the final draft of the report: Bob Beals,Kris Ansell-Bell, Andrew Bonamici, Mary Bradley, Mike Eyster, Sharon Fox, JR Gaddis, Alan Gidley,Michelle Gillette, Nick Glazener, Randy Hale, Carol Jones, Linda King, Tim King, Kurt Krueger, TomLarson, Sara Leininger, Harriet Merrick, Deanna Miller, Dusty Miller, Rick Millhollin, Rhonda Morgan, JayNamyet, Joan Nelson, Allan Price, Kelly Rasmussen, Josh Ruddick, George Scott, Alan Smith, IreneSmith, Rand Stam, Vicki Strand, Fred Tepfer, Lou Vijayaker, Bill Weiner, Maryanne Wherity, NickWilliams, and Nancy Wright. Our apologies to anyone we have unintentionally left off this list.

5Final Report
Good Company © 2002
II. Campus Sustainability Performance: Our Methodology
What does it mean to be sustainable? There is no definitive answer, but we begin this report byexplaining how we measure campus progress in the direction of sustainability. In just two pages, thissection briefly provides:
Ø A broad working definition of sustainabilityØ A description of how Good Company selects its indicatorsØ A note regarding our focus on vision and priorities
Defining Sustainability
Sustainability is a broad and complex concept with countless definitions. A good starting point is themost acclaimed definition, from the Brundtland Report of 1987, also known as Our Common Future:
“Sustainable development is that which meets all the needs of the present withoutcompromising the ability of future generations to meet their own needs.”
So, from a campus perspective, what are our needs? We approach campus sustainability byaddressing three areas: environment; human resources; and community and core function. Thehealth of the natural environment is crucial to our own health and survival, and campus managementand operations have a large potential footprint on local ecology. In addition, a university or collegeconsists of people, so the health and well being of the campus users and workforce must beaddressed. Last, we acknowledge that, beyond its people and natural environment, an institutionmust achieve its core functions while respecting the community in which it is located.
For some readers, this scope is a surprise: “sustainability” is more than “the environment”. Instead,our assessment stems from a more integrated view of our relationships to the natural world, to eachother, and to the institutions and communities of which we are a part.
The Selection of Indicators
To apply these notions of sustainability and assist campuses in finding a pathway to a sustainablefuture, Good Company has developed a set of indicators, the Sustainable Pathways Toolkit. This is atricky process: choosing what to measure is a challenge of balancing the needs to look at whatmatters, to consider diverse factors, and to stay within the time and resource constraints of anassessment. Our work is guided by a few key ideas: meaningful, feasible and measurable.
Meaningful indicators capture major impacts around which there is broad consensus. In short, wetarget those factors that contribute most to the overall impact or footprint of an institution.Everything “matters” in some sense, but we cannot measure everything. Our focus on meaningfulindicators is our attempt to select major factors and key proxies.
Ultimately, our assessment should lead to feasible action. This means that we target areas wherecampus stakeholders can realistically make a difference without prohibitive cost or effort. A particularlong-run benchmark might not be immediately within reach, but all of our indicators address areaswhere an institution can potentially improve.
Last, our assessment goes after measurable indicators and impacts. To the fullest extent possible, weaim for clearly defined quantitative and qualitative measures. And while almost anything can bemeasured, our focus is on measurement that can be achieved with minimal cost and time.

6Final Report
Good Company © 2002
Clearly, there is tension among these three principles; that is the balancing act of our assessment. Fora more in-depth discussion of how Good Company selects indicators, please see the SustainablePathways Toolkit: Technical Manual, available on request from Good Company.
Vision and Priorities
No one achieves sustainability overnight; our goal, whether as institutions, as individuals or as asociety, is to make progress in the right direction at the fastest pace possible, without compromisingour other aims. This requires a balancing act between what is ideal and what is feasible, and thechallenge of figuring out how to get things done.
But our predicament – that is, starting so far from any true place of sustainability – challenges us toanother balancing act: between setting short-run priorities for action and maintaining a coherentlong-run vision. The goal of our Toolkit is to provide both short-run stepping-stones and long-runtargets, and we describe these to the best of our ability for each of our indicators. The specific pathsfor many indicators are still to be discovered – How can we achieve a closed-loop or zero-wasteuniversity? What kind of environmental policy should a campus have? How much energy is it okay touse, and from what sources? What benefits should a campus offer its employees? – and we do notprovide final answers here. But the long-run target – that is, the vision – provides a compass for thejourney.
Any document of this length and breadth can be misused, so we lay out a clear caveat here: Ourrecommendations are not a complete pathway to sustainability. Rather, they represent oursuggestions for taking action now and preparing for action in the near future. We encourage theUniversity of Oregon and all institutions of higher education to maintain a realistic focus on what canand should be done immediately, while keeping the long-run vision in focus.
7Final Report
Good Company © 2002
III. Overview of Findings
Our findings consist of three sections:
Ø General observationsØ General strengthsØ Areas for improvement
The first two sections are covered briefly in order to provide context for the report, with the focusgiven to the areas for improvement.
General Observations
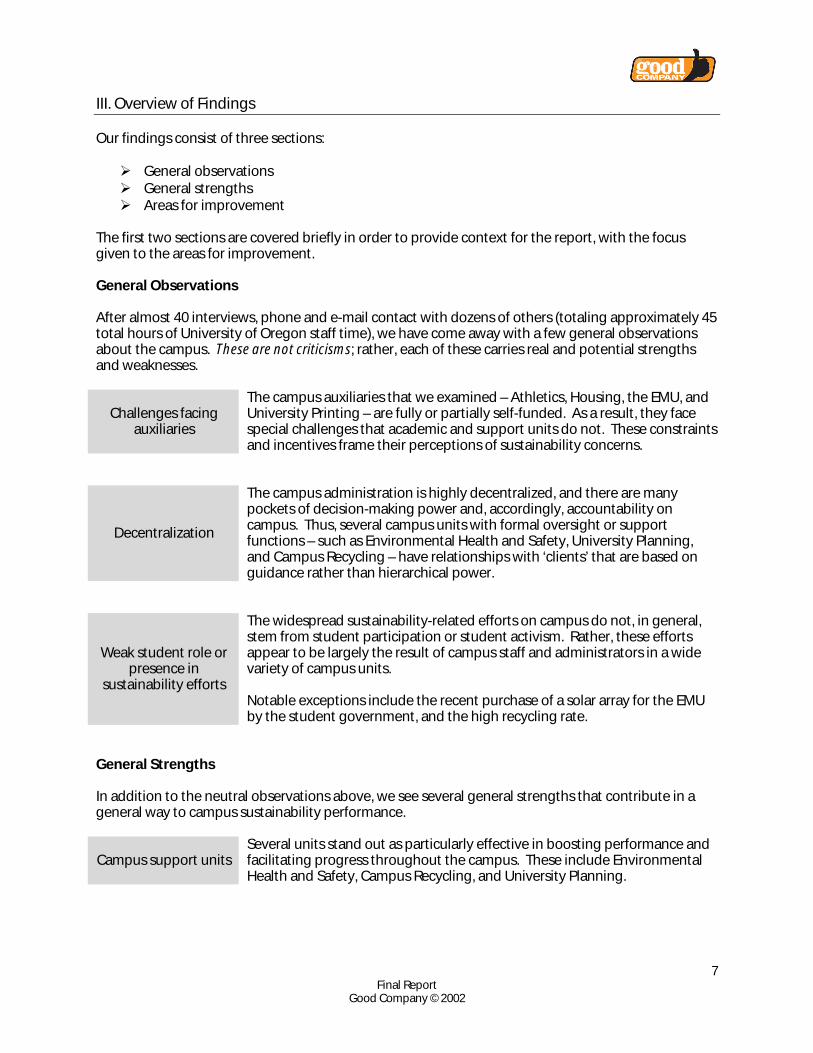
After almost 40 interviews, phone and e-mail contact with dozens of others (totaling approximately 45total hours of University of Oregon staff time), we have come away with a few general observationsabout the campus. These are not criticisms; rather, each of these carries real and potential strengthsand weaknesses.
Challenges facingauxiliaries
The campus auxiliaries that we examined – Athletics, Housing, the EMU, andUniversity Printing – are fully or partially self-funded. As a result, they facespecial challenges that academic and support units do not. These constraintsand incentives frame their perceptions of sustainability concerns.
Decentralization
The campus administration is highly decentralized, and there are manypockets of decision-making power and, accordingly, accountability oncampus. Thus, several campus units with formal oversight or supportfunctions – such as Environmental Health and Safety, University Planning,and Campus Recycling – have relationships with ‘clients’ that are based onguidance rather than hierarchical power.
Weak student role orpresence in
sustainability efforts
The widespread sustainability-related efforts on campus do not, in general,stem from student participation or student activism. Rather, these effortsappear to be largely the result of campus staff and administrators in a widevariety of campus units.
Notable exceptions include the recent purchase of a solar array for the EMUby the student government, and the high recycling rate.
General Strengths
In addition to the neutral observations above, we see several general strengths that contribute in ageneral way to campus sustainability performance.
Campus support unitsSeveral units stand out as particularly effective in boosting performance andfacilitating progress throughout the campus. These include EnvironmentalHealth and Safety, Campus Recycling, and University Planning.

8Final Report
Good Company © 2002
Widespreadinstitutional ethic
There are many individuals among the University’s staff and faculty who areaddressing sustainability in ways that match their functions.
Although the decentralization of campus administration can be a barrier toaddressing sustainability concerns, it appears to be a strength because of themany people who have the freedom to pursue progress in their jobs.Naturally, this generalization varies in degree for all individuals and campusunits, but it is true in a significant number of cases.
Clarity and authorityof high-level goals
and policies
The University has important high-level policy statements, such as theComprehensive Environmental Policy, the Sustainable Development Plan,and the Long Range Development Plan. More important, these documentsappear alive and present in several areas of campus planning and operations.This is particularly impressive given the relative newness of certaindocuments, such as the Sustainable Development Plan.
Although there is room for improvement, these goal-setting documents areimportant and effective, and given current challenges, they provide relativefocus and clarity.
Areas for Improvement
There are several areas in which the University of Oregon can make improvements, increase efficiency,reduce risk, make a significant impact for little institutional or financial commitment, or seize asignificant leadership opportunity. The findings are qualified with one or more of the followingcategories:
Impact Category Description
Savings/EfficiencyThe finding highlights an opportunity for financial savings and/orgreater resource efficiency by the University’s staff or management.
RiskThe finding describes a significant potential risk for theadministration, the campus’ finances, or the University as a whole.
LeverageThe finding describes a strong leverage point for a commitment –institutional, financial, or both – to maintain current performance,take on an emerging concern, or repair a current deficit.
LeadershipThe finding shows an opportunity for significant leadership by thecampus.
9Final Report
Good Company © 2002
A note on priorities
The areas for improvement (next page) are listed in three categories:
Ø Highest priorityØ Medium priorityØ Future concerns
This ranking represents the feasibility of, importance of, and level of consensus around action in eacharea. Implicit or explicit recommendations from the full assessment text that do not appear here are,in our view, of lowest priority. Please note: Any reader who cites this report should communicate the levelof priority assigned to a particular observation or recommendation.
Additional comments appear in the full assessment results, following the Areas for Improvement.Those comments that do not appear in this section – and appear only in the detailed assessmentresults (based on individual indicators) – are considered to have the lowest level of priority.
A call for collaboration
These recommendations are for the entire campus community, not just for the campus units thatappear directly responsible for action. In other words, we hope that our focus on these items will leadindividuals and groups on campus to help make these ideas possible, rather than simply demandchange or complain about the status quo.
For example, there is considerable room for students and faculty to assist in the design, planning, andimplementation of certain ideas – if they are willing to listen to and understand the concerns andconstraints of others. Similarly, campus units such as Housing, Athletics, and the UO Foundation standto gain enormously by harnessing the interest and intellect of concerned individuals in the campuscommunity.

10Final Report
Good Company © 2002
Areas for Improvement – Priority Levels and Impact Categories
Impact CategoryPriority
LevelArea for Improvement Savings/
EfficiencyRisk Leverage Leadership
Improve communication and information for energy and water use √ √Highestpriority Use recycled paper for programs at athletic events √ √
Charge for printing in Computing Center labs √ √Clear governance for sustainability issues √ √ √
Renewable energy purchasing √ √Mediumpriority Insufficient support for ergonomic safety staff √ √ √
Futureconcerns
Food purchasing in Campus Housing √ √
11Final Report
Good Company © 2002
Areas for Improvement (detailed descriptions)
Highest priority:
√ Savings/Efficiency
√ Leverage
Ø Improve communication between information-gatherers anduser/managers (for energy and water use)
Facilities Services and the large auxiliaries (Housing, the EMU, and Athletics) gather a substantialamount of information on energy and water use. At present, this information is not sufficientlyorganized for use as an effective management tool.
Although large parts of the University – especially Facilities Services and the EMU – have implementedsignificant improvements recently in the areas of energy conservation, there is still insufficient data-collection and processing for the information to provide clear guidance to administrators and staff.After the low-hanging fruit have been picked (e.g., installation of occupancy sensors and fluorescentlamps), only a solid information system will provide long-run gains.
There are additional opportunities at the grass-roots level. For example, there are almost nocommunication mechanisms to let students, staff and faculty know their energy and water use levelsand impacts. Although the University is typical in this regard, additional long-run change will requirebehavioral changes by campus users. Since most campus users do not connect their actions with theenvironmental and health impacts of energy and water use, there is an opportunity to leveragedecentralized individual action for cost savings and the greater good.
Good Company believes the University can increase efficiency and save money over the long run. Thiswill take a commitment on the part of upper-level staff and administrators to develop coherentsystems of information gathering and communication.
√ Leadership
√ LeverageØ Paper use for programs at athletic events
UO Athletics prints over 40,000 programs for football, men’s basketball, women’s basketball, andvarious track and field events each year. These programs are made from virgin paper (i.e., the papercontains no recycled content).
Good Company perceives an opportunity for Athletics to make a strong and highly visible statementat a small cost. Its high-profile programs could be printed on 15% post-consumer recycled paper at anadditional printing cost of only 10%, according to information provided by the subcontractor.
12Final Report
Good Company © 2002
√ Savings/Efficiency
√ LeadershipØ Charging for printing in Computing Center labs
Laser printing at the Computing Center labs is generally free to students. This divergence betweentrue costs and the costs borne by the user both skews resource use and sends the wrong messageabout consumption.
The “technology fee” assessed to students has historically come with a promise of free printing. GoodCompany believes the University can increase long-run efficiency by implementing a fee-for-usesystem (even if it is subsidized in part by tech fee funds) that is more efficient, more just, and lesscostly than the current system.
Good Company also perceives an opportunity to communicate a valuable economic andenvironmental lesson to students: society functions better when individual decisions incorporate“good information” such as true costs.
√ Savings/Efficiency
√ Leverage
√ Leadership
Ø Clearer governance for sustainability issues
The leadership and coordination functions relating to sustainability are currently scatteredthroughout the campus. In some cases, the performance of one campus unit does not meet thestandard set elsewhere on campus. In some cases, the viability of one unit’s efforts is comprised bythe lack of campus-wide coordination.
Good Company sees potential for improving governance in three specific areas relating tosustainability issues. We do not officially recommend the implementation of all three, but we chooseto highlight them here because they represent, at the very least, problem areas that surfaced duringthe assessment. They are: (1) the structure of print charging (important enough to be addressedseparately above); (2) the system of waste and recycling; and (3) the lack of a single position orcommittee with coordinating or decision-making authority over sustainability issues. We treat (2) and(3) briefly here.
Integrated waste management: The University could boost financial and sustainability performanceby combining or more closely coordinating the campus’ garbage collection and recycling operations.Currently, the artificial division between the two compromises the status of recycling, and it results ininefficient waste management for the numerous large events that take place on campus. (See the fulldescription of indicator #4 below for a more thorough treatment of this issue.)
A campus sustainability coordinator: Several institutions of higher education, including the Universityof North Carolina-Chapel Hill and Portland State University, have created Sustainability Coordinatorpositions in an effort to promote collaborative and coordinated campus-wide efforts to take oninherently campus-wide challenges. Currently, the Environmental Issues Committee (EIC) serves partof this function, but only in an advisory role for the Vice President for Administration. A mandate fordirect communication with and coordination of campus units would improve overall campus-widesustainability performance.
Good Company perceives an opportunity for leadership and significant long-run cost savings throughclearer sustainability governance. Changes of this kind will demand a significant administrativecommitment, but with enormous potential returns.

13Final Report
Good Company © 2002
Medium priority:
√ Leverage
√ LeadershipØ Renewable energy purchasing
The campus currently makes no special effort to purchase electricity from renewable sources such aswind power or certified salmon-friendly hydropower. Energy use is perhaps the greatest singlehuman impact on the environment, and large institutions are well situated to take long-run action tomove beyond energy efficiency and influence the composition of electricity generation.
Numerous universities (as well as some state governments, many private companies, and thousandsof individuals) have begun to purchase premium-priced electricity from renewable sources, especiallywind power. At universities, this has been the result of different sources of leadership, sometimesfrom the students (University of Colorado-Boulder, Connecticut College, Pennsylvania StateUniversity), and sometimes from the administration (Carnegie Mellon).
Good Company perceives an opportunity here, although it will probably involve some additionalfinancial commitment in the short run.
√ Savings/Efficiency
√ Risk
√ Leverage
Ø Support for ergonomic safety staff
Environmental Health and Safety currently has so few staff that it can devote only part of one staffmember’s time to ergonomic safety education and support.
Ergonomic injuries (including repetitive stress injuries, such as carpal tunnel syndrome) are theleading workplace hazard in the U.S. Given the rapid and recent growth in the use of computers, thiswill be an emerging problem, requiring new strategies from the University.
Good Company perceives a long-term risk that the University can address with a modest commitmentto support ergonomic education and safety. A small increase in EH&S staff would increase educationand safety efforts and reduce risk. This could provide long-run savings through reduced cost of healthand disability insurance premiums, as well as decreased absenteeism.

14Final Report
Good Company © 2002
Future concerns:
These issues do not represent significant shortcomings in the University’s overall sustainabilityperformance. However, there are options for action that would allow the University to demonstratesignificant leadership.
√ Leverage
√ LeadershipØ Food purchasing in Campus Housing
UO currently has no policies promoting the purchasing of locally or organically grown produce.
Good Company perceives an opportunity for the University to extend its good citizenship bysupporting local and regional agriculture, e.g., through direct sourcing of fresh ingredients or theparticipation in Community Supported Agriculture (CSA) programs. There are ample opportunities forthis sort of sourcing in the Willamette Valley and the Pacific Northwest.
Good Company recognizes that most food decisions by Campus Housing are appropriately driven bydemand. Campus Housing faces financial pressures as an auxiliary and must respond to its ‘clients’.Thus, this recommendation is a call to the campus community more generally, since any solution willrequire action and interest from outside of Campus Housing as well.

15Final Report
Good Company © 2002
IV. Sustainable Pathways Toolkit assessment results
The following pages provide an indicator-by-indicator description of the results of the assessment ofUO, including the Core Indicators and the Supplementary Indicators.
Indicators 1-12 address environmental concerns; indicators 13-16 address human resources; andindicators 17-20 address community and core function. There are also nine (9) miscellaneousSupplementary Indicators.
Road map to reading the indicator results
The chart below describes the format of the indicator-by-indicator assessment results. Those readerswho are unfamiliar with the Sustainable Pathways Toolkit will want to take a moment to familiarizethemselves with the flow of information in the presentation of each indicator.
INTENT:Provide a concrete benchmark (and over time, a rising bar) forcampus recycling and waste management efforts.
BENCHMARK:The total recycling rate equals 40% (as a share of the total campussolid waste stream, as measured by weight).
5. Solid waste and hazardousmaterials:
Total recycling rate (as share oftotal waste stream)
UO PERFORMANCE:Campus Recycling diverted 44.1% of the campus solid waste streamin the 1999-2000 fiscal year.
This number is based on 1675.88 tons of garbage landfilled and1321.58 tons of recycling collected.
The “aspect” is the broadcategory under which the
indicator falls.
This is the name and shortdescription of the indicator.
The name here is the oneused elsewhere in the
summary andrecommendations.
The “intent” expresses theimportance of and reason
for the indicator.
The “benchmark” is the target level ofperformance, based on Good
Company’s research. The benchmarkexpresses exemplary but feasible
performance.
A summary of UO’sperformance.

16Final Report
Good Company © 2002
Core Indicators
(Indicators 1-12 address the Environment)
INTENT:Encourage energy efficiency.
1. Resource use:
Campus Energy Intensity(scaled) BENCHMARK:
Total energy use for heating, cooling, and electricity does not exceed125 MMBtu (millions of British Thermal Units) per Scaled CampusUser (SCU) per year.
The formula for SCUs is a weighted average of the different kinds ofusers (resident students, enrolled students, and all employees,including staff, faculty, and student employees). Since UO is the firstassessment, we do not yet have benchmarking data, so thecoefficients used below are estimates. The benchmark figure is basedon research, but using available data that did not include the samelevel of detail as this report.
For these calculations, we used the two different sets of weights,both relative to a value of 1.0 for resident students. The resultsappear below, with the energy use figure for the University.
UO PERFORMANCE:Using the two weights, we found a range of SCUs:
Calculation B assumes more energy use by daytime campus users,especially employees, relative to resident students. These two sets ofweights produce a range of energy use per SCU:
Weights used: MMBtus per SCU(Benchmark: 125)
Calculation A 150.1Calculation B 110.1
These two numbers put UO in the neighborhood of the estimatebased on Good Company’s research. As more campuses join our PilotStudy, we will have more precise comparisons.
Campus usergroup
Calculation AWeights
Calculation BWeights
Resident students 1.0 1.0Employees 0.25 0.4Enrolled students 0.15 0.25SCUs (2000-2001) 5,240 7,141
17Final Report
Good Company © 2002
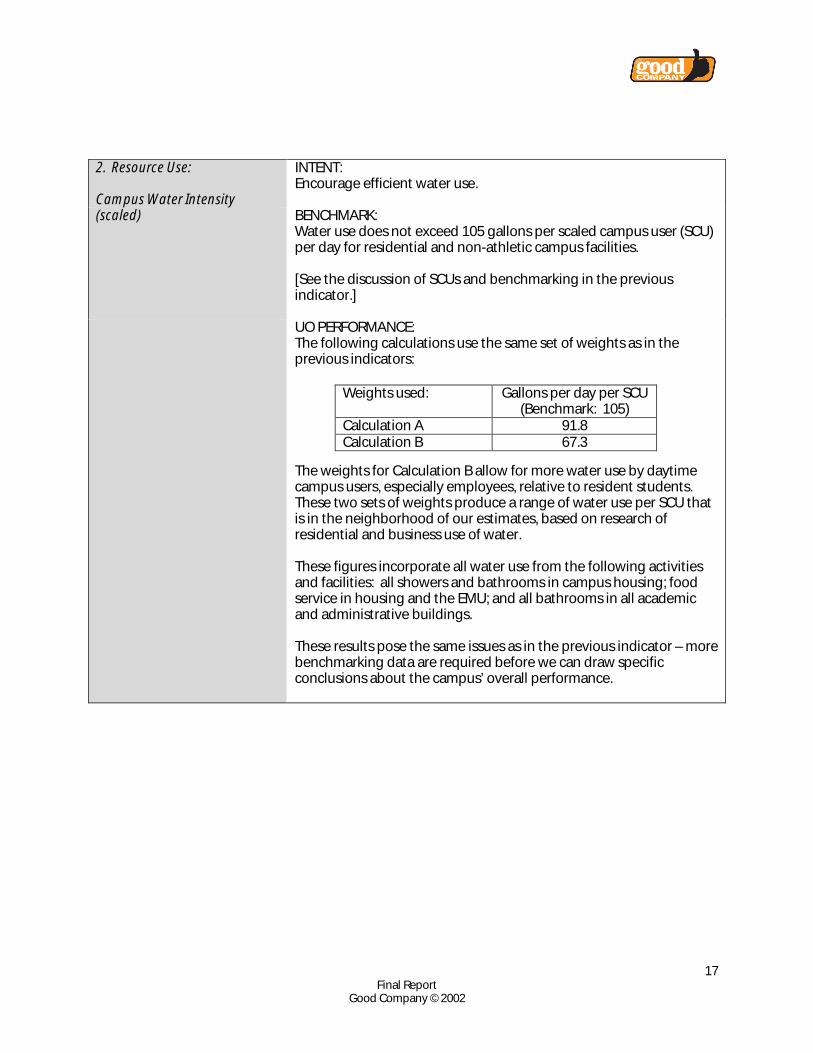
2. Resource Use:
Campus Water Intensity
INTENT:Encourage efficient water use.
(scaled) BENCHMARK:Water use does not exceed 105 gallons per scaled campus user (SCU)per day for residential and non-athletic campus facilities.
[See the discussion of SCUs and benchmarking in the previousindicator.]
UO PERFORMANCE:The following calculations use the same set of weights as in theprevious indicators:
The weights for Calculation B allow for more water use by daytimecampus users, especially employees, relative to resident students.These two sets of weights produce a range of water use per SCU thatis in the neighborhood of our estimates, based on research ofresidential and business use of water.
These figures incorporate all water use from the following activitiesand facilities: all showers and bathrooms in campus housing; foodservice in housing and the EMU; and all bathrooms in all academicand administrative buildings.
These results pose the same issues as in the previous indicator – morebenchmarking data are required before we can draw specificconclusions about the campus’ overall performance.
Weights used: Gallons per day per SCU(Benchmark: 105)
Calculation A 91.8Calculation B 67.3
18Final Report
Good Company © 2002
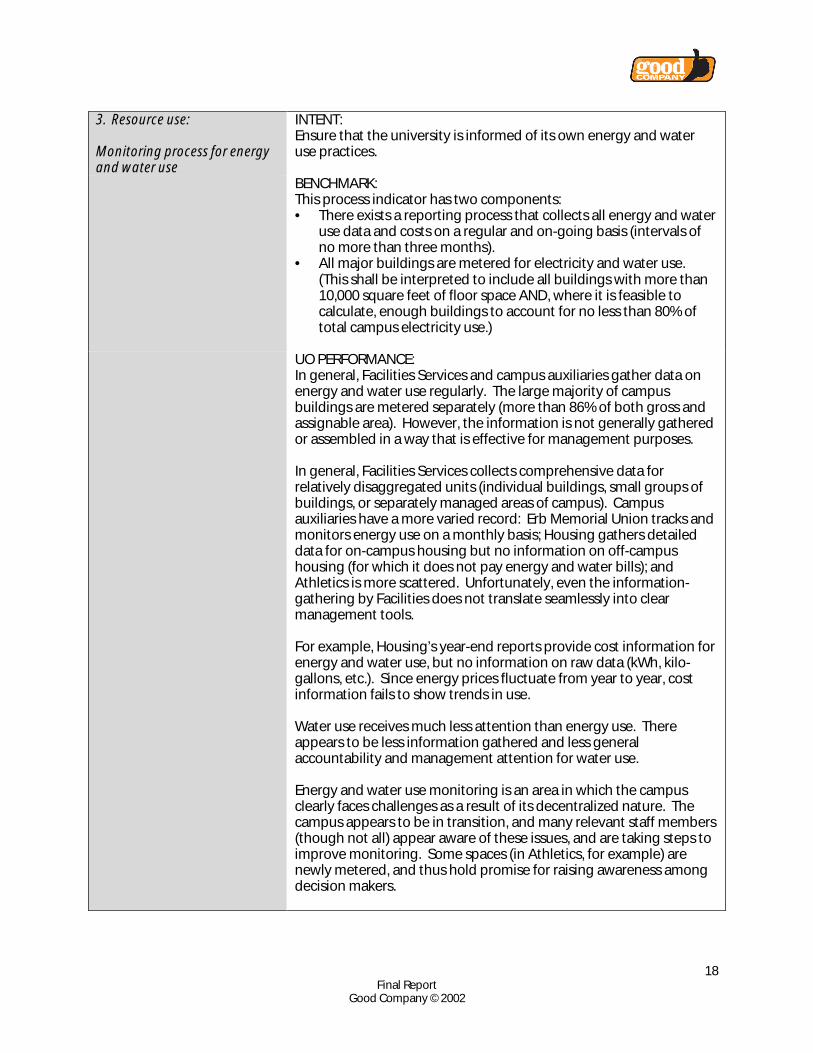
3. Resource use:
Monitoring process for energyand water use
INTENT:Ensure that the university is informed of its own energy and wateruse practices.
BENCHMARK:This process indicator has two components:• There exists a reporting process that collects all energy and water
use data and costs on a regular and on-going basis (intervals ofno more than three months).
• All major buildings are metered for electricity and water use.(This shall be interpreted to include all buildings with more than10,000 square feet of floor space AND, where it is feasible tocalculate, enough buildings to account for no less than 80% oftotal campus electricity use.)
UO PERFORMANCE:In general, Facilities Services and campus auxiliaries gather data onenergy and water use regularly. The large majority of campusbuildings are metered separately (more than 86% of both gross andassignable area). However, the information is not generally gatheredor assembled in a way that is effective for management purposes.
In general, Facilities Services collects comprehensive data forrelatively disaggregated units (individual buildings, small groups ofbuildings, or separately managed areas of campus). Campusauxiliaries have a more varied record: Erb Memorial Union tracks andmonitors energy use on a monthly basis; Housing gathers detaileddata for on-campus housing but no information on off-campushousing (for which it does not pay energy and water bills); andAthletics is more scattered. Unfortunately, even the information-gathering by Facilities does not translate seamlessly into clearmanagement tools.
For example, Housing’s year-end reports provide cost information forenergy and water use, but no information on raw data (kWh, kilo-gallons, etc.). Since energy prices fluctuate from year to year, costinformation fails to show trends in use.
Water use receives much less attention than energy use. Thereappears to be less information gathered and less generalaccountability and management attention for water use.
Energy and water use monitoring is an area in which the campusclearly faces challenges as a result of its decentralized nature. Thecampus appears to be in transition, and many relevant staff members(though not all) appear aware of these issues, and are taking steps toimprove monitoring. Some spaces (in Athletics, for example) arenewly metered, and thus hold promise for raising awareness amongdecision makers.

19Final Report
Good Company © 2002
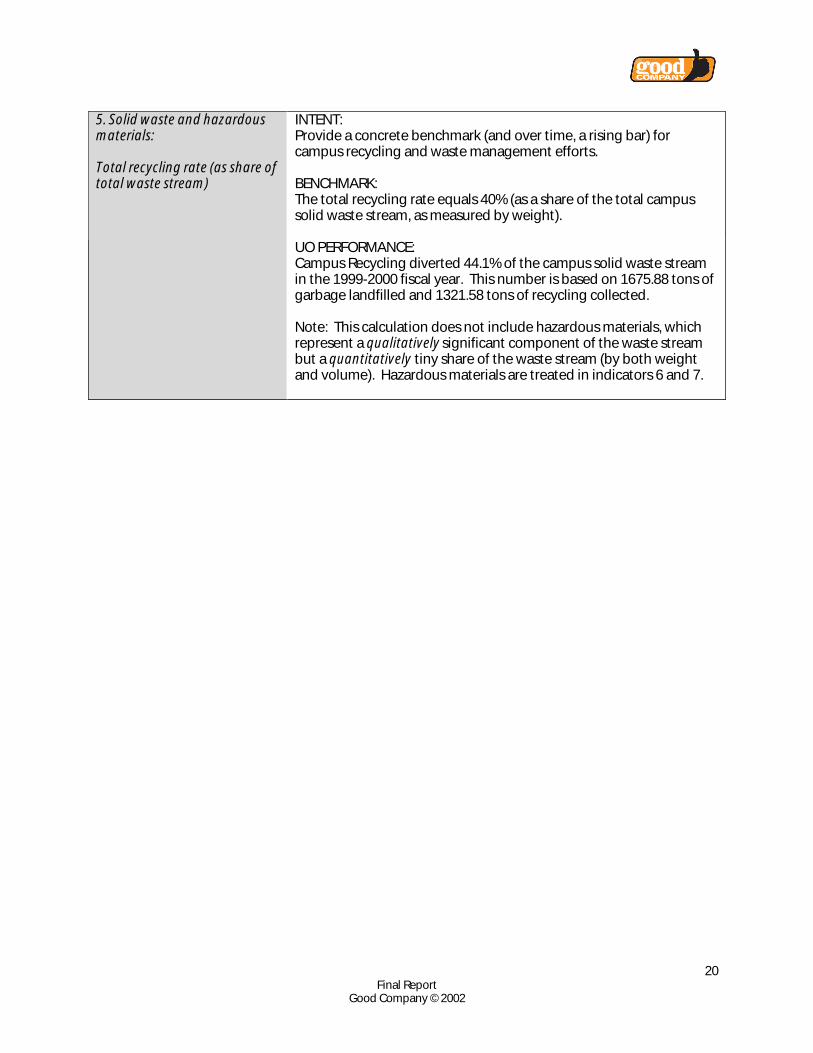
4. Solid waste and hazardousmaterials:
Recycling infrastructure
INTENT:Provide the infrastructure to make recycling convenient for campususers.
BENCHMARK:Provide widespread recycling infrastructure for all major recyclables(cans and bottles, cardboard, newsprint, office paper). Locations thatneed infrastructure:• Campus buildings with 10,000+ square feet of floor space• Computer labs with printing facilities• Dormitories and residence halls• Outdoor areas of high use (especially food courts)
UO PERFORMANCE:Recycling infrastructure at UO is pervasive outdoors, in academic andadministrative buildings, and in housing. Additional programssupport the reuse and exchange of office supplies and furniture.Campus Recycling provides extensive recycling and reductioninformation through its web site.
Regular collection bins allow users to recycle glass, plastic, aluminumand other metal, and newsprint. All computer labs have specialrecycling bins for office paper and mixed paper.
The ROSE (Reusable Office Supply Exchange) and Furniture Exchangeprograms relocated nearly $130,000 worth of furniture and suppliesduring the 1999-2000 academic year alone. A campus listservfacilitates these exchange activities.
Both Campus Recycling and Environmental Health and Safetyprovide extensive information on and assistance with recycling awide range of special materials, from batteries and compact disks tofluorescent bulbs and video cassettes.
The most conspicuous, high-volume garbage-creating events oncampus are the five or six home football games each year, but thereis no recycling process or infrastructure for these events. Attendanceat a football game leaves behind 3-5 tons of garbage in just threehours; this means that 1% of the annual waste stream happens in justfive autumn afternoons. A two-game study by Campus Recyclingshowed that recyclables made up 28-48% of the waste (dependingon the breadth of recycled items). The study demonstrated thatAthletics could achieve a recycling rate roughly equal to the campusas a whole with modest effort and minimal cost.
As mentioned in the recommendations, there is potential to improveoverall recycling by coordinating or combining garbage andrecycling into a single process of “waste management”. This couldraise the recycling rate of high-volume garbage-creating events, suchas football games, commencement ceremonies and the Folk Festival.
20Final Report
Good Company © 2002
INTENT:Provide a concrete benchmark (and over time, a rising bar) forcampus recycling and waste management efforts.
BENCHMARK:The total recycling rate equals 40% (as a share of the total campussolid waste stream, as measured by weight).
5. Solid waste and hazardousmaterials:
Total recycling rate (as share oftotal waste stream)
UO PERFORMANCE:Campus Recycling diverted 44.1% of the campus solid waste streamin the 1999-2000 fiscal year. This number is based on 1675.88 tons ofgarbage landfilled and 1321.58 tons of recycling collected.
Note: This calculation does not include hazardous materials, whichrepresent a qualitatively significant component of the waste streambut a quantitatively tiny share of the waste stream (by both weightand volume). Hazardous materials are treated in indicators 6 and 7.

21Final Report
Good Company © 2002
6. Solid waste and hazardousmaterials:
Hazardous materials handling
INTENT:Encourage campuses to meet often-neglected federal guidelines forthe handling and disposal of hazardous wastes generated by campusoperations.
BENCHMARK:The university has an official policy for hazardous materials handlingand disposal, as well as comprehensive records of disposal (that areroutinely provided by companies that provide such disposal services).
UO PERFORMANCE:UO’s Environmental Health and Safety (EH&S) manages a series ofpro-active efforts to reduce the campus’ costs and risks fromhazardous materials and hazardous waste.
EH&S monitors Integrated Pest Management (IPM) practicescampus-wide. EH&S has begun to track all pesticide use, and is wellsituated to meet recently passed Oregon guidelines for pesticidereporting.
EH&S also runs the Chemistry Reuse Facility, a program that takesunwanted chemicals from labs and connects them to other lab users,avoiding premature disposal and saving thousands of dollars. Thisprogram, consisting of an on-line database, serves such departmentsas Chemistry, Physics, and Molecular Biology. In the past year,campus labs used the Chemistry Reuse Facility about 150 times,saving an estimated $4,500-6,000 in direct purchase costs (notincluding avoided disposal costs).
EH&S’ program for computer and electronics waste disposal (seeIndicator 7 for more detail on computer hardware) significantlyreduces the University’s long-term risk associated with improperhazardous waste disposal. Currently, most CRTs (i.e., monitors) aresent directly to landfills, although they contain levels of lead thatqualify them as hazardous waste. As EPA enforcement in highereducation continues to tighten, pro-active institutions such as UO willbe ahead of the curve. In 2001, UO diverted 78 palettes of electronicsand computer waste (including printers, modems, fax machines, cellphones, etc.); over time, this significantly lowers the university’s riskfrom improper disposal.

22Final Report
Good Company © 2002
7. Solid waste and hazardousmaterials:
Computer hardwarepurchasing and disposal
INTENT:Promote an ethic of – and create the infrastructure for – life-cycleaccounting for the use of computer hardware, an important segmentof durable purchases.
BENCHMARK:The university has policies and processes for (1) purchasing energy-efficient information technology hardware and (2) providing disposaland salvage options for campus users and members of theimmediate community.
UO PERFORMANCE:Like any public agency, the University has guidelines and proceduresthat govern the purchasing, disposal and resale of computerhardware and other products. Although these rules can beconstraints, the campus is making a strong and successful effort toreduce its environmental impact in this area.
Disposal:• UO recently began a periodic and highly successful “computer
harvest” that has culled hundreds of unused monitors, CPUs, andother surplus electronics from academic and administrativebuildings and campus housing. Plans by Environmental Healthand Safety to run the “harvest” one or twice per year will providethe campus community with an effective disposal process. In theyear ending May 2002, the program culled 550 usable monitorsand 550 usable CPUs, and diverted (from landfills) 7,167 poundsof “dead” monitors.
Purchasing:• The Business Affairs Office, in coordination with groups of
purchasers and manufacturers of computer hardware, is workingtoward various options for environmentally informed purchasing.Possibilities include computer take-back programs, and efficiencythat exceeds Energy Star performance standards.
Business Affairs also works closely with the State government, whoserules govern key aspects of procurement and property disposal inpublic higher education.

23Final Report
Good Company © 2002
8. Paper:
True-cost print-charging
INTENT:Encourage efficiency by communicating the true costs of paper useto the end user.
BENCHMARK:Campus printing facilities charge for printing from computers.
UO PERFORMANCE:The majority of the campus’ high-volume printing facilities availableto students do not charge. A few publicly accessible locations sellVenda-cards for printing and photocopying.
The main venues for student printing on campus are the labs run bythe Computing Center and Knight Library. A few locations suchKnight Library (which has separate funding and administration) andthe labs in Lawrence, Klamath and Onyx (which are publiclyaccessible) charge 10 cents for printing and 7 cents for photocopies.The Computing Center does not charge for printing in its largestudent-only labs (Grayson, Millrace, and the EMU).
Free printing is funded by a “technology fee” assessed automaticallyto all students. The dialogue surrounding printing funded by thetech fee is an obstacle to reducing unnecessary paper use. Studentshave come to feel that they pay for the right to have unlimitedprinting.

24Final Report
Good Company © 2002
9. Paper:
Paper use and purchasing
INTENT:Use campus leadership – and the power of large buying units – inbasic purchasing policies to encourage markets to provide recycledpaper products.
BENCHMARK:Campus paper purchasing encourages the following:• Use of recycled-content and totally chlorine free (TCF) paper
wherever technically and financially feasible (especially whereinexpensive alternatives are widely available, such as bathroomtissue)
• Purchasing of some recycled-content materials by includingrecycled content as a purchasing criterion.
• Some quantitative target for the weighted average (by value orby volume) of recycled content in total paper purchases.
• Use of recycled-content and TCF paper wherever possible byuniversity printing services.
UO PERFORMANCE:The main venues of office paper consumption (for laser printing andphotocopying) use 30% post-consumer recycled paper as a default,and 100% post-consumer for a significant minority (up to 25%) ofuses. Virgin paper appears to be rare in academic and administrativeunits, and is available mainly by request from University Printing orby order through separate purchasing units. A significant use ofvirgin paper is the printing of athletic programs for football andbasketball games.
Paper purchasing is somewhat decentralized, though UniversityPrinting and its EMU shop, the Computing Center and its labs, andKnight Library’s printing and copying stations account for the lion’sshare of printing and copying. (Campus units should purchase fromUniversity Printing whenever possible; this would ensure the use ofrecycled content.)
Athletics (which outsources the production of its programs) does notstipulate the use of recycled paper.
Chlorine-free bleaching is not formally an issue in paper purchasingfor any major paper-purchasing campus unit.
All bathrooms stocked by Custodial use 20% post-consumer recycledpaper for bathroom tissue and hand towels. This is an important stepin the right direction, but Custodial could source higher post-consumer content without compromising quality or significantlyraising cost.

25Final Report
Good Company © 2002
INTENT:Encourage on-going assessment of the chemicals used in campus-wide custodial operations.
10. Campus Operations andDesign:
Monitoring process forcustodial chemical use BENCHMARK:
A monitoring and management process exists to assess needs foreach chemical-intensive custodial product. This process mustconsider toxicity, downstream impacts, and worker safety, as well ascost.
UO PERFORMANCE:Facilities Services, through its Safety Trainer for custodial services,screens all new chemicals to keep toxicity as low as possible.
The Safety Trainer articulated clear goals for the program, such aseliminating the use of unnecessarily strong cleaning chemicals, andeliminating bleach to the fullest extent possible. Custodial servicesregularly tries new non- or less toxic alternatives in order to reducethe overall health and environmental impact of the products it uses.
Since the creation of the Safety Trainer position and the existingdecision-making processes, the number of cleaning chemicals in usehas fallen from more than 125 to fewer than 50.
INTENT:Promote alternatives to pesticide and herbicide use and the overuseof water in the maintenance of the built campus landscape.
BENCHMARK:The campus demonstrates significant improvements overconventional pesticide-, herbicide-, and water-intensive proceduresin the maintenance of landscaping.
11. Campus Operations andDesign:
Low-impact groundsmaintenance (chemical andwater use)
UO PERFORMANCE:Facilities Services’ Exterior Team’s practices reduce chemical andwater use well below conventional practices.
The Exterior Team has a thorough Integrated Pest Management (IPM)plan, conducted with the support of Environmental Health andSafety. Non-toxic chemical substitutes include a biodegradablepesticide made from corncobs. Annual expenses for chemicals havebeen $1,200-1,800 over the past three years.
The Exterior Team currently does not meter irrigation waterseparately, though the estimated use is 16 inches per year for the140.5 acres (approximately 61.043 million gallons, or 34.8% of annualwater use). The campus is installing a weather-sensitive Maxicomirrigation system over the next five years; when fully implemented,the system will reduce irrigation water use by 30-70%.

26Final Report
Good Company © 2002
12. Campus Operations andDesign:
Infrastructure and incentives toreduce transportation impact
INTENT:Create transportation opportunities that reduce environmentalimpacts (such as air pollution and greenhouse gas (GHG) emissions)and spillover costs to the campus surroundings (such as traffic andparking congestion).
BENCHMARK(S):The university addresses transportation issues by:• implementing appropriate strategies to reduce transportation
impacts;• engaging in long-term planning that takes account of the
environment and the surrounding community; and• gathering relevant data on campus infrastructure, use of various
transportation modes, and the spatial distribution of campususers.
UO PERFORMANCE:The University does comprehensive and long-term planning and hasa diverse set of strategies to address transportation issues.
In particular, strategies used by the campus include:• Free bus passes for students, staff and faculty• Ample bicycle parking and other bicycle infrastructure• Car parking with unsubsidized pricing• Integrated housing-transportation strategies• Carpooling incentives (under-utilized)• Guaranteed ride home plan• Flexible parking passes
Parking is a self-supporting unit (i.e., car use is therefore notsubsidized through general funds).
University Planning has gathered some data on campus usertransportation patterns, and other local entities have done somesurvey work, but the data are not gathered on a regular basis or in aconsistent way over time. Funds, staff time, and the breadth of otherresponsibilities are clear constraints to carrying out deeper surveys.

27Final Report
Good Company © 2002
(Indicators 13-16 address Human Resources)
13. Employee Health andSafety:
Ergonomic safety
INTENT:Create safe workspaces.
Pursue this end by informing and empowering employees'evaluation and adaptation of their workspaces to individual needsand constraints.
BENCHMARK:Demonstrate concrete action in the following areas:• Information resources available to employees• Employee training on ergonomic safetyWhere feasible, include the following:• Employee design and implementation of ergonomic solutions• Employer process to address and control ergonomic problems
UO PERFORMANCE:Environmental Health and Safety (EH&S) makes available a pamphleton ergonomic safety with video display guidelines. EH&S alsoproduces a “Workstation Assessment Form” for users to assess theirown workspaces. EH&S also trains individuals in various departmentsthroughout campus to act as diffuse sources of information andassistance.
There is no significant monitoring, assessment, or training programthat reaches a large percentage of campus employees, much lessstudents. EH&S does not provide any ergonomic safety informationon its web site.
These shortcomings are understandable given the resourcesavailable to address the issue: ergonomic safety is the part-timeresponsibility of a single staff person at EH&S.

28Final Report
Good Company © 2002
14. Employee Health andSafety:
Indoor air quality (IAQ)
INTENT:Protect indoor environmental quality, which is paramount inworkplace quality and employee health.
BENCHMARK(S):Environmental Health and Safety (EH&S) requirements and standardsinclude several of the following:• Ventilation systems have mechanisms for adjustment by users• Regular evaluations and maintenance improvements• IAQ monitoring process/procedures for certain well-known
indoor air pollutants/contaminants• Standards for airflow/mixing of fresh/outdoor air.
UO PERFORMANCE:Environmental Health and Safety (EH&S) responds to emergencyproblems and does on-going monitoring of “sick building syndrome”in some of the older campus buildings. EH&S takes a preventive rolein preserving IAQ by giving input on which chemicals are used forpest control inside and near buildings. EH&S also occasionallyrequests optional “non-compliance inspections” to find problemsbefore they become compliance issues.
15. Employee benefits:
Core benefits for permanentemployees
INTENT:Ensure that all employees and their families have health care andother fundamental benefits.
BENCHMARK:There are three components to the required core benefits:
• Individual benefits• Family/partner benefits• Education benefits
UO PERFORMANCE:Benefits for individuals and families are generally good. The benefitsmirror but are no longer tied tightly to benefits for state employees.The collective bargaining agreements between University and theunions operating on campus provide progressive partner benefits,and faculty and staff can take courses for much-reduced rates.
All employees – including faculty, administrative and academic,janitorial, and food service staff – receive benefits as full timeemployees (see next indicator for details for part time employees).

29Final Report
Good Company © 2002
16. Employee benefits:
Pro-rated benefits for part-timeemployees
INTENT:Ensure that part-time employees with extended employment at theuniversity enjoy benefits that are commensurate with their work,given those benefits extended to full-time employees.
BENCHMARK:Provide pro-rated medical benefits for part-time, non-tenuredemployees whose contracts or employment with the university lastlonger than three (3) months.
UO PERFORMANCE:The University provides benefits for a significant share of employeesworking less than full time. Regular (“classified”) staff are eligible forbenefits with at least half time employment. Full faculty that areemployed at least half time receive full benefits. Instructors (adistinct classification) that are employed at least half time for at leastthree months become eligible for benefits. Staff and faculty thatwork less than half time do not receive benefits.
The collective bargaining agreements between the University andthe unions on campus are important elements in maximizingcoverage for the employees at the University. For example, therestrictions on the category of “temporary employees” and the rulessurrounding “intermittent employees” both reduces the amount oftemporary employment and institutionalizes the recurring short-termemployment relationships so they receive reasonable benefits.

30Final Report
Good Company © 2002
(Indicators 17-20 address Community and Core Function)
17. Curriculum content:
Curriculum for environmentalstudies
INTENT:Encourage universities to provide courses that educate students onmany aspects of sustainability.
BENCHMARK(S):• The university has an Environmental Studies program or its
equivalent, receiving general funding that establishes its on-going presence and independence (i.e., not simply external grantfunding).
• It is possible to meet certain distributional requirements forundergraduates by taking Environmental Studies courses or theirequivalents.
UO PERFORMANCE:UO has a large Environmental Studies program with undergraduatemajors in Environmental Studies and Environmental Science, as wellas MA and Ph.D. programs.
These majors are just two of 77 available to undergraduates, but theyenjoy around 1000 credit-hours of exclusive coursework per quarter(approximately 0.5% of all undergraduate credit-hours).
Additional core courses are drawn from biology, chemistry, physics,and geology, with additional courses that count toward the major indiverse departments such as anthropology, history, geography, andpolitical science. The graduate programs are also highlyinterdisciplinary.
Note: Good Company’s assessment does not cover all courseworkand research relevant to sustainability issues. UO has numerousgraduate-level programs and research institutes of relevance. Ourfocus, however, is on opportunities for focused study, especially forundergraduates.

31Final Report
Good Company © 2002
INTENT:Encourage universities to invest resources in – and vest authoritywith – a campus body devoted to sustainability or environmentalissues in order to create policy and provide leadership.
18. Campus Community andBeyond:
Campus body for addressingenvironmental issues orsustainability issues BENCHMARK(S):
The university has a designated body, preferably one involvingdiverse campus stakeholders, for providing input to theadministration on sustainability issues or environmental issues.
UO PERFORMANCE:The UO Environmental Issues Committee (EIC), formally establishedby the President’s Office in 1991, is an advisory body that reports tothe Vice President for Administration. The EIC has staff, faculty, andstudent participants. It has no official authority.
While the EIC has provided an important organizational tool fordeveloping policy, it lacks formal structure and formal rules forparticipation. Although it enjoys somewhat diverse participation, it isneither a representative body nor a broadly cross-functional one, andstudent participation has been minimal. Furthermore, the committeehas no official administrative status, other than reporting directly tothe Vice President for Administration.

32Final Report
Good Company © 2002
INTENT:Encourage universities to take a coherent and explicit leadership roleon environmental issues.
19. Campus Community andBeyond:
Formal campus environmentalpolicy or sustainability policy BENCHMARK(S):
The university has an explicit environmental policy or sustainabilitypolicy, with some sort of institutionalized mechanism for the policy’srevision and implementation.
UO PERFORMANCE:The University has excellent policies that support and guide (even ifthey do not mandate) more sustainable practices in a variety ofcontexts. A shortcoming is the lack of explicit treatment of humanhealth and safety issues.
A sub-committee of the EIC recommended the creation of theComprehensive Environmental Policy, which was issued in 1997 bythe Vice President for Administration. An important extension of thisis the Sustainable Development Plan, issued by University Planning in2000. These documents address sustainability in a broad manner –including energy and water efficiency, solid waste, hazardous waste,and numerous aspects of campus design and planning.
These policies set a tone for environmental stewardship for thecampus as a whole. They constitute a “higher authority” to whichindividuals can appeal in collective decision-making. However, likeall high-level policies that do not have accompanying rules andregulations, they rely on concerned individuals to invoke them.

33Final Report
Good Company © 2002
INTENT:Encourage universities to plan over a long time frame in areas such asconstruction, housing, and transportation.
BENCHMARK:The university has a long-term plan (with a time horizon of at least 20years, as well as updates at five- or ten-year intervals) thatincorporates detailed plans, forecasts, and guiding developmentcriteria for areas such as construction and renovation for buildingsand open spaces, housing, and various modes of transportation.
20. Campus Community andBeyond:
Long-term plan for campusdevelopment and construction
UO PERFORMANCE:UO’s Long-Range Campus Development Plan articulates clear goalsand parameters for the development of the campus as a physicalspace. It is truly comprehensive, is reviewed and amended regularly,and guides the vast bulk of campus development. The recentlyadopted Sustainable Development Plan articulates sustainabilityprinciples as they relate to the Long-Range Plan.
The Long-Range Plan is a living document with an on-going time-frame; it has a biennial review process that ensures its continuedrelevance. It integrates concerns about the surrounding community,and frames virtually all construction and development.
It appears that the Sustainable Development Plan will have a strongguiding effect on campus development. Nonetheless, it is worthnoting that this plan, like all policies articulated and issues byUniversity Planning, can in some cases be superceded by otherforces, such as the independent actions of campus auxiliaries orspecial projects with independent donors.

34Final Report
Good Company © 2002
Supplementary Indicators
Good Company’s on-going research to improve the Toolkit – and to provide a more thoroughsnapshot of a campus – looks beyond the current core indicators. The Supplementary Indicatorsbelow represent most of the current directions for additional research. There are several reasons thatan indicator or issue is only “supplementary” at this stage and not yet in the core Toolkit:
• Low level of consensus around the issue• Difficulty in defining technologies and strategies• Difficulty in defining benchmarks, especially the long-run target
Supplementary Indicators S-1. Purchasing policy for wood used in construction S-2. Renewable energy purchasing policy for grid-electricity purchases S-3. Low VOC paint S-4. Stakeholder involvement in new construction S-5. Extended benefits and employee assistance programs (EAPs) S-6. “Green chemistry” curriculum and policy for chemistry IAQ S-7. Labor policy for campus licensing S-8. Investment policy for endowment funds S-9. Food procurement and disposal by campus food service units
INTENT:Promote the purchasing of certified sustainably harvested woodproducts in campus construction.
S-1. Campus Operations &Design:
Purchasing policy for woodproducts BENCHMARK:
Wood purchasing must prioritize wood from preferable sources, i.e.wood certified by legitimate certification schemes.
UO PERFORMANCE:The University has no formal policy that encourages, requires, orprovides resources for purchasing sustainably harvested woodproducts for campus construction projects, furniture, or otherapplications of wood products.
This issue will become more important and actionable in the nearfuture. In the follow-up work based on Oregon Governor Kitzhaber’sExecutive Order 00-07, the Sustainable Suppliers Councilrecommended the specification of certified wood in stategovernment purchasing for furniture in the short run. This executivemandate should also remove concerns about the “political” nature ofsuch purchasing criteria.

35Final Report
Good Company © 2002
INTENT:Encourage institutions to use the marketplace to promote renewableenergy.
S-2. Energy:
Renewable energy purchasingpolicy for grid-electricitypurchases BENCHMARK:
• A fixed percentage or amount of electricity purchases fromrenewable sources (wind, salmon-safe hydroelectric, geothermal,solar, etc.)
• A target percentage for future years, or a schedule for a transition
A typical starting target percentage is in the range of 5-20%.
UO PERFORMANCE:UO does not currently make any special efforts to purchase electricitygenerated from renewable sources such as wind power or certifiedsalmon-friendly hydropower.
This issue is both less and more pressing given UO’s circumstances.On the one hand, the generation mix of the local utility, EugeneWater and Electric Board (EWEB), consists in large part ofhydropower, or wholesale electricity purchased from utilities thathave high shares of hydropower in their respective generation mixes(and thus lower greenhouse gas impacts). On the other hand, EWEBoffers a wind power program in which UO could easily participate bypaying a premium (whose proceeds support the construction of awind power facility). In the long run, UO’s support for this programcould help EWEB establish windpower purchasing and therebyguarantee a more stable, lower-impact energy supply.
The student government (ASUO) decided recently to give $100,000toward the purchase and installation of photovoltaic (PV) solar panelsfor the roof of the student union building, the EMU. While the powergenerated will be a small fraction (about 10%) of the electricity usedin the EMU, the symbolic value of this commitment by the studentleaders is enormous. This project is still underway.

36Final Report
Good Company © 2002
S-3. Campus Operations andDesign:
Low VOC paint
INTENT:Encourage the replacement of toxic paints with non-toxicalternatives.
BENCHMARK:• Seek low VOC paints• Include low VOC paint as a preferred alternative in requesting
materials for construction and renovation projects.
UO PERFORMANCE:UO has purchased low VOC paints for the past 10 years. FacilitiesServices staff are aware of chemical sensitivity issues amongindividuals in the campus community, and this concern motivatesthe use of low VOC paint.
INTENT:Promote the inclusion of user groups in the planning and design ofnew campus construction.
S- 4. Campus Operations andDesign:
Stakeholder involvement innew construction BENCHMARK:
The planning processes that guide new construction on the campusinclude formal steps for involving groups of end users forconstruction projects.
UO PERFORMANCE:The Procedure Guide, created by the Planning Office, articulates clearguidelines for involving future building users early in the designprocess for new construction.

37Final Report
Good Company © 2002
INTENT:Promote the quality of life of employees, and assist employees inintegrating their work and non-work lives.
S-5. Employee benefits:
Extended benefits andemployee assistance programs
BENCHMARK:Provide the following options for employees:• Work-family programs• Flexible work arrangements• Child care or day care• Professional development and training• Health-promotion and wellness programs• Legal aid• Resource and referral services• Medical plans that cover alternative medicine
UO PERFORMANCEThe University provides a wide range of extended benefits in severalof the categories listed above for many employees. A partial listincludes:• Work-family programs: seminars, support groups, and other
family-focused employee support.• Flexible work arrangements: flextime, job-sharing,
telecommuting, and compressed workweek.• Child care or day care: on-site child care centers, subsidies for
child care, and before- and after-school programs.• Resource and referral services for child care and elder care
The University received a 2000 Award from the social service non-profit Families in Good Company (not to be confused with GoodCompany of Eugene, the firm preparing this report) for its humanresource practices.

38Final Report
Good Company © 2002
S-6. Curriculum content:
“Green chemistry” curriculumand policy for chemistry IAQ
INTENT:(a) Build awareness and skills of chemistry students to includeenvironmental issues as they relate to chemistry.(b) Policy and process to address Indoor Environmental Quality (IAQ)in organic chemistry laboratories.
BENCHMARK(S):The university’s Department of Chemistry has policies to address thefollowing concerns:(a) Chemistry education typically involves the production of toxicmaterials, far beyond what is necessary from a pedagogicalstandpoint.(b) Outdated laboratory equipment can raise students’ exposures totoxic outputs, especially in organic chemistry courses.
UO PERFORMANCE:The UO Department of Chemistry has a pioneering Green Chemistrycurriculum and launched a new graduate-level program in GreenChemistry this academic year (2001-2002). Numerous professors (7-8) explicitly incorporate Green Chemistry concepts into theirteaching. The Department’s program and graduate students havewon numerous awards in the past several years.
Several laboratories recently underwent renovation with new fumehoods, reducing students’ chemical exposure.
Note: Although Good Company’s assessment generally avoids thespecifics of academic and research units, this supplementaryindicator is intended to capture chemistry’s impact in generatinghazardous waste and in teaching fundamental science to students ina wide range of disciplines.
Additionally, in many laboratory courses, the judicious selection ofexperiments and materials that can lower waste generation andtoxicity while preserving or even enhancing the educationalexperience.

39Final Report
Good Company © 2002
S-7. Campus Community andBeyond:
Labor policy for campuslicensing
INTENT:Encourage campus leadership to demonstrate a commitment to along-term process of addressing labor rights in developing countries.
BENCHMARK:Participate in one of the existing groups currently pursuing labormonitoring and labor standards for garment manufacturing. Thecampus must at least be a nominal participant, but deeperparticipation in the on-going process is necessary to push realchange.
UO PERFORMANCE:The University administration has issued a clear policy on the laborpractices of manufacturers of licensed products. In key details, thepolicy is virtually identical to the codes of conduct of such high-profile organizations as the Fair Labor Association (FLA) and theWorker Rights Consortium (WRC).
Although the University has withdrawn from membership in theWRC, the care and prominence of policy on this issue places it aheadof the mainstream (the combined FLA and WRC memberships totalfewer than 250 institutions, out of more than 3,000 four-year collegesand universities nationwide).
Further progress on this issue will require changes in the industry’spractices, motivated by non-industry stakeholders, especially thosewith bulk purchasing power such as institutions of higher education.
NOTE: Good Company considers this issue to have a lower prioritythan any of the recommendations listed under Areas of Improvementin the Overview of Findings. This judgement is based on ourunderstanding of the University’s overall impacts on society and theenvironment.
S-8. Campus Community andBeyond:
Investment policy forendowment funds
INTENT:Use campus financial strength to demonstrate a commitment to along-term process of addressing social and environmental issues inthe marketplace.
BENCHMARK:Articulate values and criteria (in addition to bottom-line concerns) toguide endowment investment policy.
UO PERFORMANCE:The UO Foundation – the body in charge of investing the University’sendowment funds – has no formal policy or informal practices thatexamine or screen investments based on the social andenvironmental performance of the companies in its portfolio.

40Final Report
Good Company © 2002
INTENT:Reduce food waste and increase local purchasing by food serviceunits on campus.
S-9. Food service:
Food procurement anddisposal by campus foodservice units TECHNOLOGIES/STRATEGIES:
Develop policies and programs to:• Purchase locally produced food wherever possible• Purchase certified organic and fair-trade foods• Reduce food going to waste by partnering with local soup
kitchens and other food recovery programs• Reuse food waste through composting
UO PERFORMANCE:Food Services currently has no policies or programs to support localor organic purchasing. Packaging is not an issue that is examined,though containers are recycled whenever possible. Food Servicesparticipates in local food rescue programs. Food Services isparticipating in a City of Eugene pilot program to test a variety ofcomposting methods.