sustainability economics: where do we stand? sustainability economics: where do we stand? robert u....
TRANSCRIPT

E C O L O G I C A L E C O N O M I C S 6 7 ( 2 0 0 8 ) 2 8 1 – 3 1 0
ava i l ab l e a t www.sc i enced i r ec t . com
www.e l sev i e r. com/ loca te / eco l econ
ANALYSIS
Sustainability economics: Where do we stand?
Robert U. AyresIIASA Laxenburg, AustriaINSEAD Fontainebleau, France
A R T I C L E I N F O
E-mail address: [email protected].
0921-8009/$ – see front matter © 2008 Elsevidoi:10.1016/j.ecolecon.2007.12.009
A B S T R A C T
Article history:Received 12 September 2007Received in revised form8 December 2007Accepted 8 December 2007Available online 22 January 2008
Environmental economics, which is a branch of resource economics – the environment as ascarce resource – is essentially about market failures, the costs of pollution and pollutionabatement, and the economics of regulation. Sustainability economics includes the problem ofmaintainingeconomicgrowth,while reducingpollutionand/or its impacts,withspecial attentionto the linked problems of energy supply (not tomention the supply other exhaustible resources),climate change and –most urgently – fossil fuel consumption. There is a need for integration ofresource and environmental economics under a new rubric, sustainability economics.
© 2008 Elsevier B.V. All rights reserved.
1. Market failures and the cost of pollution
Economists in the first two thirds of the twentieth century wereprimarily concerned with problems of unemployment, invest-ment, growth and fiscal policy. However the importance of landas a resource was recognized as primary by the French physio-crats, and again by Malthus (Malthus, 1946) in the 18th centuryandby JohnStuartMill in the19th century (Mill, 1848). The Journalof Land Economics was founded in 1925. The possible implica-tions of exhaustion of coal, the major energy resource of 19thcentury Britain was explored by Jevons in the 19th century andmanyother since then (Jevons, 1866). Themathematical theory ofdepreciation as applied to exhaustible resources began with thework of Harold Hotelling (Hotelling, 1925, 1931), and modernresource economics took off from there.
Broader economic considerations, such as the problem ofexternalities in welfare theory goes back at least to Pigou (Pigou,1920). This issue received new impetus from the theoretical workof Mishan (Mishan, 1967) and Kneese et al (Ayres et al., 1970) onexternalities. Boulding and Mishan were also among the first tocall attention to the environmental costs of economic growth(Boulding, 1966;Mishan, 1967). However,mainstreameconomistswere slow to recognize the implications of the fact thatmaterialsextracted from the earth and utilized for economic purposes are
er B.V. All rights reserved
not literally ‘consumed’, but become waste residuals that do notdisappear and may cause environmental damage and result inunpaid social costs (Ayres and Kneese, 1969). Another economicaspect of the competitive quest for scarce resources wasemphasized by Garrett Hardin's famous paper “The tragedy ofthe Commons” (Hardin, 1968).1
Environmental economics finally emerged as a recognizedbranch of the discipline around 1970 when the deterioratingstate of the human environment began to achieve headlinestatus. “Earthday” in 1970 marked the creation of theEnvironmental Protection Agency (EPA) in the U.S. andcomparable agencies in other western countries. This wasfollowed quickly by the publication of One Earth by RenéDubos and Barbara Ward (Ward and Dubos, 1972), and the UNStockholm Conference in 1972. The Stockholm conferenceresulted in the institutionalization of environmental concernsat the international level through the creation of an Environ-mental Directorate at the OECD and a new UN agency, UNEP.Fig. 1 indicates the number of new environmental regulationsintroduced in Germany, which exploded starting in the late1960s. The first professional journal in the field, the Journal ofEnvironmental Economics and Management (Academic Press)appeared soon after.
1 This idea led naturally to the idea of a stationary or steady-state economy (Ayres and Kneese, 1971; Daly, 1973)and of course“limits to growth” (Meadows et al., 1972).
.

Fig. 1 – Increasing burden of “top down” regulation cumulative environmental laws enacted in Germany.
282 E C O L O G I C A L E C O N O M I C S 6 7 ( 2 0 0 8 ) 2 8 1 – 3 1 0
The most urgent and visible environmental problems of thefirst seven decades of the twentieth century were local in nature:they included arsenic from copper smelters, cadmium from zincmetallurgy, asbestos, tailpipe emissions from automobiles (and“smog”), carbon monoxide, nitrogen oxides and sulfur dioxideand particulate emissions from coal-burning power plants andindustrial boilers, leademissions fromgasolineandwaterpipes inold buildings, PCBs, mercury, untreated sewage and industrialwastewater, and old industrial dump-sites with toxic wastes. Itwas necessary to change the public perception – a hangover fromthe Great Depression – that smoke from factory chimneys was agood thing, because it meant jobs. Substantial investment wasneeded to cleanupoldmessesand toenforcemeasures to treat orreducewaste emissions fromexisting activities. Hence, the initialapproach to environmental protection at the practical level was
Fig. 2 –Pollution contr
largely limited towhathasbeentermed “endofpipe” treatmentofwastes and pollutants.
Water pollutionwas recognized as a health problem long ago,albeit the role of untreated sewagewas not understood until nearthe end of the 19th century. Chlorination and sewage treatmentwere on the (local) political agenda by then, but economists werenot much interested. Smoke control by means of electrostaticprecipitators (ESP) was the first serious attack on atmosphericpollution. (The technologywas introduced at the beginning of thetwentieth century and was already in fairly general use by 1960.)Carbonmonoxide andother emissions fromcokeovensandblastfurnaces were another early target, partly because they repre-sented inefficient use of the expensive coke. The problem ofsmoke (particulates) and sulfur dioxide emissions from coalcombustion,mainly inpowerplants,wereaddressedby installing
ol costs in the US.

Fig. 3 –Emission reduction vs marginal cost.
2 The pulp and paper industry is a possible exception, in that themost advancedmills have foundways to reducewater, chemical andfuel consumption drastically by internal recycling. However, it isunclear whether these innovations were actually profitable.
283E C O L O G I C A L E C O N O M I C S 6 7 ( 2 0 0 8 ) 2 8 1 – 3 1 0
ESPand fluegasdesulfurization (FGD)unitson thestacks.But, ESPconsumes several percent of the electric power produced by apower plant; while FGD requires substantial quantities of lime-stone or lime as inputs. Both technologies involve significantenergy consumption plus capital costs that added to the price ofsteel, cement and electric power, as indicated by Fig. 2.
Next came regulatory requirements on automobile manu-facturers to include catalytic “convertors” to reduce harmfulengine exhaust components such as carbon monoxide,unburned hydrocarbons and nitrogen oxides. These regula-tions and the controls have been effective in reducing sulfurdioxide (and, later, nitrogen oxide emissions). They also addedseveral hundred dollars – something like 5% – to the price ofeach car. The same tendency for costs to increase non-linearlyholds for sewage treatment plants, incinerators and toxicwaste disposal facilities. Only in the case of waste incinerationwas there any potential for resource recovery or savings, andthis potential has seldom been realized in practice due topersistent engineering problems. Economists began to notice.
Then after considerable debate (and a lawsuit under the CleanAir Act), it was decided in 1973 to eliminate the use of tetraethyllead as an additive to motor fuel in the US. This was partly toprevent the catalytic convertors from being “poisoned”, butmostly because of demonstrable health hazards. The ban onlead cut the octane number of gasoline and increased the cost ofpetroleum refining by at least 10% It also forced auto manufac-turers to reduce compression ratios from 11 to 8 or 9, thusincreasingautomobile fuel consumption.However (US) tetraethyllead consumption was essentially eliminated by the mid-1980'sand ambient air concentrations of lead dropped in parallel.
In recent decades particulate emissions have also signifi-cantly decreased in the industrial world, although the mainreason for this is thewidespread substitution of natural gas forcoal in most small scale uses, especially home heating. Sulfurdioxide emissions appear to have leveled off, or evendecreased slightly. But the potential for abatement of NOx incombustion products is quite limited, and total NOx emissionshave been continuing to increase, despite significant (andcostly) efforts to reduce them. Progress in reducing localized
air and water pollution has been made since 1970, but rarelywithout significant added cost.2
In fact, the cost of pollution control became the centraltheme of environmental economics in the late 1960s and '70s.Perhaps the key insight from those years was that, ifenvironmental damage can be quantified in monetary terms,then the benefits of pollution control can be expressed as anincreasing function of the degree of control, but the marginalbenefits decline toward zero. Meanwhile it is easily demon-strated that both the cost and themarginal cost of control tendsto increase as the degree of control approaches 100%. It followsthat there is always an optimum point where the marginalcost of control is equal to the marginal benefit, and furtherreductions of emissions cost more than they are worth e.g.(Kneese and Bower, 1972). This is shown schematically inFig. 3. It follows from this simple insight that popular ideas like“zero emissions” make as little sense economically as they doin physical terms.
Many environmentalists still have difficulty with this conclu-sion.Theyargue thatenvironmentalharm,andespeciallyhumanlife, cannot be evaluated inmonetary terms and that human life,inparticular shouldhave infinite value. It seems to follow that thebenefits of pollution elimination are beyond price. However,measures to abate or compensate for environmental damages dohave realmonetary costs, and available funds are always limited.It is not possible to spend money for any purpose without limit.Consequently choices must be made and benefit-cost analysis –despite its weaknesses – has become a standard tool ofgovernment.
The next question for economists was: how should theexternal costs be allocated? This aspect of the cost problemhas been addressed as the “polluter pays” principle (PPP),emphasized in many of the international discussions, espe-cially at the Rio Conference (UNEP) in 1992. In principle, it

284 E C O L O G I C A L E C O N O M I C S 6 7 ( 2 0 0 8 ) 2 8 1 – 3 1 0
seems clear that the polluter should pay for the environ-mental harms attributable to pollution. But of course the costswill be passed on to consumers whenever producers are ableto do so, especially in oligopolistic industries.3
In practice, the ‘top down’ regulation by governmentagencies has become increasingly complex and burdensome,albeit necessary. Moreover, the rate of environmentalimprovement has declined, probably because the most cost-effective improvements have been made. By the mid-1980sthe inherent limitations of this ‘end-of-pipe’ approach beganto become clear, especially in regard to regional and globalproblems such as soil acidification and/or toxification, coastaleutrophication, ozone depletion and “greenhouse” warming.These problems are all attributable to emissions that areeither increasingly costly (SOx, NOx, CFCs, heavy metals) ornearly impossible (CO2) to remove from waste streams.4
Another useful insight from neoclassical analysis resultedfrom a controversy on limits following publication of Georgescu-Roegen's book “The Entropy Law and the Economic Process” ;(Georgescu-Roegen, 1971) and the more popular “Limits toGrowth” in 1972 (Meadows et al., 1972). Mainstream economiststook thecontraryposition inaseriesofpaperse.g. (Solow,1974a,b;Dasgupta and Heal, 1974; Stiglitz, 1974, 1979). These papers ad-dressed the question: does increasing physical scarcity implyincreasing economic scarcity? They all assumed that resourcesare privately owned and traded in efficient markets, includingforward markets between generations. They also assumed con-tinuing exogenous technological improvements, allowing econo-mic growth to continue despite diminishing returns toinvestment. Many of these assumptions have been challenged,of course, especially in this journal.
The major insight from these papers was that, subject to theunderlying assumptions (perfect competition, perfect informa-tion, etc.) the answer to the question that was posed depends onwhether the elasticity of substitution between the resource andcapital (including human capital) is large enough. The immediateimplication was that worries about impending resource exhaus-tion were probably overblown. Powerful – if anecdotal – supportsoon appeared e.g.(Goeller andWeinberg, 1976; Kahn et al., 1976;Kahn, 1984). Econometric support for the 'unlimited substitutionview was also found by some researchers, such as Weitzman(Weitzman, 1997, 1999). In principle, it has been widely acceptedbyeconomists that scarcity isnot an immediateproblemand thatcapitalmaybe substituted formost physical resources, at least upto some point that might be quite far in the future.5
3 Inacompetitive freemarket, thisalsodependsontheelasticitiesofdemand and supply. If the elasticity of demand is large enough, costsare likely to be borne by producers (through reduced profits), whereasif demand is inelastic, consumers will pay. Costs can be passed on toconsumers as fees, in some cases, such as sewer or refuse collectionservices.4 The notion of removing and sequestering carbon dioxide from
power plant flue gases has been given serious consideration in recentyears, butwhile is technically feasible for large coal or gas firedelectricpower plants, it will be very costly and is not applicable to any of thesmaller combustion sources such as motor vehicles.5 The evidence that has emerged in recent years, especially with
regard to oil and gas depletion, is much less supportive of theoptimistic view.
A second important insight from these studies and othersin that period was that exhaustible resources may actuallypose less serious problems than so-called ‘renewables’ e.g.(Wilson, 1989; La Riviere, 1989; Postel, 1989; Wang, 1989;Frederick and Gleick, 1990; Gleick, 1992; Ayres, 1993b; Raskinet al., 1994; Heywood and Watson, 1995; Gowdy, 1997). Thereason is that most renewables, including air, fresh water,favorable climate and biodiversity (especially in tropicalforests), are public goods, not traded in markets. Henceenvironmental damage has the character of an externalityand – lacking market mechanisms to assure that the “polluterpays” – regulatory means of abatement or compensation areneeded. Moreover, a further insight is that, absent adequateresource policy, technological change is likely to accelerate therate of environmental degradation e.g. (Smulders, 1998, 2000).
Global problems like ozone depletion and climate warmingare examples of public goods (or bads) that cannot even beaddressedat the local ornational level.Onepartial success storyhas been the reduction and hopefully total elimination ofcertain chloro-fluorocarbons (CFCs) that were formerly usedvery extensively as propellants for aerosol sprays, industrialsolvents and – especially – as refrigerants. The ban on usingCFCs in aerosols was enforced first in the US, starting in 1974,because the cost of switching to substitute propellants wasrelatively trivial. It was extended to refrigerants whenfeasible alternatives had been developed and ‘globalized’ atthe Montreal convention in 1987. Unfortunately, there was aloophole in the Montreal Protocol, which allowed developingcountries, notably China and India to continue to manufactureone of the CFCs (CFC-22) for refrigerators and air-conditioners,until 2016. It seems that production of this chemical – especiallyby China – has accelerated by many orders of magnitude since1987. This has seriously undermined international efforts toreduce ozone depletion, as well as contributing significantly toclimatewarming.CFCsare thousandsof timesmorepotent thancarbondioxideandtheother so-calledgreenhousegases (GHGs).
In any case, at the global level there has been virtually noprogress in reducing most greenhouse gases, especiallycarbon dioxide. The Kyoto Protocol is only a small first step,with primarily symbolic significance.
2. Emissions reduction and economic growth
The possibility that pollution would inhibit economic growthdirectly (albeit inunspecifiedways)was suggested in the report tothe Club of Rome entitled “Limits to Growth” by Meadows et al(Meadows et al., 1972). However, except for supposed scarcityproblems, specificmechanisms for this supposed feedback effectwere not discussed in that report, and have not been discussedsubsequently except insofar as the costs of governmentmandatedpollution control or treatment affect the prices of goods. The costissue was noted in the previous section. In other words, thecurrent stateof economicandenvironmental sciencedidnot (andstill does not), encompass more subtle indirect impacts ofpollution on economic growth, at least in the industrial world.
The first major recognition of the issue at the officialinternational level was the creation by the UN GeneralAssembly in 1985 of the Commission for Sustainable Devel-opment, chaired by the Prime Minister of Norway, Mrs

285E C O L O G I C A L E C O N O M I C S 6 7 ( 2 0 0 8 ) 2 8 1 – 3 1 0
Brundtland. The commission's report “Our Common Future”tried to make the case that environmental protection is anessential element of economic development because theenvironment is an essential “factor of production” and sourceof important welfare services to people, even more so in poorcountries than in wealthy countries (Brundtland, 1987). Herethe impact mechanism was also not spelled out, but itpresumably was intended to include such things as acidifica-tion, eutrophication, loss of bio-diversity and climate change.
The Brundtland Report popularized the notion of long-term‘sustainable development’, which has since become a cliché insome circles. (In fact, the termhas been twisted bymany interestgroups, including organizations focused on economic develop-ment, to mean something close to the opposite of its originalintent, i.e. continuous development). One widely acceptedprerequisite of long-term ecological sustainability, however, isthe reduction of anthropogenic pressures on the environment.Thesepressures ariseprimarily fromextractionandprocessingofnatural resources and using the environment as a sink for thedisposal of waste effluents and ‘garbojunk’. The BrundtlandReportdidnote the “continuingdilemma”ofdependenceonfossilfuels (op cit pp 174–177) as well as the loss of bio-diversity. Therecent literature on sustainable development has been reviewedin a special issue of this journal (vol. 63 no.4).
3. Resource and environmental implications ofeconomic growth
The impact of economic growth on the environment hasreceived considerable recent attention in the literature. Thereare some who emphasize the positive aspects, notably JulianSimon (Simon, 1980, 1981) and, more recently, Lomborg(Lomborg, 2004, 2001). These writers (and others of theirpersuasion) argue that economic growth is neutral or evengood for the environment because technological substitutionwill quickly solve any problems and the alleged problems areall grossly exaggerated. I cannot take these arguments veryseriously, though media organs such as The Economist andWall Street Journal are great admirers.
But there are other more optimists from a differentperspective. One of the ‘stylized facts’ of long term economicgrowth and development, that attracted renewed attention inthe 80's and90's, is the so-called ‘EnvironmentalKuznets’Curve(EKC), based on the E/GDP ratio. 6 Some development econo-mists, especially at the World Bank, have elaborated anargument to the effect that environmental pollution reductionis a ‘superior good’ and that it will occur automatically as poor
6 For early work see (Kuznets, 1930, 1963). The history energyconsumption per unit of GNP for the U.S. was first calculated in detailby (Schurr and Netschert, 1960), based on Kuznets' estimates of GNPfor the years before 1910 and Kuznets–Kendrick's estimates of GNP in1929 prices (Kendrick, 1961), updated in terms of 1958 prices by theBureau of Economic Analysis (BEA) for later years, based on NationalIncomeandProductsAccounts of theUnited States 1929–1965(Bureauof Economic Analysis, 1965). For the more recent work involving theso-called Environmental Kuznets Curve (EKC), see (World Bank, 1992;SeldenandSong,1994;Beckerman,1995;GrossmanandKrueger, 1995;Stern et al., 1996). The empirical evidence casting doubt on the EKChypothesis has recently been summarized by Stern (Stern, 2004).
countries grow richer. The general idea is that increased wealth(i.e. GDP per capita) allows countries to afford more environ-mental protection. It is supported by empirical evidence thatcertain types of pollution tend to be worse in poor countries.This correlation applies especially to sulfur oxides and particu-lates, as well as all sorts of waterborne pollutants, but not forCO2. However the likely explanation for at least part of theapparent correlation is that poor countries necessarily utilizepoorer quality fuels, such as charcoal, and use theminefficiently.
On the other hand, it is true that more industrializedcountries are more likely to construct water and sewagetreatment facilities and mandate the installation of equip-ment such as electrostatic precipitators (ESP) and flue gasdesulfurization. It is also evident that the limited successesthat have been achieved since the 1960s are almost exclu-sively to be found in the richest countries, especially the US,Japan and Western Europe.
It has to be said that the EKC argument can be – and hasbeen – used to justify perverse development strategies. Themost worrisome is the argument by some conservatives to putwealth creation at the top of the priority list, while deferringserious and presumably costly attempts to control or regulateGreenhouse Gas (GHG) emissions until a future generationwhich will (hopefully) by much richer and hence more able toafford such investments. The perverse implication for industry,of course, is that development aid to poor countries cancontinue to focus on infrastructure for raw material extractionandneednot includeprovisions for environmentalprotection inan “under-polluted” environment, a crude justification of pastpractices. Moreover, it is an empirical fact – known in somequarters as the ‘curse of oil’ – that resource exporters have,almost without exception, failed to develop economically.7 Inmost cases it appears that most of the oil or gas wealth issiphoned off by the international mining/drilling firms (espe-cially oil companies) and/or by corrupt officials.
Nevertheless, it is also a fact that a number of developingcountries depend upon the export of raw materials, rangingfrom petroleum to uranium, chrome, copper or gold, for muchof their national income. Hence serious attempts by countriesin the industrializedWest to reduce their consumption of suchmaterials – by energy conservation or accelerated ‘demater-ialization’ – would have adverse economic impacts on thoseexporters. It is no accident that the middle-eastern oilexporters and Australia were the strongest opponents (apartfrom the US) of the Kyoto Protocol. Moreover, it is clear thatrigorous environmental protection in a country like China orIndia will involve significantly increased costs of production,either for domestic consumption or export, and, hence,constitute a drag on economic growth.
More recently, the notion of “sustainable consumption” hasemerged, to reflect the recognition that consumptionofphysicalmaterials and energy derived from non-renewable fuels cannotexceed some finite limits imposed by the carrying capacity ofthe Earth. The biosphere can only absorb a limited amount of
7 The only exceptions in recent years have been the countriesbenefitting from North Sea oil and gas, especially Norway, GreatBritain and the Netherlands. All of these countries were alreadyindustrialized before the resource bonanza was discovered.

Fig. 4 –Historical and projected global sea level rise: 1900–2100.
286 E C O L O G I C A L E C O N O M I C S 6 7 ( 2 0 0 8 ) 2 8 1 – 3 1 0
waste products (including, but not limited to CO2) associatedwith the extraction, processing and disposal of materials. For arecent survey of this literature see Jackson (Jackson, 2007).
There are indications that some limits are not far away. Infact, given the slow response of complex systems to perturba-tions, it is possible that the long-term carrying capacity of theEarth/biosphere have already been exceeded, at least in someregions and biomes. Biodiversity is unquestionably and evermore rapidly decreasing, especially in the tropics.Moreover, it is
Fig. 5 –Effects of predicted population growth on worldwide useare maintained (1990=100%).
now clear to all but the self-deluded that the global climate hasalready started to change and that the process is accelerating.These changes will affect all countries, the poorest most of all.Recent experiencewith increasingly powerful storms illustratesthe point: poor countries like Sri Lanka, Bangladesh, Indonesiaand the Philippines are much less able to prevent or recoverfrom floods and landslides than Western Europe or the US. Sealevel rise (Fig. 4) will affect countries like the Maldives,Bangladesh, Indonesia, Viet Nam, thee Philippines, China and
of resources if current consumption and production patterns
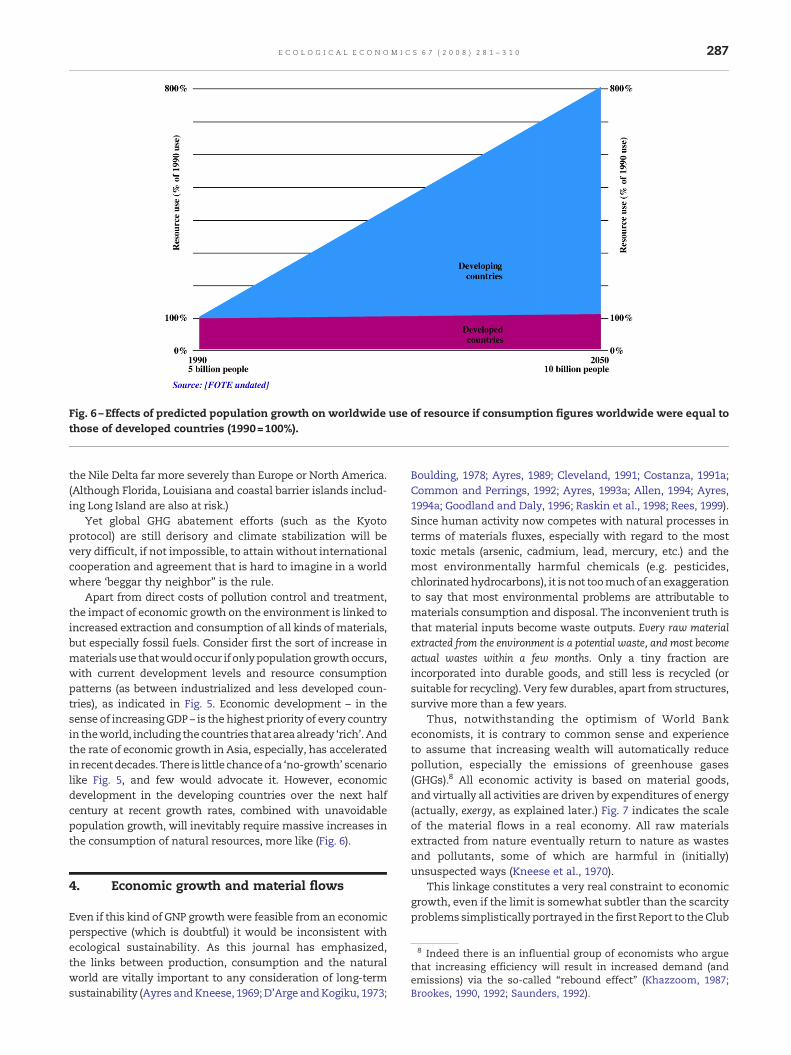
Fig. 6 –Effects of predicted population growth on worldwide use of resource if consumption figures worldwide were equal tothose of developed countries (1990=100%).
287E C O L O G I C A L E C O N O M I C S 6 7 ( 2 0 0 8 ) 2 8 1 – 3 1 0
the Nile Delta far more severely than Europe or North America.(Although Florida, Louisiana and coastal barrier islands includ-ing Long Island are also at risk.)
Yet global GHG abatement efforts (such as the Kyotoprotocol) are still derisory and climate stabilization will bevery difficult, if not impossible, to attain without internationalcooperation and agreement that is hard to imagine in a worldwhere ‘beggar thy neighbor” is the rule.
Apart from direct costs of pollution control and treatment,the impact of economic growth on the environment is linked toincreased extraction and consumption of all kinds ofmaterials,but especially fossil fuels. Consider first the sort of increase inmaterialsuse thatwouldoccur if onlypopulationgrowthoccurs,with current development levels and resource consumptionpatterns (as between industrialized and less developed coun-tries), as indicated in Fig. 5. Economic development – in thesense of increasing GDP – is the highest priority of every countryin theworld, including thecountries thatareaalready ‘rich’. Andthe rate of economic growth in Asia, especially, has acceleratedin recentdecades. There is little chanceofa ‘no-growth’ scenariolike Fig. 5, and few would advocate it. However, economicdevelopment in the developing countries over the next halfcentury at recent growth rates, combined with unavoidablepopulation growth, will inevitably require massive increases inthe consumption of natural resources, more like (Fig. 6).
8 Indeed there is an influential group of economists who arguethat increasing efficiency will result in increased demand (andemissions) via the so-called “rebound effect” (Khazzoom, 1987Brookes, 1990, 1992; Saunders, 1992).
4. Economic growth and material flows
Even if this kind of GNP growthwere feasible from an economicperspective (which is doubtful) it would be inconsistent withecological sustainability. As this journal has emphasized,the links between production, consumption and the naturalworld are vitally important to any consideration of long-termsustainability (Ayres andKneese, 1969; D'Arge andKogiku, 1973;
Boulding, 1978; Ayres, 1989; Cleveland, 1991; Costanza, 1991a;Common and Perrings, 1992; Ayres, 1993a; Allen, 1994; Ayres,1994a; Goodland and Daly, 1996; Raskin et al., 1998; Rees, 1999).Since human activity now competes with natural processes interms of materials fluxes, especially with regard to the mosttoxic metals (arsenic, cadmium, lead, mercury, etc.) and themost environmentally harmful chemicals (e.g. pesticides,chlorinatedhydrocarbons), it isnot toomuchof anexaggerationto say that most environmental problems are attributable tomaterials consumption and disposal. The inconvenient truth isthat material inputs become waste outputs. Every raw materialextracted from the environment is a potential waste, and most becomeactual wastes within a few months. Only a tiny fraction areincorporated into durable goods, and still less is recycled (orsuitable for recycling). Very few durables, apart from structures,survive more than a few years.
Thus, notwithstanding the optimism of World Bankeconomists, it is contrary to common sense and experienceto assume that increasing wealth will automatically reducepollution, especially the emissions of greenhouse gases(GHGs).8 All economic activity is based on material goods,and virtually all activities are driven by expenditures of energy(actually, exergy, as explained later.) Fig. 7 indicates the scaleof the material flows in a real economy. All raw materialsextracted from nature eventually return to nature as wastesand pollutants, some of which are harmful in (initially)unsuspected ways (Kneese et al., 1970).
This linkage constitutes a very real constraint to economicgrowth, even if the limit is somewhat subtler than the scarcityproblems simplistically portrayed in the first Report to theClub
;

Fig. 7 –The US economic system as a whole from a mass flow perspective (1993 in MMT).
288 E C O L O G I C A L E C O N O M I C S 6 7 ( 2 0 0 8 ) 2 8 1 – 3 1 0
of Rome (Meadows et al., 1972) and derided by its critics(Nordhaus, 1973b; Solow, 1973, 1974a,b). Nevertheless someenvironmentalists, e.g. at the Wuppertal Institute, haveproposed that the total worldwide consumption of allmineralsaswell as fossil fuels should be stabilized (Schmidt-Bleek, 1992;Schmidt-Bleek, 1994). But allowing for inevitable global popu-lation growth, which will certainly increase by around 50% inthe next 50 years, and allowing for economic growth in thenon-industrialized countries, especially China, South Asia,andAfrica, stabilization at the global level can only be achievedby sharp reductions in the consumption of materials in theindustrialized West. One recent book suggests a reductionfactor of four (von Weizsaecker, Lovins, and Lovins, 1994).Others, like Schmidt-Bleek suggest the need for an even moredramatic ten-fold reduction (Factor Ten Club, 1994 and 1997).In short, wemust aim for a pattern of economic growth that isconsistent with a materials consumption scenario like Fig. 8.
Whether the appropriate divisor is four or ten does notmatter so much as the fact that any reduction at all means amajor “U-turn” in both economic development and environ-mental strategy (Ayres, 1996, 1998). But, the question is: what(if any) are the feasible ways and means of achieving this sortof outcome? End of pipe treatment is an essential first step butit cannot achieve the necessary reductions, especially ofGHGs. In recognition of this fact a new ‘bottom up’ way ofthinking about emissions reduction began to emerge in themid-1980s. It has been variously called “source reduction”,“waste reduction”, “cleaner production”, “low-waste” (or “non-waste”) technology, “design-for-environment” or DFE, “dema-terialization”, “industrial ecology”, “eco-efficiency” and (inChina) ‘circular economy’.
There are significant differences among these approaches.For instance, “waste reduction” emphasizes energy conserva-tion and materials utilization efficiency. “Cleaner production”emphasizes technical change that reduces emissions at thesource, such as the (classic) example of substituting watersoluble paints and cleaning agents for coatings and cleaningagents requiring volatile hydrocarbons or chloro-fluorocar-bons. DFE emphasizes the potential for reducing wastes bymaking products more repairable, more remanufacturable, ormore recyclable. “Dematerialization” is focused on reducingthe mass of materials used in production, by miniaturizationor substitution of services for products. Industrial ecologyemphasizes the potential for recycling wastes from oneindustry as feed-stocks to another, in analogy to the carbon–oxygen cycle. (Oxygen is a waste product of photosynthesis,while carbon dioxide is a waste product of animal respiration).“Eco-efficiency” differs from the others in that it is beingdeveloped and presented explicitly by businessmen – notablythe World Business Council for Sustainable Development, orWBCSD – as a strategy for business (Schmidheiny, 1992;Fussler, 1996). Whereas the other approaches are typicallydefined by an outcome, eco-efficiency is a conceptmore firmlybased on a business perspective. A business cannot survivewithout making a profit. This implies that a basic businessapproach is to increase the value-added to customers per unitof materials/energy input. This means that for every incrementof added cost, value to customers must increase as much ormore.
Proponents of eco-efficiency like Fussler (ibid) or Lovins(Lovins et al., 1981; Lovins and Lovins, 1991) argue that thereare many “win-win” opportunities for value creation that are
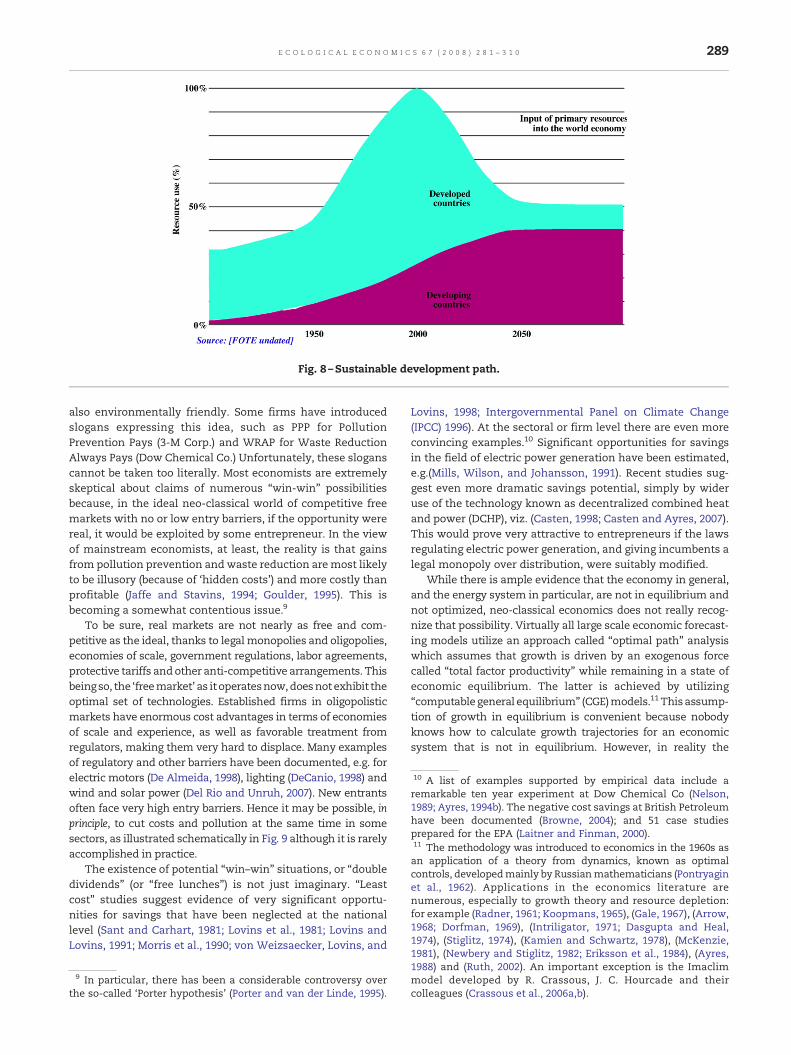
Fig. 8 –Sustainable development path.
11 The methodology was introduced to economics in the 1960s asan application of a theory from dynamics, known as optimalcontrols, developedmainly by Russianmathematicians (Pontryaginet al., 1962). Applications in the economics literature arenumerous, especially to growth theory and resource depletion:for example (Radner, 1961; Koopmans, 1965), (Gale, 1967), (Arrow,1968; Dorfman, 1969), (Intriligator, 1971; Dasgupta and Heal,1974), (Stiglitz, 1974), (Kamien and Schwartz, 1978), (McKenzie,
10 A list of examples supported by empirical data include aremarkable ten year experiment at Dow Chemical Co (Nelson,1989; Ayres, 1994b). The negative cost savings at British Petroleumhave been documented (Browne, 2004); and 51 case studiesprepared for the EPA (Laitner and Finman, 2000).
289E C O L O G I C A L E C O N O M I C S 6 7 ( 2 0 0 8 ) 2 8 1 – 3 1 0
also environmentally friendly. Some firms have introducedslogans expressing this idea, such as PPP for PollutionPrevention Pays (3-M Corp.) and WRAP for Waste ReductionAlways Pays (Dow Chemical Co.) Unfortunately, these sloganscannot be taken too literally. Most economists are extremelyskeptical about claims of numerous “win-win” possibilitiesbecause, in the ideal neo-classical world of competitive freemarkets with no or low entry barriers, if the opportunity werereal, it would be exploited by some entrepreneur. In the viewof mainstream economists, at least, the reality is that gainsfrom pollution prevention andwaste reduction aremost likelyto be illusory (because of ‘hidden costs’) and more costly thanprofitable (Jaffe and Stavins, 1994; Goulder, 1995). This isbecoming a somewhat contentious issue.9
To be sure, real markets are not nearly as free and com-petitive as the ideal, thanks to legal monopolies and oligopolies,economies of scale, government regulations, labor agreements,protective tariffs andother anti-competitive arrangements. Thisbeingso, the ‘freemarket’as itoperatesnow,doesnotexhibit theoptimal set of technologies. Established firms in oligopolisticmarkets have enormous cost advantages in terms of economiesof scale and experience, as well as favorable treatment fromregulators, making them very hard to displace. Many examplesof regulatory and other barriers have been documented, e.g. forelectric motors (De Almeida, 1998), lighting (DeCanio, 1998) andwind and solar power (Del Rio and Unruh, 2007). New entrantsoften face very high entry barriers. Hence it may be possible, inprinciple, to cut costs and pollution at the same time in somesectors, as illustrated schematically in Fig. 9 although it is rarelyaccomplished in practice.
The existence of potential “win–win” situations, or “doubledividends” (or “free lunches”) is not just imaginary. “Leastcost” studies suggest evidence of very significant opportu-nities for savings that have been neglected at the nationallevel (Sant and Carhart, 1981; Lovins et al., 1981; Lovins andLovins, 1991; Morris et al., 1990; von Weizsaecker, Lovins, and
9 In particular, there has been a considerable controversy overthe so-called ‘Porter hypothesis’ (Porter and van der Linde, 1995).
Lovins, 1998; Intergovernmental Panel on Climate Change(IPCC) 1996). At the sectoral or firm level there are even moreconvincing examples.10 Significant opportunities for savingsin the field of electric power generation have been estimated,e.g.(Mills, Wilson, and Johansson, 1991). Recent studies sug-gest even more dramatic savings potential, simply by wideruse of the technology known as decentralized combined heatand power (DCHP), viz. (Casten, 1998; Casten and Ayres, 2007).This would prove very attractive to entrepreneurs if the lawsregulating electric power generation, and giving incumbents alegal monopoly over distribution, were suitably modified.
While there is ample evidence that the economy in general,and the energy system in particular, are not in equilibrium andnot optimized, neo-classical economics does not really recog-nize that possibility. Virtually all large scale economic forecast-ing models utilize an approach called “optimal path” analysiswhich assumes that growth is driven by an exogenous forcecalled “total factor productivity” while remaining in a state ofeconomic equilibrium. The latter is achieved by utilizing“computablegeneral equilibrium” (CGE)models.11 Thisassump-tion of growth in equilibrium is convenient because nobodyknows how to calculate growth trajectories for an economicsystem that is not in equilibrium. However, in reality the
1981), (Newbery and Stiglitz, 1982; Eriksson et al., 1984), (Ayres,1988) and (Ruth, 2002). An important exception is the Imaclimmodel developed by R. Crassous, J. C. Hourcade and theircolleagues (Crassous et al., 2006a,b).

Fig. 9 –Emission reduction vs marginal cost.
290 E C O L O G I C A L E C O N O M I C S 6 7 ( 2 0 0 8 ) 2 8 1 – 3 1 0
economy isnever in equilibrium (see (Kaldor, 1971; Kaldor, 1972;Kornai, 1973)), so that simplification is somewhat like lookingfor a lost key under the streetlight, or assuming a spherical cow.
12 See article in the Encyclopedia of Energy (Cleveland, 2004); alsowww.lesjones.com/posts/003223.shtml.
5. Sustainability implications ofeconomic growth
Unfortunately, radical dematerialization is not a likely con-sequence of either end-of-pipe waste treatment, or of asystematic search for “win-win” opportunities to useresources more efficiently while producing the same productsas before. The problem is that economic growth along itscurrent trajectory demands more – and more – materialproducts.
For instance, consider the private automobile. Worldwidedemand continues to grow, not only in absolute terms, butfaster than population growth. In other words, the number ofautomobiles per thousand human beings is growing also. Thistrend is good news if you are an automobile manufacturer likeFord or GM with large investments in plant and equipment,and (of course) you are seeking to increase revenues andprofits. It is equally good news if you are in the oil business,like Exxon, Shell or BP, with large investments in tankers,refineries, pipelines and so on.
However these trends are very badnews if you start to thinkabout the global environmental impact. It is easy to see thatthere are widespread implications for highway construction,loss of valuable farmland, petroleum consumption, air pollu-tion, and so on. Such calculations, and questions, are essentialaspects of the “life cycle” perspective. But they are notnormally part of a corporate manager's portfolio of concerns.Even if the CEO (of GeneralMotors or Exxon-Mobil for instance)recognizes the problem, a life cycle analysis offer little or noguidance as to how an individual firm should behave. This isbecause the incentives for the CEO and other managers of thefirm require themto seekbiggermarkets for their product, or to
make bigger and more costly products, even though the endresult – if they succeed – will be disastrous for everybody.
Consumers andworkers also depend upon growth, becausepublic services, including social security, are funded by taxes,not by savings.Without economic growth the tax revenueswillnot grow fast enough to satisfy the demand for pensions andhealth services that have been promised to a growingpopulation of retirees. The fraction of non-working hours ascompared to working hours, increases rapidly as birth-ratesdecline and life expectancy increases. For this reason alone,governments of the richer democracies are addicted to growth.
In short, none of the important economic actors, whethergovernment leaders or private sector executives, has anincentive compatible with a ‘no growth’ policy. No economicgrowth is evidently not a politically viable proposition for ademocracy, at least in a world with enormous gaps betweenpoverty and wealth. But ‘no growth’ is an imperative asregards extractive materials, energy and pollution emissionsbecause economic activity is based on a material foundation.
The prospect of physical resource depletion – probablybeginning with petroleum (and natural gas soon after) – adds afurther complication. The dates of ‘peak oil’ output are amatter of dispute, but there is no doubt that it will happen,whether in five or twenty-five years. There is also no doubtthat the gap between supply and demand for light oil caneventually be met at some price by some combination ofalternatives, including heavy oils, tar sands, shale, coalliquefaction, or bio-fuels. However every one of these optionsinvolves higher costs and lower energy-return-on-investment(EROI).12 The clear implication of lower EROI is that (1) eithermore energy must be expended in producing the sameamount of exergy or useful work, leaving less for otherconsumptive purposes, or (2) overall extraction of primary

Fig. 10 –Towards the spaceship economy: three stages in eco-efficiency.
291E C O L O G I C A L E C O N O M I C S 6 7 ( 2 0 0 8 ) 2 8 1 – 3 1 0
fuels or biomass to support economic growth must increaseeven faster than it has in the past.
Evidently a new and radically different developmenttrajectory is needed. Some would call it a new paradigm. Ourhistorical emphasis on the use of fossil fuels to increase laborand capital productivity is no longer appropriate. We mustconcentrate, in the future, on increasing resource productivity.In effect, goods must be converted as much as possible intoservices, and services must be delivered with the minimumpossible requirement for material and energy inputs. Thechanges involved will not be marginal.
Let me summarize up to this point with another diagramFig. 10. This figure shows schematically the limits of eco-efficiency as applied to themanufacturing economy, vis a vis apure service economy. It is convenient and evocative to labelthe latter as the “spaceship” – or “zero-emissions” – economy,inasmuch as it is an economy in which all materials that areintrinsically scarce must be recovered, repaired, reused, re-manufactured or – as a last resort – recycled. In the ultimatespaceship (or circular) economy thematerial cycle would haveto be closed, or nearly so. On the other hand, such an economymust be extremely energy-(exergy)-intensive. Are thereenough non-polluting sources of energy? The answer isprobably ‘yes’ at least in the long run. Nuclear fusion power,or photovoltaic power generatedon themoonand sent to earthby microwave could add significantly to current options. But avery important preliminary question now arises: can radicalde-materialization by sharply increasing resource productivitybe accomplished without sacrificing economic growth andmaterial comfort?
This is another contentious but essential question. As I havenotedalready,mainstreamneoclassical economistsdonotacceptthe idea that there is a strong causal link between growth andenergy consumption. The lack of such a link implies that energyconsumption may be cut drastically without adversely affectingeconomic growth. This skepticism is a consequence of some ofthe convenient – but not necessarily factual – assumptions
underlyingstandardeconomicmodels. The last section returns tothis issue.
6. Bio-economics:weakvs. strongsustainability
The need for integrating ecological and environmental pro-cesses in the economicmodels – they are already integrated inthe real economy – has been recognized by some scholars formany years, certainly since Boulding (Boulding, 1978). Thecreation of this journal can be regarded as evidence of thespread of ‘eco-sensibility’ among a few economists, viz.(Costanza, 1991b,c; Toman, 1994; Toman and Crosson, 1991;Common and Perrings, 1992; Ayres, 1993b; Goodland and Daly,1996). One key insight that has emerged is that there are anumber of services of nature that cannot, even in principle, bereplaced by man-made capital or human labor. This isthe essence of what is meant by “strong sustainability” aselaborated by a number of authors, including (Guts, 1996;Gowdy and O'Hara, 1997; Goodland, 1999; Ayres et al., 2001;Ayres, 2001; Pezzey and Toman, 2002; Neumayer, 2003).
Yet strong sustainability is a controversial position, inas-much as it has been explicitly contradicted by a number ofreputable mainstream economists, who argue that humaningenuity and man-made capital can indeed replace virtuallyall such services. Eminent economists on this side of theargument include Solow (Solow, 1992) and Pearce (Pearce,1997), andprobably JulianSimon (thoughhedidnot discuss thetopic explicitly) (Simon, 1981). The key question, then is: whatare the possibilities and limits of substitutability, not onlybetween capital, labor and energy but also between differenteconomic activities ranging from shelter to food and commu-nication, and between human labor and man-made capitaland other services of nature, from fresh water and clean air totopsoil and bio-diversity. There is some room for dispute as tothe possibilities for substitution in the very long run, but verylittle doubt that substitutability between sectors as well as

292 E C O L O G I C A L E C O N O M I C S 6 7 ( 2 0 0 8 ) 2 8 1 – 3 1 0
between factors, is extremely limited in the short to mediumterm (Ayres, 2006).
The plain implication of this fact is that productionfunction models of the single sector, single product variety –whether Cobb–Douglas, CES or trans-log – cannot adequatelyreflect the problems of scarcity. Any production function oftwo or three variables that satisfies the usual conditions,(constant returns, maximization, integrability and equili-brium) must allow any combination of the variables, andconsequently it must admit perfect substitution among them.Non-substitutability can only be expressed by an Input-Output type of model, and such models are normally static.They can be made dynamic, in practice, only by attaching amacro-driver that determines future demand. But of coursetechnological progress and innovation must be exogenous tosuch a model. Moreover, there are no financial transactionsamong natural services, so the only medium of exchangecommon to all sectors must be exergy.
The flow of energy among natural systems has beenstudied by many authors, at least since the pioneering workof Lotka (Lotka, 1950) andmore recently Odum, Ulanowicz andothers (Odum, 1973, 1986; Ulanowicz, 1986). Given thedifficulties, it is not surprising that the possibility of introdu-cing the services of nature explicitly in a formal I-O frameworkhas not been developed very far. I only know of one earlyattempt (Crocker and Tschirhart, 1992).
13 I am reminded of the Aristotelian physics where everycompound was assumed to consist of some combination of thefour elements, fire, water, earth and air.
7. Need for a new energy-economic paradigm
A macro-economic perspective can help to clarify the deeperquestion at issue here. The starting point may as well be therelationship between economic activity and the larger physi-cal–biological environment in which it is embedded. At onetime economics textbooks were inclined to conceptualizeeconomic activity as a closed loop between abstract produc-tion, abstract consumption and investment. The system thusdescribed is supposed to be self-organized and capable ofgrowth, but such that every product is produced from otherproducts within the system e.g.(von Neumann, 1945; Sraffa,1960). In this paradigm growth is assumed to occur withoutany inputs of energy or materials from outside the system. Aspointed out long ago by Georgescu–Roegen, this modeleconomy is an immaterial perpetual motion machine, inviolation of both of the laws of thermodynamics (Georgescu-Roegen, 1971). Readers of this journal generally agreewith thatcritique.
The connection with real material objects and the physicalworld from which materials are extracted, processed, madeinto products and finally disposed of, was never considered tobe an essential aspect of mainstream neo-classical economicsuntil forty years ago (Kneese, Ayres, and d'Arge, 1970;Nordhaus, 1973a; Jorgenson and Houthakker, 1973; Dasguptaand Heal, 1974; Solow, 1974a; Allen et al., 1976; Allen, 1979).Even now, the essentiality (i.e. non-substitutability) of energy(exergy) as a factor of production is ignored in the greatmajority of economics textbooks and research papers. How-ever, it must be acknowledged that most environmentaleconomists are well aware of the importance of materialsand energy in the economic system, while generally assuming
that these inputs are “produced” by applying capital and laborto natural resources.13
In contrast to the closed perpetual motion machinedescribed above, the real economy is essentially a large-scalematerials processing system, largely powered (for the present)by machines using fossil fuels that were created and stored inthe earth's crust hundreds of millions of years ago. Virtuallynone of the materials consumed by the economy are recycledat present. The basic engine of economic growth in a mass-production manufacturing economy is the positive feedbackcycle, shown in Fig. 11. In brief, the impetus to growth arisesfrom the fact that demand for a product tends to increase as(real) prices fall. This phenomenon is called the ‘priceelasticity’ of demand. Falling prices, in turn, result fromexploiting economies of scale in manufacturing. Thus, firmscan reduce costs, cut prices, increase sales and maximizeprofits (and grow) by increasing the scale of production. Soever greater consumption of resources is, ipso facto, a driver ofgrowth in this paradigm: consumption (leading to investmentand technological progress) drives growth, just as growth andtechnological progress drives consumption.
In effect, a new growth engine is needed, based on non-polluting energy sources and selling non-material services,not material products. One of the progenitors of the idea of“products as service” is Michael Braungart, founder of theEnvironmental Protection Encouragement Agency (EPEA) inHamburg, Germany. Braungart calls his scheme the “Intelli-gent Product System” or IPS (Braungart et al., 1990; Braungartand Engelfried, 1992). The system recognizes three types ofproducts. The first type is consumables, which are eitherliterally consumed or are biodegradable. The second categoryis durables, which are not sold but rented or licensed, butremain the responsibility of the maker. The third categoryconsists of unsalables. The latter are toxic materials thatshould not be sold but must always belong to the originalmaker and must be stored in licensed storage facilitiesoperated for the purpose by regulated public utilities.
One of the advantages of an economy based on services isthat it is inherently more labor-intensive than the mass-production manufacturing and “throw-away” economy.Treating products as capital goods will create more jobsbecause repair, renovation, disassembly and remanufacturingare inherently more labor-intensive than original equipmentmanufacturing (Stahel and Reday-Mulvey, 1981) (Stahel, 1982).The reason is simple and straightforward: these activities aremuch less able to exploit economies of scale or learning-by-doing precisely because they are less repetitive and standar-dized. For workers they will be more interesting and willrequire higher levels of skill.
But what seems like an advantage in terms of job creation(especially from a European perspective) is a disadvantagefrom the perspective of labor productivity. The Salter cyclegrowthmechanism depends on economies of scale, which aremuch less applicable to services as such, than to products. Afundamentally different economic mechanism is needed toreduce service costs as such. One mechanism that is common

14 There are still some who believe that nuclear power is anacceptable substitute. I do not agree. Nuclear power has alwaysbeen underpriced because of government financing of the R&Dand special exemptions from liability. However the real problemis that costs of safe disposal of nuclear wastes were never takeninto account and these costs cannot, even now, be estimatedaccurately or capped because no acceptable disposal technologyhas yet been demonstrated. Moreover, the increasingly urgentneed to minimize the spread of nuclear weapons constitutes afurther disincentive to future dependence on this dangeroustechnology. Finally, despite hundreds of billions of dollars ofinvestment in R&D over the past four decades, there has beenlittle progress in cost reduction. By contrast, the cost of PV powerhas fallen dramatically and continues to fall as the technologyand scale of production advances.
Fig. 11 –Feedback cycle (“new” growth engine).
15 The best-known energy optimization models are ETA-MACRO[Manne, 1977], MARKAL [Fishbone et al., 1983], EFOM [Van derVoort et al., 1985], and MESSAGE [Messner and Strubegger, 1994]ETA-MACRO was the first energy optimization model to be linkedwith a macroeconomic forecasting module. Other such combina-tions include MARKAL-MACRO, which uses the same economymodule as ETA-MACRO and ETSAP, which also uses MARKAL[Kram, 1993].
293E C O L O G I C A L E C O N O M I C S 6 7 ( 2 0 0 8 ) 2 8 1 – 3 1 0
to both situations is “learning-by-doing”. Another mechanismfor cost reduction in the service sector, now beginning to takehold, is information technology (IT). But insofar as IT, asapplied to the service sector, is productivity enhancing it isalso inherently job reducing, almost by definition. It can,however, help compensate for the higher costs arising fromproduct life extension. Thus another, and increasingly impor-tant, mechanism for cost-reduction – or increased value-added – is R&D applied to the delivery of services.
Recall, once again, the long-term goal of “zero emissions”advocated by many environmentalists. Is this merely atheoretical end-point many thousands of years in the future?Or is there a plausible scenario that could get us to areasonable approximation of the zero-emissions world withina couple of generations? I believe there is such a scenario, viz.the solar hydrogen-plus-conservation economy, although theshort name does not give sufficient emphasis to the equallyimportant future roles of wind, tidal power, biomass, photo-voltaic (PV) electricity, materials recycling, ultra-light electricvehicles, and possibly nuclear electricity. Nor does it givesufficient emphasis to the shift from “throw-away productorientation” to “lifetime service orientation” (IPS) in themanufacturing sector. Another name for the scenario couldbe “the spaceship economy”.
However it is named, I believe this scenario is inevitablein the long run, if the world does not explode into resourcewars and anarchy (Klare, 2001). Of course the specific details,the regulatory incentives, the funding sources, and thetiming remain quite uncertain. Progress depends in largepart on technical synergies and “learning”. The role ofgovernment in accelerating, or inhibiting, this technologicaldevelopment is also vital. But, in view of limited space, Icannot discuss either the technology or the economics ingreater detail here.
To conclude: the driver of change – the imperative – is thecumulative environmental burden arising from fossil fuel use(and resulting emissions) and the higher costs that will
result.14 This burden is inconsistent with economic growth –hence unsustainable – in the long run. I trust this fact will begenerally recognized as such within a decade or two at most.More specifically, it is becoming clear that cost-effective zero-emissions substitutes for fossil energy in general, and motorfuel, in particular, are needed. Hydrogen is one answer (theremay be others). There are no physical laws standing in theway. The major barriers are indifference, initial costs andvested interests.
My core argument is that this combination of technologicalpotential and demonstrated demand (reflecting a societal need)could trigger an industrial revolution of the first magnitude.Surprisingly, perhaps, none of the standard energy-economicforecasting models15 predict such a burst of creative activity.The reason they do not may be that most energy forecasting
.
294 E C O L O G I C A L E C O N O M I C S 6 7 ( 2 0 0 8 ) 2 8 1 – 3 1 0
models assume that economic growth driven by technologicalprogress will continue automatically and indefinitely withoutcost or investment.16 Theyalsoassume that energy supply isnota constraint on growth because rising prices will assurecontinued supply, at reasonable costs, whether in terms ofnew discoveries or new technologies (Energy InformationAdministration (EIA) 2004; International Energy Agency, 2004).And finally, they assume that the price of energy will have littleif any impact on growth. All three of these assumptions arederived from standard neoclassical economic theory. But allthree are dangerously out of touch with reality.
The fundamental problem is that neo-classical economictheory has no role for physical materials, energy or the laws ofthermodynamics. Energy and materials exist in the theory asoutputs – products and services – but not as inputs or drivers. It isfundamentally a theory about relationships between immaterialabstractions. Moreover, standard theory assumes that scarcitydoes not exist in reality, because any threat of scarcity is auto-matically compensated by rising prices that induce reduceddemand and increased supply or substitution. One implausibleconsequence of this theory is that energy consumption can bereduced arbitrarily with no implication or consequence for eco-nomic growth. Future growth is simply assumed to be automatic,cost-free and independent of future energy costs. Thus the stan-dardneoclassical economic theory is, in effect, “dematerialized”. Itneeds to be “rematerialized”in the sense of incorporating the lawsof thermodynamics as real constraints on possible outcomes.
Some of the evidence for these statements is incorporatedin Appendices A and B which are posted on EcologicalEconomics' website.
8. Conclusion: towards sustainability economics
The economics of sustainability encompasses important insightsfrom several fields of science, from thermodynamics to geology,ecology to economics, psychology and political science. Econom-ics as the science of resource allocation, occupies the centralposition, in some sense. But the resources applicable to sustain-ability economics range fromminerals to species, and from solarenergy to geological and hydrological processes, as well as man-madecapital andhuman intelligence.Thecore insightof classicaleconomics, from the time of AdamSmith,was the important roleof markets acting as the ‘invisible hand’ to regulate supply anddemand, and the role of savings and investment as a driver ofgrowth. But classical economics recognized the importance of thenatural resources as landandonly insofar as it producedcrops forfood and feed. Yet ThomasMalthus correctly foresawmore thantwo centuries ago the fact that natural resources have limits,though he was ludicrously wrong about the magnitudes and theimmediacy of the problem.
Crucial insights of environmental economics pertainlargely to the limitations of the marketplace, notably the
16 A reviewer has pointed out that many theoretical and appliedmodels (such as ETA-MACRO) actually do actually converge tolong-run stationary states with constant consumption and zeronet investment. This is due to declining returns to capital, whichis built into the standard Solow growth model. Unboundedgrowth is still possible (due to continuous technological progress)but not necessary.
pervasiveness of wastes and pollutants, and the necessity ofenforcing a “polluter-pays-principle” or a second-bestapproach in the form of government regulation. The need tobalance benefits and costs of pollutant treatment and abate-ment has been a key insight. Another was the importance ofprivate ownership as a precondition of conservation. The factthat some resources cannot be privately owned, or can beowned only in common, has emerged as a major theme. Ofcourse land and minerals – including fossil fuels – can beowned, but sunlight, air, flowing water and bio-diversitycannot be privatized and consequently are subject to abuse.
The critical insights of geology were that natural resourcesare distributed in the earth's crust according to something likea log-normal pattern, characterized by relatively smallamounts of very high quality but larger amounts of progres-sively lower quality. It follows that extraction rates of aparticular resourcewill tend to accelerate at first (as costs dropdue to economies of scale and increasing demand) but – as inthe case of petroleum and natural gas – that a time of peakoutput (a so-called ‘Hubbert peak’) will come, followed by aninevitable decline (Deffeyes, 2001).
Important insights of resource economics start with thestrategy of exploitation starting with the highest quality andeasiest to extract. More subtle insights pertain largely to the issueof inter-generational allocation and discounting, since highquality resources consumed in the present will not be availablein the future. But resources extracted and utilized in the presentdo not only contribute to current enjoyment, but also to thecreation of man-made capital and “human capital” that willpermit more effective strategies for the discovery and exploita-tion of lower quality resources, or the substitution of others.
The importance of ‘human capital’ – or technology – asdrivers of growth and as a source of substitutes for naturalresources is yet another insight of recent decades.
Finally, it is only now being realized that all of theseinsights from different fields of science converge on the role ofenergy, primarily from fossil fuels, in the economic system,and the importance of energy-related pollutants as causes ofenvironmental damage. All of these critical insights arerelevant to sustainability economics.
Appendix A. Energy, exergy, work and power
Energy is a conserved quantity. It cannot be ‘consumed’ or‘used up’, as such. However it can (and does) become less ableto perform useful work. Potentially useful work, or availabilityis quantifiable. By general agreement among physical scien-tists this quantity is now denoted exergy, namely the fractionof total energy that is available to performwork. (This fractionis also what most people really mean when they speak ofenergy.) Exergy is not conserved.
Exergy. There are four components of exergy, each with acorresponding type of work (Szargut et al., 1988). They are asfollows: (I) kinetic energy associated with relative motion.Mechanical work associated with motion is exemplified by theaction of a water wheel or windmill. Next, (ii) potential fieldexergy is associated with gravitational or electromagnetic fielddifferentials. Work must be done on a mass to escape from agravitational field or, on a charged particle, to overcome an

Table A-1 – Typical chemical exergy content of some fuels
Fuel Energycoefficient
Net heat value[KJ/kg]
Chemical energy[KJ/kg]
Coat 1.088 21,680 23,687.84Coke 1.06 28,300 29,998Fuel oil 1.073 39,500 42,383.5Naturalgas
1.04 44,000 45,760
Dieselgas
1.07 39,500 42,265
Fuelwood 1.15 15,320 17,641
Data source: expanded from (Szargut et al., 1998).
295E C O L O G I C A L E C O N O M I C S 6 7 ( 2 0 0 8 ) 2 8 1 – 3 1 0
electrical field. The third category (iii) is thermal exergy (frompressure or temperature differentials). A heat engine exempli-fies the conversion to work. Finally, (iv) chemical exergy arisesfrom differences in chemical potential, associated with compo-sition. Exergy types of interest are summarized in Fig. A-1.
The exergy content of organic materials – fossil fuels, food,animal feed and other organics (wood, cotton, etc.) – is closelyrelated to enthalpy (potential heat of oxidation) and can becalculated in a straightforward manner by multiplying massquantities by the coefficients taken fromthe followingTableA-1:
The “other” category includes water power, nuclear power,wind power and solar power, expressed in terms of exergyinput. For industrialminerals andmetal ores the calculation isa little less straightforward, but not difficult (Szargut, Morris,and Steward, 1988). However, as a practical matter the onlyinorganic element that makes a significant contribution at thenational level is sulfur, either in native form or in the form ofsulfide minerals. Exergy inputs (including harvested food andfeed crops) per unit of GDP for the US and Japan are plottedsince 1900 in Fig. A-2. It is noteworthy that the trend for Japanis consistently less than half that for the US, meaning thatJapan gets more than twice the GDP per unit of exergy inputthan does the US. It is also noticeable that the trend for Japanis monotonically down, whereas the US exhibits a (small)increase from 1900 to the early 1920s, after which the trend isalso declining. Exergy inputs to the US economy since 1900 bytype are shown, in percentage terms, in Fig. A-3. The relativeimportance of biomass (close to 40% of the total in 1900) hasdeclined significantly, to about 25% in 2000. Fossil fuels haveincreased in relative importance during the period by roughlythe same amount. Allocation to end uses, by type, are shownin percentage terms in Fig. A-4.
Work is usually defined as a force operating over a distance.For instance, the work done by a horse to lift a weight againstgravity depends on the weight and the distance lifted. Thework done by a piston to compress air or a gas depends on theforce needed to overcome resistance, and the distance traveledby the piston. This is how the idea is usually explained intextbooks. However, it is important to note that work has thesame units as energy and exergy, whence the ratio of workperformed to exergy supplied is a pure, dimensionlessnumber,between zero and unity, called efficiency.
It is convenient at this point to introduce the notion of‘quasi-work’ not involving kinetic energy of motion. Thisrefers to driving an endothermic chemical process or movingheat from one place to another across some thermal barrier.(Metal smelting is an example of the first; space heating or
Fig. A-1 –Exergy types.
water heating is an example of the second.) Electricity can beregarded as ‘pure’ work, since it can perform either mechan-ical or chemical work with virtually no loss i.e. with very highefficiency. It is also convenient to distinguish primary andsecondary work, where the latter is work done by electricaldevices or machines. In all of these cases the physical units ofwork are the same as the units of energy or exergy.
Work (and quasi-work) can be estimated quantitatively bymultiplying exergy inputs by an appropriate conversionefficiency. It is important to bear in mind that efficienciesvary greatly among types of work performed. Mechanical andelectrical efficiencies tend to be significantly higher thanthermal process efficiencies.
Power is the rate at which work is performed; it is work perunit time or the time derivative of work. Hence the integral ofpower output over time is equal to total work performed. Inmechanical and electrical engineering power, measured inunits of horsepower or kilowatts is more familiar than work(kilojoules or kilowatt-hours).
For purposes of empirical estimation of conversion effi-ciency, it is helpful to distinguish between two categories offuel use. The first category is fuel used to domechanical work,which means fuel driving so-called ‘prime movers’, includingall kinds of internal and external combustion engines, fromsteam turbines to jet engines. (Electricmotors are not includedin this category, because electricity is essentially equivalent tomechanical work, as already noted. Electric power is mostlygenerated by a prime mover of some other sort). The secondcategory is fuel used to generate heat as such, either forindustry (process heat and chemical energy) or for space heatand other uses such as hotwater for washing and cooking heatfor residential and/or commercial users.
Historical statistics have never been compiled by officialgovernment agencies to distinguish between these twocategories of fuel use, but detailed estimates for the period1900–1998 have been compiled and published for the US (Ayreset al., 2003).
It is possible to estimate human and animal contributions tomechanical work crudely on the basis of food or feed intake,times a biological conversion efficiency adjusted for the fractionof time spent doing physical (muscle) work. However, sincehuman labor is treated independently in economic analysis –and since human muscle power is no longer an importantcomponent of human labor in the industrial world as comparedto eye-hand coordination and brainwork – we neglect it here-after. (The magnitudes would be trivial in any case). However
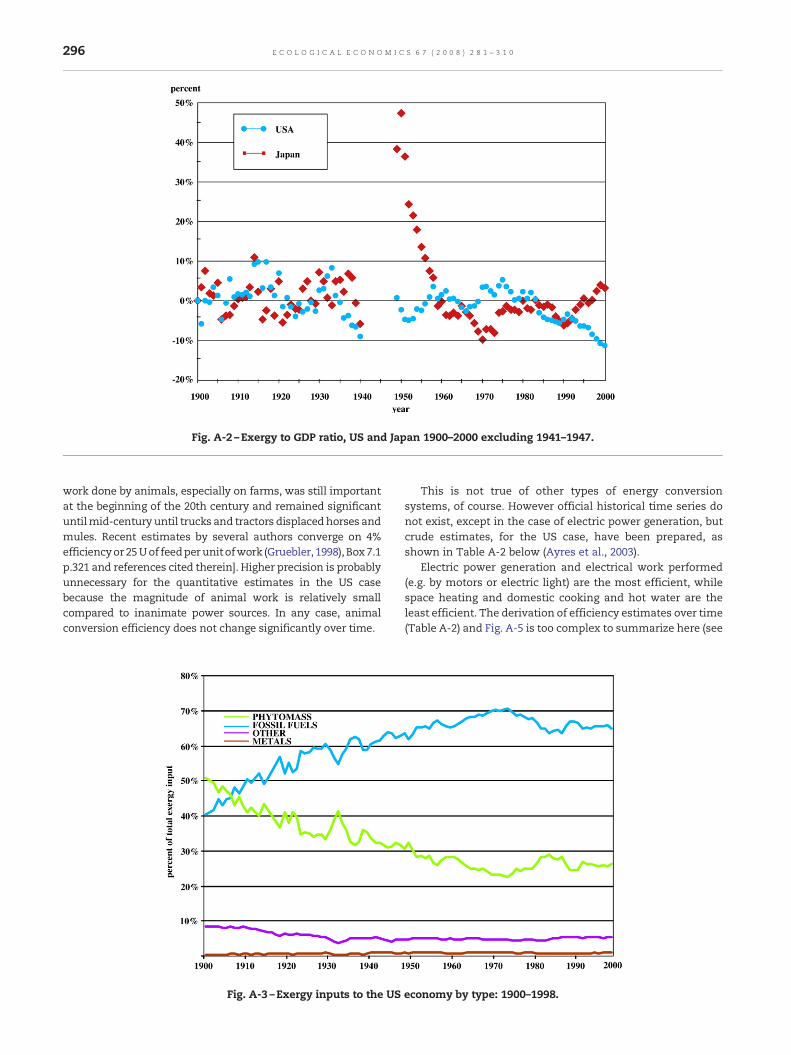
Fig. A-2 –Exergy to GDP ratio, US and Japan 1900–2000 excluding 1941–1947.
296 E C O L O G I C A L E C O N O M I C S 6 7 ( 2 0 0 8 ) 2 8 1 – 3 1 0
work done by animals, especially on farms, was still importantat the beginning of the 20th century and remained significantuntilmid-century until trucks and tractors displacedhorses andmules. Recent estimates by several authors converge on 4%efficiencyor 25Uof feedperunitofwork (Gruebler, 1998), Box7.1p.321 and references cited therein]. Higher precision is probablyunnecessary for the quantitative estimates in the US casebecause the magnitude of animal work is relatively smallcompared to inanimate power sources. In any case, animalconversion efficiency does not change significantly over time.
Fig. A-3 –Exergy inputs to the US
This is not true of other types of energy conversionsystems, of course. However official historical time series donot exist, except in the case of electric power generation, butcrude estimates, for the US case, have been prepared, asshown in Table A-2 below (Ayres et al., 2003).
Electric power generation and electrical work performed(e.g. by motors or electric light) are the most efficient, whilespace heating and domestic cooking and hot water are theleast efficient. The derivation of efficiency estimates over time(Table A-2) and Fig. A-5 is too complex to summarize here (see
economy by type: 1900–1998.

Fig. A-4 –Percent of fossil fuel exergy consumed by type of enduse, USA 1900–1998.
297E C O L O G I C A L E C O N O M I C S 6 7 ( 2 0 0 8 ) 2 8 1 – 3 1 0
(Ayres et al., 2003)). The efficiency of electric power use bymotors, lights, electrolytic cells, electric furnaces and otherapplications varies considerably from application to applica-tion. But overall efficiency has remained surprisingly close to50% since 1900, since increasing efficiency for some uses (suchas lighting) has been compensated by increases in the demandfor low efficiency uses such as space heating (Fig. A-6). Fordetails we refer the reader to an earlier publication (Ayreset al., 2005).
Aggregatework/GDP output by the US and Japan are plottedin Fig. A-7. It is noteworthy that this ratio rises consistently forboth countries before peaking in the early 1970s. The 1973–74peak coincides with the price spike associated with the so-called ‘energy crisis, triggered by the Arab oil embargo of 1973.Exergy-to-work efficiency ratios are plotted in Fig. A-8. It is notsurprising that the Japanese economy is considerably moreefficient than the US economy, but it is perhaps surprising, atfirst sight, that the difference is so great. The decline after 1970reflects the exhaustion of hydroelectric sites and increasingdemand for less efficient technologies such as personalautomobiles.
Table A-2 – Average exergy efficiency of performing useful wor
Year Electrical generation anddistribution
Electricalwork
Other mechanicwork
1900 3.8 52 31910 5.7 51 4.41920 9.2 55 71930 17.3 55 81940 20.8 56 91950 24.3 55 91960 31.3 56 91970 32.5 57 81980 32.9 58 10.51990 33.3 58 13.9
Appendix B. Analysis
B.1. Introduction
The purpose of this Appendix is to summarize an extensiveeconometric analysis supporting the hypothesis that energydelivered as useful work (in the thermodynamic sense) is one ofthe threemajor factors of production inmodern industrializedeconomies. Indeed, useful work has largely displacedunskilled labor as a factor of production in the US and Japan,since the beginning of the twentieth century. More extendedtreatments of these issues are dealt with in prior publications(Ayres et al., 2003, 2005; Ayres andWarr, 2005;Warr and Ayres,2006).
B.2. Growth equations
We conceptualize the economic system as a multi-sectorchain of linked processing stages, starting with resourceextraction, reduction, refining, conversion, production of
k, percent
al High temperature industrialheat (steel)
Low temperature spaceheat 1900
7 0.259 0.4
11 0.613 0.815 1.016 1.218 1.520 2.023 2.525 3.0

Fig. A-5 –Energy (exergy) conversion efficiencies, USA 1900–1998.
298 E C O L O G I C A L E C O N O M I C S 6 7 ( 2 0 0 8 ) 2 8 1 – 3 1 0
finished goods and services (including capital goods), finalconsumption (and disposal of wastes). Each stage hasphysical inputs and physical outputs that pass to the nextstage (Fig. A-9). At each stage of processing value is added anduseful information is embodied in the products, whilelow value, high entropy, low informationwastes are separatedand disposed of.17 Global entropy increases at every step, ofcourse, but the value-added process tends to reduce theentropy of useful products, while increasing the entropy of thewastes. An adequate description of the economic system,viewed in this way, must include all materials and energyflows, and information flows, as well as money flows. Theseflows and conversion processes between them, are governedby the first and second laws of thermodynamics, as well as bymonetary accounting balances.
The quantitative results reported hereafter are based on atwo sector, three-factor production function Y(K, L, E, t) whereK is a measure of capital stock, L is labor supply, E is a variablerelated to energy (defined later) and t is time. All variables areindexed to unity in the starting year (1900). The growthequation is the total (logarithmic) time derivative of theproduction function, viz
dyY
¼ a∂KK
þ b∂LL
þ g∂EE
þ d∂AA
ð1Þ
17 The language here is suggestive of an energy (or information)theory of value. Unfortunately, perhaps, the term ‘value added’ is sothoroughly established in economics that it cannot reasonably beavoided. In any case, we are not espousing the discredited energytheory of value. For a more thorough discussion of the economy as aself-organized system of concentrating ‘useful information’ see(Ayres, 1994) chapter 8.
The last term reflects the possibility that some part of thegrowth cannot be explained in terms of K, L, E and is thereforea function of time alone. This term, originally identified withtechnical progress, is now called total factor productivity orTFP. It cannot be accounted for within a single sector model(because a single sector model produces only a singlecomposite product), whence it must be regarded asexogenous.
The four output elasticities α, β, γ, δ are defined below, where δcanbe thoughtofas theelasticityof “innovation” (or “creativity”inKuemmel's words). Assuming constant returns to scale:
a K; L;Eð Þ ¼ KY∂Y∂K
ð2Þ
b K; L;Eð Þ ¼ LY∂Y∂L
ð3Þ
g k; L;Eð Þ ¼ 1� a� b ð4Þ
∂ tð Þ ¼ t� t0t
∂Y∂t
ð5Þ
The integrability conditions imply that the second-ordermixed derivatives of the production function Ywith respect toall factors K, L, E must be equal (Kuemmel, 1980). It followsthat
K∂a∂K
þ L∂a∂L
þ E∂a∂E
¼ 0 ð6Þ
K∂b∂K
þ L∂b∂L
þ E∂b∂E
¼ 0 ð7Þ
L∂a∂L
¼ K∂b∂K
ð8Þ

Fig. A-6 –Efficiencies in performance; secondary work from electricity by function; US 1900–2000.
299E C O L O G I C A L E C O N O M I C S 6 7 ( 2 0 0 8 ) 2 8 1 – 3 1 0
The most general solutions to these three equations are:
a ¼ aLK;EK
� �ð9Þ
b ¼Z
LK∂a∂L
þ JLE
ð10Þ
The simplest (trivial) solutions are constants: α=α0, β=β0 andγ=1−α−β. We consider other solutions of the above equations
Fig. A-7 –Useful work (U) to GDP ratio, US an
later. For the single sector two factor case, omitting the energyvariable (γ=1), one obtain the usual Cobb–Douglas form
Y ¼ A tð ÞKaLb ð11Þ
This is the conventional growthmodel with output elasticitiesequal to cost (payment) shares for capital and labor, respec-tively, in the national accounts. The usual parametric choicesare α0=0.3 and β0=0.7, respectively, and α0+β0=1. A(t) is the‘Solow residual’, i.e. the growth component that is not
d Japan 1900–2000 excluding 1941–1947.

Fig. A-8 –Exergy to work efficiencies: US and Japan 1900–2000 excluding 1941–1947.
300 E C O L O G I C A L E C O N O M I C S 6 7 ( 2 0 0 8 ) 2 8 1 – 3 1 0
explained by either capital accumulation or increased laborsupply. It is traditionally approximated as
A tð Þ ¼ exp k t� 1900ð Þ½ � ð12Þ
where t is the year and λ=0.016 for the US. In other words,throughout the twentieth century growth attributable to exogen-ous technical progress or TFP in the US has averaged 1.6% perannum, although growth was significantly slower in the 1930sand somewhat higher in the early postwar period. (Fig. A-10)
Fig. A-9 –Pollution and w
Forecasting models tend to treat this rate of TFP growth as agiven, assuming that it can be expected to continue for theindefinite future. On the other hand, Japanese growth wasconsiderably slower during the prewar period and significantlyfaster in the postwar era until 1992, since when it slowed downdramatically. It cannot be well approximated by a simpleexponential. (An S-curve or logistic function would fit better).
The next logical step in the choice of production function is tochoose the simplest non-trivial solutions of the growth equationand to select plausible mathematical expressions for the output
astes vs. value-added.

Fig. A-10 –Technological Progress Function and Solow residual USA: 1900–2005.
301E C O L O G I C A L E C O N O M I C S 6 7 ( 2 0 0 8 ) 2 8 1 – 3 1 0
elasticities, α, β, γ, based on asymptotic boundary conditions(Kuemmel, 1980; Kuemmel et al., 1985). To satisfy the constantreturns (Euler) condition these elasticitiesmust be homogeneouszerothorder functionsof the independentvariables.Theassump-tion of constant returns to scale implies that, at everymoment intime, equation (4) is satisfied. The first of Kuemmel's proposedchoices can be thought of as a form of the law of diminishingreturns (to capital). It is an asymptotic boundary conditionconveying thenotion that even in ahypothetical capital intensivefuture state in which all products are produced by machines,some irreducible need for labor L and exergy Ewill remain, viz
a ¼ aLþ EL
ð13Þ
Kuemmel's second equation reflects the continuing sub-stitution of labor by capital and exergy as capital intensity(automation) increases:
b ¼ a bLE� LK
� �ð14Þ
The corresponding production function is then obtained bypartial integration of the output elasticities yields the linear-exponential (LINEX) form (Kuemmel, 1980; Kuemmel et al.,1985):
Y ¼ AEexp a tð Þ 2� Lþ EK
� �� �þ a tð Þb tð Þ L
E� 1
� �� �ð15Þ
The functions (of time) a(t) and b(t) have been characterizedby Kuemmel as ‘capital efficiency’ and ‘energy demand’respectively. The resulting time-dependent elasticities ofoutput are then determined by fitting the above functionalform to real GDP from 1960 to 2004 for the UK, Germany, Japanand the US. Allowing the time dependent parameters a(t) andb(t) the GDP fits are extremely good (Kuemmel et al., 2000). Onthe other hand, neither a(t) nor b(t) really has a straightforward
economic interpretation. Hence, such a model cannot be areliable basis for forecasting. However, the resulting (calcu-lated) time-dependent elasticities show a significantincrease in exergy elasticity and a decline in labor elasticity,over time.
B.3. A new variable: useful work U
We now introduce a two sector model with a third factor con-sisting of ‘useful work’ (denoted U), discussed in Appendix A,which is also the output of the first sector. By definition, U is theproductof resource (exergy) inputsE timesaconversionefficiencyf. U has the same dimensions as E, since f is dimensionless.Capital, labor and useful work are not mutually substitutable;indeed there is some complementarity and interdependencebetween capital andwork, and between labor andwork. Thus thethird factor U is not truly independent of capital and labor. Thismeans that not all combinations of the three factors K, L, U arepossible. (Some combinations, including extreme cases like K=0,L=0 or U=0 are impossible.) Capital and work have a strongsynergy. In fact, capital – except for residential housing andmoney – can be defined for our purposes as the collection of allenergy-conversion machines and information processing equip-ment, plus ancillary structures to contain and move them(Kuemmel, 1980). Thus capital goods are activated by energy(exergy), while exergy has no economic function in the absence ofcapital goods.
As a first approximation, it is now convenient to assume thatthe economy is a two stage system with a single intermediateproduct, to be defined in a moment. (This assumption is notunreasonable, bearing in mind that most of economic growththeory to date postulates a single-stage, single sector, compositeproduct model.) The product of the primary sector (Sector 1) canbe thought of as “energy services”. For our purposes, energy

Fig. A-11 –Empirical and estimated GDP, US 1900–2000 excluding 1941–1948.
18 We note in passing here that for both countries there are several‘mini-breaks’ that suggest thepossibilityof re-calibrationof themodelparameters. The leads, in practice, to a series of ‘mini-models’covering as few as twenty or thirty years. However, an obviousconstraint that is impossible to incorporate explicitly in the mathe-matical optimization process is the need for each variable to becontinuous across breaks. Ignoring that condition leads to extremelyimplausible results.19 The full story can be found in an IIASA interim report whichhas been submitted for publication. It is available to specialistsfrom the web.
302 E C O L O G I C A L E C O N O M I C S 6 7 ( 2 0 0 8 ) 2 8 1 – 3 1 0
services can be definedmore rigorously as “useful work”U in thethermodynamic sense. Useful work includes muscle work byanimals or humans, electricity,mobile engine power as delivered(e.g. to the rearwheelsof avehicle) andusefulheat, asdelivered ina space in a building or in a process. A full explanation of howthese terms are defined and quantified can be found in anotherpublication (Ayres andWarr, 2003).
Simplifying (13) we get:
Y ¼ Efg ¼ Ug ð16Þ
where f is the overall technical efficiency of conversion of‘raw’ exergy inputs E into useful work output U, as shown inFig. A-8.
B.4. Statistical analysis of the time series
Before we can have great confidence in the outcome ofcalculations with a production function, especially if afterintroducing a new and unfamiliar factor of production, it isdesirable to conduct anumber of statistical tests. In particular,weneed to ascertain the presence of unit-roots, structural disconti-nuities, cointegrability and Granger-causality. The five economicvariables inquestionare capitalK, laborL, energy (actually exergy)E, useful work U and output (GDP) Y.
Todostatistical analysis on timeseriesvariables, theymust beconverted to logarithmic form, to eliminate any exponential timetrend. But the logarithmic variablesmay ormaynot be stationary(trend-free with finite variance and co-variance) as required forthe application of standard statistical procedures such as OLS. Ingeneral, we find that the time series (of logarithms) are notstationary i.e. they have ‘unit roots’. The first question iswhetherthe unit root is ‘real’ (i.e. due to amissing variable) orwhether it isdue to an external shock or structural break (discontinuity) in thetime series. In general, we find that the latter interpretationsuffices. Structural breaks can be attributed to wars, hyper-
inflations, currency devaluations, depressions, or other majorevents such as the “oil crisis” of 1973–74.
Structural breaks canbe identifiedmost easily by examinationof the residuals of several model. However, different modelssuggest possible breaks in different places. This is troublesome,because there is an element of circular logic involved, in that themodels, in turn, depend on the locations and magnitudes of thestructuralbreaks.However,whendifferentmodels (suchasCobb–Douglas and LINEX ) are consistent in the sense that they showsignificant deviations in the same place, and when thosedeviations are easily explained in terms of exogenous events, itis reasonable to interpret them as structural breaks. To make arather long story short (we have tested literally dozens ofcombinations), it turns out that the period of WW II (1942–45) isthe only break that needs to be taken into account in both the UScase and the Japanese case.18
We have carried out extensive cointegration analysis andGranger causality tests. A complete description of the lengthystatistical testing procedures involved, not to mention theunderlying rationale, is far too complicated and specialized toreproduce here. The most robust result is that both exergy anduseful work are causally related to output, and vice versa. In otherwords (as intuition also suggests) the causality is mutual.19

Fig. A-12 –Empirical and estimated GDP, Japan 1900–2000 excluding 1941–1948.
303E C O L O G I C A L E C O N O M I C S 6 7 ( 2 0 0 8 ) 2 8 1 – 3 1 0
B.5. The choice of production function
The Cobb–Douglas function is over-simplified in an importantrespect: it assumesconstantelasticitiesofoutput. It isnot realisticto assumeconstant elasticities over the entire century from1900–2003.Ontheotherhand, themodelcanbeused forshorterperiodsseparated by well-defined structural breaks. The essential resultthat we need to take into account is that exergy and, especiallyuseful work, are important drivers of growth, and that theirimportance have increased throughout the century. We expectthat the imputed marginal elasticity of resource (exergy) inputswill be much greater than the factor-payments (cost) share, asalready suggested by others (e.g. (Kuemmel et al., 1985, 2000;McKibben andWilcoxen, 1994, 1995; Bagnoli et al., 1996).
As already noted, we reject the traditional single sector, com-posite productmodel, on thegrounds that thevery act of isolatingcommercial energy as an output of the extractive industry (coal,oil, gas) constitutes a de facto sectorization. The Cobb–Douglas
Table B-1 – Statistics of fit
1900–1940 1947–2004
Cobb–Douglas
LINEX Cobb–Douglas
LINEX
USADublin–Watson 0.59 1.72 0.03 0.15Dickey–Fuller −1.816⁎ −5.427⁎⁎⁎ 3.540 2.306R2 0.987 0.994 0.997 0.999
JapanDublin–Watson 0.55 0.96 0.11 1.10Dickey–Fuller −1.317 −3.162⁎⁎⁎ −1.451 −4.355⁎⁎⁎
R2 0.985 0.991 0.999 1.000
Critical test values for the Dickey–Fuller unit–root test ⁎90%–1.606⁎⁎95%–1.950 ⁎⁎⁎99%–2.366.
model using exergy E as a third factor can be implemented bydefining a sectoral boundary between extraction and down-streamprocessing and service sectors. It is easy to show that thatversion of themodel does not explain past economic growth. Ouralternative version, however, incorporates ‘useful work’ U as athird factor. The sectoral boundary shifts from extraction toinclude primary processing of fuels, electricity generation andusage (in motors, lighting, etc) and work done bymobile internalcombustion engines (Ayres et al., 2003). It will be seen that thisversion of the model does have explanatory power.
Obviously useful work is required for its own production, astrucks carry coal to power plants and electric power is used incoal mines. It seems reasonable to postulate, as a firstapproximation, that capital, labor and useful work are usedin the same proportions in the production of useful work U as theyare in the economy as a whole. In fact, we assume that themathematical form of the production functions Y1, Y2 and Yare identical, except for a constant multiplier.
This being so, it follows that
K� K⁎K
¼ L� L⁎L
¼ U� U⁎U
¼ k ð17Þ
whence we can write
K� K⁎ ¼ kK ð18ÞL� L⁎ ¼ kL ð19ÞU ¼ U⁎ ¼ kU ð20Þ
It follows that
Y1 K⁎; L⁎;U⁎� � ¼ 1� kð ÞY K; L;Uð Þ ð21Þ
Y2 K� K⁎; L� L⁎;U� U⁎� � ¼ kY K; L;Uð Þ ð22Þ
and therefore
Y1 þ Y2 ¼ Y ð23Þ
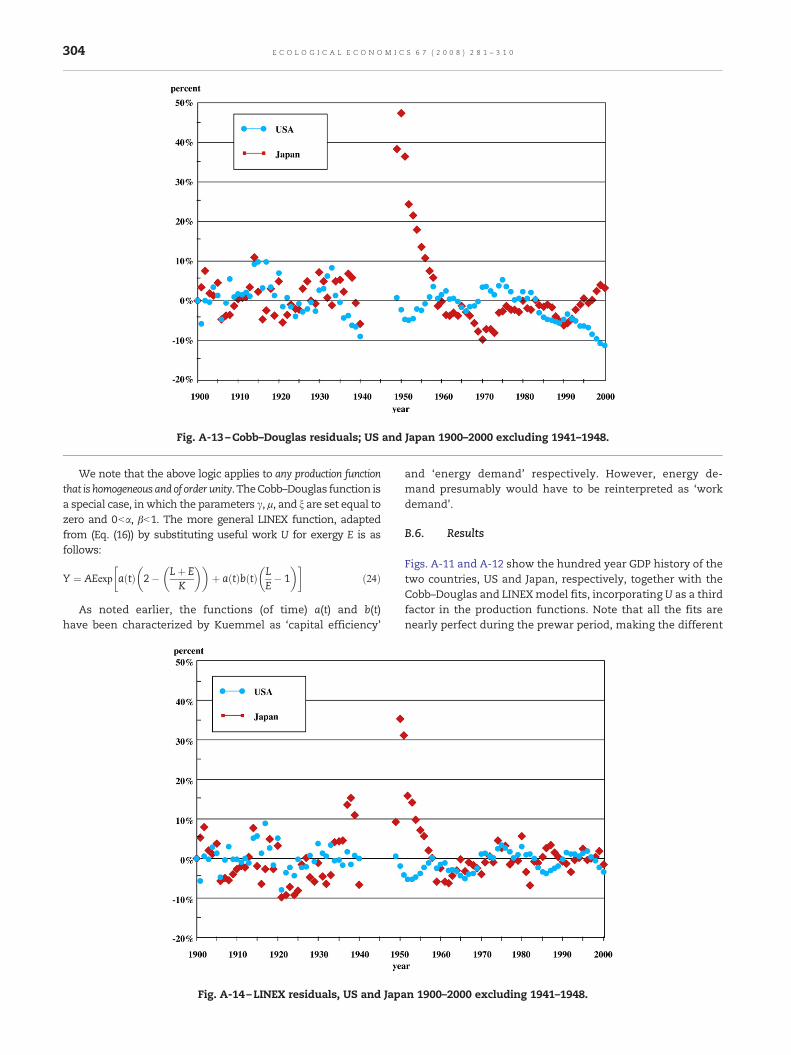
Fig. A-13 –Cobb–Douglas residuals; US and Japan 1900–2000 excluding 1941–1948.
304 E C O L O G I C A L E C O N O M I C S 6 7 ( 2 0 0 8 ) 2 8 1 – 3 1 0
We note that the above logic applies to any production functionthat is homogeneous and of order unity. TheCobb–Douglas function isa special case, inwhich the parameters γ, μ, and ξ are set equal tozero and 0bα, βb1. The more general LINEX function, adaptedfrom (Eq. (16)) by substituting useful work U for exergy E is asfollows:
Y ¼ AEexp a tð Þ 2� Lþ EK
� �� �þ a tð Þb tð Þ L
E� 1
� �� �ð24Þ
As noted earlier, the functions (of time) a(t) and b(t)have been characterized by Kuemmel as ‘capital efficiency’
Fig. A-14 –LINEX residuals, US and Jap
and ‘energy demand’ respectively. However, energy de-mand presumably would have to be reinterpreted as ‘workdemand’.
B.6. Results
Figs. A-11 and A-12 show the hundred year GDP history of thetwo countries, US and Japan, respectively, together with theCobb–Douglas and LINEXmodel fits, incorporating U as a thirdfactor in the production functions. Note that all the fits arenearly perfect during the prewar period, making the different
an 1900–2000 excluding 1941–1948.

Fig. A-15 –Parameters of the LINEX function US 1900–2000.
305E C O L O G I C A L E C O N O M I C S 6 7 ( 2 0 0 8 ) 2 8 1 – 3 1 0
models hard to distinguish. Table B-1 shows the statistics ofthe fits, for the cases where the two periods are fittedseparately. (The statistics for the other case, where the fitsare done for the whole period, are less good, as one wouldexpect). Both the Cobb–Douglas and LINEX fits indicate agrowing deviation between empirical and calculated GDP after1990. We have reason to believe that this gap reflects thecontribution of information and computer technology toeconomic growth, especially in the US.
Note that the R2 measures are quite good, even for theCobb–Douglas models, but the R2 values are significantly
Fig. A-16 –Parameters of the LINE
better for the LINEXmodel, both prewar and postwar. The DWstatistics are good for LINEX US prewar and for Japan postwar,but poor in the other two cases. We think this is because wehave had to estimate the useful work output and theestimation procedure involves smoothing. This procedurecan introduce some inadvertent serial correlation in theresiduals. The Dickey–Fuller test for stationarity of theresiduals is bad for all the C–D fits (not surprising) but quitegood for the LINEX case for prewar US, and Japan, and also forpostwar Japan. This is evidence of cointegration. The Dickey–Fuller test for stationarity (the unit-root test) is poor for the US
X function Japan 1900–2000.

Fig. A-17 –Elasticities of factors of production LINEX function: US 1900–2000 excluding 1941–1947.
306 E C O L O G I C A L E C O N O M I C S 6 7 ( 2 0 0 8 ) 2 8 1 – 3 1 0
postwar, suggesting that as many as three ‘mini-breaks’occurred during that period. As mentioned previously, suchbreaks may be associated with exogenous events such aswars, the “oil crisis” or major macro-economic policy changes.
The residual errors for the Cobb–Douglas and LINEXmodels,fitted over whole 100 year span, both with and without anadjustment for the break causedbyWWII are given in Figs. A-13and A-14 for the US and Japan respectively. The LINEX modelsincorporate S-curve “bridges” a(t) and b(t) to connect theprewar and postwar elasticities. These are plotted in Figs. A-15
Fig. A-18 –Elasticities of factors of production LINEX
and A-16. Evidently we can account quite well for economicgrowth in both countries without any requirement for anexogenous time-dependent multiplier, the traditional A(t). Ineffect, the productivity gains (TFP) are essentially explained bythe use of the U(t) variable in the production function. Thetheory has effectively endogenized economic growth.
Finally the calculated output elasticities for the LINEXmodels of the US and Japan, respectively are shown inFigs. A-17 and A-18. The elasticities for the Cobb–Douglascase are, of course, constants, as shown in Table B-2.
function: Japan 1900–2000 excluding 1941–1947.
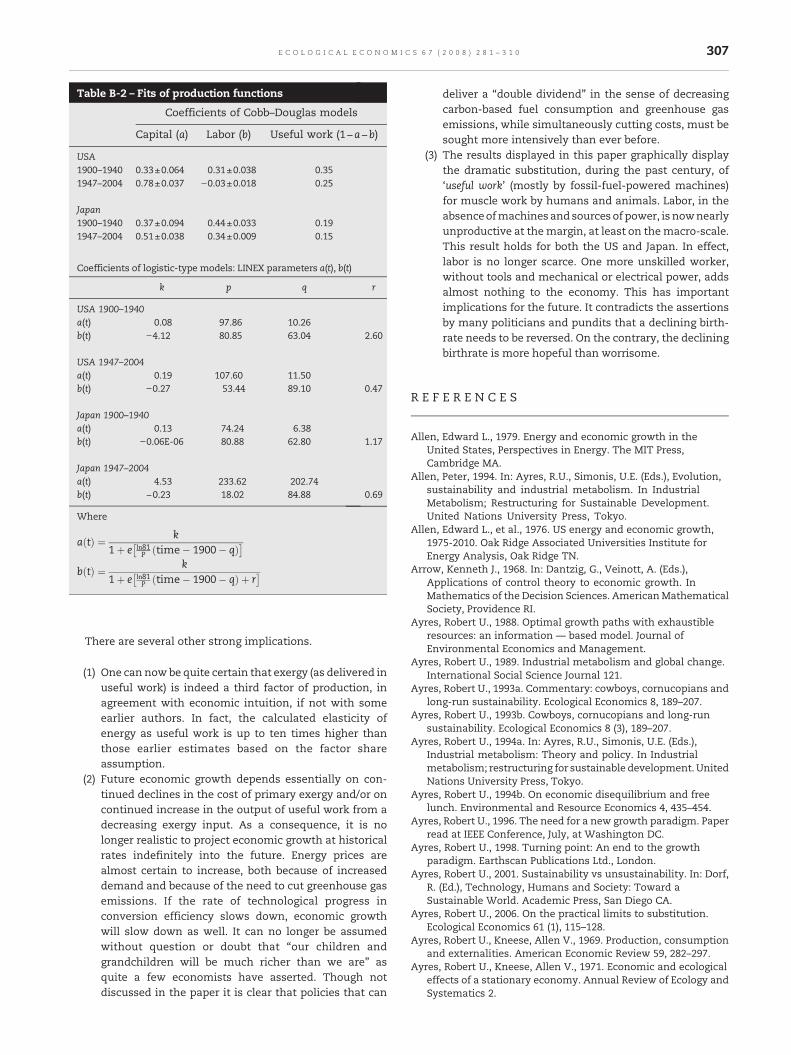
Table B-2 – Fits of production functions
Coefficients of Cobb–Douglas models
Capital (a) Labor (b) Useful work (1−a−b)
USA1900–1940 0.33±0.064 0.31±0.038 0.351947–2004 0.78±0.037 −0.03±0.018 0.25
Japan1900–1940 0.37±0.094 0.44±0.033 0.191947–2004 0.51±0.038 0.34±0.009 0.15
Coefficients of logistic-type models: LINEX parameters a(t), b(t)
k p q r
USA 1900–1940a(t) 0.08 97.86 10.26b(t) −4.12 80.85 63.04 2.60
USA 1947–2004a(t) 0.19 107.60 11.50b(t) −0.27 53.44 89.10 0.47
Japan 1900–1940a(t) 0.13 74.24 6.38b(t) −0.06E-06 80.88 62.80 1.17
Japan 1947–2004a(t) 4.53 233.62 202.74b(t) −0.23 18.02 84.88 0.69
Where
a tð Þ ¼ k1þ e ln81
P time� 1900� qð Þ� b tð Þ ¼ k
1þ e ln81P time� 1900� qð Þ þ r
�
307E C O L O G I C A L E C O N O M I C S 6 7 ( 2 0 0 8 ) 2 8 1 – 3 1 0
There are several other strong implications.
(1) One can now be quite certain that exergy (as delivered inuseful work) is indeed a third factor of production, inagreement with economic intuition, if not with someearlier authors. In fact, the calculated elasticity ofenergy as useful work is up to ten times higher thanthose earlier estimates based on the factor shareassumption.
(2) Future economic growth depends essentially on con-tinued declines in the cost of primary exergy and/or oncontinued increase in the output of useful work from adecreasing exergy input. As a consequence, it is nolonger realistic to project economic growth at historicalrates indefinitely into the future. Energy prices arealmost certain to increase, both because of increaseddemand and because of the need to cut greenhouse gasemissions. If the rate of technological progress inconversion efficiency slows down, economic growthwill slow down as well. It can no longer be assumedwithout question or doubt that “our children andgrandchildren will be much richer than we are” asquite a few economists have asserted. Though notdiscussed in the paper it is clear that policies that can
deliver a “double dividend” in the sense of decreasingcarbon-based fuel consumption and greenhouse gasemissions, while simultaneously cutting costs, must besought more intensively than ever before.
(3) The results displayed in this paper graphically displaythe dramatic substitution, during the past century, of‘useful work’ (mostly by fossil-fuel-powered machines)for muscle work by humans and animals. Labor, in theabsenceofmachines andsources of power, is nownearlyunproductive at themargin, at least on themacro-scale.This result holds for both the US and Japan. In effect,labor is no longer scarce. One more unskilled worker,without tools and mechanical or electrical power, addsalmost nothing to the economy. This has importantimplications for the future. It contradicts the assertionsby many politicians and pundits that a declining birth-rate needs to be reversed. On the contrary, the decliningbirthrate is more hopeful than worrisome.
R E F E R E N C E S
Allen, Edward L., 1979. Energy and economic growth in theUnited States, Perspectives in Energy. The MIT Press,Cambridge MA.
Allen, Peter, 1994. In: Ayres, R.U., Simonis, U.E. (Eds.), Evolution,sustainability and industrial metabolism. In IndustrialMetabolism; Restructuring for Sustainable Development.United Nations University Press, Tokyo.
Allen, Edward L., et al., 1976. US energy and economic growth,1975-2010. Oak Ridge Associated Universities Institute forEnergy Analysis, Oak Ridge TN.
Arrow, Kenneth J., 1968. In: Dantzig, G., Veinott, A. (Eds.),Applications of control theory to economic growth. InMathematics of the Decision Sciences. AmericanMathematicalSociety, Providence RI.
Ayres, Robert U., 1988. Optimal growth paths with exhaustibleresources: an information — based model. Journal ofEnvironmental Economics and Management.
Ayres, Robert U., 1989. Industrial metabolism and global change.International Social Science Journal 121.
Ayres, Robert U., 1993a. Commentary: cowboys, cornucopians andlong-run sustainability. Ecological Economics 8, 189–207.
Ayres, Robert U., 1993b. Cowboys, cornucopians and long-runsustainability. Ecological Economics 8 (3), 189–207.
Ayres, Robert U., 1994a. In: Ayres, R.U., Simonis, U.E. (Eds.),Industrial metabolism: Theory and policy. In Industrialmetabolism; restructuring for sustainable development. UnitedNations University Press, Tokyo.
Ayres, Robert U., 1994b. On economic disequilibrium and freelunch. Environmental and Resource Economics 4, 435–454.
Ayres, Robert U., 1996. The need for a new growth paradigm. Paperread at IEEE Conference, July, at Washington DC.
Ayres, Robert U., 1998. Turning point: An end to the growthparadigm. Earthscan Publications Ltd., London.
Ayres, Robert U., 2001. Sustainability vs unsustainability. In: Dorf,R. (Ed.), Technology, Humans and Society: Toward aSustainable World. Academic Press, San Diego CA.
Ayres, Robert U., 2006. On the practical limits to substitution.Ecological Economics 61 (1), 115–128.
Ayres, Robert U., Kneese, Allen V., 1969. Production, consumptionand externalities. American Economic Review 59, 282–297.
Ayres, Robert U., Kneese, Allen V., 1971. Economic and ecologicaleffects of a stationary economy. Annual Review of Ecology andSystematics 2.

308 E C O L O G I C A L E C O N O M I C S 6 7 ( 2 0 0 8 ) 2 8 1 – 3 1 0
Ayres, Robert U., d'Arge., Ralph C., Knees, Allen V., 1970. Aspects ofenvironmental economics: A materials balance-generalequilibrium approach. Johns Hopkins University Press,Baltimore MD.
Ayres, Robert U., Gowdy, J., van den Bergh, Jeroen C.J.M., 2001. Weakvs. strong sustainability.. Environmental Values (unknown).
Beckerman, Wilfred, 1995. Small is stupid. Gerald Duckworth andCompany, Ltd., London.
Boulding, Kenneth E., 1966. In: Garrett, Baltimore M.D. (Ed.),Environmental quality in a growing economy. In Essays fromthe Sixth RFF Forum. Johns Hopkins University Press.
Boulding, Kenneth E., 1978. Ecodynamics: A new theory of societalevolution. Sage Publications, Beverly Hills CA.
Braungart, Michael, Engelfried, Justus, 1992. The intelligentproducts system (IPS). Fresenius Environmental Bulletin.
Braungart, Michael, et al., 1990. Concept proposal for an intelligentproducts system. EPEA, Germany.
Brookes, Len, 1990. Energy efficiency and economic fallacies.Energy Policy 18 (2), 199–201.
Brookes, Len, 1992. Energy efficiency and economic fallacies: areply. Energy Policy 20 (5), 390–392.
Browne, John, 2004. Beyond Kyoto. Foreign Affairs. (July–August).Brundtland, Gro H. (Ed.), 1987. Our common future, Report of the
World Council For Economic Development. Oxford UniversityPress, New York.
Bureau of Economic Analysis, 1965. National Income and ProductAccounts 1929-1965. United States Department of Commerce,Washington DC.
Casten, Thomas R., 1998. Turning off the heat. Prometheus Press.Casten, Thomas R., Ayres, Robert U., 2007. Energy myth #8: the US
energy system is environmentally and economically optimal.In: Sovacool, B., Brown, M. (Eds.), Energy and Society: TwelveMyths. Kluwer, Dordrecht, the Netherlands.
Cleveland, Cutler J., 1991. Natural resource scarcity and economicgrowth revisited: economic and biophysical perspectives. In:Costanza, R. (Ed.), Ecological Economics: The Science andManagement of Sustainability. Columbia University Press,New York.
Cleveland, Cutler J. (Ed.), 2004. Encyclopedia of energy, the. 6 vols.Elsevier, Dordrecht, the Netherlands.
Common, M., Perrings, C., 1992. Towards an ecological economicsof sustainability. Ecological Economics 6, 7–24.
Costanza, Robert, 1991a. In: Costanza, R. (Ed.), Assuringsustainability of ecological economic systems. In EcologicalEconomics: The Science and Management of Sustainability.Columbia University Press, New York.
Costanza, Robert, 1991b. Ecological economics: a research agenda.Structural Change & Economic Dynamics 2 (2).
Costanza, Robert (Ed.), 1991c. Ecological economics: The scienceand management of sustainability. Columbia University Press,New York.
Crassous, Renaud, Hourcade, Jean Charles, Sassi, Olivieer,2006a. Endogenous structural change and climate targets:Modeling experiments with Imaclim. L'Ecole Hautes Etudes.cited. Available at http://www.centre-cired.fr.
Crassous, Renaud, Hourcade, Jean Charles, Sassi, Olivier, Glitz, V.,Mathy, S., Hamdi-Chenef, M., 2006b. Imaclim-R: a modelingframework for sustainable development issues. Centre- Ciredcited. Available at http://www.centre-cired.fr.
Crocker, T.D., Tschirhart, J., 1992. Ecosystems, externalitiesand economics. Environment and Resource Economics 2,551–567.
Daly, Herman E., 1973. Toward a steady state economy. W. H.Freeman and Company, San Francisco.
D'Arge, Ralph C., Kogiku, K.C., 1973. Economic growth and theenvironment. Review of Economic Studies XL (1), 61–77.
Dasgupta, Partha, Heal, Geoffrey, 1974. The optimal depletion ofexhaustible resources. Paper read at Symposium on theEconomics of Exhaustible Resources.
De Almeida., 1998. Energy efficiency and the limits of marketforces: the example of the electric motor market in France.Energy Policy 26 (8), 643–653.
DeCanio, S., 1998. The efficiency paradox: bureaucratic andorganizational barriers to profictable energy-savingtechnologies. Energy Policy 26 (5), 441–454.
Deffeyes, Kenneth S., 2001. Hubbert's peak, Hardcover ed.Princeton University Press, Princeton NJ.
Del Rio, P., Unruh, G., 2007. Overcoming the lock-out of renewableenergy technologies in Spain: The cases of wind and solarelectricity. Renewable and Sustainable Energy Review 11 (7),1498–1513.
Dorfman, Robert, 1969. An economic interpretation of optimalcontrol theory. American Economic Review 59 (part 2), 817–831.
Energy Information Administration (EIA), 2004. World energyoutlook 2003. United States Department of Energy, EnergyInformation Administration, Washington DC.
Eriksson, Karl-Erik, Islam, S., Karlsson, S., Mansson, B., 1984.Optimal development of an economy with a bounded inflow ofone essential resource. Resources and Energy 6, 235–258.
Factor Ten Club, 1994 and 1997. Carnoules declaration. WuppertalInstitute, Wuppertal, Germany.
Frederick, K.D., Gleick, Peter H., 1990. Water resources and climatechange. In: Rosenberg, N..J (Ed.), Greenhouse Warming:Abatement and Adaptation. Resources for the Future,Washington DC.
Fussler, Claude, with James, Peter, 1996. Driving eco-innovation.London: Pittman Publishing Company.
Gale, David, 1967. On optimal development in a multi-sectoreconomy. Review of Economic Studies 34, 1–18.
Georgescu-Roegen, Nicholas, 1971. The entropy law and theeconomic process. Harvard University Press, Cambridge MA.
Gleick, Peter H., 1992. Water and conflict. Paper read at Project onEnvironment Change and Acute Conflict, September, atWashington DC.
Goeller, Harold, Weinberg, Alvin, 1976. The age of substitutability.Science 191.
Goodland, Robert, 1999. The biophysical basis of environmentalsustainability. In: van den Bergh, J.C.J.M. (Ed.), Handbook ofEnvironmental and Resource Economics. Edward Elgar, Ltd.,Cheltenham, UK.
Goodland, Robert, Daly, Herman E., 1996. Environmentalsustainability: universal and non-negotiable. EcologicalApplications 6, 1002–1017.
Goulder, Lawrence H., 1995. Environmental taxation and thedouble dividend: a reader's guide. International Tax and PublicFinance 2, 157–183.
Gowdy, John M., 1997. The value of biodiversity. Land Economics73 (25–41).
Gowdy, John, O'Hara, Sabine, 1997. Weak sustainability and viabletechnologies. Ecological Economics 22 (3), 239–248.
Grossman, Gene M., Krueger, Alan B., 1995. Economic growth andthe environment. Quarterly Journal of Economics 60, 353–377.
Guts, MC., 1996. The concept of weak sustainability. EcologicalEconomics 17, 147–156.
Hardin, G., 1968. The tragedy of the commons. Science 162,1243–1248.
Heywood, V.H., Watson, R.T. (Eds.), 1995. Global biodiversityassessment. Cambridge University Press, Cambridge, UK.
Hotelling, H., 1925. A general mathematical theory ofdepreciation. Journal of the American Statistical Association20, 340–353.
Hotelling, H., 1931. The economics of exhaustible resource. Journalof Political Economy 39, 137–175.
Intergovernmental Panel on Climate Change (IPCC), 1996. Thescience of climate change: Contribution of Working Group III:Intergovernmental Panel on Climate Change.
International Energy Agency, 2004. World energy outlook 2004.OECD/IEA, Paris.

309E C O L O G I C A L E C O N O M I C S 6 7 ( 2 0 0 8 ) 2 8 1 – 3 1 0
Intriligator, Michael D., 1971. Mathematical optimization andeconomic theory. Prentice-Hall, Englewood Cliffs NJ.
Jackson, Tim (Ed.), 2007. The Earthscan reader in sustainableconsumption. Earthscan, London.
Jaffe, AiBi, Stavins, RiNi, 1994. The energy-efficiency gap; whatdoes it mean? Energy Policy 22 (10), 804–810.
Jevons, William Stanley, 1866. The Coal Question: An inquiryconcerning the progress of the nation and the probablkyexhaustion of our coal mines, 3rd ed. MacMillan Company,London.
Jorgenson, Dale W., Houthakker, Hendrik S. (Eds.), 1973. US energyresources and economic growth. Energy Policy Project,Washington DC.
Kahn, Herman (with Simon, Julian), ed. 1984. The resourceful earth.Kahn, Herman, Brown, William, Martel, L., 1976. The next 200
years: a scenario for America and the world. William Morrow,New York.
Kaldor, Niko, 1971. Economics without equilibrium. M. E. SharpeInc., Armonk NY.
Kaldor, Nicholas, 1972. The irrelevance of equilibrium economics.Economic Journal 82.
Kamien, Morton, Schwartz, Nancy, 1978. Optimal exhaustibleresource depletion with endogenous technical change. Reviewof Economic Studies XLV.
Kendrick, John W., 1961. Productivity trends in the United States.Princeton University Press, Princeton NJ.
Khazzoom, J. Daniel, 1987. Energy savings resulting from theadoption of more efficient appliances. Energy Journal 8 (4),85–89.
Klare, Michael T., 2001. Resource wars: The new landscape ofglobal conflict. Henry Holt & Co., New York.
Kneese, Allen V., Ayres, Robert U., d'Arge, Ralph C., 1970. Aspectsof environmental economics: A materials balance-generalequilibrium approach. Johns Hopkins University Press,Baltimore MD.
Kneese, Allen V., Bower, Blair T. (Eds.), 1972. Environmentalquality analysis: Theory and method in the social sciences.Johns Hopkins University Press for Resources for the Future,Inc., Baltimore MD.
Koopmans, Tjalling, 1965. The concept of optimal economicgrowth. The Econometric Approach to Development Planning.North Holland, Amsterdam.
Kornai, Janos, 1973. Anti-equilibrium. North Holland PublishingCompany, New York.
Kuznets, Simon, 1930. Secular movements in production andprices: their nature and bearing on cyclical fluctuations.Houghton Mifflin, Boston MA.
Kuznets, Simon, 1963. Quantitative aspects of the economicgrowth of nations. Economic Development and CulturalChange 11 (2/II), 1–80.
La Riviere, J.W. Maurits, 1989. Threats to the world's water.Scientific American 261 (3), 48–58.
Laitner, Ji “Skip”, Finman, H., 2000. Productivity benefits fromindustrial energy efficiency investments. United States EPAOffice of Atmospheric Programs, Washington DC.
Lomborg, Bjorn, 2001. The skeptical environmentalist: Measuringthe real state of the world. Cambridge University Press,Cambridge, UK.
Lomborg, Bjorn, 2004. Global crises, global solutions. CambridgeUniversity Press, Cambridge, UK.
Lotka, AlfredJ., 1950. Elements of mathematical biology, 1st Reprinted. Dover Publications, New York. Original edition, 1924.
Lovins, Amory B., Lovins, L. Hunter, 1991. Least-cost climaticstabilization. Annual Review of Energy 25 (X).
Lovins, Amory B., Lovins, L. Hunter, Krause, Florentin, Bach,Wilfred, 1981. Least-cost energy: Solving the CO2 problem.Brickhouse Publication Co., Andover MA.
Malthus,ThomasRobert, 1946.Anessayontheprincipleofpopulationas it affects the future improvementof society. In:Abbott, L.D. (Ed.),
Masterworks of Economics: Digest of Ten Great Classics.Doubleday and Company, Inc., New York. Original edition, 1798.
McKenzie, Lionel W., 1981. Optimal economic growth. In: Arrow,K.J., Intriligator, M.D. (Eds.), Handbook of MathematicalEconomics: Part 4 — Mathematical Approaches to WelfareEconomics. North Holland, Amsterdam.
Meadows, Dennis L., Meadows, Donella H., Randers, Jorgen,Behrens III, William, 1972. The limits to growth, Club of RomeReports. Universe Books, New York.
Mill, John Stuart, 1848. Principles of political economy with someof their applications to social philosophy. C.C. Little and J.Brown, London.
Mills, Evan, Wilson, Deborah, Johansson, Thomas B., 1991. Gettingstarted: no regrets strategies for reducing greenhouse gasemissions. Energy Policy.
Mishan, E.J., 1967. The costs of economic growth, 1st ed. StaplesPress, London.
Morris, Samuel C., Solomon, Barry D., Hill, Douglas, Lee, John,Goldstein, Gary, 1990. A least cost energy analysis of US CO2
reduction options. In: Tester, J.W., Wood, D.O., Ferrari, N.A.(Eds.), Energy and the Environment in the 21st Century. MITPress, Cambridge MA.
Nelson, Kenneth E., 1989. Are there any energy savings left?Chemical Processing.
Neumayer, Eric, 2003. Weak vs strong sustainability: Exploring thelimits of two opposing paradigms, 2nd ed. Edward ElgarPublishing Ltd., Cheltenham, UK.
Newbery, David, Stiglitz, Joseph, 1982. The choice of techniquesand the optimality of market equilibrium with rationalexpectations. Journal of Political Economy 90.
Nordhaus, William D., 1973a. The allocation of energy resources.Brookings Papers on Economic Activity 3.
Nordhaus, William D., 1973b. World dynamics: measurementwithout data. Economic Journal 83, 1156–1183.
Odum,HowardT., 1973. Energy, ecology and economics. Ambio 2 (6),220–227.
Odum, Howard T., 1986. In: Polunin, N. (Ed.), Energy in ecosystems. InEnvironmentalMonographs andSymposia. JohnWiley,NewYork.
Pearce, David W., 1997. Substitution and sustainability: somereflections on Georgescu–Roegen. Ecological Economics 22 (3),295–298.
Pezzey, John, Toman, Michael A., 2002. Sustainability and itsinterpretations. Paper read at Scarcity and Growth in the NewMillennium, November 18-19, 2002, at Washington D.C.
Pigou, A.C., 1920. The economics of welfare, 1st ed. MacMillanCompany, London.
Pontryagin, Lev Semenovich, et al., 1962. Themathematical theoryof optimal processes. Interscience. John Wiley InterscienceNew York. ISBN 04 706 939 19.
Porter, Michael E., van der Linde, Claas, 1995. Green andcompetitive. Harvard Business Review 120–134.
Postel, Sandra, 1989. Water for agriculture: Facing the limits.Worldwatch Institute, Washington DC.
Radner, Roy, 1961. Paths of economic growth that are optimal withregard only to final states. Review of Economic Studies 28, 98–104.
Raskin, Paul, Hansen, Evan, Margolis, Robert, 1994. Water andsustainability: A global outlook. Stockholm EnvironmentInstitute, Boston MA.
Raskin, Paul, Gallopin, Gilberto, Gutman, Patrio, Hammond, Alan,Swart, Rob, 1998. Bending the curve:Towardglobal sustainability.Stockholm Environment Institute, Stockholm.
Rees, William E., 1999. Consuming the earth: the biophysics ofsustainability. Ecological Economics 29 (1), 23–28.
Ruth, Matthias, 2002. Optimal resource extraction. In: Ayres, R.U.,Ayres, L.W. (Eds.), A Handbook of Industrial Ecology. EdwardElgar, Cheltenham, UK.
Sant, RogerW., Carhart, Steven C., 1981. 8 great energy myths: Theleast cost energystrategy, 1978-2000.Carnegie-MellonUniversityPress, Pittsburgh PA.

310 E C O L O G I C A L E C O N O M I C S 6 7 ( 2 0 0 8 ) 2 8 1 – 3 1 0
Saunders, Harry, 1992. The Khazzoom–Brookes postulate andneoclassical growth. Energy Journal 13 (4), 131–148.
Schmidheiny, Stephen, 1992. Changing course: A globalperspective on development and the environment. The MITPress, Cambridge MA.
Schmidt-Bleek, Friedrich B., 1992. Ecorestructuring economies:operationalizing the sustainability concept. FreseniusEnvironmental Bulletin 1 (46).
Schmidt-Bleek, Friedrich, 1994. Wieviel Umwelt braucht dermensch? MIPS, Das Mass fuer kolologisches Wirtschaften.Birkhauser Verlag, Berlin.
Schurr, Sam H., Netschert, Bruce C., 1960. Energy in theAmerican economy, 1850-1975. Johns Hopkins UniversityPress, Baltimore MD.
Selden, T., Song, D., 1994. Environmental quality anddevelopment: is there a Kuznets curve for air pollutionemissions? Journal of Environmental Economics andManagement 27, 147–162.
Simon, Julian, 1980. Resources, population, environment: anoversupply of false bad news. Science 208, 1431–1437.
Simon, Julian, 1981. The ultimate resource. Princeton UniversityPress, Princeton NJ.
Smulders, Sjak, 1998. Technological change, economic growth andsustainability. In: van den Bergh, J., Hofkes, M. (Eds.), Theoryand Implementation of Economic Models for SustainableDevelopment. Kluwer Academic Publishers, Dordrecht, theNetherlands.
Smulders, Sjak, 2000. Economic growth and environmentalquality. In: Folmer, H., Gabel, H.L. (Eds.), Principles of Environ-mental Economics. Edward Elgar, Cheltenham, UK.
Solow, Robert M., 1973. Is the end of the world at hand? In:Weintraub, A., et al. (Eds.), The Economic Growth Controversy.
Solow, Robert M., 1974a. The economics of resources or theresources of economics. American Economic Review 64.
Solow, Robert M., 1974b. Intergenerational equity and exhaustibleresources. Review of Economic Studies 41, 29–45.
Solow, Robert M., 1992. An almost practical step towardssustainability. Resources for the Future, Washington DC.
Sraffa, Piero, 1960. Production of commodities by means ofcommodities: prelude to a critique of economic theoryCambridge University Press, Cambridge, UK.
Stahel, Walter R., 1982. The product life factor. In: Orr, S.G. (Ed.), AnInquiry into the Nature of Sustainable Societies. Houston AreaResearch Center, Houston TX.
Stahel, Walter R., Reday-Mulvey, Genevieve, 1981. Jobs fortomorrow: The potential for substitutingmanpower for energy.Vantage Press, New York.
Stern, D.I.E., Common, M.S., Barbier, Edward B., 1996. Economicgrowth and environmental degradation: the environmentalKuznets curve and sustainable development.WorldDevelopment24 (7), 1151–1160.
Stern, David I., 2004. Rise and fall of the environmental Kuznetscurve. World Development 32 (8), 1419–1439.
Stiglitz, Joseph, 1974. Growth with exhaustible natural resources.Efficient and optimal growth paths. Review of Economic Studies.
Stiglitz, Joseph, 1979. A neoclassical analysis of the economics ofnatural resources. In: Smith, V.K. (Ed.), Scarcity and GrowthReconsidered. Resources for the Future, Washington DC.
Toman, Michael A., 1994. Economics and sustainability: balancingtradeoffs and imperatives. Land Economics 70 (4), 399–413.
Toman, Michael A., Crosson, Pierre, 1991. Economics andsustainability: Balancing tradeoffs and imperatives. Resourcesfor the Future, Washington DC.
Ulanowicz, Robert E., 1986. Growth and development: Ecosystemsphenomenology. Springer-Verlag, New York.
von Neumann, John, 1945. A model of general economicequilibrium. Review of Economic Studies 13, 1–9.
vonWeizsaecker, Ernst Ulrich, Lovins, Amory B., Lovins, L. Hunter,1994. Faktor Vier. Droemer Knaur, Munich, Germany.
von Weizsaecker, Ernst Ulrich, Lovins, Amory B., Lovins, Li.Hunter, 1998. Factor four: Doubling wealth, halving resourceuse. Earthscan Publications Ltd, London.
Wang, Jusi, 1989. Water pollution and water shortage problems inChina. Journal of Applied Ecology 26, 851–857.
Ward, Barbara, Dubos, Ren, 1972. One earth: the care andmaintenance of a small planet. paperback ed. Penguin Books,Harmondsworth, UK.
Weitzman, Martin L., 1997. Sustainability and technical progress.Scandinavian Journal of Economics 99 (1), 1–13.
Weitzman, Martin L., 1999. Pricing the limits to growth by mineraldepletion. Quarterly Journal of Economics 114 (2), 691–706.
Wilson, Edward O., 1989. Threats to biodiversity. ScientificAmerican 261 (3), 60–66.
World Bank, 1992. World development report. Oxford UniversityPress, New York.
References for the Appendices
Ayres, Robert U., 1994. Information, entropy and progress.American Institute of Physics, New York.
Ayres, Robert U., Warr, Benjamin, 2003. Useful work andinformation as drivers of growth. INSEAD, Fontainebleau, France.
Ayres, Robert U., Warr, Benjamin, 2005. Accounting for growth: therole of physical work. Structural Change & Economic Dynamics16 (2), 181–209.
Ayres, Robert U., Ayres, Leslie W., Warr, Benjamin, 2003. Exergy,power and work in the US economy, 1900–1998. Energy 28 (3),219–273.
Ayres, Robert U., Ayres, Leslie W., Pokrovski, Vladimir, 2005. Onthe efficiency of US electricity usage since 1900. Energy 30,1092–1145.
Bagnoli, Philip, McKibben, Warwick J., Wilcoxen, Peter J., 1996.Future projections and structural change. Paper read atClimate Change: Integrating Science, Economics and Policy,December, at Laxenburg, Austria.
Gruebler, Arnulf, 1998. Technology and global change. CambridgeUniversity Press, Cambridge, UK.
Kuemmel, Reiner, 1980. In: Eichhorn, W., Henn, R. (Eds.), Growthdynamics in the energy dependent economy. MathematicalSystems in Economics, vol. 54. Oeigeschlager, Gunn & Hain,Cambridge, Mass.
Kuemmel, Reiner, Strassl, Wolfgang, Gossner, Alfred, Eichhorn,Wolfgang, 1985. Technical progress and energy dependentproduction functions. Journal of Economics 45 (3), 285–311.
Kuemmel, Reiner, Lindenberger, Dietmar, Eichhorn, Wolfgang,2000. The productive power of energy and economic evolution.Indian Journal of Applied Economics Special Issue on Macroand Micro Economics.
McKibben, W.J., Wilcoxen, P.J., 1994. The global costs of policies toreduce greenhouse gas emissions III. The BrookingsInstitution, Washington DC.
McKibben, W.J., Wilcoxen, P.J., 1995. The theoretical and empiricalstructure of the G- cubedmodel. In Brookings Discussion Paperson International Economics. Washington DC.
Szargut, Jan, Morris II, David R., Steward, Frank R., 1988. Exergyanalysis of thermal, chemical, and metallurgical processes.Hemisphere Publishing Corporation, New York.
Warr, Benjamin, Ayres, Robert U., 2006. The MEET-REXS model.Structural Change & Economic Dynamics 17, 329–378.