sustainability guidelines and forest market response: an ... · sustainability guidelines and...
TRANSCRIPT

Sustainability guidelines and forest market response: anassessment of European Union pellet demand in thesoutheastern United StatesCHR I STOPHER S . GAL IK 1 and ROBERT C. ABT2
1Nicholas Institute for Environmental Policy Solutions, Duke University, Box 90335, Durham, NC 27708, USA, 2Department
of Forestry and Environmental Resources, North Carolina State University, Campus Box 8008, Raleigh, NC 27695, USA
Abstract
Woody biomass from the southeast United States is expected to play an important role in meeting European
Union renewable energy targets. In crafting policies to guide bioenergy development and in guiding investment
decisions to meet established policy goals, a firm understanding of the interaction between policy targets and
forest biomass markets is necessary, as is the effect that this interaction will have on environmental and eco-
nomic objectives. This analysis increases our understanding of these interactions by modeling the response of
southern US forest markets to new pellet demand in the presence of sustainability sourcing or harvest criteria.
We first assess the influence of EU recommended sustainability guidelines on the forest inventory available to
supply EU markets, and then model changes in forest composition and extent in response to expected increasesin pellet demand. Next, we assess how sustainability guidelines can influence the evolution of forest markets in
the region, paying particular attention to changes in land use and forest carbon. Regardless of whether sustain-
ability guidelines are applied, we find increased removals, an increase in forest area, and little change in forest
inventory. We also find annual gains in forest carbon in most years of the analysis. The incremental effect of sus-
tainability guideline application on forest carbon and pellet greenhouse gas (GHG) balance is difficult to discern,
but results suggest that guidelines could be steering production away from sensitive forest types inherently less
responsive to changing market conditions. Pellet GHG balance shows significant annual change and is attribut-
able to the complexity of the underlying forest landscape. The manner by which GHG balance is tracked is thusa critical policy decision, reinforcing the importance and relevance of current efforts to develop approaches to
accurately account for the GHG implications of biomass use both in the United States and European Union.
Keywords: biomass, forest carbon, pellet, renewable energy directive, subregional timber supply model, sustainability guidelines
Received 23 February 2015; accepted 6 April 2015
Introduction
Woody biomass from the southeast United States is
expected to play an important role in meeting Euro-
pean Union renewable energy targets over the course
of the next decade (Joudrey et al., 2012; Goh et al.,
2013a). In crafting policies to guide bioenergy develop-
ment and in guiding investment decisions to meet
established policy goals, a firm understanding of the
interaction between policy targets and forest biomass
markets is necessary, as is the effect that this interac-
tion will have on environmental and economic out-
comes of concern. Absent this understanding, it is
possible that policies will either hinder the develop-
ment of a sustainable bioenergy market or complicate
the attainment of environmental (e.g., greenhouse gas
mitigation) or economic (e.g., maintenance of tradi-
tional forest product markets) objectives.
There are multiple factors influencing the volume of
woody biomass material exported from the southeastern
United States to the European Union, such as domestic
production of wood products, the prevailing price of
wood pellets, and policies in place both within the Uni-
ted States and the European Union (National Renewable
Energy Laboratory, 2013; Abt et al., 2014). Here, we
focus specifically on the role of EU policy. At present,
there are multiple interrelated policy initiatives influ-
encing biomass demand. One component of what are
collectively referred to as the 20/20/20 by 2020 targets
requires each EU Member State to contribute a set share
of renewable energy so as to collectively meet a 20%
EU-wide target (European Commission, 2009). A second
component is an EU-wide 20% GHG reduction target,
itself comprised of several directives and decisions
(Directive 2009/28/EC, Decision 406/2009/EC, andCorrespondence: Christopher S. Galik, tel. +1 919 681 7193,
fax +1 919 613 8712, e-mail: [email protected]
© 2015 The Authors. Global Change Biology Bioenergy Published by John Wiley & Sons Ltd.
This is an open access article under the terms of the Creative Commons Attribution License,
which permits use, distribution and reproduction in any medium, provided the original work is properly cited. 1
GCB Bioenergy (2015), doi: 10.1111/gcbb.12273

Decision 2013/162/EU). The third component of the
20/20/20 policy is outlined by Directive 2012/27/EU
and requires an EU-wide 20% improvement in effi-
ciency.
Although policy continues to evolve (European Com-
mission, 2014), these policy initiatives and others oper-
ating within individual EU Member States [e.g., the
Renewables Obligation in the United Kingdom, SDE+(Stimulering Duurzame Energieproductie) program in the
Netherlands] are likely to drive demand for renewable
energy, generally, and southeastern US pellets, specifi-
cally. Previous analysis suggests that a doubling of bio-
mass electricity production is possible by 2020
(Beurskens et al., 2011) and that increased biomass pro-
duction within the EU itself is likely insufficient to meet
projected demands (Hewitt, 2011). Against this potential
shortfall, the United States is expected to supply a sig-
nificant volume of pellets to the European Union (e.g.,
Goh et al., 2013a). As of 2013, trade data already sug-
gested that wood pellets from the United States com-
prised nearly half (45%) of imports into the European
Union, with approximately three-quarters of total US
pellet production capacity falling within the southern
region (Goetzl, 2015).
Other policy holds the potential to limit the supply
of southeastern US biomass to European renewable
energy markets, specifically criteria or requirements
that govern the source and conditions under which
woody biomass may be harvested and/or imported
(Hewitt, 2011; Schueler et al., 2013; Lamers et al.,
2014). These criteria or requirements are broadly
referred to here as sustainability guidelines. Of partic-
ular relevance are proposed guidelines released by
the European Commission in 2010 (European Com-
mission, 2010). Although they themselves do not pre-
scribe minimum performance requirements for woody
biomass, these guidelines are intended to provide a
basis for development of sustainability policies by
individual Member States. In substance, the guide-
lines mirror previous requirements developed for
biomass for liquid biofuel production and empha-
size elements relating to GHG emissions, land use
and land-use change, and chain of custody verifica-
tion (European Commission, 2009, 2010). In practice,
the guidelines add to an already complex pol-
icy landscape, one already characterized by the pres-
ence of multiple other requirements or draft
standards (see, e.g., Vis et al., 2008; van Dam et al.,
2010; Ladanai & Vinterb€ack, 2010; Scarlat & Dalle-
mand, 2011; Kittler et al., 2012; Fritsche et al., 2014;
Lamers et al., 2014).
These evolving policies have prompted a wide array
of supply assessments and other forest market analy-
ses in recent years. Multiple woody biomass supply
assessments have been generated for the southeastern
United States and individual states within it (Galik
et al., 2009; Gronowska et al., 2009; Abt et al., 2010b,
2014; La Capra Associates, 2011; Colnes et al., 2012).
Research has also explored the role of global bioener-
gy policies in driving demand for biomass (Junginger
et al., 2009; Sikkema et al., 2011; Joudrey et al., 2012;
Lamers et al., 2012; Goh et al., 2013a). Of particular rel-
evance to emerging bioenergy policy deliberations are
those studies spanning the two literatures, those that
provide an indication of potential supply under policy
restrictions. Within this category of research, works by
Frank et al. (2013), Schueler et al. (2013), Lamers et al.
(2014), and Sikkema et al. (2014) are especially infor-
mative, speaking to the influence of policy in shaping
the international market for bioenergy and bioenergy
feedstock.
This study builds upon these recent contributions and
assesses the interaction between EU bioenergy policy
and southeastern US woody biomass supply. By assess-
ing possible compliance of discrete forested areas in the
southeast United States against EU sustainability crite-
ria, the analysis represents a more tailored approach to
the work conducted in Schueler et al. (2013) and Lamers
et al. (2014), in which they model the implications of
various sustainability criteria on the global trade of bio-
mass. It also mirrors the approach of Frank et al. (2013),
in which EU Renewable Energy Directive 2009/28/EC
(RED) sustainability criteria are applied to global liquid
biofuel production. In another respect, the analysis
broadens the forest carbon assessment conducted by
Jonker et al. (2014) to include an evaluation of the mar-
ket feedbacks triggered by an increase in biomass
demand. The end result is an integrated economic
assessment of southeastern US wood pellet supply in
the presence of sustainability and GHG reduction crite-
ria, indirect market effects, and spatially explicit land-
use change.
Materials and methods
In the section that follows, we first describe the subregional
timber supply (SRTS) model. Next, we outline the approach
by which expected pellet demand is estimated. We follow
with a description of two interrelated components of the rec-
ommended sustainability guidelines and how these are incor-
porated into the analysis. The first component is a minimum
GHG reduction for feedstocks used to meet renewable energy
targets. The second component is a suite of broader sustain-
ability requirements that speak more to where and how that
material is sourced. We follow with a description of how
these guidelines may be applied in the southeastern United
States. We then examine the influence of sustainability guide-
line sourcing restrictions on forests and forest markets in the
presence of expected increases in pellet demand. Finally, we
© 2015 The Authors. Global Change Biology Bioenergy Published by John Wiley & Sons Ltd., doi: 10.1111/gcbb.12273
2 C. S . GALIK & R. C. ABT

outline a comparative analysis to examine the influence of
sourcing restrictions on resulting GHG balance.
Overview and application of the subregional timbersupply (SRTS) model
The subregional timber supply (SRTS) model is a timber mar-
ket projection system. It solves for a recursive product market
equilibrium using market parameters derived from economet-
ric studies, forest dynamics based on USDA Forest Service
data, and exogenous demand forecasts. It utilizes field inven-
tory and timber product output data from the US Forest Inven-
tory and Analysis (FIA) program to characterize resource
conditions and harvest activity. For each year, SRTS models
equilibrium harvest and stumpage price by product category
(softwood/hardwood, pulpwood/sawtimber) and owner type
(corporate/noncorporate) in response to demand shifts, adjust-
ing forest inventories to account for equilibrium-derived remo-
vals and empirically estimated growth. It has, in recent years,
been used to evaluate the contributions of forest biomass to
regional renewable energy policy targets (Abt et al., 2010a,b),
the possible influence of biomass harvest restrictions on domes-
tic energy policy compliance (La Capra Associates, 2011), the
influence of different accounting methods on bioenergy GHG
balance (Galik & Abt, 2012), the influence of improved produc-
tivity on forest carbon storage (Abt et al., 2012), and the possi-
ble effects of EU pellet demand in the southeastern United
States (Abt et al., 2014). A more detailed overview of the model
itself can be found in Abt et al. (2009) and Prestemon & Abt
(2002).
This analysis compares multiple SRTS runs to gain insight
into two separate but related phenomena: (i) the influence
of the projected level of pellet demand on US southeastern
forest markets, with an emphasis on the resulting changes
in forest extent and composition, and (ii) the incremental
influence of EU sustainability guidelines on forest markets,
again with an emphasis on forest extent and composition. In
practice, this yields four separate model runs that can be
compared to generate insight into the question of interest: a
baseline run (no pellet demand), a restricted sourcing base-
line run (no pellet demand, areas screened for sustainability
guideline compliance), a pellet scenario run (new pellet
demand in the absence of sustainability guidelines), and a
restricted sourcing pellet run (new pellet demand and areas
screened for sustainability guideline compliance). Compari-
son of pellet and baseline scenarios provides insight into the
influence of the projected level of pellet demand on forest
markets in the southeastern US. Comparison of the restricted
and unrestricted pellet sourcing scenarios meanwhile helps
to discern the potential influence of EU sustainability guide-
lines on forest market response.
Estimation of expected pellet demand
Estimation of expected pellet demand, including imports from
the United States, can be achieved through multiple avenues.
One approach is to look to individual EU Member State
National Renewable Energy Action Plans (NREAP), which out-
line the expected use of renewable energy over the coming
years, including specific estimates of total biomass demand.
Also generally included in NREAPs are projections of domestic
biomass supply and expected biomass imports. Although con-
ceivably a valuable resource for determining total EU and
Member State demand for imported biomass (e.g., Frank et al.,
2013), it is difficult to use the plans for the express purpose of
determining the magnitude of non-EU imports (Atanasiu, 2010;
Beurskens et al., 2011). Analysis by Joudrey et al. (2012) makes
this readily apparent, exposing large gulfs between individual
Member State domestic supplies, Member State expected
imports, and total projected renewable generation.
In light of these challenges, we instead generate our estimate
of pellet demand in the southeastern US based on announced
pellet production capacity data from Forisk Consulting LLC.
Forisk tracks current, in process, and announced pellet produc-
tion volumes and provides an indication of changes in pellet
production expected to occur in the near future. To assess the
likelihood that announced production will actually result in
built capacity, Forisk applies screens to the announced data
based on permitting, site acquisition, and technology filters.
Even with these feasibility screens, it is difficult to know which
of these facilities will actually be built. To account for this
uncertainty, we simply take the average of the total from facili-
ties that meet Forisk’s screen and the total from all announced
facilities as of December 2014, yielding an annual demand of
12.2 million green tonnes (13.4 million green short tons) of con-
sumption for pellets, or approximately 5.9 million tonnes of
new pellet demand. We assume that demand increases loga-
rithmically from zero to 12.2 million tonnes over a period of
15 years and then remains constant for the balance of our 30-
year projection period. This time period extends well beyond
the aforementioned 2020 policy target, but provides an indica-
tion of how forest markets respond to the imposition of new
demand in both short- and mid-term time horizons. Both pro-
jection timing and magnitude of additional demand are well
within the range of previous analyses making use of the SRTS
modeling platform (Abt et al., 2012; Galik & Abt, 2012).
Table 1 Relevant proposed sustainability guidelines for the use of solid and gaseous biomass sources in electricity, heating, and
cooling. Source: European Commission (2009, 2010)
Objective Proposed target or requirement
Greenhouse gas reductions Requires minimum initial GHG reductions of 35%, increasing to 50% by 2017 and 60% by 2018
Land-use protection Prohibits harvested material from high biodiversity value areas, high carbon stock areas, and
undrained peat land
Sourcing verification Requires chain of custody verification using a mass balance approach
© 2015 The Authors. Global Change Biology Bioenergy Published by John Wiley & Sons Ltd., doi: 10.1111/gcbb.12273
SUSTAINABILITY GUIDELINES AND MARKET RESPONSE 3

Applying sustainability guidelines to southeastern USforests
Elements of the proposed guidelines most relevant for biomass
production in the southeastern United States for use in the
European Union are described in Table 1. As with estimation
of pellet demand itself, there are several means by which
sustainability guidelines may be operationalized so as to pro-
vide an indication of the expected direction and magnitude of
guideline influence on the development of domestic pellet mar-
kets. In practice, this has the potential to yield a variety of out-
comes depending on how the guidelines are applied (Thiffault
Table 2 Data used to evaluate the influence of sourcing restrictions on woody biomass supply dynamics. Source and description are
indicated for each
State Data layer/source Description Relevant sustainability criteria
AL Alabama Gap Analysis Project
(AL-GAP), ‘private land – no
known restrictions’ removed*
Conservation lands, both public and voluntarily-
provided private.
Exclusion of lands with high
biodiversity value; Exclusion of
lands designated for nature
purposesAR AR-GAP Land cover and
Stewardship GIS data, Gap
Status 1–3 only†
Areas managed for conservation purposes by
federal, state, or private entities.
FL Florida Conservation Lands
2013‡
Local, State, Federal, and Private lands managed
for conservation.
GA Stewardship Lands, Gap Status 1
–3 only§
Areas currently managed by state, local, and
private entities for conservation purposes.
LA National Conservation Easement
Database, All recorded
easements¶
All recorded easements, regardless of GAP status,
holder, or landowner type
National Wildlife Refuges and
other Federal LandskNational Wildlife Refuges
MS Stewardship Lands, Gap Status 1
–3 only§
Areas managed for conservation purposes by
federal, state, or private entities.
NC Stewardship Lands, Gap Status 1
–3 only§
Areas managed for conservation purposes by
federal, state, or private entities.
SC Stewardship Lands, Gap Status 0
removed (no protection
information provided)§
Areas managed for conservation purposes by
federal, state, or private entities.
TN Stewardship Lands, Gap Status 5
removed (no legal protections)§
Areas managed for conservation purposes by
federal, state, or private entities.
VA Conservation Lands** Lands in public and private protective
management (excluding private conservation
easements)
ALL Conterminous United States
Land Cover, 200-Meter
Resolution††
1992 Raster providing land cover characteristics
for conterminous United States.
N/A
Water bodies and Wetlands of
the United States‡‡
1 : 1 000 000-Scale water bodies and wetlands of
the United States, clipped to region
Exclusion of wetlands and peat
lands
National Parks§§ Boundaries of National Parks, clipped to region Exclusion of lands designated for
nature purposes
*http://www.auburn.edu/academic/forestry_wildlife/alabama_gap_analysis_project/index.php?id=stewardship_data (last accessed
29 January 2015).
†http://cast.uark.edu/gap/arcdata.html (last accessed 29 January 2015).
‡http://www.fnai.org/gisdata.cfm (last accessed 10 December 2013).
§ftp://ftp.gap.uidaho.edu/products/ (last accessed 29 January 2015).
¶http://nced.conservationregistry.org/reports/easements?report_state=Louisiana&report_type=All (last accessed10 December 2013).
krefuges: http://www.atlas.lsu.edu/search/ (last accessed 29 January 2015).
**http://www.dcr.virginia.gov/natural_heritage/cldownload.shtml (last accessed 10 December 2013).
††http://nationalmap.gov/small_scale/mld/lancovi.html (last accessed 29 January 2015).
‡‡http://nationalmap.gov/small_scale/mld/1lakesp.html (last accessed 10 December 2013).
§§http://www.nps.gov/gis/data_info/ (last accessed 10 December 2013).
© 2015 The Authors. Global Change Biology Bioenergy Published by John Wiley & Sons Ltd., doi: 10.1111/gcbb.12273
4 C. S . GALIK & R. C. ABT

et al., 2015). One conceptual approach for applying the
guidelines to a given landscape is to assume a narrow window
of compliance and assume that only those lands certified to an
existing forest certification program are eligible to supply EU
pellet markets. An alternative approach is to assume a broader
window and assume that only those areas that specifically fail
to meet the conditions outlined in the recommended guidelines
are ineligible to supply EU markets.
Forest certification standards – such as Sustainable Forestry
Initiative (SFI), Forest Stewardship Council (FSC), and Ameri-
can Tree Farm System (ATFS) – and metastandards – Program
for the Endorsement of Forest Certification (PEFC) – generally
do not contain provisions directly pertaining to EU GHG
reduction requirements. They do, however, contain several pro-
visions with the potential to address a variety of other sustain-
ability requirements, particularly those pertaining to
management and land-use change (e.g., Kittler et al., 2012; UK
Department of Energy and Climate Change, 2014). Attempts to
use certified acres in the southeastern US to estimate the mini-
mum land base from which biomass may be supplied proved
unsuccessful, however. Searches of individual program web-
sites for up-to-date and comprehensive data on total area certi-
fied and certified tract location yielded only FSC state-level
totals (Forest Stewardship Council, 2013). Data requests sent
directly to FSC, SFI, and ATFS programs (all messages sent
December 3, 2013) were likewise unsuccessful in yielding more
comprehensive data, as was a review of alternative third-party
summaries (e.g., Forest2Market, 2011).
In the absence of spatially explicit data on certified forest
areas, we instead establish a maximum area from which bio-
mass may be supplied by screening for areas specifically pro-
hibited by EU sustainability criteria: protected areas; areas of
high biodiversity and conservation value; and undrained peat
lands or wetlands. This exercise is similar to the approach
conducted in La Capra Associates (2011) and Galik & Abt
(2011). Here, the analysis begins with an assembly of natural
resource and land management data (Table 2). We utilize
National Atlas water body and wetland data to simulate the
effect of barring material harvested from wetlands. We like-
wise utilize state-level stewardship data, generally obtained
from the USGS Gap Analysis Program (GAP), to simulate the
effect of barring harvests from lands with either high biodi-
versity lands or those that are specifically set aside for con-
servation purposes. When an appropriate GAP dataset could
not be located for a given state, we made use of state-level
data on easements and protected areas to yield a similar out-
come. Areas identified through this exercise can be seen in
Fig. 1.
The resulting geospatial dataset is then overlaid with land
cover data in ArcGIS 10.2.2. (Esri, Redlands, CA, USA), using
the Tabulate Area tool to estimate the percent area of different
forest types potentially restricted from harvest. The forest types
reflect primary land-use cover types as defined by the US Geo-
logic Survey and represented in the 1992 land-use cover dataset
(US Geologic Survey, 2015). These four classification types –
(41) deciduous, (42) evergreen, (43) mixed, and (91) woody
wetland – correspond to four of the five primary management
types used in the SRTS model (upland hardwood, natural pine,
mixed pine, and lowland hardwood, respectively). A fifth SRTS
management type – planted pine – was assumed to be unaf-
fected by the sustainability guidelines.
Values of potential harvest restriction were found to vary by
both forest type and county, ranging between zero and well
over 40% of presently harvestable forest area, but with a major-
ity of county–forest type combinations falling in the 0–5%
range (Figs S1–S4). These county-level harvest restrictions were
LegendAreas of potential harvest restrictions
0 250 500 kilometers125
Fig. 1 Map of potential areas of harvest restrictions based upon an interpretation of proposed European Union sustainability guide-
lines. Shown are protected areas, areas identified as having special conservation significance, private lands covered by conservation
easements, or areas classified as wetlands or other water bodies.
© 2015 The Authors. Global Change Biology Bioenergy Published by John Wiley & Sons Ltd., doi: 10.1111/gcbb.12273
SUSTAINABILITY GUIDELINES AND MARKET RESPONSE 5

then used to adjust the inventory input files upon which
SRTS model runs were made. In this way, the inventory
adjustments are derived directly from adjustments in forest
area. It is possible that the areas identified in this screening
process are fundamentally different that areas not identified,
possessing either a higher or lower per area volume. The
exercise is likewise limited to an identification of so-called
no go areas and does not directly consider the influence of
harvest or management restrictions on remaining lands (see,
e.g., Fritsche et al., 2014). For this analysis, however, this
screening process provides a sufficient approximation of the
effects of applying sustainability guidelines at the regional,
landscape level.
Calculation of GHG balance
Once model output was generated under baseline and pellet
demand scenarios, price, inventory, removals, land-use change,
and carbon data were compared to assess potential drivers of
observed outcomes. Output was also assessed for compliance
against GHG reduction targets. To estimate approximate
annual GHG emission (AE) per tonne of pellets in year t, the
following equation was used:
AEt ¼ ððDt � ð2:032 � 0:25Þ þ FtÞ � 3:667Þ þ ðDt � PÞDt
ð1Þ
where Dt is the pellet demand in tonnes in year t, and Ft is
the observed change in forest carbon in year t. Conversion
factors of 2.032 and 0.25 are used to convert pellet demand
into units of green tonnes of biomass input and fraction
carbon, respectively. A conversion factor of 3.667 is used to
convert units of carbon into units of carbon dioxide equiv-
alent (CO2e). P is equal to a per pellet process and trans-
portation emissions factor, estimated by Dwivedi et al.
(2014) to be 34.4 g CO2e per kg pellet burned. To convert
from an annual GHG balance to cumulative GHG bal-
ance, we modify Eqn (1), in which the cumulative emissions
(CE) per tonne of pellets in year t is now equal to as fol-
lows:
CEt ¼P1
t D � ð2:032 � 0:25Þ þP1t F
� �� 3:667
� �þ P1
t D � P� �
P1t D
ð2ÞAEt and CEt are then compared to emissions associated with
coal generation to estimate percent reduction in year t per the
following equations:
Annual Percent Reduction ¼ C� AEt
Cð3Þ
Cumulative Percent Reduction ¼ C� CEt
Cð4Þ
0
500 000
1 000 000
1 500 000
2 000 000
2 500 000
3 000 000
3 500 000
4 000 000
2010 2015 2020 2025 2030 2035 2040
Hec
tare
s
Plantation
Natural
Mixed
UplandHwd
BottomHWD
Fig. 2 Land-use change associated with imposing an expected pellet consumption of 12.2 million tonnes in the presence of sustain-
ability guideline sourcing restrictions.
© 2015 The Authors. Global Change Biology Bioenergy Published by John Wiley & Sons Ltd., doi: 10.1111/gcbb.12273
6 C. S . GALIK & R. C. ABT

where C is the emission rate of coal per the energy equivalent
of 1 tonne of wood pellet, assumed here to be constant for all
years in the projection period. We assume wood pellets to have
an energy content of 18 MJ per tonne (Goh et al., 2013b) and
coal to have an emissions rate of 252.8 g CO2e per MJ. Coal
emissions’ intensities are derived from 2012 Fuel Mix Disclo-
sure (FMD) regulations as reported in UK Department of
Energy and Climate Change (2011) and converted to units of g
CO2e/MJ using a conversion factor of 1 kWh equals 0.0036 GJ
as reported for 2013 by UK Department for Environment Food
& Rural Affairs (2015).
Results
Estimated pellet demand is found to have a small rela-
tive impact on regional forest product prices, removals,
and inventories. Removals and price show upward
pressure in all forest product categories across both
restricted and unrestricted sourcing scenarios (Figs S5–14). Price of pine pulpwood increases approximately
50% over the baseline in both sourcing scenarios. Pulp-
wood provides the majority of feedstock to meet the
12.2 million tonnes of estimated pellet consumption and
thus bears the brunt of expected harvest change. Even
so, projected levels of price change for this feedstock fall
within levels of historic variation. Indices of change are
substantially lower in all other metrics and forest prod-
uct categories.
The small relative changes in price, inventory, and
removals do, however, translate into substantial land-
use and carbon effects at the regional level. Comparing
restricted baseline and pellet scenarios indicates the rel-
ative change attributable to additional pellet demand
under sustainability sourcing restrictions (Fig. 2). We
show a substantial increase in the area of all forest types
in the presence of increased pellet demand, with the
change dominated by an increase in planted pine. In
comparing the land-use change projected in the sourc-
ing restriction scenario with that in the unrestricted sce-
nario (Fig. 3), two findings quickly become apparent.
The first is the reduced area of natural pine, mixed pine,
bottomland hardwood, and upland hardwood in the
restricted scenario. This is understandable, as land area
in these forest types was removed from the scenario to
model compliance with the sustainability guidelines. A
second finding is the relative increase in planted pine in
the sourcing restriction scenario. As land area in this
forest type was unaffected by application of the sustain-
ability guidelines, the change reflects a net gain in
–3 500 000
–3 000 000
–2 500 000
–2 000 000
–1 500 000
–1 000 000
–500 000
0
500 000 2010 2015 2020 2025 2030 2035 2040
Hec
tare
s
Plantation Natural Mixed UplandHwd BottomHWD
Fig. 3 Relative land-use change in the restricted sourcing scenario as compared to the unrestricted scenario. Both scenarios assume
an expected pellet consumption of 12.2 million tonnes.
© 2015 The Authors. Global Change Biology Bioenergy Published by John Wiley & Sons Ltd., doi: 10.1111/gcbb.12273
SUSTAINABILITY GUIDELINES AND MARKET RESPONSE 7

planted pine acreage in the presence of increased pellet
demand in the restricted sourcing scenario as compared
to the unrestricted one.
The inventory, removal, and land-use change effects
collectively influence regional carbon storage (Fig. 4).
Across both restricted and unrestricted sourcing scenar-
ios, the imposition of 12.2 million tonnes of woody bio-
mass demand generates annual gains in forest carbon in
most assessment years, with very little change seen
between the two scenarios. Compiling these annual
fluxes shows a slow increase in forest carbon stock over
time, accumulating to well over 60 million tonnes of car-
bon over the baseline scenarios by the end of the assess-
ment scenario in 2040. This finding in itself suggests
compliance with sustainability guideline criteria that
pellets achieve specific levels of net GHG reductions,
but conversion of estimated carbon gains to a per tonne
pellet unit of measure can help to better evaluate perfor-
mance.
Intuitively, the annual and cumulative forest carbon
benefit per tonne of pellets produced under both a
restricted and unrestricted policy scenario follows the
annual change in forest carbon displayed in Fig. 4, with
the exception that early year changes are somewhat
exacerbated (Fig. S15). This is attributable to the early
‘ramping up’ trajectory assumed for the onset of pellet
demand, meaning that there are fewer pellets to which
changes in forest carbon may be allocated. Comparing
cumulative carbon change to cumulative pellet produc-
tion reduces year-over-year volatility, yielding a posi-
tive long-term GHG benefit per tonne pellet produced
(i.e., a net GHG reduction relative to no pellet increase
baseline). Note that these measures of cumulative bene-
fit are simply measures of annual carbon change and
pellet production volume; they do not take into account
the timing of emissions of sequestration, suggested else-
where in the literature to be an important component of
GHG accounting (Cherubini et al., 2011).
Comparing these annual changes in forest carbon to
the emissions associated with pellet combustion, emis-
sions associated with pellet production and transport,
and the emissions associated with coal generation, a
more complete sense of the aggregate GHG impact of
pellet production becomes apparent (Fig. 5). When com-
pared against the GHG reduction standards proposed
for years 2017 and 2018, pellets in both restricted and
unrestricted sourcing scenarios generally meet mini-
mum reduction requirements when used as a substitute
–3 000 000
–2 000 000
–1 000 000
0
1 000 000
2 000 000
3 000 000
4 000 000
5 000 000
6 000 000
7 000 000
2010 2015 2020 2025 2030 2035 2040
Tonn
es c
arbo
n
Restricted sourcing
Unrestricted sourcing
Fig. 4 Estimate of annual changes in forest carbon (tonnes C) associated with the estimated level of pellet production in both
restricted and unrestricted sourcing scenarios. Positive values reflect a net greenhouse gas benefit.
© 2015 The Authors. Global Change Biology Bioenergy Published by John Wiley & Sons Ltd., doi: 10.1111/gcbb.12273
8 C. S . GALIK & R. C. ABT
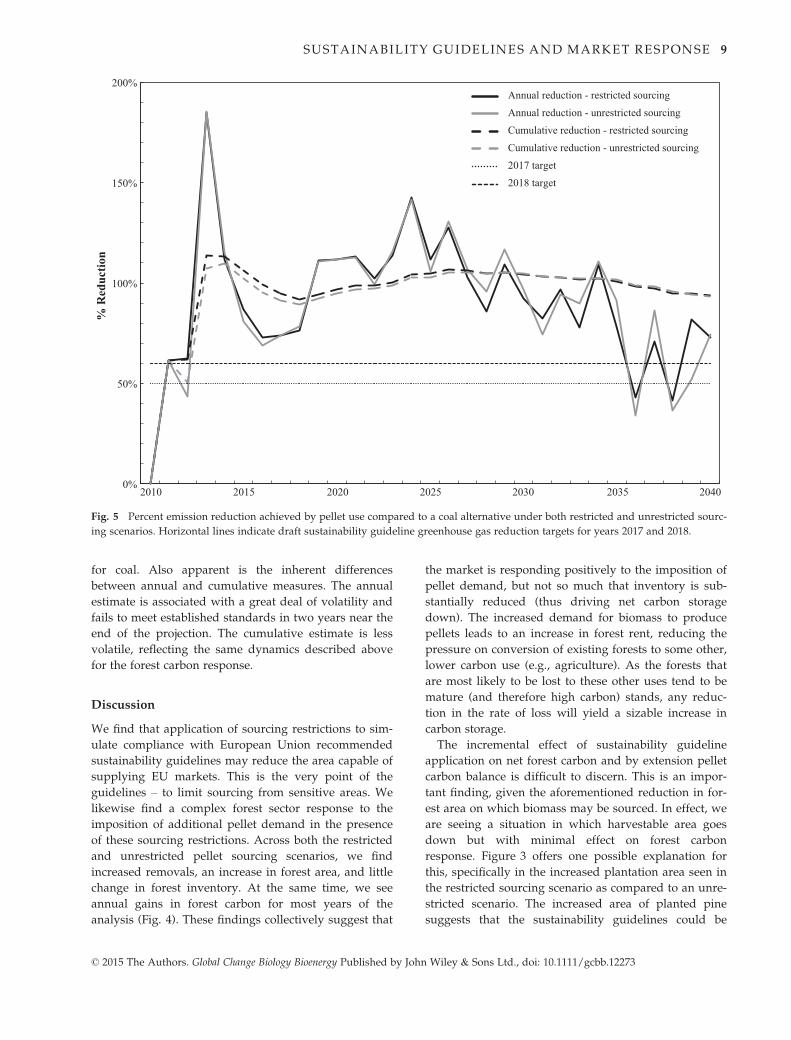
for coal. Also apparent is the inherent differences
between annual and cumulative measures. The annual
estimate is associated with a great deal of volatility and
fails to meet established standards in two years near the
end of the projection. The cumulative estimate is less
volatile, reflecting the same dynamics described above
for the forest carbon response.
Discussion
We find that application of sourcing restrictions to sim-
ulate compliance with European Union recommended
sustainability guidelines may reduce the area capable of
supplying EU markets. This is the very point of the
guidelines – to limit sourcing from sensitive areas. We
likewise find a complex forest sector response to the
imposition of additional pellet demand in the presence
of these sourcing restrictions. Across both the restricted
and unrestricted pellet sourcing scenarios, we find
increased removals, an increase in forest area, and little
change in forest inventory. At the same time, we see
annual gains in forest carbon for most years of the
analysis (Fig. 4). These findings collectively suggest that
the market is responding positively to the imposition of
pellet demand, but not so much that inventory is sub-
stantially reduced (thus driving net carbon storage
down). The increased demand for biomass to produce
pellets leads to an increase in forest rent, reducing the
pressure on conversion of existing forests to some other,
lower carbon use (e.g., agriculture). As the forests that
are most likely to be lost to these other uses tend to be
mature (and therefore high carbon) stands, any reduc-
tion in the rate of loss will yield a sizable increase in
carbon storage.
The incremental effect of sustainability guideline
application on net forest carbon and by extension pellet
carbon balance is difficult to discern. This is an impor-
tant finding, given the aforementioned reduction in for-
est area on which biomass may be sourced. In effect, we
are seeing a situation in which harvestable area goes
down but with minimal effect on forest carbon
response. Figure 3 offers one possible explanation for
this, specifically in the increased plantation area seen in
the restricted sourcing scenario as compared to an unre-
stricted scenario. The increased area of planted pine
suggests that the sustainability guidelines could be
0%
50%
100%
150%
200%
2010 2015 2020 2025 2030 2035 2040
% R
educ
tion
Annual reduction - restricted sourcing
Annual reduction - unrestricted sourcing
Cumulative reduction - restricted sourcing
Cumulative reduction - unrestricted sourcing
2017 target
2018 target
Fig. 5 Percent emission reduction achieved by pellet use compared to a coal alternative under both restricted and unrestricted sourc-
ing scenarios. Horizontal lines indicate draft sustainability guideline greenhouse gas reduction targets for years 2017 and 2018.
© 2015 The Authors. Global Change Biology Bioenergy Published by John Wiley & Sons Ltd., doi: 10.1111/gcbb.12273
SUSTAINABILITY GUIDELINES AND MARKET RESPONSE 9

steering production toward those management types
most responsive to changing market conditions. Con-
versely, application of the guidelines could also be seen
as steering production away from sensitive manage-
ment types that are inherently less responsive to chang-
ing market conditions. Application of the guidelines
could therefore be further focusing harvests on more
productive forests, limiting the role of less efficient
sources. Stated another way, removal of sensitive lands
from potential harvest could be enhancing the response
of remaining areas, areas which are likewise capable of
significant production response. This is in line with pre-
vious research showing the intensification of manage-
ment in other systems in response to the imposition of
new demand (e.g., Hertel et al., 2010).
Broadly speaking, these findings are also in line
with previous research that found GHG-based sustain-
ability criteria to have only limited effect on bioenergy
market development (Hoefnagels et al., 2014). They
are, however, somewhat in contrast to the substantial
reduction in trade volume found in work assuming a
feedstock-based exclusion or ‘blacklist’ type approach
(Lamers et al., 2014). This highlights the crucial role
that sustainability guideline implementation and GHG
accounting decisions are expected to play (Galik &
Abt, 2012; Thiffault et al., 2015). With specific regard
to the latter, the development of accounting systems
to adequately capture the GHG implications of bio-
mass use remains underway in both the United States
and European Union (Stephenson & MacKay, 2014;
US Environmental Protection Agency, 2014). The find-
ings here reinforce the importance and relevance of
these efforts. As Fig. 5 shows, cumulative GHG benefit
in the restricted sourcing scenario is positive across
the entire model run. This is in contrast to a rising
and then falling annual estimate. If one uses cumula-
tive GHG balance (or if one is allowed to ‘bank’ years
of realized overcompliance with a reduction standard),
the results here suggest that use of US southeastern
pellets sourced in compliance with EU recommended
sustainability guidelines could represent a viable GHG
reduction strategy, at least at the magnitude of pellet
demand and over the time periods assessed here. Use
of an annual GHG balance metric suggests that there
will be multiple years of clear overcompliance and
some years in which compliance must be more closely
scrutinized.
Furthermore, regional phenomena such as changes
at the extensive (i.e., land-use change) and intensive
(i.e., management) margins imply that an individual
stand- or harvest-level accounting approach is likely
to be incomplete. The inherent dynamics of the US
southeastern forest landscape make it difficult for a
single-pellet purchaser to know for certain what the
full GHG implications of his or her purchase will be
absent the use of outside data or tools to assess the
broader impacts. Complicating matters further, any
significant addition of new bioenergy demand intro-
duces the possibility of inter-regional shifts in patterns
of biomass supply, also known as leakage. Although
these shifts are expected to be small in this analysis
given the magnitude of additional demand assessed,
previous analyses have highlighted the potential sig-
nificance of the phenomenon on a global scale (Frank
et al., 2013).
Ultimately, the ability of biomass produced in the
southeastern United States to meet projected EU
demand will likely depend on satisfaction of multiple
policy criteria. Despite the important role southeastern
US forests are expected to play in meeting EU renew-
able energy targets, an integrated assessment of bio-
mass supply from the region against these
sustainability criteria has heretofore been performed.
Here, we provide such an analysis. We establish the
primary drivers of EU biomass demand, identify the
relevant sustainability criteria that they contain, review
the relevant data from which biomass supply may be
screened, and conduct a comparative economic model-
ing exercise to isolate the incremental changes associ-
ated with increasing pellet demand and application of
sustainability criteria. In doing so, the analysis fills a
critical gap in the literature and helps to inform ongo-
ing policy deliberations both within the United States
and in the European Union.
Future work can build upon the approach outlined
here. Although justified, critical assumptions are made
for both wood pellet demand and the basis for sustain-
ability guideline implementation in the southeastern
United States. Future analyses should assess the extent
to which the findings of this analysis hold across a
variety of other potential demands and policy drivers.
For example, this analysis assumes constant biomass
demand within the United States, but current regula-
tory proceedings under the auspices of the President’s
Clean Power Plan could provide incentives for greater
domestic biomass use in the future. Examining the
implications of directing harvests to certified acres is
another exercise that was precluded by available data
here, but would nonetheless be of great use and impor-
tance to ongoing policy deliberations. Future research
could likewise add Natural Heritage data as a separate
sensitivity analysis to better gauge the effects of biodi-
versity-related sustainability criteria. In an era where
increasing attention is being paid to alternative genera-
tion technologies and the full suite of services provided
by forest ecosystems, such integrated analyses are not
only timely but of critical importance to informed deci-
sion making.
© 2015 The Authors. Global Change Biology Bioenergy Published by John Wiley & Sons Ltd., doi: 10.1111/gcbb.12273
10 C. S . GALIK & R. C. ABT

Acknowledgements
This work was partially supported by a grant from the South-ern Forest Resource Assessment Consortium at North CarolinaState University. This manuscript likewise benefited immenselyfrom the in-depth and insightful comments provided by twoanonymous reviewers.
References
Abt RC, Abt KL, Cubbage FW, Henderson JD (2010a) Effect of policy-based bioener-
gy demand on southern timber markets: a case study of North Carolina. Biomass
and Bioenergy, 34, 1679–1686.
Abt KL, Abt RC, Galik CS (2012) Effect of bioenergy demands and supply response
on markets, carbon, and land use. Forest Science, 58, 523–539.
Abt KL, Abt RC, Galik CS, Skog KE (2014) Effect of Policies on Pellet Production
and Forests in the U.S. South: A Technical Document Supporting the Forest Ser-
vice Update of the 2010 RPA Assessment. General Technical Report SRS-202. US
Forest Service, Southern Research Station, Asheville, NC.
Abt RC, Cubbage FW, Abt KL (2009) Projecting southern timber supply for multiple
products by subregion. Forest Products Journal, 59, 7–16.
Abt RC, Galik CS, Henderson JD (2010b) The Near-Term Market and Greenhouse
Gas Implications of Forest Biomass Utilization in the Southeastern United States.
Climate Change Policy Partnership, Duke University, and College of Natural
Resources, North Carolina State University, Durham, NC.
Atanasiu B (2010) The role of bioenergy in the National Renewable Energy Action
Plans: a first identification of issues and uncertainties. Institute for European
Environmental Policy, London, UK.
Beurskens LWM, Hekkenberg M, Vethman P (2011) Renewable Energy Projections
as Published in the National Renewable Energy Action Plans of the European
Member States. Report Number ECN-E–10-069. Energy Research Centre of the
Netherlands and European Environment Agency, Petten, Netherlands.
Cherubini F, Peters GP, Berntsen T, Strømman AH, Hertwich E (2011) CO2 emis-
sions from biomass combustion for bioenergy: atmospheric decay and contribu-
tion to global warming. GCB Bioenergy, 3, 413–426.
Colnes A, Doshi K, Emick H et al. (2012) Biomass Supply and Carbon Accounting
for Southeastern Forests. Biomass Energy Resource Center, Forest Guild, and Spa-
tial Informatics Group, Montpelier, VT, p. 132p.
Dwivedi P, Khanna M, Bailis R, Ghilardi A (2014) Potential greenhouse gas benefits
of transatlantic wood pellet trade. Environmental Research Letters, 9, 11.
European Commission (2009) Directive 2009/28/EC of the European Parliament and
of the Council of 23 April 2009 on the promotion of the use of energy from
renewable sources and amending and subsequently repealing Directives 2001/
77/EC and 2003/30/EC, Brussels, Belgium.
European Commission (2010) COM(2010)11. Report from the Commission to the Coun-
cil and the European Parliament on sustainability requirements for the use of solid
and gaseous biomass sources in electricity, heating and cooling, Brussels, Belgium.
European Commission (2014) 2030 framework for climate and energy policies.
Available at: http://ec.europa.eu/clima/policies/2030/index_en.htm (accessed
30 January 2015).
Forest2Market (2011) Certification by Region and State. Available at: http://
www.forest2market.com/uploads/Legacy/Certifica-
tion_by_Region_and_State.pdf (accessed 2 December 2013).
Forest Stewardship Council (2013) FSC-Certified Acreage by State. Available at:
https://us.fsc.org/download.fsc-certified-acres-by-state.125.pdf (accessed 3
December 2013).
Frank S, B€ottcher H, Havl�ık P et al. (2013) How effective are the sustainability criteria
accompanying the European Union 2020 biofuel targets? GCB Bioenergy, 5, 306–314.
Fritsche UR, Iriarte L, de Jong J, Agostini A, Scarlat N (2014) Extending the EU
Renewable Energy Directive sustainability criteria to solid bioenergy from forests.
Natural Resources Forum, 38, 129–140.
Galik CS, Abt RC (2011) An Interactive Assessment of Biomass Demand and Avail-
ability in the Southeastern United States. Nicholas Institute for Environmental
Policy Solutions, Durham, NC, p. 21.
Galik CS, Abt RC (2012) The effect of assessment scale and metric selection on the
greenhouse gas benefits of woody biomass. Biomass and Bioenergy, 44, 1–7.
Galik CS, Abt RC, Wu Y (2009) Forest biomass supply in the Southeastern United
States—implications for industrial roundwood and bioenergy production. Journal
of Forestry, 107, 69–77.
Goetzl A (2015) Developments in the Global Trade of Wood Pellets. Office of Indus-
tries Working Paper No. ID-039. US International Trade Commission, Washing-
ton, D.C., p. 28.
Goh CS, Junginger M, Cocchi M et al. (2013a) Wood pellet market and trade: a global
perspective. Biofuels, Bioproducts and Biorefining, 7, 24–42.
Goh CS, Junginger M, Joudrey J et al. (2013b) Task 3: Impacts of sustainability certifi-
cation on bioenergy markets and trade, Strategic Inter-Task Study: Monitoring
Sustainability Certification of Bioenergy. A cooperation between IEA Bioenergy
Task 40, Task 43 and Task 38. IEA Bioenergy.
Gronowska M, Joshi S, MacLean HL (2009) A review of U.S. and Canadian biomass
supply studies. BioResources, 4, 341–369.
Hertel TW, Golub AA, Jones AD, O’Hare M, Plevin RJ, Kammen DM (2010) Effects
of US maize ethanol on global land use and greenhouse gas emissions: estimating
market-mediated responses. BioScience, 60, 223–231.
Hewitt J (2011) Flows of biomass to and from the EU: an analysis of data and trends.
FERN, Moreton in Marsh, UK.
Hoefnagels R, Resch G, Junginger M, Faaij A (2014) International and domestic uses
of solid biofuels under different renewable energy support scenarios in the Euro-
pean Union. Applied Energy, 131, 139–157.
Jonker JGG, Junginger M, Faaij A (2014) Carbon payback period and carbon offset
parity point of wood pellet production in the South-eastern United States. GCB
Bioenergy, 6, 371–389.
Joudrey J, McDow W, Smith T, Larson B (2012) European Power from U.S. Forests:
How Evolving EU Policy Is Shaping the Transatlantic Trade in Wood Biomass.
Environmental Defense Fund, New York, NY.
Junginger M, Sikkema R, Faaij A (2009) Analysis of the global pellet market includ-
ing major driving forces and possible technical and non-technical barriers. Deliv-
erable 6.2 for the Pellets@las project. Copernicus Institute, Utrecht University,
Utrecht, The Netherlands.
Kittler B, Price W, McDow W, Larson B (2012) Pathways to Sustainability: An Evalu-
ation of Forestry Programs to Meet European Biomass Supply Chain Require-
ments. Environmental Defense Fund, New York, NY.
La Capra Associates (2011) North Carolina’s Renewable Energy Policy: A Look At
REPS Compliance To Date, Resource Options For Future Compliance, And Strate-
gies To Advance Core Objectives. Technical Report prepared for the North Caro-
lina Energy Policy Council. La Capra Associates, Inc., Boston, MA.
Ladanai S, Vinterb€ack J (2010) Certification Criteria for Sustainable Biomass for
Energy. Report 026. ISSN 1654-9406. Swedish University of Agricultural Sciences.
Lamers P, Hoefnagels R, Junginger M, Hamelinck C, Faaij A (2014) Global solid bio-
mass trade for energy by 2020: an assessment of potential import streams and
supply costs to North-West Europe under different sustainability constraints.
GCB Bioenergy. doi:10.1111/gcbb.12162.
Lamers P, Junginger M, Hamelinck C, Faaij A (2012) Developments in international
solid biofuels trade – an analysis of volumes, policies, and market factors. Renew-
able and Sustainable Energy Reviews, 16, 2655–2676.
National Renewable Energy Laboratory (2013) Energy Analysis: International Trade
of Wood Pellets. NREL/BR-6A20-56791. Strategic Energy Analysis Center,
Golden, CO.
Prestemon JP, Abt RC (2002) Timber products supply and demand. In: Southern For-
est Resource Assessment (eds Wear DN, Greis JG), pp. 299–325. US Department of
Agriculture, Forest Service, Southern Research Station, Asheville, NC.
Scarlat N, Dallemand J (2011) Recent developments of biofuels/bioenergy sustain-
ability certification: a global overview. Energy Policy, 39, 1630–1646.
Schueler V, Weddige U, Beringer T, Gamba L, Lamers P (2013) Global biomass
potentials under sustainability restrictions defined by the European Renewable
Energy Directive 2009/28/EC. GCB Bioenergy, 5, 652–663.
Sikkema R, Faaij APC, Ranta T, Heinimo J, Gerasimov YY, Karjalainen T, Nabuurs
GJ (2014) Mobilization of biomass for energy from boreal forests in Finland &
Russia under present sustainable forest management certification and new sus-
tainability requirements for solid biofuels. Biomass and Bioenergy, 71, 23–36.
Sikkema R, Steiner M, Junginger M, Hiegl W, Hansen MT, Faaij A (2011) The Euro-
pean wood pellet markets: current status and prospects for 2020. Biofuels, Bioprod-
ucts and Biorefining, 5, 250–278.
Stephenson AL, MacKay DJC (2014) Life Cycle Impacts of Biomass Electricity in
2020: Scenarios for Assessing the Greenhouse Gas Impacts and Energy Input
Requirements of Using North American Woody Biomass for Electricity Genera-
tion in the UK. Department of Energy and Climate Change, London, UK, p. 154.
Thiffault E, Endres J, McCubbins JSN, Junginger M, Lorente M, Fritsche U, Iriarte L
(2015) Sustainability of forest bioenergy feedstock supply chains: local, national
and international policy perspectives. Biofuels, Bioproducts and Biorefining, 9,
283–292.
© 2015 The Authors. Global Change Biology Bioenergy Published by John Wiley & Sons Ltd., doi: 10.1111/gcbb.12273
SUSTAINABILITY GUIDELINES AND MARKET RESPONSE 11
UK Department of Energy and Climate Change (2011) A Comparison of Emissions
Factors for Electricity Generation. Department of Energy and Climate Change,
London, UK, p. 9.
UK Department of Energy and Climate Change (2014) Woodfuel Advice Note.
Department of Energy and Climate Change, London, UK, p. 19.
UK Department for Environment Food & Rural Affairs (2015) Greenhouse Gas Con-
version Factor Repository. Available at: http://www.ukconversionfactorscarbon-
smart.co.uk/ (accessed 29 January 2015).
US Environmental Protection Agency (2014) Framework for Assessing Biogenic
CO2 Emissions from Stationary Sources. Offiec of Air and Radiation, Office of
Atmospheric Programs, Climate Change Division, Washington, D.C., p. 69.
US Geologic Survey (2015) Conterminous United States Land Cover 1992 – 200
Meter Resolution. Available at: http://nationalmap.gov/small_scale/mld/lanco-
vi.html (accessed 29 January 2015).
van Dam J, Junginger M, Faaij APC (2010) From the global efforts on certification of
bioenergy towards an integrated approach based on sustainable land use plan-
ning. Renewable and Sustainable Energy Reviews, 14, 2445–2472.
Vis MW, Vos J, van den Berg D (2008) Sustainability Criteria & Certification Systems
for Biomass Production. Prepared for Directorate-General for Energy and Trans-
port, European Commission BTG Biomass Technology Group, Enschede, The
Netherlands.
Supporting Information
Additional Supporting Information may be found in the online version of this article:
Figure S1. Proportion of timberland classified as ‘Deciduous’ and potentially restricted from harvest under proposed EU sustain-ability guidelines.Figure S2. Proportion of timberland classified as ‘Evergreen’ and potentially restricted from harvest under proposed EU sustain-ability guidelines.Figure S3. Proportion of timberland classified as ‘Mixed’ and potentially restricted from harvest under proposed EU sustainabilityguidelines.Figure S4. Proportion of timberland classified as ‘Woody Wetland’ and potentially restricted from harvest under proposed EUsustainability guidelines.Figure S5. Relative change indices for pine pulpwood, comparing baseline and pellet demand scenarios absent sourcing restric-tions.Figure S6. Relative change indices for hardwood pulpwood, comparing baseline and pellet demand scenarios absent sourcingrestrictions.Figure S7. Relative change indices for pine small sawtimber, comparing baseline and pellet demand scenarios absent sourcingrestrictions.Figure S8. Relative change indices for pine sawtimber, comparing baseline and pellet demand scenarios absent sourcing restric-tions.Figure S9. Relative change indices for hardwood sawtimber, comparing baseline and pellet demand scenarios absent sourcingrestrictions.Figure S10. Relative change indices for pine pulpwood, comparing baseline and pellet demand scenarios in the presence of sourc-ing restrictions.Figure S11. Relative change indices for hardwood pulpwood, comparing baseline and pellet demand scenarios in the presence ofsourcing restrictions.Figure S12. Relative change indices for pine small sawtimber, comparing baseline and pellet demand scenarios in the presence ofsourcing restrictions.Figure S13. Relative change indices for pine sawtimber, comparing baseline and pellet demand scenarios in the presence of sourc-ing restrictions.Figure S14. Relative change indices for hardwood sawtimber, comparing baseline and pellet demand scenarios in the presence ofsourcing restrictions.Figure S15. Estimate of the annual and cumulative GHG benefit of pellet production in both restricted and unrestricted sourcingscenarios.
© 2015 The Authors. Global Change Biology Bioenergy Published by John Wiley & Sons Ltd., doi: 10.1111/gcbb.12273
12 C. S . GALIK & R. C. ABT