sustainability-linked bond framework may 2021
TRANSCRIPT

SUSTAINABILITY-LINKED BOND FRAMEWORK 1
SUSTAINABILITY-LINKED BOND FRAMEWORK
May 2021

SUSTAINABILITY-LINKED BOND FRAMEWORK 2
Table of Contents
1. Introduction
1.1 About Anglian Water
1.2 Sustainability at Anglian Water
1.3 Our track record on carbon reduction
2. Sustainability-Linked Bond Framework
2.1 Selection of Key Performance Indicators (KPIs)
2.2 Calibration of Sustainability Performance Targets (SPTs)
2.3 Bond Characteristics
2.4 Reporting
2.5 Verification
2.6 Recalculation of the baseline
2.7 Amendments to this Framework

SUSTAINABILITY-LINKED BOND FRAMEWORK 3
1. Introduction
1.1 About Anglian Water
At Anglian Water, we cover the largest geographical area of any water company in England and Wales. We employ 5,000 people and supply water and water recycling services to almost seven million customers in the East of England and Hartlepool. Our huge region stretches from the Humber estuary, north of Grimsby, to the Thames estuary, and from Buckinghamshire to Lowestoft on the east coast. Our coastline is around 1,257 kilometers, and 112,833 kilometers of water and sewer pipes supply and transport water across some 27,500 square kilometers. If we laid them end to end, they would take us a quarter of the way to the moon. Our region is the driest in the UK, and particularly vulnerable to climate change – low lying, with a long coastline and low rainfall. Water resources are already scarce, and climate change could reduce them further. Yet at the same time we also face the threat of more frequent flooding due to more intense rainfall and rising sea levels. Aware of those challenges, our purpose is to bring environmental and social prosperity to the region we serve through our commitment to “love every drop”. We have always recognized the special responsibility we hold as a monopoly provider of an essential public service. We have a duty to deliver wider benefits to society, beyond the provision of fresh, clean water. That responsibility is woven throughout our Strategic Direction Statement, our Net Zero Routemap 2030 to be published in July and our five-year Business Plan, which are shaped around the need to facilitate growth in our region, unlock opportunities for our customers and stakeholders, safeguard our environment and provide a resilient supply for generations to come.

SUSTAINABILITY-LINKED BOND FRAMEWORK 4
1.2 Sustainability at Anglian Water
Our commitment to the environmental and social prosperity of our region goes back many years, even before we set out our Love Every Drop strategy in 2010. We first considered climate change in our assessment of water resources back in 1993 and our education programme has reached nearly half a million people since its launch in 2006. In 2015 we were first awarded the Queen’s Award for Enterprise: Sustainable Development in recognition of our work, while in 2017 we were named Responsible Business of the Year, in large part due to our community regeneration work in Wisbech. In recent years, with the climate emergency accelerating and the challenges of providing resilient supplies to our growing population becoming ever more acute, we have played a leading role in driving industry-wide discussions around the social and environmental purpose of a water company. With our shareholders’ support, in July 2019 Anglian Water became the first major UK utility to change our company constitution – the Articles of Association – to lock public interest into the way we run our business, both now and for future generations. By doing so we have ensured that environmental and social priorities will always sit alongside the need to deliver fair returns for our shareholders. This change underlines our commitment to deliver a sustainable future for the East of England. Over the period 2020 to 2025, Anglian Water will invest several billion pounds on running the business, protecting communities from extremes of weather including flooding and helping to underpin economic growth, while at the same time keeping bills affordable. We have agreed 10 key outcomes that we will deliver for customers through our Business Plan for the period 2020-2025. Our business model is structured to create long-term value for customers, employees, investors, business partners and the wider community.

SUSTAINABILITY-LINKED BOND FRAMEWORK 5
1.3 Our track record on carbon reduction
Our journey to net zero carbon began in earnest in 2010, when we first set ambitious goals to reduce our operational and capital carbon emissions, at a time when measuring and managing capital carbon – the carbon in our assets and what we build – was unheard of.
With a committed leadership and a determined supply chain, by 2020/21 we had reduced capital carbon by
61 per cent from our original 2010 baseline, and operational emissions – the carbon produced in running the
business day to day – by 34 per cent from a new baseline set in 2014/2015.
In delivering against our carbon targets, we have demonstrated the strong link between carbon and cost,
achieving financial efficiencies in the investment programme of more than 20 per cent. In collaboration with
our integrated supply chain, we have created a strong ‘reduce carbon, reduce cost’ culture, delivering
innovation and financial efficiency through the reuse of assets, low-carbon materials, off-site build, low-
carbon standard products and advanced 3D design tools.
Working with government and other leading businesses, we developed the world’s first standard for managing carbon in infrastructure (PAS 2080), which is now being used nationally and internationally. In another first, we pioneered the use of sustainable financing through Green Bonds among UK utilities, enabled by our commitment to carbon measurement and reporting. We have also made significant progress on the adoption of renewable energy to power our operational sites, generating 134.5GWh in 2020/21 through solar, wind and combined heat and power engines (CHP) – enough to power more than 40,000 homes.
In 2019 we spearheaded the adoption of a shared water sector commitment to reach net zero by 2030. Our CEO Peter Simpson was invited to co-sponsor the commitment together with two of his fellow water company CEOs, and Anglian Water subsequently chaired the working group which delivered the sector-wide Routemap to Net Zero launched in November 2020. The Routemap has been described by UN Climate Action Champion Nigel Topping as one of the most significant steps taken by any industry anywhere in the world. Our own path to net zero will incorporate elements of the following, set out in more detail later in this framework:
• Technology-led solutions: accelerating innovation in generating and storing renewable energy, understanding and reducing process emissions and decarbonising transport;
• Nature-led solutions: using land in our region to capture and store emissions and planting trees;
• Demand-reduction solutions: reducing the use of grid electricity and fossil fuels, driving energy efficiency, leakage reduction and making the most of biogas from sludge on our sites.
• Behavioral led solutions: the solution pathways are integrated with behavior change initiatives, to progress and exploit the opportunities available.
2. Sustainability-Linked Bond Framework
Under this Framework, Anglian Water Group including any of its entities (including Anglian Water (Osprey) Financing PLC, as well as Anglian Water Services Financing Plc) (hereafter “Anglian Water”), will be able to issue Sustainability-Linked Bonds or private placements (“SLB”). Our SLB Framework is in alignment with the ICMA Sustainability-Linked Bond Principles (SLBP) published in June 2020, which are comprised of 5 core pillars:
I. Selection of Key Performance Indicators (KPIs) II. Calibration of Sustainability Performance Targets (SPTs)
III. Bond Characteristics

SUSTAINABILITY-LINKED BOND FRAMEWORK 6
IV. Reporting V. Verification
This SLB Framework allows the alignment of our founding instruments with our sustainability targets. By further promoting our targets (both internally and externally) and reinforcing engagement with investors, we believe SLB issuance will accelerate our journey towards our sustainability ambition. SLBs are any type of bond instrument for which the financial and/or structural characteristics can vary depending on whether the issuer achieves predefined sustainability objectives. In that sense, issuers are thereby committing explicitly (including in bond documentation) to future improvements in sustainability outcome(s) within a predefined timeline that are relevant, core and material to their overall business. SLBs are forward-looking performance-based instruments. The proceeds of SLBs are intended to be used for general purposes; however, in the case of Anglian Water, we anticipate that the proceeds would be deployed largely to support the overall delivery of the AMP7 capital investment plan.
2.1 Selection of Key Performance Indicators (KPIs)
The company's purpose is to bring social and environmental prosperity to its region; our strategy outlines the
four clear goals we have set ourselves’, one of which is creating a sustainable future for our region. Carbon
management is a crucial element in this.
As such, Anglian Water has selected the following KPIs, which are core, relevant and material to the business.
KPI 1: Net Operational Carbon emissions expressed in tonnes of CO2 equivalent
● Definition of the metric: KPI 1 reflects an operating environment where we have no overall impact on
the atmosphere from our operational GHG emissions. This means that any residual emissions are
counterbalanced by an equivalent sequestration of gases from the atmosphere. This fully aligns with the
definition of the Water UK Routemap to Net Zero 2030, where our emissions will be less than or equal to
mitigation activities.
The emissions that are measured and managed include CO2, CH4 and N2O. These three gases are
reported collectively as Carbon Dioxide Equivalent (CO2e).
The metric covers our operational emissions (Scope 1, 2 and some Scope 3 relevant to core outsourced
activities) of which we have operational control. Scope 1 emissions include the burning of fossil fuels,
process and fugitive emissions (e.g. Nitrous oxide and methane from water recycling/sludge treatment)
and emissions from owned or leased vehicles. Scope 2 emissions include purchased grid electricity.
Scope 3 emissions covered under operational carbon include business travel, outsourced activities within
our regulatory boundary and Transmission & Distribution losses.
The reporting of net emissions also takes into account the export of surplus renewable generation and
purchase of Renewable Energy Guarantees of Origin (REGO) backed green tariff electricity1.
1 Ofgem issues REGO certificates (1 REGO certificate per MWh of eligible renewable output to generators of renewable electricity). Certificates are held in a central registry managed by ofgem.

SUSTAINABILITY-LINKED BOND FRAMEWORK 7
Capital carbon and wider Scope 3 emissions (e.g., sludge to land, and chemicals) are not included within
this KPI, with capital carbon (KPI 2) having a separate target.
Anglian Water intends to meet the Net operational carbon emissions target by following the
decarbonisation hierarchy of:
o Reducing/avoiding GHG emissions
o Avoiding emissions from grid electricity through the use of renewable energy and of green
electricity procurement (backed by REGOs)
o Tackling any residual and difficult to avoid/remove emissions, such as process emissions by
removing such emissions through measures within our boundary (e.g. trees)
o Tackling our residual emissions through investing in credible offset credits in our region, the UK
territory and where not commercially or technically possible in the international offset credit
markets
● Unit: Percentage reduction of tonnes of carbon dioxide equivalent (tCO2e)
● Perimeter: Regulated activity of Anglian Water Services Ltd
● Methodology:
This is reported as operational carbon, including the consumption of fossil fuels, transport and process
emissions. In calculating annual GHG emissions, raw data for fossil fuels, treated sludge, etc. is collected
from around the business and entered into the UKWIR (UK Water Industry Research) Carbon Accounting
Workbook2. Data is then compiled within the Carbon Accounting Workbook to provide scope 1, 2 and 3
emissions.
The reporting boundary covers the emissions within the regulated activity of Anglian Water Services Ltd
We have followed the 2019 UK Government environmental reporting guidance. Through using the
UKWIR carbon accounting workbook, we have used the GHG Protocol Corporate Accounting and
Reporting Standard (revised edition) and emission factors from the UK Government’s GHG Conversion
Factors for Company Reporting 2019 to calculate the above disclosures. Where relevant, we have also
aligned with industry best practice for emissions measurement and reporting. This approach has been
verified, since 2010, by CEMARS as being measured, managed and reduced in accordance with ISO
14064. Our strategy for operational carbon reduction has been verified against ISO-14064 since 2010
and in 2021 were awarded Platinum status on Achilles Carbon Reduce .
● Data assurance:
Carbon data is submitted to Ofwat and the Management Board through our Annual Integrated Report
(AIR) processes. The AIR contains Outcome Delivery Incentives (ODIs), including operational carbon.3
The carbon data has historically and will continue to be externally verified by a suitable provider as part
of our regulatory reporting requirements. Since 2010, we have met the requirements of CEMARS (the
Certified Emissions Measurement and Reduction Scheme - now called CarbonReduce), having
measured greenhouse gas emissions in compliance with ISO 14064-1:2006. Going forward the data
assurance will also review purchased grid electricity and offsets.
2 The UKWIR Carbon Accounting Workbook provides UK water companies with a consistent and transparent approach for accounting GHG emissions from their annual operational activities. The workbook is reviewed annually by a cross company working group facilitated by UKWIR, to reflect any changes in operational practices and align with the operational emissions factors issued by the UK Government 3 Annual Integrated Report 2020 (page 45)

SUSTAINABILITY-LINKED BOND FRAMEWORK 8
● Baseline and historical data:
in tonnes of CO2e 2020/2021 2019/20204 2018/2019 (baseline)4
Scope 1 117,010 117,784 123,302
Scope 2 245,501 241,134 209,818
Scope 3 (operational
carbon) 34,867 36,420 32,676
Annual gross
emissions 397,379 395,338 365,796
Exported renewables (10,957) (12,257) (9,444)
Net Emissions 386,421 383,081 356,351
Reporting period 1st April to 31st March.
4 Due to an error in the process emissions methodology, the figures for 2018/2019 and 2019/2020 have been restated and are higher
than previously reported by Anglian Water. This will be detailed in the Routemap to net zero document which will be released in July and audited on an annual basis starting in 2021/22.

SUSTAINABILITY-LINKED BOND FRAMEWORK 9
● Rationale:
Anglian Water is committed to reaching net zero carbon emissions by 2030. This is an objective shared
with all water companies in England, and set out in 2019 as part of the Water UK Public Interest
Commitment to show leadership at a national level.
We are targeting net zero carbon emissions by 2030 on operational carbon.

SUSTAINABILITY-LINKED BOND FRAMEWORK 10
KPI 2: Capital Carbon emissions expressed in % of emissions avoided in tonnes of CO2 equivalent
● Definition of the metric: Capital Carbon is the emissions associated with the creation of assets (from
cradle to as built). This is our carbon footprint as a result of the construction projects we undertake,
covering the extraction, transportation and processing of raw materials and from site construction
activities required to create or maintain a built asset, or part thereof, expressed as equivalent emissions
of carbon dioxide.
● Unit: Percentage of tonnes of carbon dioxide equivalent (tCO2e) avoided
● Perimeter: Regulated activity of Anglian Water Services Ltd
● Methodology:
Measurement is made through the creation of over 1300 capital carbon models5 utilizing data from the
University of Bath Inventory of Carbon and Energy, Defra and CESSM6 workbook. Baselines at scheme
level are calculated within the investment optimisation tool Copperleaf C557 (“C55”) and a bespoke
carbon modelling tool is made available for design engineers within the supply chain.
C55 is our corporate master system for supporting expenditure decisions. It gives us a common location
to store and report on all of our investments in our assets, and uses a common framework to assess
them. It is used to calculate carbon baselines. C55 is used for carbon and cost modelling before scheme
are handed to a delivery route. Asset+ was the predecessor to C55 and was used to calculate carbon
baselines.
Our Carbon and Water Footprint Modeller (the “Carbon Modeller”), uses the various carbon models and
has the ability to calculate the life cycle carbon and water of infrastructure projects.
● Data assurance:
Since 2016 we have met the requirements of PAS2080 Carbon Management in Infrastructure externally
verified by LRQA8. PAS 2080:2016 provides a common framework for all infrastructure sectors (including
energy, water, waste, transportation and communication) on how to manage whole life carbon
management when delivering infrastructure assets and programmes of work. The Infrastructure Carbon
Review, was published by HM Treasury in November 20139. PAS 2080 ensures that carbon is
consistently and effectively quantified at key points, enabling carbon data to be shared transparently
along the supply chain.
• Baseline:
The baseline period for the Carbon Modeller is 2010.
5 Our approach to measuring capital carbon follows the guidance of the UKWIR ‘framework for accounting for embodied carbon in water industry assets 12/CL/01/15’. The link for the carbon modelling tool - www.awcm.co.uk/pr14. Link to one of the training videos - https://www.youtube.com/watch?v=VR8lRrFqptE 6 Civil Engineering Standard Method of Measurement 7 Water & Wastewater | Asset Investment Management | Copperleaf 8 Lloyd’s Register Quality Assurance 9 HM Treasury (2013). Infrastructure Carbon Review. Available at:
https://assets.publishing.service.gov.uk/government/uploads/system/uploads/attachment_data/file/260710/infrastructure_carbon_review_251113.pdf

SUSTAINABILITY-LINKED BOND FRAMEWORK 11
2010 baseline level refers to material emission factors, materials and construction techniques associated
with assets created under business as usual practises during the period between 2005-2010. Baseline
levels are set on a scheme-by-scheme basis on projects delivered through the Totex Investment
Programme, using Asset+ and C55.
Emissions factors for baselines and models are based on the Intergovernmental Panel on Climate
Change (IPCC) AR2 Global Warming Potentials (GWPs). It is noticed that GWPs have been updated in
the published IPCC AR4 GWP, however IPCC AR2 GWPs have been retained to maintain a consistency
and comparability between carbon baselines and models.
Modelling our AMP7 2020-2025 investment programme using our activities and practises from 2010, the
projected capital carbon baseline for the period 2020-2025 is 1,014,875 tonnes of CO2e.
As a regulated utility operating with five yearly asset management periods, the projection for delivering
the capital carbon avoidance for the period AMP8 2025-2030 will be updated prior to 1 April 2025.
● Historical data:
% of emissions avoided in tonnes of
CO2e from associated baseline level* 2019/2020 2018/2019 2017/2018
Capital Carbon 61% 58% 57%
*Modelling our AMP6 2015-2020 investment programme using our activities and practises from 2010,
the capital carbon baseline for the period 2015-2020 is 236,958 tonnes of CO2e.
Reporting period 1st April to 31st March.
● Rationale:
As an asset-heavy industry, we are responsible for considerable capital carbon in our distribution and
treatment assets. We recognized that there is a causal link between carbon reduction and lower costs,
as confirmed by the HMT Infrastructure Carbon Review, sponsored by the Green Construction Board, in
its national initiative to save 24 million tonnes of carbon and thus £1.46bn a year by 2050. We have used
carbon reduction as a means of driving efficient investment.
As such, in 2010, we ambitiously defined our initial Capital Carbon goal to halve the carbon emitted
through our construction projects. At the time, measuring and managing capital carbon, let alone setting
such a stretching goal for avoidance, was market leading. In 2020, with visionary leadership and a supply
chain that lined up behind the target, we have achieved a 61 per cent reduction avoidance in capital
carbon emissions versus a 2010 baseline. Again, despite this achievement, we continue our commitment
to decarbonising our business and recognize that further action is required in our indirect footprint.

SUSTAINABILITY-LINKED BOND FRAMEWORK 12
2.2 Calibration of Sustainability Performance Targets (SPTs)
SPT 1a: 30% reduction in Net Operational Carbon emissions by 31st March 2025 – from 2018/2019 base
year
SPT 1b: Net zero on Net Operational Carbon emissions by 31st March 2030 – from a 2018/2019 base year
SPT 2a: 65% of Capital Carbon emissions avoided by 31st March 2025 - from AMP7 2010 baseline level
SPT 2b: 70% of Capital Carbon emissions avoided by 31st March 2030 – from AMP8 2010 baseline level
Our long-term capital carbon goal is carbon neutrality by 2050.
New interim SPTs may be developed on a per issuance basis corresponding to specific target
observation dates between the 2025 and 2030 period. Any new SPT will be set with an equivalent or
greater level of ambition and will at least align with the 2030 trajectory defined in SPT 1b and SPT 2b.
Moreover, any new SPT will be subject to review by DNV GL, or any such other qualified provider of
Second Party Opinions, in an updated SPO and defined within the specific Bond issuance document.
SPT1 Ambition
To meet the needs of the growing population we serve and increasing stringent regulation in water and waste water treatment, we are forecasting an increase in energy consumption, while Anglian Water has already got an industry leading performance on water leakage. While we are working on increasing renewable energy capacity, this has also revealed both commercial and technological challenges to resolve over time. While we strive to reduce emissions of our fleet, charging point infrastructure and technologies for HGV trucks remains to be further developed. We also depend on scientific data to measure and technologies to reduce process emissions and are undertaking actions to improve these.
SPT 1 - Factors that support the achievement of the targets:
We have a robust action plan. Our collaborative routemap sets out how the industry plans to rise to the net zero challenge over the next decade and highlights a broad range of opportunities, initiatives and projects that will help us cut millions of tonnes of carbon emissions by 2030. Specifically, Anglian Water will focus on the following areas to achieve its target:
• Purchased electricity and renewables
UK electricity grid decarbonisation; Energy Efficiency measures (incremental and systemic); Leakage
reduction; Water efficiency; Alternative treatment processes; Catchment management; Nature Base Solutions;
Solar, Wind PPAs; Energy storage; CHP; Green electricity, sleeving (for offsetting residual emissions from
power consumption)
• Biogas
CHP efficiencies; Biomethane to grid; Biomethane to transport (HGVs)

SUSTAINABILITY-LINKED BOND FRAMEWORK 13
• Transport
EV small vans; Electrifying components of large vehicles; HGVs to LNG; HGVs to hydrogen; Behavioural travel
changes
• Process Emissions measurement and reduction
Targeted monitoring for N2O emissions; Alternative treatment processes; Operational optimization for fugitive
emissions
• Alternative Fuels
HVO; Hydrogen (green, grey); Biomethane to transport (HGVs)
• Offsetting
Insets (trees, grassland, seagrass); Regional offsets (soil sequestration); National, international offsets (carbon
offset credits)
• Management
Strong leadership with a clear narrative aligning the reduction of operational GHG emissions with the purpose
of Anglian Water through technological and behaviour changes, a mature approach to energy optimisation
since 2006, savinf circa 10 GWh’s annually year on year and continual improvement and case studies
recognising areas of focus and success stories in the low GHG emissions journey.
• Supply chain
Collaboration with the supply chain to explore lower carbon solutions.
• Investment
Integrated approach in challenging energy efficiency on new investment early in the design process.
• Results
Over ten years of consistent verified operational GHG emissions measurement, management and reduction
and year on year increases in renewable energy generation from 27GWh’s in 2010 to in excess of 130GWh’s
by 2020
SPT 1 - Factors that risk the achievement of the targets:
• Customer preferences
• UK electricity grid decarbonisation rate
• Funding and government incentives
• Moving electricity market landscape affecting pricing strategies
• Future energy policy levers
• Future water sector policy/regulatory levers
• Evolving science in process emissions & natural sequestration options
• Weather events & pandemics
• Changes in the future UK offsetting markets

SUSTAINABILITY-LINKED BOND FRAMEWORK 14
SPT2 Ambition
Anglian Water has been a pioneer in measurement and avoidance of capital carbon in the water industry.
Anglian Water has hence already tackled all the significant carbon hotspots, which brought significant
reductions. Our capital carbon footprint is increasingly challenging due to the greater proportion of the baseline
in harder to reduce infrastructure schemes, such as below ground assets that are part of our water
infrastructure.
SPT 2 - Factors that support the achievement of the targets
• Mature processes in place verified to PAS2080 Carbon management in infrastructure
• Proven performance over the previous ten years in measuring, managing and reducing capital carbon
and hitting key milestone targets
• Strong leadership with a clear narrative aligning capital carbon avoidance with the purpose of Anglian
Water
• Robust governance with schemes within the investment delivery process measured and challenged
on three occasions through design and construction.
• Baselines integrated into existing investment optimisation tools, with over 1300 capital carbon models.
• Clarity of communication to the supply chain, with collaboration enabling lower GHG emissions
solutions.
• Continual improvement and case studies recognising areas of focus and success stories in the low
GHG emissions journey
• Development of an ofwat innovation fund project to further align carbon and cost accounting and
visualise GHG emissions hotspots through the design process.
SPT 2 - Factors that risk the achievement of the targets
• Increasing challenge due to higher target and greater proportion of baseline in harder to reduce
infrastructure schemes.
o This is water infrastructure (below ground assets). Out of an overall performance of 61%,
water infrastructure achieved 49% in 2020 against a 2010 baseline. In the period 2015 – 2020
(AMP 6) water infrastructure made up 22% of the programme versus 32% in 2020-2025 (AMP
7).
• Cost assessment report completed on AMP 6 schemes validating carbon and cost reduction and
actions for improving performance through AMP 7. This highlighted increasing costs for performance
exceeding 72%.
Our risk management process identifies, assesses and manages our risks. These risks are broadly
categorised as safety, operational, financial, regulatory and compliance with current regulations and law. Risks
are formally identified and mapped to ensure consistency and completeness.
We analyse the potential causes and impacts of risk using a range of governance, compliance and audit
activities. The business unit and top-tier risk registers remain key tools that help management to monitor risks
and evaluate the impact of individual risks on the business, and also evaluate risks in the ‘aggregate’ across
a broad spectrum of threats to overall business performance.

SUSTAINABILITY-LINKED BOND FRAMEWORK 15
2.3 Bond Characteristics
The failure of Anglian Water to satisfy one or several of the SPTs above will trigger a Step up Margin, as
defined in the offering documentation, to be applied for any Interest Period commencing on or after the interest
payment date immediately following the Notification Date10. In this case, the rate of interest will be increased
by the Step up Margin.
The details of any financial penalty payable to investors in any Sustainability-Linked Bond in the event of a
missed target will be set out in the offering documentation provided at the point of issuance of any Sustainability
Linked Bond. These details will include:
• Maturity date of instrument
• Sustainability Key Performance Indicators (KPIs)
• Sustainability Performance Targets (SPTs)
• Sustainability Target Observation Date(s)
• The amount of the Step Up Margin
2.4 Reporting
All KPIs will be reported by Anglian Water on an annual basis as part of its annual report/non-financial statement, which is verified by external auditors, and available on Anglian Water’s website. Reporting may include:
i. Up-to-date information on the performance of the selected KPIs, including the baseline where relevant. ii. A Verification Assurance Report relative to the KPIs outlining the performance against the
corresponding SPT and the related impact, and timing of such impact, on a financial instrument performance; and
iii. Any relevant information enabling investors to monitor the progress of the KPIs Information may also include when feasible and possible:
• Qualitative or quantitative explanation of the contribution of the main factors behind the evolution of the performance/KPIs on an annual basis;
• Illustration of the positive sustainability impacts of the performance improvement; and/or
• Any re-assessments of KPIs and/or restatement of the SPT and/or pro-forma adjustments of baselines or KPI scope, if relevant.
2.5 Verification
10 Anglian Water’s performance of each KPI according to each corresponding SPT will be verified by an External Verifier on an annual
basis in a report, which will be published no later than 120 days after 31st March in each year. The Notification Date will occur 15 days
after this publication and any case before 31st July

SUSTAINABILITY-LINKED BOND FRAMEWORK 16
Pre-issuance Anglian Water’s Sustainability-Linked Bond Framework has been reviewed by DNV GL which has provided a second party opinion, confirming the alignment with the five pillars of the ICMA Sustainability-Linked Bond Principles (SLBP). Post-issuance Anglian Water’s performance of each selected KPI according to each corresponding SPT will be verified by
the External Verifier on an annual basis as part of the annual report In addition, the performance of the KPIs
as of 2025, or 2030 as the case may be, against each corresponding SPT will be notified in writingby Anglian
Water to the Principal Paying Agent by 31st July 2025, or 31st July 2030 as the case may be.
2.6 Recalculation of the baseline
We will adjust our base year emissions inventory to account for significant changes, further described below, if the changes drive an increase/decrease in emissions of greater than 5%. We may also choose to recalculate our baseline for changes less than 5%, especially when structural changes occur. Significant changes may include:
• Structural changes that significantly impact our base year GHG emissions and may trigger the adjustment of the baseline include acquisitions, divestitures or mergers. When significant structural changes occur in the middle of a year, the current and baseline year will be recalculated for the entire year. In the event of an acquisition, in order to ensure that full and accurate data are available, recalculation will be carried out within one year after the structural change has occurred.
• Methodology changes that significantly impact our base year GHG emissions and may trigger the adjustment of the baseline include updated emission factors, improved data access or updated calculation methods or protocols
• In case of a data error, or if a number of cumulative errors that together are significant Baseline adjustments will occur at the end of each fiscal year if we identify any changes described above that have occurred in the reporting period which may require us to recalculate our base year.
2.7 Amendments to this Framework
Anglian Water will review this Framework from time to time, including its alignment to updated versions of the relevant Principles as and when available in the market. Any major update will be subject to the prior approval of DNV GL or any such other qualified provider of Second Party Opinion.
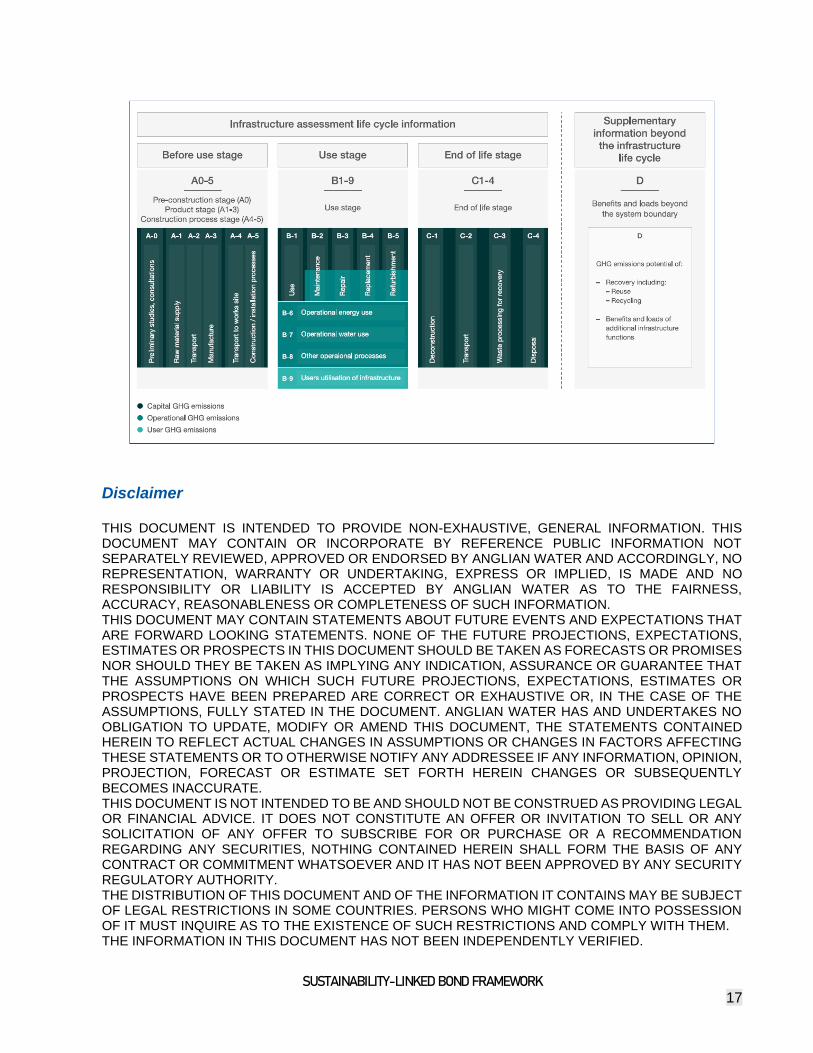
Appendix
Figure 1 – Modular approach showing the life cycle stages and individual modules for infrastructure GHG emissions qualification Extract from PAS 2080:2016 Carbon Management in Infrastructure:
SUSTAINABILITY-LINKED BOND FRAMEWORK 17
Disclaimer THIS DOCUMENT IS INTENDED TO PROVIDE NON-EXHAUSTIVE, GENERAL INFORMATION. THIS DOCUMENT MAY CONTAIN OR INCORPORATE BY REFERENCE PUBLIC INFORMATION NOT SEPARATELY REVIEWED, APPROVED OR ENDORSED BY ANGLIAN WATER AND ACCORDINGLY, NO REPRESENTATION, WARRANTY OR UNDERTAKING, EXPRESS OR IMPLIED, IS MADE AND NO RESPONSIBILITY OR LIABILITY IS ACCEPTED BY ANGLIAN WATER AS TO THE FAIRNESS, ACCURACY, REASONABLENESS OR COMPLETENESS OF SUCH INFORMATION. THIS DOCUMENT MAY CONTAIN STATEMENTS ABOUT FUTURE EVENTS AND EXPECTATIONS THAT ARE FORWARD LOOKING STATEMENTS. NONE OF THE FUTURE PROJECTIONS, EXPECTATIONS, ESTIMATES OR PROSPECTS IN THIS DOCUMENT SHOULD BE TAKEN AS FORECASTS OR PROMISES NOR SHOULD THEY BE TAKEN AS IMPLYING ANY INDICATION, ASSURANCE OR GUARANTEE THAT THE ASSUMPTIONS ON WHICH SUCH FUTURE PROJECTIONS, EXPECTATIONS, ESTIMATES OR PROSPECTS HAVE BEEN PREPARED ARE CORRECT OR EXHAUSTIVE OR, IN THE CASE OF THE ASSUMPTIONS, FULLY STATED IN THE DOCUMENT. ANGLIAN WATER HAS AND UNDERTAKES NO OBLIGATION TO UPDATE, MODIFY OR AMEND THIS DOCUMENT, THE STATEMENTS CONTAINED HEREIN TO REFLECT ACTUAL CHANGES IN ASSUMPTIONS OR CHANGES IN FACTORS AFFECTING THESE STATEMENTS OR TO OTHERWISE NOTIFY ANY ADDRESSEE IF ANY INFORMATION, OPINION, PROJECTION, FORECAST OR ESTIMATE SET FORTH HEREIN CHANGES OR SUBSEQUENTLY BECOMES INACCURATE. THIS DOCUMENT IS NOT INTENDED TO BE AND SHOULD NOT BE CONSTRUED AS PROVIDING LEGAL OR FINANCIAL ADVICE. IT DOES NOT CONSTITUTE AN OFFER OR INVITATION TO SELL OR ANY SOLICITATION OF ANY OFFER TO SUBSCRIBE FOR OR PURCHASE OR A RECOMMENDATION REGARDING ANY SECURITIES, NOTHING CONTAINED HEREIN SHALL FORM THE BASIS OF ANY CONTRACT OR COMMITMENT WHATSOEVER AND IT HAS NOT BEEN APPROVED BY ANY SECURITY REGULATORY AUTHORITY. THE DISTRIBUTION OF THIS DOCUMENT AND OF THE INFORMATION IT CONTAINS MAY BE SUBJECT OF LEGAL RESTRICTIONS IN SOME COUNTRIES. PERSONS WHO MIGHT COME INTO POSSESSION OF IT MUST INQUIRE AS TO THE EXISTENCE OF SUCH RESTRICTIONS AND COMPLY WITH THEM. THE INFORMATION IN THIS DOCUMENT HAS NOT BEEN INDEPENDENTLY VERIFIED.

SUSTAINABILITY-LINKED BOND FRAMEWORK 18
THE ADDRESSEE IS SOLELY LIABLE FOR ANY USE OF THE INFORMATION CONTAINED HEREIN AND ANGLIAN WATER SHALL NOT BE HELD RESPONSIBLE FOR ANY DAMAGES, DIRECT, INDIRECT OR OTHERWISE, ARISING FROM THE USE OF THIS DOCUMENT BY THE ADDRESSEE.