sustainability of long-term care financing in the netherlands
TRANSCRIPT

FIRST, PRELIMINARY DRAFT / NOT BE QUOTED
Sustainability of long-term care financing in the Netherlands Paper prepared for the International Conference on the Policies and Regulations governing the Costs of Health Care and Long Term Care of the Elderly, organized by the Institute of Economic Research of Hitotsubashi University on January 14-15, 2009, Tokyo, Japan Authors: Frederik T. Schut, Erasmus University Rotterdam Bernard van den Berg, VU University Amsterdam January 5, 2009 Abstract: The Netherlands was the first country that introduced a universal mandatory social health insurance scheme (abbreviated: AWBZ) for covering a broad range of long-term care (LTC) services provided in a variety of care settings. Since its introduction in 1968, the scope of the scheme was gradually expanded from nursing home care and institutional care for the mentally and physically handicapped to home health care, mental health care and residential care for the elderly. In comparison to most other OECD countries both total and public expenditure on LTC is high, particularly since the Dutch population is relatively young. This can be explained by the relatively generous social health insurance scheme.
Because of the generous insurance scheme, in the 1990s stringent supply and price regulation was introduced to control the growth of LTC expenditure. As a consequence the share of GDP spent on LTC remained more or less stable at 3.5 percent for more than a decade, despite a growing demand for LTC-services. The increasing gap between demand and supply resulted in growing waiting lists and a deterioration of quality and service levels. As an alternative for getting care in kind, in 1996 cash benefits (or personal care budgets) for LTC were introduced. For part of the clients personal care budgets offered a way to get around the waiting lists. Forced by court decisions and growing political pressure, in 2000 the government lifted the budgetary controls. This resulted in a huge expenditure growth: from 2000 to 2003 the share of GDP spent on LTC increased from 3.5 to 4.0. Since 2004 the government increased income related co-payments and introduced regional budgets to regain control over the growth of LTC spending. In addition, several benefits (housekeeping, transitory mental health care) were excluded from coverage.
Since the regional budget mechanism does not provide appropriate incentives for quality and efficiency and may not be feasible in the long run given several court decisions, the government aims at a structural reform of LTC financing and delivery. The reform is based on three pillars: (1) a reduction of the coverage of the LTC insurance scheme to benefits that are targeted to those who need help with basic activities of average daily living (ADL) over an extended period of time; (2) an improvement of the system of needs assessment; and (3) the introduction client-based budgeting based on a classification of “care service packages.” Depending on the choice of the client the budget can either be used by health insurers to purchase and arrange care on behalf of their enrolees or can be used by the client itself to purchase care.
The objective of this paper is to analyse the deficiencies of the current system of LTC financing and to assess the feasibility and financial sustainability of the intended reforms. Findings are particularly relevant for other countries having a social insurance scheme for LTC (e.g. Japan, Germany, Belgium, US).
1
1. Introduction
In many OECD countries public expenditures on health and long-term care are a matter of great
concern in the view of an ageing population and increasing constraints on public budgets. These
concerns are particularly vexing for countries with a relatively rapidly ageing population, such as
Japan (see Table 1), or with relatively high public expenditures on long-term care, such as the
Netherlands. In comparison to most other OECD countries, both total and public expenditure on
LTC in the Netherlands are high, particularly since the percentage of elderly is similar to the OECD
average (Table 1). This can be explained by the relatively generous social health insurance scheme.
[Table 1 about here]
Nevertheless, the growth of public spending on health and long-term care in the Netherlands has
been quite successfully limited until 2000 via the implementation of cost-containment policies.
These policies acted essentially through the rationing of supply, wage moderation, price controls and
postponement of investment in long-term care facilities. However, increasing waiting lists and rising
consumer expectations about the quality and variety of long-term care services, has substantially
reduced the scope for containing long-term care expenditures along these lines. Hence, the Dutch
government is aiming to reform the current long-term care financing system to increase incentives
for efficiency and consumer direction.
In this paper we discuss the background, past experience and proposals to reform the system of
long-term care financing in the Netherlands. Section 2 provides a short background of the Dutch
public health insurance scheme. In section 3 we discuss the main features of the current public
insurance scheme. In the next section we analyze the empirical evidence about the growth of public
expenditure on long-term care over the period 1985-2005. Section 5 specifically focuses on the role
2
of informal care and the implications of the introduction of the personal care budgets to increase
consumer direction and choice. In the sixth section we discuss the projections and determinants of
future long-term expenditure growth. Next, we discuss the shortcomings of the current system of
long-term care financing and the proposals for reforming the system. Finally, we discuss the
prospects of the reform and the questions that remain to be answered.
Often the term long-term care is used only in the context of elderly care. In this paper we use a more
comprehensive definition, including also care for the mentally and physically handicapped and care
for chronic psychiatric patients. This definition coincides with the types of services covered by the
public insurance scheme for long term care in the Netherlands.
2. Background of public insurance of LTC
The Netherlands was the first country that introduced a universal mandatory social health insurance
scheme (the Exceptional Medical Expenses Act, abbreviated as: AWBZ) for covering a broad range
of long-term care (LTC) services provided in a variety of care settings.
There are several reasons why in the Netherlands the choice was made for a separate universal public
health insurance scheme for long-term care. First, prior to 1968 the financing of long-term care
facilities was highly fragmented and increasingly insufficient to provide access to adequate long-term
care for lower income groups. The strong economic growth during the 1960s substantially increased
the general welfare in society, but because of a lack of adequate funding the availability and quality of
long-term care facilities lagged behind this overall welfare increase. Hence, since the financial risk of
3
long-term care was considered to be largely uninsurable on a private market1, there was broad
political support to expand public financing of long-term care. Second, because of the presence of a
social health insurance scheme for curative health services (the Sickness Fund Act, abbreviated as:
ZFW) the choice was made for public insurance rather than tax financing (as for instance in Sweden
and Norway). However, the prevailing sickness fund scheme covered only two-thirds of the
population (primarily lower and middle income groups). Therefore, a straightforward expansion of
this scheme by including long-term care in the mandatory benefits package was no option, because
then the higher income groups would not be included and not would have to contribute to the
financing of long-term care. An option would be to expand the prevailing mandatory social health
insurance scheme from two thirds to the entire population, alongside an expansion of the benefits
package to include long-term care. Although this option was seriously considered and actually
proposed by the government, the proposal was soon withdrawn because of strong resistance from
private health insurers (fearing a substantial loss of business), employers (fearing increasing employer
contributions) and the medical profession (fearing government control of fees for services to
privately insured patients). Since an expansion of the prevailing social insurance scheme was not
feasible (as for instance in Belgium and Switzerland), a separate mandatory insurance scheme for long
term care (AWBZ) for the entire Dutch population was proposed and enacted in 1968.
Initially, the AWBZ covered primarily nursing home care, institutionalized care for the mentally
handicapped, and hospital admissions lasting more than a year. In due course, however, coverage was
gradually expanded by including home health care (in 1980), ambulatory mental health care (in 1982),
family care (1989) and residential care for the elderly (1997).
1 The failure of private markets to adequate insure long-term risks can be explained by the nature of the intertemporal risk, by supply side market failures (due to high transaction costs, adverse selection, imperfect competition) and by demand-side factors (e.g. limited consumer rationality, limited foresight, availability of imperfect but cheaper substitutes) (Cutler 1996, Brown and Finkelstein 2007)
4
3. Main features of the AWBZ
The AWBZ constitutes a mandatory insurance scheme for long-term care the entire Dutch
population. Every Dutch citizen older than 15 years of age with a taxable income has to pay an
income-related contribution (up to a certain maximum amount) that is collected through the income
and payroll tax systems, along with the contributions for the other national insurance schemes (e.g.
for unemployment and disability). In addition, for most long-term care services covered by the
AWBZ income-related co-payments are required. For higher income groups the maximum
copayment can be so high (about 1800 euro per month for residential care) that private facilities are
often more attractive. Income-related contributions, co-payments as well as an annual State subsidy
are collected in a General Fund (abbreviated as: AFBZ).
[Table 2 about here]
Table 2 provides an overview of the different sources of funding of the AWBZ in 2008. Since in the
same year the total expenditures from the General Fund were 21.4 billion euro, there was an overall
deficit of 2.1 billion euro (to be compensated by an extra increase in the 2009 contribution rate). As
shown in Table 2, more than 75% of the AWBZ is financed directly by households, while the
residual amount is paid by the State out of general taxes. Table 3 provides an overview of the most
important categories of long-term care users and their relative share in long-term care expenditure
[Table 3 about here]
Formally the AWBZ is administered by health care insurers that provide coverage for curative health
services. In practice, however, health care insurers have delegated various responsibilities – in
particular the contracting of health care providers, the collection of patient contributions and the
5

organization of regional consultations – to the largest regional health care insurer. At present, the
Netherlands is divided into 32 care regions and in each region a single health insurer (called “regional
care office”) carries out the AWBZ on behalf of all health insurers for all residents living in that
region. Regional care offices receive a fixed budget for the administrative tasks. All long term care
expenses are directly paid out the General Fund (AFBZ). Hence, neither regional care offices nor
individual health insurers are at risk for long term expenses covered by the AWBZ scheme.
Before a person can qualify for care under the AWBZ, it is necessary to establish whether care is
really required and, if so, what type of care and how much care is needed. Initially, health care
providers were responsible for the required needs assessment, but in 1998 this task was assigned to
regional independent needs assessment organizations, and since 2005 to a single national
organization (the Centre for needs assessment, abbreviated as: CIZ)2. The idea behind this was to
make needs assessment more objective and uniform and independent from the self-interest of health
care providers. Notice that the access to long-term care is solely based on a person’s health – like in
Germany and Japan – and does not depend on his income or wealth – like the Medicaid program in
the US.3
Prior to 2003 the LTC benefits covered by the AWBZ scheme were defined in terms of the type of
care or the type of health care provider people were entitled to. To encourage innovation, consumer
choice and an efficient substitution of long term care services, in 2003 the definition of entitlements
was radically changed into seven broad functional care categories. In 2007 one of these categories –
domiciliary care – was excluded from coverage and transferred to the responsibility of the
municipalities under a new Social Support Act (abbreviated as: WMO). The remaining six functional
2 In 2008 this Centre for needs assessment (CIZ) has one main office, six district offices and 30 local offices. 3 Following the recently proposed typology by Ariizumi (2008), the Dutch public insurance system can be characterized as health-based rather than a means-tested program.
6
categories of long term care services that were covered under the AWBZ scheme in 2008 are
summarized in Box 1.4
[Box 1 about here]
Except for the functional category “accommodation” clients who are entitled to care have a choice
of receiving care “in kind” or in the form of a personal care budget (or a combination of both). The
personal care budget is set at about 75 percent of the average cost of care provided “in kind” (in
2003) because this formal care is expected to be more expensive because of the fixed costs are higher
than for the informal care that is often purchased by clients who opt for a personal care budget.
4. Expansion of LTC-services and expenditure, 1968-2005
The enactment and gradual expansion of the public long-term insurance scheme (AWBZ) paved the
way for a strong growth of long-term care facilities and of public expenditure on LTC. The
percentage of GDP spent on long-term services covered by AWBZ increased from 0.8 percent in
1968 to 2.0 percent in 1980 and further to 4.0 in 2005. Part of this increase, however, is due to an
expansion of AWBZ coverage.
[Figure 1 about here]
As shown in Figure 1, from 1985 to 2000 the percentage of GDP spent on long-term care services
that were covered by AWBZ in 2000 was more or less stable, around 3.5 percent (in 1985, however,
4 In 2009 two functional categories – supportive and activating guidance – are combined into a single category “guidance”. At the same time, guidance that is aimed at social participation is excluded from coverage and brought under the scope of the Social Support Act (WMO).
7

only 2.0 percent was covered by AWBZ and 1.5 percent was financed in other ways). Hence, taking
into account the expansion of AWBZ coverage, the expenditure on long-term care services as a
percentage of GDP has been quite constant over a considerable period of time. This is remarkable
given the ageing of the population (albeit fairly moderate during that period) and the susceptibility of
LTC to Baumol’s cost disease due to the limited scope for productivity gains in the provision of
long-term care (Oliviera Martins et al. 2006).5
The main reason for the limited growth of public spending on long-term care has been the
implementation of cost-containment policies since the early 1980s. In 1984 the government
introduced for all inpatient long-term health services a system of budgeting. In addition, already since
the 1970s the entry and capacity of new long-term care institutions was strictly regulated. For
building and major investments in facilities a license from the government was required, and only if
investments were judged to be of sufficient priority such a license was granted. Furthermore,
especially during the 1980s the government successfully tried to moderate the increase in the wages
of nursing personnel. In the 1990s, prompted by an economic recession, the budgetary controls were
expanded to comprise also home health care and other outpatient long-term care services.
The persistent rationing of supply, postponement of investments and budgetary controls resulted in
growing waiting lists and a general perception of a deterioration of quality, particularly compared to
the general increase in standard of living and the rising expectations about the quality of care people
would like to receive at old age. In 1999 the court ruled in an important case in which patients
challenged the long waiting list for home health care, that people are entitled by the AWBZ to timely
access to home health care, and that budgetary considerations are no valid reason for withholding
5 When productivity growth in the long-term care sector lags behind that in other sectors while wages grow at the same rate, relative prices of LTC vis-à-vis other goods and services in the economy will rise. In case of a low price-elasticity of demand for LTC - which is likely in the presence of public insurance - the share of LTC expenditure in GDP will increase over time.
8

care. In fact, the court decision implied that a too stringent rationing of health services was not
compatible with the “right to care” that was guaranteed by the social insurance legislation (AWBZ).
Urged by the court decision and a period of strong economic growth, in 2000 the government
decided to lift the budgetary controls and to reimburse all extra production necessary to reduce
waiting lists. Indeed, from 2000 to 2003 waiting lists were substantially reduced: for home health care
were reduced by 64 percent, for nursing homes by 39 percent and for elderly homes by 23 percent
(Van Gameren 2005). As a consequence, during that period the expenditure on long-term care
rapidly increased to more than 10 percent per year (see Figure 2), resulting in an increase from 3.5 to
4.0 percent in the share of GDP spent on long-term care (see Figure 1).
[Figure 2 about here]
During the period 1985-2005 the average annual growth of real expenditure on long-term care
services covered by AWBZ was 3.3 percent, whereas the average annual increase of GDP was about
2.7 percent. The average difference of 0.6 percent, however, is completely caused by the high cost
inflation during the short period from 2000 to 2003. As shown in Figure 3, the largest share of
expenditure growth can be explained by an increase in relative prices (2.0 percent) while about 1.3
percent can be attributed to an increase in production.6
[Figure 3 about here]
From figure 3 it can be concluded that for four of the five major categories of long-term care
services the annual cost growth was about 4 percent, which is well above the annual increase of
GDP. This relatively high cost increase is largely compensated, however, by a relatively low cost
6 Production of long-term care services is measured by the Social and Cultural Planning Office (Eggink et al. 2008) using indicators of production (e.g. admissions, daytreatments, length of stay, number of patients etc.) weighted by the type and intensity of treatment.
9

increase of residential elderly care (on average about 1.3 percent per year). This is caused by a
decrease in production (on average -0.7 percent per year) due to reductions in the capacity of elderly
homes and a substitution toward home health care. As a result, the annual production growth in
home health care is the largest among the five categories of long-term care services (on average about
2.5 percent per year). Clearly, this reflects the trend that elderly people are treated at home for a
longer period.
[Figure 4 about here]
The annual change in real expenditure for each of the five categories of long-term care is depicted in
Figure 4. This figure shows that except for elderly homes, real expenditure steadily grow, and that for
all categories expenditure growth has accelerated during the 2000-2003. For home health care,
however, the continuous growth is disrupted in 2004, which can be largely attributed to a substantial
increase in copayments to curb the high cost inflation during the preceding years (Eggink et al. 2008).
The growth in real expenditure can be decomposed into a volume and price component, as shown in
Figures 5 and 6 respectively.
[Figure 5 about here]
As can be observed from Figure 5, particularly since the mid-1990s there is a clear downward trend
in the production volume of elderly homes. This is more than compensated by a strong growth of
the production of home health care, that increased by 5 percent per year since 1996. From 1990 to
1996, however, the real production growth of home health services was about zero, due to stringent
budgetary controls by the government. Since 1997 budgets were gradually raised to reduce the fast
growing waiting lists, and, as discussed earlier, in 2000 the budgetary controls were completely lifted,
10

resulting in a peak in the production growth of home health services during the 2000-2003 period. In
contrast to the production of elderly homes and home health care, the production of nursing home
care displays a steady growth, which is in line with the demographic trend of an ageing population.
The steady growth of production of care for the mentally handicapped cannot be explained by a
demographic trend but by a higher use of services by the mentally handicapped and a gradual
expansion of the number of people who are defined as being mentally handicapped (Eggink et al.
2008).
[Figure 6 about here]
Figure 6 shows that the real price of providing long-term care services increased for categories during
the 1985-2005 period. The pattern is quite similar for all categories except home health services.
Whereas the increase in real price of home health care is relatively high in the first half the observed
period, since 1996 prices remained more or less constant. This is in sharp contrast to the substantial
price increase for other long-term care services during that period. The reason for this is the
substantial increase in labour productivity in the home health care sector, which fully compensated
the real wage increase (which was comparable as in other long-term care sectors).
[Figure 7 about here]
As shown in Figure 7 labour productivity for all long term care services decreased by 0.3 percent
over the entire 1985-2005 period, contributing slightly to the overall price increase. This is
corroborates the supposition that Baumol’s cost disease is particularly relevant for long-term care
services (Oliviera Martins et al. 2006). Contrary to the general trend, labour productivity in home
health care increased by on average 0.7 percent per year during the same period. As can be seen from
Figure 8, this growth in labour productivity was particularly pronounced in the second half of this
period.
11
[Figure 8 about here]
The increase in labour productivity in home health care is attributed to a relative decline in
administrative and managerial personnel and the introduction of benchmarking and time
management to increase the efficiency of production (Eggink et al. 2008).
Looking at the development of long-term care expenditure in the period 1985-2000, supply
regulation and budgetary restrictions were clearly quite effective in containing cost. The downside of
the prolonged rationing policies, however, were increasing waiting lists, resulting in a growing public
discontent and incompatibility with the legally established entitlements to long-term care services.
For this reason, in 2000 a continuation of the prevailing cost containment strategy was no longer
politically feasible. On the other hand, the radical change toward an open-ended reimbursement
policy was no solution either, since the resulting unimpeded cost inflation – without accompanying
incentives for efficiency – is not sustainable in the long or even in the short run. Already in 2004 the
government tried to regain control over long-term care expenditure by concluding agreements with
the interest associations of long-term care providers to limit the growth of expenditure and to
increase production. In addition, particularly for home health services co-payments were increased.
In 2005, the government reinstated budgetary controls by imposing regional budgets for each of the
32 regions, based on the past expenditure on long-term care in that region. Regional care offices were
made responsible for the allocation of these budgets and had to negotiate with regional providers
about price and maximum level of production. By reintroducing tight budget constraints, the
government runs the risk that waiting lists will increase, which could again generate a conflict with
the existing legal entitlement to long term care. In contrast to the late 1990s, however, there is an
important safety valve: the personal care budget. Since personal care budgets do not fall under the
scope of the regional budget constraints, long-term care providers can exceed their budgets if they
12

can persuade their clients to apply for a personal budget and to use this to pay the provider. Indeed,
this is one of reasons for the vast increasing popularity of personal care budgets.
5. Personal care budgets, consumer direction and informal care
In addition to increasing waiting lists, the top-down supply regulation and cost control also resulted
in a growing mismatch between demand and supply. During the 1990s long-term care providers were
increasing criticized of not being able to meet consumer preferences: they were not able to deliver
the right services at the right time. Moreover, the new generation of long-term care users had higher
expectations and was better able to express its preferences for long-term care. To empower the
consumer of outpatient long-term care services and to reduce the apparent mismatch between supply
and demand, the government introduced the option of a personal care budget in 1995. Started as a
small scale experiment for purchasing home services, personal care budgets now comprise a about
7% of long-term care expenditure covered by AWBZ and are used by more than 10 percent of long-
term care users. Table 4 provides some key figures about personal budgets in 2005.
[Table 4 about here]
Each year the government sets a total budget that can be spent on personal care budgets. Particularly
since 2005 the demand for personal care budgets is much larger than the available budget. In 2007,
for instance, the government decided four times to raise the budget, resulting in a total annual budget
increase of 35 percent. Several factors are responsible for the fast expansion of the personal budgets
(Ministry of Health 2007). First, there is growing use of personal care budgets for the assistance of
young people with psychiatric disorders (e.g. autism, ADHD). Second, personal care budgets are
increasingly used for paying informal care by relatives, neighbors and friends, which care previously
13
was often provided for free. Third, an increasing number of brokers is becoming active that – in
return for a fee – offer people to assist in applying for a personal care budget. Finally, personal
budgets are increasingly used by home health care agencies to escape the budget constraints.
On the other hand, personal care budgets are valued by many clients as an effective means to
purchase and organize care that better meets their preferences than regular care contracted by
regional care offices. In that respect the discussion is not whether personal care budgets are a useful
means to increase consumer direction and choice, but how to avoid the inappropriate use of personal
budgets and the crowding out of informal care that is currently provided “for free”.
It is obvious that a public service that allows people to pay their family members to provide care, like
the personal care budgets, involves a relatively large danger of misuse. Given the number of people
using a personal care budget, detailed controls require high transaction costs. Initially, the Social
Insurance Bank (SVB)7 managed the major part of the personal budget. A client could instruct the
SVB to pay the care providers. Clients received a minor part of the personal care budget on their
bank account for transaction costs. There were, however, major complaints about the way the SVB
was organised. For instance, they often made payments too late. From April 2003, clients got the
personal budget on their bank account and could manage it themselves. They have to justify their
spending afterwards. Control occurs by means of random checks and clients have to justify their
expenditures.
But the first control mechanism is when people apply for a personal care budget. As mentioned
before, the CIZ determines how much care a person can legally claim. The CIZ bases this judgement
on an assessment of the person’s health status. People are not solely seen as individuals but as parts
of their social environment. In their judgement, the CIZ accounts for what they call “common care”.
For instance, they define it as common that partners provide care for each other in case of care needs
7 The Social Insurance Bank is a social security agency.
14
for at least three months. This way of thinking in terms of common care was partly developed as a
reaction on the introduction of personal care budgets. Without clear definitions of common care, it
seemed very likely that personal care budgets could result in a substitution of informal care that was
previously provided for informal care paid from the personal care budgets. It is however, unclear to
what extent people still are able to use personal care budgets for a substitution of unpaid in paid
informal care. Especially, the rise of personal care budgets for the assistance of young people with
psychiatric disorders has been attributed to the substitution of unpaid informal care by their parents
in paid informal care.
6. Projections of future LTC expenditure
Future expenditure on long-term care depends on a number of factors, both demographic and non-
demographic. Oliviera Martins et al. (2006) explicitly model the potential determinants of future
long-term care expenditure (primarily elderly care) to project the expected share of GDP spent on
long-term care in 2050 for 30 OECD countries. The main results of their projections for Japan and
the Netherlands are summarized in Table 5.
[Table 5 about here]
Since the dependency on long-term care increases sharply with age, demographic effects contribute
to a substantial increase in LTC expenditures, especially in rapid ageing countries such as Japan.
The effects of ageing on long-term care consumption might be mitigated by a “healthy ageing”
process if longevity gains are fully or partially translated in additional years in good health. Since the
empirical evidence about the occurrence (and extent) of a healthy ageing process is mixed, Oliviera
Martins et al. (2006) assume that only half of the longevity gains are translated into a reduction in
15
dependency.8 In addition, they also estimate the effect of a full healthy ageing process (compression
of disability) and a complete absence of healthy ageing (expansion of disability). As can be seen in
Table 5, future long-term care expenditures in a country with are more rapidly ageing society like
Japan (see Table 1) are more sensitive to the presence or absence of healthy ageing.
In projecting future long-term care expenditures, Oliviera Martins et al. (2006) capture the Baumol
effect by assuming that unit costs rise in line with aggregate labor productivity, a proxy for wage
growth of care staff. As shown in Table 5 this full Baumol effect induces a steady increase in relative
prices, pushing LTC expenditures to 3.1 percent of GDP by 2050 in Japan, to 3.7 percent of GDP in
the Netherlands and to 3.3 percent for the OECD countries on average. In addition, the effects of
potential cost containment policies were simulated assuming that governments would be able to
mitigate the cost pressures associated with the Baumol effect, by stimulating productivity gains and
mitigate wage increase.
Under the base scenario, Oliviera Martins et al. (2006) assume an income elasticity of zero, since they
argue that long-term care can be characterized as a necessity. Although empirical evidence of income
elasticities for long-term care are lacking, estimated income elasticities for health care in general are
all above unity at a country level (Getzen 2000). This suggests that – at least for industrialized
countries – health care can be considered as a luxury. Since the substitution of professional care for
informal care can be seen a luxury that may be only publicly affordable if a country as a whole
reaches a certain aggregate income level, long-term care may well be a luxury rather than a necessity.
If this is true, the result of the sensitivity analysis using a unitary income elasticity may be more
relevant. Table 5 shows that this implies that in 2050 an extra 0.5 percent of GDP would be spent on
long-term care.
8 For both Japan and the Netherlands this assumption might be an underestimation. In Japan the ratio of disability-free life expectancy to life expectancy at age 65 was 92% for men and 87% for women (in 1990), whereas this ratio in the Netherlands was 79% for men and 67% for women (in 2000) (OECD 2005). In Japan the ratio is the highest in the world and is fairly stable over time. In the Netherlands the ratio increased since 1990, particularly for women.
16

The authors also estimate the effect of an increase in dependency as a result of increasing disability
rates (assumed to be 0.5 percent per year) due to a continuation of the current trends in obesity.
Finally, the authors examine the impact of an “increased participation” scenario in which the
availability of informal care is dramatically reduced by assuming that all countries converge towards
labor participation ratio in the age group of 50-64 years (which is used as a proxy for the availability
of informal care) of at least 70% by 2050. As shown in Table 5, both an increase in dependency and
an increase in labor market participation are likely to have substantial impact on long-term care
expenditure in most countries. By contrast for Japan the impact of the increased participation
scenario is negligible because labor market participation is already very high.
In the Netherlands several projections of the future cost of long-term care have been made. Based
on the expected growth of the number of users, the Social and Cultural Planning Office (SCP)
projected an annual growth of expenditure on home health care, elderly homes and nursing home
care of about 1.3 percent in constant prices for the period 2005-2030 (Eggink et al. 2008). The
projected increase in cost is higher than the projected increase in number of users, which can be
explained by the higher expected growth in the number of users of the most expensive long-term
care facilities (especially nursing homes). Looking at the average price increase over the 1985-2005
(see Figures 6 and 7), however, the assumption of constant prices is not realistic. By assuming a
annual real price (or unit cost) increase of 2.0 percent (reflecting the Baumol effect and a possible
increase in quality and intensity of care), the annual growth of public long-term care expenditure on
elderly care is projected to be about 3.4 percent. The projections by the SCP were adjusted by the
Ministry of Health using more recent data of the Central Bureau of Statistics (CBS) on the expected
number of elderly (SER 2008). Since the expected number of elderly is substantially increased, the
projected annual growth at constant prices is raised from 1.3 to 2.1 percent. Adding an annual real
price increase of 2.0 percent would result in an annual real expenditure growth of more than 4
percent, which likely to be substantially higher than the real growth in GDP.
17
The Dutch Central Planning Bureau (CPB) followed another methodology to project future
expenditure on long-term care (SER 2008). After making the observation that expenditure on long-
term care are very sensitive to the type government policy, the CPB made a distinction between two
extreme scenarios. The first scenario is based on a prolonged policy of supply and price regulation as
in the period 1990-2000. Since during this period the annual growth of long-term care expenditure
was 0.6 percent lower than the growth of GDP, the CPB assumes that under this scenario the same
difference in growth would occur during the next decade. This would result in a decline of the
proportion of GDP spent on long-term care to 3.5 percent in 2020. The second scenario on a
prolonged policy of “laissez faire” policy as was prevalent from 2000 to 2006. During this period the
annual growth of expenditure on long-term care growth was about 3.8 percent higher than the
growth of GDP. Using this figure as the relevant difference under the second scenario, the resulting
share of GDP spent on long-term care in 2020 would be 6.4 percent. Since both extreme scenarios
are unlikely, the 3.5 and 6.4 percent of GDP can be perceived as lower and upper bounds on the
long-term care expenditure in 2020. The crucial role of health policy is in line with the observation by
the OECD (2005) that the correlation across countries between long-term care spending and ageing
is rather weak, suggesting that the way of organizing and financing long-term care plays an important
role.
The overall conclusion that emerges from these projections is that the future expenditure on long-
term care are extremely uncertain and very sensitive to the exact growth of the number of elderly,
changes in real prices of long-term care (due to changes labor productivity and the quality and
intensity of care), changes in health policy, changes in labor market participation and trends in
disability among the elderly.
18

7. Proposals to reform LTC financing in the Netherlands
The projections of future expenditure on long-term care make clear that a “laissez faire” policy
without supply and demand constraints (as in the period 2000-2003) is likely to jeopardize the
sustainability of the public long-term care insurance scheme. On the other hand, a return to the
stringent top down rationing policy of the 1990s has serious drawbacks and is not feasible either.
Faced with this dilemma, the government has temporarily opted for a mixture of both policies,
halfheartedly relying both on supply constraints and arrangements to improve efficiency by
increasing consumer direction and choice.
Shortcomings of the current long-term care policy
For the following reasons, this inconsistent policy compromise can achieve neither cost containment
nor an effective increase in efficiency.
First, the currently imposed supply constraints in the form of regional care budgets are not effective
in controlling cost because they can be circumvented by opting for a personal care budget. Since
personal care budget are not included under the regional budget, the regional budget constraint is not
binding. In addition, the regional budget mechanism punishes providers who do a good job and
consequently attract more clients than the number on which their budget is based. If these
presumably efficient providers cannot effectively motivate their clients to apply for a personal care
budget, they run a deficit and may even go bankrupt. Moreover, an increasing number of clients is
forced to apply for a personal care budget to be able to retain their preferred provider, raising their
transaction costs as well as the cost of rent seeking behavior by an increasing number brokers that
assist these clients in handling the required administration.
Second, regional care offices do not have an incentive to allocate the regional budget to the most
efficient providers because they have a regional monopoly (being mandated by all health insurers)
and are not at risk for the cost of care. Since long-term care users cannot choose another regional
19
care office, these offices have no incentive to allocate budgets to providers that best meet consumer
preferences. Again, consumers may opt for a personal care budget (except for inpatient care), but this
is not likely to discipline the behavior of the regional offices because they do not benefit from having
more customers. Moreover, since regional offices get a fixed budget for administrative cost, they
have a financial incentive to negotiate with a limited number of large providers in order to minimize
the cost of contracting. For the same reason, regional care offices have no incentive to take action
against too lenient needs assessment procedures.
Third, the definition of entitlements in terms of six functional categories (see Box 1) has proven to
be too imprecise to provide a firm basis for uniform and unambiguous needs assessment. Particularly
the number of clients that were assessed to in need of “supportive guidance” increased dramatically,
by 37 percent from 2005 to 2007 (Ministry of Health 2008).
Reform proposals
In view of the serious deficiencies of the current long-term policies, the government asked for advice
to a number of advisory and supervisory bodies9 to draft proposals for reforming the system of LTC
financing in order to guarantee a sustainable, efficient and consumer directed provision of long term
care.
This resulted in five different advisory reports, which were not all equivocal. Two reports (by CVZ
and RVZ) recommended to completely abolish the separate public long-term insurance scheme and
to integrate most of the benefits covered by AWBZ into the new national Health Insurance Act for
curative health services (abbreviated: ZVW) and to integrate benefits that are related to social
support and participation into the new Social Support Act (WMO). The main line of reasoning was
that the new health insurance scheme for curative services – based on the model of managed
competition (Van de Ven and Schut 2008) – would provide much stronger incentives for efficiency
9 Specifically, the Social and Economic Council (SER), the Council for Public Health and Health Care (RVZ), the Health Care Insurance Board (CVZ), the Dutch Healthcare Authority (NZa), and a governmental working group (IBO).
20
and to meet consumer preferences, than the AWBZ. Moreover, integrating curative and long-term
care into a single scheme would also provide incentives and possibilities for a better coordination of
care for people with chronic diseases. Next, the original reasons for a separate public insurance
scheme (see section 2) were no longer valid, since the mandatory insurance scheme for curative
services was extended to the entire population in 2006. Finally, the 2007 Social Support Act (WMO)
provided an integrated legal framework for social and community support under the responsibility of
municipalities, so the transfer of social care benefits from the AWBZ to the WMO would also
enhance a better coordination of social care and welfare assistance.
The radical proposals to abolish the AWBZ scheme, however, also had serious potential
shortcomings. Most importantly, it is questionable whether the model of managed competition
underlying the new health insurance scheme for curative services is adequate for the provision and
financing of long-term care (Van de Ven and Schut 1994). A key element of the managed
competition model, which makes it possible to guarantee universal access in a competitive health
insurance market, is an adequate system of risk adjustment (Van de Ven and Schut 2008). At
present, there are no appropriate risk adjusters available for long-term care and it is even unclear
whether adequate risk adjustment is feasible for many of these services (IBO-werkgroep AWBZ
2006). Given the typically high level of expenditure per long-term care user, imperfect risk
adjustment for these type of services may result in unfair competition among insurers and huge
incentives for risk selection if insurers are obliged to charge community rated premiums (as is the
case under the 2006 Health Insurance Act). Another reason why the managed competition model
may not be appropriate for long-term care services is that for many of these services consumers are
not able or willing to act as critical buyers of health plan. There is substantial empirical evidence that
the propensity to switch health plans substantially declines with age and the presence of health
problems (Buchmueller 2006, Schut et al. 2003, Strombom et al. 2002). For long-term care services
for which the number of critical buyers is too small competition may result in a deterioration of
quality, since competitive health insurers may have an incentive to reduce quality in order to reduce
21

cost if this does not result in a significant loss of market share. Finally, the experience with both the
Health Insurance Act and Social Support Act is limited and it unclear whether health insurers and
municipalities are willing and able to perform as prudent purchaser of health and social services.
Therefore, a major expansion of the scope of the responsibilities of health insurers and municipalities
would be premature.
In view of these shortcomings, other advisory reports proposed to maintain a separate insurance
scheme for several categories of long-term care, at least comprising care for the mentally
handicapped. Among these reports, the proposal by the Social and Economic Council was the latest
and the most prominent (SER 2008). The SER proposed to reform the AWBZ along the following
main lines:
1. A much more clear cut and unambiguous delineation and definition of entitlements;
2. An improvement of the needs assessment by, for example, introducing protocols,
benchmarking and a permanent supervision of the assessment bodies
3. A reduction of coverage by transferring short-term rehabilitation services to the public
insurance scheme for curative health services (Health Insurance Act) and by bringing the
provision of social care under the responsibility of the municipalities (Social Support Act);
4. A far-reaching separation of the financing of residing and care, implying that
accommodation would no longer be reimbursed by public insurance; lower income must be
subsidized to pay the rent to compensate institutions for the cost of accomodation; it is
expected that the separation of care and residing will lead to innovative combinations of
residing, care, welfare and participation.
5. A replacement of provider-based budgeting by client-based budgeting. Rather than clients
having to follow the money – as in the current provider-based budgeting system – the
money should follow the client. Clients would have the option to choose a personal care
budget (as in the current system) and arrange all care by themselves, or to choose among
providers contracted by regional care offices (to be replaced by individual health insurers in
22
2012). Providers can increase revenues if they are able to attract more clients by offering
better service (for a fixed budget per client). The client-based budgets should be based on
the categorization of clients in “care service packages” (abbreviated: ZZPs) by the needs
assessment bodies. A “care service package” described the type and amount of care needed
by the client. For each “care service package” a budget will be calculated.
In June 2008 the government made clear to endorse the main lines of SER-proposal and announced
the first steps to implement its recommendations (a more precise demarcation of entitlements and an
exclusion of recovery and social support from coverage by 2009).
8. Conclusion: toward sustainable LTC-financing?
Whether the proposed reform will lead to a sustainable financing and more consumer-directed
provision of long-term care services crucially depends on three factors: (1) the ability to sharpen the
definition of entitlements; (2) the ability to improve the accuracy of needs assessment; and (3) the
ability to develop appropriate “care service packages” as a solid basis for client-based budgeting. The
feasibility of these three requirements is highly uncertain. In particular client-based budgeting may
turn out to be complicated. In 2008 “care service packages” have been developed for inpatient care,
which will be used for determining the budgets for inpatient care long-term care facilities in 2009 (i.e.
nursing homes, elderly homes, institutions for mentally and physically handicapped and mental care
institutions). The experience with these “care service packages” for financing inpatient care may
make clear whether these packages can provide a firm basis for client-based financing. A key
question will be whether the predictable cost variation per care package will be small enough to avoid
problems of cream skimming and misallocation of funds.
An important, yet unanswered question is how client-based budget should be determined: should it
be based on the average cost of all providers that offer the care package? Given the increasing
23

pressure to contain public expenditure on long-term care services, the most likely outcome may be
that the client-based budgets will be derived from the regional budgets (or a national budget) set by
the government, using the “care service packages” as relative weights for the determining the
(regional) level of the client-based budget for each care package.10 The way of determining the
budget will be closely related to another still unanswered question, namely for whom the client-based
budget should be binding? When the actual cost of providing a care package exceeds the client-based
budget, who should bear the additional costs: the client, the provider, or the insurer (or regional care
office) contracting the provider? In other words, would the provider be allowed to charge a higher
price or would the insurer be allowed to require an additional contribution when the client-based
budget is not sufficient to cover all costs?
Although the proposed reform offer a promising perspective to combine sustainable and universally
accessible long term care financing with a consumer-directed provision of care, a number of
complicated issues have to be resolved. The Dutch experiences in implementing the reform may
therefore provide important lessons for countries with a public insurance scheme for long-term care
– e.g. Japan and Germany – that also struggle with the question how to guarantee a sustainable and
consumer-oriented system of long-term care financing.
10 Using a national rather than regional budgets may be politically attractive because then government may avoid a socially controversial regional variation in the level of client-based budgets.
24
References
Ariizumi, H. (2008) Effects of public long-term care insurance on consumption, medical care
demand, and welfare. Journal of Health Economics 27: 1423-1435.
Brown, J.R. and A. Finkelstein (2007) Why is the market for long-term care insurance so small?
Journal of Public Economics 91: 1967-1991.
Buchmueller, T.C. (2006) Price and the Health Plan Choice of Retirees, Journal of Health Economics
25(1): 81-101.
Cutler, D. (1996) Why don’t markets insure long-term risk? Unpublished working paper.
http://www.economics.harvard.edu/faculty/cutler/files/ltc_rev.pdf
Eggink, E., E. Pommer and I. Woittiez (2008) De ontwikkeling van de AWBZ-uitgaven. Een analyse
van de AWBZ-uitgaven 1985-2005 en een raming van de uitgaven voor verpleging en verzorging
2005-2030. Sociaal en Cultureel Planbureau, Den Haag.
Getzen, T.E. (2000) Health care is an individual necessity and a national luxury: applying multilevel
decision models to the analysis of health care expenditures. Journal of Health Economics 19 (2): 259-270.
IBO-werkgroep AWBZ (2006), Toekomst AWBZ. Eindrapportage van de werkgroep Organisatie romp
AWBZ, Interdepartementaal Beleidsonderzoek 2004-2005, nr. 4, Den Haag.
Ministry of Health (2004) Op weg naar een bestendig stelsel voor langdurige zorg en maatschappelijke
ondersteuning, Letter to parliament, DVVO-U-2475093, Den Haag.
25
Ministry of Health (2006). Fact sheet personal budget AWBZ,
http://www.minvws.nl/en/folders/zzoude_directies/dvvo/2005/fact-sheet-personal-budget-
awbz.asp
Ministry of Health (2007) Pgb in perspectief, Letter to parliament, DLZ/ZI-U-2811809, November 9,
2007, Den Haag.
Ministry of Health (2008) Zeker van zorg, nu en straks, Letter to parliament, DLZ/KZ-2856771, June
13, 2008, Den Haag.
OECD (2005) Long-term care for older people, OECD, Paris.
Oliviera Martins, J. and C. de la Maisonneuve (2006) The drivers of public expenditure on health and
long-term care: An integrated approach. OECD Economic Studies 43 (2): 115-154.
Schut, F.T., S. Greβ, and J. Wasem (2003) Consumer price sensitivity and social health insurer choice in
Germany and the Netherlands, International Journal of Health Care Finance and Economics 3; 117-138.
SER (2008) Langdurige zorg verzekerd: Over de toekomst van de AWBZ, Publicatienummer 3,
Social and Economic Council (SER), Den Haag.
Strombom, B.A., T.C. Buchmueller and P.J. Feldstein (2002), Switching costs, price sensitivity and
health plan choice, Journal of Health Economics 21: 89-116.
26
Van de Ven, W.P.M.M. and F.T. Schut (1994) Should catastrophic risks be included in a regulated
competitive health insurance market? Social Science and Medicine 39 (10): 1459-1472.
Van de Ven, W.P.M.M. and F.T. Schut (2008) Universal mandatory health insurance in the
Netherlands: a model for the United States? Health Affairs 27 (3): 771-781.
Van Gameren, E. (2005) Regionale verschillen in de wachtlijsten verpleging en verzorging. Een emprisch onderzoek
naar verklarende factoren. Werkdocument 119. Sociaal en Cultureel Planbureau (SCP), Den Haag.
27

Box 1: Functional categories of care covered by AWBZ
1. Personal care: e.g. help with taking a shower, bed baths, dressing, shaving, skin care, going to
the toilet, eating and drinking. 2. Nursing: e.g. dressing wounds, giving injections, advising on how to cope with illness, showing
clients how to self-inject. 3. Supportive guidance: e.g. helping the client organize his/her day and manage his/her life
better, as well as day-care or provision of daytime activities. 4. Activating guidance: e.g. talking to the client to help him modify his behavior or learn new
forms of behavior in cases where behavioral or psychological problems exist. 5. Treatment: e.g. care in connection with an ailment, such as serious absent mindedness. 6. Accommodation: e.g. some people are not capable of living independent lives, but require, for
example, sheltered housing or continuous supervision in connection with serious absent mindedness. In some cases, a client’s care requirements may be too great to address in a home environment, making admission to an institution necessary.
28

Table 1. Share of older persons in the population and old-age dependency ratio, 1960 to 2040
Share of 65 and over Share of 80 and over Old age-dependency ratio (pop.>65/pop.20-64 * 100%)
1960 2000 2040 1960 2000 2040 1960 2000 2040 Japan 5.7 17.4 35.3 0.7 3.8 14.1 10.6 27.9 59.9 Netherlands 9.0 13.6 25.5 1.4 3.2 7.6 16.9 21.9 48.1 OECD Average 8.7 13.8 25.6 1.3 3.1 7.7 15.9 22.9 46.3 Source: OECD (2005)
29
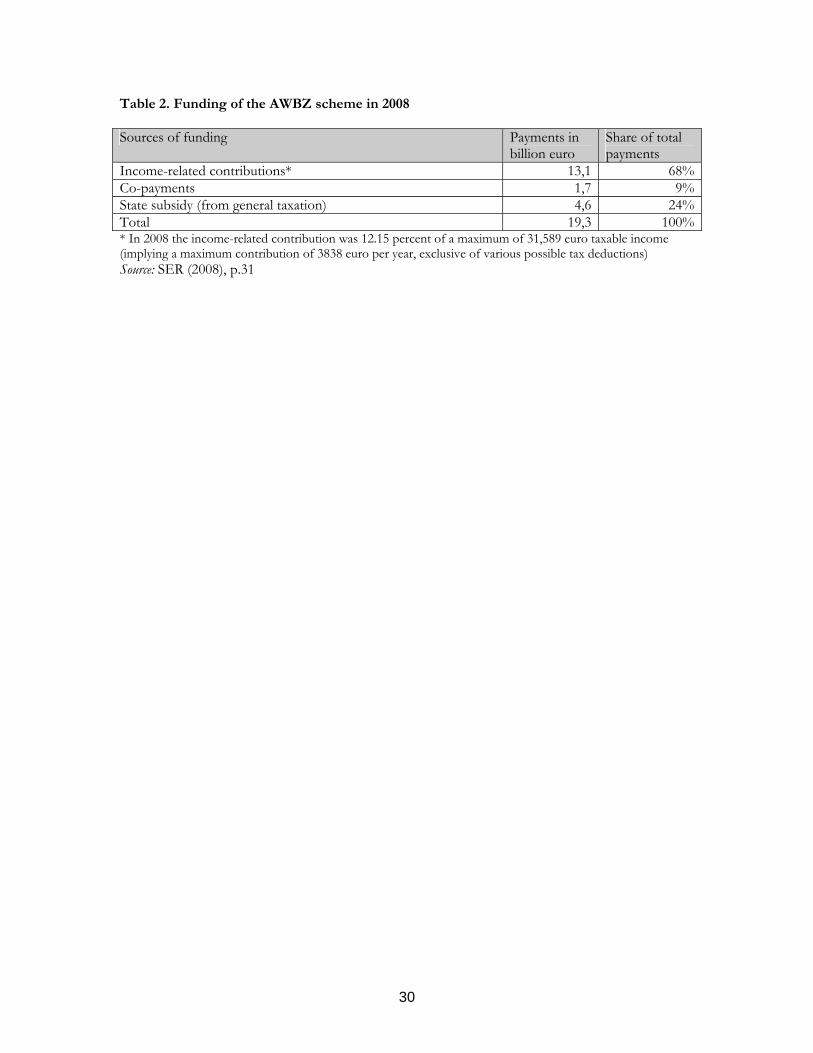
Table 2. Funding of the AWBZ scheme in 2008 Sources of funding Payments in
billion euro Share of total payments
Income-related contributions* 13,1 68%Co-payments 1,7 9%State subsidy (from general taxation) 4,6 24%Total 19,3 100%* In 2008 the income-related contribution was 12.15 percent of a maximum of 31,589 euro taxable income (implying a maximum contribution of 3838 euro per year, exclusive of various possible tax deductions) Source: SER (2008), p.31
30
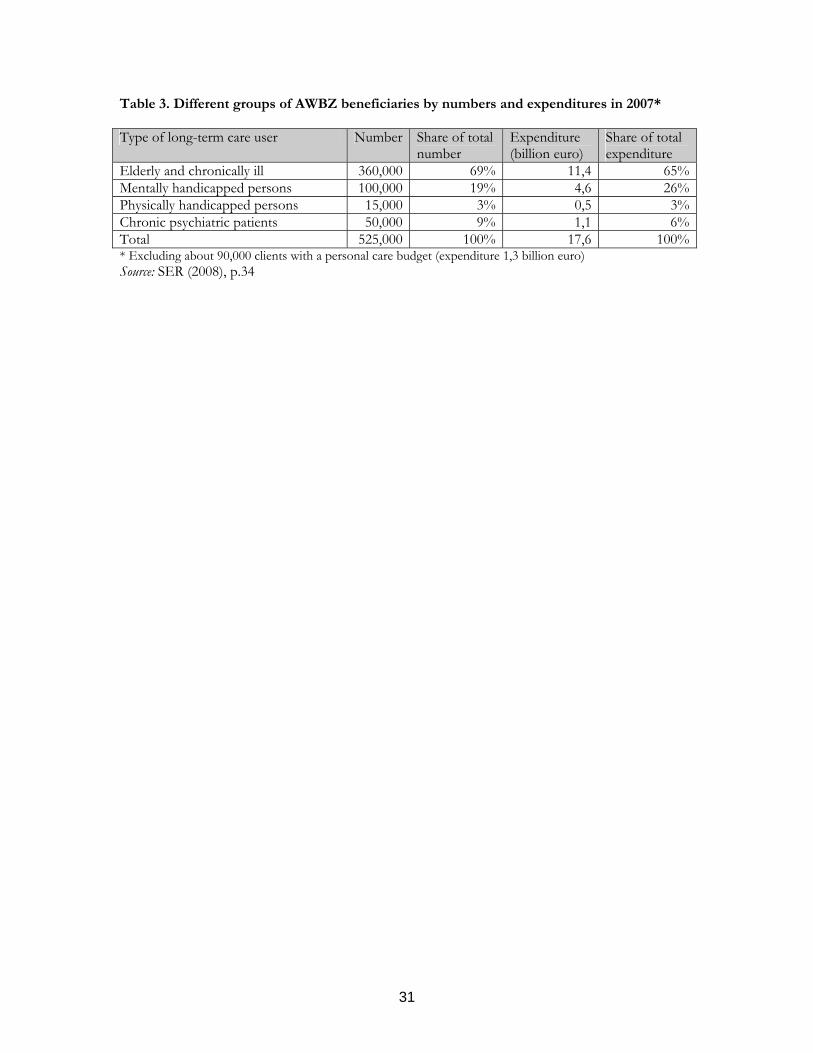
Table 3. Different groups of AWBZ beneficiaries by numbers and expenditures in 2007* Type of long-term care user Number Share of total
number Expenditure (billion euro)
Share of total expenditure
Elderly and chronically ill 360,000 69% 11,4 65%Mentally handicapped persons 100,000 19% 4,6 26%Physically handicapped persons 15,000 3% 0,5 3%Chronic psychiatric patients 50,000 9% 1,1 6%Total 525,000 100% 17,6 100%* Excluding about 90,000 clients with a personal care budget (expenditure 1,3 billion euro) Source: SER (2008), p.34
31
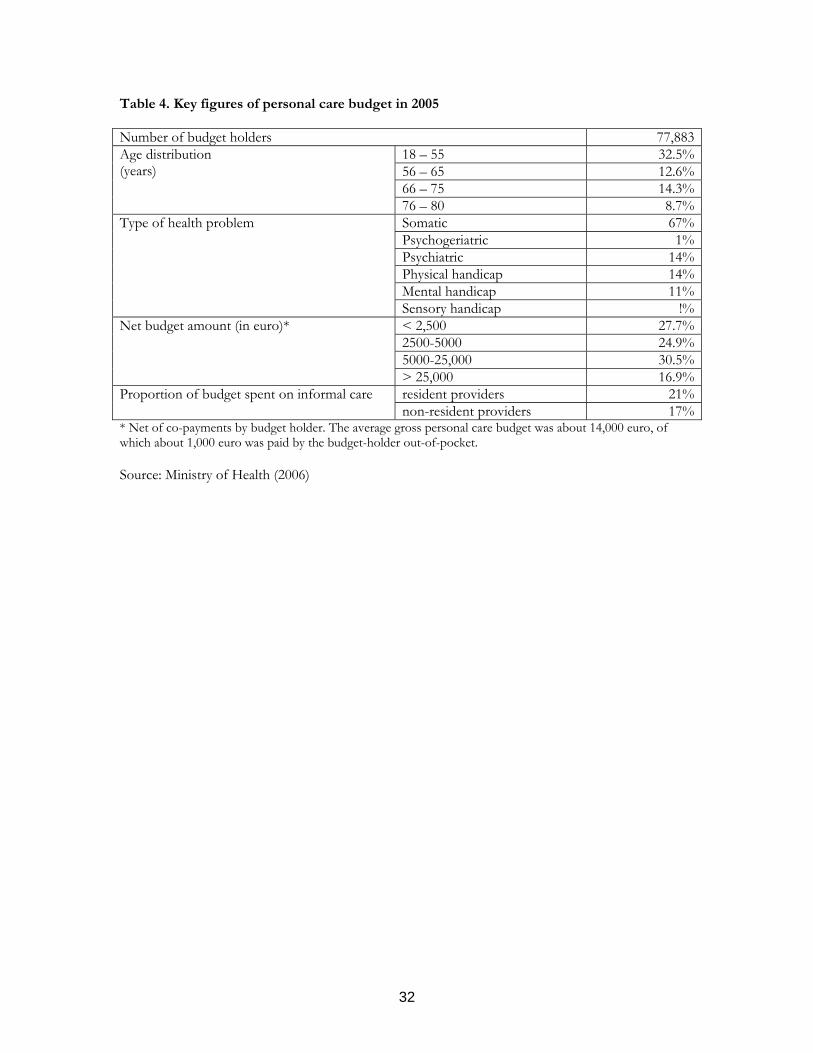
Table 4. Key figures of personal care budget in 2005 Number of budget holders 77,883
18 – 55 32.5%56 – 65 12.6%66 – 75 14.3%
Age distribution (years)
76 – 80 8.7%Somatic 67%Psychogeriatric 1%Psychiatric 14%Physical handicap 14%Mental handicap 11%
Type of health problem
Sensory handicap !%< 2,500 27.7%2500-5000 24.9%5000-25,000 30.5%
Net budget amount (in euro)*
> 25,000 16.9%resident providers 21%Proportion of budget spent on informal care non-resident providers 17%
* Net of co-payments by budget holder. The average gross personal care budget was about 14,000 euro, of which about 1,000 euro was paid by the budget-holder out-of-pocket. Source: Ministry of Health (2006)
32

Table 5. Projection scenarios for public long-term care expenditure*, 2005-2050 (% of GDP)
Sensitivity analysis (compared to cost containment scenario) Demographic effect
Full Baumol effect
Cost containment Unitary
income elasticity
Compression of disability
Expansion of disability
Increase in dependency
Increased participation
2005
2050 Japan 0.9 2.3 3.1 2.4 2.8 1.9 2.9 3.7 2.3 Netherlands 1.7 2.4 3.7 2.9 3.5 2.4 3.4 4.1 3.9 Average** 1.1 2.3 3.3 2.4 2.9 1.9 2.8 3.5 3.9 * According to a narrow definition of long-term care, including primarily elderly care (accounting for about 45 percent of expenditures covered by AWBZ) ** 30 OECD countries Source: Oliviera Martins et al. (2006)
33

Figure 1. Percentage of GDP spent on long-term care services covered by AWBZ at the time and in 2005, from 1985-2005*
0
1
2
3
419
8519
8619
8719
8819
8919
9019
9119
9219
9319
9419
9519
9619
9719
9819
9920
0020
0120
0220
0320
0420
05
% GDP
LTC-services in 2005 covered by AWBZLTC-services at the time covered by AWBZ
* From 1997 to 2005 the LTC-services covered by AWBZ were the same as in 2005, so both lines overlap. The bubble in the dotted line from 1992 to 1995 is caused by a temporary inclusion of outpatient drugs into the AWBZ benefits package. Sources: Ministry of Health (2004), Eggink et al. (2008)
34
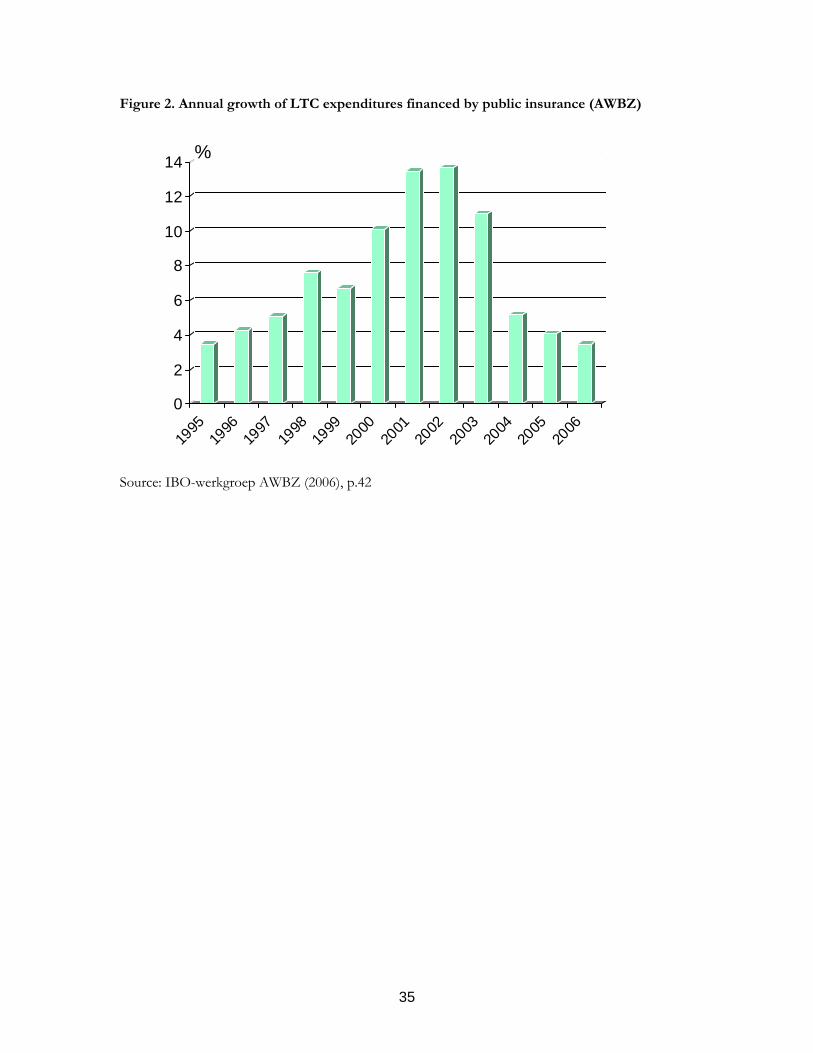
Figure 2. Annual growth of LTC expenditures financed by public insurance (AWBZ)
0
2
4
6
8
10
12
14 %
1995
1996
1997
1998
1999
2000
2001
2002
2003
2004
2005
2006
Source: IBO-werkgroep AWBZ (2006), p.42
35

-1
0
Figure 3: Average annual growth (in %) of LTC-benefits covered by AWBZ, 1985-2005
2
3
4
5
1
36
Total Home healthcare
Elderlyhomes
Nursinghomes
Mentallyhandicapped
care
Mental healthcare
Volume Price Total Source: Eggink et al. (2008)

Figure 4. Real expenditure* growth long-term care benefits (AWBZ), 1985-2005 (1985=100)
8090
100110120130140150160170180190200210220230240250
1985
1986
1987
1988
1989
1990
1991
1992
1993
1994
1995
1996
1997
1998
1999
2000
2001
2002
2003
2004
2005
Total
Home health care
Mentally handicapped care
Mental health care
Nursing homes
Elderly homes
* Real expenditures are obtained by deflating nominal expenditure by the price index of GDP. Source: Eggink et al. (2008)
37

Figure 5. Weighted production growth long-term care (AWBZ), 1985-2005 (1985=100)
80
90
100
110
120
130
140
150
160
170
1985
1986
1987
1988
1989
1990
1991
1992
1993
1994
1995
1996
1997
1998
1999
2000
2001
2002
2003
2004
2005
Total
Home health care
Mentally handicapped care
Mental health care
Nursing homes
Elderly homes
Source: Eggink et al. (2008)
38

Figure 6. Growth of real price of long-term care benefits (AWBZ), 1985-2005 (1985=100)
80
90
17
0
0
0
0
0
0
0
019
8519
8619
8719
8819
8919
9019
9119
9219
9319
9419
9519
9619
9719
9819
9920
0020
0120
0220
0320
0420
05
16 15 14 Total Home health care13 Mentally handicapped care
Mental health care12 Nursing homes
11
39
10
Elderly homes Source: Eggink et al. (2008)

Figure 7. Components of the growth of real prices of long-term care benefits, 1985-2005
3
2
1
0
40
-1Total Home health
careElderlyhomes
Nursinghomes
Mentallyhandicapped
care
Mental healthcare
Labour productivity Hourly wages Material cost Total Source: Eggink et al. (2008)
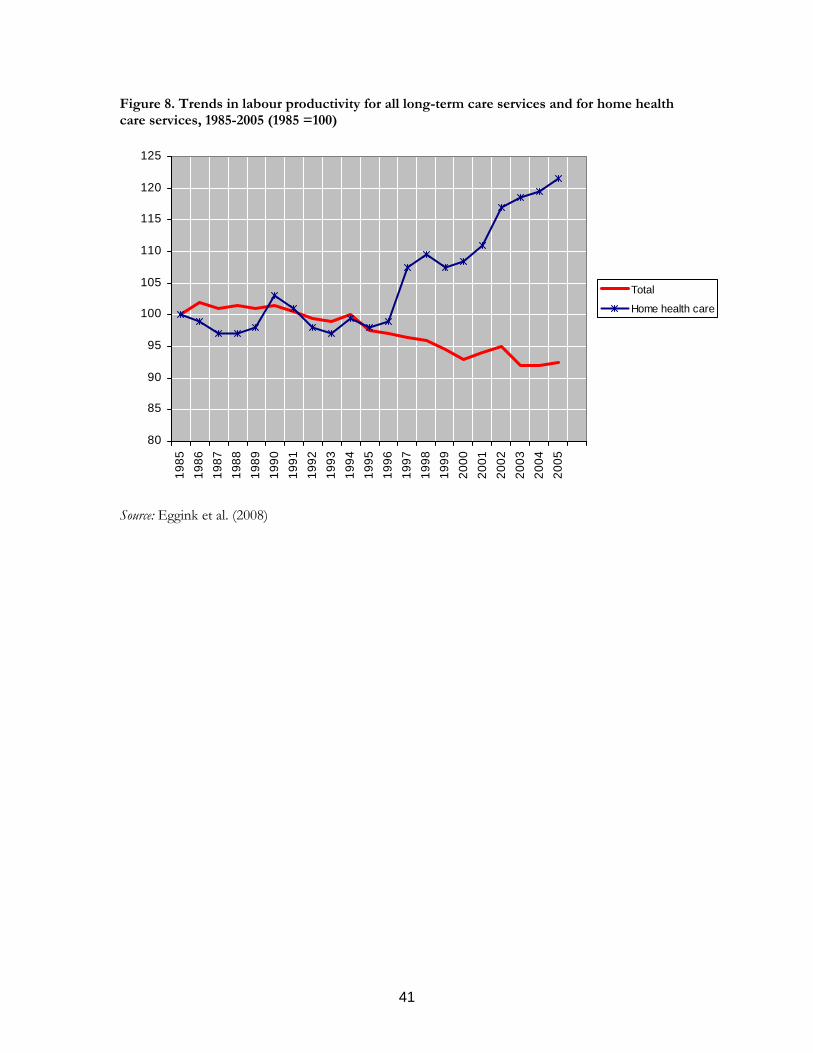
Figure 8. Trends in labour productivity for all long-term care services and for home health care services, 1985-2005 (1985 =100)
80
85
90
95
100
105
110
115
120
125
1985
1986
1987
1988
1989
1990
1991
1992
1993
1994
1995
1996
1997
1998
1999
2000
2001
2002
2003
2004
2005
Total
Home health care
Source: Eggink et al. (2008)
41