sustainability report 2013 - aspen pharma
TRANSCRIPT

Aspen Pharmacare Holdings LimitedSustainability Report 2013

Reading the Sustainability ReportThis is Aspen’s fourth Sustainability Report which has been prepared in
accordance with the Global Reporting Initiative’s (“GRI”) B+ application
level. The 2013 Sustainability Report has been assured for the first time
using a combined assurance approach.
Economic, environmental, social and governance aspects, which are
considered to be relevant to the Group’s strategic objectives, have
been presented in the Sustainability Report under sustainability
themes which present the Group’s material issues.
The Sustainability Report is supplementary to the Group’s 2013
Integrated Report, Annual Financial Statements and Corporate
Governance Reports. These documents are available online.
The GRI Standard Disclosures Table and web-based documents referred
to herein can be accessed online.
For an electronic version of the Integrated Report, Annual Financial
Statements and Supplementary Documents, please visit:
www.aspenpharma.com
Reference to information elsewhere in the Integrated Report
Reference to information in the Annual Financial Statements
Reference to information in the Supplementary Documents
Download QR code reader for your smartphone and scan the QR code for quick access to the website
Company names and currencies have been abbreviated throughout the Sustainability Report. Full names and additional abbreviations can be referenced on the inside back cover.
1 Message from the Group Chief Executive
4 Aspen’s sustainability reporting process
Sustainability Report
Economic Sustainability
8 Sustaining life and health through high quality and affordable medicines
12 Adding economic value to stakeholders
22 Sustaining a cost-competitive manufacturing base
Social Sustainability
24 Creating an environment in which our employees can thrive
27 Respecting human rights and promoting equality
28 Contributing to the enhancement of healthcare, education and basic needs in communities
30 Supporting the well-being of our employees
32 Providing a safe working environment
Environmental Sustainability
34 Playing a role in preserving the environment
36 Managing efficient utilisation of scarce resources
40 Abbreviations and formulae
CONTENTS
BASTION GRAPHICS
Abbreviation Full name
kl KilolitresLWDFR Lost working day frequency rateMandela Day The Nelson Mandela International DayMSD Merck Sharpe & DohmeOECD Organisation for Economic Co-operation and DevelopmentOHSAS18001 International standard for occupational health and safety managementPBS Pharmaceutical Benefits SchemePharmerging markets Emerging pharmaceutical marketsPHEF The South African Public Healthcare Enhancement FundPWC PricewaterhouseCoopers Inc SENS Stock Exchange News ServiceSHE Safety, Health, and EnvironmentShelys Shelys Africa LimitedSKUS Stock keeping unitsSRI Socially Responsible Investment IndexSSA Sub-Saharan AfricaThe Collaboration The GSK Aspen Healthcare for Africa collaborationThe Companies Act The South African Companies Act, 71 of 2008tCO2e Tons of carbon dioxide equivalentUN Compact The United Nations Global Compact Principles
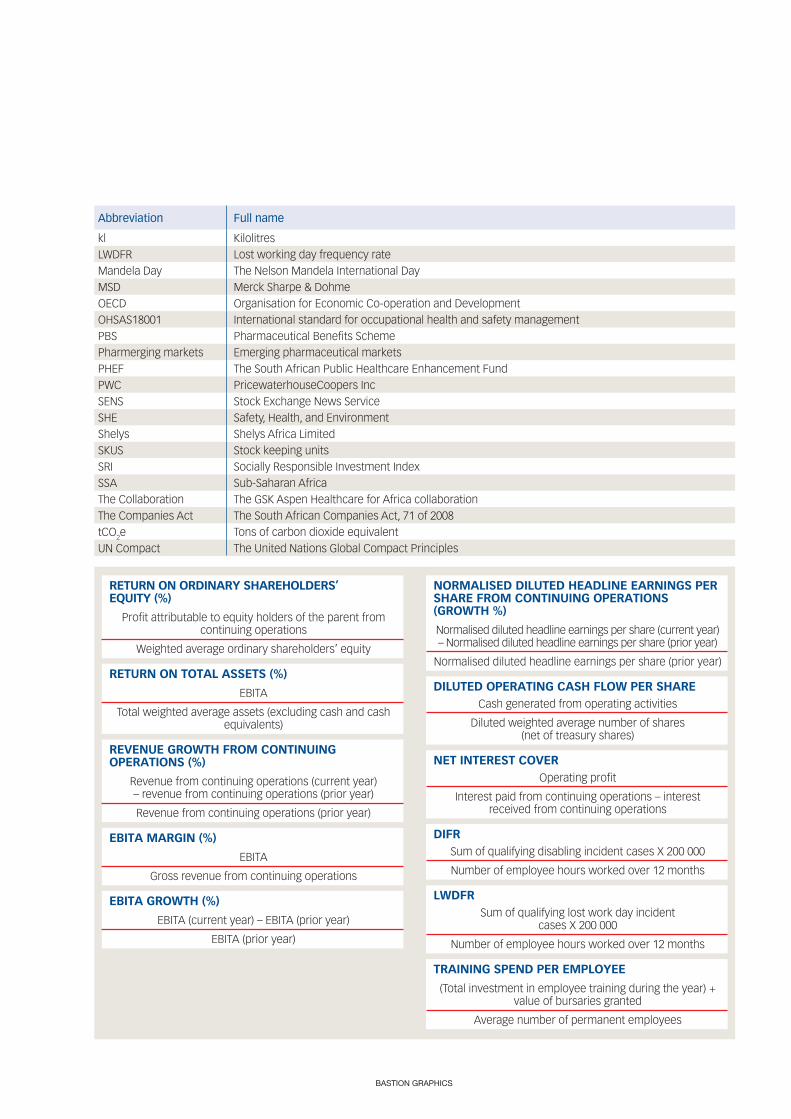
RETURN ON ORDINARY SHAREHOLDERS’ EQUITY (%)
Profit attributable to equity holders of the parent from continuing operations
Weighted average ordinary shareholders’ equity
RETURN ON TOTAL ASSETS (%)
EBITA
Total weighted average assets (excluding cash and cash equivalents)
REVENUE GROWTH FROM CONTINUING OPERATIONS (%)
Revenue from continuing operations (current year) – revenue from continuing operations (prior year)
Revenue from continuing operations (prior year)
EBITA MARGIN (%)
EBITA
Gross revenue from continuing operations
EBITA GROWTH (%)
EBITA (current year) – EBITA (prior year)
EBITA (prior year)
NORMALISED DILUTED HEADLINE EARNINGS PER SHARE FROM CONTINUING OPERATIONS (GROWTH %)
Normalised diluted headline earnings per share (current year) – Normalised diluted headline earnings per share (prior year)
Normalised diluted headline earnings per share (prior year)
DILUTED OPERATING CASH FLOW PER SHARECash generated from operating activities
Diluted weighted average number of shares (net of treasury shares)
NET INTEREST COVEROperating profit
Interest paid from continuing operations – interest received from continuing operations
DIFRSum of qualifying disabling incident cases X 200 000
Number of employee hours worked over 12 months
LWDFRSum of qualifying lost work day incident
cases X 200 000
Number of employee hours worked over 12 months
TRAINING SPEND PER EMPLOYEE
(Total investment in employee training during the year) + value of bursaries granted
Average number of permanent employees
page 1Aspen Pharmacare Holdings LimitedSustainability Report 2013
Overview
Economic Sustainability
Social SustainabilityEnvironm
ental Sustainability
Economic volatility during the period under review continued to burden businesses and consumers, the focus on increasing access to affordable healthcare remained a high priority on national agendas worldwide and recent incidents of natural disasters increased the inherent environmental risks to global supply chains. In response, Aspen has remained focused on pursuing its defined strategic objectives and ongoing optimisation of our business model. This has enabled the Group to deliver another set of strong results despite the challenging operating conditions prevalent across all territories. Organic growth has been achieved through continued strong promotion of Aspen’s established brands, by leveraging the Group’s global brands and intellectual property across multiple territories and focusing on unlocking value from the product pipeline in accordance with commercial plans.
New subsidiaries were established in the key emerging markets of Argentina, Malaysia, Nigeria and Taiwan. In addition, the Group continued to invest in acquisitive growth opportunities aimed at the expansion of its global product portfolio and at developing a critical
mass in territories identified as having future growth potential. Negotiations progressed well in respect of significant transactions with Merck Sharp & Dohme (“MSD”), Glaxo Group Limited (“GSK”) and Nestlé and these transactions are expected to be concluded in the year ahead leading to extension of the Group’s product portfolio and its geographic coverage.
Aspen’s global family has grown to nearly 8 200 employees following recent acquisitions of the MSD API business. Experienced pharmaceutical skills are in high demand and the Group remains committed to the effective management of its human capital. In the acquisition of new businesses, employee engagement activities have taken place with individual employees, labour unions and works councils as required. Carefully developed integration plans are in progress to ensure that the acquired employees, operations and products are efficiently amalgamated into the Group’s business model and ethos. To this end, the Group human resources policies and procedures, already embedded in the South African business, are currently being implemented across the International businesses. This is expected
to improve the consistency of human capital management in the Group. Employee training has been identified as an area which requires additional focus, particularly in the International businesses and for the development of black employees in South Africa.
In Australia, the planned closure of the Noble Park and Baulkham Hills sites is expected to be completed by December 2014. This project is being given due focus by the management team at Aspen Australia to provide necessary support to affected employees and to ensure that relevant stakeholder requirements are addressed. It is with deep regret that Aspen reports one fatality at Aspen Venezuela where an employee was killed in a motor vehicle accident while travelling for business meetings.
Good progress has been made towards enhancing safety and environmental management across the Group’s manufacturing sites. The Port Elizabeth, East London and Johannesburg manufacturing sites received the ISO 14001 and OHSAS 18001 certifications for the first time during July 2013. This is
Sustainability Report
MESSAGE FROM THE GROUP CHIEF EXECUTIVE
Stephen SaadGroup Chief Executive

page 2Sustainability Report continued
a commendable achievement by the South African Operations team and validates Aspen’s commitment to the preservation of the environment, efficient utilisation of scarce resources and ongoing enhancement of safe working conditions. The focus on improving Safety, Health and Environmental (“SHE”) compliance management practices will now be extended to the Group’s manufacturing sites in Australia, East Africa, and Latin America. Aspen also obtained external assurance of the 2013 Carbon Disclosure Project (“CDP”) submission and further participated, for the first time, in the CDP’s Water Disclosure project for the South African and German sites this year.
Aspen continued its support of 36 Corporate Social Investment (“CSI”) projects in South Africa directed at the development of primary healthcare clinics in rural areas, HIV/AIDS management programmes, healthcare education and training initiatives and other community upliftment programmes. In commemoration of the Nelson Mandela International Day (“Mandela Day”), Aspen’s employees volunteered 67 minutes and more of their time to various community upliftment projects across six continents. Donations, refurbishment projects and life skills workshops benefited approximately 9 400 underprivileged members of communities across fifteen
countries. The formation of the South African Public Healthcare Enhancement Fund in August 2012 was a significant milestone towards the consolidation of CSI funds and collaboration of publicprivate initiatives in South Africa. Aspen played a leading role in pioneering this initiative with the South African Department of Health and other South African healthcare companies. This initiative aims at addressing critical community healthcare projects in South Africa including the acceleration of access to primary healthcare and educational facilities in South Africa as well as reinforcing the national campaign against HIV/AIDS, TB and other noncommunicable diseases.
We strive for continuous improvement across all business activities and the sustainability reporting process is no exception. Aspen’s Sustainability Report was assured externally by Environmental Resources Management (“ERM”). In addition, limited assurance was obtained on selected key performance indicators through a combined assurance approach. Selected safety and environment, commercial, employee and financial indicators were subjected to limited assurance engagements performed by ERM, the Group’s Internal Audit (“Internal Audit”) Department and PricewaterhouseCoopers Inc. (“PwC”) respectively. The 2013 Sustainability
Report has been assured by ERM in accordance with Global Reporting Initiative (“GRI”) 3,0 as BLevel compliant. Recommended areas for improvement have been identified and plans are in place to enhance reporting systems to improve the accuracy and relevance of disclosed nonfinancial sustainability information. Consideration will be given to aligning Aspen’s sustainability reporting process to the GRI G4 requirements, as appropriate, during 2014 and 2015.
Aspen provides access to affordable, high quality medicines to a global base of customers that have trust in the Aspen brand. Aspen has been ranked as the ninth largest generic pharmaceutical company in the world by EvaluatePharma and, earlier this year, the Boston Consulting Group ranked Aspen as one of only five South African companies on the “100 Global Challengers” list. Through an embedded daytoday culture of sound governance, effective risk management, accountability, innovation and synergistic teamwork, the Group has been successful in delivering value to stakeholders and will continue to pursue this intent in a responsible manner.
Stephen SaadGroup Chief Executive
21 October 2013

page 3Aspen Pharmacare Holdings LimitedSustainability Report 2013
Overview
Economic Sustainability
Social SustainabilityEnvironm
ental Sustainability
Aspen’s ongoing participation in the annual Mandela Day initiative prompted greater involvement from employees, their families and our business partners who volunteered 67 minutes and more of their time by providing food parcels and other daily necessities, educational aids, financial donations, refurbishment of community buildings and life skills training.
More than 4 500 employees from 19 Aspen business unitsparticipated in Mandela Day through 36 projects hosted in 15 countries
on six continents, touching the lives of some
9 400 beneficiaries

page 4Sustainability Report continued
Reporting parameters
Aspen’s Sustainability Report is prepared
annually, reflecting information for the
Group’s financial year ending 30 June. To
the extent that the information collected
after 30 June supports initiatives which
were in place at yearend, subsequent
events are disclosed. The 2012 Sustain
ability Report was released in November
2012 as part of the 2012 Annual Report.
GRI Reporting Services certified the self
assured 2012 Sustainability Report as
BLevel compliant.
The Material Sustainability Issues and
Key Performance Indicators Report and
Aspen’s management approach to
economic, environmental and social
sustainability issues are included in the
2013 Integrated Report. Aspen’s detailed
Sustainability Report supplements the
Integrated Report and can be accessed
online.
Aspen’s self declared B+ GRI application
level has been independently assured
by ERM. As a consequence, the
2013 Sustainability Report will not be
submitted to GRI Reporting Services for a
further application level check.
Sustainability governance
Management of environmental, social
and governance principles are an
embedded part of the daytoday
strategic, operational, compliance and
financial processes at Aspen and this
responsibility is not considered to be an
isolated Board or corporate office
function.
The Board is responsible for monitoring
the effectiveness of the Group’s
sustainability management activities
and, consequently, evaluates the status
of key performance indicators on a
quarterly basis. The Group’s material
sustainability issues and related key
performance indicators are reviewed
and approved by the Audit & Risk
Committee on an annual basis and
ratified by the Board to ensure alignment
with the Group’s strategic objectives, key
risks and stakeholder expectations. The
Social & Ethics Committee monitors the
governance of the Group’s social,
environmental, human rights and ethics
issues in accordance with the provisions
of the Companies Act of South Africa,
King III, GRI, JSE Limited’s (“JSE”) Socially
Responsible Investment (“SRI”) Index,
the Employment Equity and the The
Department of Trade and Industry’s
BBBEE Codes of Good Practice (“BBBEE
Codes”) in South Africa, the 10 principles
set out in the United Nations Global
Compact Principles (“UN Compact”) and
the Organisation for Economic Co
operation and Development (“OECD”)
recommendations regarding bribery and
corruption.
Aspen’s Board of Directors represent a
good balance of financial, commercial,
operational, social responsibility and
legal experience to direct and monitor
effective sustainability governance in the
Group. Where a Board member identifies
a gap in technical understanding of a
matter, targeted training sessions are
held to address and/or enhance this
knowledge gap. Four of the eight non
executive directors are from historically
disadvantaged backgrounds of which
two members are female, including the
Board’s Chairman. This supports the
Group’s targeted objectives towards
promoting transformation in the South
African business.
Compensation for members of the
highest governance body, senior
managers and executives is linked to
financial, social and environmental
measures relevant to their functional
responsibilities as these aspects are
considered to be a fundamental
part of executive and management
responsibilities. Accountability for
effective management of material
sustainability issues has been integrated
into the Group’s strategy.
Determination of material issues and
prioritisation of topics
In Aspen’s Sustainability Report, key
performance indicators are discussed
under sustainability themes which
represent the Group’s material issues.
The information contained in Aspen’s
Integrated Report is arranged and
prioritised in a manner which supports
the attainment of best practice
integrated reporting requirements,
including pertinent information related
to the Group’s sustainability management
initiatives.
The Group’s material sustainability
issues are approved by the Board and
Audit & Risk Committee on an annual
basis, with reference to:
• the Group’s strategic objectives;
• external factors impacting the Group’s
business model and pursuit of
strategic objectives;
• key business risks impacting the
Group’s sustainability;
• the Group’s responsibility to
stakeholders in accordance with GRI,
King III, Companies Act of South Africa,
BBBEE Codes, SRI, CDP and UN
Compact; and
• the value and/or opportunity cost of
the applied financial, intellectual,
technical, human capital and environ
mental resources to the business and
responsible management of these.
Disclosed information is presented to
ASPEN’S SUSTAINABILITY REPORTING PROCESS
page 5Aspen Pharmacare Holdings LimitedSustainability Report 2013
Overview
Economic Sustainability
Social SustainabilityEnvironm
ental Sustainability
key stakeholders in a manner that aids a
broader understanding of:
• the Group’s business model;
• key inherent risks to Aspen’s sustained
business performance; and
• the impact of Aspen’s material
business activities on its key
stakeholders.
The Group’s key stakeholder engagement
activities are available online.
Amendments made to reported key
performance indicators:
IMS market share and ranking for
territories where this is recorded
by IMS:
Information related to IMS market shares
is used as a reference to monitor Aspen’s
commercial performance in territories
where IMS market indicators are
recorded. However, IMS is not considered
to be a primary measure of commercial
performance. To this end, Aspen’s
performance is compared against prior
year performance and strategic growth
objectives for each territory. For this
reason, IMS market share data is not
considered to be a material key
performance indicator although this
information remains relevant. IMS shares
and rankings continue to be disclosed in
the business unit reviews contained in
the Integrated Report and in this report
on pages 16 to 19.
Providing a safe working environment:
For purposes of comparability with peer
companies, the Disabling Incident
Frequency Ratio (“DIFR”) and Lost Work
Day Frequency Rate (“LWDFR”) have
replaced Number of Permanent
Disabling Injuries as key performance
indicators. The number of permanent
disabling injuries continues to be
disclosed to aid the analysis of safety
performance in the Group. Please refer
to page 33.
Contributing to enhancement of
healthcare, education and basic needs
in communities:
A benchmark of peer CSI disclosures
indicated that number of direct
beneficiaries reached, as previously
reported, is not a comparable CSI
indicator. Furthermore, owing to Aspen’s
participation in the publicprivate CSI
initiative, the South African Public
Healthcare Enhancement Fund (“PHEF”),
Aspen no longer has sole control on the
selection of CSI projects and can
therefore not directly influence number
of beneficiaries reached through CSI
projects.
Report parameters
The scope of the Sustainability Report
includes all operating subsidiaries and
collaborations, controlled by the Group
in South Africa, subSaharan Africa
(“SSA”), Asia Pacific, Latin America, North
America, Europe and the Middle East.
Comparative information is disclosed on
a consistent basis to that of the relevant
reporting period, unless otherwise
stated. There are no limitations to the
scope and boundary of reported
information in any of these business
units.
Environmental indicators are measured
and reported across the Group’s
manufacturing sites where
environmental management is of
material relevance. The measurement
and disclosure of environmental
management indicators for the facilities
in Australia has been increased during
2013 to include Scope 1 and Scope 2
emissions.
Environmental indicators are not
measured and reported for the non
manufacturing business units for the
following reasons:
• water and electricity consumption at
these business units are not material;
• carbon emissions generated by the
nonmanufacturing business units are
negligible and therefore not measured;
and
• the DIFR and LWDFR are not recorded
at the officebased sales, marketing
and distribution centres. However,
tailored safety representation struc
tures and safety policies and
procedures are applied at these
business units.
Economic and social indicators are
applied across all business units in the
Group, including manufacturing and
nonmanufacturing businesses.
Reported data has been measured using
generally accepted measurement
techniques for reported indicators. Where
comparative information has been
restated owing to audited findings and/
or a refinement of measurement systems
and/or standardisation of recording
methodologies, concise explanations
support the restated values on the
pages upon which these performance
indicators are disclosed – please
refer to pages 9, 26, 37, 38 and 39.
Explanations are also provided to clarify
yearonyear movements above 5%
against comparative 2012 information.

page 6Sustainability Report continued
Information for the Baulkham Hills,
Croydon, Dandenong and Noble Park
sites has been included in the 2013
reported data for Aspen Australia.
Environmental and safety performance
indicators for Aspen Australia will, in
future, include information for only the
Dandenong site after scheduled closure
of the other sites as follows:
• Croydon – full closure of the penicillin
plant is expected to be completed by
December 2013 after decontamination
of this plant is completed;
• Noble Park and Baulkham Hills – both
sites are expected to be closed by
December 2014.
Following the expansion of Aspen’s
presence in Asia Pacific, Europe and SSA,
relevant economic and social
sustainability management information
has been reported for Aspen Malaysia,
Aspen Ireland and Aspen Nigeria.
Environmental indicators are not
considered to be relevant to these non
manufacturing business units. Except for
relevant information impacting employee
movement, sustainability information
related to the recently acquired MSD
business has not been included in the
2013 Sustainability Report but will be
included in the 2014 Sustainability
Report.
Progress on Aspen’s sustainability
journey
Good progress has been made with the
standardisation and refinement of the
sustainability reporting processes
throughout the Group. This was achieved
through ongoing sustainability reporting
training provided to the relevant business
unit representatives, refinement of
related reporting systems as well as a
growing awareness of and accountability
for the management of material
sustainability issues across the Group.
As a consequence of embedded
reporting processes, the Group was well
positioned for combined assurance of
the 2013 Sustainability Report and the
underlying sustainability reporting
processes. ERM conducted a Type 2,
Moderate Assurance engagement in
accordance with AA1000AS. PWC, the
Group’s external auditors, conducted
two limited assurance engagements in
accordance with ISAE3000. In addition,
selected performance indicators have
been assured by ERM, PwC, Empowerdex
and the Internal Audit Department as
summarised in the table below and
include all but one of the indicators on
the Material Issues and Key Performance
Indicator Report.
2013 ASSURANCE PROVIDERS
ERM PwC Empowerdex Aspen Internal Audit
DIFR
LWDFR
Electricity used (gigajoules)
Reduction in electricity usage (gigajoules)
Volume of water consumed (kilolitres)
Volume of water recycled (kilolitres)
Volume of waste recycled (tons)
Volume of hazardous waste generated (tons)
Scope 1 and Scope 2 emissions* (tCO2e)
Return on ordinary shareholders’ equity
Return on total assets
Growth in revenue from continuing operations
EBITA margin %
Growth in EBITA1
Growth in normalised, diluted headline earnings per share from continuing operations
Diluted operating cash flow per share
Net interest cover
Value added per employee#
Value of CSI spend**
BBBEE accreditation**
Number of product recalls
IMS value of the product pipeline for the next five years
Number of employees trained
Training spend per employee
* 2013 emissions data was verified by ERM for Aspen’s sites in South Africa, Germany and Australia. In addition, Aspen’s 2013 CDP submission, containing Scope 1 and Scope 2 emissions data for South Africa and Germany as recorded for the 2012 financial year, was verified by ERM.
**Relevant to South Africa only. #The value added statement as a whole has been subjected to limited assurance by PwC. 1 EBITA represents operating profit from continuing operations before amortisation adjusted for specific non-trading items as set out in the segmental
analysis contained in the Annual Financial Statements.
ASPEN’S SUSTAINABILITY REPORTING PROCESS continued

page 7Aspen Pharmacare Holdings LimitedSustainability Report 2013
Overview
Economic Sustainability
Social SustainabilityEnvironm
ental Sustainability
Recommendations which emerged from
the various audit processes are being
implemented, as appropriate, as part of
the sustainability reporting continuous
improvement process.
The 2013 sustainability assurance
statements from external assurance
providers can be accessed online.
Aspen’s Internal Audit function also
provided limited assurance on selected
key performance indicators and, based
on the audit work performed, concluded
that the tested key performance
indicators have been prepared in
accordance with the defined reporting
criteria and are free from material
misstatements.
The Group is committed to continuous
improvement of its sustainability
reporting process in accordance with
international best practice. To this end,
the GRI G4 reporting requirements will
be considered for future reporting during
2014 and 2015 for alignment of Aspen’s
sustainability reporting parameters and
systems to GRI G4 as appropriate.
Presenting a responsible investment
opportunity for investors
Information disclosed in the Group’s
Integrated Report is benchmarked on an
ongoing basis to monitor the adequacy
and comparability of the Group’s
sustainability management information
with reference to global best practice
trends.
Aspen again qualified for the JSE’s SRI
Index in November 2012 and is currently
the only pharmaceutical company on
this index. Active participation in the SRI
process will continue in 2013 and
feedback from the SRI will be considered
for inclusion in future Integrated Reports.
Aspen participated in the 2013
Sustainalytics survey and evaluation
feedback was considered in drafting the
Integrated Report. Sustainalytics is an
international and independent
sustainability research provider to the
financial sector which specialises in
analysing the environmental, social and
governance performance of companies.
Aspen participates annually in the
Association of Chartered Certified
Accountants sustainability reporting
awards and in the South African
sustainability reporting review
conducted by Integrated Reporting and
Assurance Services. The feedback
received from these organisations is
discussed with evaluators and
incorporated, as appropriate, into the
design and content for the subsequent
year’s Integrated and Sustainability
Reports.
GRI standard disclosures table
Aspen’s 2013 GRI standard disclosures
table is available online.
Sustainability Report contact
For queries regarding Aspen’s Sus
tainability Report or its contents, contact
Roshni Gajjar, Group Risk & Sustainability
Manager: [email protected].

page 8Sustainability Report continued
element of Aspen’s business model and a significant number of the products in the Group’s pipeline. With the conclusion of the recently announced branded product acquisition transactions with MSD and GSK, Aspen will also extend its footprint into the developed pharmaceutical markets in Europe and the United States.
Generic formulations are subjected to regulated internal testing and validation processes to prove technical equivalence to the originator product. Once completed, the formulation is then submitted to the relevant national regulatory authority to validate the equivalence prior to being launched and distributed to customers. This includes regulatory approval of artwork and packaging in accordance with registration requirements in each territory. This full process can take up to five years. In addition, all necessary steps are taken to confirm adherence to patent regulations ahead of the intended product launch.
Aspen supplies a comprehensive basket of branded and generic pharmaceutical and consumer products, including infant milk formula (“IMF”), to customers across six continents. Regional product portfolios are carefully developed to address key disease profiles in each territory and to support the healthy well-being of millions of patients who rely on Aspen’s products. Generic products offer patients a cheaper alternative to an originator product, once the patent for the originator molecule has expired. Aspen’s expansion strategy has, to date, focused on developing a presence in the so-called emerging pharmaceutical markets (“pharmerging markets”) where patients are often responsible for their own healthcare costs and where the future demand for low cost, high quality generic alternatives is rising.
Aspen is able to respond to the developing healthcare needs in these territories with its broad range portfolio which offers essential but affordable medicines to patients. Generics are a key
Product responsibility and patient safety is of utmost importance. Consequently, there is no compromise on product quality – only products which meet the prescribed quality standards are supplied through Aspen’s owned distribution network or through accredited third party distributors. To this end, quality controls are implemented at various stages during the manufacturing process in accordance with strict Good Manufacturing Practice (“GMP”) requirements. Throughout the product lifecycle, the quality and efficacy of supplied products are monitored using systems approved and monitored by regulatory authorities. If a product recall were to take place, predefined communication procedures are followed to ensure that the authorities, healthcare professionals and customers are kept informed of related product information.
A significant portion of products are manufactured at Aspen owned sites. The balance of production takes place at reputable third-party manufacturers
0% 10% 20% 30% 40% 50% 60% 70% 80% 90% 100%
India
Mexico
Brazil
USChina
Russia
Canada
S. Korea
italy
France
Japan
Spain
Germany
UK
Turkey
% of healthcare spend
Source: IMS data: Barclays Research-CEEMEA Generics Report, September 2013
Private PublicOut of pocket
Markets with high “out of pocket” spend are attractive to the branded generics approach
SUSTAINING LIFE AND HEALTH THROUGH HIGH QUALITY AND AFFORDABLE MEDICINES

page 9Aspen Pharmacare Holdings LimitedSustainability Report 2013
Overview
Economic Sustainability
Social SustainabilityEnvironm
ental Sustainability
which have been identified, audited and approved for manufacture through a prescribed process. Finished goods supplied by Aspen are manufactured at facilities which are accredited by the relevant regulatory authorities. Manufacturing facilities are subjected to periodic inspections by those regulatory authorities that govern pharmaceutical requirements for each supplied territory. Raw materials are purchased from authorised suppliers who comply with necessary regulatory and quality requirements in addition to meeting Aspen’s materials specifications. Both finished goods and production materials suppliers are monitored to ensure that the prerequisite quality, service and cost criteria are consistently adhered to. The Quality Assurance Department conducts potential and existing vendor audits to support the Group’s quality objectives in the supply value chain.
Four product recalls took place during 2013 (2012: 8). These included two recalls for Co-Malafin tablets in East Africa, one
recall for Rinex Paediatric Syrup in South Africa and one recall for Serenace tablets in Australia. Recall processes for the affected batches have been completed and appropriate corrective action is in progress to address the identified causes of these recalls. No adverse effects to patients were recorded as a result of these recalls. In the 2012 financial year, Aspen reported five quality-related product recalls. A further three product recalls had taken place in 2012 as a result of incorrect packaging which, in retrospect, meets the definition of quality-related product recalls as revised during 2013. For this reason, the 2012 comparative has been restated to eight product recalls.
Supplying relevant products to customers and sustaining the Group’s organic growth strategyThe Group has delivered double-digit growth in revenue, EBITA and normalised headline earnings per share for 15 consecutive years. This has been achieved through a combination of
organic and inorganic strategies which focus on the sustained growth of existing product portfolios in mature businesses, launch of new products from the product pipeline and strategic acquisitive investments.
Aspen’s product pipeline represents the Group’s future organic growth potential across targeted growth territories and, at 30 June 2013, had an IMS value of USD8,9 billion (2012: USD9,1 billion). Products for the pipeline cover a broad range of therapeutic categories to address anticipated future medicinal needs in targeted territories. Products in the pipeline are at various stages of registration as an authorised medicine. The product pipeline is managed and monitored in alignment with the Group’s commercial growth objectives and is currently weighted towards addressing the prevalence of cardiovascular, central nervous system and oncolytic conditions across key territories. The commercial feasibility of products in the pipeline is evaluated on an ongoing basis, with
Emerging marketsRest of World
2016
2006
2011
Pharma market development (USD’ billion)
30%70%
20%80%
14%
1 190
956
65886%
Source: IMS Market Prognosis, September 2011, IMS Pharmerging Overview 2011
% of global pharmaceutical market
2010 Brand growth
Generic Other 2015EEmerging markets
Patent expirations
Emerging markets are the key drivers of total (pharmaceutical) spend
119 (120) 47 150 29 1 081
856
Tota
l pha
rma
spen
ding
USD
’ billi
on
Source: IMS Market Prognosis, KPMG
Importance of emerging markets in a global context
Development of the emerging pharmaceutical markets
page 10Sustainability Report continued
reference to available market intelli-gence. The value of the product pipeline has diminished since the prior year due to a re-assessment of products in planning for launch in Latin America in line with a more focused approach to therapeutic targeting.
Feasible product acquisition and/or licensing opportunities to support the Group’s commercial growth strategies are evaluated on an ongoing basis and, to this end, the Group has extended its
relationship with leading global pharmaceutical companies during the year and reached agreement in respect of an option to acquire eleven molecules from MSD as well as for a further two post-patent, specialist molecules from GSK pending regulatory and shareholder approval of the transaction. In addition, Aspen also reached an agreement with Nestlé to acquire the S-26 brand of IMFs in Australia, southern Africa and Latin America to bolster the Group’s Consumer portfolio.
Aspen has earned its credibility as a trusted supplier of high quality and safe medicines across South Africa and Australia. In collaboration with GSK, Aspen has also become a leading pharmaceutical supplier in SSA. Through organic and acquisitive product growth plans, increases in sales representation and active stakeholder engagement activities, Aspen’s brand recognition is being strengthened in Latin America, SSA and South East Asia.
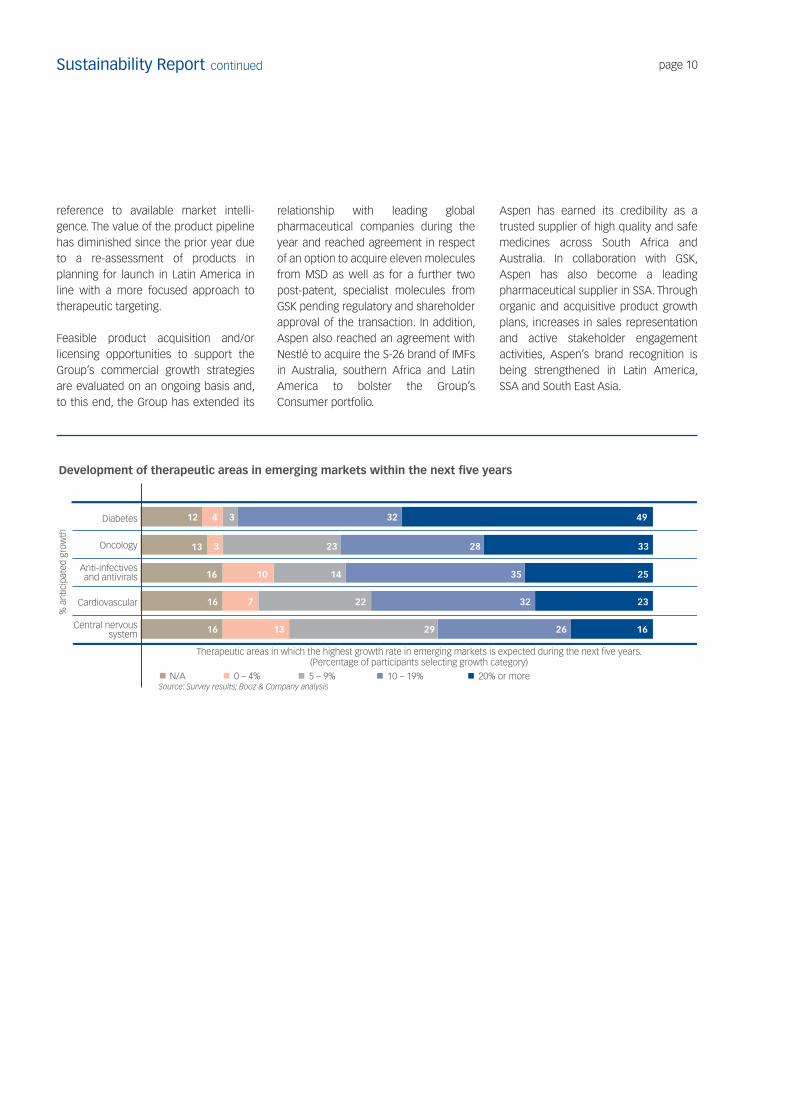
Diabetes
Oncology
Anti-infectivesand antivirals
Cardiovascular
Central nervous system
N/A 0 – 4% 10 – 19%5 – 9% 20% or more
Development of therapeutic areas in emerging markets within the next �ve years
Therapeutic areas in which the highest growth rate in emerging markets is expected during the next �ve years.(Percentage of participants selecting growth category)
12 4 3 32 49
23 3328313
16 10 14 35 25
16 7 22 32 23
16 13 29 26 16
Source: Survey results; Booz & Company analysis
% a
ntic
ipat
ed g
row
th

page 11Aspen Pharmacare Holdings LimitedSustainability Report 2013
Overview
Economic Sustainability
Social SustainabilityEnvironm
ental Sustainability
ASPEN’S PRODUCT PIPELINE BY VALUE
Therapeutic category South Africa
USD’million Asia Pacific USD’million
SSA USD’million
Latin America USD’million
Europe, Middle East
and North America
USD’million Total
USD’million
Anaesthetics 8 32 – – – 40Analgesic 61 351 – 66 – 478Antifungal – 4 – – – 4Antihistamine 8 6 – 28 – 42Anti-infective 2 8 – – – 10Antimicrobial 61 29 – 104 – 194Antiviral 3 32 – 12 – 47ARV 39 50 – – – 89Cardiovascular 106 893 2 1 597 – 2 598Central Nervous System 94 121 – 782 14 1 011Cold & Flu 21 – – 18 4 43Dermatological 8 38 – 22 – 68Endocrine 63 150 – 63 – 276Gastrointestinal 49 308 1 109 – 467Hormonal 28 108 – 374 – 510Immunomodulators 10 1 200 – – – 1 210Musculoskeletal 3 53 – 1 11 68Oncology 28 418 – 8 101 555Ophthalmic 6 102 – 86 – 194Respiratory 16 512 – 171 – 699Urology 18 121 – 113 – 252Vitamins, herbals and complementary 2 – – 45 – 47
Total 634 4 536 3 3 599 130 8 902
Anticipated launch in:0 – 2 years 313 2 309 3 1 794 – 4 4192 – 5 years 321 2 227 – 1 805 130 4 483
Total 634 4 536 3 3 599 130 8 902
Important explanatory notes to the product pipeline table:1. With the exception of SSA, values stated have been derived from IMS. IMS is an independent measure of the pharmaceutical sector in the
respective territories. Public sector tender values have been excluded. The IMS values reported herein record the annual market value of the molecule for the year to 31 December 2012 for the products which were in Aspen’s pipeline at 30 June 2013.
2. In the absence of IMS data, values for SSA represent Aspen’s estimate of the value of the total private sector in SSA per molecule.3. In assessing the potential value to Aspen of the molecule to be launched, the following needs to be taken into consideration:
(i) The generic equivalent of an originator molecule trades at a discount to the originator product.(ii) The entry of generic products to the market will result in greater competition.
4. Products have only been included where Aspen has a physical product dossier in hand. Not all products have as yet been submitted to the applicable regulatory authorities for registration.
Molecules to the value of USD653 million have been added to the pipeline over the last year. A number of key new products were launched during the year, thereby unlocking value from the pipeline. Aspen Teicoplanin Injection (antiviral) and Tenarenz tablets antiretroviral (“ARV”)
were launched in South Africa and Ksart (cardiovascular) and Respikast (respiratory) were launched in Australia. Sedopan (antiviral), Tamsulina (urology), Ecitalopram, Lamotrigina (central nervous system) and Clopidogrel (cardiovascular) were all launched in
Latin America. Anticipated launch plans for three products, having an IMS value of USD514 million, have been postponed beyond the five-year horizon period pending confirmation of patent expiry dates and are therefore not quantified in the reported pipeline value.

page 12Sustainability Report continued
Aspen’s value added to stakeholders during 2013, limited assurance provided by PwC, is summarised below:
VALUE ADDED STATEMENT Change2013
R’million %2012
R’million %
Net revenue 27% 19 308 15 256South Africa 20% 7 377 6 160Sub-Saharan Africa 11% 615 552Asia Pacific 26% 7 590 6 021International 48% 3 726 2 523
Other operating income 104 219Less: Purchased materials and services 26% (11 280) (8 921)
Value added from operations 24% 8 132 97 6 554 96Investment income 299 3 275 4
Total wealth created 23% 8 431 100 6 829 100
Employees 18% 2 504 30 2 124 31Providers of capital – finance costs 27% 1 568 19 1 234 18
Finance costs 853 10 776 11Capital distribution paid to shareholders 715 9 458 7
Governments 1 056 12 671 10Reinvested in the Group 3 303 39 2 800 41
Depreciation and amortisation 550 7 465 7Deferred tax (46) (1) 125 2Income retained in the business 2 799 33 2 210 32
Total value distribution 23% 8 431 100 6 829 100
Value added statisticsNumber of full time employees* 5 498 5 210Revenue per employee (R’000) 20% 3 512 2 928Value added per employee (R’000) 18% 1 479 1 258Wealth created per employee (R’000) 17% 1 533 1 311Monetary exchanges with governmentCurrent taxes (excluding deferred tax) 1 021 647Customs and excise duty 23 19Rates and similar levies 12 5
Gross contribution to central and local government 1 056 671
Additional collections on behalf of governmentEmployee taxes 550 448Withholding taxes 6 8Net value added tax paid 514 591
Additional contribution to central and local government 1 070 1 047
* The Group’s total number of employees at 30 June 2013 comprised 5 498 (2012: 5 210) permanent employees and 1 679 (2012: 1 414) non-permanent employees totalling 7 177 (2012: 6 624).
Aspen’s net revenue during the year increased by 27% and value added by operations increased by 24% driven by robust performance from the International businesses, effective response to arising regulatory and competitive challenges in South Africa and Australia and continued optimisation of efficiencies across the supply chain.
ADDING ECONOMIC VALUE TO STAKEHOLDERS
page 13Aspen Pharmacare Holdings LimitedSustainability Report 2013
Overview
Economic Sustainability
Social SustainabilityEnvironm
ental Sustainability
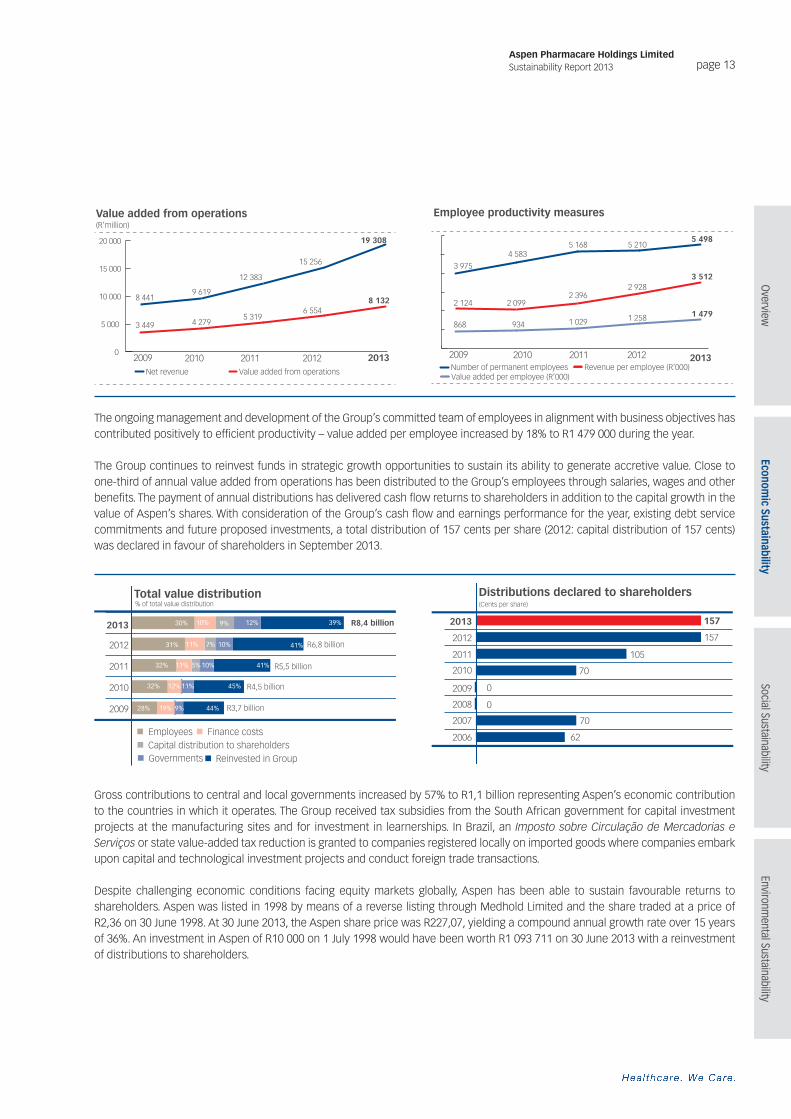
The ongoing management and development of the Group’s committed team of employees in alignment with business objectives has contributed positively to efficient productivity – value added per employee increased by 18% to R1 479 000 during the year.
The Group continues to reinvest funds in strategic growth opportunities to sustain its ability to generate accretive value. Close to one-third of annual value added from operations has been distributed to the Group’s employees through salaries, wages and other benefits. The payment of annual distributions has delivered cash flow returns to shareholders in addition to the capital growth in the value of Aspen’s shares. With consideration of the Group’s cash flow and earnings performance for the year, existing debt service commitments and future proposed investments, a total distribution of 157 cents per share (2012: capital distribution of 157 cents) was declared in favour of shareholders in September 2013.
Gross contributions to central and local governments increased by 57% to R1,1 billion representing Aspen’s economic contribution to the countries in which it operates. The Group received tax subsidies from the South African government for capital investment projects at the manufacturing sites and for investment in learnerships. In Brazil, an Imposto sobre Circulação de Mercadorias e Serviços or state value-added tax reduction is granted to companies registered locally on imported goods where companies embark upon capital and technological investment projects and conduct foreign trade transactions.
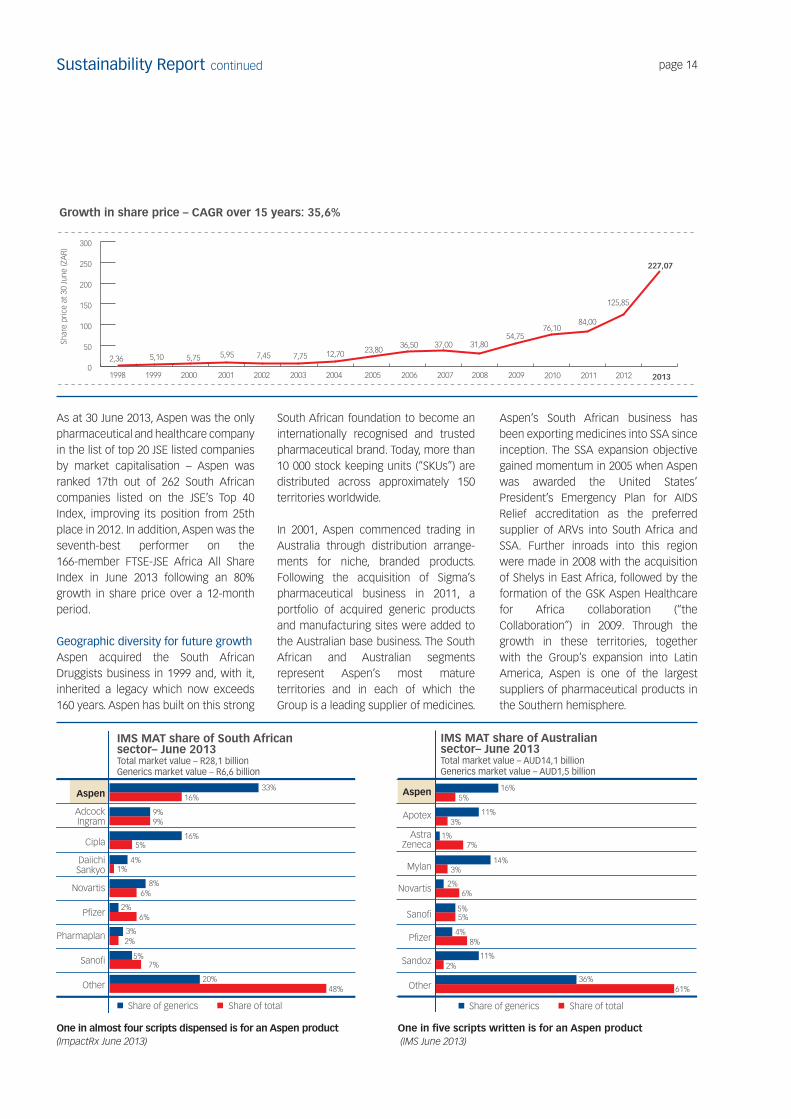
Despite challenging economic conditions facing equity markets globally, Aspen has been able to sustain favourable returns to shareholders. Aspen was listed in 1998 by means of a reverse listing through Medhold Limited and the share traded at a price of R2,36 on 30 June 1998. At 30 June 2013, the Aspen share price was R227,07, yielding a compound annual growth rate over 15 years of 36%. An investment in Aspen of R10 000 on 1 July 1998 would have been worth R1 093 711 on 30 June 2013 with a reinvestment of distributions to shareholders.
Value added from operations(R’million)
20132012201120102009Net revenue Value added from operations
0
5 000
10 000
15 000
20 000
3 449 4 2795 319
6 5548 1328 441
9 619
12 383
15 256
19 308
Employee productivity measures
20132012201120102009Number of permanent employees Revenue per employee (R’000)Value added per employee (R’000)
868 934 1 029 1 258 1 4792 124 2 099
2 3962 928
3 5123 975
4 5835 168 5 210
5 498
2013
2012
2011
2010
2009
Employees Finance costsCapital distribution to shareholdersGovernments Reinvested in Group
Total value distribution
30% 10% 9% 12% 39% R8,4 billion
R6,8 billion
R5,5 billion
R4,5 billion
R3,7 billion
10% 41%11% 7%31%
32% 5%11% 10% 41%
32% 12%11% 45%
28% 19% 9% 44%
% of total value distribution
2013
2011
2012
2010
2009
2008
2007
2006
Distributions declared to shareholders (Cents per share)
157
157
105
70
0
0
70
62
page 14Sustainability Report continued
As at 30 June 2013, Aspen was the only pharmaceutical and healthcare company in the list of top 20 JSE listed companies by market capitalisation – Aspen was ranked 17th out of 262 South African companies listed on the JSE’s Top 40 Index, improving its position from 25th place in 2012. In addition, Aspen was the seventh-best performer on the 166-member FTSE-JSE Africa All Share Index in June 2013 following an 80% growth in share price over a 12-month period.
Geographic diversity for future growthAspen acquired the South African Druggists business in 1999 and, with it, inherited a legacy which now exceeds 160 years. Aspen has built on this strong
South African foundation to become an internationally recognised and trusted pharmaceutical brand. Today, more than 10 000 stock keeping units (“SKUs”) are distributed across approximately 150 territories worldwide.
In 2001, Aspen commenced trading in Australia through distribution arrange-ments for niche, branded products. Following the acquisition of Sigma’s pharmaceutical business in 2011, a portfolio of acquired generic products and manufacturing sites were added to the Australian base business. The South African and Australian segments represent Aspen’s most mature territories and in each of which the Group is a leading supplier of medicines.
Aspen’s South African business has been exporting medicines into SSA since inception. The SSA expansion objective gained momentum in 2005 when Aspen was awarded the United States’ President’s Emergency Plan for AIDS Relief accreditation as the preferred supplier of ARVs into South Africa and SSA. Further inroads into this region were made in 2008 with the acquisition of Shelys in East Africa, followed by the formation of the GSK Aspen Healthcare for Africa collaboration (“the Collaboration”) in 2009. Through the growth in these territories, together with the Group’s expansion into Latin America, Aspen is one of the largest suppliers of pharmaceutical products in the Southern hemisphere.
Growth in share price – CAGR over 15 years: 35,6%
2013201220112010200920082007200620052004200320022001200019991998
2,36 5,10 5,75 5,95 7,45 7,75 12,70 23,80 36,50 37,00 31,80
54,75 76,10
84,00
125,85
227,07
Shar
e pr
ice
at 3
0 Ju
ne (Z
AR)
0
50
100
150
200
250
300
One in five scripts written is for an Aspen product (IMS June 2013)
Aspen
Apotex
AstraZeneca
Mylan
Novartis
Sano�
P�zer
Sandoz
Other
16%5%
11%3%
1%7%
14%3%
2%6%
5%5%
4%8%
11%2%
36%61%
IMS MAT share of Australian sector– June 2013 Total market value – AUD14,1 billionGenerics market value – AUD1,5 billion
Share of totalShare of generics
Aspen
AdcockIngram
Cipla
Daiichi Sankyo
Novartis
P�zer
Pharmaplan
Sano�
Other
IMS MAT share of South African sector– June 2013 Total market value – R28,1 billionGenerics market value – R6,6 billion
33%16%
9%9%
16%5%
4%1%
8%6%
2%6%
3%2%
5%7%
20%48%
Share of totalShare of generics
One in almost four scripts dispensed is for an Aspen product (ImpactRx June 2013)

page 15Aspen Pharmacare Holdings LimitedSustainability Report 2013
Overview
Economic Sustainability
Social SustainabilityEnvironm
ental Sustainability
Through implementation of Aspen’s internationalisation strategy since 2008, the Group has developed a recognised presence in targeted territories across SSA, Asia Pacific and Latin America. It is thereby well positioned to respond to growing healthcare needs in these regions. In developing the Group’s strategy, due consideration has been given to the risk of growth stagnation, pricing pressures and increased competition in territories such as Australia and Europe where continued future value growth is uncertain. In these territories, Aspen’s regional management teams have implemented innovative strategies to further leverage existing brand credibility, continue to focus on key customer relationship management, target responsible supply chain efficiencies and continue to pursue
appropriate inorganic growth opportunities. In SSA and Latin America the shift away from the commercially unfeasible tender business to private sector driven growth has resulted in improved profitability and enhanced management focus in these businesses.
Through expansion into new global pharmaceutical markets with extended product portfolios, Aspen has diversified its footprint across a combination of emerging and developed pharmaceutical regions in order to sustain financial performance and secure long-term growth in revenue and operating profit. Commercial strategies have been closely aligned with the manufacturing strategies to leverage the Group’s supply chain competence in pursuit of Aspen’s vision.
During 2013, new subsidiaries were established in Nigeria, Malaysia (*ranked 47th), Taiwan (*ranked 24th) and Argentina (*ranked 20th). In addition the thirteen molecules acquired from MSD and GSK will complement Aspen’s existing global brands portfolio, increase critical mass in territories such as Latin America and Asia Pacific and create opportunity to enter into Central/Eastern Europe (“CEE”) and the Commonwealth of Independent States (“CIS”) comprising Russia and the other former Soviet Republics regions. The portfolio of products to be acquired covers a diverse range of therapeutic categories including female, cardiovascular and endocrine health.
* Information in brackets shows IMS rankings in the global pharmaceutical sectors.
Which emerging markets do you consider as most relevant today and in the future (2018) 1 = Least relevant 5= Most relevant
Source: Booz & Company analysis
Relevance today
Difference
in future
and current
relevance
0,80,70,60,50,40,30,20,10,0
-0,10,0 1,0 2,0 3,0 4,0 5,0
▲ BRICMTL*❍ Second-tier emerging markets◆ African markets
◆
◆
◆
❍
❍
❍
❍
❍
▲
Sub-Saharan countries Southeast Asia
Latin America
BRICMT*
North African countries
CISMiddle East
South Africa
Central/Eastern Europe
* BRICMT represents the economies of Brazil, Russia, India, China, Mexico and Turkey.
Group EBITA margin % based on gross sales value
201320122011201020092008
27% 27% 27% 27% 27%26%
20
22
24
26
28
30
EBIT
A m
argi
n %

page 16Sustainability Report continued
Market characteristics in Aspen’s key regional territories are summarised in the table below:
Population size GDP value
IMS value of the total
pharmaceutical sector
Global IMS ranking of the pharmaceutical
sector per territory as at December 2012
Year in which business unit commenced
tradingAspen’s reach in the territory
at 30 June 2013Aspen’s current
ranking in the territoryOverview of key risks/opportunities
impacting future growth
SO
UTH
AFR
ICA
53 million USD609 billion USD2,8 billion 28th 1998 Number of permanent employees (including SA Operations and FCC): 3 071
Number of sales representatives: 310
SKUs sold in South Africa: 1 399
SKUs sold in export territories: 1 146
• Ranked Number one pharmaceutical company in South Africa’s private sector according to IMS
• Close to one in four scripts dispensed in the private sector is for an Aspen product
• Aspen is the largest supplier of products to the public sector
• Five of the top seven generics sold in South Africa are Aspen products
• Of Aspen’s top 20 products, 17 are growing faster than competing products
Risks• Margin pressure – single exit price does not
adequately cover input costs and currency volatility impacting cost of goods
• Regulatory uncertainty with pending logistics fee and international benchmark regulations
Opportunities• Aspen is South Africa’s leading pharmaceutical
company and has the largest sales representation in South Africa
• Aspen has earned the trust of customers as a dependable producer of high quality, affordable medicines
• Aspen offers a comprehensive basket of products to the public and private sector
• Socio-economics and healthcare legislation favour volume growth for affordable generics
• Through vertical integration and scale of sales units, the Group is able to respond to pricing risks
SU
B-S
AH
AR
AN
AFR
ICA
766 million USD912 billion IMS information not available
Not ranked Shelys – 2008 The Collaboration – 2009
Number of permanent employees: 363
Number of sales representatives – Aspen: 118
Number of sales representatives – Including The Collaboration: 465
SKUs sold: The Collaboration 2 941
Shelys: 701
SSA exports: 237
IMS market indicators are not available for this region
Aspen and GSK combined are the largest suppliers of pharmaceuticals in this region
Risks• Political instability, currency volatility and fragmented
markets which pose a challenge to achieving a critical mass in any one territory
Opportunities• Aspen, in collaboration with GSK, has the largest sales
representation in the region• A high-growth future pharmerging market• Socio-economics factors favour affordable generics in
this region• Aspen’s product portfolio is suited to specific disease
profiles in this region• Aspen has already established a presence in the
private sectors across key territories in East Africa through the well-recognised Aspen-Shelys brand and across multiple territories through the Collaboration
AS
IA P
AC
IFIC
Australia
23 million USD961 billion USD13,9 billion 12th 2001 Number of permanent employees: 801
Number of sales representatives: 172
SKUs sold: 1 269
• Aspen is Australia’s Number 1 generics company and the fifth largest pharmaceutical company in Australia
• One in five scripts written is for an Aspen product
Risks• Demographic factors, Pharmaceutical Benefits
Scheme (“PBS”) price cuts and growing competition restricting value growth
Opportunities• Aspen has established strong credibility in Australia• Aspen offers a comprehensive basket of products• Gateway to accessing high growth pharmerging
markets in Asia
Philippines
98 million USD457 billion USD3,0 billion 32nd 2011 Number of permanent employees (including Hong Kong): 116
Number of sales representatives: 73
SKUs sold: 30
Within its first year of operating, Aspen is ranked 32nd
Risks• Attaining a critical mass of volumes pending product
registrations and identification of feasible acquisitive growth opportunities
Opportunities• A high growth pharmerging market with a preference
for brands• Aspen has, within a year, established brand credibility

page 17Aspen Pharmacare Holdings LimitedSustainability Report 2013
Overview
Economic Sustainability
Social SustainabilityEnvironm
ental Sustainability
Market characteristics in Aspen’s key regional territories are summarised in the table below:
Population size GDP value
IMS value of the total
pharmaceutical sector
Global IMS ranking of the pharmaceutical
sector per territory as at December 2012
Year in which business unit commenced
tradingAspen’s reach in the territory
at 30 June 2013Aspen’s current
ranking in the territoryOverview of key risks/opportunities
impacting future growth
SO
UTH
AFR
ICA
53 million USD609 billion USD2,8 billion 28th 1998 Number of permanent employees (including SA Operations and FCC): 3 071
Number of sales representatives: 310
SKUs sold in South Africa: 1 399
SKUs sold in export territories: 1 146
• Ranked Number one pharmaceutical company in South Africa’s private sector according to IMS
• Close to one in four scripts dispensed in the private sector is for an Aspen product
• Aspen is the largest supplier of products to the public sector
• Five of the top seven generics sold in South Africa are Aspen products
• Of Aspen’s top 20 products, 17 are growing faster than competing products
Risks• Margin pressure – single exit price does not
adequately cover input costs and currency volatility impacting cost of goods
• Regulatory uncertainty with pending logistics fee and international benchmark regulations
Opportunities• Aspen is South Africa’s leading pharmaceutical
company and has the largest sales representation in South Africa
• Aspen has earned the trust of customers as a dependable producer of high quality, affordable medicines
• Aspen offers a comprehensive basket of products to the public and private sector
• Socio-economics and healthcare legislation favour volume growth for affordable generics
• Through vertical integration and scale of sales units, the Group is able to respond to pricing risks
SU
B-S
AH
AR
AN
AFR
ICA
766 million USD912 billion IMS information not available
Not ranked Shelys – 2008 The Collaboration – 2009
Number of permanent employees: 363
Number of sales representatives – Aspen: 118
Number of sales representatives – Including The Collaboration: 465
SKUs sold: The Collaboration 2 941
Shelys: 701
SSA exports: 237
IMS market indicators are not available for this region
Aspen and GSK combined are the largest suppliers of pharmaceuticals in this region
Risks• Political instability, currency volatility and fragmented
markets which pose a challenge to achieving a critical mass in any one territory
Opportunities• Aspen, in collaboration with GSK, has the largest sales
representation in the region• A high-growth future pharmerging market• Socio-economics factors favour affordable generics in
this region• Aspen’s product portfolio is suited to specific disease
profiles in this region• Aspen has already established a presence in the
private sectors across key territories in East Africa through the well-recognised Aspen-Shelys brand and across multiple territories through the Collaboration
AS
IA P
AC
IFIC
Australia
23 million USD961 billion USD13,9 billion 12th 2001 Number of permanent employees: 801
Number of sales representatives: 172
SKUs sold: 1 269
• Aspen is Australia’s Number 1 generics company and the fifth largest pharmaceutical company in Australia
• One in five scripts written is for an Aspen product
Risks• Demographic factors, Pharmaceutical Benefits
Scheme (“PBS”) price cuts and growing competition restricting value growth
Opportunities• Aspen has established strong credibility in Australia• Aspen offers a comprehensive basket of products• Gateway to accessing high growth pharmerging
markets in Asia
Philippines
98 million USD457 billion USD3,0 billion 32nd 2011 Number of permanent employees (including Hong Kong): 116
Number of sales representatives: 73
SKUs sold: 30
Within its first year of operating, Aspen is ranked 32nd
Risks• Attaining a critical mass of volumes pending product
registrations and identification of feasible acquisitive growth opportunities
Opportunities• A high growth pharmerging market with a preference
for brands• Aspen has, within a year, established brand credibility

page 18Sustainability Report continued
Population size GDP value
IMS value of the total
pharmaceutical sector
Global IMS ranking of the pharmaceutical
sector per territory as at December 2012
Year in which business unit commenced
tradingAspen’s reach in the territory
at 30 June 2013Aspen’s current
ranking in the territoryOverview of key risks/opportunities
impacting future growth
BR
AZI
L
194 million USD2,4 trillion USD26,2 billion 8th 2008 Number of permanent employees: 359
Number of sales representatives: 123
SKUs sold: 136
Ranked 64th Risks• Fragmented market posing a challenge to gaining
critical mass and identification of feasible acquisitive growth opportunities
• Strong domestic participation in industryOpportunities• A high growth pharmerging market with a preference
for brands• Aspen has become a well recognised brand in this
region through the successful efforts of an experienced management team
SP
AN
ISH
LA
TIN
AM
ERIC
A
Mexico
117 million USD1,8 trillion USD9,7 billion 16th 2008 Number of permanent employees: 198
Number of sales representatives: 67
SKUs sold: 79
Ranked 51st Risks• Regulatory changes and challenge to gaining a critical
mass of volumes• Political and fiscal volatility impacting cost of doing
business in VenezuelaOpportunities• Acquisition of the Pfizer infant milks business for this
region presents a good opportunity for gaining further brand recognition and growing the consumer business
• Aspen Argentina was established during the year, further expanding the Group’s presence in this region
Venezuela
29 million USD397 billion USD6,2 billion 17th 2008 Number of permanent employees: 83
Number of sales representatives: 44
SKUs sold: 113
Ranked 68th
RES
T O
F TH
E W
OR
LD
Includes: Aspen Bad OldesloeAspen Dubai (selling into MENA)Aspen Global
n/a n/a n/a Aspen Bad Oldesloe Aspen Dubai: 2009Aspen Global: 2008
Number of permanent employees: 507
Number of sales representatives 42 dedicated Aspen sales representatives in addition to others that are currently outsourced to accredited third-party distributor companies
SKUs sold: 2 108
n/a Risks• Pricing pressures in Europe, high cost of operating in
Europe and increased regulation impact operating profit margins
• Diversity of regulatory requirements across key territories in CEE, the Middle East and North Africa requires sophisticated regulatory intelligence
• Fragmentation of pharmaceutical sectors in the Middle East and North Africa pose a challenge
Opportunities• Leveraging of strength of sourcing and supply chain
capabilities vested in Aspen Global• Aspen’s vertically integrated business model enables
ongoing monitoring and management of product costs to respond to competitive challenges
• Aspen’s regulatory technical centre in Ireland is capable of managing the complex regulatory requirements for key territories, thereby setting a strong compliance platform for pursuit of commercial growth opportunities
• The acquisition of selected businesses and products from GSK and MSD supports the Group’s growth objectives across Europe and the CIS

page 19Aspen Pharmacare Holdings LimitedSustainability Report 2013
Overview
Economic Sustainability
Social SustainabilityEnvironm
ental Sustainability
Population size GDP value
IMS value of the total
pharmaceutical sector
Global IMS ranking of the pharmaceutical
sector per territory as at December 2012
Year in which business unit commenced
tradingAspen’s reach in the territory
at 30 June 2013Aspen’s current
ranking in the territoryOverview of key risks/opportunities
impacting future growth
BR
AZI
L
194 million USD2,4 trillion USD26,2 billion 8th 2008 Number of permanent employees: 359
Number of sales representatives: 123
SKUs sold: 136
Ranked 64th Risks• Fragmented market posing a challenge to gaining
critical mass and identification of feasible acquisitive growth opportunities
• Strong domestic participation in industryOpportunities• A high growth pharmerging market with a preference
for brands• Aspen has become a well recognised brand in this
region through the successful efforts of an experienced management team
SP
AN
ISH
LA
TIN
AM
ERIC
A
Mexico
117 million USD1,8 trillion USD9,7 billion 16th 2008 Number of permanent employees: 198
Number of sales representatives: 67
SKUs sold: 79
Ranked 51st Risks• Regulatory changes and challenge to gaining a critical
mass of volumes• Political and fiscal volatility impacting cost of doing
business in VenezuelaOpportunities• Acquisition of the Pfizer infant milks business for this
region presents a good opportunity for gaining further brand recognition and growing the consumer business
• Aspen Argentina was established during the year, further expanding the Group’s presence in this region
Venezuela
29 million USD397 billion USD6,2 billion 17th 2008 Number of permanent employees: 83
Number of sales representatives: 44
SKUs sold: 113
Ranked 68th
RES
T O
F TH
E W
OR
LD
Includes: Aspen Bad OldesloeAspen Dubai (selling into MENA)Aspen Global
n/a n/a n/a Aspen Bad Oldesloe Aspen Dubai: 2009Aspen Global: 2008
Number of permanent employees: 507
Number of sales representatives 42 dedicated Aspen sales representatives in addition to others that are currently outsourced to accredited third-party distributor companies
SKUs sold: 2 108
n/a Risks• Pricing pressures in Europe, high cost of operating in
Europe and increased regulation impact operating profit margins
• Diversity of regulatory requirements across key territories in CEE, the Middle East and North Africa requires sophisticated regulatory intelligence
• Fragmentation of pharmaceutical sectors in the Middle East and North Africa pose a challenge
Opportunities• Leveraging of strength of sourcing and supply chain
capabilities vested in Aspen Global• Aspen’s vertically integrated business model enables
ongoing monitoring and management of product costs to respond to competitive challenges
• Aspen’s regulatory technical centre in Ireland is capable of managing the complex regulatory requirements for key territories, thereby setting a strong compliance platform for pursuit of commercial growth opportunities
• The acquisition of selected businesses and products from GSK and MSD supports the Group’s growth objectives across Europe and the CIS

page 20Sustainability Report continued
The Group achieved gross revenue growth of 27% to R20,8 billion (2012: R16,4 billion) and increased operating profit by 28% to R5,0 billion (2012: R3,9 billion) during the 2013 financial year. The Group’s five year CAGR is 35% for both gross revenue and EBITA.
The Group’s legacy business in South Africa continues to deliver organic growth. However, due to recent geographic diversification, expanding contributions from the other businesses have diluted the weighting of the South African segment over the last five years. This trend is set to continue. The Asia Pacific region has become the largest revenue contributor to the Group, representing 37% to the Group’s revenue and contributes 34% to the Group’s operating profits. Businesses in Latin America and Rest of the World are also showing strong growth, having posted revenue increases of 53% and 40% respectively during the year.
The Group’s cash generation capability remains strong as a result of an effective business model and close monitoring of operating cash flows, thereby enabling the ongoing pursuit of growth opportunities and the maintenance of a distribution to shareholders in 2013. Diluted operating cash flow per share increased by 37% to 874 cents. The
Group’s working capital to annual revenue ratio has remained stable at 27% as a result of diligent working capital management initiatives and is well within Aspen’s target range of 25% to 30%. Demand management systems and supply chain systems are currently areas of high focus across the Group to support the increasing supply chain complexity. Once implemented, these systems will support supply chain optimisation objectives which, in turn, will support the management of working capital.
During the year, the Group invested R5,6 billion on business and product acquisitions while a further R0,7 billion was invested in other capital projects. The Group’s net borrowings increased by R4 billion to R11,1 billion following
payment for the infant milks businesses in Australia and southern Africa and acquisition of global brands during the year. Total debt, following the completion of the impending transactions is expected to reach USD3,4 billion. The Group’s borrowings are grouped into currency-denominated debt pools. During the year, South Africa denominated debt as a proportion of total borrowings diminished as new US Dollar and Australian Dollar based debt was added, resulting in appropriate matching of the related cash flows. Interest rates are mostly linked to BBSY1, LIBOR2 and JIBAR3 for the respective debt pools. Despite the increase in the debt balance, operating profit before amortisation covered finance costs, net of interest received, 10 times at year-end which exceeds the Group’s internal target of five times cover.
2012
2013
2011
2010
2009
2008
Geographic diversi�cation for sustainable gross revenue growth5-year CAGR to 2013 = 34,7%
51% 11% 38%
55% 9% 36%
48% 10% 43%
38% 10% 52%
36% 10% 54%
77% 23%
South Africa SSA International including Asia Paci�c(R’billion)
R8,4
R10,1
R13,2
R16,4
R20,8
R4,9
2012
2013
2011
2010
2009
2008
Geographic diversi�cation for sustainable growth in EBITA 5-year CAGR to 2013 = 34,8%
South Africa SSA International including Asia Paci�c(R’billion)
35% 5% 60%
40% 6% 54%
55% 5% 39%
60% 3% 37%
48% 8% 44%
85% 15%
R5,6
R4,4
R3,5
R2,7
R2,3
R1,3
1 Bank Bill Swap Yield2 London Inter-bank Offer Rate3 Johannesburg Inter-bank Acceptance Rate
Debt, liquidity and revenue trends (R’million)
201320122011201020092008
6521 292
2 033
2 446 2 9083 986
1 597
4 0393 041
6 3487 068
11 058
4 683
8 4419 619
12 383
15 25619 309
Net Revenue Net borrowings Cash �ow from operating activities
0
5 000
10 000
15 000
20 000
Maintenance of financial health

page 21Aspen Pharmacare Holdings LimitedSustainability Report 2013
Overview
Economic Sustainability
Social SustainabilityEnvironm
ental Sustainability
To sustain business growth, Aspen has undertaken extensive corporate activity during 2013 which includes the following impending transactions which will be funded with bank debt:
1. The acquisition of an API manufacturing business, primarily in the Netherlands, from MSD for approximately EUR36 million plus inventory to the value of EUR300 million, completed on 1 October 2013. Further details can be found in Aspen’s Stock Exchange News Service (“SENS”) announcement issued on 27 June 2013.
2. In a related agreement, Aspen has an option to acquire a portfolio of 11 branded finished dose form molecules covering a diverse range of therapeutic areas for approximately USD600 million. The most likely date for the acquisition of this portfolio through the exercise of the option is 31 December 2013. Further details can be found in Aspen’s SENS announcement issued on 27 June 2013.
3. Acquisition by Aspen of GSK’s Arixtra and Fraxiparine/Fraxodi brands and business worldwide (except China, India and Pakistan) together with the specialised sterile production site
which manufactures these brands for approximately GBP700 million. Subject to regulatory approvals, it is expected that the commercial operations will transfer to Aspen on 31 December 2013 with the site, to follow on 1 May 2014. Further details can be found in Aspen’s SENS announcement issued on 30 September 2013.
4. The acquisition of certain licence rights to infant nutritional intellectual property, net assets including a production facility in Mexico and shares in the infant nutritional businesses in several countries in Latin America from Nestlé with a proposed effective date of 28 October 2013. Further details can be found in Aspen’s SENS announcement issued on 7 August 2013.
5. The acquisition from Nestlé of certain rights to intellectual property licences, net assets and shares in the infant nutritionals business presently conducted by Pfizer in certain southern African territories, including South Africa, which remains subject to the approval of the South African competition authorities. Further details can be found in Aspen’s SENS announcement of 18 April 2013.
Investing activities during 2013 R8,6 billion
Utilisation
Financed by
16%9%6%69%
47% 53%
● IP and business acquisitions ● Expansion capex – PPE ● Capital distribution ● Other● Free cash �ows ● Net borrowings
Net borrowings balances
2013
2012 2,23,6 1,3
3,54,3 3,3
7,1
11,1
● South Africa ● Asia Paci�c ● International
(R’billion)
Net borrowingsEquity
2013
2011
2012
2010
2009
Capital composition% of total
33%67%
29%71%
34%66%
24%76%
52%48%
Aspen and MSD executives toasting the signature of the agreements concluded between them on 27 June 2013

page 22Sustainability Report continued
Products supplied to customers are largely manufactured at the Group’s owned production facilities. The South African Operations manufacturing sites, centered in Port Elizabeth, represent 61% of the Group’s tablet manufacturing capacity. A number of Aspen’s global brands for worldwide supply are produced at the Bad Oldesloe site in Germany. Manufacturing optimisation programmes at these sites are given high focus to deliver production efficiencies and cost competitive products. Aspen’s vertically integrated manufacturing and supply business model enables responsive management of the supply chain and stringent monitoring of regulatory and quality standards across the value chain.
For details of Aspen’s manufacturing facility accreditations, refer to pages 10 and 11 of the Integrated Report.
Despite inflationary pressures, the South African manufacturing sites are well positioned to produce high quality and affordable medicines for the Group through the application of continuous improvement projects. Consequently, an additional four billion tablets are planned
to be transferred from existing suppliers to the Port Elizabeth site over the medium term. Deca Durabolin and Sustanon, to be acquired from MSD, are expected to be manufactured at the Steriles facility in Port Elizabeth – this project is currently in the planning phase.
Over the last seven years, the Group has invested more than R3,7 billion in the expansion, upgrade and refurbishment of its manufacturing facilities, largely related to facility investment projects at the South African sites. During the year, capital expansion projects have progressed according to plan at all of the South African sites. In Port Elizabeth, land was acquired immediately adjacent to Aspen’s site. Part of this land is already under construction with the commencement of the building of the high containment suite while the remaining land remains available for future projects. The upgrade of packing capabilities is also under way in Port Elizabeth. The expansion of manufacturing capabilities is continuing at FCC in line with the strategy to achieve greater vertical integration of this site with Group API demands. The projects under way at the East London and
Johannesburg facilities are nearing completion. Aspen’s ongoing investment in its world class manufacturing hub in South Africa has contributed positively to the financial security and ongoing development of its employees. Product costs have benefited from ongoing improvement in manufacturing efficiencies, application of sound procurement practices, the promotion of a manufacturing excellence culture and teamwork amongst experienced staff. Formalised trade union engagement processes are in place to manage employee relations in a proactive manner.
In Australia, the manufacturing rationalisation process is progressing in accordance with scheduled plans. Full closure of the penicillin plant at Croydon is planned to be completed by December 2013 after decontamination of this site. The Noble Park and Baulkham Hills sites are expected to be closed by December 2014. This project is receiving significant focus from the Australian management team in order to implement the required closure protocols effectively with due consideration and appropriate response to key stakeholder concerns.
Analysis of Group tablet making capacity (19 billion tablets)
Germany 13%
Other 14%
South Africa 61%*Australia 12%
*Includes tablet making capacity at Dandenong only owing to the planned closure of Baulkham Hills, and Noble Park during 2014.
Key cost components for products manufactured at the South African facilities
IncludingARVs
Non-ARVs
32%68%
51% 49%
● Material costs ● Conversion costs
% of total
Allocation of conversion costs at the South African facilities
Electricity 6%
Other 23%
Payroll costs 57%Depreciation 14%
SUSTAINING A COST-COMPETITIVE MANUFACTURING BASE

page 23Aspen Pharmacare Holdings LimitedSustainability Report 2013
Overview
Economic Sustainability
Social SustainabilityEnvironm
ental Sustainability
Commercial manufacturing opportunities continue to be evaluated at Aspen Mexico in order to increase manufactured volumes and attain better economies of scale. Capital investment plans are being evaluated for refurbishing and upgrading manufacturing capability in Brazil. Continuous improvement projects are in progress at Aspen’s Tanzanian and Kenyan sites and future manufacturing strategies are being reviewed.
Several product introductions, in various stages of commercialisation at Aspen Bad Oldesloe, will increase manufacturing volumes and improve economies of scale. The technical expertise which exists at Aspen Bad Oldesloe is a benefit to the Group’s manufacturing base.
Aspen’s raw materials are largely purchased from accredited suppliers in the East owing to the fact that local sources of supply are not available for these products in South Africa. Packaging material is mostly procured from South African suppliers to the extent that quality and cost requirements are met. Ninety percent of Aspen’s total measured procurement spend in South Africa is with BBBEE suppliers, exceeding the target level of 70%.
Across the facilities, standard product costs are set on an annual basis in accordance with budgeted exchange rates and other expected costs of procurement and manufacture. Forward cover is taken out for each confirmed materials purchase in South Africa and, currently, the cost of 50% of imported
goods into Australia is hedged by forward cover contracts. The adequacy of this treasury policy is monitored on an ongoing basis with reference to material movements in the South African and Australian currencies.
2013
2012
2011
2010
2009
2008
2007
470
667
632
627
379
288
652
Investment in property, plant and equipment (R’million)
Currencies denomination of raw material purchases by South African operations during 2013
EUR 10%
Other 2%
USD 55%ZAR 33%

page 24Sustainability Report continued
Managing our human capitalAspen’s global team of committed, accountable and passionate employees is considered to be a key critical success factor for the Group. A wealth of technical and commercial experience resides in the Group’s human capital base and management takes pride in supporting the development, progress and continued effectiveness of individuals across all business units. Aspen’s dynamic environment requires employees to be results-driven, self-motivated, decisive and responsive team players. All employees are provided with equal opportunities for development, advancement and promotion on merit and without prejudice.
Aspen strives to become a preferred pharmaceutical employer by attracting, developing and retaining high-calibre talent across its global operations. Candidates with the required technical qualifications and experience are in short supply and in high demand including pharmacists, chemists, engineers and artisans. To improve employee management and employee relations in the Group, the Group Human Resources organisational structure was reviewed and appropriately resourced to meet the changing needs of the business. The department has been strengthened during the year with the appointment of additional recruitment professionals and the implementation of recruitment tools
that have enabled access to a wider international network of highly skilled candidates. Furthermore, a Group Rewards Manager was appointed to ensure that Aspen’s remuneration and benefits remain competitive. The recruitment of a Group Human Resources Projects Manager and a Group Human Resources Manager have also added to the strength of the function. Through the extended Group Human resources infrastructure, the level of engagement between the Group and offshore business unit Human Resources departments has increased during the year to provide the necessary guidance and support to decentralised human resources teams for application of consistent human resources practices. This division is now well positioned to accommodate the employee management requirements of the expanding business. Human Resources managers have also been appointed at Aspen Mexico, Aspen Ireland and Aspen Europe.
The Group’s Human Resources Department develops and monitors the employee management strategy and related policies which are implemented by business unit human resources teams. Group human resources policies and procedures have been updated and implemented in the South African business over the last two years. Phase 2 is currently in progress for the consistent
implementation of these protocols in Aspen’s International businesses.
Retention and succession plans are in place for key managerial and technical staff and for identified high-potential candidates. The Board’s Remuneration & Nomination Committee monitors the adequacy of succession plans for the Company’s executive directors and the Group’s senior executives. Succession plans are also in place for key business unit executives and managers – the adequacy of these succession plans is monitored by the responsible Group executives.
Employee performance is managed through a formalised key performance assessment process for skilled, professional and managerial permanent staff where annual performance objectives for individuals are developed in accordance with functional and business unit strategic objectives. During the year, performance appraisals were completed for 74% of permanent employees across the Group through formal one-on-one meetings between employees and responsible managers. Performance incentives and annual salary increases for assessed staff are determined with reference to the completed appraisals. Development and training needs are also identified during this process. Business unit managers are responsible for the implementation of
Aspen’s total permanent and non-permanent employees per geographic segment as at 30 June 2013 – 7 177 employees (2012: 6 624)
Rest of world 8%
Latin America 10%
South Africa 57%
SSA 12%
Asia Paci�c 13%
2013
2012
2011
2010
5 498
5 210
5 168
4 579
9% 12% 7% 17% 55%
8% 12% 7% 17% 56%
7% 13% 8% 15% 57%
8% 14% 10% 2% 66%
Growth in number of permanent employees per geography
Rest of the world Latin America SSAAsia Paci�c South Africa
CREATING AN ENVIRONMENT IN WHICH OUR EMPLOYEES CAN THRIVE

page 25Aspen Pharmacare Holdings LimitedSustainability Report 2013
Overview
Economic Sustainability
Social SustainabilityEnvironm
ental Sustainability
effective training programmes to address identified skills development needs with the support of regional Human Resources Departments. The Group Human Resources function supports business unit management teams to this end and monitors adequacy of implemented training plans.
Grievance procedures are in place across all business units and consistently applied by management teams. Employees are made aware of these processes. Formalised grievance policies are in place at the businesses in South Africa, Australia and Ireland. Steps are currently in progress to develop formal grievance policies for other business units. This project is expected to be completed during the 2014 financial year.
Respecting employee diversity and promoting equality in the workplace Through geographic expansion, as at 30 June 2013, Aspen’s diverse team comprises 7 177 employees representing 42 different nationalities across six continents. In accordance with the
Group’s Code of Conduct available online, all employees are treated with fairness, equality and respect. Aspen promotes a working environment which is void of prejudice, bias, harassment and/or violation. Discrimination of employees on the basis of gender, race, physical health, sexual orientation, individual belief systems and/or any other prejudicial grounds is prohibited. Female employees comprise 49% of the total workforce and 77% of employees are employed on a permanent basis. In South Africa, 75% of permanent employees represent historically dis-advantaged individuals.
A perception survey was conducted during April 2013 to evaluate perceptions of female staff in the South African business regarding equality of women in the workplace and suitability of working conditions. No material issues regarding gender equality were reported. Some matters requiring further investigation were identified and, in response, an Aspen Women’s Forum has been established to provide a platform for
female employees in South Africa to engage on relevant matters.
In South Africa, in accordance with the BBBEE Codes and Aspen’s transformation policy, the advancement of historically disadvantaged individuals, including females, is promoted and measured. Aspen’s Board is committed to the advancement of females into managerial roles within the Group and this objective is monitored by the Social & Ethics Committee. Aspen’s employee management policies in South Africa are developed in accordance with the Employment Equity Act and the BBBEE Codes to promote the advancement of historically disadvantaged individuals. Employment equity forums are in place at each of the South African sites and these forums meet regularly to monitor the status of employment equity plans at these relevant sites. Transformation indicators for South Africa are monitored by Social & Ethics Committee on a quarterly basis.
KEY EMPLOYMENT INDICATORS
Employee movement Group total South Africa SSA Asia Pacific International
Number of employees at 1 July 2012 6 624 3 717 817 908 1 182Appointment of new employees 1 695 890 112 257 436Termination of employment contracts (1 080) (508) (58) (209) (305)Retirements (32) (20) (4) (3) (5)Medical retirements (12) (3) (9) – –Deaths (18) (16) (1) – (1)
Total employees at 30 June 2013 7 177 4 060 857 953 1 307
– Percentage permanent employees 77% 76% 42% 96% 88%– Percentage non-permanent employees 23% 24% 58% 4% 12%
Note: Following the acquisition of the MSD API business effective 1 October 2013, approximately 1 000 employees were added to the Group’s International segment, increasing the number of employees from 7 177 at 30 June 2013 to near 8 200 as at 21 October 2013, being the date of this report.

page 26Sustainability Report continued
The number of employees at 1 July 2012 has been restated following the inclusion of fixed-term, contracted employees in East Africa to the definition of non-permanent employees. As a result, the opening balance of employees in SSA increased from 372, as stated in the 2012 Sustainability Report, to 817. This increased the opening balance of Group employees by 445 employees from 6 179 to 6 624. This amendment did not impact the number of permanent employees at 1 July 2012.
One work-related fatality was recorded during 2013 (2012: 1) being the death of an Aspen Venezuela employee who died in a motor
One work-related fatality was recorded during 2013 (2012: 1) being the death of an Aspen Venezuela employee who died in a motor vehicle accident whilst travelling for business meetings. Aspen also regrets to report the death of 17 other employees during the year who died as a result of non-work related natural causes and wishes to acknowledge the meaningful contribution made by these employees during their time at Aspen.
Employees were recruited to support business expansion requirements and to replace vacancies. Following the acquisition of the Nestlé infant milks business in Australia, 57 permanent
employees were added to the Group, of which three resigned during the year. Additional non-permanent employees were appointed mainly at the South African sites and in East Africa. Three employees in South Africa and nine employees in East Africa retired due to ill health attributable to non-work-related causes.
The Group’s employee turnover ratio is monitored for each territory by the Group’s Human Resources Department to identify potential risks to employee retention. Where benchmark employee turnover ratios are published, these are used as a reference for monitoring internal trends. Material movements are discussed with the business unit management teams and potential causes of high turnover rates are investigated.
The Group’s employee turnover rate has improved to 14% from 18% in 2012 mainly as a result of actively managing identified employee management issues in Latin America and East Africa. Aspen’s employee attrition rate in South Africa has decreased to 9% which is below the industry average of 14% as reported in the Deloitte (South African) Pharma Survey for the year ended 31 December 2012. In Australia, the facility rationalisation programme is in progress and the phased employee retrenchment plan is expected to be completed by December 2014.
Building the skills pool and developing future Aspen leadersOn the job coaching by managers, employee participation in cross-functional project teams, formal functional training, leadership training and an open-door engagement policy facilitates an empowering environment to aspirant individuals in the organisation. To sustain the pool of scarce technical skills, bursary, internship and learnership programmes are in place.
Technical and functional skills gaps are identified and managed in accordance with business objectives. Owing to the highly regulated pharmaceutical and globalised corporate environment in which Aspen operates, relevant training programmes are conducted throughout the year to maintain an up-to-date awareness of regulatory, legislative and statutory compliance requirements as well as best governance and ethics management practices. At the manufacturing sites, functional and compliance training related to GMP governing the pharmaceutical manufacturing environment, standard operating procedure training and SHE training takes place in a structured manner.
Training courses are conducted internally and also through external service providers. Internal training courses comprise a significant portion of total
Group employee trends
Percentage female employees Percentage permanent employeesNet growth in permanent employee base
76%
49%
14%
82%
49%
13%
84%
50%
1%
77%
49%
6%
2010 2011 2012 2013
Permanent employee turnover ratios
South Africa SSA Asia Paci�c International Group
12%
22%
26%
16%
13%
18%
35%
21%
16%14%
9%
17%
2011 2012 2013
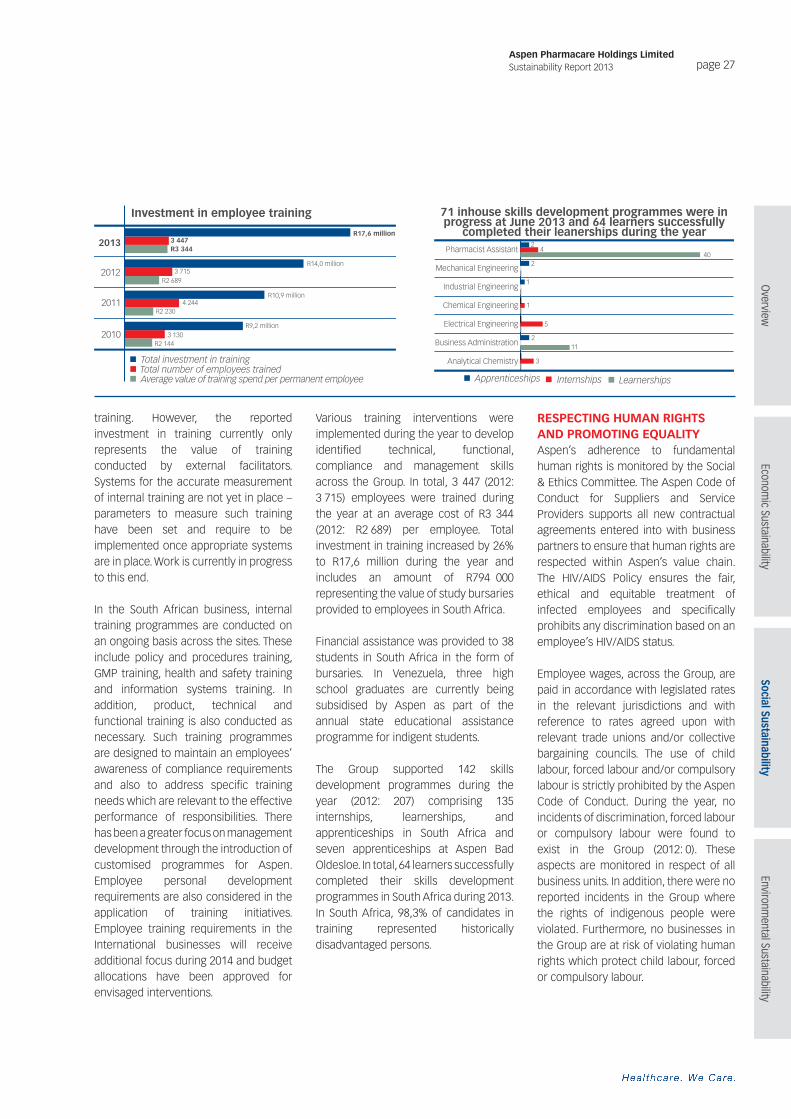
page 27Aspen Pharmacare Holdings LimitedSustainability Report 2013
Overview
Economic Sustainability
Social SustainabilityEnvironm
ental Sustainability
training. However, the reported investment in training currently only represents the value of training conducted by external facilitators. Systems for the accurate measurement of internal training are not yet in place – parameters to measure such training have been set and require to be implemented once appropriate systems are in place. Work is currently in progress to this end.
In the South African business, internal training programmes are conducted on an ongoing basis across the sites. These include policy and procedures training, GMP training, health and safety training and information systems training. In addition, product, technical and functional training is also conducted as necessary. Such training programmes are designed to maintain an employees’ awareness of compliance requirements and also to address specific training needs which are relevant to the effective performance of responsibilities. There has been a greater focus on management development through the introduction of customised programmes for Aspen. Employee personal development requirements are also considered in the application of training initiatives. Employee training requirements in the International businesses will receive additional focus during 2014 and budget allocations have been approved for envisaged interventions.
Various training interventions were implemented during the year to develop identified technical, functional, compliance and management skills across the Group. In total, 3 447 (2012: 3 715) employees were trained during the year at an average cost of R3 344 (2012: R2 689) per employee. Total investment in training increased by 26% to R17,6 million during the year and includes an amount of R794 000 representing the value of study bursaries provided to employees in South Africa.
Financial assistance was provided to 38 students in South Africa in the form of bursaries. In Venezuela, three high school graduates are currently being subsidised by Aspen as part of the annual state educational assistance programme for indigent students.
The Group supported 142 skills development programmes during the year (2012: 207) comprising 135 internships, learnerships, and apprenticeships in South Africa and seven apprenticeships at Aspen Bad Oldesloe. In total, 64 learners successfully completed their skills development programmes in South Africa during 2013. In South Africa, 98,3% of candidates in training represented historically disadvantaged persons.
RESPECTING HUMAN RIGHTS AND PROMOTING EQUALITYAspen’s adherence to fundamental human rights is monitored by the Social & Ethics Committee. The Aspen Code of Conduct for Suppliers and Service Providers supports all new contractual agreements entered into with business partners to ensure that human rights are respected within Aspen’s value chain. The HIV/AIDS Policy ensures the fair, ethical and equitable treatment of infected employees and specifically prohibits any discrimination based on an employee’s HIV/AIDS status.
Employee wages, across the Group, are paid in accordance with legislated rates in the relevant jurisdictions and with reference to rates agreed upon with relevant trade unions and/or collective bargaining councils. The use of child labour, forced labour and/or compulsory labour is strictly prohibited by the Aspen Code of Conduct. During the year, no incidents of discrimination, forced labour or compulsory labour were found to exist in the Group (2012: 0). These aspects are monitored in respect of all business units. In addition, there were no reported incidents in the Group where the rights of indigenous people were violated. Furthermore, no businesses in the Group are at risk of violating human rights which protect child labour, forced or compulsory labour.
Total number of employees trainedTotal investment in training
Average value of training spend per permanent employee
2013
2011
2010
2012
Investment in employee training
R17,6 million
R14,0 million
R10,9 million
R9,2 million
3 447R3 344
3 715R2 689
4 244R2 230
3 130R2 144
InternshipsApprenticeships Learnerships
Pharmacist Assistant
Mechanical Engineering
Industrial Engineering
Chemical Engineering
Electrical Engineering
Business Administration
Analytical Chemistry
71 inhouse skills development programmes were in progress at June 2013 and 64 learners successfully
completed their leanerships during the year2
2
1
1
5
2
3
11
440

page 28Sustainability Report continued
Material operational changes are communicated to the employee trade unions, as necessary, within legislated timeframes and these vary across the territories.
All employees are free to belong to trade unions and relationships with trade union representatives, considered to be key stakeholders, are managed in a proactive and responsible manner by site Human Resources Managers. Formal processes are in place to foster a culture of transparency and constructive engagement with trade union representatives in each territory. Employees across the Group are free to
Employment equity forums are in place at each of the South African sites and these forums meet regularly to monitor the status of employment equity plans at the relevant sites. On an annual basis, employment equity indicators, which track Aspen’s performance against its employment equity plan, are submitted to the Department of Labour. The Group’s employment equity indicators are monitored by the Social & Ethics Committee.
CONTRIBUTING TO THE ENHANCEMENT OF HEALTHCARE, EDUCATION AND BASIC NEEDS IN COMMUNITIESAspen’s CSI comprises formal projects which address primary healthcare clinics in the rural areas, HIV/AIDS and non-communicable disease management and increasing healthcare education and awareness in South Africa where
exercise their rights to belong to trade unions and collective bargaining councils – approximately 29% of the Group’s employees belonged to a trade union during 2013 and 36% are represented by collective bargaining councils.
No employee strike action was experienced at the Group’s sites during the year and consequently no production days were lost.
Empowering historically disadvantaged individuals in South AfricaIn South Africa, 75% (2012: 76%) of permanent employees represent the historically disadvantaged ethnic groups
the development of public-funded healthcare infrastructure is part of the national development plan. South Africa represents 17% of the world’s HIV/AIDS population. Aspen’s business model in South Africa addresses a critical national medicinal need – Aspen continues to be the largest supplier of ARVs to this State tender programme.
In March 2013, Aspen South Africa received the PMR Golden Arrow Award for its corporate social responsibility projects and initiatives as adjudicated by a selection of business leaders, members of the investment community and public sector representatives in South Africa.
The PHEF, initiated by Aspen and the South African Department of Health, was inaugurated in November 2012 and includes 23 private sector healthcare companies. The PHEF serves as a non-
of African Blacks, Indians and Coloureds (collectively referred to as “Blacks”) of which 41% comprise female employees. Good progress has been made in increasing representation of these groups amongst Aspen’s management team in South Africa. Aspen maintained its Level 3 contributor status as verified by Empowerdex in October 2013. The BBBEE legislation is currently under review and the impact of such changes to Aspen’s employment equity indicators is being monitored by the Social & Ethics Committee.
profit organisation and participating companies are required to make an annual contribution to the fund in proportion to reported financial performance. In consultation with the DOH, member companies have jointly selected initiatives targeting healthcare capacity development for the management of HIV/AIDS and TB. The PHEF aims to:• amalgamate and leverage CSI
resources from the private healthcare sector to extend the reach and impact of socially targeted financial capital;
• promote cohesive implementation of targeted projects for increased effectiveness; and
• consolidate the focus of public and private sector initiatives to collectively enhance South Africa’s public health-care and educational systems.
Management level
2013 “Black”
representationachieved
2013target
under theBBBEE codes
2012“Black”
representationachieved
Senior management 37% 43% 33%Middle management 46% 63% 45%Junior management 65% 68% 74%

page 29Aspen Pharmacare Holdings LimitedSustainability Report 2013
Overview
Economic Sustainability
Social SustainabilityEnvironm
ental Sustainability
Aspen contributed
R5 million to the Nelson Mandela Children’s Hospital fund

page 30Sustainability Report continued
The PHEF will make an investment in community development projects which support:• increased access to affordable
healthcare and training of primary healthcare professionals;
• management of HIV/AIDS, TB and other non-communicable diseases;
• relevant community upliftment initiatives; and
• increased access to basic education in South Africa.
During the year, Aspen continued to provide financial assistance to targeted South African CSI projects and 67 such projects were supported amounting to a total investment of R15,1 million.
2013
2012
2011
2010
67
50
46
37
17 10 8 23 9
13 6 11 8 12
7 15 114 9
4 6 13 7 7
CSI projects supported by Aspen in South Africa
Education and training Healthcare HIV/AIDSClinicsCommunity upliftment
Allocation of 2013 corporate social invesment (R15,1 million)
Communityupliftment 14%
Other 2%Clinics 7%
Education andtraining 29%
HIV/AIDS 15%
Aspen’s CSI activities in South Africa reached the following key beneficiaries during the year:
CSI project Nature of Aspen’s contribution
Alexandra Healthcare Centre Financial assistance for the purchase of primary healthcare equipment.
Centre for Education in Economics and Finance Africa
Financial contribution towards a leadership development and distance learning programme which provides subsidies to underprivileged students studying towards finance, economics and policy management studies.
Sifiso Nxasana Paediatric Trust The trust was formed for the enhancement of paediatric healthcare at the Nelson Mandela Children’s Hospital and the KwaZulu-Natal Children’s Hospital.
Pholosho Secondary School Trust Financial assistance was given towards the school refurbishment project.
South African Department of Defence and Military Health Service
Financial contribution towards a public-private partnership for the upskilling of nurses through structured training programmes offering the Aspen Diploma in Clinical Nursing Science, Health Assessment, Treatment and the Care the Dispensing for Non-Pharmacist Healthcare Professionals course.
Umthobo Youth Development Foundation Aspen supports 13 medical students through this foundation (2012: 6). Students will work in rural hospitals post qualification.
Wits Rural Health Initiative Financial assistance is provided to five high potential medical students from rural areas (2012: 6) One sponsored graduate qualified during the year.
In addition to these formal CSI projects, more than 4 500 Aspen employees across the Group volunteered 67 or more minutes of their time to make a difference to the lives of some 9 400 (2012: 3 000) underprivileged people on Mandela Day which was commemorated
on 18 July. In total, 36 projects (2012: 29) were run across 15 different countries. Contributions were made in the form of food parcels and other daily necessities, financial donations, refurbishment of community buildings and/or life skills training.
SUPPORTING THE WELL-BEING OF OUR EMPLOYEESThe well-being of our staff is of utmost importance to ensure that employees are able to perform their duties in good health and to the best of their ability.

page 31Aspen Pharmacare Holdings LimitedSustainability Report 2013
Overview
Economic Sustainability
Social SustainabilityEnvironm
ental Sustainability
The prevalence of HIV/AIDS amongst staff is a material sustainability factor facing employers on the African continent and Aspen acknowledges that employees require the necessary support for management of this disease.
Various healthcare insurance options are available to employees offering a range of medical plans suitable to individual budgets and healthcare requirements. On-site clinics, employee assistance
programmes, programmes for the promotion of healthcare awareness and HIV/AIDS testing, counselling and support programmes are offered to employees at designated business unit. In support of employee safety, wellness and to manage employee productivity, employee absenteeism is formally recorded by business unit management teams and reasons for anomalous leave patterns are subjected to investigation. Where required, formal discussions are
held with the affected employee and, where necessary, prescribed remedial or disciplinary procedures are followed. Where absenteeism is related to a diagnosed illness or psycho-social matter, employees are referred to the Employee Assistance Programme as part of the medical incapacity process.
Some wellness programmes available to Aspen’s employees are described below.
Programme Employee wellness facilities available to employees
Healthcare insurance plans
• In South Africa, permanent employees are members of one of three medical aids and membership is partly subsidised for non-professional and non-managerial staff.
• In East Africa, all permanent employees receive a partial subsidy towards medical aid costs.• Aspen Bad Oldesloe contributes towards employee medical insurance in accordance with German regulations.• All permanent employees at Aspen Brazil receive a medical subsidy which provides general health, dental
and life insurance cover.• Employees at Aspen Mexico receive a fully subsidised medical plan.• Aspen Global subsidises the full cost of medical cover for all employees.• Employees at Aspen Philippines receive a fully subsidised medical plan and the Employee Medical Assistance
facility is also in place to aid the cost of medical expenses which exceed healthcare insurance limits.
On-site clinics and employee medical assessments
• On-site clinics are in place at the South African manufacturing sites which provide primary healthcare services and also conduct pre-employment and exit medicals. In addition, occupational health medical assessments are conducted regularly. Primary healthcare services are provided to employees at FCC and occupational health and safety medical assessments are conducted in accordance with legislative requirements. An on-site clinic was opened at the Aspen Nutritionals site during the year.
• Manufacturing staff in Australia undergo pre-employment medical examinations including audiometric testing.
• Annual legislated medical assessments are conducted for all employees at Shelys in Kenya and Tanzania. • At Aspen Bad Oldesloe, an on-site occupational physician is available on a weekly basis to provide free
comprehensive medical services to employees. • At Aspen Brazil, an on-site first-aid centre is available to facilitate basic workplace healthcare requirements
and also to promote healthcare awareness. In addition, employees have access to a nutritionist.• Medical assessments are conducted twice per year at Aspen Venezuela for employees who are entitled to
healthcare insurance. • Aspen Global subsidises the full cost of medical assessments for expatriates applying for a working permit. • Pre-employment medical assessments are conducted for all new employees at Aspen Philippines. In addition,
employees in this business also have an Annual Physical Examination which forms part of the employee healthcare insurance plan.
Employee Assistance Programmes
• Employee Assistance Programmes are in place at the manufacturing sites in South Africa and Australia. Relevant resources and counselling are provided to employees to aid physical and emotional health.
Programmes for the promotion of healthcare awareness
• Health awareness seminars take place frequently and HIV/AIDS voluntary counselling and testing services are also provided. All permanent employees have medical insurance cover, partly subsidised by Aspen.
• Annual HIV/AIDs and anti-smoking awareness campaigns are conducted for all employees.• Employees at Aspen Venezuela participate in monthly awareness seminars conducted by an external
healthcare service provider.• An employee health day takes place annually at Aspen Global which provides free diabetes testing and
counselling to all employees.• At Aspen Philippines, a monthly health bulletin is sent out to employees that promotes an awareness of
selected healthcare topics.
page 32Sustainability Report continued
Supporting HIV/AIDS-infected employees and promoting awarenessAspen is committed to promoting HIV/AIDS awareness and offering HIV/AIDS positive employees with required counselling and support.
An Aspen HIV/AIDS policy is in place in South Africa and has been updated and consideration is being given to Group-wide implementation of a broader HIV/AIDS policy. The HIV/AIDS policy complies with legal guidelines and prescribes confidentiality of the employee’s status. Free condom dispensers are installed in accessible areas across the South African and Kenyan sites. Each year, Aspen participates in World AIDS Day on 1 December and World TB Day on 24 March. Employee awareness of these diseases is created through the dissemination of information booklets, posters and making relevant information available electronically to staff.
In South Africa, Aspen’s HIV/AIDS management programme is administered by Metropolitan Health Risk Management. Free HIV/AIDS testing is conducted every two years and is offered to all employees in South Africa. A total of 117 employees participated in the HIV/AIDS voluntary testing process during September 2013 (2012: 1 202) concluded at the Port Elizabeth, East London, FCC, Durban and East London sites. Testing at Aspen’s Nutritionals and at commercial offices in Cape Town and Bloemfontein was still in progress during October 2013. A total of 25 employees representing 2% of employees tested (2011: 5%), were found to be HIV/AIDS positive. Once testing at the remaining sites is completed, a “Knowledge, Attitudes, Perceptions and Behaviour“ survey will be conducted to identify
barriers to participation in HIV/AIDS management programmes and close consideration will be given to emerging findings in further enhancing the Group’s HIV/AIDS management initiatives. In addition, non-communicable diseases such as diabetes, hypertension and cholesterol were also tested during this assessment.
HIV/AIDS positive employees have access to the disease management programmes through their healthcare insurance schemes which subsidise the provision of ARVs as well as voluntary counselling and support programmes. In South Africa, peer educators provide staff with necessary HIV/AIDS prevention and disease management training and, where required, this is also offered to family members of affected employees.
Free HIV/AIDS testing was also conducted in Kenya in association with the Kenya HIV/AIDS Business Council in November 2012. Of the 131 employees tested, no employees were found to be HIV/AIDS positive. Initiatives to encourage employee participation in voluntary HIV/AIDS testing continue to be promoted at Shelys in Tanzania. Employees in Tanzania remain reluctant to participate in the voluntary testing programme and no employees participated in the 2013 testing process. To address this, HIV/AIDS awareness talks are conducted to raise awareness around this disease and available treatment regimes. Employees are able to access the free voluntary testing and counselling programmes which are available across various public healthcare facilities. Annual HIV/AIDS and TB awareness talks are held at Beta in Kenya.
PROVIDING A SAFE WORKING ENVIRONMENTAspen strives to provide employees with a workplace which is safe and hazard free to prevent injuries and occupational diseases. To this end, SHE hazard identification and risk assessment evaluations are conducted on an ongoing basis by multi-functional management teams which include site SHE representatives. A Group SHE structure was established during the year to provide support to all business units in respect of SHE legal compliance and with development, implementation and monitoring of SHE management systems. External SHE legal compliance audits are conducted at each site at scheduled intervals and the Group SHE department monitors the status and adequacy of corrective action plans through formal follow-up audits. Formal SHE training is conducted on an ongoing basis to increase awareness and reinforce safety procedures.
Aspen’s SHE management systems include policies and procedures to manage third-party contractors and visitors on site. Third-party contractors are responsible for conducting their activities in compliance with Aspen’s safety specifications and the relevant SHE legislation. Due consideration is given by Aspen, its business partners and third-party distributors to ensure the safe and compliant handling and transport of all supplied products across the value chain.
The South African manufacturing sites in Port Elizabeth, East London and Johannesburg achieved OHSAS 18001 certification in July 2013. Aspen Bad Oldesloe in Germany has maintained a

page 33Aspen Pharmacare Holdings LimitedSustainability Report 2013
Overview
Economic Sustainability
Social SustainabilityEnvironm
ental Sustainability
similar certification for a number of years. Safety, health and environment structures, policies and procedures at Aspen’s facilities in East Africa, Australia and Latin America are in the process of being reviewed and a phased programme will be implemented to enhance safety compliance at these facilities in accordance with global best practice and international standards.
Investment is made in appropriate security controls to protect the physical safety of Aspen’s employees across the Group. Access controls are in place across Aspen’s sites to prevent unauthorised entry and independent security services, CCTV cameras and security search procedures are deployed in those areas where personal security and the risk of theft is at high risk. Business unit executives are responsible for implementing sufficient security measures to protect the safety and security of their employees and company assets.
Safety management and performanceAt Aspen, the DIFR and LWDFR are used as performance indicators to measure health and safety management within the Group. DIFR tolerance at all sites is set at less than or equal to 1,00 and LWDFR tolerance at all facilities is set at
less than or equal to 0,75. The DIFR reflects the percentage of employees who suffered disabling injuries in the 12 months ending 30 June, irrespective of whether such incidents resulted in lost work days. The LWDFR indicates the percentage of employees who had to be absent from work due to work-related disabling injuries over the last 12 months.
Both indicators are calculated with reference to a factor of 200 000 which represents the average number of hours worked by 100 employees over a 12-month period. The Group’s DIFR for the year was 0,99 (2012: 0,94) which is within the tolerance level of 1,00. The Group’s LWDFR for the year was recorded at 0,79 (2012: 0,87) which exceeds the 0,75 tolerance level but shows a year-on-year improvement. Continuous improvement initiatives are in progress across all sites to enhance safety controls. There was one permanent disabling injury (2012: four) recorded during the year in respect of an employee who suffered permanent impairment of speech and mobility due to a work-related incident. The employee received the necessary medical treatment and is currently in the process of recovery.
During the year, restricted work day cases were included in the calculation of DIFR at FCC, leading to an increase in the 2013 DIFR to 2,01 (2012: 0,87). In addition, the LWDFR at FCC increased from 0,87 to 1,43. Corrective action is being implemented to address identified causes of recorded incidents and FCC management has placed additional focus on initiatives to reduce injuries on duty. No incidents were recorded at Aspen Mexico during 2013. Safety indicators were measured for the first time at this facility during 2013.
At Aspen Australia, the increase in number of incidents, which has led to an increase in the DIFR to 3,87 (2012: 1,68) and in the LWDFR to 2,73 (2012: 1,68), is being evaluated by facility management teams. A formal baseline safety and health risk assessment process will be conducted to enable prioritisation of additional preventive action plans targeted at reducing the number of safety incidents. This includes the promotion of safe material handling practices through relevant training and awareness interventions.
DIFR trends
Gro
up
Sout
hA
fric
anO
pera
tions
FCC
East
Afr
ica
Aus
tral
ia
Ger
man
y
Bra
zil
Mex
ico
DIFR: 2013 Actual DIFR: 2012 Actual DIFR: Tolerance
0,99
0,940,64
2,01
0,87
2,11
0,37
3,87
1,68
1,08
1,14
0,16 0
0,711,00
LWDFR trends
Gro
up
Sout
hA
fric
anO
pera
tions
FCC
East
Afr
ica
Aus
tral
ia
Ger
man
y
Bra
zil
Mex
ico
LWDFR: 2013 Actual LWDFR: 2012 Actual LWDFR: Tolerance
0,87
0,79 0,61
0,64
1,43
0,87
1,89
0,37
2,73
1,68
1,081,14
0,75
0,14 00,16

page 34Sustainability Report continued
GMP regulations govern pharmaceutical manufacturing facilities and require that technically advanced air-handling systems are installed in production areas to extract and filter harmful fumes, vapour and dust particles during the manufacturing process. This materially eliminates the risk of employee exposure to harmful substances and prevents the release of contaminated emissions into the atmosphere. As a result, measured air pollution indicators are negligible and therefore not material to Aspen’s environmental risks.
Pharmaceutical and general waste is managed in compliance with waste management legislation applicable to each territory. Service level agreements are in place with specialist and licensed waste management services providers to ensure compliance to contracted terms and relevant legislation. Focused waste management initiatives are in place at the South African facilities to reduce the disposal of waste through landfill in favour of more responsible waste disposal methods. In addition, the quality of effluent discharge is carefully monitored and controlled at all sites in accordance with local municipal requirements. Detailed waste registers are maintained at the sites in South Africa, Australia and Germany and will be considered for implementation at Aspen’s other international sites.
As at year-end, none of the Group’s business units were located in conservation areas or areas of biodiversity.
Aspen’s Environmental Management Principles, available online, promotes the efficient use of resources with due regard to the scarcity of natural resources and the environmental impact resulting from the utilisation and application of such resources in conducting Aspen’s business. In addition,
these principles also advocate containment and reduction of Aspen’s carbon footprint across the supply chain in a technically and economically feasible manner. The Environmental Management Principles document has been implemented across all Group manufacturing sites except at Aspen Brazil where implementation will take place during 2014.
Electricity and water are critical to Aspen’s manufacturing processes and are the resources relied upon for meeting key GMP requirements at the facilities. Electricity is required for powering equipment and of air handling systems to prevent air contamination and to ensure that the required environmental conditions are maintained. Municipal water is used for the generation of purified water and clean steam for purposes of cleaning required to maintain a sterile production environment. The availability of electricity supply from the sole State-owned supplier, Eskom, in South Africa is constrained and steep tariff increases place a burden on maintaining cost-competitive supply of products. Globally, water is considered to be a scarce resource and, in accordance with projections by the Water Resources Group (2010), it is estimated that the global demand for freshwater will exceed supply by 40% by 2030. In response, water and electricity conservation projects are being formally implemented and monitored at Aspen’s facilities, particularly at Aspen’s South African Operations which represent the Group’s largest consumption base for these resources.
Aspen’s main sources of Scope 1 emissions include fuel mainly used for the production of steam and in Aspen’s owned vehicles and trucks as well as refrigerants and natural gas. Scope 2 emissions represent a larger energy
consumption value comprising purchased electricity and purchased steam. Progress has been made with the identification of Scope 3 emissions related to air travel, car rentals and for the transport inbound production materials for the South African business. This information will be reported once the information sources and related systems have been validated.
Scope 1 and Scope 2 emissions for Australia have been disclosed for the first time in 2013. Emissions are not currently measured at the sites in East Africa and Latin America. An overview of the CDP objectives and requirements has been presented to these sites and systems to record all input data and emissions measurement are being considered for implementation over the next two years.
As Aspen is in the early stages of measuring emissions, the Group’s current focus is on ensuring that emissions are consistently recorded across facilities so that a baseline can be set. Thereafter, consideration will be given to setting emissions reduction targets.
Scarce resource conservation and waste recycling targets are currently in place at the South African sites and are set annually, per site. These targets have been reviewed and updated for the 2014 financial year. In order to support the implementation of longer-term con-servation objectives, a new position has been created for this purpose within the South African Operations structure – a Resource Conservation Engineer, scheduled to join the Group SHE structure from January 2014, will focus on the identification of feasible conservation solutions and the improvement of current calculators to measure and monitor electricity and water consumption indicators.
PLAYING A ROLE IN PRESERVING THE ENVIRONMENT

page 35Aspen Pharmacare Holdings LimitedSustainability Report 2013
Overview
Economic Sustainability
Social SustainabilityEnvironm
ental Sustainability
Good progress is being made with the achievement of waste recycling objectives to reduce use of the landfill disposal method in favour of alternative methods.
Targets for electricity and water conservation initiatives have not yet been set at the International sites and these will be given consideration during 2013. The priority at the international manufacturing sites for the next two years is on ensuring that environmental legal compliance audit findings are appropriately addressed to establish a foundation for SHE systems development and implementation in accordance with international standards. Implementation of formalised electricity and water conservation projects and related reporting systems will be implemented subsequently.
Participation in the CDP and external assurance of emissions dataAspen’s 2012 CDP score improved from 63E to 72D. During the year, Aspen continued its participation in the CDP and, for the first time, participated in the Water Disclosure Project including information for the sites in South Africa and Germany.
Environmental legal complianceStructured environmental management processes are in place across the South African sites. The sites in Port Elizabeth, East London and Johannesburg successfully obtained ISO 14001 certification in July 2013. At FCC in Cape Town, facility upgrade capital investment projects are currently in progress and specific focus has been placed on maintaining a high level of environmental legal compliance in preparation for systems development in accordance with ISO 14001 over the next three years. The Aspen Bad Oldesloe site maintained its ISO 14001 certification and a project is currently in progress to prepare this facility for ISO 50001 energy management certification during 2014.
External environmental legal compliance audits were conducted across Aspen’s facilities during 2012. An external legal compliance follow up audit was conducted across the South African sites during August 2013 and no material issues were reported. Follow up audits were conducted by Aspen’s Group SHE Management Department during August and September 2013 at the Dandenong site in Australia, at the Shelys and Beta sites in East Africa and at Aspen’s sites in
Mexico and Brazil. The status and effectiveness of implemented corrective action plans were evaluated and the awareness around the Group’s environ-mental sustainability management objectives was increased. Facility management teams have been committed to addressing identified areas of improvement.
Stack emission surveys were conducted by independent consultants at the Port Elizabeth, East London and Johannesburg facilities during the 2013 financial year and at the Steriles facility in Port Elizabeth shortly after year-end. Levels of pollutants recorded at these sites were negligible thereby indicating that the risk of harmful and/or noxious gas emissions to the atmosphere is low.
Effluent quality across all of the Group’s manufacturing sites complied with municipal standards throughout the year and there were no incidents of non-compliance to effluent quality (2012: 1). Furthermore, there were no incidents of effluent discharge into stormwater drains (2012: zero).
Hoisting of the DQS flag in recognition of the ISO 14001 and OHSAS 18001 certification for the South African Operations sites in July 2013

page 36Sustainability Report continued
Emissions management Aspen’s 2013 CDP submission was independently reviewed and assured by ERM. This included the verification of the 2013 Scope 1 and Scope 2 emissions data as disclosed in this report and which will be included in the 2014 CDP submission.
Emissions are recorded in accordance with the Greenhouse Gas Protocol methodology and reported using the
standard international measure, carbon dioxide equivalent tons (tCO2e). Aspen’s carbon footprint is calculated using the Department of Environment, Food and Rural Affairs emissions factors as well as published territory specific local emission conversion factors. Consideration will, in future, be given to using the Intergovernmental Policy on Climate Change emissions factors if these are found to represent the Group’s emissions more accurately. This evaluation is
currently being performed in consultation with the Group’s external CDP and sustainability auditors, ERM.
Following the completion of ERM’s audit of the CDP information, recom-mendations for improvement of carbon calculator parameters have been implemented to meet global best practice standards. This resulted in a restatement of 2012 comparative emissions as follows:
Environmental management training conducted across Aspen’s manufacturing sites during the year is summarised below:
2013 ENVIRONMENTAL MANAGEMENT TRAINING
Territory Key environmental training interventions implemented
South Africa Environmental legal awareness training and training on the transport of dangerous goods was provided to employees at all South African sites in Port Elizabeth, East London and Johannesburg. Relevant training programmes are scheduled to be conducted at FCC during 2014 following the completion of the environmental baseline risk assessment process.
East Africa General safety and environmental awareness training.
Australia Hazardous substances and dangerous goods training took place. In addition, Environmental Protection Agency interactive portal and waste certificate training was also conducted. Further training requirements will be identified and implemented once the environmental baseline risk assessment process is completed during 2014.
Germany Training for handling of hazardous chemicals and environmental standard operating procedures training.
Brazil Waste management and general safety and environmental awareness training.
Mexico Hazardous waste management training, non-hazardous waste management training and materials handling training.

page 37Aspen Pharmacare Holdings LimitedSustainability Report 2013
Overview
Economic Sustainability
Social SustainabilityEnvironm
ental Sustainability
Scope 1 emissions increased by 59% to 10 744 tCO2e and Scope 2 emissions increased by 35% to 119 189 tCO2e. These increases are largely as a result of the inclusion of data for facilities in Australia contributing 3 494 tCO2e to Scope 1 emissions and 28 864 tCO2e to Scope 2 emissions. With reference to
the 2012 comparable base, Scope 1 emissions in South Africa, not included in the 2012 data, increased by 19% as a result of the inclusion of fugitive gasses from refrigerants for the Port Elizabeth and Johannesburg sites in the 2013 data (not included in 2012 data) and decreased in Germany by 5% due to a
reduction in the natural gas consumption due to varying weather conditions. Scope 2 emissions in South Africa increased by 7% owing to increased electricity usage and decreased by 78% in Germany owing to a change in energy supplier and a restatement of the emission factor for electrical power.
Scope 2Scope 1
2013
2011
2012
Group emissions (tCO2e)
10 744119 189
6 774
88 008
15 012
97 855
2013 Scope 1 emissions 10 744 tCO2e
Australia 32%
South Africa 38%
Germany 30%
Australia 24%
South Africa 75%
Germany 1%
2013 Scope 2 emissions 119 189 tCO2e
Territory
2012 data as included in the
2012 Annual Report(tCo2e)
2012 data
restated(tCo2e) % Key reasons for movements
Scope 1 18 969 6 774 (64)
South Africa 15 589 3 394 (78) Scope 1 emissions were previously erroneously calculated using theoretical volumes of refrigerants required. This was corrected and the restated data reflects only the quantity of refrigerants used during the financial year.
Germany 3 380 3 380 – No restatement required.
Scope 2 158 035 88 008 (44)
South Africa 153 437 83 410 (46) This restatement was due to an instance of double accounting – the emissions resulting from the fuel used to generate steam internally and the emissions from the steam were both previously recorded for the FCC and East London sites. This has been amended in accordance with international best practice.
Germany 4 598 4 598 – No restatement required.
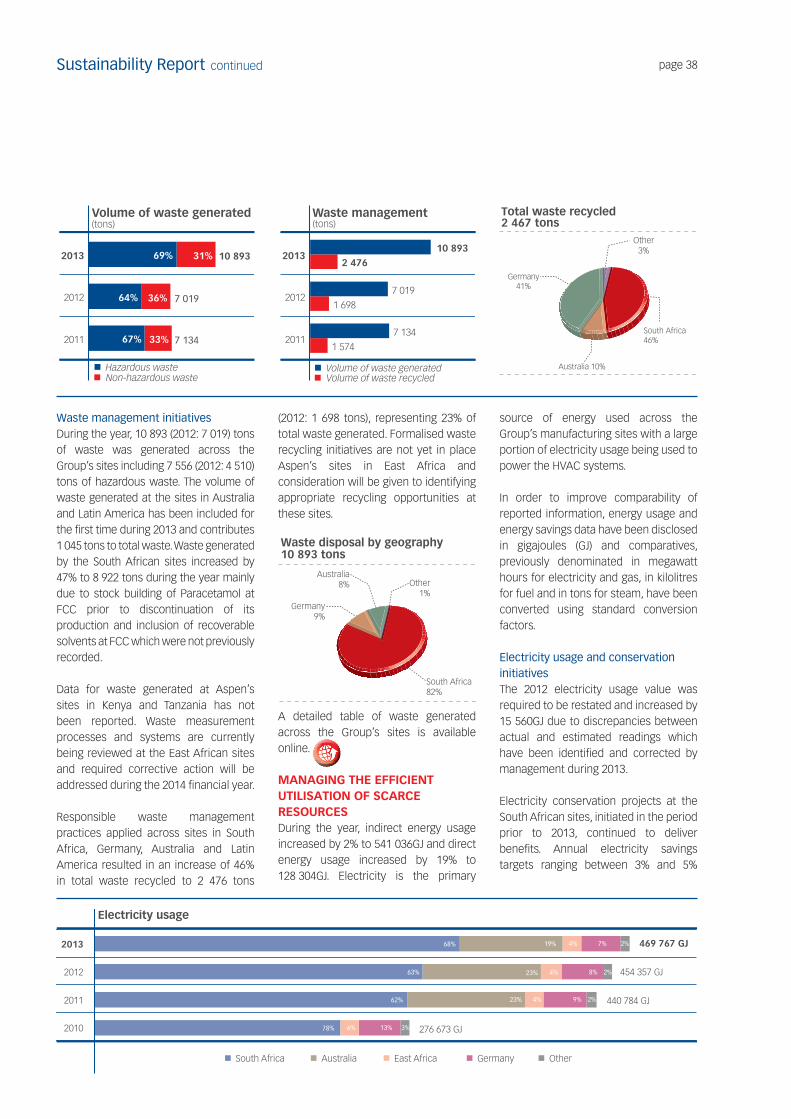
page 38Sustainability Report continued
Waste management initiativesDuring the year, 10 893 (2012: 7 019) tons of waste was generated across the Group’s sites including 7 556 (2012: 4 510) tons of hazardous waste. The volume of waste generated at the sites in Australia and Latin America has been included for the first time during 2013 and contributes 1 045 tons to total waste. Waste generated by the South African sites increased by 47% to 8 922 tons during the year mainly due to stock building of Paracetamol at FCC prior to discontinuation of its production and inclusion of recoverable solvents at FCC which were not previously recorded.
Data for waste generated at Aspen’s sites in Kenya and Tanzania has not been reported. Waste measurement processes and systems are currently being reviewed at the East African sites and required corrective action will be addressed during the 2014 financial year.
Responsible waste management practices applied across sites in South Africa, Germany, Australia and Latin America resulted in an increase of 46% in total waste recycled to 2 476 tons
(2012: 1 698 tons), representing 23% of total waste generated. Formalised waste recycling initiatives are not yet in place Aspen’s sites in East Africa and consideration will be given to identifying appropriate recycling opportunities at these sites.
Waste disposal by geography 10 893 tons
Australia 8% Other
1%
South Africa 82%
Germany 9%
A detailed table of waste generated across the Group’s sites is available online.
MANAGING THE EFFICIENT UTILISATION OF SCARCE RESOURCESDuring the year, indirect energy usage increased by 2% to 541 036GJ and direct energy usage increased by 19% to 128 304GJ. Electricity is the primary
source of energy used across the Group’s manufacturing sites with a large portion of electricity usage being used to power the HVAC systems.
In order to improve comparability of reported information, energy usage and energy savings data have been disclosed in gigajoules (GJ) and comparatives, previously denominated in megawatt hours for electricity and gas, in kilolitres for fuel and in tons for steam, have been converted using standard conversion factors.
Electricity usage and conservation initiatives The 2012 electricity usage value was required to be restated and increased by 15 560GJ due to discrepancies between actual and estimated readings which have been identified and corrected by management during 2013.
Electricity conservation projects at the South African sites, initiated in the period prior to 2013, continued to deliver benefits. Annual electricity savings targets ranging between 3% and 5%
Non-hazardous wasteHazardous waste
2013
2011
2012
Volume of waste generated
31%69%
36%64%
10 893
7 019
33%67% 7 134
(tons)Total waste recycled 2 467 tons
Other 3%
South Africa 46%
Australia 10%
Germany 41%
Volume of waste recycledVolume of waste generated
10 8932 476
7 019
1 698
7 134
1 574
2013
2011
2012
Waste management(tons)
2013
2012
2011
2010
469 767 GJ
454 357 GJ
440 784 GJ
276 673 GJ
68% 19% 4% 7% 2%
63% 23% 4% 8% 2%
62% 23% 4% 9% 2%
78% 6% 13% 3%
Electricity usage
South Africa Australia East Africa Germany Other

page 39Aspen Pharmacare Holdings LimitedSustainability Report 2013
Overview
Economic Sustainability
Social SustainabilityEnvironm
ental Sustainability
IndirectDirect
2013
2011
2012
Energy usage by source type
81%19%
83%17%
699 340GJ
622 797GJ
70%30% 631 128GJ
Energy usage by primary source669 340 GJ
Steam-purchased 11%
Gas 18%
Electricity 70%
Fuel 1%
Direct source Indirect source
were set at the Port Elizabeth, East London and Johannesburg sites and conservation projects were implemented to achieve the targets. In total, electricity consumption decreased by 3 647GJ (2012: 20 768GJ) and targets were met at the Steriles facility in Port Elizabeth and at the Nutritionals site in Johannesburg. Installation of a power factor correction at the Port Elizabeth tabletting site was delayed and hence the targeted savings were not realised.
Total electricity consumed by the Group during the year increased by 3% to 469 767GJ.
Electricity conservation projects across the South African sites will receive further focus with the appointment of a dedicated Resource Conservation Manager in the first quarter of 2014.
High efficiency light fittings replaced mercury vapour light fittings in designated sections of the Steriles facility. The installation of enthalpy controls, in addition to automated chiller controls, further improved the efficiency of the HVAC chiller systems. In total, 2 373GJ was saved at this facility. The replacement of standard light fittings with high efficiency lighting, optimisation of electricity used to power chiller systems and the installation of a standby compressor system at Aspen Nutritionals achieved a saving of 1 274GJ.
Water usage and conservation initiatives Water used across all sites is obtained from municipal sources.
The water consumption total reported for 2012 has been restated and increased by 21 761kl from 523 611kl to 545 372kl following correction of comparative data recorded for the sites in South Africa.
During 2013, the Group reduced its consumption of water by 8% to 499 715kl, mainly as a result of a 12% decrease in consumption at the South African sites. Water conservation at the Port Elizabeth sites was achieved through increased HVAC efficiencies which lead to reduced water consumption for the cooling towers and ongoing benefits realised from the recycling of rejected water from the reverse osmosis plant, a project which was implemented in the 2012 financial year. A planned decrease in production volumes at the FCC resulted in reduced water consumption at this site and contributed to the Group’s overall decrease in water consumption in 2013. Water conservation targets are in place for the Port Elizabeth and East London sites of between 3% to 5% and consideration will continue to be given to implementation of water conservation targets at other sites.
A total of 5 027kl (2012: 23 079kl) of water was saved during the year through water conservation projects initiated in 2012. At the Port Elizabeth site rejected water from the reverse osmosis plant continues to be used to supply the cooling towers and ablution blocks. Using water recirculation systems, recycled waste water at the East London site continues to be used for the cooling system. As part of continuous improvement initiatives at Aspen Nutritionals, a change in the type of pasteuriser used led to water savings. No new water conservation projects were introduced during 2013.
2013
2011
2012
2010
Water consumption trend
499 715
545 372
484 168
418 321
(Kilolitres)
Water consumption across the Group’s manufacturing facilities 499 715 kl
Australia 13%
East Africa 8%
South Africa 71%
Germany 7%
Other 1%
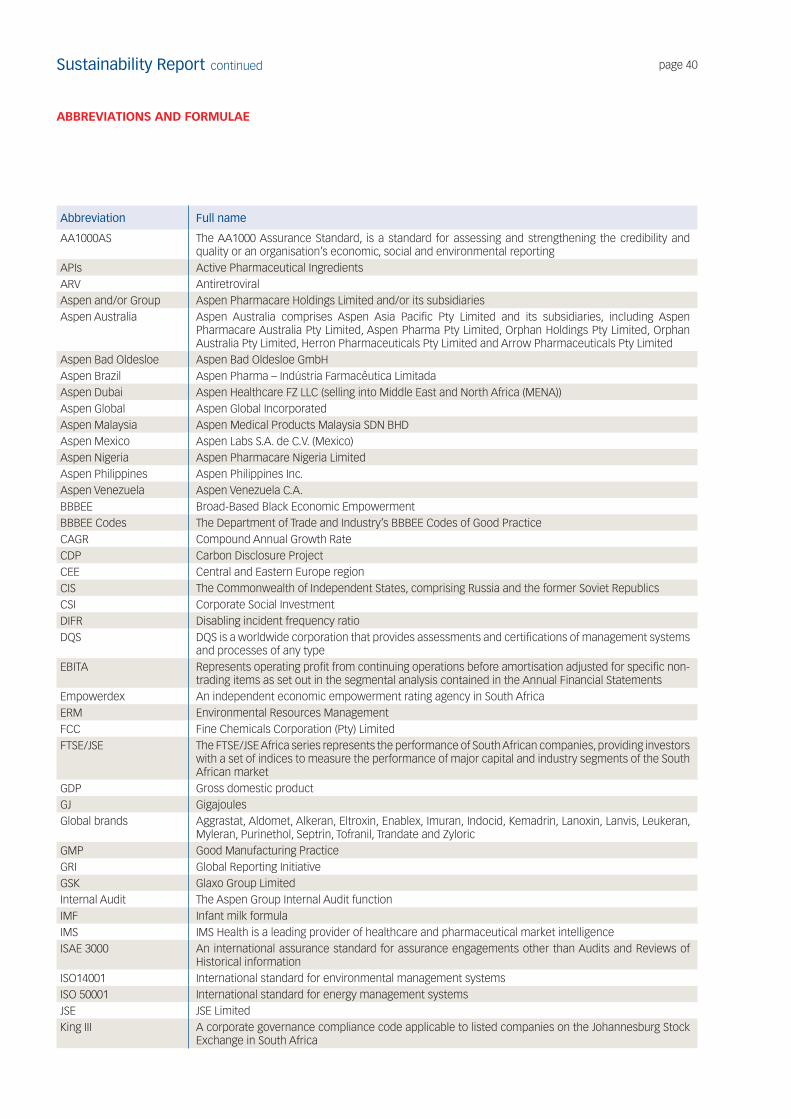
page 40Sustainability Report continued
ABBREVIATIONS AND FORMULAE
Abbreviation Full name
AA1000AS The AA1000 Assurance Standard, is a standard for assessing and strengthening the credibility and quality or an organisation’s economic, social and environmental reporting
APIs Active Pharmaceutical IngredientsARV AntiretroviralAspen and/or Group Aspen Pharmacare Holdings Limited and/or its subsidiariesAspen Australia Aspen Australia comprises Aspen Asia Pacific Pty Limited and its subsidiaries, including Aspen
Pharmacare Australia Pty Limited, Aspen Pharma Pty Limited, Orphan Holdings Pty Limited, Orphan Australia Pty Limited, Herron Pharmaceuticals Pty Limited and Arrow Pharmaceuticals Pty Limited
Aspen Bad Oldesloe Aspen Bad Oldesloe GmbHAspen Brazil Aspen Pharma – Indústria Farmacêutica LimitadaAspen Dubai Aspen Healthcare FZ LLC (selling into Middle East and North Africa (MENA))Aspen Global Aspen Global IncorporatedAspen Malaysia Aspen Medical Products Malaysia SDN BHDAspen Mexico Aspen Labs S.A. de C.V. (Mexico)Aspen Nigeria Aspen Pharmacare Nigeria LimitedAspen Philippines Aspen Philippines Inc.Aspen Venezuela Aspen Venezuela C.A.BBBEE Broad-Based Black Economic EmpowermentBBBEE Codes The Department of Trade and Industry’s BBBEE Codes of Good PracticeCAGR Compound Annual Growth RateCDP Carbon Disclosure ProjectCEE Central and Eastern Europe regionCIS The Commonwealth of Independent States, comprising Russia and the former Soviet RepublicsCSI Corporate Social InvestmentDIFR Disabling incident frequency ratioDQS DQS is a worldwide corporation that provides assessments and certifications of management systems
and processes of any typeEBITA Represents operating profit from continuing operations before amortisation adjusted for specific non-
trading items as set out in the segmental analysis contained in the Annual Financial StatementsEmpowerdex An independent economic empowerment rating agency in South AfricaERM Environmental Resources ManagementFCC Fine Chemicals Corporation (Pty) LimitedFTSE/JSE The FTSE/JSE Africa series represents the performance of South African companies, providing investors
with a set of indices to measure the performance of major capital and industry segments of the South African market
GDP Gross domestic productGJ GigajoulesGlobal brands Aggrastat, Aldomet, Alkeran, Eltroxin, Enablex, Imuran, Indocid, Kemadrin, Lanoxin, Lanvis, Leukeran,
Myleran, Purinethol, Septrin, Tofranil, Trandate and ZyloricGMP Good Manufacturing PracticeGRI Global Reporting InitiativeGSK Glaxo Group LimitedInternal Audit The Aspen Group Internal Audit functionIMF Infant milk formulaIMS IMS Health is a leading provider of healthcare and pharmaceutical market intelligenceISAE 3000 An international assurance standard for assurance engagements other than Audits and Reviews of
Historical informationISO14001 International standard for environmental management systemsISO 50001 International standard for energy management systemsJSE JSE LimitedKing III A corporate governance compliance code applicable to listed companies on the Johannesburg Stock
Exchange in South Africa

Building Number 8, Healthcare Park, Woodlands Drive, Woodmead
PO Box 1587, Gallo Manor, 2052
Telephone 011 239 6100
Telefax 011 239 6144
www.aspenpharma.com