sustainability report 2020 supplement
TRANSCRIPT

Sustainability Report 2020 SUPPLEMENT
1

2
An American company founded in 1882, Matson (NYSE: MATX) is a leading provider of ocean transportation and logistics services in and around the Pacific. Matson provides a vital lifeline to the domestic noncontiguous economies of Hawaii, Alaska and Guam, and to other island economies in Micronesia. Matson also operates premium, expedited services from China to Long Beach, California; provides service to Okinawa, Japan and various islands in the South Pacific; and operates an international export service from Dutch Harbor, Alaska to Asia. Matson Logistics, established in 1987, extends the geographic reach of Matson’s transportation network throughout North America with integrated, asset-light logistics services, including rail intermodal, highway brokerage, warehousing, freight consolidation, Asia supply chain services and forwarding to Alaska. Additional information about the company is available at matson.com.
in consolidated revenues
$2.38Bemployees in global workforce
4,149square feet of warehouse space
1.6M intermodal, rail and highway brokerage service providers in North America
with container cargo capacity of more than 36,000 twenty-foot equivalent units (TEUs), plus garage space for autos and additional rolling stock
Hawaii Service Alaska Service
Guam / Micronesia / Okinawa Service
South Paci�c Express (SPX)
South Paci�c Service
China-Auckland Express (CAX) *
China-Long Beach Express (CLX)
China-California Express (CCX) *
Partner Carrier * seasonal service
China-Long Beach Express+ (CLX+)
Alaska-Asia Express (AAX)Matson Logistics O�ces
Non-O�ce Ports of Call
Matson O�ces
Honolulu (HQ)
HAWAII
Kahului
Kawaihae Hilo
Nawiliwili
Kaunakakai
Kaumalapau
PhoenixCustomer Service Center
OaklandCorporate Office
LA/Long Beach
Anchorage
KodiakDutch Harbor
Honolulu (HQ)
MajuroKosraePohnpei
XiamenHong Kong
Ningbo
Shanghai
Saipan/Tinian/Rota
Okinawa
Guam
PalauYap
Chuuk
Brisbane
Sydney
Melbourne
Pago Pago
Aitutaki
PapeeteRarotonga
Niue
Auckland
Tacoma
Kwajalein/Ebeye
Apia
Vava ‘uLautoka
Suva
Laem Chabang
Ho Chi Minh
Dalian
Qingdao
Kaohsiung
Yokohama
Hakata
KobeBusan
Concord (HQ)
Salt Lake City
Houston
Monterrey
Mexico City
SavannahAtlanta
Philadelphia
AkronChicago
Intermodal connections throughout North America
Nuku ‘alofa
2020 FAST FACTS
connecting Honolulu and other Hawaiian Island ports
supporting our industry-leading freight forwarding service to Alaska
6 cross-dock facilities
About Matson 2
One of the top 25
to support CLX+ and AAX services
6 chartered vessels
Matson-owned ships18 Matson-owned
barges2

3
Climate Change and Greenhouse Gas Emissions
Environmental Stewardship
Climate change is the most pressing environmental challenge facing our world. We believe we have a responsibility to significantly reduce our impact on climate change by lowering our greenhouse gas (GHG) emissions.
To this end, we are nearing the completion of our Hawaii fleet renewal program, which started in 2013. Under this program, we commissioned four new state-of-the-art vessels with multiple environmental features designed to help reduce GHG emissions, allowing us to retire seven steamships that were older and less efficient. The new Kanaloa class vessels — Lurline and Matsonia — entered service in 2020 and 2021, respectively. In 2020, we also recycled two ships in U.S. facilities that comply with international ship recycling standards. We are planning to recycle the last of our steamships in 2021.
In addition to the short-term goals described above, we have established the following medium- and long-term goals that reflect Matson’s commitment and contribution to helping the world decarbonize and limit climate change.
■ Reduce Scope 1 GHG emissions from our fleet by 40% by 2030, using a 2016 baseline
We selected 2016 as the baseline year because it was the first full year following our acquisition of Horizon Lines’ Alaska operations. Our aim is to improve fleet and operational efficiency as a means to achieving this goal.
■ Achieve net zero Scope 1 GHG emissions from our fleet by 2050
This is a particularly ambitious goal. Currently, there are no commercially available carbon neutral fuels for use on ocean-going containerships nor the technologies to use such fuels or deliver them to terminals. As a member of the World Shipping Council, the Chamber of Shipping of America and the Blue Sky Maritime Coalition, Matson supports efforts to create an industry-funded R&D program to accelerate zero-carbon fuels and technologies. While transformative technology develops, Matson continues to focus on its fleet renewal programs and to retire older vessels, re-engining some ships to improve efficiency, and modernizing terminal operations.
Advocating for Alternative FuelsIn 2021, Matson, along with 16 members of the World Shipping Council, signed an open letter to the International Maritime Organization (IMO) advocating for bold action to achieve the IMO’s climate goals and proposed a new $5 billion industry-funded R&D program to accelerate zero-carbon fuels and technologies.
Matson’s Impacts
The majority of Matson’s GHG emissions are generated from the burning of fuel aboard our vessels. Our business model is based on fast, frequent shipments of critical supplies and vital goods that power local economies. When compared with competitors in our domestic tradelanes, we believe our GHG emissions are similar or even less, given the age, size and speed of our vessels. Many of our customers select Matson’s premium expedited services from China as an alternative to air freight because ocean shipping has a substantially smaller carbon footprint.
To reduce our emissions, we are focused on improving fleet and operational efficiencies. See more about these efforts on page 4.
$5B industry-funded R&D program
We intend to report our climate risks and opportunities in accordance with the Task Force on Climate-related Financial Disclosures (TCFD) recommendations in 2022.
TCFD

4
Greenhouse Gas Emissions Inventory and Energy ConsumptionIn 2020, efficiency improvements in our fleet reduced Scope 1 GHG emissions by 12% compared to the prior year.
Environmental Stewardship
23% reduction in Scope 1 GHG fleet emissions since 2016
Scope 1 Greenhouse Gas Fleet Emissions: Progress Against 2016 Baseline
2016 2017* 2018* 2019* 2020 % change from 2016-2020
% change from 2019-2020
Total Scope 1 Emissions (mt CO2e) 1,340,000 1,307,000 1,213,000 1,166,000 1,030,000 -23% -12%
CO2 (mt) 1,319,000 1,286,000 1,195,000 1,148,000 1,014,000 -23% -12%
CH4 (mt) 21 21 19 18 16 -24% -11%
N2O (mt) 76 74 69 66 58 -24% -12%
For most figures, data was rounded to the nearest thousand.
* Restated to include GHG emissions from the Matson South Pacific (“MSP”) service and correct errors in historical fuel data. While Matson previously chartered some vessels in the MSP service, Matson currently owns all MSP vessels. Accordingly, GHG emissions from MSP vessels are reported as Scope 1.
1,500,000
1,200,000
900,000
600,000
300,000
0
1,340,000 1,307,0001,213,000
1,166,000
1,030,000
2016 2017* 2018* 2019* 2020
mt C
O2e
Matson’s Climate Goals
2021 Recycle the last of our steamships
Net ZeroAchieve net zero total Scope 1 GHG emissions from our fleet by 2050
40%reduction in Scope 1 GHG emissions from our fleet by 2030
Working Toward Our Climate Goals
In working to meet our 2030 climate goal, we are evaluating and planning to pursue various approaches to increasing efficiency, which may include:
■ Applying high performance, environmentally preferred anti-fouling or friction-reducing coatings to vessel hulls, which help reduce fuel consumption by reducing drag in the water
■ Deploying new engine monitoring technology to help increase fuel efficiency
■ Adopting technology upgrades to our vessel weather routing services to help reduce fuel consumption
■ Reducing vessel speed, where possible, throughout our network
■ Converting certain vessels to operate on LNG and conventional fuels, and installing tanks that are able to accommodate future carbon neutral fuels when commercially available
■ Designing new vessels to be energy efficient, with features such as shaft generators and improved bulbous bow, hull, rudder and propeller designs
■ Using onshore electricity, whenever available, to power vessels when in port
■ Implementing more environmentally sensitive container design practices and refrigerants
■ Installing additional energy saving devices on vessels such as onboard LED lighting
Environmental Stewardship

5
Scope 2 Greenhouse Gas Emissions Energy Use
2017* 2018* 2019* 20201 2017* 2018* 2019* 2020
Scope 2 GHG emissions include vessel shore power at the Ports of Long Beach and Oakland, California. Shore power is currently not available outside of California.
* Restated to correct power draw data and utility carbon intensity factors.
1 In the second quarter of 2020, the Pacific Merchant Shipping Association began purchasing renewable energy certificates on behalf of Matson to offset Scope 2 emissions from shore power. Figures are based on previous year estimates for public power grid emissions factors as the 2020 data has not yet been published by local utilities.
2017* 2018* 2019* 2020 % change from 2019-2020
Total Energy Consumed (GJ) 16,744,000 15,561,000 14,970,000 13,269,000 -11%
Heavy Fuel Oil 15,619,000 14,195,000 13,004,000 10,814,000 -17%
Marine Gas Oil/Diesel 1,108,000 1,349,000 1,948,000 2,436,000 25%
Electricity (shore power) 17,000 17,000 18,000 19,000 6%
For most figures, data was rounded to the nearest thousand. * Restated to include fuel used in the MSP service and correct errors in historical fuel data.
1,200
1,000
800
600
400
200
0
20,000,000
15,000,000
10,000,000
5,000,000
0
mt C
O2e
GJ
1,030904
818
180
16,744,00015,561,000 14,970,000
13,269,000
Environmental Stewardship
CLX+ Service Scope 3 Greenhouse Gas Emissions
In May 2020, in response to the overwhelming demand resulting from the COVID-19 pandemic, Matson introduced the CLX+ service as a second expedited ocean service from China to the U.S. West Coast. The CLX+ service is currently supported by six chartered vessels. Because Matson does not own the vessels, the emissions attributed to these vessels fall within Scope 3. We are actively engaging with the owners of the vessels to evaluate ways to reduce their emissions.
Matson has not yet completed a full accounting of all of its Scope 3 GHG emissions. However, we began measuring CLX+ emissions when we introduced the service. Going forward, we plan to continue reporting CLX+ emissions and expect to expand our Scope 3 reporting.
May – Dec. 2020
Total CLX+ Scope 3 Emissions (mt CO2e) 271,000
CO2 (mt) 267,000
CH4 (mt) 4
N2O (mt) 15
For most figures, data was rounded to the nearest thousand.
812
632 mt CO2e offset by renewable energy certificates
5

6
Air EmissionsIn addition to contributing to climate change, emissions from the combustion of fuel oil that powers marine vessels can have a negative impact on the environment and human health. To improve air quality, the IMO introduced regulations effective January 1, 2020 that generally require all vessels to burn low-sulfur fuel oil or install technologies that limit sulfur oxide (SOx) emissions. Matson uses a combination of exhaust gas cleaning systems, or "scrubbers," and low-sulfur fuels to achieve or exceed the improvements required by these regulations. Matson’s two new Kanaloa class ships have Tier 3 engines, which have 80% lower nitrogen oxides (NOx) emissions than Tier 1 engines, making them among the lowest-emitting vessels to regularly call the U.S. West Coast. Additionally, Matson’s U.S.-flagged ships comply with designated IMO Emission Control Areas in North America.
All of these investments have helped to reduce our air emissions. In 2020, each type of air emissions from our fleet decreased by at least 9% compared to the prior year.
2017* 2018* 2019* 2020% change from
2019-2020
Nitrogen oxides – NOx (excluding N2O) 36,600 33,900 31,900 26,700 -16%
Sulfur oxides – SOx 16,300 14,600 11,500 2,000 -83%1
Particulate matter – PM10 2,500 2,300 2,000 900 -55%1
Volatile organic compounds – VOCs 1,300 1,200 1,100 1,000 -9%
Black carbon 110 103 101 91 -10%
For most figures, data was rounded to the nearest hundred.
* Restated to include emissions from the MSP service, correct errors in historical fuel data, and account for more precise measures of sulfur fuel content and PM and NOx emissions factors. 1 Decrease due primarily to use of scrubbers and low-sulfur fuels.
Air Emissions (mt)
83% reduction in SOx
since 2019
55% reduction in
particulate matter since 2019
Matson’s Kanaloa class ships are among the lowest-emitting vessels to regularly call the U.S. West Coast
Environmental Stewardship

7
Ocean Health and Biodiversity
We navigate some of the world’s most pristine marine environments and work to minimize any negative impacts on ocean health. We strive to have zero significant spills, which we define as more than one barrel of oil or another hazardous substance. In 2020, we had zero significant spills. Should a spill occur, we have response plans and procedures in place that are designed to reduce the environmental impact.
We also use vessel ballast water management systems to filter and treat ballast water before discharging it back into the ocean in order to prevent the spread of invasive species. We installed ballast water management systems on three additional vessels in 2020 for a total of 13.
ships responsibly recycled in the U.S.2
Matson’s policy on ship recycling protects worker safety and the environment by requiring that our ships be recycled in facilities that meet stringent U.S. regulatory standards or similar standards in international conventions. Matson inspects and monitors ship recycling facilities for adherence to this policy.
Ship Recycling
Environmental Stewardship 7
13 vessels
with active ballast water management systems
resulting in significant harm to the environment
0 spills
8People & Places
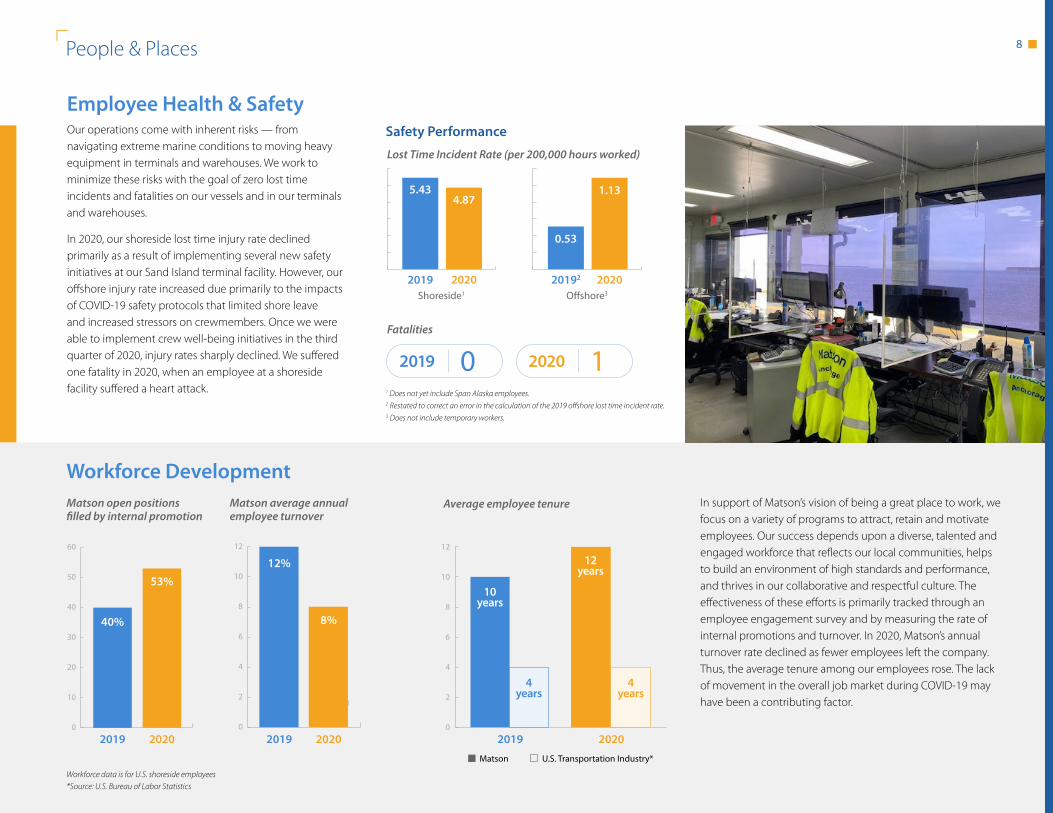
Employee Health & SafetyOur operations come with inherent risks — from navigating extreme marine conditions to moving heavy equipment in terminals and warehouses. We work to minimize these risks with the goal of zero lost time incidents and fatalities on our vessels and in our terminals and warehouses.
In 2020, our shoreside lost time injury rate declined primarily as a result of implementing several new safety initiatives at our Sand Island terminal facility. However, our offshore injury rate increased due primarily to the impacts of COVID-19 safety protocols that limited shore leave and increased stressors on crewmembers. Once we were able to implement crew well-being initiatives in the third quarter of 2020, injury rates sharply declined. We suffered one fatality in 2020, when an employee at a shoreside facility suffered a heart attack.
Safety Performance
1 Does not yet include Span Alaska employees. 2 Restated to correct an error in the calculation of the 2019 offshore lost time incident rate. 3 Does not include temporary workers.
2019 2020 20192 2020
Lost Time Incident Rate (per 200,000 hours worked)
Shoreside1 Offshore3
5.434.87
0.53
1.13
Fatalities
2019 0 2020 1
In support of Matson’s vision of being a great place to work, we focus on a variety of programs to attract, retain and motivate employees. Our success depends upon a diverse, talented and engaged workforce that reflects our local communities, helps to build an environment of high standards and performance, and thrives in our collaborative and respectful culture. The effectiveness of these efforts is primarily tracked through an employee engagement survey and by measuring the rate of internal promotions and turnover. In 2020, Matson’s annual turnover rate declined as fewer employees left the company. Thus, the average tenure among our employees rose. The lack of movement in the overall job market during COVID-19 may have been a contributing factor.
0
10
20
30
40
50
60
Matson open positions filled by internal promotion
2019 2020
Workforce Development
40%
53%
0
2
4
6
8
10
12
Average employee tenure
2019 20200
2
4
6
8
10
12
Matson average annual employee turnover
2019 2020
12%
8%
Matson U.S. Transportation Industry*
4 years
4 years
10 years
12 years
Workforce data is for U.S. shoreside employees *Source: U.S. Bureau of Labor Statistics

9People & Places
Matson's Global Workforce
96.9% U.S. based
71.2% Unionized
4,149 Total employees
19.1% Women
2020
Breakdown by Race 2019 2020
White 50.8% 51.0%
Minorities 49.2% 49.0%
American Indian or Alaska Native 6.4% 6.3%
Asian 36.2% 35.4%
Black or African American 9.3% 8.9%
Hispanic or Latino 16.5% 17.3%
Native Hawaiian or other Pacific Islander 18.3% 18.6%
Two or more races 13.3% 13.5%
48.4 average age of employees in 2020
Diversity, Equity & InclusionWe are committed to improving diversity, providing equal pay for equal work and fostering an inclusive culture. In 2020, we continued to advance efforts to improve diversity, equity and inclusion at Matson. This included analyzing pay among various employee groups to confirm gender and racial pay equity across the company; developing and implementing unconscious bias trainings; hiring and promoting women and minorities into upper levels of management; and supporting programs intended to help build a diverse talent pool for Matson and our industry.
Matson's U.S. Shoreside Workforce
Figures include seagoing and shoreside personnel

10
Matson's U.S. Shoreside Workforce (continued)
Gender
Matson
Women Men
29.1% 70.9%
U.S. Transportation Industry*
Women Men
24.8% 75.2%
2019
Matson U.S. Transportation Industry*
2020
Women Men
28.5% 71.5%
Women Men
24.6% 75.4%
* Source: U.S. Bureau of Labor Statistics
People & Places
Diversity, Equity & Inclusion
2019
Management Positions - Gender
65.7% men
34.3% women
82.7% men
17.3% women
60.2% white
39.8% minorities
85.1% white
14.9% minorities
2020
66.1% men
33.9% women
78.7% men
21.3% women
U.S. Transportation Industry*
57.3% white
42.7% minorities
79.3% white
20.7% minorities
Matson U.S. Transportation Industry*Matson
Management Positions - Race
U.S. Transportation Industry*Matson U.S. Transportation Industry*Matson

11
Community LifelineOur ships carry essential cargo to many communities that rely on us to deliver the necessities of everyday life. We understand the important role we play and the need for our ships to consistently and reliably arrive on time. In 2020, any delays we did experience were due primarily to terminal congestion, weather and vessel maintenance.
2020 On-Time Performance (arrivals within 24 hours of schedule)
Tradelane On-Time Performance
Hawaii 98%
Guam 92%
China/Long Beach 90%
Alaska 97%
Okinawa 88%
People & Places

12
$3.52M invested in communities
$1.44M cash contributions
2020 Giving
$173,500 company and employee contributions to food banks and meal programs
$5M value of shipping services committed to support food banks in Hawaii, Alaska and Guam through 2023
In 2020, the COVID-19 pandemic dramatically altered our long-standing community giving programs. We significantly increased utilization of in-kind services while temporarily halting our participation in and support for in-person fundraising, charitable and volunteer events, including our environmental programs, Ka Ipu Aina and Adahi I Tano. Instead, we targeted more of our support to essential social safety nets such as food banks, meal programs and health and human services. We also initiated a new social justice giving program.
Community Giving
758 community organizations supported
$211K employee matching gifts
45% year-over-year increase in contributions of in-kind shipping and equipment
$100,000 invested in 10 employee-selected community racial equity programs
People & Places
Supporting COVID-19 Relief and Racial Justice
Sample material transported by Matson for a community waste- to-energy project

13
Board GovernanceIn 2020, we amended our Corporate Governance Guidelines to specify that the Matson Board of Directors is responsible for overseeing sustainability matters relevant to the company’s business, including environmental, social and governance matters. Our Board members represent the communities we serve and bring their diverse backgrounds and perspectives to the table, which we believe makes the Board well positioned to address these topics.
43% of directors are women
71% identify as racially or ethnically diverse
* For comparison, the average U.S. ratio between CEO pay and median employee pay in 2020 was 351:1. Source: Economic Policy Institute, 2021
Economic ImpactWhen we move cargo, we power local economies, delivering the supplies that are the lifeblood of many small businesses. We are also a long-time employer in many local communities, offering secure job opportunities, and we partner with local vendors to support our operations. In 2020, we offered competitive pay and benefits to shoreside employees throughout local communities in Hawaii, Alaska and Guam.
$166M annual compensation for shoreside employees in Hawaii, Alaska and Guam
1,279 Matson's CEO pay to median employee pay ratio*
47:1 shoreside employees in Hawaii, Alaska and Guam
Corporate Integrity
Safe & Resilient OperationsWe are committed to maintaining the safety and resiliency of our operations in order to prevent any serious marine incident that could disrupt our service. In 2020, we had zero serious marine incidents as defined by the U.S. Coast Guard.
0 serious marine incidents

14
This document is a supplement to Matson’s 2019-2020 Sustainability Report and provides updates on 2020 data. For more context on Matson’s environmental, social and governance (ESG) strategy and initiatives, please see the 2019-2020 Sustainability Report. Additional information can also be found in the 2019-2020 GRI and SASB Index. Our next annual Sustainability Report will be published in 2022.
Matson is responsible for the preparation and integrity of the information in this document. Subject matter experts, company leadership and the Board of Directors have reviewed and approved the content and data.
The 2020 Supplement was published in November 2021.
Unless otherwise noted, activities and performance data described in this document cover Matson, Inc. and its subsidiaries, but do not cover SSA Terminals, LLC — a joint venture between Matson Ventures, Inc., a wholly owned subsidiary of Matson, and SSA Ventures, Inc., a subsidiary of Carrix, Inc.
Matson contracts with union labor. As these employees are subject to separate union contracts, employee figures represent non-bargaining, U.S.-based employees only, unless otherwise noted.
We welcome feedback on our sustainability performance and reporting. Please send questions or comments to [email protected]. Additional information can be found at www.matson.com/sustainability.
Forward-Looking Statements and Other Important Legal Information
Website references are provided for convenience only. The content on the referenced third-party websites is not incorporated by reference into this document, nor does it constitute a part of this document. Matson assumes no liability for the content contained on the referenced third-party websites.
This document contains statements reflecting our views about our future performance that constitute “forward-looking statements” within the meaning of the Private Securities Litigation Reform Act of 1995. Forward-looking statements are generally identified through the inclusion of words such as “anticipate,” “believe,” “estimate,” “expect,” “goal,” “may,” “plan,” “commit,” target,” and “will,” or similar statements or variations of such terms and other similar expressions. The forward-looking statements in this document concern the company’s goals, progress or expectations with respect to corporate responsibility, sustainability, employees, environmental matters, policy, procurement, and business risks and opportunities. Forward-looking statements inherently involve risks and uncertainties that could cause actual results to differ materially from those predicted in such statements, such as the availability and cost of carbon neutral fuels and technologies and the ability of our suppliers and partners to meet our sustainability standards. Forward-looking statements are also aspirational and not guarantees or promises that goals or targets will be met. For example, these statements reflect our current business plans, and our ability to achieve our goals and targets may be impacted by changes in demand for our services or, in some cases, we may determine to adjust our goals and targets or establish new ones to reflect changes in our business. The company undertakes no obligation to update any forward-looking statements, whether as a result of new information, future events, or otherwise.
In addition, historical, current and forward-looking sustainability-related statements may be based on standards for measuring progress that are still developing, internal controls and processes that continue to evolve and assumptions that are subject to change in the future.
Issues identified as material for purposes of, and information otherwise included in, this document may not be considered material for Securities and Exchange Commission (SEC) reporting purposes. The term “material” used in the context of this document is distinct from, and should not be confused with, such term as used in the context of our SEC reporting.
About the 2020 Supplement
Delivery of new electric cranes to Matson's Sand Island terminal in Honolulu.