sustainability report sustainability ... - adani green energy · sustainability report of adani...
TRANSCRIPT

Sustainability Report 2015-16Executive Summary
1
SUSTAINABILITY REPORT 2015-16

Sustainability Report 2015-16Executive Summary
The Lighthouse (CEO Speaks)
Dear Stakeholders,
It is my pleasure to present the second Sustainability Report of Adani Power Limited. The report discloses our sustainability performance on triple bottom line for FY 2015-16. As India’s largest private power producer, we acknowledge our responsibility in achieving sustainable growth. This report is a testimony of our efforts in doing so during the reporting year, and also presents a way forward.
The Government has continuously emphasised ensuring electricity availability for all. Keeping this guidance in mind, we hope to build on our existing asset base of 10,480MW and reach 20,000MW of installed capacity by year 2020.
During the reporting year, we generated 69.39 billion units of power, an increase of 27% over the previous year. We are pleased to report a consolidated net profit of `4.88 billion for the financial year. We contribute nearly 15% of India’s total coal-based power generation capacity in
for the second consecutive year. We have started the creation of an additional water reservoir within the Tiroda plant to mitigate such risks.
In line with the target for surface water consumption of 2.5 m3/MWh for hinterland power plants, we are on course to achieve the same at Tiroda and Kawai and we look forward to improve our performance on this front. Additionally, this year onwards, we target to cap sea water drawl at 9.5 m3/MWh at Mundra which uses sea water based FGD and at 6 m3/MWh at Udupi which uses lime based FGD.
We are saddened to report 1 fatality at Udupi Plant during the reporting year and a mishap on 20th April 2016, which resulted in a loss of 8 lives at the Mundra plant. Such incidents are reminders that our business involves safety risks which need strong mechanisms for ensuring safer working conditions. As we join the bereaved families in their grief, we aggressively renew our efforts towards eliminating any such possibility in the future by engaging DuPont as our partner to support our ‘Zero Harm’ objective.
Much of our strength is attributable to our employees, with an average age of 33.81 years, which gives us a competitive advantage to cultivate leaderships within the organisation to meet our growth plans.
We continue to partner with Adani Foundation to implement Corporate Social Responsibility initiatives under the core areas of education, sustainable livelihood, community healthcare and rural infrastructure development.
Vneet S. Jaain
the private sector. Critical aspects continue to be better returns to shareholders, fulfilling our obligations under power sale agreements, uninterrupted domestic coal supply, water availability, safety in operations and land acquisition for new projects.
Under the Indo-Bangla Friendship Treaty of 2010, we are developing a 1,600MW power plant in state of Jharkhand to supply power to Bangladesh. We have obtained the Terms of Reference for environment clearances from Ministry of Environment, Forest and Climate Change (MoEFCC) and the Government of India and signed an in-principle Memorandum of Understanding (MoU) with Government of Jharkhand. After successful acquisition of our Udupi Power Plant, we are also expanding in Udupi by 1,600MW, for which an MoU has been signed with the Government of Karnataka, with land acquisition and environmental clearances underway.
In FY 2016-17, Tiroda plant suffered a generation loss for over a month due to drought conditions sweeping Maharashtra
Climate change concerns are pushing for innovation and upgradation of technology for power plants.
Accordingly, we are exploring efficient 800MW ultra-supercritical technology units to fulfil our expansion goals. Our direct GHG emissions sustained at 0.87 tCO2/MWh despite adding two sub-critical units of 600MW. We are also comforted that dedicated efforts are underway within our Group to incorporate renewables as a significant portfolio.
Our group has also forayed aggressively in the renewable energy sector with solar power projects and manufacturing of solar PV cells and modules. With the addition of Bitta Solar Plant of 40MWp in Adani Power, we have also contributed to our group strategy.
There has been a thrust by our Government towards effective ash utilisation from power plants, primarily within a 300km radius from the plants.
Our efforts have led to increased ash utilisation of 72.7% in the reporting year compared with 63.7% during the previous year.
Our sustainability journey so far has been a path of self-discovery and an enriching experience to achieve higher standards in reporting. I express my sincere gratitude to all those who contributed in this journey. We look forward to your continued feedback to improve our sustainability performance.
Jai Hind
Vneet S. JaainChief Executive Officer
For over a decade, Adani Power has energised India and fuelled development across the nation. As India’s largest private power producer, we are conscious of the impact we have on the country’s progress and the day-to-day lives of our fellow citizens. This not only makes us proud but also helps shape a brighter tomorrow.
In a multi-faceted, challenging and increasingly interconnected world, it is imperative to balance the impact of business activities. Flourishing in such a climate requires focus, dedication, tenacity and awareness. Our understanding and respect for the environment we operate in, pushes us towards a quest for the socio-economic well-being of the habitat and communities we occupy.
Consequently, showcasing greater transparency, setting higher standards of accountability and developing newer ways to operate responsibly, are integral to our growth. At the heart of our goals is a deep commitment to the happiness of our employees and stakeholders. We consistently strive to ensure a healthy and sustainable collaboration that contributes to rapid and responsible national development.
Considering this, we have developed our second Sustainability Report around the idea of a bigger, better and brighter tomorrow. ‘QUEST’ is a part of our journey towards excellence. The term ‘QUEST’ stands for ‘Quality, Environment Protection & Energy Conservation, Safety and Security in Totality.’
The Quest For A Brighter Tomorrow

Adani Power Limited
2
Sustainability Report 2015-16Executive Summary
3
Dear Readers,
Through this report we wish to highlight our Economic, Social and Environment performance for the FY 2015-16.
The report is developed as per the Global Reporting Initiative’s (GRI) G4 Guidelines. The report content has been guided by Sustainability Context, Stakeholder Inclusiveness, Materiality and Completeness.
We intend to publish our Sustainability Report on an annual basis.
This year, we analysed the global megatrends to determine the sustainability context of our power business and in the process identified rapid depletion of natural resources, energy security, waste management and climate change. Based on the megatrends and stakeholder engagement inputs we have also included two new stakeholders i.e. Investors and Customers. Further, considering the stakeholder inputs, we revisited our material aspects and the aspect boundary within and outside the organisation to map our report with National Voluntary Guidelines (NVG) on Social, Environmental and Economic Responsibilities by Ministry of Corporate Affairs, Government of India. Besides, we are also mapping our report with Sustainable Development Goals (SDG) and UN Global Compact Principles. Our materiality and management disclosures in this report also address relevant requirements of IFC
Our direct GHG emissions sustained at 0.87 tCO2/MWh despite adding two sub-critical units of 600MW.
About the Report (From the CSO’s Desk)
Santosh Kumar Singh
performance standards for Environment and Social Sustainability and mapped with the same. We shall continue to revisit our materiality time to time and enlarge reporting scope and mapping with other standards and UN Global Compact Principles on issues material to us.
As a policy we seek external assurance to disclosures in public domain and we have retained DNV GL Business Assurance India Private Limited to carry out an independent assurance of our report based on AA1000AS.
Report Coverage We consider environmental sustainability as paramount to our operations since power plants are generally known to create environmental impact across its lifecycle.
In order to strengthen our human resource capabilities to prepare for upcoming projects, we have developed a Centre of Excellence for Human Resources to offer support in creation of talent pipeline, employee engagement, learning and development.
We invite you to read our report and appreciate your feedback to help us improve our report. You may write to us on [email protected].
Santosh Kumar Singh Chief Sustainability Officer
Our Legacy scale of our ambitions, speed of execution and quality of operations and responding to challenges in a timely and effective manner. We have deep faith in the capability of our employees and other stakeholders and consistently empower them to deliver results that matter to our business and to the nation.
Motivated to support India’s growing infrastructure and economy, Adani Power Limited has built a significantly large portfolio in thermal power generation. Our Mundra power plant is among the world’s top 10 largest single-location thermal power plants with a capacity of 4,620MW.
We aim to be known for offering value to our stakeholders while maintaining the
Our Story
Adani Power Limited is India’s largest private sector power producer.
We began our journey in 2006. From the first day of commissioning the first 330MW unit in Mundra, we have now surged to 10,480MW across five locations, including a solar plant at Bitta. We are focused on achieving sustainable growth and becoming a globally-admired leader in integrated
infrastructure businesses with a deep commitment to nation building.
We are Passionate, Result-oriented, Integrated, Dedicated and Entrepreneurial. It has been our proactive concern to retain focus on ensuring minimum impact with maximum output as we set sail towards a 20,000MW target by 2020.
Adani Power Limited
4 5
Sustainability Report 2015-16Executive Summary
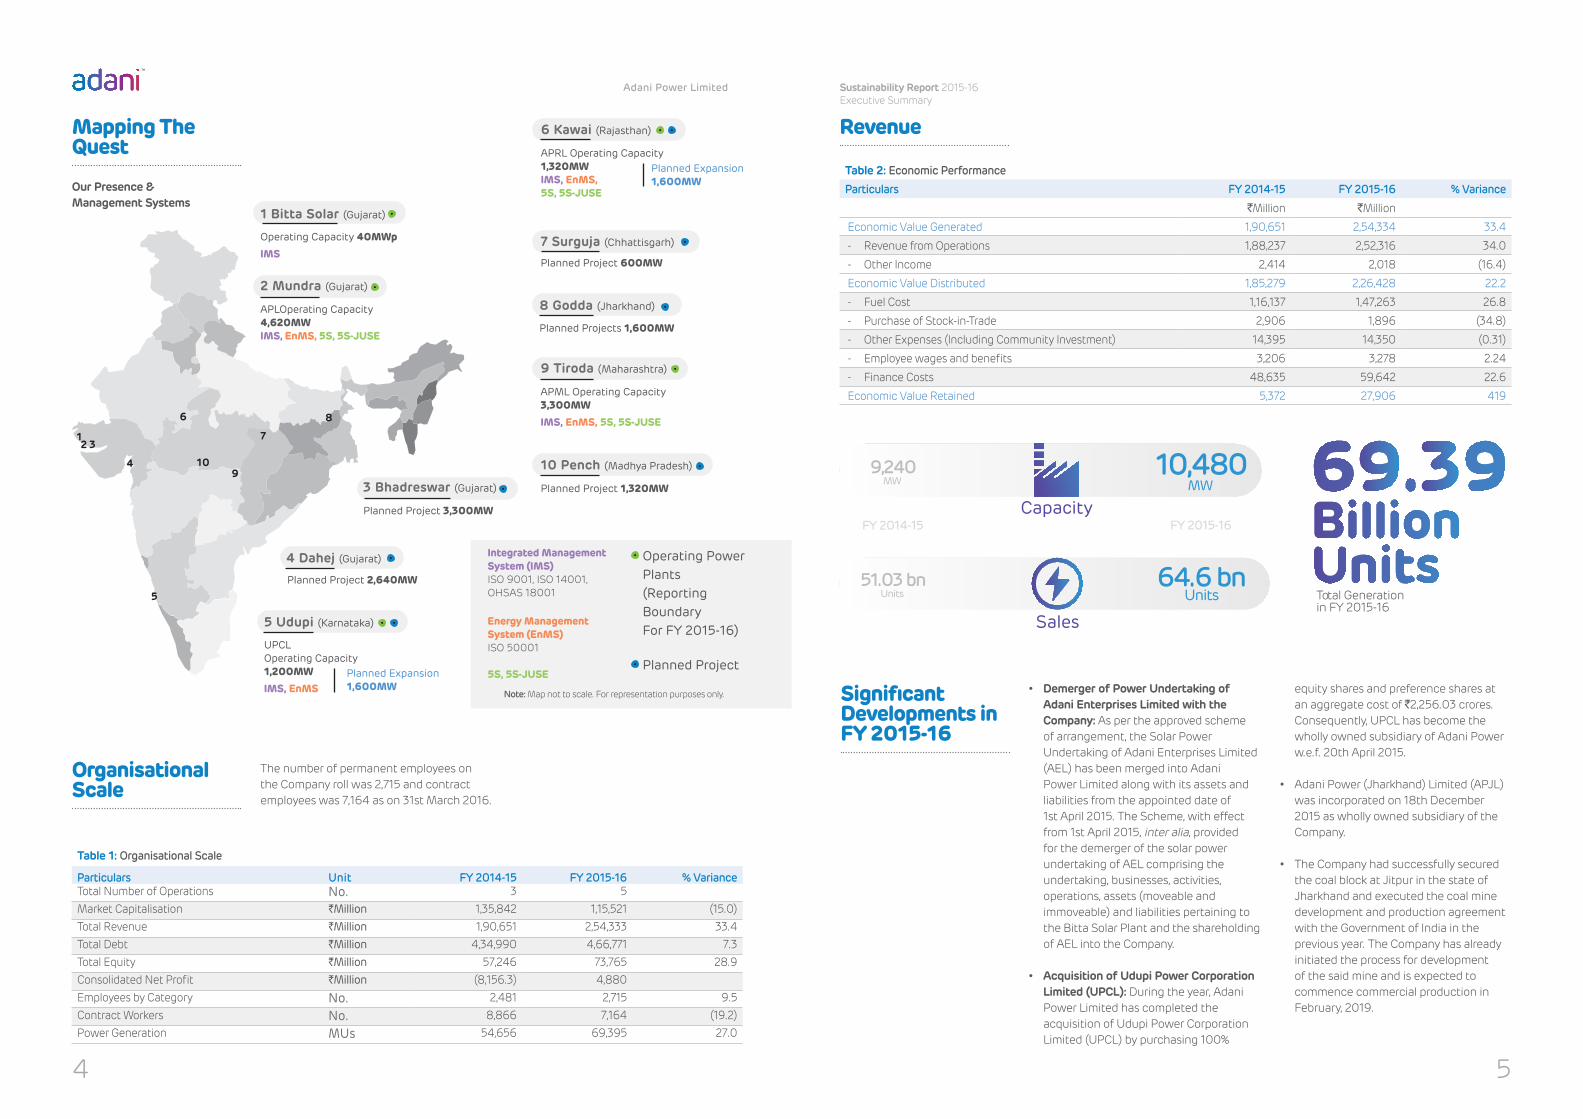
Mapping The Quest
Note: Map not to scale. For representation purposes only.
Operating Power Plants (Reporting Boundary For FY 2015-16)
Planned Project
Integrated Management System (IMS) ISO 9001, ISO 14001, OHSAS 18001
Energy Management System (EnMS) ISO 50001
5S, 5S-JUSE
Our Presence & Management Systems
1 Bitta Solar (Gujarat)
Operating Capacity 40MWp
IMS
2 Mundra (Gujarat)
APLOperating Capacity 4,620MWIMS, EnMS, 5S, 5S-JUSE
3 Bhadreswar (Gujarat)
Planned Project 3,300MW
4 Dahej (Gujarat)
Planned Project 2,640MW
5 Udupi (Karnataka)
UPCLOperating Capacity 1,200MW
IMS, EnMSPlanned Expansion 1,600MW
6 Kawai (Rajasthan)
APRL Operating Capacity 1,320MWIMS, EnMS, 5S, 5S-JUSE
Planned Expansion 1,600MW
Planned Project 600MW
8 Godda (Jharkhand)
Planned Projects 1,600MW
9 Tiroda (Maharashtra)
APML Operating Capacity 3,300MW
IMS, EnMS, 5S, 5S-JUSE
10 Pench (Madhya Pradesh)
Planned Project 1,320MW
Organisational Scale
Table 1: Organisational Scale
Particulars Unit FY 2014-15 FY 2015-16 % VarianceTotal Number of Operations No. 3 5Market Capitalisation `Million 1,35,842 1,15,521 (15.0)Total Revenue `Million 1,90,651 2,54,333 33.4Total Debt `Million 4,34,990 4,66,771 7.3Total Equity `Million 57,246 73,765 28.9Consolidated Net Profit `Million (8,156.3) 4,880Employees by Category No. 2,481 2,715 9.5Contract Workers No. 8,866 7,164 (19.2)Power Generation MUs 54,656 69,395 27.0
The number of permanent employees on the Company roll was 2,715 and contract employees was 7,164 as on 31st March 2016.
Table 2: Economic Performance
Particulars FY 2014-15 FY 2015-16 % Variance
`Million `Million
Economic Value Generated 1,90,651 2,54,334 33.4
- Revenue from Operations 1,88,237 2,52,316 34.0
- Other Income 2,414 2,018 (16.4)
Economic Value Distributed 1,85,279 2,26,428 22.2
- Fuel Cost 1,16,137 1,47,263 26.8
- Purchase of Stock-in-Trade 2,906 1,896 (34.8)
- Other Expenses (Including Community Investment) 14,395 14,350 (0.31)
- Employee wages and benefits 3,206 3,278 2.24
- Finance Costs 48,635 59,642 22.6
Economic Value Retained 5,372 27,906 419
Revenue
Total Generationin FY 2015-16
9,240MW
10,480MW
51.03 bnUnits
FY 2014-15 FY 2015-16
64.6 bnUnits
Sales
Capacity
Significant Developments in FY 2015-16
• Demerger of Power Undertaking of Adani Enterprises Limited with the Company: As per the approved scheme of arrangement, the Solar Power Undertaking of Adani Enterprises Limited (AEL) has been merged into Adani Power Limited along with its assets and liabilities from the appointed date of 1st April 2015. The Scheme, with effect from 1st April 2015, inter alia, provided for the demerger of the solar power undertaking of AEL comprising the undertaking, businesses, activities, operations, assets (moveable and immoveable) and liabilities pertaining to the Bitta Solar Plant and the shareholding of AEL into the Company.
• Acquisition of Udupi Power Corporation Limited (UPCL): During the year, Adani Power Limited has completed the acquisition of Udupi Power Corporation Limited (UPCL) by purchasing 100%
equity shares and preference shares at an aggregate cost of ̀ 2,256.03 crores. Consequently, UPCL has become the wholly owned subsidiary of Adani Power w.e.f. 20th April 2015.
• Adani Power (Jharkhand) Limited (APJL) was incorporated on 18th December 2015 as wholly owned subsidiary of the Company.
• The Company had successfully secured the coal block at Jitpur in the state of Jharkhand and executed the coal mine development and production agreement with the Government of India in the previous year. The Company has already initiated the process for development of the said mine and is expected to commence commercial production in February, 2019.
1
7 Surguja (Chhattisgarh)
2 3
4
5
6
7
8
910

Adani Power Limited
6 7
Sustainability Report 2015-16Executive Summary
Identifying Risks and Opportunities
A standard 3–step approach has been defined for risk management:
1) Risk Identification2) Risk Assessment and Prioritisation3) Risk Mitigation
Power Sales In FY 2015-16, the spot power market remained vibrant with over 34 billion units traded in power exchange, 21% over 28 billion units traded in the last financial year. Average price realised over electricity transacted in power exchanges declined by 20% in the reporting year to about ̀ 2.46/unit compared with ̀ 3.07/unit in the last financial year. This was mainly on account
Coal Production Outlook
Coal India (CIL) is the single largest producer of dry fuel in the world and the government has set a target of doubling its production
to 1 billion tonnes by 2020. Implementation of these decisions shall be a key factor affecting project performance.
of an increase in merchant capacity. We have strategically sold almost 85% of the net capacity under long-term PPAs.
Also, on account of the APTEL order on the Compensation Tariff (CT) matter, the Company has recognised CT considering the same as relief under force majeure under respective PPAs.
Our risk management framework is based on proactive identification, assessment and mitigation measures to reduce the potential negative impact.
Table 3: List of Identifed Stakeholders and Engagement Details
Engagement Methods Key Concerns Our ResponseFrequency of Engagement
Employees
Direct interaction, Feedback questionnaire, Newsletter, magazines and emails, Employee engagement events
Work Environment, Health and Safety, Energy Efficiency, Talent Management
Initiatives to improve work environment, Safety management systems, Energy efficiency initiatives, Employee training and development
Ongoing
Contractual Workforce
Open forum, Interviews Work environment, Health and Safety, Training and skill development, Grievance handling
Initiatives to improve work environment, Safety trainings and promotional events, Grievance redressal mechanism
Ongoing
Engagement Methods Key Concerns Our ResponseFrequency of Engagement
Local Communities
Direct interaction with project beneficiaries and community based organisations, Interviews with local community representatives
Water availability, Local employment, School education, Community healthcare facilities, Vocational skill development
Infrastructure and sanitation related projects, Local hiring where possible, Woman empowerment programmes, Education programmes including adoption of Government schools, computer literacy and teacher orientation, Community health programmes, Mobile Health Care Units, Livelihood generation programmes, Local hiring where possible
Regular and need-based
Government / Regulatory
Direct interaction on a case-to-case basis, policy advocacy through industry bodies, response to information sought, routine filing of reports, regulatory audits and inspections
Compliance, revenue & taxes, community development.
Compliance monitoring and management, payment of statutory levies, submission of reports and other related information, CSR initiatives
Regular and need-based
Investor
Investor meets, AGMs, meeting with bankers and other financial institutions, periodic declaration of results
Company’s Sustainability performance, growth opportunities, debt servicing
Prudent financial management system and reporting.
Quarterly basis and on specific need-based
Customer
Direct communication with existing and new customers through various media, binding agreements including PPAs, through power exchanges
Plant availability, transmission availability, forced outages, reconciliation of accounts, settlements including change in law
Power generation planning and scheduling, timely and proactive communication on reconciliation and settlements, responses to queries, proactive settlements
Regular and need-based
Media & NGO
Telephone interviews, In-person interviews, Regulatory Authorities, Telephonic Interviews, Personal Interviews
Local community development, Health and Safety, Legal compliances, Environment protection, Health and Safety, Ash management
Investment in Education Infrastructure, Integration of management systems including environmental, energy and OH&S, Best available technology implementation, Compliance with applicable regulations, Initiatives for improvement in ash utilisation
Issue-based
Vendors (Suppliers and Contractors)
On-boarding process, Site visits to manufacturing facilities for compliance monitoring, Regular one-on-one interaction for compliance monitoring
Timelines for payments Payment cycle changed from two days in a week, to daily, Implementation of IT-enabled payment systems
Regular
Stakeholder Engagement & Materiality Assessment

Adani Power Limited
8 9
Sustainability Report 2015-16Executive Summary
Table 4: List of Material Aspects with Boundary Classification
Aspect & TopicsAspect Boundary
External Internal
Compliance – (Environment, Labour, Human Rights, Products, Project Related etc.)
Government, Investors, Community, Vendors, Customers
Company, Subsidiaries, Employees, Contract Workforce
Grievance (Environment, Human Rights, Supply Chain, Contract labour, Employee, Community etc.)
Community, Investors, Vendors Employees, Contract Workforce
Fuel Management – (Coal & Oil) - Company, Subsidiaries (excluding Solar)
Economic Performance (including PPA and sales)
Shareholders, Investors Company, Subsidiaries
Plant Efficiency (PLF, Availability, SHR, Aux Power)
Customers Company, Subsidiaries
Land Acquisition Community Company, Subsidiaries
Supply Chain Management (Procurement Practices, Supply chain assessment - Environment, Labour, Human Rights, Society) including Contract Management – O&M and Projects
Vendors Company, Subsidiaries, Contract Workforce
Asset Security & Protection - Company, Subsidiaries
Water Management Community, Government (as an owner and Supplier of Water)
Company, Subsidiaries (including Solar)
Emissions (Air, GHG) Community Company, Subsidiaries (excluding Solar)
Waste Management – Ash, Gypsum, Hazardous and non-hazardous waste
Community, Vendors Company, Subsidiaries (excluding Solar)
Biodiversity Community -
Emergency Preparedness and Disaster Management
Community, Government Company, Subsidiaries
A. O & M Material – input (Associated Chemicals, Limestone for FGD, Spares, Paints, other consumables)
Vendors Company, Subsidiaries
B. Project Material – Plant Machinery, Construction materials,
Vendors Company, Subsidiaries
Occupational Health and Safety - Employee and Contract Workforce
Community Employees, Contract Workforce
Community Engagement & Development (Indirect economic impact)
Community, Government Company, Subsidiaries
Employment Community Company, Subsidiaries
Labour Relations/ IR Company, Subsidiaries, Contract Workforce
Human Rights - Forced Labour, Child Labour, Working Conditions
- Company, Subsidiaries, Employees, Contract Workforce
Fair Treatment and Equal Opportunity - Company, Subsidiaries, Employees, Contract Workforce
Indigenous Rights Indigenous Community -
Anti-Corruption - Company, Subsidiaries
Cultural Heritage Community, Government -
Security Practices - Company, Subsidiaries
Competency Management - Employees, Contract Workforce
RELEVANCE
High
HighLow
SIG
NIF
ICA
NC
E
00
1
1
2
2
3
3
4
4
5
5
6
6
12
11 9
8 4 2
3
5 1
6
710
12 Innovation (R&D)
Contract Management
8
Employment4
Project Material,Emergency Preparedness,Supply Chain Management
9
Economic Performance,Fuel Management, Water Management,Compliance,OHS
1
Waste Management,Input Material, Biodiversity,Power PurchaseArrangements
5
Contract Management,Anti-corruption, Land Acquisition, Planned Capacity
10
Air/GHG Emissions,Plant Efficiency,Community Engagement & Development
2
Working Conditions,Stakeholder Grievance,Fair Treatment and Equal Opportunity,Child Labour,Forced Labour
6
11 CompetencyManagement,Security Practices
Labour Relations/IR 3
Indigenous Rights7
Materiality Matrix

Adani Power Limited
10 11
Sustainability Report 2015-16Executive Summary
While we are working on achieving our growth ambitions, we believe that caring for the environment and the society at large is intrinsically linked to sustenance of our business. Our sustainability strategy is interwoven into our overall business strategy and our commitment to the journey drives our sustainability agenda.
Quality Initiatives
In collaboration with the Quality Circle Forum of India (QCFI), we have implemented the 5 ‘S’ workplace organisation methodology to achieve greater organisational effectiveness.
Collaboration and Knowledge Sharing
During FY 2015-16, we were a member of the following associations either directly or through our parent company Adani Enterprises Limited:
During the year, our CEO was the Chairperson of APP. In all other associations, we featured as members.
• Association of Power Producers (APP) • Confederation of Indian Industry (CII)• Federation of Indian Chamber of
Commerce and Industry (FICCI) • Independent Power Producers
Association of India (IPPAI) • Gujarat Chamber of Commerce and
Industry (GCCI)
• Ahmedabad Management Association (AMA)
• National Safety Council (NSC) • Quality Circle Forum of India (QCFI) • Gujarat Safety Council • Institute of Fire Engineers, India (IFE)• British Safety Council
Management Systems
The Board of Directors has delegated sustainability responsibility to the CEO. All strategic and operational responsibilities are executed by the CEO through various functional heads at the corporate office and station heads at all operating and project locations.
The Board of Directors fully supports corporate governance practices in our Company with appropriate checks and audits at suitable places and at necessary intervals. The Company has complied with applicable requirements of Corporate Governance under Clause 49 of the Listing Agreement.
Governance, Ethics and Integrity
The responsibility of facilitating stakeholder engagement, materiality determination related to sustainability management and reporting including regular monitoring of the Company’s sustainability performance and that of its subsidiaries has been
delegated to the CSO. The CSO routinely relays the sustainability performance to the CEO and to the Board based on inputs from the various station heads and other stakeholders.
Board of Directors
CEO
Audit Committee
Nomination and Remuneration Committee
Sustainability and CSR Committee
Stakeholder Relationship Committee
Figure 1: Governance Structure
Internal Audit
The Internal Audit process includes review and evaluation of the effectiveness of existing processes, controls and compliances.
The Internal Audit department prepares Risk-Based Internal Audit (RBIA) scope and
Introduction For the reporting period we have registered a turnover of ̀ 254,333 million, which is a 33% increase compared with the previous financial year. Adani Power’s total generation stood at 69.39 billion units during the financial year, as against 54.7 billion units in FY 2014-15.
Our growth has been and continues to be inclusive of employee and community development to generate direct and indirect economic benefits.
In the past five years, Adani Power has continued to expand rapidly and has increased its capacity from 1,980MW to its present operating capacity of 10,480MW,
Strategy for Sustainability
Governance for Sustainability
Operations & Economics
the frequency of audit is decided by the risk rating of the concerned areas or functions.
A quarterly Internal Audit report, including the Action Taken Report, is placed at the Audit Committee meeting of the Board.

Adani Power Limited
12 13
Sustainability Report 2015-16Executive Summary
Our consolidated net profit for the year was recorded at `4,884.8 million, as against a net loss of ̀ 8,156.3 million in FY 2014-15.
For the Mundra power plant, major customers under long-term PPAs are the states of Gujarat and Haryana. For the Bitta power plant, the state of Gujarat is the only customer under long-term PPA. For Tiroda and Kawai power plants, major customers are the states of Maharashtra and Rajasthan, respectively, and for the Udupi power plant, we are supplying to the state of Karnataka under a long-term
PPA. We have now signed a long-term PPA with Mundra Utilities Pvt. Ltd. (MUPL) for a contracted capacity of 40MW. In addition to this, we have medium-term PPAs with Railway Energy Management Company Ltd. (REMCL) and Tamil Nadu Generation & Distribution Company Ltd. (TANGEDCO) for supply from Mundra.
We also supply power to Indian Energy Exchange (IEX) and other short-term customers from time to time. We have no direct residential customers.
were in O & M stage. As on 31st March 2016, we had a total of 2,715 on-roll employees, excluding apprentices as compared to 2,481 employees in FY 2014-15. In the reporting year, we had a total of 7,164 contract workmen. The total number of person-days worked by contract and sub-contracted workers was 2.48 million. During FY 2015-16, the total number of new joinees at Adani Power were 304. Workforce attrition rate for all the sites in FY 2015-16 was 8.95% compared to 9.85% in FY 2014-15.
To achieve the goal of 20,000MW by year 2020, we need to significantly scale up our workforce. We have HR policies of the group which are uniform over all business verticals which gives us the flexibility to internally transfer the workforce and quickly meet the requirement from within the organisation.
In FY 2015-16 we on boarded 71 employees (GET – 30, ET – 32, MT – 9) through our Campus recruitment drive.
In FY 2015-16, all five locations of Adani Power Business within reporting boundary
New Plans and Upcoming Projects
We are committed to reaching our goal of achieving a thermal power generation capacity of 20,000MW by 2020 to bridge the power deficit in the country, in line with the revised Tariff Policy and the Government of India’s vision of 24X7 power to all by 2019.
We plan to expand our thermal business by additional capacity of 1,600MW at Kawai, 1,600MW at Jharkhand, 1,600MW Udupi and 600MW at Surguja in the near future. We plan to finance our expansion plans
through a healthy mix of debt and equity. For the debt portion, we expect to tie up a mix of Rupee Term Loans and External Commercial Borrowings as we have done for our existing plants. We executed a share purchase agreement with the owners of Korba West Power Company Limited (KWPCL) for the acquisition of a 100% stake in KWPCL during the previous year. KWPCL owns a 600MW coal-based thermal power plant in Chhattisgarh.
Coal Sourcing Fuel requirements for 2,640MW spanning units 1 to 6 are met through imported coal, whereas for the 1,980MW needed for units 7 to 9, the Company has entered into a fuel supply agreement with Mahanadi Coalfield Limited (MCL). To ensure fuel security, we rely on our group company, Adani Enterprises Limited, for continuous availability of imported coal for our operations.
Fuel for the Tiroda plant’s 1,980MW is being sourced from SECL, which a subsidiary of Coal India Limited (CIL) under a long-term
Fuel Supply Agreement (FSA) with SECL for 4.91 MMTPA for 1,180MW and another tapering linkage with SECL for 3.329 MMTPA for 800MW. The fuel requirement for the remaining 1,320MW is being sourced from MCL and Central Coalfields Limited (CCL), executed through an MoU for 5.21 MMTPA.
Fuel for the UPCL plant comprises 1,200MW (2x600MW each) and demand is met through imported coal mainly from countries such as Indonesia, Australia and South Africa.
A reliable and sustainable supply chain is critical to drive efficiency in business and scale operations across our facilities. Further, our seven units of 660MW are identical, giving us an advantage when it comes to spares and vendor management.
Supply Chain Management
Coal
Liquid Fuel
Chemicals
Equipment Supplier
Spare Parts
O & M Mundra
Tiroda
Udupi
Kawai
Bitta
T & D
Waste
Discoms Customers
Manpower
ContractWater
UdupiAPL, Bitta
MundraTirodaKawai
FY 2014-15 FY 2015-16
0
10,000
40,000
30,000
20,000
GW
h 28,125
30,333
16,457
15,5037,866
7,40259.3
61.7
32,993
30,221
20,080
18,962
8,685
8,236
7,575
7,138
Sales Generation
Figure 2: Power Sales and Power Generation
Human Capital
Talent Management
Adani Power Limited
14 15
Sustainability Report 2015-16Executive Summary
Our engagement methods include Grievance Redressal Mechanism, Employee Reach Out programmes and regular one-to-one communication. These help us to resolve employee concerns promptly.
Employee Engagement
We have employee communication channels such as ‘Vartaalap’ - town hall with leaders, organisation wide mailers, newsletters, intranet, touch pad, reach out, ‘Vaad - Sanwaad’ and transmeets whereby all employees are encouraged to raise their view points in an open forum and directly interact with leaders.
Employee Communication
Our performance management system provides inputs for the Training Need Identification (TNI) process as each employee’s reporting manager assesses their developmental needs.
Training and Education
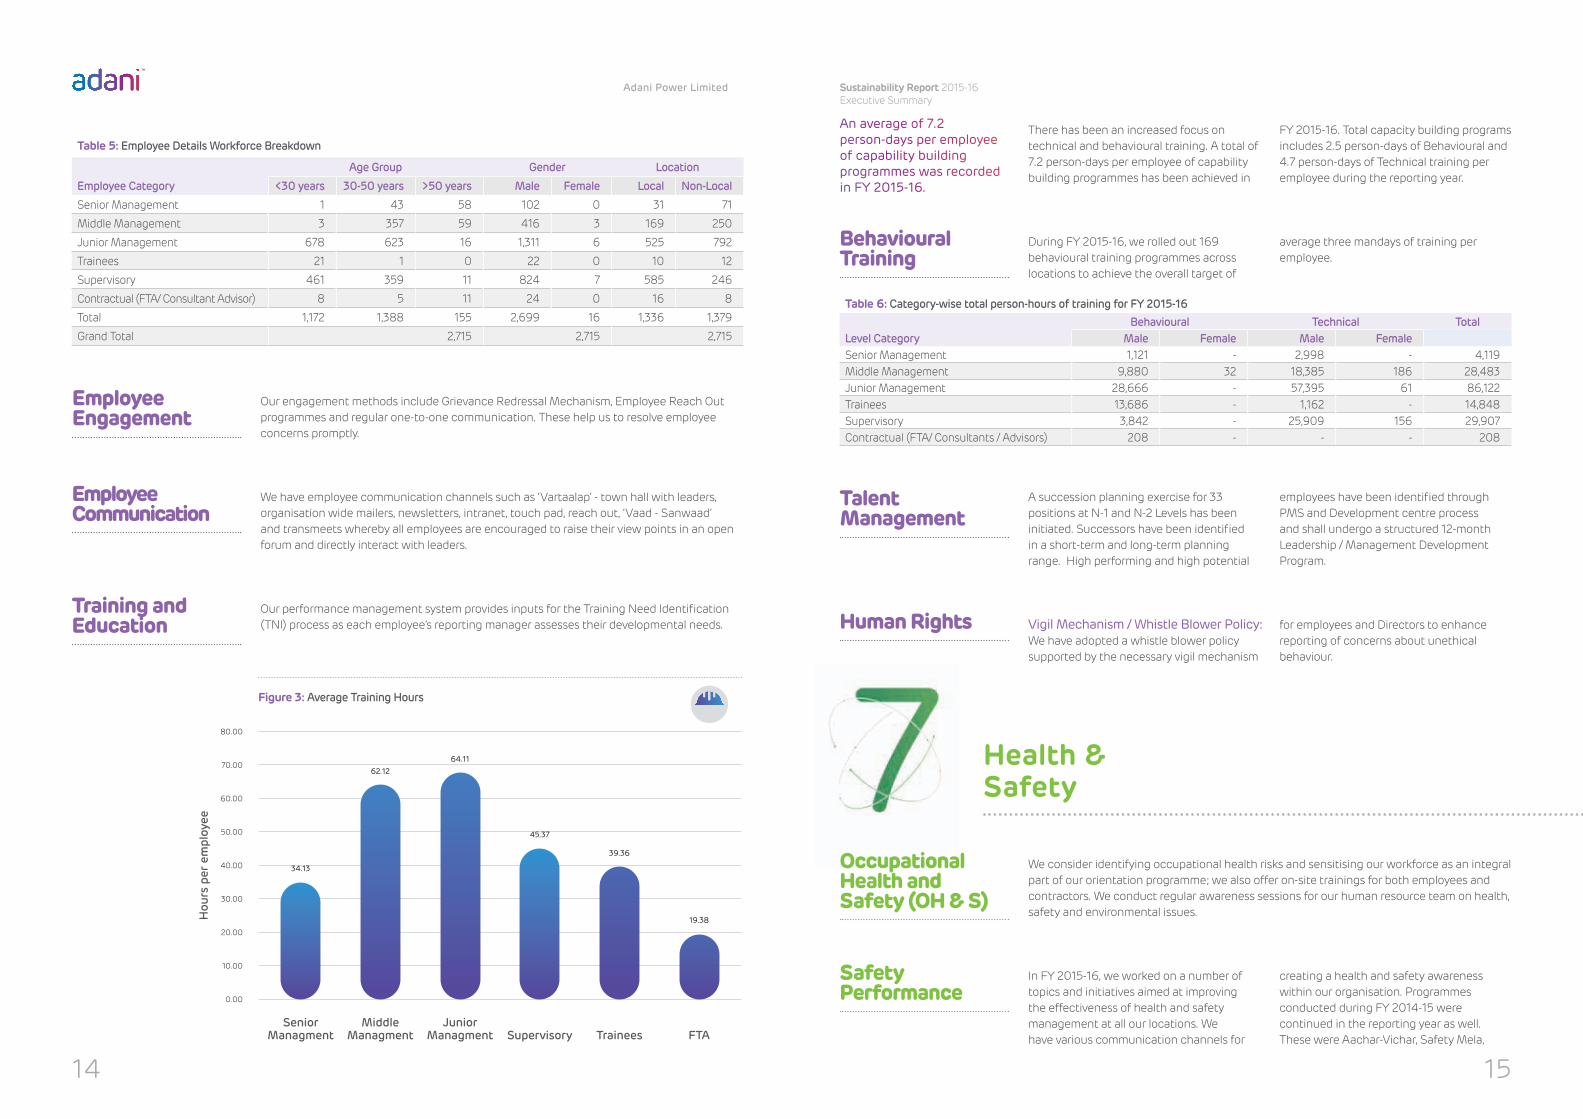
Table 5: Employee Details Workforce Breakdown
Employee Category
Age Group Gender Location
<30 years 30-50 years >50 years Male Female Local Non-Local
Senior Management 1 43 58 102 0 31 71
Middle Management 3 357 59 416 3 169 250
Junior Management 678 623 16 1,311 6 525 792
Trainees 21 1 0 22 0 10 12
Supervisory 461 359 11 824 7 585 246
Contractual (FTA/ Consultant Advisor) 8 5 11 24 0 16 8
Total 1,172 1,388 155 2,699 16 1,336 1,379
Grand Total 2,715 2,715 2,715
Senior Managment
Hou
rs p
er e
mpl
oyee
34.13
45.37
62.1264.11
39.36
19.38
Middle Managment
Junior Managment Supervisory FTA
40.00
0.00
50.00
10.00
60.00
70.00
80.00
20.00
30.00
Figure 3: Average Training Hours
Trainees
An average of 7.2 person-days per employee of capability building programmes was recorded in FY 2015-16.
There has been an increased focus on technical and behavioural training. A total of 7.2 person-days per employee of capability building programmes has been achieved in
FY 2015-16. Total capacity building programs includes 2.5 person-days of Behavioural and 4.7 person-days of Technical training per employee during the reporting year.
During FY 2015-16, we rolled out 169 behavioural training programmes across locations to achieve the overall target of
Behavioural Training
average three mandays of training per employee.
Table 6: Category-wise total person-hours of training for FY 2015-16
Level CategoryBehavioural Technical Total
Male Female Male FemaleSenior Management 1,121 - 2,998 - 4,119Middle Management 9,880 32 18,385 186 28,483Junior Management 28,666 - 57,395 61 86,122Trainees 13,686 - 1,162 - 14,848Supervisory 3,842 - 25,909 156 29,907Contractual (FTA/ Consultants / Advisors) 208 - - - 208
Talent Management
A succession planning exercise for 33 positions at N-1 and N-2 Levels has been initiated. Successors have been identified in a short-term and long-term planning range. High performing and high potential
employees have been identified through PMS and Development centre process and shall undergo a structured 12-month Leadership / Management Development Program.
Vigil Mechanism / Whistle Blower Policy:We have adopted a whistle blower policy supported by the necessary vigil mechanism
for employees and Directors to enhance reporting of concerns about unethical behaviour.
Human Rights
We consider identifying occupational health risks and sensitising our workforce as an integral part of our orientation programme; we also offer on-site trainings for both employees and contractors. We conduct regular awareness sessions for our human resource team on health, safety and environmental issues.
Safety Performance
In FY 2015-16, we worked on a number of topics and initiatives aimed at improving the effectiveness of health and safety management at all our locations. We have various communication channels for
creating a health and safety awareness within our organisation. Programmes conducted during FY 2014-15 were continued in the reporting year as well. These were Aachar-Vichar, Safety Mela,
Health & Safety
Occupational Health and Safety (OH & S)

Adani Power Limited
16 17
Sustainability Report 2015-16Executive Summary
Energy & Environment
Bitta
10,000
0
12,500
2,500
15,000
17500
20,000
22,500
25,000
5,000
7,500
Figure 4: Safety Training Hours
14,392
22,327
9,703
13,302
0
7,066
2,467
3,929
1,220
64.0
Trai
ning
Hou
rs
Mundra Tiroda Kawai Udupi
Contractual EmployeesAPL Employees
Safety Virus Scheme, Safety Halla Bol Scheme, Safety Chappa Scheme, Safety Ambassador Scheme, Safety on Top and Traffic Safety Week, to name a few.
followed by appropriate corrective actions and preventive measures.
We have aggressively renewed our efforts towards eliminating any such possibility in the future by engaging DuPont as our partner to support our ‘Zero Harm’ objective.
Accidents and Incidents:The aim for FY 2015-16 was to achieve zero lost time injuries and fatalities across our operating power plants. However, after the close of the reporting year, we witnessed one fatality at one of our plants. In line with our OH&S management systems, a root-cause analysis was conducted and this was
0.04
0
0.05
0.01
0.06
0.07
0.08
0.09
0.10
0.02
0.03
Figure 5: Injury Rate, FY 2015-16
0.08
0.00 0.00
0.05
0.000.00 0.00
0.09
Contractual EmployeesPermanent Employees
Inju
ry R
ate
Mundra Tiroda Kawai Udupi
Figure 6: Lost Day Rates, FY 2015-16 Contractual EmployeesPermanent Employees
400
450
550
0
500
100
50
150
250
350
200
300
0.96 0.000.005.40 0.00 0.004.10
548.00
Mundra Tiroda Kawai Udupi
Lost
Day
Rat
e
Table 7: Safety Statistics
Safety ParametersPermanent Workforce Contractual Workforce
FY 2014-15 FY 2015-16 FY 2014-15 FY 2015-16Reportable Injuries 2 1 4 2Lost time injury rate 0.16 0.04 0.05 0.03Lost days 135 12 244 354Lost days (Including fatalities) 12,135 12 12,244 6,354Lost day rate 5.24 0.44 1.87 3.57Lost day rate (Including fatalities) 471.42 0.44 94.03 64.00Fatalities 2 0 2 1Million Man-hours worked 5.15 5.51 26.04 19.86
The energy intensity figures for the reporting period are given below:
Table 8: Energy Intensity for Coal, LDO, HFO and Diesel with Availability and PLF
Particulars Availability PLF Coal LDO HFO Diesel(GJ/MWh) (GJ/MWh) (GJ/MWh) (GJ/MWh)
ConsolidatedFY 2014-15 90% 70% 8.96 0.0056 0.0069 0.0022FY 2015-16 93% 76% 9.52 0.0020 0.0023 0.0017MundraFY 2014-15 93% 75 % 8.96 0.0046 0.0033 0.0008FY 2015-16 95% 81.5% 9.82 0.0019 0.0011 0.0006TirodaFY 2014-15 86% 64% 8.89 0.0051 0.0103 0.0046FY 2015-16 93% 69% 9.37 0.0012 0.0052 0.0040KawaiFY 2014-15 93% 68% 9.08 0.0108 0.0132 0.0027FY 2015-16 90% 75% 9.01 0.0025 0.0019 0.0017UdupiFY 2014-15 NA NA NA NA NA NAFY 2015-16 86% 77% 9.86 0.004 0.0011 0.0005

Adani Power Limited
18 19
Sustainability Report 2015-16Executive Summary
During the financial year, through our energy saving initiatives we achieved about 0.67 million GJ in savings in all operational plants, compared with 0.49 million GJ in energy savings in FY 2014-15.
Our operations consumed a total of 665.32 million GJ of energy in FY 2015-16 compared with 490.36 million GJ in FY 2014-15 in the form of primary fuels such as coal, HSD, HFO and LDO used in boilers including the diesel used in plant and machinery.
In this financial year, there was 1,832 GJ power import compared with 4,130 GJ in FY 2014-15. Our total auxiliary power consumption for the year was 15.16 million GJ compared with 13.05 million GJ in FY 2014-15. We generated a total of 69.39 billion units of power compared with 54,655 million in FY 2014-15, of which net sales were 64,616 million units compared with 51,030 million units in FY 2014-15.
Table 9: Material Consumption
Fuel TypeConsumption (in MT)
FY 2015-16* FY 2014-15Coal 3,65,09,464.00 2,96,72,219.00LDO/HSD 3,644.53 7,012.72HFO 3,785.11 8,557.41Diesel (consumed in equipment and vehicles) 3,189.30 2,722.04Associated MaterialsLubricating Oils (in kL) 342.00 298.32Grease 33.80 23.29Other chemicals and additives 9,421.94 10,370.18
* This financial year includes our Udupi operations of 1,200MW.
Water
Our hinterland plants have already achieved specific water consumption of about 2.5 m3/MWh on an annual basis.
• Rain Water Harvesting: We have implemented rain water harvesting in our hinterland plants to reduce withdrawal of surface water.
• Using Waste Water: The total waste water generation and treated waste water discharge at our power plants was 303 million KL and 253 million
KL, respectively, in the financial year. The quantity of water discharges from Mundra and Udupi for the year was 173.59 million KL compared with 129.72 million KL in FY 2014-15. The thermal energy from such discharges is computed to be 1.71 million GJ in the reporting as compared with 1.31 million GJ in FY 2014-15.
Figure 7: Specific Water Consumption UdupiAPL, Bitta
MundraTirodaKawai
SEA WATER Mundra
Udupi
SURFACE WATER Tiroda Kawai
APL, Bitta
4.00
0
5.00
1.00
6.00
7.00
8.00
9.00
10.00
2.00
3.00
9.37
2.69 2.67
0.153
9.53
5.69
2.50 2.42
Trai
ning
Hou
rs
FY 2014-2015 FY 2015-2016
We recognise the relationship between Ecosystem Services and our business sustainability. The Company thus aims to minimise any negative impact on biodiversity and Ecosystem Services. We have taken efforts for positive impact on the environment and biodiversity around our operations.
Biodiversity All our operating locations are outside the buffer areas and eco-sensitive zones notified around biodiversity hotspots including wildlife sanctuary, national park and world heritage sites declared under applicable regulations or international treaties ratified by India.
Climate Change
Mitigation and Adoption StrategyFossil fuels are viewed as one of the largest contributors of climate change and increase in GHG and other air emissions like SOx and NOx. We were the first in the country to commission supercritical boilers. These boilers save about 2% of fuel per unit of power generated and help in subsequent reduction in GHGs per unit. In the future, we are considering utilising ultra-supercritical units for upcoming thermal power projects to further reduce specific GHG emission. Till date, we have commissioned 7,920MW (12 units of 660MW each) power plants based on supercritical technology.
To adapt to increase in water temperatures due to climate change in the future, all our thermal power plants are equipped with induced draft cooling towers with a re-circulation system.
Changes in precipitation rates may affect water availability in our hinterland power plants at Tiroda and Kawai. Accordingly,
we have implemented suitable water conservation and recycling practices to mitigate the same including rain water harvesting and increasing green belt cover.
With respect to rising sea levels and cyclonic surges due to global warming, the finished floor level of the Mundra power plant has been raised to 10 metres above chart datum (CD), whereas the highest high tide recorded is 5.4 metres above CD. The intake water channel is designed at (-) 6 metres from the CD to ensure water availability even at the lowest of the low tides. Similarly, at the Udupi power plant, the sea water intake is from -4.5m CD. The finished floor level is at 28.5 metres above Mean Sea Level (MSL).
For hinterland power plants, source sustainability study of surface water has been conducted based on primary data and secondary historical data of the past 25-30 years published by the Indian Metrological Department. Based on the findings of these studies, financial impact has been
Figure 8: Greenhouse Gas Emissions
20.00
0
25.00
5.00
30.00
10.00
15.00
26.0
14.3
7.02
27.0
6.91
17.9
7.62
Mill
ion
Tonn
es C
O2e
FY 2014-15 FY 2015-16
MundraTirodaKawai
UdupiAPL, Bitta
Corporate Office

Adani Power Limited
20 21
Sustainability Report 2015-16Executive Summary
calculated considering the loss of power generation in case of non-availability of water in any year due to very less rainfall. To address this risk, we have created water capacity to one month. At Kawai, we have a water storage capacity sufficient for one month.
Managing our Carbon FootprintWe calculate and monitor emissions generated from our power generation process which includes CO2, CH4 and N2O emissions. We do not use any biogenic fuels and therefore, there are no biogenic
emissions. During the financial year, our power plants emitted 59.4 million tCO2e GHG (direct emissions) compared with 47.34 million tCO2e GHG (direct emissions) in FY 2014-15. The GHG emission intensity sustained at 0.87 tCO2/MWh in the reporting year despite addition of two sub critical units in the reporting boundary.
Stack EmissionsThe total emissions of Particulate Matter (PM), Oxides of Nitrogen (NOx) and Oxides of Sulphur (SOx) were 11,895 MT, 53,516 MT and 1,42,132 MT, respectively.
2.0
0
2.50
0.50
1.0
1.50
Figure 10: Emissions Intensity
0.77
2.05
0.17
0.63
2.47
0.17
kg/M
Wh
FY 2015-16FY 2014-15
NOx IntensitySOx Intensity
Particulate Matter (PM) Intensity
1,00,000
0
1,25,000
25,000
1,50,000
50,000
75,000
53,516.76
1,42,132.84
9,316.26 11,894.84
34,343.40
1,35,002.57
FY 2015-16FY 2014-15
Tonn
es (t
)
Figure 9: EmissionsNOxSOx
Particulate Matter (PM)
Waste Management
The hazardous wastes generated are used oil, oil containers and spent resins. The generated wastes are disposed through authorised agencies as per the Hazardous Waste Handling and Management Rules for appropriate treatment and disposal.
Since we do not use any polychlorinated biphenyls (PCBs), there was no generation of PCB waste. We do not engage in import or export of any hazardous waste or materials under the Basel Convention. There is no radioactive waste generated and disposed from our power pants, however we are regularly monitoring radioactivity in fly ash as well as bottom ash.
We have installed state-of-the-art ash disposal and bagging technologies and supporting infrastructure for ash evacuation and sale at our plants. This has helped us increase our ash utilisation by supply to specialised agencies for use in cement manufacturing. Ash utilisation is a major challenge at Tiroda due to its geographical location. To overcome this challenge, we have developed a facility for loading of fly ash into specialised railway wagons. As more cement plants in the country adopt railway unloading facilities, we will be able to utilise a greater amount of ash through this means.
1.58million
Fly ash bricks manufactured.
66.0
0 50.0
70.0
1,000,000
8,000,000
7,000,000
6,000,000
5,000,000
4,000,000
3,000,000
2,000,000
54.0
74.0
78.0
82.0
58.0
62.0
Figure 11: Fly Ash Utilisation
54,99,77457,45,089
72.7%
FY 2015-2016FY 2014-2015
Fly Ash Generation (t)Fly Ash Utilisation (%)
Tonn
es (t
)
Per
cent
age
63.0%
Introduction As a responsible organisation, we take upon this onus and commit to support the development of the area and the community in which we operate. Our CSR activities are implemented through our partner Adani Foundation which facilitates various activities in the following focus areas:
• Education• Community Health• Sustainable Livelihood Development• Rural Infrastructure Development
Our CSR activities are identified and implemented in consultation with the
Community Engagement

Adani Power Limited
22 23
Sustainability Report 2015-16Executive Summary
community through an independent need assessment and a Participatory Rural Appraisal (PRA). During the FY 2015-16, the Company’s subsidiaries have spent ̀ 37.7 million towards the CSR activities through Adani Foundation for various community development initiatives. However, the total expenses made by Adani Foundation on CSR initiatives was ̀ 234 million.
SustainableLivelihoodEducation
Community Health
Rural Infrastructure
Self HelpGroup(SHG)
Support
TreePlantationProgram
Skilldevelopment
training
Communityengagement
through sports & cultural events
Enhancinglivelihood through
agriculture & animal husbandry
Water Conservation
Projects
SanitationPrograms
Infrastructurefor Education
Infrastructurefor CommunityDevelopment
Disha
Medical Aid
Support
Curbing Malnutrition
Scholarship
SupportingGovt.
Schools
UDAAN
Adani VidyaMandir
Health Camps
Mobile Health
Care Units
Blood Donation
Camp
• Schools that nurture - Adani Vidya Mandir: The Adani Vidya Mandir (AVM) aims at providing cost free quality education to meritorious students coming from underprivileged families. At Bhadreshwar, near Mundra, we have reached 379 meritorious students with quality education.
• Enabling Education through Handholding Government Schools & Other Initiatives: As part of our efforts, programmes such as DISHA, a career counselling programme, Parvarish, Science-On-Wheels and support for science laboratory have proven to be
beneficial for more than 46,000 students cumulatively covering ~ 300 schools in last one year.
• We share, we learn - project UDAAN: We strive to inspire by encouraging youth coming from various educational institutes across the country to visit Adani Group of Industries at Mundra, Tiroda and Kawai. This year, around 31,000 students across India have been benefited through programme UDAAN. This programme is replicated at all power sites where students from schools and colleges in the vicinity are encouraged to visit power plants.
Our goal is to provide ‘quality’ in education to children across all social strata with learning experience as core objective.
Education
Health We have organised 11 rural clinics and medical camps which have touched about 67,000 lives. Further, financial assistance has been provided to around 460 patients. In all, we have touched the lives of around 246,000 people towards a healthy life.
• Mobile Health Care Units (MHCU): Five MHCUs cover more than 95 villages and 6 fisherfolk settlements in the regions of Mundra, Kawai, Tiroda and Udupi attending to around 13,000 patients a
month and reaching around 156,000 beneficiaries during the year.
• Respect and dignity – Senior Citizen card: To encourage senior citizens to focus on preventive healthcare and provide healthcare coverage “Health Card to Senior Citizen scheme” was introduced. Health check-ups, coverage of up to ̀ 50,000 are provided to people over the age of 60 years.
People we have supported towards a healthy life2,46,000rural clinics and medical camps
11units of blood through ‘GO-RED’ Blood Donation drive
1,800lives benefited by rural clinics and medical camps
67,000
Livelihoods Adani Foundation has been working towards providing the community members with a number of livelihoods and income generating initiatives.
Women SHGs: Various women oriented initiatives were undertaken through Self-Help Groups (SHGs) formation and trainings for ensuring that these women are self-reliant and independent. SHGs have benefitted more than 200 women.
youth were trained with soft skills and technical trainings
VOCATION SELF-HELP GROUPS AGRICULTURE & ANCILLARY SUPPORT
women benefitted beneficiaries from 35 villages of Tiroda for training programme conducted to share organic farming techniques
1,000 200+ 1,050+
Rural Infrastructure Development
Our RID Projects includes water conservation projects, drinking water projects, education related infrastructure, improvement and development of roads for better access and other need based infrastructure. With the installation of safe drinking water facilities more than 5,300 people have benefited. Over 18,600 people have benefited directly owing to our RID initiatives across all locations and this number is rising. We receive feedback, both
through formal and informal channels. This includes letters, email, one-on-one verbal communication etc. We then record the feedback, including the appreciation as well as grievances and expectations from local communities. We periodically conduct impact assessment studies of our CSR initiatives at all operating locations covering 100% of the locations.

Adani Power Limited
24 25
Sustainability Report 2015-16Executive Summary
Independent Assurance StatementScope and ApproachAdani Power Limited (APL) commissioned DNV GL Business Assurance India Private Limited (‘DNV GL’) to undertake an independent assurance of the Company’s Sustainability Report 2015-16 (‘the Report’) in its printed and web format. The intended user of this assurance statement is the management of the Company. Our assurance engagement was planned and carried out in August 2016 – January 2017 for the financial year ending 31st March 2016.
We performed our work using AccountAbility’s AA1000 Assurance Standard 2008 (AA1000 AS) and DNV GL’s assurance methodology VeriSustainTM1, which is based on our professional experience, international assurance best practice including International Standard on Assurance Engagements 3000 (ISAE 3000) and the Global Reporting Initiative (GRI) Sustainability Reporting Guidelines.
We planned and performed our work to obtain the evidence we considered necessary to provide a basis for our assurance opinion for providing a Type 2 Moderate Level of assurance based on AA1000AS. In doing so we evaluated the performance data presented in the Report using the reliability principle, together with APL’s data protocols for how the data is measured, recorded and reported. The performance data in the agreed scope of work included the qualitative and quantitative information on sustainability performance disclosed in the Report prepared by APL based on GRI G4 in line with its ‘in accordance’ – Comprehensive option, and covering economic, environmental and social performance for the activities undertaken by the Company over the reporting period 1st April 2015 to 31st March 2016.
The reporting Aspect boundary of sustainability performance is based on the internal and external materiality assessment predominantly covering APL’s operations at Mundra and 3 subsidiaries (i.e. APML, APRL and UPCL) as set out in the Report.
We understand that the reported financial data (including CSR spends) and related information are based on disclosures and data from APL’s Annual Report 2015-16, which is gone through a separate independent audit process. The reported data on economic performance and Contribution to Adani Foundation (CSR expenses) is based on audited financial statements by the Company’s statutory auditors and not included in our scope of work.
Responsibilities of the Management of APL and of the Assurance ProvidersThe Management team of the Company have the sole responsibility for the preparation of the Report and are responsible for all information disclosed in the Report as well as the processes for collecting, analysing
and reporting the information presented in the printed and web-based versions of the Report, including the maintenance and integrity of the website. In performing our assurance work, our responsibility is to the management of APL; however, our statement represents our independent opinion and is intended to inform the outcome of our assurance to the stakeholders of APL.
DNV GL provides a range of other services to APL, none of which constitute a conflict of interest with this assurance work. DNV GL was not involved in the preparation of any statements or data included in the Report except for this Assurance Statement.
DNV GL’s assurance engagements are based on the assumption that the data and information provided by the client to us as part of our review have been provided in good faith. We were not involved in the preparation of any statements or data included in the Report except for this Assurance Statement. DNV GL expressly disclaims any liability or co-responsibility for any decision a person or an entity may make based on this Assurance Statement.
Basis of our OpinionA multi-disciplinary team of sustainability and assurance specialists performed work at APL’s sites in India i.e. APL Mundra, Gujarat and subsidiary companies Adani Power Maharashtra Limited (APML) at Tiroda, Maharashtra and Adani Power Rajasthan Limited (APRL) at Kawai, Rajasthan, UPCL at Udupi Karnataka, Bitta Solar PV at Bitta, Gujarat and at its Corporate Office at Ahmedabad. We adopted a risk based approach, i.e. we concentrated our verification efforts on the issues of high material relevance to Company’s power generation (O&M) business and its key stakeholders. We undertook the following activities:
• Reviewed the Company’s approach to stakeholder engagement and its materiality determination process;
• Verified the sustainability-related statements and claims made in the Report and assessed the robustness of the data management system, data accuracy, information flow and controls;
• Examined and reviewed documents, data and other information made available by the Company;
• Conducted in-person interviews with top and senior management team of Company and other representatives, including data owners and decision-makers from different divisions and functions of the Company;
• Performed sample-based reviews of the mechanisms for implementing the Company’s sustainability related policies, as described in the Report;
• Performed sample-based checks of the processes for generating, gathering and
managing the quantitative data and qualitative information included in the Report.
During the assurance process, we did not come across limitations to the scope of the agreed assurance engagement.
OpinionOn the basis of the verification undertaken, nothing came to our attention to suggest that the Report does not properly describe APL’s adherence to the GRI G4 reporting requirements including the Principles for Defining Report Content, representation of the material aspects, related strategies and disclosure on management approach and performance indicators as below:
• General Standard Disclosures: The reported information on General
Standard Disclosure generally meets the disclosure requirements for the ‘in accordance’ – Comprehensive option and the reasons for omissions and partial disclosure were explained to us and explained within the Report.
• SpecificStandardDisclosures: The Report describes the generic
Disclosures on Management Approach (DMA) and Performance Indicators for identified material Aspects as below:
Economic • Economic Performance– G4-EC1, G4-
EC2, G4-EC3, G4-EC4;
• Indirect Economic Impacts – G4-EC7, G4-EC8;
• Procurement Practices – G4-EC9;
• Availability and Reliability- EU10;
• System Efficiency – EU11; EU12;
Environmental • Materials – G4-EN1;
• Energy – G4-EN3, G4-EN5, G4-EN6;
• Water – G4-EN8, G4-EN10;
• Biodiversity – G4-EN11, G4-EN12, G4-EN13, G4-EN14, EU13;
• Emissions – G4-EN15, G4-EN16, G4-EN17, G4-EN18, G4-EN19, G4-EN20, G4-EN21;
• Effluents and Waste – G4-EN22, G4-EN23, G4-EN24, G4-EN25, G4-EN26;
• Compliance – G4-EN29;
Social Labour Practices and Decent Work • Employment – G4-LA1, G4-LA2, G4-
LA3, EU15, EU16, EU17;
• Occupational Health and Safety – G4-LA5, G4-LA6, G4-LA7, G4-LA8,
• Training and Education – G4-LA9, G4-LA10, G4-LA11;
Human Rights • Indigenous Rights – G4-HR8;
Society • Local Communities – G4-SO1, G4-
SO2, EU22;
• Anti-corruption – G4-SO3, G4-SO4, G4-SO5;
Product Responsibility • Power Outage Frequency – EU28;
• Average Power Outage Duration – EU29;
• Average Plant Availability Factor – EU30.
Observations Without affecting our assurance opinion we also provide the following observations. We have evaluated the Report’s adherence to the following principles on a scale of ‘Good’, ‘Acceptable’ and ‘Needs Improvement’:
Inclusivity: The participation of stakeholders in developing and achieving an accountable and strategic response to Sustainability.
The stakeholder engagement process is well established and involves planned engagement with key stakeholders to identify and respond to significant sustainability concerns. The material issues emerging from materiality analysis were collected and prioritized, and the results are fairly reflected in the Report. In our opinion, the level at which the Report adheres to this principle is ‘Good’.
Materiality:The process of determining the issues that is most relevant to an organization and its stakeholders.
The materiality determination process was revalidated based on inputs from key stakeholders including global and peer sector reports, company policies, value chain impacts of operations, business risks and Senior Management at APL. The Report focusses its disclosures on key material aspects at macro level and has not missed out any known material aspects. The management of APL has established internal management process for monitoring and management on a continual basis for their long term organisational sustainability. In our opinion, the level at which the Report adheres to this principle is ‘Good’.
Responsiveness:The extent to which an organization responds to stakeholder issues.
We consider that the Report has fairly disclosed the strategies and management approach related to identified key sustainability aspects and challenges considering the overall sustainability context of the sector for its Operation and Maintenance activities defined within the report as its reporting boundary. In our opinion, the level at which the Report adheres to this principle is ‘Good’.
Reliability:The accuracy and comparability of information presented in the report, as well as the quality of underlying data management systems.
The majority of data and information verified at the Corporate Office and four operational sites were found to be accurate. The data collection system has been strengthened and the process of implementation of an ERP based system is in progress. Some of the data inaccuracies identified during the verification process were found to be attributable to transcription, interpretation and aggregation errors and the errors were communicated and subsequently corrections made in the reported data and information. Hence in accordance with AA1000AS (2008) requirements for a Type 2, Moderate level assurance engagement, we conclude that the specified sustainability data and information presented in the Report is generally accurate and reliable. In our opinion, the level at which the Report adheres to this principle is ‘Acceptable’.
Specificevaluationoftheinformationonsustainability performanceWe consider the methodology and process for gathering information developed by APL for its sustainability performance reporting to be appropriate, and the qualitative and quantitative data included in the Report was found to be identifiable and traceable; the personnel responsible could demonstrate the origin and interpretation of the data and its reliability. We observed that the Report presents a faithful description of the reported sustainability activities for the reporting period.
Additional principles as per DNV GL VeriSustainCompleteness: How much of all the information that has been identified as material to the organisation and its stakeholders is reported.
The Report has fairly reported the General and Specific Standard Disclosures including the management approach, monitoring systems and sustainability performances indicators against GRI G4 requirements corresponding to the ‘in accordance’ – Comprehensive option. The reporting boundary is limited to Operation and Maintenance activities. In our opinion, the level at which the Report adheres to this principle is ‘Good’
Neutrality: The extent to which a report provides a balanced account of an organization’s performance, delivered in a neutral tone.
The disclosures related to sustainability issues and performances are fairly reported in a neutral tone, in terms of content and presentation, however Report could further bring out responses related to the challenges faced during the reporting period. In our opinion, the level at which the Report adheres to the principle of Neutrality is ‘Good’
Opportunities for ImprovementThe following is an excerpt from the observations and opportunities for improvement reported to the management of the Company and are not considered for drawing our conclusions on the Report; however they are generally consistent with the management’s objectives:
• Increased awareness and implementation of IT enablement of Sustainability Performance Management and Reporting initiative with standard operating procedures may be established across sites for consistency in monitoring and recording sustainability performance indicators; this will help in further strengthening the reliability of sustainability parameters.
• The future report may consider reporting on Aspect-specific DMA related to identified material aspect and to further strengthen disclosure on supply chain activities related to impact on APL due to risks in supply chain
• Sustainability performance may be benchmarked with peers to further strengthen the disclosure of the sustainability impacts of material aspects and strategic responses to material issues and stakeholder expectations and establish short, medium and long term targets and objectives related to its identified material Aspects and topics.
Nandkumar VadakepatthLead VerifierRegional Sustainability Manager – India Subcontinent and Middle East DNV GL Business Assurance India Private Limited India
Balasubramoniam, SivasubramaniamAssurance Reviewer,DNV GL Business Assurance India Private Limited India
Bangalore, India, October 30, 2015
For and on behalf of DNV GL Business Assurance India Private LimitedBengaluru, India 27th January 2017
DNV GL Business Assurance India Private Limited is part of DNV GL – Business Assurance, a global provider of certification, verification, assessment and training services, helping customers to build sustainable business performance. www.dnvgl.com
Adani Power Limited
26
Adani Power LimitedShikhar, Near Adani House,Mithakhali Six Roads, Navrangpura,Ahmedabad - 380 009Gujarat, India.
For our full sustainability report, please visit our website www.adanipower.com
www.adanipower.com
Tel: +91 79 2656 5555Fax: +91 79 2656 5500