sustainability/resiliency in tarpon springs · 2018-07-23 · sustainability plan or goals to...
TRANSCRIPT


Presentation Overview
1. Identify problem
2. Terms: Mutual Understanding
3. Solutions-Proposal
4. Next Steps

Identify problem• Tarpon Springs is facing increasing stresses and shocks
directly related to sea level rise.
• Tarpon Springs does not have a coordinated Sustainability plan or goals to address these increasing risks.
•We have individual ‘projects’ but risks cannot be successfully contained with that lens.

RECOMMENDED PROJECTION OF SEA LEVEL RISE IN THE TAMPA BAY REGION
Tampa Bay Climate Science Advisory Panel August 2015

“The Cost of Doing Nothing-Economic Impacts of Sea Level Rise in the Tampa Bay Region”
Tampa Bay Regional Planning Council January 2017


Tarpon Under Water
Tampa Bay Regional Planning Council (TBRPC) developed maps depicting a 2.95 foot rise in sea level by 2060
UF Interactive Map showing different scenarios

RESILIENCY
CHRONIC STRESSES
Chronic stresses are slow moving disasters that weaken the fabric of a city. They include:
• Sea level rise
ACUTE SHOCKS
On the other hand, acute shocks are sudden, sharp events that threaten a city, including:
• Hurricanes
• Floods
100RC defines urban resilience as “the capacity of individuals, communities, institutions, businesses, and systems within a city to survive, adapt, and grow no matter what kinds of chronic stresses and acute shocks they experience.”
Source: http://www.100resilientcities.org/resources/

Sustainability can be understood as living in such a way that future generations will be able to live with the same or higher quality of life.
Sustainable cities are livable cities.
SUSTAINABILITY
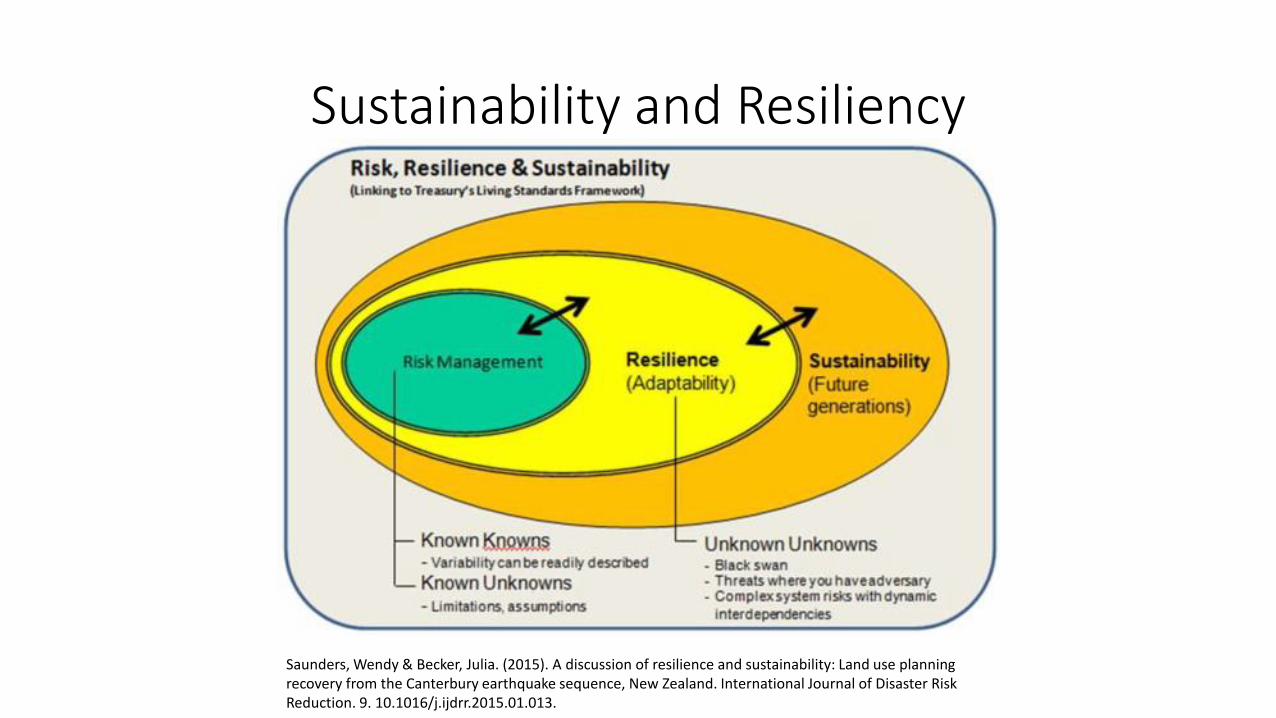
Sustainability and Resiliency
Saunders, Wendy & Becker, Julia. (2015). A discussion of resilience and sustainability: Land use planning recovery from the Canterbury earthquake sequence, New Zealand. International Journal of Disaster Risk Reduction. 9. 10.1016/j.ijdrr.2015.01.013.
Solutions-Proposal
1. Board of Commissioners establish formal Sustainability Goals

Solutions-Proposal2. Hire a Sustainability Coordinator to develop and enact an
Integrated Sustainability Action Plan
• Oldsmar, Dunedin, Largo, St. Petersburg all have a Sustainability Coordinator.
• Salary range of 40-45K annually. (See EXCEL file in backup)
• Job description: coordinate, oversee and prioritize resilience and sustainability-building activities. (See description in backup)

Solutions-Proposal3. Adopt an
Integrated Sustainability Action Plan
• St. Petersburg, FL: STAR Communities
• Largo, FL: LEAP Largo Environmental Action Plan
• City of Coral Gables, FL: Sustainability Master Plan There are 24 proposed projects included in the plan
• Miami-Dade County, FL: GreenPrint Climate Action Plan
• Hollywood Florida: Action PlanSustainability

Solutions-Proposal3. Sustainability Action Plan Indicators (specific measurables)
• Reducing Building Energy usage: Sign a Contract with an Energy Services Company which locks savings into the contract.
• Conducting a vulnerability assessment with regards to sea level rise to map at-risk assets and create Resiliency Plan for emergencies.
• Increasing building energy efficiency (HVAC, lighting, building automation, etc.)
• Upgrading the City’s irrigation system and flow and flush fixtures
Solutions-Proposal
3. Sustainability Action Plan Indicators (specific measurables)• Adopt Electric vehicle fleet goals
•No idle policy
• Increasing technology implementation such as timers to shut computers/lights off.
• Local and environmental purchasing

Solutions-Proposal-Examples
YMCA - St. Petersburg
• Planning stage to replace fluorescent lighting with LED - estimated $15,000-$18,000 per year savings, with 3-4 month payback
Pinellas County School District
• Contracts with Cynergistic - involves nightly shutdowns of electronics, and setting thermostat to 85 degrees each night and weekend, across all school campuses - 5 yr contract
• District splits savings with Cynergistics, no capital investments
• Over 3 years, $6.2 million in energy savings, with $3 million returned to teacher salaries
Clearwater Residential Solar - based on permit data
• 2017: 128 installations, totaling an estimated 1,000 KW, saving residents an estimated $197,000/yr in energy bills, and 2.5 million pounds of CO2/yr
Data Credit: Bryan Beckman Ready for 100 Campaign, Sierra Club

Solutions-Proposal4. We would like to see us adopt a Citizen Advisory Board that would build capacity for the Sustainability Coordinator and increase community.

ConsiderationsThe City is already doing some of these things:• Solar on the RO plant• Spring Bayou
monitoring project w/SWFWMD and County based on EPA issue• LED lighting for
streetlights

Considerations• This proposal should support efforts already
in action but in a coordinated way which does several things:• Leverages the City’s image as forward
looking for it’s citizens and business owners
• Creates a greater sense of community through increased communication and education both internally (to staff) and externally (to citizens)
• This would be a net financial gain for the city. Regardless of the environmental benefits.
• Grants-there are many federal, state, and private/public funds available

Next Steps
• I would urge you to vote to take action soon. This position could be funded in this budget if action is taken soon.
• Every season the waters are rising and the risk (environmental and financial) is increased.

Resources• Resources Specific to Resiliency/Sustainability in Florida
• Tampa Bay Regional Planning Council ‘One Bay’ Resilient Communities webpage
• American Planning Association "Sustainable Planning Toolkit”
• Local Governments for Sustainabilty
• Arcadis Sustainable Cities Index: Gives an overview based on criteria the most sustainable cities in the World and in the U.S.
• US Climate Resilience Toolkit: Find information and tools to help you understand and address your climate risks

Next StepsWe have a historic preservation board, we need a future preservation board.
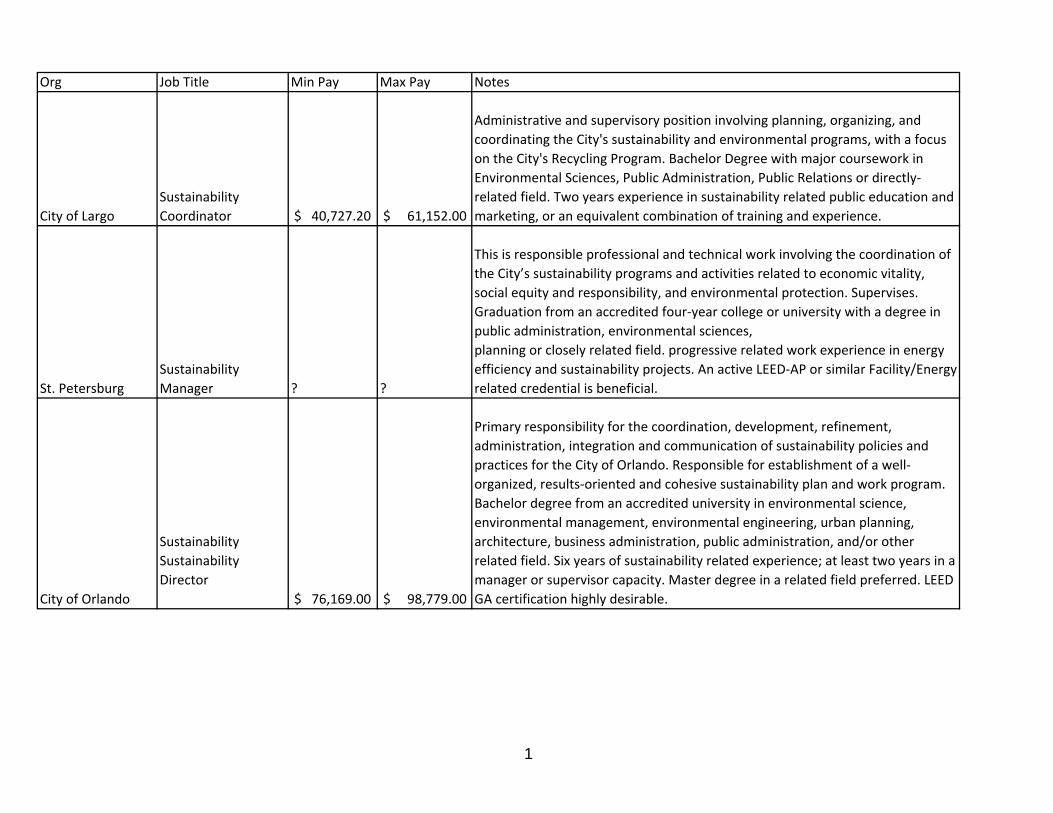
Org Job Title Min Pay Max Pay Notes
City of LargoSustainability Coordinator $ 40,727.20 $ 61,152.00
Administrative and supervisory position involving planning, organizing, and coordinating the City's sustainability and environmental programs, with a focus on the City's Recycling Program. Bachelor Degree with major coursework in Environmental Sciences, Public Administration, Public Relations or directly‐related field. Two years experience in sustainability related public education and marketing, or an equivalent combination of training and experience.
St. PetersburgSustainability Manager ? ?
This is responsible professional and technical work involving the coordination of the City’s sustainability programs and activities related to economic vitality, social equity and responsibility, and environmental protection. Supervises. Graduation from an accredited four‐year college or university with a degree in public administration, environmental sciences,planning or closely related field. progressive related work experience in energy efficiency and sustainability projects. An active LEED‐AP or similar Facility/Energy related credential is beneficial.
City of Orlando
Sustainability Sustainability Director
$ 76,169.00 $ 98,779.00
Primary responsibility for the coordination, development, refinement, administration, integration and communication of sustainability policies and practices for the City of Orlando. Responsible for establishment of a well‐organized, results‐oriented and cohesive sustainability plan and work program. Bachelor degree from an accredited university in environmental science, environmental management, environmental engineering, urban planning, architecture, business administration, public administration, and/or other related field. Six years of sustainability related experience; at least two years in a manager or supervisor capacity. Master degree in a related field preferred. LEED GA certification highly desirable.
1

City of OrlandoSustainability Proj Mgr $ 54,371.00 $ 72,467.00
Performs administrative and professional work related to the development of the City’s community sustainability programs. The position develops and manages projects, policy and programs to improve the effectiveness of the City’s community sustainability programs, with a specific emphasis on community recycling, community agriculture and community tree planting programs. A Bachelor’s degree in Environmental Science, Urban Planning, Sustainability, or Business Administration or equivalent and four (4) years experience in the area of sustainability, local food; or equivalent combination of education, training, and experience.
Palm Bay N/A
West Palm BeachSustainability Coordinator $ 43,967.00 $ 67,930.00
Under general supervision, provides support for the City of West Palm Beach sustainabilityinitiative; performs related duties as assigned. Bachelor’s degree from an accredited college or university with a major in Environmental Studies, Public Policy, management, sustainable land planning or related field. three (3) years relevant work experience in the area of sustainability program management.
Sustainability Manager $ 50,989.00 $ 78,778.00
Under general direction, develops, implements, and monitors the City’s sustainabilityprogram that incorporates into all aspects of City operations, and continually advances the City towardbecoming more environmentally, socially, and economically sustainable; serves as the liaison of the Citywith the public for issues and advances in sustainable practices within City operations. Bachelor’s degree from an accredited college or university with a majorin Environmental Studies, Public Policy, management, sustainable land planning or related field. five(5) years relevant work experience in the area of sustainability program management. One (1) year ofsupervisory experience, required.
Deltona N/A
2

Melbourne
Environmental Programs Coordinator $ 31,662.00 $ 53,179.00
Under the general supervision of the Environmental Community Outreach Manager, assists in the planning, development, implementation, and administration of the City’s water conservation, solid waste and recycling, and storm water education/pollution prevention community outreach programs. Graduation from high school, GED or equivalent certificate of competency supplemented with previous experience in environmental, educational and public relations activities. College degree preferred. Word processing, database and spreadsheet experience required.
Environmental Community Outreach Manager $ 47,421.00 $ 79,647.00
Under the general supervision of the Public Works & Utilities Director, performs responsible management, education and public relations work in planning, developing and implementing the City’s environmental outreach programs; managing and administering the City’s sanitation ordinance and service contract; and in marketing and providing public relations for the water, wastewater, reuse,stormwater, and solid waste/recycling programs. Bachelor’s Degree in journalism, marketing, public relations, public administration or related field, supplemented by experience in local government and/or public or private sector communications, marketing work, public speaking, and development of educational and conservation programs.
Miami Gardens N/ADeerfield Beach ?
3

Sunrise Sustainability Officer ? ?
This is highly responsible managerial, administrative, and professional work of considerable difficulty in developing, planning, and directing plans and strategies for the City of Sunrise Sustainability Program. An employee in this class is responsible for the operational planning, directing, coordinating, and the implementation of policies and procedures related to the sustainability of City operations and the advocacy of sustainability to the community.Graduation from an accredited college or university with a Bachelor's Degree in business or public administration, urban planning, engineering, architecture, environmental studies, or a closely related field. Minimum five (5) years progressively responsible experience in sustainability programs, energy programs, or environmental quality. Minimum six (6) months experience in one or more of the following areas: building and development projects; sustainable infrastructure projects; life cycle cost analysis; analytical techniques and monitoring systems; orany equivalent combination of relevant training and experience. Certification by the U.S. Green Building Council (USGBC), LEED or a similar certifying agency is preferred
Plantation N/AMiami Beach N/ALakeland N/APompano Beach N/AClearwater N/ADavie N/ACoral Springs N/APalm Coast N/ABoca Raton N/A
DunedinSustainability Coordinator $ 40,479.00 $ 64,767.00
4

Orange County, FLSustainability Coordinator (016) $ 44,158.00 $ 70,844.00
This position will coordinate and implement sustainability initiatives for the Orange County Convention Center (OCCC) that will benefit the OCCC, clients, exhibitors, attendees, employees and the environment. Responsibilities will include obtaining and maintaining Leadership in Energy & Environmental Design (LEED) certification and maintaining and expanding the environmental standards as defined by the Environmental Management System ISO 14001 (EMS). Graduation from an accredited institution with a Bachelor’s degree in Environmental Science, Engineering, Environmental Studies, Biology or other closely related field and three years of environmental/sustainability work experience or an equivalent combination of education, training and/or experience. Possess LEED certification such as LEED Green Associate or LEED Accredited Professional (Operations & Maintenance) or obtain certification within six months of hire.
City of Jacksonville
ENVIRONMENTAL PROGRAMS SPECIALIST $ 31,986.00 $ 60,233.00
This is professional work in the coordination and execution of environmental programs and community activities which includes administering related grants. Five year combination of education and/or administrative experience in environmental and ecological awareness program coordination, public education and community event coordination.
City of TallahasseeRECYCLING COORDINATOR $ 39,499.00 $ 78,083.00
This is professional, technical, supervisory and public contact work in the field of recycling andpromoting the City’s compliance with the State Solid Waste Act and other regulations geared towardsprotecting the environment. Possession of a bachelor’s degree and four years of experience that includes solid waste management, recycling, marketing, utility customer service, environmental compliance or a relatedarea, or four years of staff or administrative experience; or an equivalent combination of training andexperience. One year of the required experience must include directing or coordinating the activitiesof subordinates.
5

Fort LauderdaleSUSTAINABILITY MANAGER $ 76,752.00 $121,617.60
This is highly responsible managerial, administrative, and professional work of considerable difficulty in developing, planning, and directing plans and strategies for the City of Fort Lauderdale’s Sustainability Program. An employee in this class is responsible for the operational planning, directing, coordinating, and both directly and through subordinate management personnel, the implementation of policies and procedures related to the sustainability of all City operations and advocacy of sustainability and climate resiliency to the community. Have graduated from an accredited college or university with a Bachelor's Degree in business or public administration, urban planning, engineering, environmental studies or other closely related field. 2. Have at least five (5) years of progressively responsible experience in sustainability programs or environmental quality. Must have some experience in one or more of the following areas: building and development projects; sustainable infrastructure projects; life cycle cost analysis; analytical techniques and monitoring systems; or any equivalent combination of relevant training and experience. 3. Certification by the U.S. Green Building Council (USGBC), Leadership in Energy and Environmental Design (LEED), Certified Energy Manager (CEM), or similar is preferred.
6

City of Hollywood, FL
Environmental Sustainability Coordinator $ 52,525.56 $ 84,040.90
Highly responsible managerial, administrative, and professional work of considerable difficulty in developing, planning, and directing plans and strategies for a City Sustainability Program. Graduation from an accredited college or university with a Bachelor’s Degree in business or public administration, urban planning, engineering, architecture, environmental studies, or a closely related field. Certification by the U.S. Green BuildingCouncil (USGBC), LEED or a similar certifying agency is preferred. Minimum five (5) years progressively responsible experience in sustainability programs, energy programs, or environmental quality including a minimum six (6) months experience in one or more of the following areas: building and development projects; sustainable infrastructure projects; life cycle cost analysis; analytical techniques and monitoring systems; or any equivalent combination of relevant training and experience.
Recycling Coordinator $ 43,188.00 $ 65,646.00
Under general direction of an administrative superior, coordinates, develops and manages recycling and solid waste programs throughout the City. This position is responsible for promoting, monitoring, and coordinating programs which include but are not limited to the commercial recycling program, curbside and other residential recycling programs, solid waste programs, household hazardous waste programs as well as the "Keep Hollywood Beautiful" initiatives. Required: Associate's Degree in Business Administration, Management or Environmental Management along with three (3) years of experience overseeing a commercial recycling program, curbside and other residential recycling programs, solid waste programs, and household hazardous waste programs. Preferred: Bachelor's Degree in Business Administration, Management, or Environmental Management.
7

Public Utilities Outreach Coordinator $ 60,566.13 $ 96,905.80
This is highly responsible, specialized public communications work involving research, documentation and distribution of written and oral communications. The employee in this class works under the supervision of the Director of Public Utilities and is responsible for coordinating and implementing impactful and appropriate public relations outreach programs that promotes the departments brand and message through the use of various communications media including broadcast, online and print. Required: Possession of a Bachelor's degree in Public Administration, Business Administration, Environmental Sciences or related field.Three (3) years' experience in public information, public relations/marketing for a government agency or for a private agency servicing local government clients and administrative experience with water and/or wastewater systems; or an equivalent combination of training and experience.Experience in preparing, administering and managing grants and/or special projects. Preferred: Possession of a Master's Degree from an accredited college or university with major course work in environmental sciences, Public Administration, Business Administration or related field of study.Five (5) years of progressively responsible administrative experience with water and/or wastewater systems; or an equivalent combination of training and experience
8

Tarpon Springs Sustainability Resources
Attachments: Recommended Projection of Sea Level Rise in the Tampa Bay Region (PDF) Cost of Doing Nothing Report (PDF) St Pete Integrated Sustainability Action Plan (ISAP) Primer (PDF) St Pete Sustainabilty Manager Description (PDF) Largo’s Environmental Action Plan 2018 (LEAP) Sustainabilty Coordinator Salary (EXCEL) Grant for Sustainable Projects (PDF) FL Department of Economic Opportunity Power Point on Pilot programs with communities on Coastal Resiliency (PPT) Websites In Dory’s Power Point Presentation Resources Specific to Resiliency/Sustainabilty in Florida http://resiliencyflorida.org/resources/ Tampa Bay Regional Planning Council ‘One Bay’ Resilient Communities webpage: http://www.tbrpc.org/onebay/working_group.shtml University of Florida Sea-Level Rise Viewer. An interactive map that shows inundation of horozontal infrastructure at different levels. http://plaza.ufl.edu/dengyujun11/SLR7.0.html# American Planning Association "Sustainable Planning Toolkit" Southeast Sustainability Directors Network Grant Information: http://www.southeastsdn.org/grants/#1491595405527-b963b5d2-3dbd Concept of Energy Services Companies: https://hub.globalccsinstitute.com/publications/energy-efficiency-policies-around-world-review-and-evaluation/36-escos Local Governments for Sustainabilty http://icleiusa.org/membership/join-iclei/ Arcadis Sustainable Cities Index Gives an overview based on criteria the most sustainable cities in the World and in the U.S. https://www.arcadis.com/en/global/our-perspectives/sustainable-cities-index-2016/# US Climate Resilience Toolkit Find information and tools to help you understand and address your climate risks https://toolkit.climate.gov/

RECOMMENDED PROJECTION OF SEA LEVEL RISE IN THE TAMPA BAY REGION
Tampa Bay Climate Science Advisory Panel
August 2015

RECOMMENDED PROJECTION OF SEA LEVEL RISE IN THE TAMPA BAY REGION
Introduction The Tampa Bay region, with nearly 700 miles of shoreline1 and 3.2 million residents - many of whom live near Tampa Bay or the Gulf of Mexico - is highly vulnerable to the potential effects of sea level rise (SLR). Citizens, emergency managers and regional leaders have been accustomed to thinking of coastal hazards in terms of the episodic effects of hurricanes or coastal storms; however, it is also important for local governments and regional agencies to consider the long-term, sustained effects of SLR on real property, natural habitats, and our ability to sustain growth in the regional economy. The Tampa Bay regional economy is closely tied to both the Gulf of Mexico and Tampa Bay. It is valued at $170 billion, with $51 billion directly influenced by the bay itself2. In a report recently published by the World Bank, Tampa was identified as one of the ten coastal metropolitan areas most vulnerable to sea level rise and subsequent flooding. The report rated cities in terms of the overall cost of potential damage and assumed that no adaptation strategies would be implemented in response to SLR3. Regional measurements show that the Tampa Bay region is already experiencing sea level rise and there is broad scientific consensus that this trend will continue on into the next century. Cities that choose not to implement adaptation strategies, including those in the Tampa Bay region, may experience the following conditions which will likely incur substantial social and economic costs:
• Flooding of streets, homes, businesses, hospitals, schools, emergency shelters, etc., • Shoreline and beach erosion, • Impacts to the operations of coastal drainage systems, • Impairment of coastal water supplies including saltwater intrusion of groundwater and
threats to coastal water treatment facilities and infrastructure, and • Shifts in habitats and reduced ecosystem services.
The economic costs of inaction in the face of SLR must be weighed carefully against the potential (and equally substantial) costs of implementing adaptation strategies, technological solutions and infrastructure investments. However, local governments in the Tampa Bay region should feel confident that there are viable opportunities for implementing adaptation strategies that increase the region’s resilience to sea level rise and other coastal hazards. These opportunities benefit from a common projection of regional SLR that enables coordinated planning and policy efforts to protect public safety, health, and quality of life; providing the scientific rationale for the most appropriate projection(s) of SLR in the Tampa Bay region is the purpose of this recommendation. The Tampa Bay Climate Science Advisory Panel (CSAP), formed in spring 2014, is an ad hoc network of scientists and resource managers working in the Tampa Bay region (Pinellas, Hillsborough, Manatee, and Pasco counties). The goal of the advisory panel is to develop
1 http://www.tbrpc.org/mapping/pdfs/sea_level_rise/Tampa%20Bay%20-%20Sea%20Level%20Rise%20Project%20Draft%20Report%20without%20maps.pdf 2https://tbeptech.org/TBEP_TECH_PUBS/2014/TBEP_04_14_%20FinalReport_Economic_Valuation_of_Tampa_Bay_Estuary.pdf 3 http://www.worldbank.org/en/news/feature/2013/08/19/coastal-cities-at-highest-risk-floods
1

RECOMMENDED PROJECTION OF SEA LEVEL RISE IN THE TAMPA BAY REGION
recommendations for local governments and regional agencies as they make decisions about responding to climate change and associated SLR. The CSAP has assessed the best available scientific data to determine a regional set of SLR projection scenarios through 2100. With this shared projection, local governments can coordinate, develop, and implement appropriate coastal adaptation and risk reduction strategies. This document briefly explains the technical methods used to produce SLR projections and offers the CSAP’s rationale for the most appropriate SLR projections to use for planning and policymaking throughout the Tampa Bay region.
Technical Methods and Recommendations Estimates of future SLR are typically expressed by plotting or tabulating a quadratic function. This function is used because it is the simplest function that can effectively capture a wide range of possible SLR scenarios, including constantly increasing, rapidly increasing or even decreasing sea levels. Defining a specific SLR scenario requires three numbers: a datum, the point in time sea level is defined to be zero; a rate of change, how rapidly sea level is changing (increasing or decreasing) at time zero; and a projection, the amount global sea level is expected to change between time zero and some point in the future4. Both the datum5 and the rate of change6 are defined using present day observations from a tide gauge proximate to the region of interest. Local rates of sea level change reflect a variety of factors, including vertical land motion (subsidence or uplift), changes in estuarine and shelf hydrodynamics, regional oceanographic circulation patterns, and hydrologic cycles (river flow). So, while global measurements and projections are important for estimating SLR, local measurements and projections are needed for realistic local planning efforts. For the Tampa Bay region, the CSAP recommends using data collected from the tide station located near downtown St. Petersburg as the basis for adjusting the first two parameters that are needed to predict regional SLR. The St. Petersburg tide station7 has the longest reliable period of record (1946 to present) in the region and is consistent with other nearby tide stations, including one located in the Gulf of Mexico at Clearwater8. Data measured at the St. Petersburg tide station shows that water levels in Tampa Bay have increased approximately 6.6 inches or approximately 1 inch/decade (see Figure 2).
4 Most often, this point in the future is the year 2100. However, this does not mean that we only know what the predicted sea level will be in 2100. The quadratic function can show possible sea levels at any point along the curve, between now, 2100 and beyond. 5 http://tidesandcurrents.noaa.gov/datums.html?id=8726520 6 http://tidesandcurrents.noaa.gov/sltrends/sltrends_station.shtml?stnid=8726520 7 http://tidesandcurrents.noaa.gov/stationhome.html?id=8726520 8 http://tidesandcurrents.noaa.gov/stationhome.html?id=8726724&name=Clearwater Beach&state=FL
Figure 1. Map of the four county region served by the CSAP.
2

RECOMMENDED PROJECTION OF SEA LEVEL RISE IN THE TAMPA BAY REGION
Figure 2. Mean Sea Level Trend (relative to Mean Lower Low Water) in St. Petersburg, Florida, NOAA Tide Gauge #8726520 The final parameter, projections of how much sea level will change globally over the next 100 years, is derived from experts engaged in climate science. Currently, there are two primary sources of information regarding sea level rise projections: the Intergovernmental Panel on Climate Change (IPCC) and the US National Climate Assessment (NCA). Although these assessments employ different methods (IPCC relies upon numerical process models; the NCA uses semi-empirical models), both produce estimates of SLR that are consistent with the other. This implies that the results obtained through either approach are robust and should provide practitioners with a higher degree of confidence in using the recommended projections for planning purposes. The 2012 National Oceanic and Atmospheric Administration (NOAA) Technical Report, Global Sea Level Rise Scenarios for the United States National Climate Assessment, was produced as a coordinated, interagency effort to identify nationally agreed upon estimates for global SLR. The report synthesized the scientific literature on global SLR, included input from national experts in climate science, physical coastal processes and coastal management, and produced a set of four plausible SLR scenarios that can easily be adjusted for regional conditions throughout the United States. The projections included in the report will be reviewed every five years in concert with the NCA and the projections use the most current science available. For
3

RECOMMENDED PROJECTION OF SEA LEVEL RISE IN THE TAMPA BAY REGION
these reasons, the CSAP recommends that local governments and regional agencies use the set of four global SLR scenarios included in the NCA (hereinafter the NOAA SLR projections9), adjusted to local conditions, to inform adaptation and infrastructure planning efforts in the Tampa Bay region. Future SLR estimates can be calculated for the Tampa Bay region, integrating data from the local St. Petersburg tide gauge, using a flexible, well-supported tool developed by the United States Army Corps of Engineers (USACE)10. The tool takes the three parameters discussed above (datum, rate of change, projection) and produces the plots or tables that describe how sea level will change in the future, such as those included as Figure 3 and Table 111.
Figure 3. Graphic Relative Sea Level Change (RSLC) Scenarios for St. Petersburg, Florida, as calculated using the NOAA projections and regional corrections. (USACE, 2015)
9 NOAA led the multi-agency effort to inform the sea level portion of the NCA and produced the key technical report, so we will refer to these as the NOAA SLR projections. 10 Although the CSAP recommends using the USACE Sea Level Change Curve Calculator Tool, this should not be confused with a recommendation of the USACE SLR projections. The USACE SLR projections are similar to the results produced by the IPCC and NCA, but are based on the National Research Council (NRC) report, Responding to Changes in Sea Level; Engineering Implications, published in 1987. 11 When using the USACE Sea Level Change Curve Calculator Tool, first select the “St. Petersburg, FL” gauge, then choose “NOAA” as the output agency and factor the projected SLC rate as “Regionally Corrected.”
4

RECOMMENDED PROJECTION OF SEA LEVEL RISE IN THE TAMPA BAY REGION
The regionally adjusted NOAA SLR projections through 2100 (Table 1 and Figure 3) can be summarized as follows:
• NOAA Low (0.93 feet): This is a linear continuation of the historically measured rate of sea level rise and is generally considered appropriate for use as a baseline comparison or in circumstances where there is a great tolerance for risk.
• NOAA Intermediate Low (1.97 feet): This is based on global mean SLR projections from the IPCC 4th Assessment Report and primarily characterizes risks attributed to ocean warming.
• NOAA Intermediate High (4.26 feet): This is an average of the high end of ranges of global mean SLR reported by several studies12 using semi-empirical approaches that attempt to characterize the complex relationships between observed sea level change, air temperature, and actual ice sheet loss.
• NOAA High (6.89 feet): This is derived from a combination of estimated ocean warming from the IPCC 4th Assessment Report global SLR projections and a calculation of the maximum possible glacier and ice sheet loss by the end of the century.
Table 1. Relative Sea Level Change Scenarios for St. Petersburg, Florida in Feet above Local Mean Sea Level (LMSL).
Summary Based upon a thorough assessment of scientific data and literature on SLR, the CSAP concludes that the Tampa Bay region may experience SLR somewhere between 6 inches to 2.5 feet in 2050 and between 1 to 7 feet in 2100. Given this range of uncertainty in future SLR, the
12 Grinsted et al. 2009; Jevrejeva et al. 2010; Vermeer and Rahmstorf, 2009; Horton et al. 2008 from NOAA Tech Memo OAR CPO, p. 12.
5

RECOMMENDED PROJECTION OF SEA LEVEL RISE IN THE TAMPA BAY REGION
CSAP encourages local governments and other agencies to use multiple scenarios in order to allow experts and decision makers the flexibility to consider a variety of contextual factors, including the expected lifespan of the project, project cost, and criticality of function, when developing adaptation strategies. Scenario planning offers opportunities to initiate actions now by balancing the costs of inaction against reasonable returns on investments made to infrastructure that may reduce future impacts and vulnerabilities. For example, decision makers may decide to plan for the NOAA Intermediate Low or Intermediate High scenarios when faced with projects with low to moderate risk tolerance such as temporary projects or infrastructure projects with a relatively short life cycle, while they may choose to plan for the NOAA High scenario in situations where there is little tolerance for risk (e.g. new infrastructure with a long anticipated life cycle such as a power plant, waste water treatment facility, or bridge) (NOAA, 2012). The level of adaptation planning necessary will be up to the planning entity and based on the acceptable level of risk and vulnerability. The decision to use a common set of SLR scenarios throughout the Tampa Bay region will promote the efficient development of vulnerability assessment information, provide a platform for broad consensus that can facilitate political support at the local government level, enable increased inter-governmental sharing of policies, and serve as a resource for smaller local governments in the region that frequently look to their larger neighbors for planning and policy guidance. Furthermore, use of a regional set of scenarios for SLR will enable other entities, such as the CSAP, universities, regional agencies (e.g. Tampa Bay Estuary Program, Tampa Bay Regional Planning Council, Tampa Bay Water, Southwest Florida Water Management District) and others to develop decision support tools, best practices, and planning documents to inform policy, planning, and adaptation strategies for local governments and regional agencies managing transportation, infrastructure, water resources, and natural systems. The CSAP recommendations are intended to further these goals, but it is also important to acknowledge that scientific research is evolving. In order to keep up with the best available science, the CSAP advises that this recommendation be revisited, at minimum, every five years and sooner if significant scientific information on future SLR becomes available. Local governments and other agencies planning for sea level rise in the Tampa Bay region should incorporate three key findings of the CSAP recommendation:
• Adaptation planning should employ a scenario-based approach that considers, at a minimum, location, time horizon, and risk tolerance.
• Projections of SLR should be consistent with present and future National Climate Assessment estimates and methods.
• Projections of SLR should be regionally corrected using the St. Petersburg tide gauge data.
A resilient Tampa Bay – one that acknowledges and responds to coastal vulnerabilities – is one that can support the economic, environmental, and cultural prosperity of this unique and highly valuable region.
6

RECOMMENDED PROJECTION OF SEA LEVEL RISE IN THE TAMPA BAY REGION
References
Butler, W, R Deyle, C. Mutnansky, and L. Stevens. 2013. Sea Level Rise Projection Needs Capacities and Alternative Approaches: A Policy Briefing for the Florida Department of Economic Opportunity. Florida Planning and Development Lab, Department of Urban and Regional Planning, The Florida State University, 148 pp. http://ezadmin.fsu.edu/content/download/157060/1392750/version/1/file/Sea+Level+Rise+Projection+Needs+Capacities+and+Alternative+Approaches+Sept+2013.pdf Hallegatte, Stephane, Colin Green, Robert K. Nicholls, and Jan Corfee-Morlot. 2013. Future Flood Losses in Major Coastal Cities, Nature Climate Change (3), 802-806 pp. IPCC, 2013: Climate Change 2013: The Physical Science Basis. Contribution of Working Group I to the Fifth Assessment Report of the Intergovernmental Panel on Climate Change [Stocker, T.F., D. Qin, G.-K. Plattner, M. Tignor, S.K. Allen, J. Boschung, A. Nauels, Y. Xia, V. Bex and P.M. Midgley (eds.)]. Cambridge University Press, Cambridge, United Kingdom and New York, NY, USA, 1535 pp. http://www.ipcc.ch/report/ar5/wg1/ Marcy D., A. Allen, W. Sweet, S. Gill, A. Luscher-Aissaoui, E. Myers, C. Zervas. 2012. Incorporating Sea Level Change Scenarios at the Local Level. NOAA. http://www.ngs.noaa.gov/PUBS_LIB/SLCScenariosLL.pdf Melillo, Jerry M., Terese (T.C.) Richmond, and Gary W. Yohe, Eds., 2014: Climate Change Impacts in the United States: The Third National Climate Assessment. U.S. Global Change Research Program, 841 pp. http://nca2014.globalchange.gov/report National Research Council. 1987. from Responding to Changes in Sea Level: Engineering Implications. National Research Council. 2014. Reducing Coastal Risk on the East and Gulf Coasts. Washington, DC: The National Academies Press. http://www.nap.edu/openbook.php?record_id=18811 NOAA. NOAA Tides and Currents. 2014. St. Petersburg, FL Station ID: 8726520. http://tidesandcurrents.noaa.gov/stationhome.html?id=8726520. Parris, A., P. Bromirski, V. Burkett, D. Cayan, M. Culver, J. Hall, R. Horton, K. Knuuti, R. Moss, J. Obeysekera, A. Sallenger, and J. Weiss. 2012. Global Sea Level Rise Scenarios for the US National Climate Assessment. NOAA Tech Memo OAR CPO-1. 37 pp. http://scenarios.globalchange.gov/sites/default/files/NOAA_SLR_r3_0.pdf
7

RECOMMENDED PROJECTION OF SEA LEVEL RISE IN THE TAMPA BAY REGION
Tampa Bay Estuary Program and Tampa Bay Regional Planning Council Economic Analysis Program. 2014. Economic Valuation of Tampa Bay. Technical Report #04-14 of the Tampa Bay Estuary Program. https://tbeptech.org/TBEP_TECH_PUBS/2014/TBEP_04_14_%20FinalReport_Economic_Valuation_of_Tampa_Bay_Estuary.pdf Tampa Bay Regional Planning Council. 2006. Sea Level Rise in the Tampa Bay Region. http://www.tbrpc.org/mapping/pdfs/sea_level_rise/Tampa%20Bay%20-%20Sea%20Level%20Rise%20Project%20Draft%20Report%20without%20maps.pdf U.S. Army Corps of Engineers. 2013. ER 1100-2-8162: Incorporating Sea Level Change in Civil Works Programs. http://www.publications.usace.army.mil/Portals/76/Publications/EngineerRegulations/ER_1100-2-8162.pdf U.S. Army Corps of Engineers. 2014. ETL 1100-2-1: Procedures To Evaluate Sea Level Change: Impacts, Responses and Adaptation. http://www.publications.usace.army.mil/Portals/76/Publications/EngineerTechnicalLetters/ETL_1100-2-1.pdf U.S. Army Corps of Engineers. 2014. ECB 2014-10: Guidance for Incorporating Climate Change Impacts to Inland Hydrology in Civil Works Studies, Designs, and Projects. http://www.iwr.usace.army.mil/Portals/70/docs/Climate%20Change/ecb_2014_10.pdf U.S. Army Corps of Engineers. 2015. Online Sea Level Change Calculator. http://www.corpsclimate.us/ccaceslcurves.cfm. Accessed 4/16/2015
8

RECOMMENDED PROJECTION OF SEA LEVEL RISE IN THE TAMPA BAY REGION
List of Acronyms
CSAP Tampa Bay Climate Science Advisory Panel IPCC United Nations Intergovernmental Panel on Climate Change LMSL Local Mean Sea Level MLLW Mean Lower Low Water MSL Mean Sea Level NCA U.S. National Climate Assessment NOAA National Oceanic and Atmospheric Administration NRC National Research Council NTDE National Tidal Datum Epoch RSLC Relative Sea Level Change SLR Sea Level Rise USACE United States Army Corps of Engineers
9

RECOMMENDED PROJECTION OF SEA LEVEL RISE IN THE TAMPA BAY REGION
Definition of Terms
Datum: The base elevation used as a reference from which to calculate heights or depths; the point in time at which the sea level is defined to be zero.
Mean Lower The average of the lower low water height of each tidal day observed Low Water: over the National Tidal Datum Epoch. Mean Sea Level: The arithmetic mean of hourly heights observed over the National Tidal
Datum Epoch. Shorter series are specified in the name; e.g. monthly mean sea level and yearly mean sea level. Local Mean Sea Level (LMSL) is the arithmetic mean of hourly heights at the specific tide station at which it was observed and should not be confused with any other vertical datum, including LMSL at other tide stations.
National Tidal The specific 19-year period adopted by the National Ocean Service as Datum Epoch: the official time segment over which tide observations are taken and
reduced to obtain mean values for tidal datums. It is necessary for standardization because of periodic and apparent secular trends in sea level. The present NTDE spans 1983 through 2001 and is referred to as the mid-point or 1992. The NTDE is actively considered for revision every 20-25 years.
Projection: The numerical value of sea level change between time zero and some point in the future.
Rate of Change: How rapidly sea level is changing (increasing or decreasing) at time zero.
Relative Sea The variance in the height of the water as measured in reference to a Level Change: specific, stable vertical point on land (known as a benchmark) due to
changes in local conditions (e.g. subsidence or vertical uplift).
Scenario: The quadratic function that shows possible sea levels at any point along the curve, between time zero and some point in the future.
Tool: An application that processes the datum, rate of change and projection to produce the plots or tables that describe how sea level will change in the future (e.g. USACE Sea Level Change Curve Calculator)
10

RECOMMENDED PROJECTION OF SEA LEVEL RISE IN THE TAMPA BAY REGION
Tampa Bay Climate Science Advisory Panel
Organization Representative Designated Alternate UF/IFAS Extension, Florida Sea Grant Libby Carnahan (Facilitator) Tampa Bay Regional Planning Council Maya Burke Brady Smith, AICP Tampa Bay Estuary Program Lindsay Cross Ed Sherwood
Tampa Bay Water Dr. Alison Adams, P.E. Dr. Tirusew Asefa, P.E., D.WRE
Southwest Florida Water Management District John Ferguson, P.G. James Golden, AICP
Florida Climate Institute Dr. Gary Mitchum US Geological Survey Dr. Nathaniel Plant Dr. Hilary Stockdon NOAA National Weather Service, Tampa Bay Dr. Charlie Paxton
University of South Florida, School of Public Affairs Dr. Mark Hafen
University of South Florida, College of Marine Science Dr. Mark Luther Dr. Steve Meyers
NOAA Office for Coastal Management, Gulf Coast Heidi Stiller Kristen Laursen
Florida Sea Grant Thomas Ruppert, Esq. Pinellas County Kelli Hammer-Levy Andy Squires Environmental Protection Commission of Hillsborough County Margaret Rush Tom Ash
Manatee County Rob Brown
Pasco County Melissa Charbonneau Keith Wiley, Curtis Franklin
US Army Corps of Engineers Glenn Landers (Technical Advisor, ex officio)
Suggested citation: Tampa Bay Climate Science Advisory Panel. 2015. Recommended Projection of Sea Level Rise in the Tampa Bay Region.
11

Economic Impacts of Sea Level Rise in the Tampa Bay Region
January 2017

Authors Acknowledgements Randy Deshazo Principal Economic Planner Brady Smith Principal Planner Avera Wynne Planning Director Heather Young Senior Environmental Planner Contact [email protected] (727) 570-5151 X 31 January 2017.
About the Economic Analysis Program
The authors wish to thank the TBRPC Board, the Agency on Bay Management and the One Bay Resilient Communities Working Group for providing comments.
Since 1999, the Tampa Bay Regional Planning Council has been producing economic impact studies for a variety of public and private sector clients. Using the most powerful analytical tools, including IMPLAN and REMI PI+, the Council’s Economic Analysis Program has produced hundreds of reports covering topics such as job creation, land use, natural resources and energy, as well as a variety of public policy questions.
The Tampa Bay Regional Planning Council is an association of local governments from Hillsborough, Manatee, Pasco, Citrus, Hernando and Pinellas Counties.
Cover page: Top to bottom: Courtney Campbell Causeway flooding during Hurricane Hermine (photo by Heather Young, TBRPC), Oblique 2015 aerial of Fort De Soto (courtesy of the National Oceanic and Atmospheric Administration). Background map created by TBRPC using ©Mapbox basemap.

1
Executive Summary
Rising sea levels may submerge many areas of the Tampa Bay region by 2060. While there are varying estimates, one worst case possibility suggests that sea levels may rise as much as 2.95 over the next forty years. Such an increase may cause thousands of properties to be flooded, thousands of jobs to be lost, lost taxes and lost income from tourism as well as the loss of much of the region’s barrier islands.
Using Geographic Information Systems, economic impact software, county property records and employment data, the Tampa Bay Regional Planning Council (TBRPC) prepared The Cost of Doing Nothing: Economic Impacts of Sea Level Rise in the Tampa Bay Region to consider the potential impacts of year round flooding on the regional economy. Together these impacts bear cumulative costs of $162 billion to the region’s Gross Regional Product. The direct impacts of sea level rise are summarized in the following table.
But direct impacts from inundation are only part of the story. Sometimes the most important and longer lasting impacts of large scale events are indirect in nature. As such, The Cost of Doing Nothing: Economic Impacts of Sea Level Rise in the Tampa Bay Region assesses the direct and indirect impacts of sea level rise on the regional economy. Because there are many different ways of framing sea level rise as a problem, the Tampa Bay Regional Planning Council prepared a series of computer simulations using REMI PI+, a sophisticated economic modeling tool, to compare different aspects of the issue.
The simulations viewed the same issue—the implications of a sea level rise of 2.95 feet—on different aspects of the economy. In the first simulation, TBRPC examined the stand-alone implications of the loss of some $16 billion in inundated properties, of lost property taxes and lost access to jobs. This simulation anticipates the loss of $2 billion of Gross Regional Product to the regional economy in 2060.
The second simulation considered the loss of non-tourism related jobs. This scenario anticipates the loss of $4.4 billion of Gross Regional Product in 2060 while the third simulation, modeling the loss of tourism jobs, results in the loss of $1.9 billion in Gross Regional Product. While these three different angles overlap conceptually and are inseparable under actual inundation conditions, the simulation results define the nature of the problem. Even though Sea Level Rise can flood much of the region’s coastal land and its tourist economy, it is the non-tourism related economy that has the most to lose.
When Mean Sea Level Increases by 2.95 Feet Estimate Value of Submerged Residential Property in 2015 $14.9 Billion Value of Submerged Commercial Property in 2015 $1.3 Billion Cumulative loss of Property Taxes (2020-2060) $5.4 Billion Job Losses in submerged areas 17,184

2
Will the events analyzed in this report occur? Probably not. While sea level rise is occurring, it is not yet clear how dramatic that sea level rise will be by 2060. Also, it is likely that if and when flooding occurs, Tampa Bay Area communities will act to mitigate the damage. That mitigation may occur ahead of sea level rise or after its impacts manifest but it is unlikely that nothing will be done to protect property, natural resources and jobs. As such, while reasonable people can disagree about the risks entailed by sea level rise, The Cost of Doing Nothing: Economic Impacts of Sea Level Rise in the Tampa Bay Region provides a roadmap for thinking through them.

3
Introduction
Sea levels are rising around the world1. In recent years, groups of concerned scientists and economists have convened to study the potential impacts of sea level rise and other climate events and to recommend that governments and industry take action to prevent or mitigate those impacts. Those efforts have resulted in studies such as the Risky Business project and the American Climate Prospectus which have raised awareness of the potential risks the American economy and the economies of the fifty states face in the coming years2.
As one of the states most affected by sea level rise, Florida’s economic outlook is particularly important given its population size and importance to the national economy. Focusing on the Tampa Bay Area, one of the most populous metropolitan areas in Florida in 2060, we ask “what economic impacts are anticipated to occur if nothing is done to mitigate the impacts of sea level rise on the Tampa Bay Area?”
Study Focus: Sea Level Rise in the Tampa Bay Area
Based upon the NOAA High sea level rise projection from the Recommended Projection of Sea Level Rise in the Tampa Bay Region, developed by the Tampa Bay Climate Science Advisory Panel (CSAP), the Tampa Bay Regional Planning Council (TBRPC) developed maps depicting a 2.95 foot rise in sea level by 2060. As shown on the map below3 sea level rise may submerge properties along the coastline, including much of the barrier islands in Pinellas County. While the map depicts areas anticipated to be inundated year-round, periodic flooding of other areas further inland may occur as the result of normal storm events. While sea levels will continue to rise, 2060 was chosen as the forecast horizon as this is the last year in the Council’s economic impact model, REMI PI+.
There are numerous potential areas of analysis in studying the impacts of sea level rise. The Hillsborough County Metropolitan Planning Organization (MPO) has already investigated the effects of sea level rise on parts of the transportation network. That study found that disruptions would result in the loss of $109 million in Gross Regional Product by 2035 just from increased travel delays during storm events4.
Of course, travel delays are just one of many potential negative outcomes of sea level rise. Changes in the cost of homeowner insurance, physical damage to utility and transportation infrastructure, exacerbated nuisance flooding and an increased threat from polluted stormwater runoff into Tampa Bay and the Gulf of Mexico are just a few examples.

4
Regional Map Depicting Inundated Areas (Dark Blue) in 2060

5
Quantifying Sea Level Rise Impacts
With many potential areas of analysis, the TBRPC narrowed the study’s focus to model three different aspects of the key sea level rise impact, submerged lands. These three aspects are the loss of property value and consequent loss in government property tax revenue, the loss of jobs on those lands, and the loss of tourism dollars stemming from the loss of beachfront property.
Using County property assessor data and geocoded employment data from Florida Agency for Workforce Innovation, TBRPC identified the key quantitative inputs of the modeling process resulting from a mean sea level increase of 2.95 feet by 2060. Those inputs are summarized below.
When Mean Sea Level Increases by 2.95 Feet Estimate Value of Submerged Residential Property in 2015 $14.9 Billion* Value of Submerged Commercial Property in 2015 $1.3 Billion* Cumulative loss of Property Taxes (2020-2060) $5.4 Billion* Job Losses in submerged areas 17,184
*all currency figures are fixed and local 2015 dollars
A REMI PI+ Model
TBRPC maintains economic impact analysis software to help estimate the impacts of various conjectural policy questions—what would happen if taxes were to increase, or if a new industry began in the Tampa Bay Area—in order to see how those events would affect the regional economy. One of those models, REMI PI+, is a powerful desktop economic simulation tool that can forecast the impacts of thousands of variables across a fifty year time horizon. Its outputs, however, are based on the assumption that inputs are firm when in fact new information will help refine our understanding of future sea level rise. As such, the unambiguous numbers (and maps) that TBRPC presents should be understood as estimates and that actual outcomes will vary.
Assessing the Costs of Inundated Land in the Tampa Bay Area
TBRPC segregated the potential impacts of inundated land in the region into three separate simulations on the regional economy5. Under each of the following scenarios, sea levels will be 2.95 feet over 1992 levels. The scenarios are:
1. Simulation 1(Property Value and Tax Revenue Loss) is the impact of the economy from the economic losses stemming from submerged property. In this case 31,800 parcels lose all economic value.
2. Simulation 2 (Direct Job Loss) refers to the combined effects of direct and indirect job loss to sea level rise on the rest of the economy.
3. Simulation 3 (Tourism Loss) is the loss of tourism spending to the economy.

6
Property Value and Tax Revenue Loss: Simulation 1
Property Value and Tax Revenue loss in the Tampa Bay Area will be gradual in the coming decades and its impacts subtle until higher sea levels inundate coastal lands. The following table summarizes the impacts to submerged land in Hillsborough, Manatee, Pasco and Pinellas County.
Land Use Acres Parcels Value Est. 2015 Taxes Residential 72,048 29,297 $14.9 Bil $241,8 Mil Commercial 4,226 2,316 $1.2 Bil $20.3 Mil Industrial 296 186 $94.5 Mil $2.1 Mil Total 76,570 31,799 $16.2 Bil $264.2 Mil
The economic impact of submerged lands was modeled in Policy Insight by simulating the loss of land in the model. As there is no direct way to do this in the model, TBPRC created a simulation where land costs for residential and commercial land uses increase by the same percentage that the acreage lost represents of all land. If eight percent of the land is submerged by 2060 according to the GIS model, the Council modeled an increase in housing and land costs by eight percent in the REMI PI+ model6.
Without compensating increases to residential and commercial capital stock, increasing costs of land and housing will induce out-migration, increasing job-loss and the loss of personal income and Gross Regional Product. In addition to increases to the cost of existing land, government spending is reduced by the amount of taxes paid by owners of the affected properties. This impact alone represents a cumulative loss of $5.4 billion through 2060.
The following table summarizes the impacts of the simulation. Twelve thousand jobs are lost from the region, while nearly 40,000 people leave the region from the loss of land and the taxes paid on it alone. Because of the gap between optimal residential capital stock and actual residential capital stock grows due to the loss of land when demand for it is on the rise, this is the only simulation with a positive impact on the Price Index.

7
Property Value and Taxes Hills Manatee Pasco Pinellas Tampa Bay Category Units In 2060 for all counties
Total Employment
Thousands (Jobs) -1.292 -2.240 -0.545 -8.404 -12.481
Population Thousands -2.400 -9.634 -3.262 -24.461 -39.757 Labor Force Thousands -0.787 -4.120 -1.564 -12.522 -18.993
Gross Regional Product
Billions of Fixed (2009)
Dollars -0.302 -0.304 -0.070 -1.355 -2.031
Personal Income Billions of
Current Dollars
0.300 -1.436 -0.386 -3.996 -5.518
PCE-Price Index 2009=100 (Nation) 0.180 0.352 0.136 0.587 0.323
Job Losses: Simulation 2
17,184 jobs currently exist on properties anticipated to be submerged by 2060. Assuming existing job densities and the spatial distribution of employment by industry persists through 2060, that many jobs were modeled as being removed from the economy.
The following table estimates the number of jobs lost by industry in areas that are submerged by 2060.
Industry Jobs Accommodation/Food 5,568 Health Care 4,344 Financial Services 2,221 Professional Services 1,674 Retail 1,479 Construction 548 Wholesale/Transportation 539 Education 82 Manufacturing 51 Other 678 Total 17,184
For this simulation, the Council modeled the loss of the jobs in the table above from the regional economy. Because jobs in the accommodation and food services industries are so closely tied to tourism spending, Simulation 2 does not account for the loss of those jobs. Instead, in order to avoid double counting, those job losses and their secondary effects are modeled in the third simulation.

8
Jobs Hills Manatee Pasco Pinellas Tampa Bay Category Units In 2060 for all counties Total Employment
Thousands (Jobs) -6.365 -2.803 -1.108 -16.041 -26.318
Population Thousands -8.491 -3.657 -0.837 -21.456 -34.442 Labor Force Thousands -4.998 -2.086 -0.644 -12.335 -20.064 Gross Regional Product
Billions of Fixed (2009)
Dollars -1.365 -0.502 -0.17 -2.371 -4.408
Personal Income Billions of Current Dollars
-1.934 -0.933 -0.504 -4.717 -8.088
PCE-Price Index 2009=100 (Nation) -0.21 -0.307 -0.187 -0.617 -0.34
As with the first simulation, thousands of jobs are lost, and 34,442 people move out of the region. Of the three simulations, direct and secondary job losses are the most impactful to the economy.
Tourism Losses: Simulation 3
Tourism is one of the pillars of the region’s economy and with much of the region’s attractive beaches modeled to be underwater, the impact to the recreation economy could be enormous. Since there are no prior region specific studies of the loss of coastal land to sea rise, staff made several assumptions about changes to existing conditions for the purposes of the simulation.
Visitors to the region spent about $12 billion a year between 2013 to 20157. Using industry standards for revenue per hotel employee, the Council modeled the loss of tourism spending by the estimated number of hotel employees in inundated areas, proportionately scaled over 40 years to reflect the slow increase in mean sea level. While this approach likely underestimates the true amenity value of the beach front property, those values are highly subjective in comparison to more directly estimated revenue losses.
Tourism Losses Hills Manatee Pasco Pinellas Tampa Bay Category Units In 2060 for all counties Total Employment
Thousands (Jobs) -3.934 -2.306 -1.969 -8.727 -16.937
Population Thousands -5.060 -4.176 -5.538 -12.300 -27.074 Labor Force Thousands -2.900 -2.129 -2.908 -6.959 -14.896 Gross Regional Product
Billions of Fixed (2009)
Dollars -0.584 -0.223 -0.176 -0.898 -1.881
Personal Income Billions of Current Dollars
-0.811 -0.715 -0.831 -2.227 -4.584
PCE-Price Index 2009=100 (Nation) -0.113 -0.215 -0.190 -0.312 -0.202

9
Composite Simulation
The final step in the REMI PI+ analysis was re-running all three simulations as a single set of events in a Composite Simulation. That Composite Simulation is not the sum of all of the other simulations. Instead, some factors cancel each other out or represent the same kinds of effects which REMI PI+ accounts. For example, Price Index increases due to the loss of land are overwhelmed by the impacts of the loss of jobs and tourism dollars, leading to an overall decline in the Price Index through the forecast. In other cases, the figures reported in the table below are similar to the sum of all of the other simulations, but not necessarily the same because of interaction effects between the different variables of each simulation.
All Simulations Hills Manatee Pasco Pinellas Tampa Bay Category Units In 2060 for all counties Total Employment
Thousands (Jobs) -11.579 -7.332 -3.609 -33.065 -55.585
Population Thousands -15.974 -17.355 -9.605 -57.746 -100.68 Labor Force Thousands -8.69 -8.297 -5.102 -31.578 -53.666 Gross Regional Product
Billions of Fixed (2009)
Dollars -2.472 -1.128 -0.455 -5.057 -9.112
Personal Income Billions of Current Dollars
-1.102 -1.35 -0.731 -4.902 -8.084
PCE-Price Index 2009=100 (Nation) -0.15 -0.176 -0.246 -0.355 -0.214
As such, the Composite Simulation is a useful means to compare different simulations. For example, the following graphic compares how each aspect of submerged lands influences change in Personal Income. In this case, Job losses are the biggest drag on personal income (48%), followed by submerged property values (28%) and then the effects of lost tourism dollars (24%).

10
Cumulative Effects of Composite Simulation
In any given year of the slow increase in the mean sea level, economic impacts on the region are significant but not overwhelming. In this table, the Council presents 40 years of cumulative pecuniary impacts to the Tampa Bay region’s economy.
All Simulations Hills Manatee Pasco Pinellas Tampa Bay Category Units Cumulative 2020-2060 Gross Regional Product
Billions of Fixed (2009)
Dollars -43.115 -20.244 -8.219 -88.926 -160.503
Personal Income Billions of Current Dollars
-19.009 -22.103 -12.411 -80.755 -134.28
Conclusion
This report considers the economic implications of the unlikely event that rising sea levels will be ignored by policymakers. Some Florida communities, such as Miami Beach, are already investing millions of dollars to retrofit existing buildings and infrastructure to handle sea level rise. Instead, we ask what would happen if no action is taken to prepare for sea level rise. With a sense of the scale of costs, individual communities or the region as a whole can weigh the benefits of acting and investing early or waiting to see what happens and adjust later.
Besides calculating direct and indirect costs, parsing and comparing the different categories of potential impacts of sea level rise is helpful in defining the dimensions of the challenges facing policymakers. For example, a public policy approach that rests on a principle that the primary beneficiary of mitigation pays the most to cover mitigation costs might result in higher taxes on commercial property but levies fewer taxes on residential property owners, and fewer still on
-10
-8
-6
-4
-2
0Property Values Jobs Tourism
Billi
ions
of c
urre
nt D
olla
rs
Simulation Comparisons on Personal Income in 2060

11
accommodation establishments. Analyses such as these can be useful in staking out potential mitigation strategies, while in the private sector insurance premiums will influence future decision making on residential and commercial investment.
Because the problems posed by sea level rise are incremental and grow slowly over time, any discussion of mitigation needs to consider the role of scale in defining the problem. Leaving aside the vast costs of doing nothing over forty years--$161 Billion of lost Gross Regional Product in 2015 dollars—in each year the impact is relatively small compared to the size of the region’s economy. Even in the peak year of sea level impacts, 2060, the region’s Gross Product is reduced by less than three percent. The benefit of relatively small damage to the economy is that sea level rise will not have catastrophic consequences for the entire region in 2060.
However, the worst case scenario is not a foregone conclusion. The actual results of sea level rise may be different than 2.95 feet, and it may be even less by 2060. But even lower sea level rise estimates may carry risks for property and infrastructure. The first step in understanding those risks occurs through modeling exercises like this study.
Directions and Need for Future Analysis
This study focusses on just a few potential impacts of sea level rise because there are many other potential areas of analysis. Potential areas for future study include: how will extreme weather events impact storm drainage and emergency management facilities when they are already compromised by decades of sea level events? How will periodic loss of access through submerged roads affect businesses? How will skyrocketing flood insurance costs shape the housing market, even if the value of homes drop?
Perhaps most important but the most difficult question to answer is how much will it cost to offset sea level rise through technological means or capital investment? From an economic feasibility standpoint, will the investment be worth it?
Category Units
Baseline 2060 Data Percent Impact of Composite Simulation
on Baseline Total Employment Thousands (Jobs) 2320 -2.55% Population Thousands 4400 -2.50% Labor Force Thousands 2141 -3.16% Gross Regional Product Billions of Fixed
(2009) Dollars 371.51 -2.32%
Personal Income Billions of Current Dollars
893.7 -2.17%
PCE-Price Index 2009=100 (Nation) 247.63 -0.09%
12
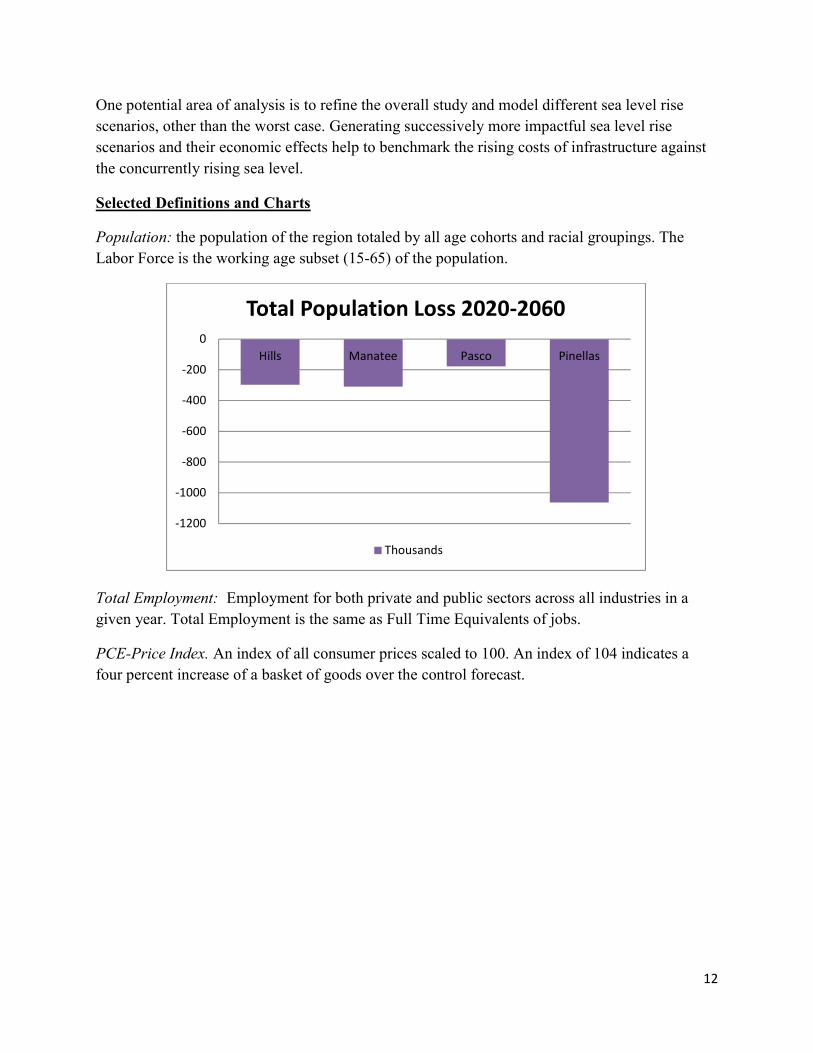
One potential area of analysis is to refine the overall study and model different sea level rise scenarios, other than the worst case. Generating successively more impactful sea level rise scenarios and their economic effects help to benchmark the rising costs of infrastructure against the concurrently rising sea level.
Selected Definitions and Charts
Population: the population of the region totaled by all age cohorts and racial groupings. The Labor Force is the working age subset (15-65) of the population.
Total Employment: Employment for both private and public sectors across all industries in a given year. Total Employment is the same as Full Time Equivalents of jobs.
PCE-Price Index. An index of all consumer prices scaled to 100. An index of 104 indicates a four percent increase of a basket of goods over the control forecast.
-1200
-1000
-800
-600
-400
-200
0Hills Manatee Pasco Pinellas
Total Population Loss 2020-2060
Thousands

13
Personal income is wages and all transfer payments.
Gross Regional Product is the value of all goods and services produced in the region.
SLR Methodology
The 2060 sea level rise inundation areas for the Tampa Bay region were selected using the NOAA High sea level rise simulation from the Recommended Projection of Sea Level Rise in the Tampa Bay Region. The Tampa Bay CSAP recommends that local governments and regional agencies use the set of four regionally adjusted sea level rise projections, shown below8. Using the regionally-adjusted NOAA High projection, local mean sea level in the Tampa Bay region in 2060 is estimated to be 2.95 feet above local mean sea level in 1992, the midpoint of the present National Tidal Datum Epoch (NTDE).
-0.40%
-0.35%
-0.30%
-0.25%
-0.20%
-0.15%
-0.10%
-0.05%
0.00%Hills Manatee Pasco Pinellas Tampa Bay
Percent Change in Price Index in 2060
Change in PCE
-6.00%
-5.00%
-4.00%
-3.00%
-2.00%
-1.00%
0.00%2020 2030 2040 2050 2060
Percent Change in Gross Regional Product
Tampa Bay Hills Manatee Pasco Pinellas

14
TBRPC’s SLR Assessment Tool, an extension used in conjunction with geospatial analysis software, was employed to determine the land areas that are projected to be frequently inundated in the Tampa Bay region under the regionally-corrected NOAA High simulation for the year 2060. The SLR Assessment Tool uses a LIDAR-based digital elevation model (DEM) of land surfaces in the Tampa Bay area, current (NTDE) tidal datums, and user-input sea level rise values to create a geographic information system (GIS) layer that depicts inundation areas under increased sea level conditions.
The SLR Assessment Tool creates an inundation surface by determining the water surface elevation for a given point under the increased sea level simulation, using NOAA’s interpolated mean higher high water (MHHW) dataset for the present NTDE as the base elevation. The elevation of the land surface at the same point with respect to the North American Vertical Datum of 1988 (NAVD 88) is determined from the DEM. The DEM elevation value is subtracted from the water surface elevation for all coastal locations throughout the region, and
Illustration 1: Relative Sea Level Change in Feet
15
locations where the water surface value is greater than the DEM elevation are shown to be inundation areas. In this analysis, all sea level rise inundation areas have surface hydrologic connectivity to the sea under the increased sea level conditions. Areas in the model where the land elevation is greater than the projected 2060 water surface elevation act as barriers that seawater may not cross. However, seawater may circumvent these barriers if the water surface elevation is high enough to inundate lower elevation land areas nearby.
The 2060 inundation analysis considers projected tidal levels at the MHHW tidal datum. Since MHHW is the average of the higher of the high tide levels each day, the inundation areas determined in this analysis would be expected to frequently experience sunny-day flooding at the highest high tide of the day in 2060. This analysis does not consider heavy precipitation events, where the stormwater drainage system may not be effective in removing excess rainwater from dry land areas. Backflow of seawater through the subsurface stormwater drainage system is not accounted for in this analysis. Also, storm surge from tropical cyclones and other weather systems is not considered. Heavy precipitation, backflow, and storm surge would all be expected to increase the geographic coverage of the inundation areas, though typically on a temporary basis and with lower frequency than sunny day tidal flooding.
The Quarterly Census of Employment and Wages (QCEW) dataset from the third quarter of calendar year 2015 was used to help determine the impacts of potential future increased sea level conditions. The QCEW dataset, compiled by the State of Florida Bureau of Labor Market Statistics, contains information about geographic location, number of employees, and total wages at each place of employment for businesses/entities that are subject to state Unemployment Insurance (UI) laws. Geocoded location information for each reporting unit was compared with the location of the projected 2060 sea level rise inundation areas for the Tampa Bay region using geographic information system software. Places of employment that intersect the projected 2060 inundation areas are considered to be directly impacted.
Parcel data obtained from the property appraisers’ offices in Hillsborough, Manatee, Pasco, and Pinellas Counties were compared with the projected 2060 sea level rise inundation areas for the Tampa Bay region in a geographic information system. Properties that have greater than 20 percent of their total parcel land area in the projected 2060 sea level rise inundation zone are considered to be directly impacted in this analysis.
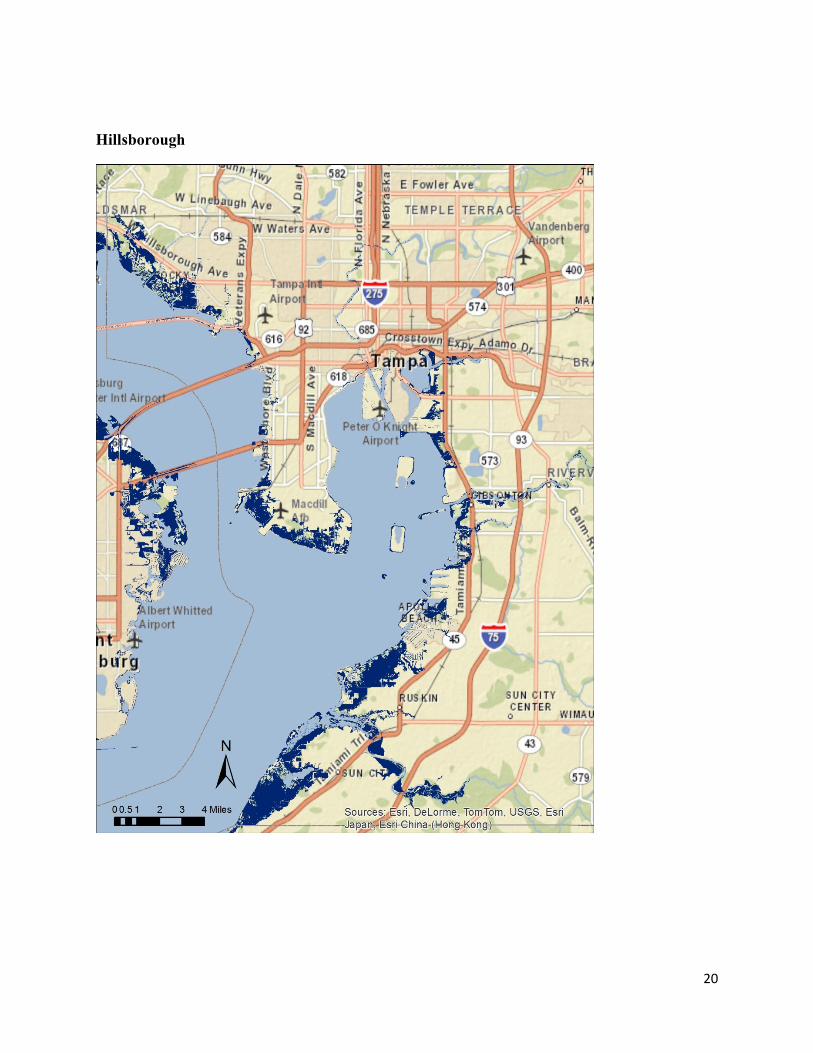
Inundation Maps
The Regional Map and the following larger scale maps indicate the Mean Higher High Water Level in 2060, based on the best currently available data and on the current worst case scenario of a 2.9 foot increase in sea level rise. The following maps highlight areas of interest in the Regional Map and reflect the same assumptions and data.

16
Pinellas County

17
Pinellas Beaches

18
Bradenton and Beaches

19
Pasco
20
Hillsborough

21
1 http://oceanservice.noaa.gov/facts/sealevel.html 2 http://riskybusiness.org and http://climateprospectus.org/ 3 Dark blue indicates inundation areas at Mean Higher High Water (MHHW) based upon the regionally-corrected NOAA High SLR Simulation for 2060 (+2.95 ft over the 1992 MHHW level).
4 Hillsborough County. Vulnerability Assessment and Adaptation Pilot Project. October 2014. P. 32. 5Due to the timing of the original grant terms, the region refers to Hillsborough, Manatee, Pasco and Pinellas Counties. 6 Since there is no true equivalence between the percentage of acres lost and the resulting percentage increase in costs, the assumed precise trade-off between the two variables is intended to ensure that the impacts are roughly on the same magnitude even as there no existing studies that account for the permanent loss of a primary factor of production to sea level rise.
7 Visit Tampa Bay and Visit St Pete/Clearwater, 2015. 8 Tampa Bay Climate Science Advisory Panel. 2015. Recommended Projection of Sea Level Rise in the Tampa Bay Region

City of Largo, Florida
Largo’s Environmental Action Plan2018 LEAP
Policy and Data Appendix
January 1, 2018
25

Introduction
The Largo Environmental Action Plan, LEAP, is the City’s first environmentally focused operations plan, created overthe last year by critical staff members with information from every Department in the City. LEAP aims to report progress and set priorities for our organization in order to move forward in the most sustainable and resilient manner possible. This appendix serves as the backbone of LEAP and contains the metrics, data and policies for all outlined indicators in the plan.
There are two types of information displayed in this document, both of which help steer our long-term and daily operations toward the focus areas identified in the Strategic Plan.
Quantitative DataA fundamental goal of LEAP is to increase internal collaboration and stakeholder engagement within our organization Many indicators in LEAP were previously reported in various methods such as annual or quarterly reports. Showcasing these metrics in one document allows us to better understand our overall impact and ways that we can achieve a collective goal. Some LEAP metrics are new data points that will be collected for LEAP annually and are represented as baseline data in this report.
These quantitative measures allow us to clearly define our progress towards a more sustainable community and adjust our plans and daily operations towards more successful outputs in our organization and the community.
Recommendation ListsQualitative data in this report is presented as a recommendation list for each corresponding indicator within LEAP. Indicators are presented in this way as they may not be financially feasible at the moment, they may need to be completed over lengthier timelines to ensure overall project sustainability or more data collection is needed before taking action. Potential action items in each list are broken into three components:
A. Community & Staff Outreach and EducationB. City Operation & ProjectsC. City Codes & Policies
All of the data presented in this plan is presented topically in order to include information from multiple Departments when necessary, and to be comprehensible to the public.
26

Topic: InfrastructureFocus Area: Buildings & EnergyIndicator 1: Total Energy Reduction by Complex Current: Baseline Data 2016, Goal: Overall Reduction of 20%
BackgroundThe City spends nearly $2 million dollars annually on energy costs to run City infrastructure. A 20% reduction in usage may result in annual savings of over $375,000. One method of energy savings can be through encouraging behavior changes in employees such as turning lights off when leaving a room and powering down work stations at the end of the day. The amount of lighting can also be reduced by removing a percentage of lights in a room or adjusting their location, as well as replacing old lighting with LEDs. Additionally, Energy Savings Contracts can be created to contribute to a much larger cost savings through methods such as upgraded lighting, HVAC, control and energy systems. Investing in solar and alternative power sources can also offset the overall costs of a building.
Focusing these efforts on our least cost-effective buildings will not only increase the fiscal longevity of the City, it will also create the greatest impact on the environment through reduced resource consumption and greenhouse gas emissions.
Rank Park/Complex Name Annual Cost Acreage Cost/Acre1 Whitesell $15,109.10 39.3 $384.462 Sports Complex $8,042.88 13.27 $606.093 Bayhead $7,190.85 10.91 $659.114 Belcher Complex $5,432.74 7.99 $679.94
Total Annual Cost $35,775.57
New Annual Cost Annual Savings5% Energy Reduction $33,986.79 $1,788.7810% Energy Reduction $32,198.01 $3,577.5620% Energy Reduction $28,620.46 $7,155.11
27

Rank Complex Name Annual Cost Square Feet Cost/Square Feet Notes1 PW Complex $36,648.61 60201 $0.612 Feed Store $3,558.77 4802 $0.743 Golf Course Clubhouse $12,236.32 13094 $0.934 Police Complex $42,943.95 44879 $0.965 Parks Admin $9,637.54 7434 $1.306 Fire Station 42 $8,166.12 5300 $1.547 Fire Station 41 $22,761.65 14200 $1.608 Fire Station 38 $10,575.51 6503 $1.639 Fire Station 39 $9,330.46 5300 $1.7610 Community Center $56,530.67 31121 $1.8211 Library $164,798.76 90300 $1.8312 CPPAC $49,910.31 26000 $1.9213 Southwest Complex $87,545.03 33548 $2.61 Building, Courts & Pool14 Highland Complex $87,795.52 32754 $2.68 Building and Pool15 City Hall $279,099.60 57742 $4.83
Total Annual Cost $881,538.82
New Annual Cost Annual Savings5% Energy Reduction $837,461.88 $44,076.9410% Energy Reduction $793,384.94 $88,153.8820% Energy Reduction $705,231.06 $176,307.76
28

Topic: InfrastructureFocus Area: Buildings & EnergyIndicator 2: Average Building Environmental Scorecard RatingCurrent: Measure FY18 as BaselineGoal: Based on FY18 Data
BackgroundDeveloping a Building Environmental Scorecard will help the City of Largo understand the state of current assets and develop strategies for building repair, retrofitting and replacement. Based off of the Leadership in Energy and Environmental Design (LEED) Rating System, this scorecard also incorporates aspects of organizational commitment as well as employee and patron education on sustainability issues related to buildings and energy. This scorecard is notintended to replace standards within the organization but serve as a tool to assist employees in assessing sustainable development practices. Once completed, this scorecard can be used by all stakeholders to be shared ubiquitously, creating a common set of goals for building standards and design.
29

Topic: InfrastructureFocus Area: Buildings & EnergyIndicator 3: CIP Recommendation ListCurrent: No Sustainability Scoring MetricGoal: Incorporate Sustainability into all Project Scoring, Incorporate CIPs from Annual LEAP List
BackgroundThrough innovative and cost effective strategies, the City of Largo will develop Capital Improvement Projects that reduce our impact on the natural environment. Superior capital improvement projects save energy, reduce costs, reduce waste, increase comfort and help ensure a sustainable future for the whole community. As a result these projects which incorporate and support the City’s sustainable vision are of increasing priority to our organization.
Potential Action ItemsA. Community & Staff Outreach and Education·Increase collaboration and communication about the CIP decision making process and annual selections through collaborative scoring methods.
B. City Operations·Solar Field Installation (See Indicator 4)·EVSE Installation and Investment (See Indicator 8)·Recycling Drop Off Locations- While there is a very low ROI for additional recycling centers, strategically placing drop-off locations for mixed recycling would greatly increase our participation rate due to availabilityand convenience. Additional sites could be mixed recycling, cooking oil, textiles or any combination of these items. ·Land Acquisition- Focusing on acquiring shoreline and areas that are critical to best land/water management practices, adding land that would otherwise seem inefficient could increase the long-term resiliency of the community. Through hazard mitigation, acquiring and managing certain areas could lead to increased water quality, flood resistance, planning adaptations and more. Specific examples include areas around Largo Medical and within the McKay Creek Watershed. ·City Hall Reconstruction- City Hall has the second lowest energy performance by any City property on a daily basis. With an annual energy cost of $120,000 relocating or building a new site would greatly reduce annual energy costs. Building this facility in a mixed-use zone would further improve community sustainability with the potential for revenue generation and community partnerships. ·Smart Technology Incorporation (See indicator 28)
C. City Policies·Incorporate sustainability into the CIP Scoring Policy
·Maintain a Sustainability Project Section within the CIP·Incorporate LEED and ENVISION practices into the Facilities Design Standards to guarantee sustainable practices in building construction and renovation.
Capital Improvement Program Project Evaluation and Criteria Scoring Element Addition
SustainabilityDoes the project consider its impact on organizational sustainability?Projects designed with consideration to environmental impact, community resiliency and walkability will maximize the return on infrastructure investment and be given priority.
5 The project will greatly decrease the City’s environmental impact.3 The project will slightly decrease the City’s environmental impact.1 The project will have no effect on the City’s environmental impact.0 The project will increase the City’s environmental impact.
30

Topic: InfrastructureFocus Area: Buildings & EnergyIndicator 4: Solar and Alternative Energy Recommendation ListCurrent: Few Solar Projects Exists Goal: Incorporate Solar Capabilities into Small-Scale Projects, Environmental Services Warehouse/Ops Building
BackgroundSolar power projects are a key component of energy mitigation and can easily offset utility costs for the City and have the potential to be installed on many systems and structures already owned and operated by Largo. These projects are broken into two types: Small and Large. Small projects are those that can be done over time as materials are replaced,or have less significant cost implications. Large projects include projects that require significant up-front cost as well as project management to complete and install.
Potential Action ItemsA. Community & Staff Outreach and Education·Educate staff and the public about solar and alternative energy as part of the Sustainability Workshop (see indicator 29).·Develop Public/Private partnerships to fund potential projects.
B. City OperationsSmall Projects·Street Lights- Technologies exist that provides solar and wind powered street lights. These lights could be used in areas such as the Largo downtown where the City owns street lighting. These lights are considerably higher in cost for replacement than a regular street light, however they show a very quick ROI in terms of the benefits to the utility costs to run them. ·Parking Lot Lights- Similarly to the Street Lights, these can be purchased and installed as needed, for a heavy initial cost, but over time and as replaced, will provide a ROI.·Southwest Rec Pool Heating- Solar panels may be installed to assist in the heating of the water for the olympic sized pool at Southwest Recreation Complex. This would not offset all of the electricity needed due to the size and scope of a solar system needed, but could reduce annual costs. This project has a long projected ROI.·Bayhead Dog Park- Due to the lack of power service in the immediate area, to light the park, a solar area and battery system could be installed to provide minimal LED lighting around the area for nightime use. This type of array would be similar to the one being used to power irrigation at the Library complex.
Large Projects·Public Works Fleet Garage and Streets & Stormwater Building-Both of these areas of Public Works have wind rated roofs that could structurally hold solar panels and provide power back to their associated facilities. The costs to install these systems is substantial and would not be able to cover the entire energy load required to run either facility.·Highland Recreation Complex- This new building already has energy efficient equipment installed and hasnew electrical systems. It also has a very large flat roof area that would be ideal for installing solar panels on. The cost of this system would be near the cost associated with the Community Center project. At this time however it is felt energy reduction measures inside the building would have greater cost value in the near term.·Environmental Services Warehouse and New Operations Building-Both of these buildings are brand new and have new electrical systems therefore impacts for electrical contracting costs will be relatively low. They also have roofs that can be easily used to mount and hold solar panels. The Warehouse is the suggested priority because it already has a light electrical load. Providing solar to this building may completely offset the energy costs. The new Operations Building will have an increased energy load on it due to the amount of operations in the building and a smaller roof area to install solar panel. It may be included in the project scope and offset a portion of the energy costs for the building.
31

·Fire Stations- Due to their flat roofs and relative energy requirements, fire stations have the potential to completely offset their energy costs with solar panels. As new stations are built, consideration to solar panels should be given priority.
C. City Policies·Develop incentives through City Code to encourage solar powered residential projects while adjusting dwelling height limits for solar use. ·Develop codes to require solar or alternative energy use on City property where suitable.
32

Topic: InfrastructureFocus Area: TransportationIndicator 5: City Vehicles with Alternative FuelsCurrent: Three VehiclesGoal: 100% of Light-Duty Vehicles
BackgroundLargo currently owns three alternative fuel vehicles, one all-electric Nissan Leaf and two Hybrid Toyota RAV-4’s out of a fleet of approximately 550 vehicles. Switching City fleet to alternative vehicles can greatly reduces carbon emissions and leads to higher air quality in the community. Fuel savings also create a large ROI, particularly as more alternative fuel vehicles are purchased. Electric and hybrid vehicles are suitable for the replacement of typical passenger vehicles while Natural Gas vehicles lend themselves for the replacement of large and heavy-duty vehicles.
Additionally, establishing Departmental and general motor-pools can greatly reduce the number of vehicles per full time employee. This would create significant cost savings to the City and reduce waste, resource consumption and carbon emissions in the community.
The following Policy is suggested for City-wide adoption.
33

City of Largo Policies and Procedures
Policy Number: Supersedes Policy Number: N/A
Policy Name: Light Duty Fleet Efficiency
Approved By:
Originating Division: Effective Date:
BACKGROUND
In March 2017, City Commission approved the new Strategic Plan highlighting three broad focus areas:Sustainability, Public Health & Safety and Community Pride. In support of the focus on sustainability, the City isdeveloping a city-wide Environmental Action Plan in order to address our organizational impact on the environmentwith the goal of reducing resource consumption, improving fiscal sustainability and creating a more healthyenvironment for our community. The Largo Environmental Action Plan (LEAP) has three topic areas with over 30indicators which signal our progress towards this goal, including the percentage of City vehicles with an alternativefuel source. Advancing towards a more sustainable fleet will include favoring vehicles which use bio diesel, naturalgas, electricity and other fuel alternatives, as well as installing infrastructure to support these vehicles. Additionally,creating a ride-share system for City use will reduce the number of redundant passenger vehicles increasingpurchasing power for alternative fuel vehicles.
Supporting vehicles that lessen our resource consumption serves to support the City’s Strategic Plan initiative torenew our natural environment in order to ensure sustainability for future generations. This policy is intended toformalize those goals and initiatives for the City fleet.
DEFINITIONS AND RESPONSIBILITIES
Conventional Fuel: A vehicle powered by gasoline-only or diesel fuel.
Alternative Fuel: A vehicle powered by a one (or a combination) of the following:• Flexible Fuel – gasoline OR E85• EV – vehicle is battery powered and must be plugged into a charging stations• Hybrid – vehicle can be powered with battery and/or gasoline. Battery is recharged by the gasoline engine.• PHEV – plug-in hybrid electric vehicle. Vehicle can be powered with battery and/or gasoline. Battery can be
recharged by being plugged into a charging station.• CNG – vehicle is powered by compressed natural gas• FCV – vehicle is powered by a fuel cell using pressurized hydrogen
Administrative Vehicle: A vehicle which is primarily used by the Department for personal or group transportation.Administrative vehicles are not routinely used off the roadway.
Work Vehicle: A vehicle which is used for transporting equipment and parts, in addition to personnel, to and fromwork sites around the City. Work vehicles may be expected to go off the roadway.
Equipment: Other individually powered work tools. Equipment could range from lawn mowers to vactor trucks.
Supervisor/Operational Manager: Personnel responsible for assessing vehicle operational requirements, determiningfeasibility of options, and coordinating purchase with the Fleet Management Division
POLICY
34

1. The City of Largo may replace all administrative and light duty vehicles with makes and models utilizing alternative fuels as vehicles are replaced.
1. Due to infrastructure limitations at the time of policy adoption, preference may be given to hybrid, PHEV, and EV vehicles.
2. Vehicles must be selected from options provided and approved by the Fleet Management Division (i.e. available on state contract, sheriff’s bid, etc).
3. Supervisors and Operational Managers will take into account vehicle operation and specialized needs, miles traveled, fuel costs, vehicle maintenance and alternative fuel availability when selecting vehicle.
4. Supervisors and Operational Managers will conduct cost/benefit analysis of the selected alternative fuel vehicle utilizing information available at fueleconomy.gov.1. Analysis will include, but not be limited to, overall capital cost of alternative versus conventional
fuel vehicle; comparison between alternative and conventional fuel cost and consumption estimates, greenhouse gas emissions, and smog ratings.
2. The City will make a good faith effort to replace all work vehicles with makes and models utilizing alternative fuels.1. Supervisors and Operational Managers will begin the replacement vehicle selection process by
examining feasibility of alternative fuel makes and models.2. If no alternative fuel vehicles are deemed suitable, Supervisors and Operational Managers will provide
written justification to explain why an alternative fuel vehicle was not suitable.3. Supervisors and Operational Managers will utilize the fuel economy comparison tool available at
fueleconomy.gov to compare fuel consumption and emissions statistics of conventional fuel vehicle options.1. Preference will be given to vehicles with better fuel economy and fewer emissions.2. Supervisors and Operational Managers will compare the fuel economy and emissions of the selected
replacement conventional vehicle to the conventional vehicle being replaced.3. Selection of replacement vehicles will be made early enough so as to be included in the appropriate fiscal
year budget.4. Supervisors and Operational Managers are encouraged to investigate and experiment with the purchase of
alternatively fueled equipment where possible.1. New equipment will only be purchased for experimentation to replace broken or retired equipment. 2. If alternatively fueled equipment does not adequately perform to the same standards as conventional
equipment staff will be permitted to return to the conventional equipment.3. Supervisors and Operational Managers are encouraged to seek out try-it-before-you-buy-it programs.
5. Supervisors and Operational Managers are encouraged to consider utilizing an internal motor-pool as an alternative to new vehicle purchases.1. If annual vehicle mileage is not sufficient to support the need for a vehicle, Supervisors and Operations
Manager will investigate the possibility of utilizing a motor-pool.2. Savings from the reduced number of redundant vehicles may be used to acquire additional alternative
fuel vehicles and necessary infrastructure. 6. This policy may be rendered invalid in the event of funding constraints as determined by City Administration,
and/or technical maintenance concerns as determined by the Fleet Manager.
35

Topic: InfrastructureFocus Area: TransportationIndicator 6: Bike Lanes and SidewalksCurrent: Bike Lanes: 13 milesSidewalks: 8,242 Linear FeetGoal: Complete a Community Street Every Five Years / 100% of City owned streets with alternative transportation
BackgroundIncreased community mobility has the potential to drastically reduce carbon emissions, increase community pride and public access to City services. In accordance with both the Strategic Plan and the Comprehensive Plan, Largo aims to foster bicycle and pedestrian community multimodal corridors while building safe and healthy neighborhoods (Comprehensive Plan, Objective 1.6). The Multimodal Plan outlines the City’s community streets and serves as a 25 year work program designed to guide funding and scheduling of multimodal improvements along a designated network of streets and trails. The City, where applicable, must design, develop and maintain a safe, well-connected, comfortable and convenient environment for bicyclists, pedestrians and transit users. This will reduce vehicle miles traveled, facilitate the creation of vibrant places, increase health and recreation opportunities and reduce our carbon footprint.
Currently, many of the streets within the multimodal network cannot adequately support bicycle and pedestrian activities due to a lack of sidewalks or bicycle lanes, gaps or obstacles along existing sidewalks, inadequate transit facilities and roadway crossings, or other safety hazards. Creating these pathways not only creates a sustainable improvement for the community but can also serve as a branding and City identity opportunity through designs and imprints along the lanes. This would all coordinate with the Pinellas County Metropolitan Planning Organization’s proposed improvements.
There are currently 13 miles of bike lanes in Largo and approximately 8,242 feet of sidewalk. A City-wide sidewalk inventory is also being conducted for accuracy and to establish future metrics and goals for community mobility and isto be completed in FY18.
Potential Action ItemsA. Community & Staff Outreach and Education·Educate staff and the public about alternative transportation as part of the Sustainability Workshop (see indicator 29).·Develop Public/Private partnerships to fund potential projects.
B. City Operations·Expand Multimodal Network- Accommodate City growth by promoting the use of transit and addressing deficient bicycle and pedestrian facilities along community streets, improving mobility within constrained rights-of-way that cannot be expanded to allow additional automobiles. ·Expand Work with Outside Organizations- Foster a deeper relationship with Pinellas County, PSTA, Tampa Bay Regional Planning Council, local municipalities and others to better identify improvement areas that have the greatest potential impact on regional multimodal networks. This may be done with programs such as a City-wide bike share program or other mobility efforts.
C. City Policies·Require all City right-of-way projects to incorporate alternative transportation methods when applicable.
36

Topic: InfrastructureFocus Area: TransportationIndicator 7: Ride Share Recommendation ListCurrent: No Program Currently ExistsGoal: Establish one Internal Program for City Employees
BackgroundRide-Sharing is the sharing of vehicles by passengers to reduce vehicle trips, traffic congestion and automobile emissions. Types of transportation that are considered ride-sharing include, carpool, vanpool, and transit or public transport. There are approximately 550 vehicles in Largo’s fleet which operate on a daily or weekly basis, however there is no ride-share program. Creating such a program would greatly reduce vehicle emissions and create better air quality in our local community.
Potential Action ItemsA. Community & Staff Outreach and Education·Create a Citizen and Employee “Sustainability Leader” awards to promote the dedication of those who striveto be environmentally friendly by using the programs provided by the city to reduce all harm unto the environment.·Create an annual ride-share competition for employees.
B. City Operations·Employee Bus Programs- Coordinate with PSTA or other outside organizations that offer public transportation incentive programs such as the Mobility on Demand, MOD, and Employer’s Choice Programs.·Carpooling- Carpooling may provide less stress commuting to and from work; financial savings due to sharing commuting costs; reduces need for parking; increases free time for riders; and reduces pollution due to auto emissions. Carpoolers could be eligible to win gas cards.
a) Convert the first two visitors parking spots at the City Hall front parking lot to carpool only.b) Convert spaces reserved for specific departments/division (with the exceptions of emergency vehicles) to carpool only. �c) Create a staff carpool database with voluntary staff data using GIS capabilities.
·Public Partnerships for Food Trucks on City Property- Support local businesses by allowing food trucks to visit City Hall and other City Property on set schedules, reducing time spent driving and emissions spent on driving to lunch.
C. City Policies·Require all new City buildings to incorporate alternative transportation methods when applicable.
37

Topic: InfrastructureFocus Area: TransportationIndicator 8: Electric Vehicle Charging StationsCurrent: No Stations ExistGoal: 1 Single-Charge Station per Four All-Electric Vehicles, one Dual-Charge Station per six All-Electric Vehicles
BackgroundAs electric (EV) and alternative fuel vehicles become a standard option for fleets the necessary infrastructure must be installed and maintained in order to operate these vehicles. While not much data currently exists on the number of charging stations (EVSE) necessary per fleet vehicle, early indicators show that for every four EVs, one Level-2, single-use charging station is used. Alternatively one Level-2, dual-use charging station can be used per six EVs, or one DC Fast-Charging, dual-use station per 8 EVs. While installation costs vary greatly for the EVSEs, the ROI is highly tied to the estimated EV fleet size over a five to ten year period. Public funding and public-private partnerships are both highly encouraged to cover the costs of the asset as well as installation and maintenance.
38

Topic: InfrastructureFocus Area: Horizontal InfrastructureIndicator 9: Average EnvisionTM Rating of a Project or SystemCurrent: Not Currently RatedGoal: Projects Must Meet Envision Rating Standards
BackgroundCity infrastructure is a critical component of sustainability and our ability to provide safe, fun and affordable services to residents, businesses and visitors. This infrastructure is not currently rated by any widely used system in the way LEED certification is used for buildings. The EnvisionTM Rating System ensures that projects, specifically horizontal infrastructure, are created and maintained in a way that delivers value to the community for decades, both fiscally and environmentally.
Created by the Institute for Sustainable Infrastructure, EnvisionTM is a framework of 60 criteria that encompass the fullrange of environmental, social and economic impacts that should be assessed in order to determine how such a projecthas incorporated sustainability. To ensure these criteria are met a city-wide policy could be created to establish a minimum rating that all projects must meet, creating long-term financial savings. Projects built to this EnvisionTM standard would not be required to be certified, and therefore would not require additional funding on top of capital costs for internal ratings.
39

Topic: InfrastructureFocus Area: Horizontal InfrastructureIndicator 10: Water Line InspectionsCurrent (FY16): Stormwater: 23.90%Reclaimed Water: 10 Weekly Pump and Motor InspectionsWastewater: 16.9% of Line Inspected AnnuallyGoal: Stormwater: 10% of Line Inspected AnnuallyReclaimed Water: 10 Weekly Pump and Motor InspectionsWastewater: 20% of Line Inspected Annually
BackgroundStormwater, wastewater and reclaimed water infrastructure are some of the City’s most important assets, providing service to every resident, business and visitor within and outside of the City’s boundaries. In order to maintain this infrastructure, a very high set of standards has been created to constantly ensure their proper function. Currently, the City is meeting or exceeding their goals in all three areas.
StormwaterYear Inspected Goal 2016 23.90% 10.00%
Reclaimed Water
Fiscal Year Valve Blow-Off’s HydrantFY15 90 82 28 10 Quarterly
FY16 77 68 31 10 Quarterly
Pump/Motor Inspections
Vibration Testing
Wastewater
Fiscal Year Cleaned/Jetted Vacuumed CC TV’ed Jetting Rate
FY15 522,051 331,715 296,576 34.0 1,693,665 19.30%
FY16 464,535 224,794 257,781 30.8 1,693,665 16.40%
FY17 452,717 206,288 259,829 29.5 1,693,665 16.90%
Total Line ft (Gravity and Force Main)
Percentage CC TV’ed
40

Topic: InfrastructureFocus Area: Horizontal InfrastructureIndicator 11: Annual Sanitary Sewer OverflowsCurrent: 64 (2016)Goal: 0
BackgroundSanitary Sewer Overflows (SSOs) are caused by a variety of conditions including leaks, breaks, blockages, power failures and system overload. The Environmental Protection Agency (EPA) estimates there are 23,000- 75,000 SSOs per year, not including backups into buildings. This point source discharge can cause immediate detrimental effects to our community and the ultimate goal is to have no discharges.
Due to various infrastructure and Inflow and Infiltration (I&I) issues in 2017, Largo had 64 SSOs on public property though many of these were due to contractor issues, Wet Weather construction projects and an active hurricane season.Through the City’s Capacity Management, Operations and Maintenance (CMOM) program framework Largo works to substantially improve the management and operations of this infrastructure towards the ultimate goal of reducing and eliminating SSOs.
In FY17 Environmental Services completed upgrades to help reduce the City’s contribution to SSOs, including a five million gallon equalization tank and many upgrades to lift and pump stations. These upgrades have already made a huge impact on reducing SSOs as we aim for zero overflows annually. Public education is also a key component of reducing SSOs as private laterals can directly impact the overall system. Conducting smoke tests to identify malfunctioning laterals can create opportunities to improve the publicly owned system, though the burden of ownership has the potential to create downstream negative impacts.
41

Topic: Natural ResourcesFocus Area: WaterIndicator 12: Annual Water Use on City-Owned PropertyCurrent: Potable Water: 16,659,000 GallonsGoal: Potable Water: Reduce by 10% Annually
Background Growing pressure on water use comes from many sources including population increase, building and economic growth, pollution and other important issues. The financial impact these pressures have on our water sources continue to rise, along with their environmental impact. To relieve unnecessary pressure on our water system the amount of potable water used by the City must decrease. Reducing potable water use by 10% can save over $8,000 annually which may be reinvested in future projects throughout the community.
Potential Action ItemsA. Community & Staff Outreach and Education·Educate staff and the public about water usage and reuse as part of the Sustainability Workshop (see indicator 29).
B. City Operations·Native Landscaping- In order to reduce the amount of water necessary for landscaping on City properties, landscaping should be selected which is native, drought tolerant or xeric. Reclaimed water should be used to water landscapes across City properties where available. ·WaterSense Fixtures- Assets such as faucets, toilets and water fountains should be retrofitted to use ‘low-flow’ technology which adhere to the EPA WaterSense criteria when applicable. New installations should have these fixtures at a minimum. ·Reclaimed Water Connections- Reclaimed water should be utilized on all City property, particularly where there are areas of large, open-areas which require relatively high maintenance where available.
C. City Policies·Require all new and updated City properties to provide infrastructure connections for reclaimed water where applicable, even if service is not currently available. ·Require all new business and residents to connect to reclaimed water where applicable.
42

Topic: Natural ResourcesFocus Area: WaterIndicator 13: Percentage of EPA WaterSense Fixtures on City PropertyCurrent: 33%* (Approximation)Goal: 100%
BackgroundThe City spends thousands of dollars annually to provide potable water to it’s buildings and property. Reducing the cost of this utility can be done easily through fixture replacement and education. Incorporating smart technologies intofuture investments can drastically reduce our impact on water and water quality in our community. The City is currently assessing the total number of WaterSense or ‘low-flow’ fixtures installed. WaterSense is a voluntary partnership program sponsored by the EPA and serves as a label for water-efficient products and a resource for helpingto conserve water.
Potential Action ItemsA. Community & Staff Outreach and Education·Encourage employees to use Water-Wise facilities·Encourage Water-Wise product installation throughout the community
B. City Operations·Buildings- Replacing old water fixtures such as toilets, shower heads and faucets can lead to a relatively quick ROI in high traffic areas as needed. Specific consideration should be given to areas the public has access to, such as Recreation, Park and Arts buildings, to increase recognition in the program and increase community participation. ·Irrigation- Replace old irrigation systems as needed with products that have correct pressures and coverage.Installing new systems should be done only after a site assessment in order to determine the most effective locations. ·Smart Technology- Incorporating smart technologies into water assets has the potential to save thousands annually and greatly reduce our impact on the environment. Purchasing equipment such as smart irrigation controllers has a very short-term ROI.
C. City Policies·Require all new and updated City buildings to use as many Water-Wise products as feasible.·Require all landscaping equipment that is replaced to be ‘low-flow’ or Water-Wise.
43

Topic: Natural ResourcesFocus Area: WaterIndicator 14: Percentage of Reclaimed Water Used City-WideCurrent: 42.6% Annually Goal: 70% Annually
Background Largo creates 4,281.68 million gallons of reclaimed water annually, of which only 1,849.83 million gallons are utilized. There are numerous benefits to increasing this usage such as fiscal savings, improved water quality and social equality. Expanded reclaimed water systems can reduce residential water fees, reduce operational costs long-term and reduce the burden on potable water systems as well as our local environment.While the cost of expanding this network is currently the largest deterrence to expansion, sustainable planning, building and operational design can alleviate much of this burden on a long-term scale.
Potential Action ItemsA. Community & Staff Outreach and Education·Educate staff and the public about reclaimed water as part of the Sustainability Workshop (see indicator 29).·Expand public education campaigns in coordination with multiple Departments.
B. City Operations·Business Focus- Business and industrial use of reclaimed water has the largest impact on usage per subscriber. Focusing efforts on this type of customer can create a larger impact than many small residential subscribers. Through coordination with Economic Development, soliciting reclaimed water subscription through existing businesses as well as bringing in new businesses would create fiscal savings through reducedannual discharge fees.·Capital Improvement Project Coordination- As horizontal infrastructure projects are being developed, consideration to reclaimed water should be given even when direct connection is not currently possible. Infrastructure that could be connected within a five year time period could be installed for future expansion ofthe network.
C. City Policies·Require all new and updated subdivisions to provide infrastructure connections for reclaimed water where applicable, even if service is not currently available. ·Require all new business and residents to connect to reclaimed water where applicable.
44

Topic: Natural ResourcesFocus Area: WaterIndicator 15: Pounds of Nutrients Removed by Street SweepingCurrent: Nitrogen: 3,001Phosphorous: 1,924 Goal: Increase annually
Background Stormwater runoff is contaminated by nutrients running off of roadways, parking lots, lawns, roofs and other surfaces. This water collected nutrients such as nitrogen and phosphorous which can eventually be released into our surrounding water systems. An increase in these nutrients can lead to harmful and expensive health and environmental conditions such as algae blooms and fish kills. Largo has many efforts directed at reducingthis nutrient load such as street sweeping which prevented nearly 5,000 pounds from entering out waters in 2016.
Potential Action ItemsA. Community & Staff Outreach and Education·Educate staff and the public about nutrient runoff as part of the Sustainability Workshop (see indicator 29).
B. City Operations·Street Sweeping- Continue to expand the City’s street sweeping program and focus on areas around critical bodies of water or high nutrient runoff. ·Smart Technologies- Incorporate smart technologies, such as debris cameras on garbage trucks, to help identify areas of high nutrient runoff throughout the City. ·Community Education Art Projects- Develop partnerships with schools and outside organizations to createcommunity art projects that highlight the importance of stormdrains, rainwater, and nutrient loads. This may include artwork painted on or around stormdrains, placards or participation at public events within the City.
C. City Policies·Create policies requiring specific landscaping techniques which reduce overall nutrient run off.·Increase the LOS for street sweeping.
45

Topic: Natural ResourcesFocus Area: WasteIndicator 16: Annual City Paper UsageCurrent: 2.5 Million Sheets* (Approximate)Goal: Reduce 10% Annually, Incorporate tablets into Commission, hiring and other standard operations.
BackgroundLargo spends over $20,000 on paper annually for appropriately 2.5 million sheets of paper, the equivalent of 300 trees.Much of this paper is virgin, not often containing recycled content, placing a further burden on our natural resources. Simply using electronic document sharing internally and with vendors, as well as converting traditional systems to electronic systems can save these valuable resources.
Potential Action ItemsA. Community & Staff Outreach and Education·Develop annual paper reduction campaigns.·Create minimum standards for recycled paper purchasing.
B. City Operations·Commission- Utilize tablets and electronic document submission for all Commission staff reports and presentations. Each Agenda Item currently requires at least seven copies without edits with a total impact of potentially thousands of sheets of paper each year. Converting to an electronic-only system would save hundreds of trees annually and reduce overall operating costs. ·Human Resources and Hiring- The hiring process is highly reliant on paper copies of each application for multiple interviewers. Much of this paperwork is simply filed after use and not utilized again. Purchasing software or hardware that can be used by Departments during the course of hiring and would streamline the process and create a large fiscal savings. ·Monthly Statements, Invoices and Purchase Orders (PO)- Every month thousands of credit card statements, invoices, vendor receipts and checks are printed and kept on file. In order to reduce physical space needed for file storage, and the amount of paper printed for City operations, these documents should only be shared electronically. Vendors should also send all correspondence electronically.·Ordering System- Several different companies and ordering schedules are used across Departments for paper. In order to streamline the process common ordering standards, including recycled content paper and appropriate schedules, as well as selective vendor utilization can save the City thousands of dollars annually. ·Digital Editing Software- Purchasing digital editing software or software upgrades would enable employeesto electronically edit, sign, track and send documents. The ROI for these programs would been very short-term.
C. City Policies·All paper purchased for daily City operations should have a minimum 50% recycled content.·All outside vendors should correspond with the City electronically where possible. ·All internal documents should be shared digitally to reduce overall operating costs and environmental impact.
46

Topic: Natural ResourcesFocus Area: WasteIndicator 17: Percentage of Recycling Containers on City PropertyCurrent: 35.97%Goal: 75% Statewide Goal
BackgroundThe State of Florida continues to pursue it’s goal of a 75% recycling rate by 2020. In order to support these efforts the City of Largo would like to provide enough recycling capacity on City properties to accommodate. While major City facilities do have recycling bins they often are smaller or not easily accessible. Some smaller locations do not have any recycling bins. Expanding the number of waste streams at certain locations, such as including organics or textile recycling, can greatly increase the available recycling options within the City.
Potential Action ItemsA. Community & Staff Outreach and Education·Educate staff and the public about recycling as part of the Sustainability Workshop (see indicator 29).·Encourage staff and public recycling by providing 3:4 recycling at events.·Provide recycling opportunities at staff desks and inside vehicles.
B. City Operations·City Buildings- Provide recycling bins at all City properties at 3:4 ratio.·Smart Technologies- Incorporate responsive recycling bins to reduce operational needs on recycling collection systems.·Special Events- Provide recycling bins at all special events at all locations, including parks, facilities, employee desks and vehicles at a 3:4 ratio. ·Organics Recycling- Develop public partnerships to recycle organic materials such as food waste and landscaping material. These items can be used as a resource for community gardens, City green spaces and for public use. ·Oil Recycling- Expand the Cooking Oil Recycling Effort to additional locations on City property. ·Textile Recycling- Create a textile recycling program for City employees to increase total diversion rates across the City.
C. City Policies·Require recycling bins at all new businesses and City properties.·Require waste enclosure specifications on new and updated properties to include space for additional waste streams such as organics recycling.
47
Topic: Natural ResourcesFocus Area: WasteIndicator 18: Bulk Waste Disposal Recommendation ListCurrent: There is currently no bulk waste disposal programGoal: Bulk waste warehouse or website
BackgroundThe City of Largo disposes over 85,000 tons of waste every year much of which is generated by the City itself. From construction materials to office furniture, reducing the amount of waste the City generates has a large impact on our environment through reduced landfilling, reduced resource consumption and increased savings through avoiding tipping fees and potential revenue generation. With increasing populations, construction services and disposal fees, potentially threefold, the need to establish alternative methods of waste disposal should take priority for City operations.
Potential Action ItemsA. Community & Staff Outreach and Education·Educate staff and the public about bulk waste and reuse as part of the Sustainability Workshop (see indicator 29).·Educate staff and the community on reuse and resource reduction.
B. City Operations·Community Garden- A community garden has the potential to collect organic waste items and turn them into compost material for on site use. This could be managed with public/private partnerships at current community garden sites and would reduce the cost of disposal for the City. ·Internal Trading Website- Volunteer employees could operate a webpage which lists City office items that could be used elsewhere internally. This option would require little to no investment but would likely only reduce waste on smaller items, typically not in bulk.
C. City Policies·Require all bulk waste to be sent to warehouse or listed on webpage for reuse.
48

Topic: Natural ResourcesFocus Area: WasteIndicator 19: Number of Zero Waste Special EventsCurrent: 0Goal: Add one event annually
BackgroundZero Waste events incorporate the ideals of sustainability such as plastic and organic recycling, reusable or biodegradable items and reduced purchasing. These events lower the overall operational costs of the City by reducing the costs of waste disposal. They serve as educational opportunities for staff and the community and can support otheraspects of City operations such as community gardens.
Potential Action ItemsA. Community & Staff Outreach and Education·Create a Community Garden Team that operates composting for City events.·Educate staff and the public about the concept of zero waste as part of the Sustainability Workshop (see indicator 29).
B. City Operations·Public Partnership for Organics- Work with outside organizations to develop an organics recycling program for City events.·Purchase Reusables- Use only recyclable, reusable or biodegradable serve-ware and supplies such as plates,utensils and cups.·Vendor Regulations- Require all outside vendors to use recyclable, reusable or biodegradable serve-ware and supplies.·Outreach Organizations- Donate all leftover food to local charities and non-profits.·Packaging- Purchase items in bulk or items that use less packaging.
C. City Policies·Require all internal City events (picnics, lunches, meetings, etc.) to use reusable, recyclable or biodegradable supplies.
49

Topic: Natural ResourcesFocus Area: Green SpacesIndicator 20: Percentage of Canopy Cover on City PropertyCurrent: 37.11%Goal: 40%
BackgroundA robust tree canopy is important for a comfortable, safe and socially integrated community. Streets with more tree canopy have proven to be associated with greater health and sociability with neighbors, improve local air quality and decrease the ‘heat-island’ effect. American Forests has set a 40% tree canopy coverage as the goal for all US communities. Largo’s Urban Forest Master Plan supports this goal with FY17 coverage on City property at 37.11%
Potential Action ItemsA. Community & Staff Outreach and Education· Continue to promote Tree City USA at City Welcome signs and yearly events, tree give away and tree planting programs.
B. City Operations· Continue to educate staff on tree crews and landscape maintenance crews to care for sites and trees with the latest methods and techniques to ensure tree on City property reach maturity and are healthy.
C. City Policies·Strengthen tree protection standards and develop a Grand Tree Ordinance.
50

Topic: Natural ResourcesFocus Area: Green SpacesIndicator 21: Percentage of Public & Green Space on City PropertyCurrent: 73.59%Goal: 80% by 2050
BackgroundLargo maintains a total of 422 acres of green space on City property which includes tree canopy, grasses, low-lying vegetation, parks and areas with the Future Land Use Designation of preservation and recreation or open space. This equates to over 73% of Largo’s 573 acres of total property. Preserving these spaces is critical to maintaining a LOS to our community for recreation and parks and helps to create a more healthy and livable environment. Our preserved spaces create natural habitats, mitigate threats of sea level rise and provide critical benefits to local air quality. In support of the Urban Forestry Master Plan, Largo aims to increase our green spaces, and hopes to achieve 80% by 2050.
Potential Action ItemsA. Community & Staff Outreach and Education·Promote the use of parks and open spaces within our organization. ·Educate staff and the community about green spaces and resiliency.·Encourage the use of Florida-Friendly landscaping to improve the health of current green spaces.
B. City Operations·Comprehensive Development Code (CDC)- Research potential policy changes in the CDC to address programs and issues such as pocket parks, parcel designation and densities.·Land Acquisition- Aquire critical parcels that would connect current and future park and trail systems. Aquire green spaces that provide environmental benefits to areas potentially impacted by sea level rise. Aquire spaces adjacent to vulnerable economic areas such as CRA’s and local businesses.
C. City Policies·Increase the LOS for access to green spaces and parks.
51

Topic: Natural ResourcesFocus Area: Green SpacesIndicator 22: Percentage of Native & Florida-Friendly Species on City PropertyCurrent: 87%Goal: 95%
BackgroundNative and Florida-Friendly species help provide a natural habitat for local wildlife, require less resources to maintain and increase our communities resiliency. These trees use less water and fertilizer over their life and typically have lessdiseases, providing long-term financial benefits to our organization. Largo has a total of 3,756 trees on City property, of which 3,292 are Florida-Friendly or Native, or 87%. While some locations such as medians and other microhabitatsmay not support these species sustainably, Largo aims to increase the total percentage of Native & Florida-Friendly species to 95%.
Potential Action ItemsA. Community & Staff Outreach and Education·Create an Adopt-a-Tree program.·Expand programs that promote Native & Florida-Friendly species as well as species diversity.
B. City Operations·Site Rehabilitation- In order to further mitigate against sea level rise and increase our communities overall resiliency, green space rehabilitation will be prioritized at critical infrastructure and economic development points.·Diversity- Increase the diversity of Native & Florida-Friendly species to reduce the threat of diseases and increase community resiliency.
C. City Policies·Require all species to be a Native or Florida-Friendly for site redevelopment, where applicable.
52

Topic: Natural ResourcesFocus Area: ResiliencyIndicator 23: Green House Gas EmissionsCurrent: Measure Baseline 2018Goal: Measure Annually
BackgroundThe Environmental Protection Agency (EPA) provides a tool for local municipalities to evaluate and estimate greenhouse gas (GHG) emissions within their communities. This tool can help Largo understand local greenhouse gas emissions profiles and the sectors driving those emissions, as well as provide a baseline for tracking emission trends which can further support LEAP and the Strategic Plan. Ultimately, reducing GHG emissions creates a more resilient community that is less susceptible external environmental changes and improves local air quality. It is the goal of LEAP to begin calculating a simplified GHG emission profile using the EPA tool which covers 20 topics and their impact on our community.
53

Topic: Natural ResourcesFocus Area: ResiliencyIndicator 24: Percentage of Impervious Surfaces on City PropertyCurrent: 16.6%Goal: 14% by 2050
BackgroundImpervious surfaces are artificial structures such as road, sidewalks, pavement or any other surface that alters the natural air and water processes in an area. The control of impervious surfaces ensures continued absorption of rainwater, aids in the control of stormwater runoff, and implements the policies of the Natural Resources and Public Facilities Element of the Comprehensive Plan. It is important to keep in mind that land is a crucial component of the built environment and can be planned, designed, developed and maintained to protect and enhance the benefits we derive from healthy functioning landscapes. It is our initiative to invest and foster a resilient community that benefits the environment, property owners and local and regional communities and economies. Impervious surface ratio (ISR) is the area of ground covered by any part of a building, vehicular use area, or any otherstructure, improvement or facility or material that prevents or severely restricts natural percolation of moisture, not including residential swimming pools. City property has a ISR of 16.6% while the City-wide ISR is 45%. Reducing Reducing the ISR can be done through the use of structural, landscape and low impact development (LID), best management practices (BMPs) and policy changes.
Potential Action ItemsA. Community & Staff Outreach and Education·Educate staff and the public about the community resilience as part of the Sustainability Workshop (see indicator 29).
B. City Operations·Comprehensive Development Code- Review the CDC for the opportunity to improve overall ISR. Potentialfocus areas may be redevelopment code changes, density bonuses for vertical construction, impact fee reduction or parking credits for semi-impervious surfaces. ·Legal Surveys- Aquire up-to-date legal surveys for each city-owned property to ensure accurate informationas it pertains to location of all permanent structures, property lines, right of way lines, easements or encroachments, etc. in order to submit and/or apply for any development review process. ·Infrastructure Standards- Ensure the use of sustainable street and parking lot infrastructure that encourages stormwater best management practices (BMPs) and low impact development (LID).·Site Rehabilitation- Any improvement on city-owned properties over 25% of a parcel must meet the goals identified in Indicator #1 of this Plan.
C. City Policies·Incorporate the Low Impact Development (LID) standards to reduce impervious surface and lessen surface water runoff into the CIP scoring Policy.
54

Topic: Natural ResourcesFocus Area: ResiliencyIndicator 25: Linear Feet of Shoreline on City PropertyCurrent: 2,622 feetGoal: Provide resilient City policies to best manage shoreline properties.
BackgroundCoastal resiliency is critically important to the overall vulnerability of communities in sensitive regions. Heavy storms, increased tides and sea levels and loss of natural habitat pose risks to community infrastructure and public health. Sustainable planning can lessen the impact of these issues on human health and safety while providing a more diverse local environment. Largo aims to provide exceptional best management practices and City policies in order to create a more resilient community.
Potential Action ItemsA. Community & Staff Outreach and Education·Educate staff and the public about the concept of community resilience as part of the Sustainability Workshop (see indicator 29).
B. City Operations·Comprehensive Development Code- Review the CDC for potential impact on community resilience and shoreline management. ·Best Management Practices- Maintain or improve BMPs for shoreline property and development to ensure the protection of the environment and City infrastructure. ·Land Acquisition- Acquire land with shoreline in order to better manage parcels which affect community resilience.
C. City Policies·Require all shoreline on City property to be designated as preserved land space.
55

Topic: Natural ResourcesFocus Area: ResiliencyIndicator 26: Resiliency Plan ProgressCurrent: Develop a City-Wide Resiliency Plan Goal: FY2019
BackgroundResiliency is the ability for a community to anticipate, adapt and respond to disturbances such as environmental, social and economic pressures. Resilient communities plan for such disturbances while balancing current characteristics of the community. Developing resiliency requires careful policy and infrastructure planning, particular to communities more susceptible to these pressure such as those on the coast.
Researching and developing a Resiliency Plan will allow Largo to remain sustainable through the careful planning of City operations within the context of external pressures and disasters. The National Oceanic and Atmospheric Administration (NOAA) recommends a six-step planning process for community resiliency that considers three types of risks:
·Routine Hazards (High-tide, Tree Damage, etc.)·Design Hazards (CRA Placement, Shelter Design, etc.)·Extreme Events (Natural Disasters, Community-Scale Threats)
Integrated resilience plans incorporate steps to disaster preparedness and recovery efforts seamlessly with other City plans. To successfully accomplish this, these plans should be made with support from the highest levels of the organization with the assistance and detailed input form all sections of the organization. Potential action items may be items from the Natural Resources and Hazard Adaptation Policies of the Comprehensive Plan.
56

57

Topic: WorkforceFocus Area: TechnologiesIndicator 27: Technology Implementation ListCurrent: No Standardized List ExistsGoal: Incorporate One Method Annually
BackgroundAs the City of Largo continues to grow and require more resources to meet the needs of residents and businesses, our organization must seek economically feasible and environmentally sustainable solutions to meet this objective. In support of the Strategic Plan, investments in technology can address growing needs in a way that is not only more costefficient but can offer a higher quality of life for residents in a sustainable manner. Incorporating responsive technology projects into our organizational culture will allow us to develop solutions in a centralized and adaptive manner, decreasing our resource consumption and increasing operational efficiencies.
Potential Action ItemsA. Community & Staff Outreach and Education·Smart City Leadership Workshop- Designed for Administration, ELT and key staff, develop a workshop with community partners such as the Institute of Food and Agricultural Sciences (IFAS) or the Tampa Bay Regional Planning Committee (TBRPC) in order to highlight the importance and utility of smart technology in daily operations.
B. City Operations·Smart City Technologies- Integrate smart technologies that are responsive to every day scenarios throughout the City, streamlining operations and response.
·Waste management sensors- These devices signal when waste collection is needed. ·Street light communication sensors- Updated street lights can measure air quality, ‘hear’ gunshots, record humidity levels and can be activated by motion sensors. ·Water quality sensors- Automatic sensors measure oxygen levels, turbidity and can signal when there is point-source pollution. ·Responsive HVAC systems- Respond to numerous factors such as time of day, time of year, occupancy, and other issues to reduce overall operating costs. ·Responsive lighting systems- Motion sensors can be adjusted through cloud-based technology to accurately interpret the amount of light needed on fields and other green spaces. ·Water Metering Sensors- These sensors can recognize extreme use scenarios and alert when maintenance is required, in addition to providing accurate readings electronically.
·Centralized Work Management Systems- Include as many divisions as possible in an Enterprise Asset Management (EAM) system allowing for efficient use of personnel and asset usage. ·Data Warehousing- This increases data integration and organizational knowledge while reducing data silos and disparate systems. ·Public Data Sharing- Open data systems (where applicable) foster local and community growth across all economic sectors and have the ability to better validate data. ·Wireless Infrastructure- Sustainable wireless networks are multi-functional and have the ability to quickly adapt to external pressures and developments. They can provide additional security methods while reducing the need for hardwired systems that greatly impact local environments.
C. City Policies·Develop policies that encourage the use of shared technology resources to reduce operations costs.
58

Topic: WorkforceFocus Area: TechnologiesIndicator 28: Project Data StandardsCurrent: No Ubiquitous System ExistsGoal: Develop Standards for Internal and External CIP Projects
BackgroundProject stakeholders need practical tools and data that can be shared ubiquitously across platforms in order to accurately develop project designs, increasing operational efficiencies and environmental impacts. These tools and data standards should be developed with the needs of stakeholders across project levels and integrate comprehensive asset class life cycles.
Potential Action ItemsA. Community & Staff Outreach and Education·Hold training sessions for all key personnel on updated standards
B. City Operations·Organizational Computer Aided-Design (CAD) Standards- Use VUEWorks Asset Type/Class hierarchy as the basis for creating an organizational CAD standard that supports all asset classes and project types, augmenting or replacing existing CAD standards in use throughout the City.•Tool Utilization- Leverage tools in desktop CAD applications to enable connections to spatial databases and the Largo Enterprise Geodatabase.•Validation Tool- Create a validation tool using FME Server to ingest CAD data from all project types; the tool would validate incoming CAD data against the City's organizational CAD standard and then perform an automated feature extraction of data into intelligent GIS features.•GIS Driven- Create a GIS-driven data discovery/download tool for the public to use in acquiring GIS datasets.•External Services- Publish Web services that allow consultants to access City geospatial data directly withintheir desktop CAD or GIS applications.•Maintenance- Maintain a list of supported data formats across both CAD and GIS applications.•Technical Standards- Provide these standards for how the data should be structured and represented, including a copy of the City's enterprise GIS data model and enterprise asset class/type hierarchy.
C. City Policies·Provide these standards as part of all RFPs and CIPs.
59

Topic: People & ServicesFocus Area: WorkforceIndicator 29: Staff Engagement in Sustainable PracticesCurrent: 35%Goal: 100%
BackgroundIn order to be a community leader in sustainability, Largo staff should be actively participating in sustainable practicessuch as recycling, waste reduction and park cleanups. Outreach should be conducted continuously to promote the various aspects of sustainability and engage staff with current trends and topics. Expanding the number of staff engaged with sustainable practices annually improves the overall efficiency of our organization.
Potential Action ItemsA. Community & Staff Outreach and Education·Utilize Employee Orientations as a standard outreach effort.
B. City Operations·Sustainability Team- Further develop the team of core staff who engage coworkers in sustainable practices. Continue to develop annual projects or challenges for City-wide staff engagement. ·Sustainable Events and Meetings- Develop standards for all internal City events and meetings to meet or work towards zero waste policies. ·Incentivize Sustainable Practices- Create workforce incentives such as time-off, awards and recognition for sustainable staff members. ·Sustainability Workshop- Conduct an annual workshop for staff and the public to educate on sustainability topics. This can be done with the partnership of outside organizations from the community to further support regional sustainability and may include IFAS, USF, TBRPC and NOAA.
C. City Policies·Require that all internal meetings work towards being zero waste.
60

Topic: People & ServicesFocus Area: WorkforceIndicator 30: Staff Enrollment in Emergency Notification System Current: 100%Goal: 100%
BackgroundEmergency Notification Systems (ENS) are a critical aspect of sustainability as they facilitate a safe and healthy workforce while increasing an organizations resilience. Largo’s ReadyOp system is a comprehensive communication system for staff that has aggressively worked to include all employees. This successful effort has proven it’s efficacy during recent events and encourages our organization to provide further notification efforts to staff and the community.
Potential Action ItemsA. Community & Staff Outreach and Education·Educate employees on the impacts and importance of modern notification systems.
B. City Operations·Maintain Enrollment- Continue to enroll all new employees into the ENS.·Additional Methods- Develop additional methods of notification that account for hazard variances such as loss of cell phones, inaccessibility, flooding, etc. ·Community Incorporation- Develop additional methods to deliver critical information to residents using similar systems during and after hazardous events.
C. City Policies·Require all employees with City phones to enroll in the ENS.
61
Topic: People & ServicesFocus Area: WorkforceIndicator 31: Alternative Work Schedule Recommendation ListCurrent: 2 Alternative Schedules for Applicable PersonnelGoal: Research and Develop Pilot Programs
BackgroundAlternative work schedules are an umbrella term that refers to compressed work schedules and flexible work schedules. Compressed work schedule means a fixed work schedule (no flexible time bands) in which an employee can complete the biweekly work requirement in less than 10 working days. Having a flexible work schedule allows employers following benefits: increased employee morale, engagement, commitment to the organization, reduced absenteeism and tardiness and an increased ability to recruit outstanding employees.
Currently Largo has over 900 full time equivalents (FTE) across eleven Departments each with different needs so alternative work schedules must be developed by work group. The Strategic Plan aims to advance a flexible and resilient organization that delivers superior City services, recruit and retain an innovative workforce that is motivated to exceed customer service expectations and provide modern, evolving technology that supports collaboration, automation and a seamless user experience. Alternative work schedules would assist in accomplishing all of these while increasing operational efficiencies.
Many alternative work schedules have the ability to reduce the amount of GHG emissions in our community through telecommuting, carpooling and careful planning of environmental resources.
Potential Action ItemsA. Community & Staff Outreach and Education·Educate staff on the benefits and risks of alternative schedules.
B. City Operations·Telecommute-Telecommuting allows the employee to use telecommunication links, keeping in touch with coworkers and employers via telephone and email. The worker may occasionally enter the office to attend meetings and touch base with the employer. However, with many options for distance conferencing, there may be no need to visit the office.· Four-10 Hour Days- A compressed work schedule that allows an employee to work four 10-hour days as opposed to the traditional five-day work week. This could be a financial benefit to the City by reducing the overtime pay for those on stand-by or on-call. ·Compressed Work Week-A compressed work schedule allows an employee to work a traditional 35-40 hour workweek in less than the traditional number of workdays. Many compressed work schedule options may be negotiated. Compressed work schedules are but not limited to: 1. 5/4/9 (also called 9/80): Work eight 9-hour days and one 8-hour day in the pay period and get an extra day off.
2. 4/10: Work 4 10-hour days each week of the pay period and have an extra day of each week.·Maxiflex- A type of flexible work schedule that contains core hours on fewer than 10 workdays in the biweekly pay period and in which a full-time employee has a basic work requirement of 80 hours for the biweekly pay period, but in which an employee may vary the number of hours worked on a given workday.·Gliding- A schedule in which employee has a basic work requirement of 8 hours a day and may select an arrival time each day and may change the arrival time daily as long as it is within the flexible time band. ·Staggering Hours- Workers or groups of workers start and finish work at slightly different times. Staggered hours may allow workers some discretion within prescribed limits, in fixing the time when they start and finish work.
C. City Policies·Allow management staff to determine when a group or individual is allowed to use an alternative work schedule within the constraints of the Fair Labor Standards Act (FLSA).
62

Topic: People & ServicesFocus Area: WorkforceIndicator 32: Sustainability Review PanelCurrent: No Such Review Panel ExistsGoal: Develop the Panel FY18
BackgroundIn order to maintain the longterm sustainability of our organization, the creation of a Sustainability Review Panel (SRP) is recommended for review of specific CIPs equal to or greater than $100,000. This team would be compromised of key stakeholders with the specific role duties of:
1. Identifying new projects for review2. Review project for overall sustainability and assign sustainability value for CIP Validity committee review3. Conduct Preliminary Envision and/or LEED review of project at or before 30% plan review4. Provide recommendations for sustainable design elements within the project
The SRP would specifically look at projects focused on buildings, horizontal or vertical infrastructure and their adherence to Envision, LEED, and the Building Environmental Scorecard. The team would review these projects before the CIP scoring process for reasonableness and at or prior to 30% project completion. For Building and VerticalInfrastructure projects the SRP would be compromised of the Assistant Public Works Director, Sustainability Coordinator, Parks Superintendent and the Stormwater Program Administrator. For Horizontal Infrastructure projects the SRP would be compromised of the Engineering Project Manager, the Stormwater Program Administrator, the Sustainability Coordinator and a Subject Matter Expert pertaining to the project.
63

Topic: People & ServicesFocus Area: PurchasingIndicator 33: Local & Environmental Purchasing PolicyCurrent: Currently No Such Policy ExistsGoal: Research Potential Policies
BackgroundThe products and services that Largo acquires has an inherent social, fiscal and environmental impact on our community. The City can make procurement decisions that promote a commitment to sustainability and the long term resilience of our community. Creating a policy that promotes these ideals will encourage economic growth in the region and a shared environmental benefit. Local goods do not require as much shipping, reduce overall GHG emissions, landfill waste, traffic risks and fiscal costs of other goods. These benefits can also create an underlying financial savings in a product or service and foster even larger economic benefits to businesses we already support in the community.
Even small purchases made on p-cards can affect the overall sustainability of an organization or community, such as purchasing products with more recycled content, less packaging, less harmful dyes or chemicals or that are reusable orbiodegradable. By promoting these items to all employees Largo can increase sustainability in all daily operations.
Largo will research potential policies that focus on the environmental and financial impact of our purchases on our local community. Consideration will be given to:
· Material Origin· Locally Sourced Products· Incorporation into Largo Building Scorecard· Recyclability· Potential hazardous or chemical components· Energy Efficiency· Energy Consumption
Additionally, Largo will review the impact of our Requests for Proposals (RFPs) on these items, as unique projects can potentially result in an increased environmental impact.
64

65

Topic: People & ServicesFocus Area: PurchasingIndicator 34: Bulk & Shared PurchasingCurrent: There is limited bulk or shared purchasing City-wideGoal: Increase bulk purchasing items annually
BackgroundPurchasing bulk orders immediately reduces the financial burden on an organization while also reducing it’s environmental impact. Bulk purchasing requires less packaging, less transportation and gives consideration to end-of-life use. Bulk purchasing can be done departmentally, organizationally or between single or multiple outside organizations.
Appropriate schedules and BMPs should be created to effectively implement large-scale bulk purchasing, such as shared order forms, cooperative agreements, quarterly schedules, single-source vendors and product exceptions.
Other items can be purchased on a rotating basis for greater efficiency. This includes Potential Action Items
A. Community & Staff Outreach and Education·Create awareness of bulk purchasing benefits.
B. City Operations·Scheduled Purchases- Uniforms, furniture, landscaping products and other Department specific items can be purchased on annual schedules with enough reserve to anticipate additional needs. ·Order Form- Create a City-wide order form for each division to use for general supplies and remove personalization from items such as stationaries. ·Vendor Selection- Utilizing single-source vendors for specific items can greatly reduce the cost and environmental impact of an item.
C. City Policies·Require all Departments to follow bulk-ordering guidelines and encourage the use of bulk ordering where possible.
66

LIST OF ABBREVIATIONS
BMP Best Management PracticesCAD Computer Aided DesignCDC Comprehensive Development CodeCIP Capital Improvement ProjectCMOM Capacity Management, Operations and MaintenanceCPPAC Central Park Performing Arts CenterCRA Community Redevelopment AreaEAM Enterprise Asset ManagementENS Emergency Notification SystemEPA Environmental Protection AgencyEV Electric VehicleEVSE Electric Vehicle Supply EquipmentFLSA Fair Labor Standards ActFTE Full Time EquivalentGHG Green House GasHVAC Heating, Ventilation and Air ConditioningI&I Inflow and InfiltrationIFAS Institute of Food and Agricultural SciencesISR Impervious Surface RatioLEAP Largo Environmental Action PlanLED Light Emitting DiodeLEED Leadership in Energy and Environmental DesignLID Low Impact DevelopmentLOS Level of ServiceNOAA National Oceanic and Atmospheric AdministrationPO Purchase OrderRFP Request for ProposalROI Return on InvestmentSRP Sustainability Review PanelSSO Sanitary Sewer OverflowTBRPC Tampa Bay Regional Planning Committee
67

Community Resiliency Initiative: Planning for Sea Level Rise Dr. Barbara Lenczewski, AICPDivision of Community DevelopmentBureau of Community Planning & Growth

Community Resiliency InitiativeThis project was funded in part, through a grant agreement from the Florida Department of Environmental Protection, Florida Coastal Management Program, by a grant provided by the Office of Ocean and Coastal Resource Management under the Coastal Zone Management Act of 1972, as amended, National Oceanic and Atmospheric Administration Award No. NA13NOS4190053. The views, statements, findings, conclusions and recommendations expressed herein are those of the author(s) and do not necessarily reflect the views of the State of Florida, NOAA or any of their sub-agencies.
1

Community Resiliency Scope of Work
Working to help local governments: – Identify areas of current and
future flood risk (vulnerability assessments & modeling).
– Develop coastal resiliency strategies and integrate policies into planning processes.
– Implement statutory Peril of Flood language.
– Share the results and lessons learned.
4

Community Resiliency Scope of Work• Year 1: Build partnerships, gather information and establish
parameters. • Year 2: Evaluate vulnerability assessments, select pilots
and develop guidance on adaptation planning / Adaptation Action Areas Pilot Project.
• Year 3: Pilot adaptation planning guidance in three communities.
• Year 4: Compiling Lessons Learned and disseminating results.
• Year 5: Information Dissemination and Outreach.• Adaptive Action Initiative Years 1 - 4

Recently Completed:
• Project of Special Merit – Train the Trainers
• Peril of Flood Workshops
• Pilot Projects for Adaptation Action Area Plans
9/23/2016 4

5

6

7
http://www.floridajobs.org/community-planning-and-development/programs/community-planning-table-of-contents/adaptation-planning

Adaptation Action Planning:
PAST:• Fort
Lauderdale• Broward
County
CURRENT:• City of St. Augustine• City of Clearwater• Escambia County
9/23/2016 8

Adaptation Action AreasSection 163.3177(6)(g)(10), Florida Statutes
Optional designation for areas experiencing or are vulnerable to current and future coastal flooding
Criteria for the AAA may include, but need not be limited to areas for which: • Land elevations are below, at, or near mean higher high water • Have a hydrologic connection to coastal waters• Are designated as evacuation zones for storm surge

Adaptation Action AreasSection 163.3164(1), Florida Statutes – Coastal Management
Element, Comprehensive Plan
AAA Purpose:• Identify infrastructure funding priorities• Adaptation planning
AAA identifies one or more areas that: • Experience coastal flooding due to extreme high tides and storm
surge• Are vulnerable to the related impacts of rising sea levels

11
http://www.tbrpc.org/events/perilofflood/

What is the Peril of Flood Act?
Section 163.3178(2)(f)1, Florida Statutes, now includes sea-level rise as one of the causes of flood risk that must be addressed in the “redevelopment principles, strategies, and engineering solutions” to reduce flood risk. The new law, which became effective July 1, 2015, specifies new requirements for the coastal management element of a local government's comprehensive plan related to coastal flooding and the related impacts of sea level rise.
12

13
What is the purpose of the Peril of Flood workshops?
• Discuss the requirements of the Peril of Flood legislation for local government comprehensive plans.
• Identify best practices to address coastal flooding and the related impacts of sea level rise.
• Participate in knowledge sharing about strategies, principles, site development techniques, and related engineering solutions that will inform the goals, objectives and policies to be developed by the local government for its coastal management element .

Focus of Next 4 Years:
• Continue building partnerships: statewide focus group and state agency sub-group.
• Technical assistance to local governments.
• Integrating adaptation into current planning and development processes – funding for local government adaptation planning efforts and implementation of Peril of Flood legislation.
9/23/2016 14

Develop guidance materials and updates to Adaptation Planning Guidebook and

Dr. Barbara Lenczewski, AICPDivision of Community Development
[email protected] (850) 717-8502
http://www.floridajobs.org/community-planning-and-development/programs/community-planning-table-of-contents/adaptation-planning

Provide healthy and equitable opportunities.The City is developing its first ever Integrated Sustainability Action Plan (ISAP). The ISAP will:
• Define the City’s and community’s existing greenhouse gas (GHG) emissions inventory and identify reduction strategies;
• Develop a roadmap for 100% clean energy in the City; and,
• Guide the City and community partners to implement programs and strategies that will enhance sustainability and resiliency across municipal department operations and throughout the community.
The ISAP is utilizing the STAR Communities framework to prioritize policies and projects across a range of topic areas contributing to community sustainability and resiliency. For the STAR Communities baseline results for St. Petersburg, read the 2016 STAR Certification Results Report.
ST PETERSBURG INTEGRATED SUSTAINABILITY ACTION PLAN
175 5th Street North ● St. Petersburg, FL 33701 ● 727.893.7111
WHAT IS SUSTAINABILITY? A sustainable city is one that balances social equity and environmental stewardship with a thriving economy. It is a community that emphasizes resource efficiency, minimizes its impacts to the local, regional, and global environment, while providing healthy and equitable opportunities to live, work, and play.
St. Pete must also be a resilient city. A resilient city adapts and prepares for effects of climate change like sea level rise and extreme weather; a resilient city means city operations, businesses, and residents including vulnerable populations, can bounce back more quickly when protections are breached from time to time.
OVERVIEW

ISAP DATA COLLECTION BEGAN IN SEPTEMBER 2017.The ISAP will establish goals and strategies for broader social, economic, and environmental sustainability with a focus on equity, livability, and resiliency. The identification of these goals and strategies will be both data-driven and informed by community input. The final ISAP will include cost estimates implementation steps for key strategies. Completion of the ISAP is anticipated by the end of 2018.
HOW CAN THE COMMUNITY ENGAGE IN THE ISAP PROCESS?The ISAP team is engaging with residents, businesses, and the City organization itself.
Residents can engage in online surveys, discussions with ISAP team members during existing community forums, and small group outreach efforts to targeting underrepresented communities. Technical, business and other stakeholder working group meetings will be held to inform the plan, including a “green ribbon” executive commission of regional leaders, coordination with Chamber of Commerce leadership, and other small business community outreach.
KEEP ENGAGED WITH PLANNING PROCESS.Updates on the ISAP can be found at www.stpete.org/sustainability.
Thoughts, suggestions, and strategies to advance the CIty’s sustainability goals can be emailed to [email protected].
WHY IS SUSTAINABILITY IMPORTANT TO ST. PETERSBURG?
The City of St. Petersburg recognizes that integrating sustainability into decision-making will enhance its equity, livability and resiliency. Further integration of sustainability will promote future growth that addresses environmental, economic, and social challenges in the City.

SUSTAINABILITY MANAGER Page 1 of 2
Position Title: Sustainability Manager Pay Grade: MGT.B Department: Public Works Bargaining Unit MGT
Employment Status: Full-time FLSA Status: Exempt Revised Dates: 1/17; W/C Code: 8810
Established Date: 4/16 EEO Category: Officials and Administrators Supervisory Work: Supervises EEO Code/Name: 0105 Admin Asst.
Job Overview Summary: This is responsible professional and technical work involving the coordination of the City’s sustainability programs and activities related to economic vitality, social equity and responsibility, and environmental protection. Work includes responsibility for administrating, developing, monitoring and reporting sustainability initiatives following Florida statues, state and regional planning and local planning initiatives. Employees in this position are expected to be able to perform any and all work tasks and comply with any work schedules or attendance or duty requirements, which may be established by City or department rules. Work requires the exercise of considerable judgment, initiative and tact in dealing with employees, other agencies, contractors and the public, and is reviewed by an administrative supervisor through conferences, conversation, the analysis of reports and evaluation of results achieved.
Note: The following duties are illustrative and not exhaustive. The omission of specific statements of duties does not exclude them from
the position if the work is similar, related, or a logical assignment to the position. Depending on assigned area of responsibility,
incumbents in the position may perform some or all of the activities described below.
Duties:
Promotes initiatives and advises on sustainability programs locally incorporating more sustainable practices into City policy.
Meets with citizens, elected officials, City staff, consultants, and outside organizations to answer questions and present information on sustainability-related topics and challenges.
Establishes priorities, reviews progress and generally keeps informed of all projects relating to sustainability. Assists departments in defining sustainability program goals and objectives; establishes methods and means of
accomplishing program objectives. Conducts policy analysis and review to solve sustainability problems and recommends solutions. Maintains records, files and other information related to program and project functions and activities. May participate in energy grant administration and proposals. Reviews plans and technical specifications of assigned projects. Conducts site visits and facilitates sustainable design workshops. Assists management by facilitating the City’s strategic goals. Reviews plans and technical specifications and provides consultancy to other City departments; monitors construction
and start-up projects. Performs related work as assigned.
Minimum Qualifications:
Graduation from an accredited four-year college or university with a degree in public administration, environmental sciences, planning or closely related field with progressive related work experience in energy efficiency and sustainability projects. An active LEED-AP or similar Facility/Energy related credential is beneficial. Knowledge and Skills:
Thorough knowledge of federal, state and local regulatory requirements applicable to growth management and planning related to the preparation of plans and specifications in a wide variety of major City assigned projects.
Thorough knowledge of all areas of environmental science and sustainability measures.

SUSTAINABILITY MANAGER Page 2 of 2
Thorough knowledge of materials, maintenance procedures and of approved standards of safety as related to mechanical/electrical and energy designs and specifications.
Ability to plan, implement and coordinate administrative and sustainability programs. Ability to express ideas clearly and concisely, orally and in writing to groups and individuals. Ability to apply planning knowledge to specific administrative and technical problems. Ability to use engineering instruments and equipment and utilize computer applications and software design tools for
engineering design, drafting, mapping and plans. Ability to adapt approved engineering methods and standards to the design, construction and maintenance of a variety
of major projects. Ability to deliver quality projects on time and within budget. Ability to establish and maintain effective working relationships with employees, contractors, other agencies and the
public, as necessitated by the work.
Required Responsibilities:
Successful demonstration of cultural competence, work standards, quality work product, productivity, and job knowledge are standard expectations for all city staff and employees.
Core Competencies:
Adaptability/flexibility
Business Acumen
Conflict Management
Decision-Making
Effective Communication
Employee Trust
Staff Development
Necessary Special Requirements:
Possession and maintenance of a valid State of Florida Driver's License. If assigned duties require the use of a personal motor vehicle, an automobile insurance policy that meets the minimum requirements of liability established by the State of Florida for property damage and personal injury coverage must be maintained. Public Contact:
Contacts are an essential component of this position and are for the purpose of obtaining and furnishing information, providing interpretations, responding to complaints as assigned, and similar purposes. Work may involve considerable public contact and usually requires the incumbent to interact with the public, various City departments, and governmental agencies, as needed. Work requires an employee of this class to present oneself in a courteous, tactful, and effective manner.

Southeast Sustainable Communities Fund 2018 Request for Proposals (RFP)
Issued Friday April 20, 2018
A Letter of Intent (LOI) must be submitted by 5pm EST on Thursday, June 14, 2018
Shortlist finalists will be notified by 5pm EST on Friday July 27th, 2018
Grant awards will be announced by 5pm EST on Friday, November 16, 2018
The Southeast Sustainable Communities Fund (SSCF) announces a second round of funding for local communities in the southeastern United States. Grants will be awarded to local partnerships to advance local government policy, plans, or programs that will create equitable and sustainable energy and/or water initiatives. Grants are restricted to the states of Alabama, Arkansas, Florida, Georgia, Louisiana, Mississippi, North Carolina, South Carolina, and Tennessee. Applicants do not have to be members of the Southeast Sustainability Directors Network (SSDN); however, grantees are required to work with SSDN in a variety of outreach and educational areas. We anticipate the 2018 RFP will result in five to seven grants of approximately $75,000 to $150,000 per year for two years. Funding for Year Two is contingent on Year One performance.
For more information, visit the SSCF webpage (www.southeastsdn.org/grants), register for an informational webinar (11am EST / 10am CST on Tuesday, May 1, 2018 AND/OR 11am EST / 10am CST on Thursday, May 31, 2018) , or contact Meg Jamison, SSCF Program Manager, at [email protected].
1. Fund Background
The Southeast Sustainable Communities Fund (SSCF) is a partnership between The Kendeda Fund and the Southeast Sustainability Directors Network (SSDN). The Kendeda Fund supports the dignity of individuals and the sustainability of communities through investments in transformative leaders and ideas. SSDN is a membership network of sustainability officials representing more than 55 local governments in the Southeastern United States. SSDN members share ideas and collaborate to accelerate the adoption of sustainable best practices across the region. SSDN’s mission is to build capacity for community sustainability in the Southeast.
SSDN members collaborate to accelerate the adoption of sustainable best practices across the Southeastern U.S. www.SoutheastSDN.org
1

2. Fund Purpose
Innovation toward sustainable and equitable outcomes often looks different in the Southeast than it does in other parts of the country. All too often, the greatest challenges are not determining what communities should do to be more sustainable, but navigating the uncharted path for how to implement strategies in a way that aligns with local values. SSDN members identified two drivers to advance sustainable practices:
1. Demonstrating proof-of-concept within the Southeast context: simply put, people on the ground need success stories from within the region to make the case for leadership support.
2. Providing access to implementation funding: Southeast communities are historically and chronically under-resourced. Local sustainability efforts need access to funding sources that acknowledge regional context.
The purpose of the Southeast Sustainable Communities Fund is to accelerate the adoption of sustainable best practices in Southeast communities by funding projects that implement local sustainability solutions, while leveraging the SSDN network to help others learn from grantee experiences and widely sharing success stories about sustainability in the Southeast. The intent of this RFP is to fund five to seven projects that will support sustainable and equitable communities working in the following six areas:
1. Mitigating and/ or adapting to climate change through sustainable energy and/or water initiatives 2. Fostering equity and inclusiveness 3. Leveraging community partnerships 4. Strengthening local government commitment 5. Demonstrating scalable solutions 6. Demonstrating innovation (NEW in 2018!)
Applicants should focus on these areas in their project design and application materials.
3. Funding Amounts and Grant Project Timelines
The 2018 RFP will result in five to seven two-year grants that range from $75,000 to $150,000 per year. Grants will be issued in one-year increments, and Year Two funding will only be provided after the grantee demonstrates successful performance toward Year One project milestones. Grantees have two years to complete all stated milestones, deliver results, and spend all grant funds. Project costs associated with this grant are not to exceed $150,000 in either grant project year, and two-year funding should not exceed $300,000.
SSDN members collaborate to accelerate the adoption of sustainable best practices across the Southeastern U.S. www.SoutheastSDN.org
2

4. Eligibility Requirements and Scoring Criteria
Proposals that meet ALL of these eligibility requirements will be considered for funding using the scoring criteria in this RFP: Eligible Applicants
● Southeast U.S. Community: This funding opportunity is open to any Southeast community, including SSDN and non-SSDN members. For the purpose of this RFP, the Southeast includes Alabama, Arkansas, Florida, Georgia, Louisiana, Mississippi, North Carolina, South Carolina, and Tennessee. Statewide or Southeast region-wide efforts are not eligible.
● City or County Lead Applicant: Projects must be led by one of three types of applicants representing a city or county government: (1) An Equity Director, or (2) a Sustainability Director, or (3) someone who performs a cross-departmental equity or sustainability function. If the lead applicant is the latter of the three types of applicant, they will be required to submit a short paragraph with their application materials that describes the duties and cross-department function of their position related to equity and/or sustainability. The lead applicant is expected to be highly involved in project leadership, but they are not required to be the project manager or the funds recipient. Applicants are allowed to have a non-municipal partner receive funds and perform fiscal management for the project. Although regional planning organizations, councils of governments, municipal utilities, and/or school districts are encouraged to be partners in a proposed project, they cannot serve as the lead applicant. Please note that in the 2018 RFP, this eligibility requirement is included in the selection criteria under “Local Government Commitment”.
Grant Application Scoring Criteria Letters of Intent and Grant Applications will be scored using the following scoring criteria. Each of the criteria are weighted differently and should guide applicants as they craft different sections of their proposals. Scoring Criteria (up to 130 available points) Points Project Design: How well does the proposal identify a need within the local context, propose a solution, and clearly state the expected outcomes? How clear is the project design? How realistic is the timeframe and milestones? Does the project have the potential to be a regional best practice?
20
Impact on Community Sustainability: How impactful will the project outcomes be in mitigating or adapting to climate change in the community? How widespread will the project’s impact be in reaching the community?
20
Community Partnerships: Does the lead applicant include at least one local community partner in the project? Does the partner have a successful history of working with the target community, experience with inclusive engagement and outreach strategies, and/or technical expertise related to developing climate change solutions? How well does the partnership leverage community expertise and resources?
20
Equity and Inclusiveness: What is the extent of meaningful involvement of target populations, including people of color, people with low incomes, and/or residents from immigrant or refugee communities, in
20
SSDN members collaborate to accelerate the adoption of sustainable best practices across the Southeastern U.S. www.SoutheastSDN.org
3

shaping project design and implementation? Will the proposed project create wealth building opportunities and/or expand educational opportunities for target populations? Innovation: How does the project demonstrate innovation? To what extent does the project identify and develop new ways to solve a problem or take advantage of opportunities that can be scaled?
15
Local Government Commitment: How well does this project advance and support an adopted local government policy, plan, or program? Are there supporting resolutions or adopted policies that support this project? Has the local government taken internal steps to advance sustainability and/or equity within the local government, such as hiring a Sustainability and/or Equity Director or establishing a Sustainability and/or Equity Office?
15
Metrics: Does the project clearly measure both outcomes and outputs? How well do the milestone metrics measure impact and not just actions taken? Can the milestones be measured within the time frame of the project?
10
Budget and Match: How realistic is the budget? Does the budget provide clarity on how the funds will be used? How significantly does the cash or in-kind match add to the project’s potential for success?
10
Further Description of Grant Application Scoring Criteria Project Design: Proposals must clearly highlight the need for the project within the local community and state the solution and expected outcomes of the project. Projects should be focused on implementation. Proposals that focus solely on planning efforts will not be considered for funding. Project design should demonstrate a clear and realistic timeframe and workflow by lead applicants and partners. The design should clearly show that progress will move forward by meeting specific milestones and demonstrate how those milestones will be met. Applicants are highly encouraged to design projects so that they have the potential to be replicated and/or become a regional best practice. Impact on Community Sustainability: Projects must mitigate or adapt to climate change through sustainable energy and/or water initiatives. Proposals should detail the aspect of climate change mitigation and/or adaptation they intend to address (e.g. energy efficiency, renewable energy, water efficiency, green infrastructure stormwater, etc.), and how they plan to use or model best practices to create replicable solutions. Applicants are encouraged to seek technical expertise through partnerships or contracted professionals to ensure best practices and appropriate technology are applied to project design and implementation. Projects that seek funding solely for the design, purchase, or installation of sustainability measures are not eligible for grant funding (see non eligible projects section below). Design, purchase, or installation of individual sustainability measures may be funded when integrated into a larger project that meets all of the eligibility requirements (see examples of eligible projects below). Community Partnership: Projects must leverage community support through partnerships. Proposals must have at least one local community partner included in the application in addition to the lead applicant. Local community partners must work in the neighborhood/community/city/county in which the project will take place. Partners must demonstrate their commitment to the partnership by detailing the role they will play and how the partnership will improve outcomes of the proposed project. Ideal community partners will have a successful history of working with
SSDN members collaborate to accelerate the adoption of sustainable best practices across the Southeastern U.S. www.SoutheastSDN.org
4

the target community, experience with inclusive engagement and outreach strategies, and/or technical expertise related to developing climate change solutions. SSDN recognizes that each project will require different partners based on the local context, but each application should demonstrate an equitable approach, and make every effort to develop and implement a project in partnership with the community, not for the community. The strength of the partnership and the leverage the partnership provides will be evaluated through the scoring criteria. Equity and Inclusiveness: Projects must engage and benefit a target population of underserved community members, which SSDN defines as people of color, people with low incomes, and/or people of immigrant and refugee communities. Proposals must clearly identify the project’s target population, and how they will be impacted by the project in both the near term and long term. Projects should seek to fulfill an immediate need, but also provide the target population with the opportunity for long-term improvements, knowledge and skills development, and increased resilience. Applicants are highly encouraged to involve the target population in the shaping of the project’s design and implementation, and should demonstrate how this will happen in their proposal. Applicants are encouraged to share demographic information, submit maps, images or other data that demonstrate the need for the project in the target population and clearly describe the local context for the selection committee. Innovation (NEW in 2018!): Projects must pursue innovation whether is is through creative problem solving, a new solution and/or a unique approach to a shared problem. Innovation involves the identification, development and scaling of new ways to solve a problem or take advantage of an opportunity. Innovation can take the form of a practice, program, policy, tool, performance standard, practice and/or organizational model. SSDN understands that innovation looks different in each part of the Southeast and encourages applicants to provide their local context for the innovation they are pursuing. As projects chart new territory, SSDN understands that innovation implies a certain level of risk. Applicants should know that risks in proposals are acceptable, so long as the project design and plan are clear and demonstrate a thoughtful approach for achieving appropriate outcomes. Local Government Commitment: Strong local government leadership is important for collaborative community initiatives to thrive. Therefore, projects need to show what existing support the local government has provided to demonstrate their commitment to sustainability and/or equity initiatives. This support could include plans, policies or programs that support sustainability and/or equity, the establishment of an office or department for equity and/or sustainability, hiring of a Sustainability/Equity Director or Officer, or other relevant actions. Applicants should show how the proposed project will advance any local government policies, plans, or programs (If available, please link to or attach documentation of the policy, plan, or program information). Examples include a Climate Action Plan, a Diversity, Equity and Inclusion Plan, or Sustainability Plan. Budget and Project Match: While a dollar match is not required, successful applicants will demonstrate in-kind and/or cash support that enhances the project. In-kind support can include personnel time donated to the project, as well as donated services, equipment, and materials. For example, if a utility offers cash rebates for installed measures, the value of the cash rebates are a cash match. If an organization will host a series of workshops in a low-income neighborhood, the value of the personnel time to organize and lead the workshops is an in-kind match. Applicants must document the value of their matching in-kind and/or cash resources, if available.
SSDN members collaborate to accelerate the adoption of sustainable best practices across the Southeastern U.S. www.SoutheastSDN.org
5

Metrics: Proposals must clearly identify metrics to demonstrate the outputs (e.g. number of individuals to receive job training) and outcomes (e.g. number of individuals to be placed in full time employment as a result of the job training and placement efforts of the project) that will result from their project. Milestones within the project’s time frame should be clearly measured and clearly described in the proposal. Examples of Eligible Projects Examples of eligible water projects include, but are not limited to those that address stormwater, sea level rise, and/or drought adaptation strategies. Examples of eligible energy projects include, but are not limited to, demand-side management, energy efficiency and/or renewable energy solutions. Sample eligible project summaries can be found below:
● Recently, a destructive storm caused significant damage to a city’s tree canopy and neighborhoods, costing millions in tree debris removal and unknown losses in water storage from mature trees. As the region experiences extremes in weather, the local municipal government looks to tree canopies and green infrastructure to improve the community’s resilience to the effects of major storm events at a very local level. In addition, there are over 350 flood-prone FEMA vacant lots throughout the city’s low-income neighborhoods that are underutilized assets. This project will create urban tree nurseries and green infrastructure pilot projects on City-owned vacant FEMA lots through a green job training program. A portion of the plantings will become permanent green infrastructure, and a portion will be used in City rights of way, in the process creating pocket parks for the enjoyment of the surrounding communities. This example comes from the 2017 Savannah, Georgia grant application.
● A city is partnering with its local electric utility, local weatherization nonprofit, and additional nonprofit
organizations to offer 75 free residential energy efficiency upgrades each year for local residents that cannot afford or qualify for on-bill financing or conventional loans. The partners will provide homeowners with low income the most effective tools for achieving appreciable reductions in energy use and costs. The project will focus on creative ways to achieve financial sustainability, through on-bill customer donations (Project Share), on-bill employee donations from the municipally-owned utility and the City employee base, and the local nonprofit’s engagement to leverage community support to match those contributions one-to-one. The utility and its certified contractor network of businesses will work together to train and employ members of the low-income community in its energy efficiency programs. This example comes from the 2017 Huntsville, Alabama SSCF grant application.
Non-Eligible Projects Projects that do not come from applicants in the nine identified Southeastern states highlighted in this RFP will not be considered for funding. Local government applicants must represent city or county governments. School districts, regional government, metropolitan planning agencies, and/or local electric or water utilities may not serve as the lead applicant. Projects that do not meet the project eligibility criteria will not be considered for funding. The Southeast Sustainable Communities Fund is not intended to fund traditional environmental projects, nor is it intended to provide funding solely for the design, purchase or installation of sustainability measures on
SSDN members collaborate to accelerate the adoption of sustainable best practices across the Southeastern U.S. www.SoutheastSDN.org
6
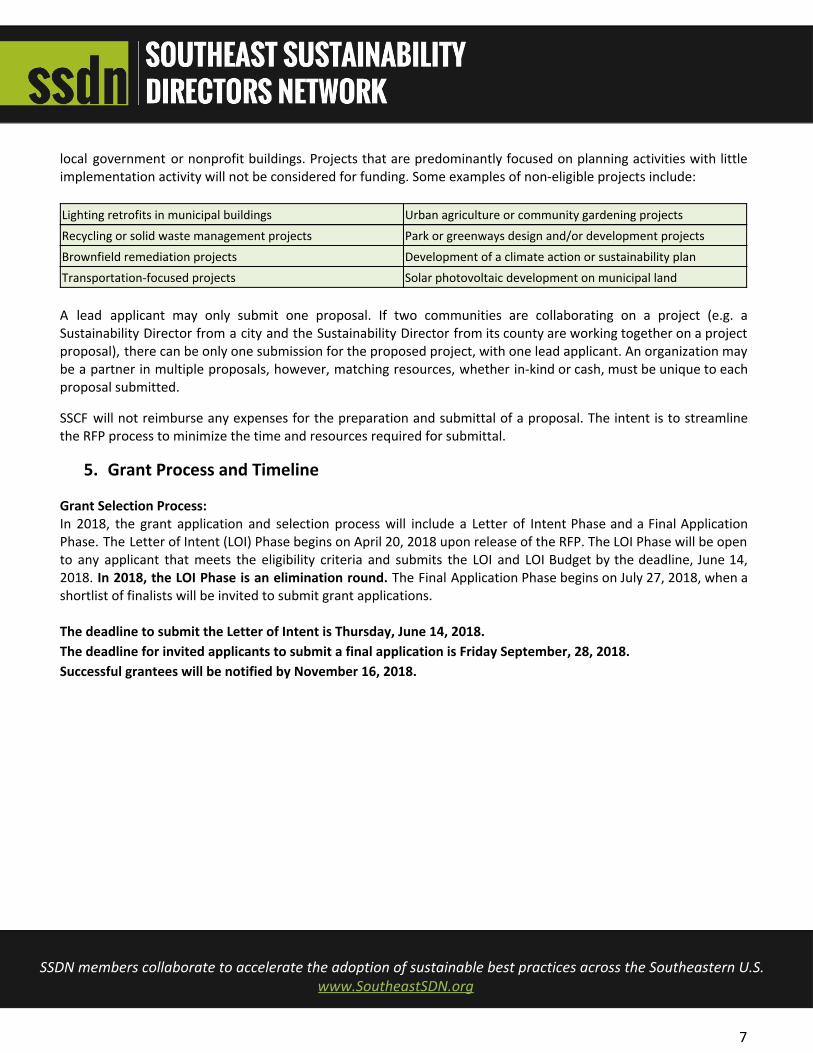
local government or nonprofit buildings. Projects that are predominantly focused on planning activities with little implementation activity will not be considered for funding. Some examples of non-eligible projects include: Lighting retrofits in municipal buildings Urban agriculture or community gardening projects
Recycling or solid waste management projects Park or greenways design and/or development projects
Brownfield remediation projects Development of a climate action or sustainability plan
Transportation-focused projects Solar photovoltaic development on municipal land A lead applicant may only submit one proposal. If two communities are collaborating on a project (e.g. a Sustainability Director from a city and the Sustainability Director from its county are working together on a project proposal), there can be only one submission for the proposed project, with one lead applicant. An organization may be a partner in multiple proposals, however, matching resources, whether in-kind or cash, must be unique to each proposal submitted.
SSCF will not reimburse any expenses for the preparation and submittal of a proposal. The intent is to streamline the RFP process to minimize the time and resources required for submittal.
5. Grant Process and Timeline
Grant Selection Process: In 2018, the grant application and selection process will include a Letter of Intent Phase and a Final Application Phase. The Letter of Intent (LOI) Phase begins on April 20, 2018 upon release of the RFP. The LOI Phase will be open to any applicant that meets the eligibility criteria and submits the LOI and LOI Budget by the deadline, June 14, 2018. In 2018, the LOI Phase is an elimination round. The Final Application Phase begins on July 27, 2018, when a shortlist of finalists will be invited to submit grant applications. The deadline to submit the Letter of Intent is Thursday, June 14, 2018. The deadline for invited applicants to submit a final application is Friday September, 28, 2018. Successful grantees will be notified by November 16, 2018.
SSDN members collaborate to accelerate the adoption of sustainable best practices across the Southeastern U.S. www.SoutheastSDN.org
7

The Round Two application process will include the following timeline: 2018 Southeast Sustainable Communities Application Process Friday, April 20, 2018 Distribute RFP Friday, April 20, 2018 – Friday June 14, 2018 SSCF staff technical assistance for self-selecting applicants Tuesday, May 1, 2018 at 11:00 am EST RFP informational webinar 1 Thursday, May 31, 2018 at 11:00 am EST RFP informational webinar 2 Thursday, June 14, 2018; 5:00 pm EST DEADLINE to for applicants to submit LOI Friday, July 27, 2018 Shortlist finalist notified Friday, September 28, 2018; 5:00 pm EST DEADLINE for shortlist applicants to submit final application Friday, November 16, 2018 Successful grantees notified Monday, December 17, 2018 Public grant award announcement Details about the application process and materials required in the LOI Phase and Final Application Phase follow. Important note: The SSCF Application Portal uses Google Forms to accept LOI and Grant Application submissions. If you DO NOT have access to Google, please email Meg Jamison at [email protected] for submission instructions before June 14, 2018. Letter of Intent (LOI): The required Letter of Intent Template can be downloaded at www.southeastsdn.org/grants. This template enables applicants to be concise and specific with their responses. Key partners may provide letters of support that clearly state their role and the in-kind and/or cash match they will be contributing, but letters of support are not required. You may choose to upload images, maps, articles or supplemental materials that clearly support your application in the grant application portal. Videos, superfluous graphics and/or generic letters of support are not encouraged. Letters of Intent are to be no more than five pages, and should be uploaded electronically via Google Forms at www.southeastsdn.org/grants in Microsoft Word format. Letters of support and budget documentation are considered attachments, and are not included in five page maximum. The deadline to submit a letter of intent is 5:00 pm EST on Thursday, June 14, 2018. Letter of Intent (LOI) Budget: The required LOI Budget Template can be downloaded at www.southeastsdn.org/grants. This budget’s purpose is to provide a big picture overview of the project’s budget needs, and needs to clearly outline the major expenses and matching funds for each funding year. Typical major expense categories include personnel/labor, materials, communications, design, transportation, equipment, and other categories as appropriate. Add or remove expense categories as needed. LOI Budgets are to be uploaded electronically to www.southeastsdn.org/grants in Microsoft Excel format. The deadline to submit a grant application is 5:00 pm EST on Thursday, June 14, 2018. Grant Application: The Grant Application will be by invitation only. Invitations to submit a final proposal will be offered to ten to fifteen of the LOI applicants. Templates for the application can be found at www.southeastsdn.org/grants. The template asks applicants to provide more detail on projects budget, activities,
SSDN members collaborate to accelerate the adoption of sustainable best practices across the Southeastern U.S. www.SoutheastSDN.org
8
strategy,outputs, milestones, and budget. Letters of support are not required, but key partners may provide letters of support that clearly state their role and the in-kind or cash match they will be contributing. Grant Applications are to be no more than eight pages, and should be uploaded electronically to www.southeastsdn.org/grants in Microsoft Word format. Letters of support and budget documentation are considered attachments, and are not included in eight page maximum. The deadline to submit a letter of intent is 5:00 pm EST on September 28, 2018. Grant Application Budget: The required Grant Application Budget Template can be downloaded at www.southeastsdn.org/grants. The budget needs to clearly delineate the detailed expenses and matching funds for each funding year. Applicants should be as detailed as possible when describing expenses, highlighting specific estimates for things like equipment rental or purchase costs, labor rates and hours, contractor costs, and materials. Add or remove expense categories as needed. Grant Budgets are to be uploaded electronically to www.southeastsdn.org/grants in Microsoft Excel format. The deadline to submit a grant application is 5:00 pm EST on September 28, 2018.
6. Technical Assistance for Proposal Development
Informational Webinars: Two informational webinars about this RFP will be held during the application period. Participation is encouraged but is not mandatory. Pre-registration is required. The webinars will be led by SSCF program staff and will revue grant requirements, timelines, and will also allow participants to ask questions of several technical experts. Documents that summarize the webinars will be posted on www.southeastsdn.org/grants after each call. Click here to register for one or both of the informational webinars: 11am EST / 10am CST on Tuesday, May 1, 2018 AND/OR 11am EST / 10am CST on Thursday, May 31, 2018. Technical Assistance: During the Letter of Intent phase of the application process, SSCF Program Staff are available to respond to written questions, to review draft materials, and/or to schedule thirty minute one-on-one calls with a proposal team. Applicants are highly encouraged to seek one-on-one technical assistance. Technical assistance requests can be initiated via email with SSCF Program Manager, Meg Jamison, at [email protected]. Applicants who are invited to submit a final proposal will have access to technical assistance calls with experts in energy efficiency, water, equity, climate resilience, project management and program development. Calls with technical experts are available by emailing SSCF Program Manager, Meg Jamison, who will set up the best communication method between finalists and technical experts.
7. Reporting Requirements There are three types of reporting requirements for grantees: Storytelling
● Grantees will be required to capture and share with SSDN aspects of their project in ways that are relatable/instructive to the general public. Examples include written feature stories and participant profiles,
SSDN members collaborate to accelerate the adoption of sustainable best practices across the Southeastern U.S. www.SoutheastSDN.org
9

photo essays, sound recordings, videos, and/or local media coverage. Storytelling submissions are required once each year of the project. These submissions do not need to be technical or expensive: using a phone to capture photos or video is sufficient. Capturing the first day of a program launch or filming 30-second interviews from a stakeholder focus group may be all it takes to translate the impact of your project to others in a more accessible way than a written grant report.
Progress Reporting
● Year One Milestone Performance Report. In the final quarter of Year One, grantees will submit to the Program Manager a written Year One progress report, of no more than three pages, that will document progress on project milestones, performance, budget, as well as Year Two funding needs and milestones. This will be the basis for a Year Two funding discussion call.
● Year Two Funding Discussion Call. Lead grantees (and key team members, if desired) will have a call with the Program Manager to discuss Year One milestone performance and Year Two funding needs after the Year One progress report is submitted.
● Final Report. At the end of the grant period, grantees will submit a brief final report to the Program Manager. This report will be between five and ten pages and will include three deliverables: 1. a final grant report that describes outcomes, impact, follow on work planned, funds leveraged, and lessons learned; 2. a detailed record of grant fund expenditures, including a comparison of original budget to actual expenditures; 3.any materials created for this grant project that demonstrate the project outputs and/or outcomes in a way that could help SSCF share the success of the grant program with other communities and other funders.
Peer Learning
● SSDN Webinar or In-Person Meeting on Project Results and Lessons Learned. The lead grantee will be asked to make a presentation about their project during a SSDN webinar or at an in-person meeting. The presentation will include project results, lessons learned, and key takeaways, etc. Travel expenses for this presentation will be covered separately from the grant funding.
● Quarterly Peer Learning Progress Calls. The lead grantee (and key team members, if desired) is required to participate in quarterly peer learning progress calls with their grantee cohort. The purpose of these calls is to share updates on progress, learn about each other’s projects, and troubleshoot challenges together. Peer Learning Progress Calls will be scheduled after grants are awarded.
Appendix These following templates can be found at www.southeastsdn.org/grants:
● RFP Attachment 1: Letter of Intent Template
● RFP Attachment 2: Letter of Intent Budget
SSDN members collaborate to accelerate the adoption of sustainable best practices across the Southeastern U.S. www.SoutheastSDN.org
10

● RFP Attachment 3: Grant Application Template
● RFP Attachment 4: Grant Budget Template
SSDN members collaborate to accelerate the adoption of sustainable best practices across the Southeastern U.S. www.SoutheastSDN.org
11