sustainable brewery initiative - colorado · marketing materials, used the term “sustainable”...
TRANSCRIPT

Sustainable Brewery Initiative February 2018

2
Contents
Executive Summary 3
Background 4
Project Description 5
Project Findings 7
P2 Recommendations 11
Sustainable Brewery Summit 14
Survey 15
Lessons Learned 16
Conclusion 17
Appendix 1 Marketing materials flyer, press release, fact sheet, website
Appendix 2 Site visit materials pre-visit questionnaire, emissions calculator, summary report
Appendix 3 List of rebates and financial assistance
Appendix 4 Follow-up survey
Primary Contacts Kaitlin Urso Small Business Assistance Program
303-692-3175 [email protected]
Derek Boer Pollution Prevention Program
303-692-2977 [email protected]
Supporting Programs Contacts Alexandria Niebergall Small Business Assistance Program
John Stier Brewers Association Sustainability Mentor
Zac Swank Boulder County, Partners for a Clean Environment Program
Jeremy Lauffenburger City and County of Denver, Denver Certifiably Green Program
Jon Strauss Colorado Department of Public Health and Environment, Manufactured Foods Program

3
Executive Summary
According to a recent industry study, Colorado is home to 348 craft brewers, second most of any state in the nation1. These brewers use significant amounts of energy in brewing and refrigeration; and water in brewing and packaging. Considerable volumes of wastes generated include spent grains and high-strength wastewater. In 2017, the Pollution Prevention and Small Business Assistance Programs at the Colorado Department of Public Health and Environment undertook an initiative to provide pollution prevention (P2) and sustainability assistance to brewers.
Two department advisors provided opportunity assessments to 22 breweries, documenting existing sustainability practices and recommending additional P2 measures to help brewers reduce utility usage and save money. The advisors found that many Colorado craft brewers had already implemented numerous sustainability practices, and that some practices such as sending spent grain to farmers, solid waste recycling, and lighting upgrades were nearly universal among program participants (Fig. 1). Most of the existing sustainability practices observed at brewers were associated with reducing energy usage.
The advisors recommended opportunities resulting in energy, water, wastewater, and solid waste reductions. Many of the recommendations did not involve expensive equipment upgrades, but rather things like employee training, leak detection, preventative maintenance, and utility tracking to improve future P2 planning (Fig. 2).
At the end of the year, two brewers reported implementing at least one of the recommended P2 measures. Both brewers reported that they began tracking and monitoring their utility usage. While it is difficult to quantify the environmental and financial outcomes of data tracking, it is the basis for future project identification and implementation.
The initiative generated awareness, interest, and networking around sustainability within the brewer sector. Some examples of this movement include:
Seven brewers presented their P2 activities at the 2017 Sustainable Brewer Summit hosted by the department;
Four brewers joined the Environmental Leadership Program (ELP) and will be recognized for their efforts;
One brewer began hosting their own local sustainability meetings; and
One brewer presented their P2 program at national conference.
1 Where is Craft Beer most Popular in America? (2017, April). Retrieved from https://datafiniti.co/craft-beer-popular-america/
0
5
10
15
20
25
Fig 1: Most Common Existing Sustainability Practices
0
2
4
6
8
10
12
14
16
Fig 2: Most Recommended Sustainability Practices

4
Background The Sustainable Brewery Initiative targeted breweries for multiple reasons: the industry is primarily comprised of small businesses; existing relationships could be leveraged through the department’s Manufactured Foods Program and local technical assistance programs (TAPs); the presence of an active and accessible Brewers Association; and the industry’s culture of environmental stewardship. The industry appeared receptive to implementing sustainability measures, and lessons learned from this sector may be applied to food manufacturers (an EPA P2 National Emphasis Area).
Furthermore, this initiative builds on information gathered by SBAP in trying to better understand craft brewery emissions of VOCs (primarily from fermentation and packaging) and NOx (from process boilers). These emissions have been quantified, compliance assistance tools were generated, and sector-based best management practices are being compiled.
Pollution prevention vs sustainability
“Pollution prevention” is defined as any practice that reduces or eliminates pollution at the source, within a facility. “Sustainability” is a broader concept, whose guiding principal is meeting the resource needs of today without compromising the ability of future generations to meet their needs. As it relates to business practices, “sustainability” is commonly used to refer to reducing a business’s overall environmental impact.
The SBAP and P2 programs used both concepts and terms in the initiative assessments and outreach. Site assessments were focused on pollution prevention activities but advisors also examined and recommended reuse and recycling measures. Of the 245 practices recommended to brewers, 89% of them were P2 activities. The remaining recommendations were related to recycling and composting wastes.
The initiative title - the “Sustainable Brewery Initiative” - and marketing materials, used the term “sustainable” because businesses are likely more familiar with the term, and because the advisors included reuse and recycling practices when appropriate.
Resources and Commitments
An in-kind contribution was made by John Stier, sustainability mentor at Brewers Association, for early help with research and for presenting at the Sustainable Brewery Summit. The department’s Manufactured Foods Program food safety inspectors were trained to identify P2 opportunities and volunteered to promote the Initiative during their regulatory visits to brewers. In-kind volunteer contributions were also made by staff at Certifiably Green Denver (CGD) and Boulder Partners for a Clean Environment (Boulder PACE) for their help planning the Sustainable Brewery Summit.
Table 1: Project Objectives
1. Establish a multi-divisional partnership model that leverages resources, shares responsibilities and results in greater overall reach and impact;
2. Identify and encourage implementation of P2 measures and best management practices for breweries through on-site assessments;
3. Host a workshop/networking event for sustainability staff within brewing sector;
4. Measure and track initiative outputs and outcomes. Communicate and promote initiative successes; and
5. Promote the department’s Environmental Leadership Program (ELP) recognition program.

5
Project Description
Brewers
Program advisors provided onsite technical assistance to 22 craft brewery facilities (Fig. 3). Thirteen of the breweries were classified as microbreweries as defined by the Brewers Association – with 2017 production under 15,000 barrels per year. Nine breweries fell into the regional brewer category with production between 15,000 and 6,000,000 barrels per year. Eight of the microbreweries were likely also classified as brewpubs, with more than 25% of their beer being sold onsite.
None of the regional breweries visited produced more than 75,000 barrels, and only one of the breweries visited is classified as a large brewery based upon its ownership by a large national producer.
The breweries visited produced nearly 400,000 barrels of beer in 2017.
Project Materials
The project team developed a number of communication materials to market the program, create project awareness, and educate brewers. These included a marketing flyer, a press release, fact sheet, and project website (Fig. 4) (see attachments). The team involved the Department’s Office of Communications to provide assistance with design and the project press release.
To support site visits, the team developed a pre-site visit questionnaire, air emissions calculator, a summary report template (see attachments). From the middle of March, 2017 through the end of the year, the initiative webpage received 1,383 page views.
The team also generated a list of rebates and financial assistance available to Colorado businesses for the purpose of increased energy and water efficiency, and waste reduction (see attachments). The list is posted online and is searchable by county or provider name.
Marketing
At the start of the project an email list was developed of most of the craft brewers in Colorado, around 300 of the reported 350 brewers in the state. The team sent an email to the list and flyer advertising the availability of no-cost, sustainability assessments. This email generated the first series of site visits. The team sent three more emails, with attached project flyers or post cards, advertising the project throughout the remainder of the year.
In March, 2017, the SBAP team prepared a press release to create greater project awareness. The release was picked up by the Denver Post’s YourHub online site, and by CompanyWeek - an online manufacturing newsletter. The press release was promoted through the Department’s communications channels.
The Sustainable Brewery Initiative also looked to make use of existing relationships between brewers and the Department’s
Fig 3: Participating Brewers Bbls/yr
mic
robre
wery
Great Divide Bottling Hall 0
Mad Jack's 150
Purpose 300
Bonfire - taproom 492
Gilded Goat 600
Intersect 700
Asher 846
Riff Raff 900
Horse and Dragon 1,500
Three Barrel 1,500
Steamworks 1,700
Phantom 2,200
Bonfire - production facility 3,750
Denver Beer 12,500
regio
nal bre
wery
Crazy Mountain 16,000
Sleeping Giant 30,000
Upslope 30,000
Great Divide 40,000
Ska 40,000
Avery 63,000
Left Hand 73,519
Breckenridge 75,000
Fig. 4: Project Materials
outr
each
flyer
post card
press release
Summit flyers and posters
project presentation
site
vis
its
fact sheet
project website
pre-visit questionnaire
air emissions calculator
summary report template
rebates list

6
Manufactured Foods Program, which regulates food and beverage manufacturers. The team asked the Manufactured Foods inspectors to look for sustainability opportunities during their inspections, and provided them with project fact sheets. Four of the 22 site visits were generated through references from the Manufactured Foods Program.
Site Assessments and Summary Reports
Site visits were advertised as “opportunity assessments” and not as technical audits. Similar to an ASHAE (American Society of Heating, Refrigerating and Air-Conditioning Engineers) Level 1 Preliminary Audit, the assessments were simple investigations that included a walkthrough of the facility, an interview of operating personnel, and potentially a brief review of utility bills or operating data. While the advisors focused on brewhouses, in facilities that included a restaurant or a taproom they would include facility-wide operations in their assessment.
Once a site assessment was requested, an advisor sent the brewery a questionnaire with basic questions on energy, air, water and waste practices and usage. The questionnaire was a way to gather base data, reduce time spent at the facility during operational hours, and identify any unique concerns prior to the visit.
Once onsite, advisors conducted an opening conference with the hosting staff, explaining the fundamentals of the program and the scope of the site visit. In nine visits the advisors were hosted by the brewery’s owner, who likely has the greatest influence in pursuing sustainability measures (Fig. 5). Six of the hosting staff were brewers - two of whom had been tasked with sustainability. Three hosts had specific roles associated with managing sustainability at their breweries.
Following the opening discussion, the brewery representatives and advisors toured the facility. The advisors asked questions about existing pollution prevention initiatives, operating processes and procedures, process equipment, building envelope and HVAC systems, and employee training. Advisors categorized their observations into media categories – energy, air emissions, water, and waste.
Following the visit, summary reports were written for each brewery that included existing sustainability practices, recommendations for improvements, and a list of additional resources (Table 2). Return-on-investment (ROI) of suggested pollution reduction practices wasn’t quantified, but the advisors attempted to focus recommendations on low-capital projects and limited the number of capital intensive recommendations.
0123456789
10
Fig. 5: Hosting Staff
Table 2: Summary Report Resources
Contact for Brewers Association Benchmarking Tools
Industry contact for data tracking and monitoring
Locally available utility audits
Locally available rebates
Information about ELP
Department contacts for compliance assistance

7
Project Findings
Existing P2 Practices at Breweries
The advisors noted an average of 16 existing P2 practices at each brewer they visited. A total of 345 practices were noted consisting of 99 unique activities. Most existing practices noted by the advisors were energy related – 184 in total, followed by waste and water (Fig. 6).
Sixty-eight percent of the P2 practices were observed in the brewhouse and included a variety of sustainability practices and technologies (Fig. 7). Facility-wide practices included many general activities that affected the entire facility like utility bill tracking, energy audits, LED lighting retrofits, occupancy sensors, and recycling programs.
Energy
The most common existing P2 energy practices show a mix of technology upgrades, and two operational activities (Fig. 8).
Lighting upgrades and occupancy sensors are often thought of as low-hanging fruit in sustainability, and many of the brewers had already installed these technologies. Lighting upgrades were noted at 21 brewers, with only one brewer yet to upgrade their lighting.
Heat exchangers, used to recapture heat generated from brewing and used to preheat hot liquor, were also universally utilized. The only facility not noted to have a heat exchanger hadn’t begun brewing at that facility.
An examination of the most common technology upgrades indicate what brewers believe will provide the greatest ROI – energy efficient equipment, insulated glycol lines, walk-in cooler curtains and doors, and efficient boilers. Energy efficient equipment was most often brewhouse systems and refrigeration systems. Variable speed drives for pumps were observed in nearly a third of the brewers. Four of the nine microbrewers utilized tankless hot water systems and reported greater efficiencies through their use.
Two simple operational practices were commonly noted. Energy usage tracking was noted in 14 of the brewers, while regular service of refrigeration components was noted in 10 brewers. Of the 14 brewers that said they tracked their energy usage, nine of them said they were using he Brewers Association Benchmarking Tools.
One regional brewer reported that utility tracking allowed them to track and predict seasonality, and changes in utility usage versus production rates. This brewer also reported tracking provided greater employee understanding of resource
0
50
100
150
200
Fig. 6: Existing P2 Practices by Type
0
50
100
150
200
250
300
Fig. 7: Where Exisiting Practices Were Noted
0
5
10
15
20
25
Fig. 8: Existing P2 Energy Practices
8
usage, promoted greater employee buy-in, and forced greater accountability across work groups.
Water
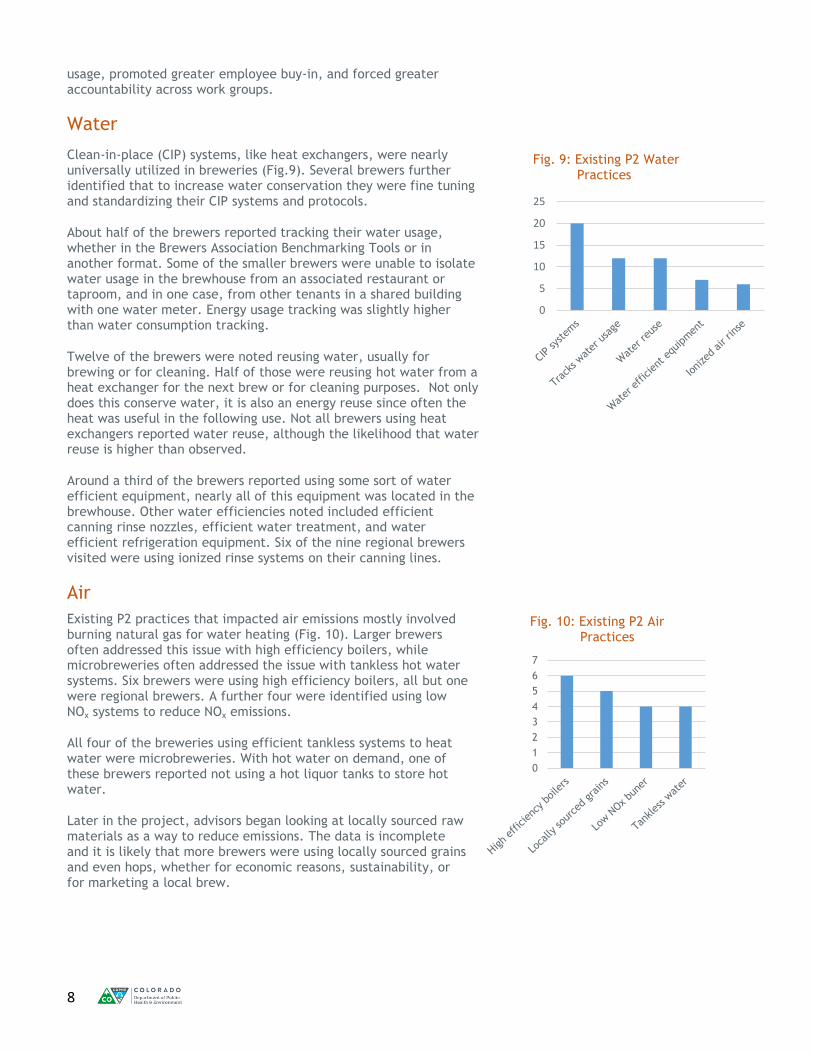
Clean-in-place (CIP) systems, like heat exchangers, were nearly universally utilized in breweries (Fig.9). Several brewers further identified that to increase water conservation they were fine tuning and standardizing their CIP systems and protocols.
About half of the brewers reported tracking their water usage, whether in the Brewers Association Benchmarking Tools or in another format. Some of the smaller brewers were unable to isolate water usage in the brewhouse from an associated restaurant or taproom, and in one case, from other tenants in a shared building with one water meter. Energy usage tracking was slightly higher than water consumption tracking.
Twelve of the brewers were noted reusing water, usually for brewing or for cleaning. Half of those were reusing hot water from a heat exchanger for the next brew or for cleaning purposes. Not only does this conserve water, it is also an energy reuse since often the heat was useful in the following use. Not all brewers using heat exchangers reported water reuse, although the likelihood that water reuse is higher than observed.
Around a third of the brewers reported using some sort of water efficient equipment, nearly all of this equipment was located in the brewhouse. Other water efficiencies noted included efficient canning rinse nozzles, efficient water treatment, and water efficient refrigeration equipment. Six of the nine regional brewers visited were using ionized rinse systems on their canning lines.
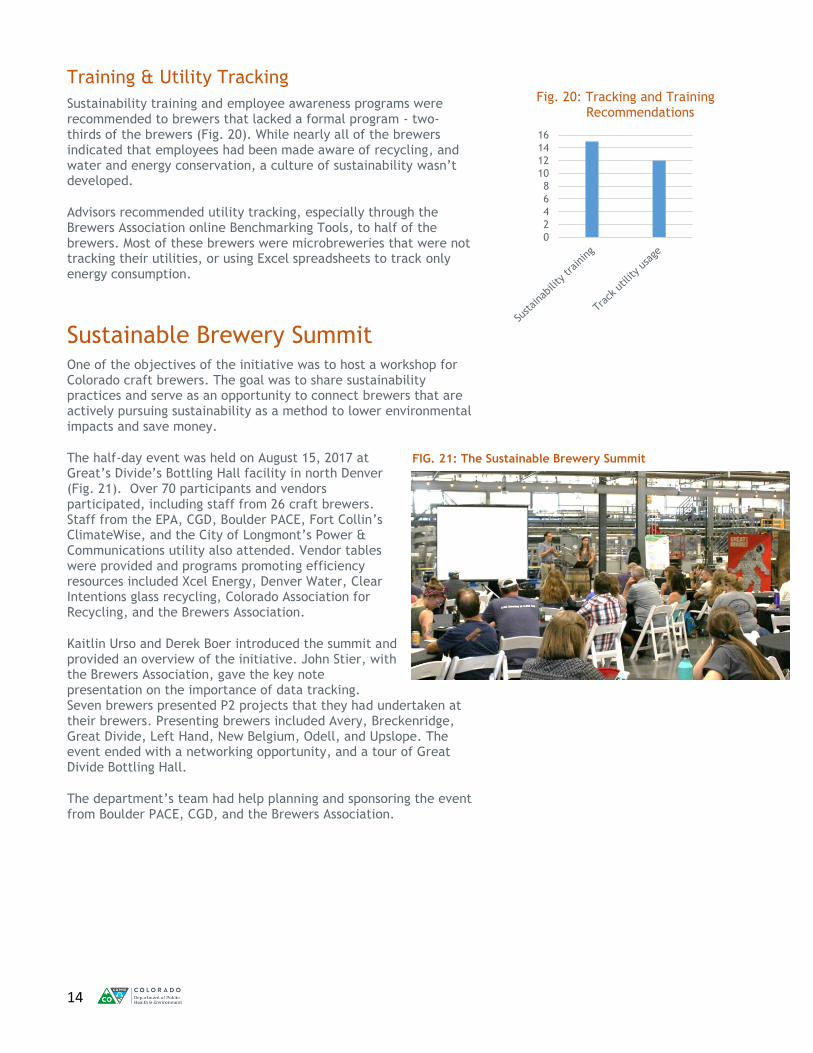
Air
Existing P2 practices that impacted air emissions mostly involved burning natural gas for water heating (Fig. 10). Larger brewers often addressed this issue with high efficiency boilers, while microbreweries often addressed the issue with tankless hot water systems. Six brewers were using high efficiency boilers, all but one were regional brewers. A further four were identified using low NOx systems to reduce NOx emissions.
All four of the breweries using efficient tankless systems to heat water were microbreweries. With hot water on demand, one of these brewers reported not using a hot liquor tanks to store hot water.
Later in the project, advisors began looking at locally sourced raw materials as a way to reduce emissions. The data is incomplete and it is likely that more brewers were using locally sourced grains and even hops, whether for economic reasons, sustainability, or for marketing a local brew.
0
5
10
15
20
25
Fig. 9: Existing P2 Water Practices
0
1
2
3
4
5
6
7
Fig. 10: Existing P2 Air Practices

9
Using air emissions factors developed by the EPA for breweries and by using data collected on the boilers and brewery operations, the advisors reached the following conclusions regarding air emissions:
99% of total air emissions are CO2 – mostly from the brew kettle and packaging
VOCs are generated mostly from fermentation and packaging (Fig. 11)
NOx and CO are generated from process boilers
CO emissions are generated from the brew kettle
Particulate matter is generated from grain handling
Waste
Sustainable waste practices were the second most common, and show broad adoption of two waste management practices (Fig. 12). Sending spent grain to local farmers and livestock owners for feed was universally adopted by the breweries visited. The spent grain was often provided to the farmer at no cost if the farmer hauled the grain.
All but one of the breweries had also implemented an internal recycling program based upon locally available recycling services. These recycling programs ranged from concerted recycling programs to more passive efforts where recycling containers were made available but employee training and engagement may have been limited. Materials commonly recycled included paper, plastic, glass, scrap metal, and cardboard.
Materials that brewers commonly found difficult to recycle included shrink wrap and polypropylene grain bags.
Fewer brewers were tracking waste than were tracking energy usage or water usage (Fig. 13).
Wastewater
Most of the smaller brewers were discharging wastewater that included trub and spent yeast, also known as high-strength wastewater, to a municipal wastewater systems for treatment. In these cases, the local publically owned treatment works (POTW) was aware of the discharge, and discharges fell within the local discharge limits. This high-strength effluent is usually high in biochemical oxygen demand (BOD), or the organic content of water, and total suspended solids (TSS).
A number of regional brewers, and microbrewers in small communities with smaller treatment plants, were either practicing or looking for options to separate high-strength wastewater from their effluent, or to pretreat their wastewater. At least one regional brewer adjusted the pH before discharge, while another implemented a more robust pretreatment system that included aeration to reduce BOD and clarification. At least two of the regional breweries provided spent yeast to their POTW to be used in the plants water treatment, while at least one other separated a spent yeast effluent for land application as a fertilizer.
0
5
10
15
20
25
Fig. 12: Existing Waste Practices
0
2
4
6
8
10
12
14
16
Fig. 13: Utility Tracking
FIG. 13
0%
5%
10%
15%
20%
25%
30%
35%
40%
Fig. 11: VOC Emissions

10
Training & Awareness
All of the brewers indicated that employees had been made aware of recycling and to a lesser extent, water and energy conservation practices. Most brewers, around two-thirds, indicated employee training and awareness usually took place through staff meetings, or more informally, “We talk about saving water.” Around a third of the brewers indicted they provided more formal sustainability training. Four of the brewers, all regional brewers, had active sustainability programs that included a sustainability coordinator or champion, and/or sustainability teams. These programs were supported brewer management.
Fifteen brewers were marketing either their corporate vision of sustainability or their active sustainability programs on their websites.

11
P2 Recommendations
Advisors recommended a mix of P2 measures across energy, water, air, waste, and corporate operations. Recommended activities included simpler and cheaper measures such as data tracking and employee training, and low-cost upgrades like aerators or low-flow spray valves. While ROI of recommended practices wasn’t quantified, advisors attempted to make most recommendations low capital projects with three year ROI or less. Larger, more capital intensive projects were also identified and discussed with brewery representatives, with the brewers themselves often identifying the more significant items on their wish list.
A total of 245 practices were recommended consisting of 43 unique activities. Most of the practices recommended by the advisors were energy related – 93 in total, followed by water and waste (Fig. 14). The advisors recommended an average of 11 P2 practices per assessment.
Nearly 90% of the recommended practices were P2 activities that concerned preventing waste before it was generated. The remaining 10% of recommended practices concerned recycling of materials such as shrink wrap and polypropylene grain bags (Fig. 15).
Energy
Around two-thirds of the most common energy recommendations dealt with equipment upgrades such as installing occupancy sensors, building improvements, energy efficient equipment, and lighting upgrades (Fig. 16).
Pre-chilling using city water involves using a heat exchanger to run city water against wort prior to running the wort against glycol cooling lines. Building improvements included installing energy efficient windows, installing radiant heating system at work spaces, building a permanent walk-in cooler, and installing 480v power.
Energy efficient equipment recommendations included inline tankless hot water, CIP rinse water collection tanks, larger brewhouse tanks, and electric hand dryers in bathrooms.
Around a third of energy recommendations concerned operational changes such as preventative maintenance programs, leak detection programs, equipment repair, process changes, and equipment optimization. Preventative maintenance programs usually dealt with regular service of refrigeration systems, and motors and pumps. Equipment repair included replacement of damaged walk-in cooler vinyl curtains, replacing damaged insulation on tanks and walk-in coolers, electrical repair to allow for individual tank cooling, and repairing existing glycol lines.
0
50
100
150
200
250
Fig. 15: Recommendations P2 vs Recycling
0
10
20
30
40
50
60
70
80
90
100
Fig. 14: Recommendations by Type
0
2
4
6
8
10
12
Fig. 16: Most Common Energy Recommendations

12
Process changes included changes to automated thermostat scheduling and changes in operations scheduling to avoid peak load demands. Equipment optimization included adjusting chillers settings to increase efficiency, recalibrating occupancy sensors, and consolidation of smaller refrigeration units.
Water
The most common P2 practice recommended for water conservation was the implementation of a leak detection program (Fig. 17). A number of brewers said they checked water lines for leaks, but they appeared to lack a formal program. One brewer was observed with several significant water leaks in installed lines. Hose leaks were more difficult to observe with hoses in use and wet floors.
Other common water conservation recommendations included equipment upgrades. Advisors recommended brewers develop a system to collect and reuse final CIP rinse for other cleaning cycles, perhaps using a final fermentation rinse on the initial rinse of a mash tun or the kettle. This water reuse would likely require a recovery tank to temporally hold the water.
In the larger regional brewers, the advisors often recommended installing sub meters at different points in the brewhouse to segregate and quantify water usage by major uses; or between the brewhouse and packaging, taproom, or restaurant. By collecting water consumption data by process, brewers are better able to understand problems areas and identify possible water conservation practices.
Beyond the installation of efficient faucet aerators and low-flow, high-pressure spray values, the advisors recommended high-efficiency rinse nozzles for canning and bottling line rinses. The advisors also recommended the adoption of water reuse in canning and bottling lines by capturing internal rinse for reuse as an external rinse. Advisors recommended that one brewery investigate high-water usage in a dishwasher.
Air
While the energy saving activities result in reductions to air emissions through reduced power generation, the advisors also looked at air pollutants in emissions.
The primary air pollutant emitted by brewers is CO2 gas which is generated during fermentation. Ninety-nine percent of total air emissions at the breweries visited were calculated to be waste CO2. This represents a P2 opportunity because brewers need CO2 for carbonation, bottling, flushing, and tank headspace to reduce oxidation.
One of the brewers visited was recapturing and reusing some of their CO2 through a collaborative partnership with a local university. Students had designed a pilot system using the waste CO2 to help grow algae onsite, which in turn was being used to produce what was described as a more sustainable ink (Fig. 18).
0
2
4
6
8
10
12
14
16
Fig. 17: Most Common Water Recomendations
Fig. 18: Pilot CO2 Reuse

13
Unanimously, brewers pointed to the price associated with current CO2 recycling technologies as the greatest barrier to adoption of CO2 recovery and reuse technologies.
Waste
Unlike energy and water recommendations, recommendations for more sustainable waste management were nearly always recycling practices. Of the most common waste recommendations only waste audits might be considered a P2 practice (Fig. 19).
Advisors focused on the recycling of difficult solid waste streams such as grain bags and shrink wrap; these were recommended in half of the visits. In a third of the assessments, the advisors recommended recycling training to employees, because while the brewery might have had recycling service, the program was viewed as informal – employees weren’t always disposing of materials properly, collection wasn’t standardized (no recycling bins), and signage was absent. Other “recycling improvements” included specific changes to recycling such as working with food vendor trucks to provided coordinated recycling of food waste containers, and improvements such as segregation of waste streams and bailing wastes to facilitate recycling.
Wastewater
While wastewater practices were often discussed during the visits, advisors failed to recommend many specific improvements. Small brewers were generally discharging wastewater to POTWs, while regional brewers were practicing some form of wastewater segregation, or pretreatment. The drivers in adoption of wastewater management were cost and local discharge requirements.
At small brewers, not yet fully regulated by their POTW, there remains a host of P2 opportunities that can reduce the amount of trub and spent yeast from becoming effluent. These include precise filling of tanks in mashing, brewing, and fermentation; efficient manual cleaning practices (dry clean-up, short bursts, screening of particulate); trub collection at fermenters; and fine tuning of CIP systems. Side streaming of waste - separating high strength wastes at the source – while more common at larger brewers can be implemented at smaller brewers. Possible barriers for smaller brewers include the space required for storage, tank costs, and finding a beneficial use for the waste such as land application or animal feed.
0
1
2
3
4
5
6
7
8
9
10
Fig. 19: Common Waste Recommendations
14
Training & Utility Tracking
Sustainability training and employee awareness programs were recommended to brewers that lacked a formal program - two-thirds of the brewers (Fig. 20). While nearly all of the brewers indicated that employees had been made aware of recycling, and water and energy conservation, a culture of sustainability wasn’t developed.
Advisors recommended utility tracking, especially through the Brewers Association online Benchmarking Tools, to half of the brewers. Most of these brewers were microbreweries that were not tracking their utilities, or using Excel spreadsheets to track only energy consumption.
Sustainable Brewery Summit One of the objectives of the initiative was to host a workshop for Colorado craft brewers. The goal was to share sustainability practices and serve as an opportunity to connect brewers that are actively pursuing sustainability as a method to lower environmental impacts and save money.
The half-day event was held on August 15, 2017 at Great’s Divide’s Bottling Hall facility in north Denver (Fig. 21). Over 70 participants and vendors participated, including staff from 26 craft brewers. Staff from the EPA, CGD, Boulder PACE, Fort Collin’s ClimateWise, and the City of Longmont’s Power & Communications utility also attended. Vendor tables were provided and programs promoting efficiency resources included Xcel Energy, Denver Water, Clear Intentions glass recycling, Colorado Association for Recycling, and the Brewers Association.
Kaitlin Urso and Derek Boer introduced the summit and provided an overview of the initiative. John Stier, with the Brewers Association, gave the key note presentation on the importance of data tracking. Seven brewers presented P2 projects that they had undertaken at their brewers. Presenting brewers included Avery, Breckenridge, Great Divide, Left Hand, New Belgium, Odell, and Upslope. The event ended with a networking opportunity, and a tour of Great Divide Bottling Hall.
The department’s team had help planning and sponsoring the event from Boulder PACE, CGD, and the Brewers Association.
0
2
4
6
8
10
12
14
16
Fig. 20: Tracking and Training Recommendations
FIG. 21: The Sustainable Brewery Summit

15
Survey Implementation
In early December, 2017, participating brewers were sent a survey to identify whether recommendations were being implemented, the benefits of any implemented measures, barriers to implementation, and brewer satisfaction with the assessment (see attachments). The survey was sent to all 20 brewers - seven responded and two reported implementing assessment recommendations (Fig. 22).
The survey consisted of eight questions and was emailed twice to the brewer contacts who had hosted the advisors, along with an additional copy of their assessment report. Responses to the survey were anonymous.
The advisors plan to contact each brewery again in April, 2018, to determine if additional recommendations are being implemented and to calculate benefits.
Brewers reported implementing three assessment recommendation – two reported both implementing data tracking and one reported developing employee education materials. A third brewer indicated that they had begun data collection and project planning, although those measures hadn’t been recommended since some tracking was already occurring.
Brewers were asked to provide any calculated benefits from implemented measures and none were reported.
Brewers were asked if they planned on implementing recommended measures - six out of seven respondents said they were planning on implementing recommendations generated through the assessments (Fig. 23).
Brewers were recommended they apply to the Colorado ELP, a department program that recognizes Colorado companies that go above and beyond environmental compliance. Four of the brewers applied and were accepted into the ELP during the brewer initiative – three at the entry Bronze Achiever level, and one at the Gold Leader level (Fig. 24). Bronze Achievers must implement a significant environmental project and one year clean compliance, while Gold Leaders must have a three-year clean compliance record and a fully implemented environmental management system.
Gold Leader Great Divide Brewing demonstrated their commitment to continual environmental improvement with a corporate sustainability strategy and a company “Green Team” to identify and implement green practices.
Brewers were asked how to make the assessments more helpful. One response addressed who was receiving the information, suggesting that key decision makers at the brewery needed to receive the information. Another brewer noted that the process of gathering information for the assessment was helpful in itself.
When asked if they would recommend the assessments to other brewers all seven respondents said they would.
Fig. 24: Breweries Accepted into Enviroinmental Program
Bro
nze
Avery Brewing
Horse & Dragon Brewing
Left Hand Brewing
Gold
Great Divide Brewing
0
5
10
15
20
25
Fig. 22: Follow-up Survey
0
1
2
3
4
5
6
7
Fig. 23: Implementation of Recommendations

16
Barriers
Five brewers described what barriers prevented them from implementing sustainability recommendations. Three identified costs associated with improvements, while 2 identified time constraints (Fig. 25).
To facilitate implementation, advisors recommended sustainability measures that included low-cost equipment upgrades, and changes to operations such as tracking or training, which required relatively little capital investment. In many cases, brewers had already implemented low-cost measures such as lighting upgrades or water efficient aerators at sinks or low-flush toilets. The idea that costs represent a barrier to implementation is supported by the fact that the only measures implemented at the time of this report were low-cost measures - data tracking and employee education.
Two brewers identified time constraints as a barrier to implementation. The post-assessment survey occurred between 2 to 11 months after the site assessments.
Lessons Learned
These are some lessons learned through the project:
Colorado craft brewers are already implementing many P2 practices; some appear to be standard practices for the sector.
A general culture of sustainability exists in up to three-quarters of participating brewers, but half of those brewers lacked formal programs.
Incentives to adopt P2 practices include reductions in operating costs, new sources of revenue, regulatory control, and customer preference and product differentiation.
Energy efficiency practices were the most common existing P2 practices at the brewers.
Opportunities for future P2 practices exist in water conservation and wastewater reduction, recovery, and reuse.
Brewery air emissions are low on individual basis, but can have a cumulative effect on area ozone.
Tracking utility usage is the first step to strategic P2 project identification and planning.
Barriers to greater P2 implementation include project cost and staff time.
A sector-based approach that involved the brewers made the project more visible, and generated interest and referrals, but did not result in significant measurable outcomes.
The internal program partnership within the department, and the leveraging of limited resources, increased the overall impact of the initiative.
0
1
2
3
4
Fig. 25: Barriers to Implemetation

17
For an effective multi-division partnership, a joint work plan that defines objectives, specifies tasks and responsibilities, and commits resources should be developed upfront.
To improve outcome reporting, the post-assessment process should include timely and regular follow-up utilizing a variety of communication methods (e-mail, phone call, post cards)
To improve the number of recommendations implemented, advisors should provide assistance in seeking relevant financial resources such as utility rebates.
Conclusion
Through the Sustainable Brewery Initiative the department was able to undertake a multi-divisional partnership that leveraged limited resources and provided a greater overall reach than otherwise possible. Colorado brewers were receptive to the assistance and exhibited a culture eager to learn more about P2 and sustainability practices. Yet while interest in the initiative was high, the initiative was unable to generate significant measurable outcomes in terms of newly adopted P2 practices and associated outcomes.
Brewers identified project costs and limited time as barriers to implementation. To overcome these barriers associated with cost, P2 assistance programs should consider providing rebates, financial aid, or at a minimum, facilitate obtaining financial assistance through external programs.
Minus significant funding for financial assistance, the P2 Program will consider handing out low-cost sustainability “kits,” that include items such as occupancy sensors and efficient spray valves, to incentivize project uptake. The P2 Program will also look to improve its role as a conduit to existing rebates and financial resources.
A host of other mechanisms might help increase project implementation. Jointly identifying one or two key P2 projects would encourage greater focus, and allow for directed support around technology and funding opportunities. Calculating and demonstrating specific project benefits and expected ROI also encourages implementation. Other mechanisms might include utilizing commitment strategies such as asking participating businesses for a pledge to complete one P2 measure in follow-up to an assessment.
The overall impact of the initiative is difficult to measure. Certainly, participating brewers have an increased awareness, interest, and interaction amongst fellow brewers around sustainability. Brewers presented their P2 activities at the Summit, and several have asked for an annual sustainability summit. Brewers are joining the ELP for recognition, and marketing their corporate commitment to sustainable operations online and through social media. One brewer has started hosting sustainability meetings with other local brewers. P2 assistance programs should also consider these qualitative outcomes, and their effect on the adoption of more quantitative outcomes in the future.