sustainable eaf steel...sustainable eaf steel production (greeneaf) doi:10.2777/44502 sustainable...
TRANSCRIPT
Sustainable EAF steel production
(GREENEAF)
doi:10.2777/44502
Sustainable EAF steel production (GREEN
EAF)EU
EUR 26208
KI-NA-26208-EN
-N
In the modern electric arc furnace (EAF) more than 40 % of energy comes from chemical sources by fossil fuels: natural gas is used in dedicated burner during the melting of the scrap while coal (mainly anthracite), lump in the basket and pulverided by wall injector, is used as foaming agent. In the frame of the European Research Fund for Coal and Steel (RFCS), project GREENEAF was carried out with the objective to replace coal and natural gas in EAF with char and sysngas produced by biomass pyrolisis.
Generally speaking, in the electric furnace, coal (and consequently char) is used as injected powder or charged into the basket. The syngas can be used for EAF burners.
The characteristics of char and biogas, and the related pyrolysis process, are tailored in order to match the requirements for their utilisation in EAF. The following activities have been carried out within the project:
— Biomass selection and classification respect their origin and characterisation activities;
— Tailoring of biomass pyrolysis: Laboratory tests to define the pyrolysis kinetics of the selected biomass, and on the basis of these results design of industrial pyrolysis; then chemical and physical characterisation of char produced by biomass pyrolysis has been carried out to define pyrolysis plant process parameters. About 15 tons of char has been produced for industrial trials;
— EAF pilot plant experimentation: First tests of char utilisation have been carried out in the pilot Furnace;
— ndustrial experimentation: industrial tests with char have been carried out.
Simulation of syngas utilisation: due to the difficulties in having syngas available close to the steel plant syngas utilisation for EAF burners has been simulated by CFD calculation. In this paper the simulation of syngas utilisation into the EAF burners are not described.
The use of syngas by biomass pirolisys in the wall-mounted burner has been investigated in this stage of the project by calculation based on CFD analysis due to the difficulty to produce syngas directly close to the EAF.
The results obtained have demonstrated the technical feasibility of the approaches used while the economical evaluation has showed the sustainability of replacing the coal with char from biomass, in addition to environmental benefits due to CO2 reduction, even if at the moment there is not a real assessed market of charcoal for steelmaking purposes.
Studies and reports
Research and Innovation EUR 26208 EN

EUROPEAN COMMISSION Directorate-General for Research and Innovation Directorate G — Industrial Technologies Unit G.5 — Research Fund for Coal and Steel
E-mail: [email protected] [email protected]
Contact: RFCS Publications
European Commission B-1049 Brussels
HOW TO OBTAIN EU PUBLICATIONS
Free publications: • one copy:
via EU Bookshop (http://bookshop.europa.eu);
• more than one copy or posters/maps: from the European Union’s representations (http://ec.europa.eu/represent_en.htm); from the delegations in non-EU countries (http://eeas.europa.eu/delegations/index_en.htm); by contacting the Europe Direct service (http://europa.eu/europedirect/index_en.htm) or calling 00 800 6 7 8 9 10 11 (freephone number from anywhere in the EU) (*). (*) The information given is free, as are most calls (though some operators, phone boxes or hotels may charge you).
Priced publications: • via EU Bookshop (http://bookshop.europa.eu).
Priced subscriptions: • via one of the sales agents of the Publications Office of the European Union
(http://publications.europa.eu/others/agents/index_en.htm).

European Commission
Research Fund for Coal and SteelSustainable EAF steel production
(GREENEAF)
L. Bianco, G. BaracchiniFerriere Nord
Zona Industriale Rivoli – 33010, Osoppo, ITALY
F. CirilliCentro Sviluppo Materiali
Via di Castel Romano 100, 00128 Rome, ITALY
A. Moriconi, E. MoriconiTecnocentro
Località Pentima Bassa, 21, 05100 Terni, ITALY
M. MarcosImperial College
South Kensington Campus, SW7 2AZ London, UNITED KINGDOM
T. Demus, T. Echterhof, H. Pfeifer, T. DemusRheinisch Westfälische Technische Hochschule Aachen
Templergraben 55, 52056 Aachen, GERMANY
C. BeilerDeutsche Edelstahlwerke GmbH
Deutsche Edelstahlwerke, 101220, 57012 Siegen, GERMANY
T. GriessacherStahl- und Walzwerk Marienhütte Gmbh
Südbahnstrasse 11, 8020 Graz, AUSTRIA
Grant Agreement RFSR-CT-2009-00004 1 July 2009 to 30 June 2012
Final report
Directorate-General for Research and Innovation
2013 EUR 26208 EN

LEGAL NOTICE
Neither the European Commission nor any person acting on behalf of the Commission is responsible for the use which might be made of the following information.
The views expressed in this publication are the sole responsibility of the authors and do not necessarily reflect the views of the European Commission.
More information on the European Union is available on the Internet (http://europa.eu). Cataloguing data can be found at the end of this publication. Luxembourg: Publications Office of the European Union, 2013 ISBN 978-92-79-33614-0 doi:10.2777/44502 © European Union, 2013 Reproduction is authorised provided the source is acknowledged. Printed in Luxembourg Printed on white chlorine-free paper
Europe Direct is a service to help you find answers to your questions about the European Union
Freephone number (*):00 800 6 7 8 9 10 11
(*) Certain mobile telephone operators do not allow access to 00 800 numbers or these calls may be billed.

Table of contents
Executive summary .................................................................................................................................4
Scientific and technical description of results .......................................................................................151 ObJectives of the project ....................................................................................................................15
2 ComparIson of initially planned activities and work accomplished...................................................15
3 Description of activities and discussion .............................................................................................15WP1 Biomass selection for EAF char production (Tecnocentro, CSM, IP)......................................15WP2 Tailoring of biomass pyrolysis (TECNOCENTRO; IP; CSM) ...............................................20WP3 Chemical and physical characterization of char produced by biomas pyrolysis (CSM, IP,RWTH) ..............................................................................................................................................20WP4 Definition of the EAF operating practices (DEW, FENO, CSM, RWTH, MU,TECNOCENTRO, IP) .......................................................................................................................42WP5 Industrial experimentation (DEW, Ferriere Nord, CSM, RWTH, MH, Tecnocentro, IP)........67WP6 Techno-economic evaluation and final report (Ferriere Nord, CSM, Tecnocentro, IP, RWTH,DEW, MH) .......................................................................................................................................89
Conclusions .........................................................................................................................................100
References ...........................................................................................................................................101
Exploitation and impact of the research results...................................................................................103List of symbols and abbreviations.......................................................................................................104List of Figures .....................................................................................................................................104List of Tables.......................................................................................................................................109
Annex 1- Slag foaming........................................................................................................................112
ANNEX 2 - Calculation of CO2 emissions from DEW steelplant......................................................114
3

EXECUTIVE SUMMARY
WP1 BIOMASS SELECTION FOR EAF CHAR PRODUCTION (TECNOCENTRO, CSM, IP)
WP is devoted to the analysis of availability of biomass in the area around the steel factoriesparticipating to the project. In fact, in order to make the biomass utilization economically convenienttransportation costs must be reduced as much as possible.The analysis of biomass availability has been carried out close to the steel plant of Ferriere Nord(Italy), DEW (Germany) and MH (Austria). Following Table reports the amount of total biomassamount close to the steel plants and the steel plant biomass demand.In general, biomass is collected from agricultural residues, from forest residues, wood industry or canbe cultivated.Within this activity some biomass species have been selected for characterization activities:
- forest residues (including ligneous species as saw dust for pellets or pulp)- grapewine and corn stalk as agricultural residues- mischantus and sorghum as biomass from cultivation
Following Table summarises the main vantages and disadvantages of different biomass specie
Biomass Advantages DisadvantagesForest residues large amount available and well
distributed during yearrelatively high energy necessaryfor collection and transportation
Corn and graspewines large amount; low cost larger ash content and nitrogen(see analysis) respect otherbiomasses
Mischantus and sorghum large amount available; present inboth North Italy, Austria andGermany; high energy ratio.nitrogen and ash amount smallerthan residues form cultivations
Need of dedicated cultivation,large productivity after secondyear of implantation; nitrogenand ash amount larger than forestresidues
Summary of main characteristics of different types of biomass.
Samples of biomass of types described in Table 2 have been collected. The following characterizationactivities have been carried out on selected biomass:
1. Physico-Chemical characterization in terms of chemical composition, ash content, ashcomposition and properties, heating value;
2. Thermogravimetric testsTable below summarizes performed characterization activities on selected biomass
Data* Ligneous biomass (Forest residues) Corn straw grapewine mischanthusLHV* [kJ/kg] 20000 18000 18900 19100Volatiles (%) 80 76-81 78 78Ash (%) 1.1 5.5 3.9 3.5C (%) 51.5 47.3 46.2 48.2H (%) 6.7 5.4 5.5 5.4N (%) 0.3 0.8 1.3 0.6O (%) 39.7 43.2 37.7 42.1S (%) 0.04 0.05 0.03 0.06Cl (%) 0.05 0.2 0.05 0.2
* Lower Heating ValueCharacterization activities performed on selected biomass
4

The performed analysis showed that the selected biomasses have very similar elemental analysis interms of C/H/O and similar volatile matter content. Biomasses heating value is also very similar. Maindifferences can be found in minor elements (as N, S and Cl ) and ash amount.
WP2 TAILORING OF BIOMASS PYROLYSIS (TECNOCENTRO, CSM, IP)
WP3 CHEMICAL AND PHYSICAL CHARACTERIZATION OF CHAR PRODUCED BYBIOMAS PYROLYSIS (IP, CSM, RWTH)
WP2 is devoted to the definition of the influence of the pyrolysis conditions in terms of temperature,residence time, material size, atmosphere composition on char and biogas yields and characteristics.WP3 is devoted to define the yield and the quality of the char produced in terms of chemicalcomposition, impurities content and relevant physical characteristics, as a function of pyrolysisconditions defined in WP2. Being the two WPs strongly connected, their activities are presented jointlyin this same paragraph. Pyrolysis products are charcoal, condensable vapours and syngas. Thepercentages of formed products depends on pyrolysis heating rate, residence time and reactiontemperature. Moreover the characteristics of formed products (in terms of composition, porosity,combustion behaviuour and so on) are a function of pyrolysis conditions.The following characteristics of char and syngas have studied:
- Char/syngas yeld as a function of different pyrolysis conditions and starting biomas- chemical composition and porosity- heating values of char as a function of different pyrolysis conditions and starting biomas- syngas composition and heating value as a function of different pyrolysis conditions- char reactivity- comparison of char reactivity with coal reactivity- Char proximate analysis
Laboratory tests are carried out with:thermobalance, to follow weight variation as a function of time and temperature (TG tests),using also different atmosphere and low heating rates (order of magnitude of 1-20 °C/min),Wire Mash Reactor, for high heating rate,Gray-King furnace, an apparatus used for testing coals according to the British Standardmethod-BS1016-107.2.
According to the performed tests the starting biomass particle size does not affect the general yield interms of char, tar and syngas.An important result is that, after 500°C, the char yield is almost stable, and this result does not dependon the biomass type. Figure below reports Char yield as a percentage of the original biomass (dry basis)as a function of temperature (°C) in experiments conducted in the Gray-King reactor.
0%10%
20%30%
40%50%60%
70%80%
90%100%
100 200 300 400 500 600 700Char yield for three different biomasses (CS: ligneous biomas, SO cultivated biomass, SW: biomas fromresidues)
Syngas compostion has been determined connecting a mass spectrometer As an example, followingcurve compare char and syngas heating value as a function of pyrolysis temperature. Char heating
CS - CHARdbSO- CHARdb
SW- CHARdb
Temperature (°C)
Charyield(%)
5
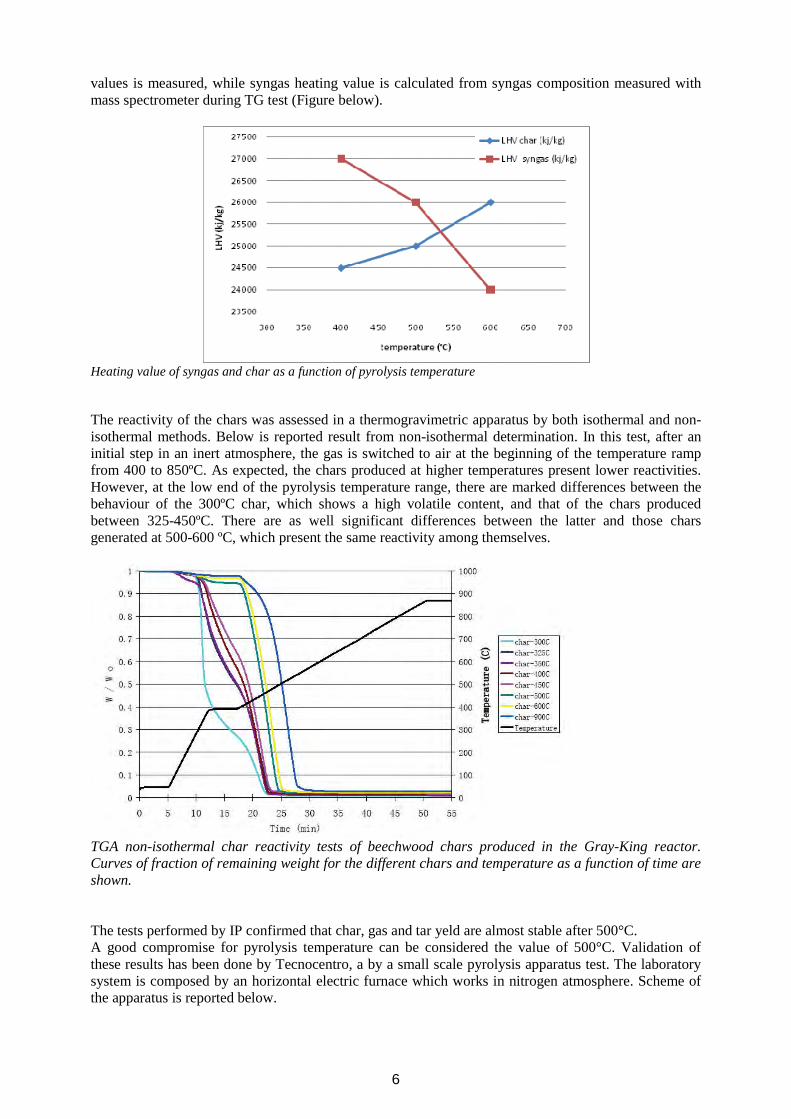
values is measured, while syngas heating value is calculated from syngas composition measured withmass spectrometer during TG test (Figure below).
Heating value of syngas and char as a function of pyrolysis temperature
The reactivity of the chars was assessed in a thermogravimetric apparatus by both isothermal and non-isothermal methods. Below is reported result from non-isothermal determination. In this test, after aninitial step in an inert atmosphere, the gas is switched to air at the beginning of the temperature rampfrom 400 to 850ºC. As expected, the chars produced at higher temperatures present lower reactivities.However, at the low end of the pyrolysis temperature range, there are marked differences between thebehaviour of the 300ºC char, which shows a high volatile content, and that of the chars producedbetween 325-450ºC. There are as well significant differences between the latter and those charsgenerated at 500-600 ºC, which present the same reactivity among themselves.
TGA non-isothermal char reactivity tests of beechwood chars produced in the Gray-King reactor.Curves of fraction of remaining weight for the different chars and temperature as a function of time areshown.
The tests performed by IP confirmed that char, gas and tar yeld are almost stable after 500°C.A good compromise for pyrolysis temperature can be considered the value of 500°C. Validation ofthese results has been done by Tecnocentro, a by a small scale pyrolysis apparatus test. The laboratorysystem is composed by an horizontal electric furnace which works in nitrogen atmosphere. Scheme ofthe apparatus is reported below.
6
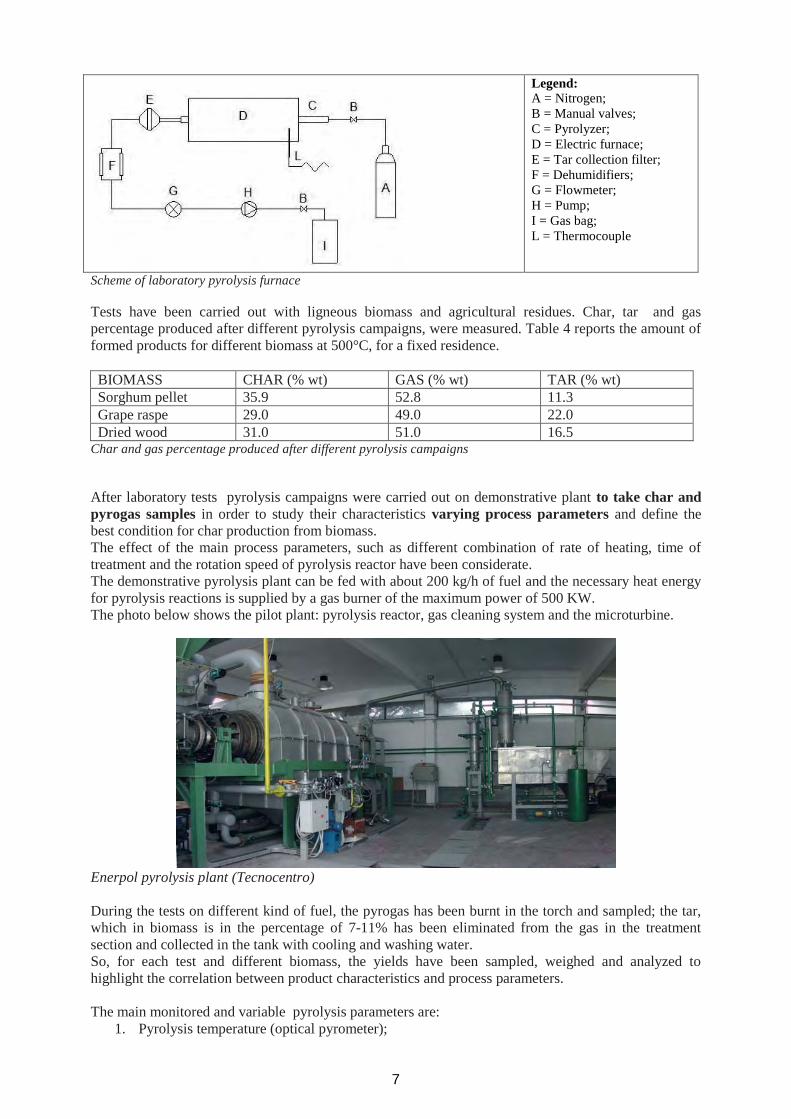
Legend:A = Nitrogen;B = Manual valves;C = Pyrolyzer;D = Electric furnace;E = Tar collection filter;F = Dehumidifiers;G = Flowmeter;H = Pump;I = Gas bag;L = Thermocouple
Scheme of laboratory pyrolysis furnace
Tests have been carried out with ligneous biomass and agricultural residues. Char, tar and gaspercentage produced after different pyrolysis campaigns, were measured. Table 4 reports the amount offormed products for different biomass at 500°C, for a fixed residence.
BIOMASS CHAR (% wt) GAS (% wt) TAR (% wt)Sorghum pellet 35.9 52.8 11.3Grape raspe 29.0 49.0 22.0Dried wood 31.0 51.0 16.5
Char and gas percentage produced after different pyrolysis campaigns
After laboratory tests pyrolysis campaigns were carried out on demonstrative plant to take char andpyrogas samples in order to study their characteristics varying process parameters and define thebest condition for char production from biomass.The effect of the main process parameters, such as different combination of rate of heating, time oftreatment and the rotation speed of pyrolysis reactor have been considerate.The demonstrative pyrolysis plant can be fed with about 200 kg/h of fuel and the necessary heat energyfor pyrolysis reactions is supplied by a gas burner of the maximum power of 500 KW.The photo below shows the pilot plant: pyrolysis reactor, gas cleaning system and the microturbine.
Enerpol pyrolysis plant (Tecnocentro)
During the tests on different kind of fuel, the pyrogas has been burnt in the torch and sampled; the tar,which in biomass is in the percentage of 7-11% has been eliminated from the gas in the treatmentsection and collected in the tank with cooling and washing water.So, for each test and different biomass, the yields have been sampled, weighed and analyzed tohighlight the correlation between product characteristics and process parameters.
The main monitored and variable pyrolysis parameters are:1. Pyrolysis temperature (optical pyrometer);
7

8
2. Gas temperature out from the reactor;3. Gas pressure out from the reactor;4. Internal reactor pressure;5. Rotation speed of the reactor (residence time);6. Feeding speed varying the rate of the feeding metering screw;7. Chemical and physical properties of the feeding fuel;8. Chemical - physical characteristics (density, elemental analysis, heavy metals), temperature and
mass balances of char and gas obtained;
The gas product is typically a mixture of carbon dioxide (9-55% by volume), carbon monoxide (16-51%), hydrogen (2-43%), methane (4-11%) and small amounts of higher hydrocarbons.Temperature affects char composition. Chars produced at higher temperatures having higher carboncontents both total- and fixed-carbon; higher temperatures lead to lower char yeld in all pyrolysisreactions.
Influence of temperature on pyrogas composition and on Higher Heating Value of pyrolysis yelds
Preliminary laboratory tests were carried out to have a first evaluation of char vs coal foamingbehaviour. The trials have been conducted using slag sampled from the DEW EAF right before slagfoaming. Foaming slag are carried into alumina crucible, filled with a mixture of pulverized char or coaland put into a furnace at 1600°C. The foamy slag is increasing the slag volume and leads to a freezingof slag to the inner crucible wall up to a height indicative of the maximum volume increase during thetrial. Figure below shows pictures of the crucibles after the slag foaming trials. Within these pictures thefoamy slag height reached during the trial is marked.
Foaming test with coal Foaming test with char
Crucible after laboratory foaming tests
The achieved volume increases clearly show the general suitability of the char for slag foaming.

WP4 DEFINITION OF THE EAF OPERATING PRACTICES (DEW, FENO, CSM, RWTH,MU, TECNOCENTRO, IP)
Activities preparatory to industrial trials have been performed consisting in:1. To perform test in pilot plant of RWTH2. Analysis of EAF cycle of the steelmakers, to design an operating practice
The pilot plant tests at RWTH have been started with trials investigating the slag foaming capability ofthe charcoal delivered by Tecnocentro and comparing it to conventionally used fossil coals.Regarding the tests into the pilot EAF plant of RWTH two types of biochar have been tested in thepilot plant as charge coal and as injection. Additionally tests with reference materials have beenperformed to compare the results from biochar tests with the standard situation in the industrial mills.As reference materials, anthracite coal and petrol coke presently used at DEW Siegen were used. Thedifferent compositions have been analyzed and the results are shown in Table below.
[%] Biochar fromgrape seed (TC)1
Biochar fromwood residues2
Anthracite(DEW)
Petrol Coke(DEW)
Carbon 77.5 60 86 93Ash 9 21 11.1 5.8Volatiles 7.7 13.5 2.6 1Humidity 5.6 5.2 - 0.2Sulphur 0.3 0.06 0.3 1Phosphor 0.5 0.4 - -Grain Size <5 mm <<1 mm 6-12 mm <1 mm
1: mean of 3 measurements; 2: mean of 24 measurements
Composition of different biochar and reference materials
As a basis the reference trials have been performed using an amount of 1 kg anthracite coal on 50 kg ofscrap. Due to the lower heating value in comparison to the anthracite coal 1.6 kg of non-processedbiochar from Tecnocentro and from wood gasification plants were charged to compensate thedifference. Just before tapping at 1650°C, a melt sample was taken for chemical analysis to giveinformation about possible negative effects of biochar use. After tapping all output fractions have beenseparated and the individual output masses were recorded. Figure below reports steel analysis after trialtests, comparing coal, and two char from two providers.
Steel composition after pilot trials
9

The evaluation of the pilot arc furnace trials shows no negative effects regarding the steel and slaganalysis. Differences occur in terms of the Ni and Mn content. These differences can be explained bysmall fluctuations in the scrap composition and they are not addressed to pollution from char use.The reference trial shows a higher carbon content than the two biochar trials. This would imply a bettercarburization of the melt by the anthracite coal and would also be in agreement with the findings of theoff-gas analysis. Considering the sulphur content of the steel, the effect is evident of the lower sulphurcontent of the biochar in relation to the reference materials. The steel produced by the biochar trials hasonly about half the sulphur content in relation to the reference trial. Despite the higher phosphorconcentration in the different biochar on the other hand, the phosphor content in the steel is the same forall trials. So the use of biochar instead of fossil coal shows no negative impact on steel composition inthe pilot trials. Also regarding the slag composition, these first preliminary results indicate no negativeinfluence of the use of biochar with higher ash content on the general slag composition.
WP5 INDUSTRIAL EXPERIMENTATION (DEW, FERRIERE NORD, CSM, RWTH, MH,TECNOCENTRO, IP)
The use of char in EAF has been tested at industrial scale by the three industrial partnersparticipating to the GreenEAF project. The industrial partners involved in this project have differentEAF, which differs for size, capacity, and amount of chemical energy. Following Table reports themain EAF characteristics. Char industrial testing with these three furnaces will exploit a wide range ofoperational variability. Both char charging and injection have been tested. FENO uses coal charged andinjected for respectively bath carburization and foaming. DEW uses coal mainly for bath carburization:coal is manly charged and injected in a small amount. DEW and MH uses coal for foaming: coal onlyinjected.
Chargeweight(TLS)
Num.buckets/heat
Electricalenergy input[kWh/TLS]
CH4[Nm3/TLS]
O2[Nm3/TLS]
Coal lump[kg/TLS]
InjectedCoal
[kg/TLS]
Poweron [min]
Tapto tap[min]
FENO 140 3 341 6 42 4 8 38 45DEW 130 2 417,2 0 21,8 10.7 1,53 54 69MH 40 3 375 7 45 0 12 31 45
FENO: Ferriere NordDEW: Deutsche Edelstahlwerke GmbHMH: Marienhütte Ges. m.b.h.
Main characteristics of the electric furnaces of the industrial partners participating to the project
Charged char testsSubstitution of charged coal with char has been tested by Ferriere Nord and DEW. Charged coal
can be needed to reach certain carbon levels in the steel depending on scrap qualities available. It canalso be used to substitute electrical energy by chemical energy when oxygen is used to decarburize themelt and the carbon is burned to CO and CO2 respectively.
Ferriere Nord uses about 1 ton of charge coal per heat, while DEW about 1.4 tons of coal perheat. The Electric furnace of Ferriere Nord is equipped also with the offgas online monitoring systemEFSOPTM.
The average of steel and slag analysis with char charged in 5 heats has been compared with theaverage of 5 standard heats. As example Figure below reports the comparison of average values of steeland slag analysis measured at DEW in standard and trials heats. The results from steel and slag analysisshow no significant differences.
Off gas analysis system (EFSOP analyzer) in Ferriere Nord has been used during tests. Measureddata have been compared with data of the production of CO/CO2/H2 during standard operations.
The main difficulty in char charging is related to high char reactivity. Significant powderdispersion has been noticed during handling and charging operations and intense flame emissions wereobserved during trials with char.
This problem has been solved with preliminary material briquetting. New industrial testsperformed with charcoal briquettes have been performed and confirmed the absence of anomalousflame emissions with briquetted material.
10

Steel analysis Slag analysis
Comparison of steel and slag analysis of standard and trials heat measured at DEW
CO/s* CO2/s* H2/s* O2/s*Char Trials 16,07 17,34 9,85 0,39
Standard Trials 17,55 16,96 10,19 0,16Average Values of offgas compostion measured during industrial trials at Ferriere Nord
Injected char trialsFoaming trials were carried out by the three industrial partners. Slag foaming is a very complex
equilibria depending on slag properties (mainly viscosity and surface tension), amount of injected coal(which affect the amount of gaseous species necessary to promote foaming) and also coal reactivity. So,beside the energetic input, the foaming behavior is an important process aspect which must be takeninto account for industrial testing of char.
For a better control of foaming process Marienhütte developed together with VATRON GmbHan Optical Foaming Slag Management System (OFSM). The slag height is detected by a cameracontinuously. The camera is placed close to the slag door. Special image processing software calculatesa slag index to be used for the injection of the carbon amount required. Due to the real-time monitoringof the slag level it is possible to adjust the C-contents by injection of the optimal quantity of carbon.Following figure reports the images of three foaming tests with char produced by Tecnocentro.
Injection tests were carried out also by DEW and Ferriere Nord.Results obtained by the three partners were partially satisfactory, in the sense that in some trials goodfoaming behavior was observed, and in some trials no. These results indicate that injection system mustbe improved promoting the penetration of char into the slag.
11

Test C. No foaming
Test B. Poor foaming beavhiour
Test A . Good foaming beavhiour
Foaming tests recorded with Optical Foaming Slag Management System (OFSM installed atMarienhütte
Environmental monitoring at stack was carried out both by FENO and DEW and confirmed that chardoes not introduce any modification respect the historical plant trends.
Use of syngas in EAFDue to the difficulty to produce syngas close to the steel plant for industrial trials, syngas
utilization into the EAF burners has been simulated trough CFD modeling. Due to complexity of syngascomposition the simulation of syngas industrial utilization has been carried out according to thefollowing criteria:
Definition of a quantitative criteria to compare natural gas burning with syngas burningCFD calculation with natural gas burning to be used as reference situationCFD calculation with the syngas and comparison with reference situation
Calculation was set considering a bidimensional calculation domain having diameter of 2500 mmand length 6000 mm. The domain is surrounded on three sides by the furnace atmosphere (consideredcomposition of the atmosphere is taken from measurement of offgas analysis system of FENO) attemperature of 1100°C. On one side (in which is present the burner in symmetric position) thetemperature is fixed at 100°C (considering the temperature of water cooled panels)
Quantitative criteria to compare the standard and syngas situation must be introduced. Thecriteria selected to compare natural gas and syngas burning is the efficiency, defined as:
The syngas composition used in the simulation has been measured during industrial charproduction. Due to the heating value of the obtained syngas, syngas composition has been enriched withmethane up to obtain the value of 21 MJ/kg of heating value. This is the value which is compatible withthe maximum flow rates available on the steel plant of Ferriere Nord.
burnerthefromkWscrapthetokW
12
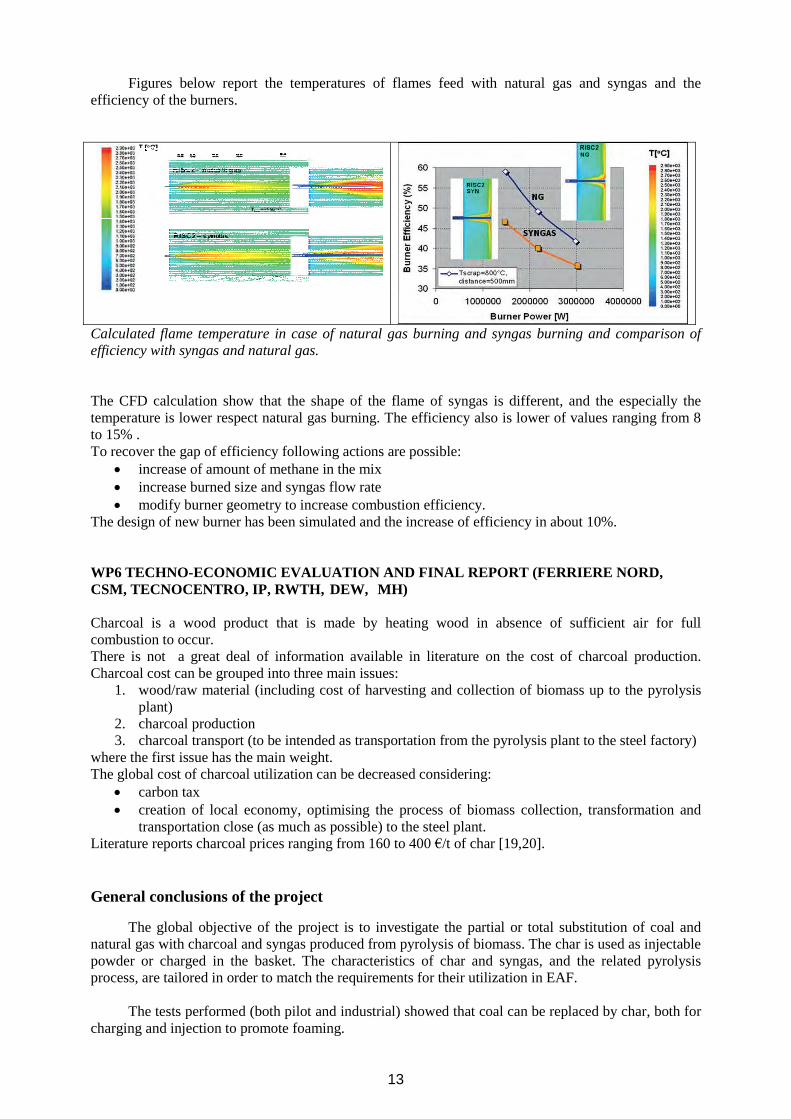
Figures below report the temperatures of flames feed with natural gas and syngas and theefficiency of the burners.
Calculated flame temperature in case of natural gas burning and syngas burning and comparison ofefficiency with syngas and natural gas.
The CFD calculation show that the shape of the flame of syngas is different, and the especially thetemperature is lower respect natural gas burning. The efficiency also is lower of values ranging from 8to 15% .To recover the gap of efficiency following actions are possible:
increase of amount of methane in the mixincrease burned size and syngas flow ratemodify burner geometry to increase combustion efficiency.
The design of new burner has been simulated and the increase of efficiency in about 10%.
WP6 TECHNO-ECONOMIC EVALUATION AND FINAL REPORT (FERRIERE NORD,CSM, TECNOCENTRO, IP, RWTH, DEW, MH)
Charcoal is a wood product that is made by heating wood in absence of sufficient air for fullcombustion to occur.There is not a great deal of information available in literature on the cost of charcoal production.Charcoal cost can be grouped into three main issues:
1. wood/raw material (including cost of harvesting and collection of biomass up to the pyrolysisplant)
2. charcoal production3. charcoal transport (to be intended as transportation from the pyrolysis plant to the steel factory)
where the first issue has the main weight.The global cost of charcoal utilization can be decreased considering:
carbon taxcreation of local economy, optimising the process of biomass collection, transformation andtransportation close (as much as possible) to the steel plant.
Literature reports charcoal prices ranging from 160 to 400 /t of char [19,20].
General conclusions of the project
The global objective of the project is to investigate the partial or total substitution of coal andnatural gas with charcoal and syngas produced from pyrolysis of biomass. The char is used as injectablepowder or charged in the basket. The characteristics of char and syngas, and the related pyrolysisprocess, are tailored in order to match the requirements for their utilization in EAF.
The tests performed (both pilot and industrial) showed that coal can be replaced by char, both forcharging and injection to promote foaming.
13

In case of charging the following aspects should be deeply investigated:char reactivity: char start burning during charging. Char reactivity depends on high surfacearea, volatile content and powders dispersion during charging. Proposed solution is a char pre-treatment with briquetting stage before charging;slag foaming: some trials showed good foaming behaviour, other trials were not satisfactory.Proposed solutions are improvement of injection system and utilization of additives togheterwith char powder to increase char/slag wettability and promote reaction of char with ironoxide. The injection system must ensure char injection below the slag
Moreover, syngas utilization in EAF burners, instead of natural gas has been simulated by means ofCFD calculations. The used syngas composition was that arising from the pyrolysis tests. Syngasutilization leads to a decrease of EAF efficiency.
Techno economic evaluation carried out considering char cost and CO2 emission leads to the conclusionthat:
official market for biochar does not exist an which can be used in steel mills. Most part ofbiochar production is still in pilot scale state. So the prices per ton of produced biochar are notrepresentative. Literature reports prices ranging from 160 to 400 /t of produced char.Evaluation of Tecnocentro indicates a price of production in the range 200-250 /t. The localavailability of biomass is mandatoryexemplary price of 18 per ton of CO2 partially compensate actually higher price of charcoal.
In the next few years the industrial scale production of different biochar qualities is expected andaccording to this the development of a market and a market price.
In Addition to that increases of the prices for fossil coal are expected, too. In general the use of biocharputs the electric steel mills in a position to avoid CO2 emissions which are relevant for the EU ETS likethe emissions from fossil carbon.
14

SCIENTIFIC AND TECHNICAL DESCRIPTION OF RESULTS
1 OBJECTIVES OF THE PROJECTThe ECSC project “Sustainable EAF Steel Production – GREENEAF” has the objective to study
the EAF cycle in order to investigate the partial or total substitution of coal and natural gas withcharcoal and syngas produced from pyrolysis of biomass.
Generally speaking, in the electric furnace coal (and consequently char) can be used as injectedpowder or charged into the basket. The syngas can be used for EAF burners.
The characteristics of char and syngas, and the related pyrolysis process, must be tailored in orderto match the requirements for their utilization in EAF.
The feasibility of coal substitution has been tested with industrial trial.
2 COMPARISON OF INITIALLY PLANNED ACTIVITIES AND WORKACCOMPLISHED
All project activities foreseen in the technical annex have been carried out without deviations.
3 DESCRIPTION OF ACTIVITIES AND DISCUSSION
WP1 BIOMASS SELECTION FOR EAF CHAR PRODUCTION (TECNOCENTRO, CSM, IP)
WP1 is devoted to the analysis of availability of biomass in the area around the steel factoriesparticipating to the project.In general, biomass is collected from agricultural residues, forest residues, wood industry or can becultivated.These three species of biomass differ for:
• Amount• Different expected characteristics of produced char in terms of size, shape, mechanical
characteristics and pollutants emissions• Availability during the year• Different energetic balance [3,4,7], considering the heating values and the energetic expense for
cultivation, collection and transportation.
In what follows, the local situation in Friuli (Italy), North Rhine-Westfalia (Germany) and Styria(Austria) has been analysed. In these three regions are located respectively the steel plant of FerriereNord, Deutsche Edelstahlwerke and Marhienutte.
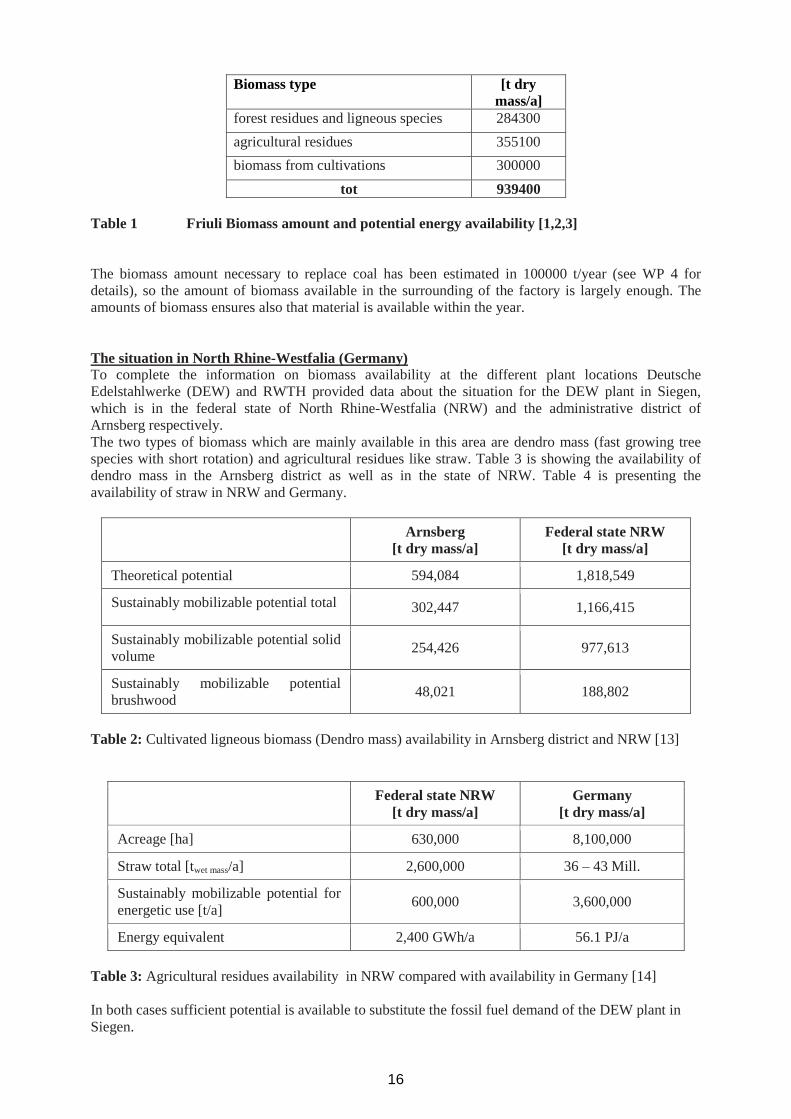
The situation in Friuli (Italy)The steel plant of Ferriere Nord steel plant is located in the region of Friuli, in the North of Italy.Table 1 reports the amount and types of available biomass, the corresponding energy potential and anestimation of CO2 amount which can be saved.
15
Biomass type [t drymass/a]
forest residues and ligneous species 284300agricultural residues 355100biomass from cultivations 300000
tot 939400
Table 1 Friuli Biomass amount and potential energy availability [1,2,3]
The biomass amount necessary to replace coal has been estimated in 100000 t/year (see WP 4 fordetails), so the amount of biomass available in the surrounding of the factory is largely enough. Theamounts of biomass ensures also that material is available within the year.
The situation in North Rhine-Westfalia (Germany)To complete the information on biomass availability at the different plant locations DeutscheEdelstahlwerke (DEW) and RWTH provided data about the situation for the DEW plant in Siegen,which is in the federal state of North Rhine-Westfalia (NRW) and the administrative district ofArnsberg respectively.The two types of biomass which are mainly available in this area are dendro mass (fast growing treespecies with short rotation) and agricultural residues like straw. Table 3 is showing the availability ofdendro mass in the Arnsberg district as well as in the state of NRW. Table 4 is presenting theavailability of straw in NRW and Germany.
Arnsberg[t dry mass/a]
Federal state NRW[t dry mass/a]
Theoretical potential 594,084 1,818,549
Sustainably mobilizable potential total 302,447 1,166,415
Sustainably mobilizable potential solidvolume 254,426 977,613
Sustainably mobilizable potentialbrushwood 48,021 188,802
Table 2: Cultivated ligneous biomass (Dendro mass) availability in Arnsberg district and NRW [13]
Federal state NRW[t dry mass/a]
Germany[t dry mass/a]
Acreage [ha] 630,000 8,100,000
Straw total [twet mass/a] 2,600,000 36 – 43 Mill.
Sustainably mobilizable potential forenergetic use [t/a] 600,000 3,600,000
Energy equivalent 2,400 GWh/a 56.1 PJ/a
Table 3: Agricultural residues availability in NRW compared with availability in Germany [14]
In both cases sufficient potential is available to substitute the fossil fuel demand of the DEW plant inSiegen.
16

The situation in Styria (Austria)Even if not directly involved in this WP, Stahl- und Walzwerk Marienhütte (MH) provided data aboutlocal situation of biomass availability in Austria, in order to have a reference situation to be comparedwith plant needs. Austria has a large amount of biomass availability, actually used for power generation(see Figure 1, (a)). The potential on wood is about 31 million solid cubic meters per year, wherefromonly 19 million are used at the moment. Most of this wood, with a still rising trend, is used for heat andenergy production in different forms. In Styria the annual amount of wood used for energy production isabout 1.2 million solid cubic meters (Steiermark Holzeinschlag, www.verwaltung.steiermark.at, Stand21.1.2009).
(a)
split logs 71.8 43%
woodchips 10.0 6%woodpellets 2.9 2%
straw 0,2 0%
landfill 0.5 0%
digester gas 0.7 0%
biodiesel 0.2 0%
waste liquor/Sludge ofpaper industry 23.6 14%
waste 2.2 1%
other refuse 14.7 9%
solar heat 3.7 2%
heat pumpe 6.1 4%wind 1.3 1%
geothermal energy 0.8 0%
photvoltaics 0.0 0%
industry wood off-cuts(incl. bark) 17,3%
(b)
115.000
56.000
27.800
-
24.849
122.616
3.000
-
5.000
10.000
15.000
20.000
25.000
-20.00040.00060.00080.000
100.000120.000140.000160.000180.000200.000
Land
requ
irem
ent[
ha]
Dem
and,
Cap
aciti
es[t,
DM
/a]
Raw materials
Demand [t,DM/a]Capacity Styria [t,DM/a]Land requirements [ha]
780.000 t,DM/a
Figure 1 (a): Gross consumption of renewable energy sources in Austria in the year 2003(b): Biomass potential in Styria
Due to the fact, that wood is a typically expansive biomass also some potentials of low pricedbiomasses were checked for the region Styria. One of these biomasses is strew from different origins,
17

which has a potential of about 115000 t per year. The actually used part of strew can only be estimated.One problem of strew is its seasonality, which would lead the high storage capacities.In Styria also high amounts on corn are cultivated. This results in about 56000 t of cobs per year, whichare also one potential feedstock material for charcoal production. The quantity of biomass arising atlandscape conservation works is about 28000 t per year. In most cases this material is converted towoodchips. Bark, which is very often a by-product in wood industry, has a potential of about 123000 tper year. Also waste wood seems to be interesting for charcoal production. It accumulates in an amountof approximately 25000 t/a.Two examples for very special but also interesting biogenic feedstock materials are brewer grains andsewage sludge with an occurring amount of 3000 t/a and 34000 t/a, respectively in Styria.One additional option would also be the purchase of some agricultural areas and the cultivation of ownbiomass in form of e.g. short rotation crops or wood. The typical crop yield for such plantations inStyria is about 10 to 20 t/ha and year. This means, for the cultivation of reasonable amounts of biomass,huge areas of several km² would be needed.Figure 1(b) gives an overview of the arising amounts of different biomasses in Styria. Comparable, thedemand on injection coal at Marienhütte is about 5400 t per year, which gives a consumption of purecarbon of about 5000 t per year for slag foaming. To cover this demand by charcoal, approximately20000 t/a of feedstock biomass would be needed, if a carbonization yield of 30 % and a carbon contentof the charcoal of 80 % is taken as a base; this amount is largely available at the moment.
Main conclusions from the analysis carried out by all the partners are reported in Table 4, describingsynthetically the main advantages/disadvantages of considered biomasses.
Biomass Advantages DisadvantagesForest residues large amount available and well
distributed during yearrelatively high energy necessary forcollection and transportation
Corn and graspewines(agricultural residues)
large amount; low cost larger ash content and nitrogen (seeanalysis) respect other biomasses.Seasonal
Mischantus andsorghum (cultivatedbiomass)
large amount available; present inboth North Italy, Austria andGermany; high energy ratio.nitrogen and ash amount smallerthan residues form cultivations
Need of dedicated cultivation, largeproductivity after second year ofimplantation; nitrogen and ash amountlarger than forest residues. Seasonal
Table 4 Main advantages/disadvantages of considered biomasses
Task 1.2 Characterization activities (Tecnocentro, CSM)
Physico-Chemical characterization in terms of chemical composition, ash content, ash composition andproperties, heating value have been carried out on the selected biomass. Results are presented in whatfollows
Physico chemical characterization of biomass
Representative samples of biomasess have been collected by Industrial partners and Tecnocentro andused for characterization activities and for further pyrolysis tests at lab scale..Among the individuated categories of biomass (Table 5), the following representative samples werecollected:
Forest residues (with and without bark)Corn straw and Grapewine (residues from cultivations)Mischantus and sorghum (cultivated biomas)
Following Table summarises performed characterization activities of CSM and Tecnocentro
18

Data* Forestresidues
Wood+bark Bark Woodwithout
bark
Cornstraw
corn grapewine mischanthus Sorghumpellet
Lowerheatingvalue
(LHV)[kJ/kg]
20000 18100 16200 18500 18000 17500 18900 19100 18000
Volatiles(%)
80 82 76 85.0 76-81 76 78 78 81
Ash (%) 1.1 0.8 3 5.5 5.5 3.5 3.9 3.5 6.8
C (%) 51.5 47 47 51.0 47.3 45 46.2 48.2 43.7
H (%) 6.7 6 5.4 - 5.4 6 5.5 5.4 5.73
N (%) 0.3 0.3 0.4 0.16 0.8 1.8 1.3 0.6 1.07
O (%) 39.7 44 40 43.2 43 37.7 42.1
S (%) 0.04 0.05 0.06 0.02 0.05 0.12 0.03 0.06 <0.1
Cl (%) 0.05 - - - 0.2 0.08 0.05 0.2 0.4
Table 5 Physico-chemical characterization of selected biomasses. Moisture content rangesform 10-12 % in all the samples
Following Table reports the characterisation of biomass ashes, in term of oxide content and alsoviscosity.This data will be used to design the industrial tests. One representative example of ash for each categoryof biomass has been considered.
[%] Forestresidues
corn Grape wine mischantus
SiO2 5.6 1.4 22.03 71.7K2O 38 42 31.2 14.56CaO 22.87 11.02 20.1 7.56MgO 17.35 9 8.52 2.69P2O5 14.98 28.5 16.19 2Na2O 1.1 0.5 0.7 0.9FeO 0.42 1.3 0.54 0.5MnO 0 0.2 0.1 0Al2O3 0 1.06 0.1 0.93
Table 6 Biomass ashes composition
The performed analysis showed that the selected biomasses have very similar elemental analysis interms of C/H/O and similar volatile matter content. Biomasses heating value is also very similar.
Main differences can be found in minor elements (as N, S and Cl ) and ash amount. This means that thepossible effects on EAF process, influence on steel and slag composition and environment pollutionmust be investigated and analysed in the industrial tests.
19

Ashes composition is very different from the four types of biomass: mischantus has a very high silicacontent, while the other biomass have a significant content of potassium oxide.The effect on EAF slag composition and the subsequent effect of main slag physical properties (meltingbehaviour and viscosity) will be evaluated in WP4.
WP2 TAILORING OF BIOMASS PYROLYSIS (TECNOCENTRO; IP; CSM)
WP3 CHEMICAL AND PHYSICAL CHARACTERIZATION OF CHAR PRODUCED BYBIOMAS PYROLYSIS (CSM, IP, RWTH)
WP2 is devoted to the definition of the influence of the pyrolysis conditions in terms of temperature,residence time, material size, atmosphere composition on char and biogas yields and characteristics.WP3 is devoted to define the yield and the quality of the char produced in terms of chemicalcomposition, impurities content and relevant physical characteristics, as a function of pyrolysisconditions defined in WP2. Being the two WPs strongly connected, their activities are presented jointlyin this same paragraph.In what follows the task activities are reported according to the following logical order:
1. Task 2.1: laboratory tests to define the pyrolysis kinetics of the selected biomass2. Task 3.1: characterization of char and biogas3. Task 3.2: process parameters4. Task 2.2: definition of pyrolysis process parameters
Task 2.1: laboratory tests to define the pyrolysis kinetics of the selected biomass. (CSM, IP)
Laboratory tests have been carried out to determine:- pyrolysis kinetic- amount of char, biogas and tar produced under different pyrolysis conditions- the chemical composition of biogas
Tests are carried out with thermobalance (TG tests), with low heating rates (order of magnitude of 1-20°C/min) and with wire mash reactor, for high heating rate and Gray-King furnace, an apparatus used fortesting coals according to the British Standard method-BS1016-107.2Experimental tests have been carried out by CSM and Imperial College. Descriptions
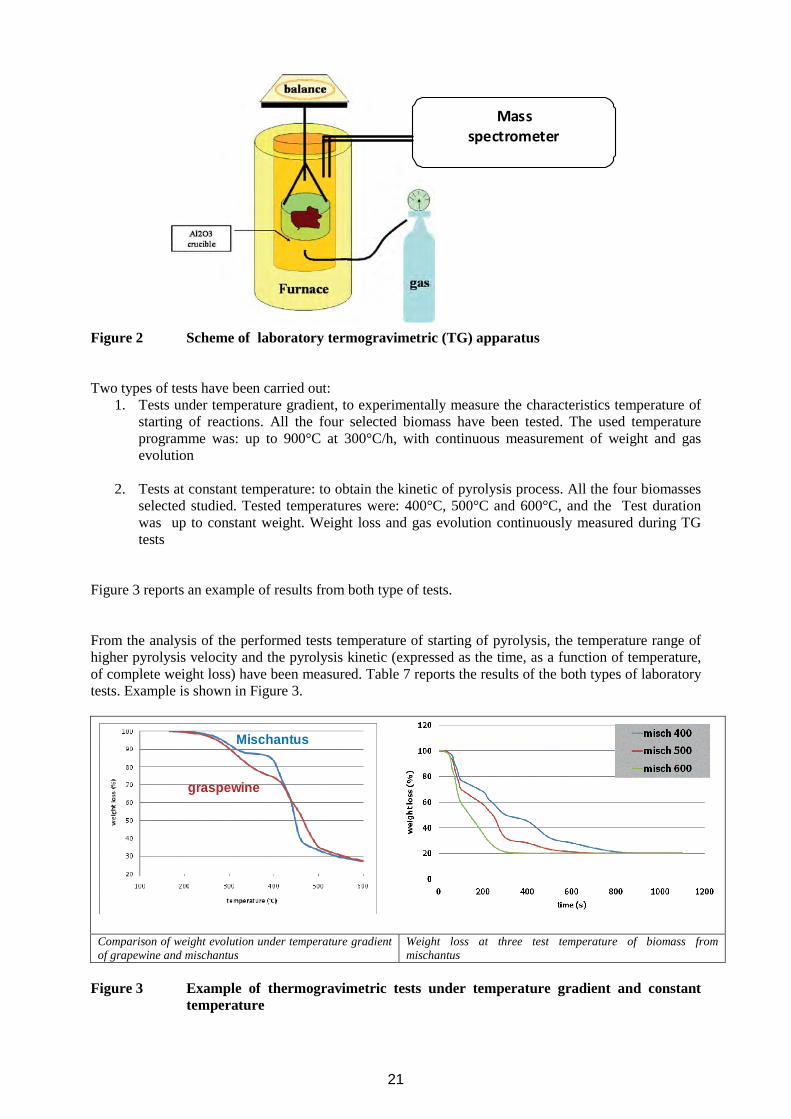
TG tests (CSM)Laboratory tests have been carried out using a termogravimetric apparatus (TG tests). Figure 2 reportsa scheme of the laboratory apparatus. It consists of a vertical electric furnace, with heating rate in therange 1-20 °C/min, able to work under controlled Ar atmosphere. Sample is placed inside an alluminacrucible of 20 cm3, which does not interact with sample or gaseous atmosphere during experimentaltest.Sample is hang up to a balance, connected to a PC to continuously record weight variations during thetest. The furnace is equipped also with a mass spectrometer to analyse gas composition evolution duringtest.
20
Massspectrometer
Figure 2 Scheme of laboratory termogravimetric (TG) apparatus
Two types of tests have been carried out:1. Tests under temperature gradient, to experimentally measure the characteristics temperature of
starting of reactions. All the four selected biomass have been tested. The used temperatureprogramme was: up to 900°C at 300°C/h, with continuous measurement of weight and gasevolution
2. Tests at constant temperature: to obtain the kinetic of pyrolysis process. All the four biomassesselected studied. Tested temperatures were: 400°C, 500°C and 600°C, and the Test durationwas up to constant weight. Weight loss and gas evolution continuously measured during TGtests
Figure 3 reports an example of results from both type of tests.
From the analysis of the performed tests temperature of starting of pyrolysis, the temperature range ofhigher pyrolysis velocity and the pyrolysis kinetic (expressed as the time, as a function of temperature,of complete weight loss) have been measured. Table 7 reports the results of the both types of laboratorytests. Example is shown in Figure 3.
Mischantus
graspewine
Comparison of weight evolution under temperature gradientof grapewine and mischantus
Weight loss at three test temperature of biomass frommischantus
Figure 3 Example of thermogravimetric tests under temperature gradient and constanttemperature
21
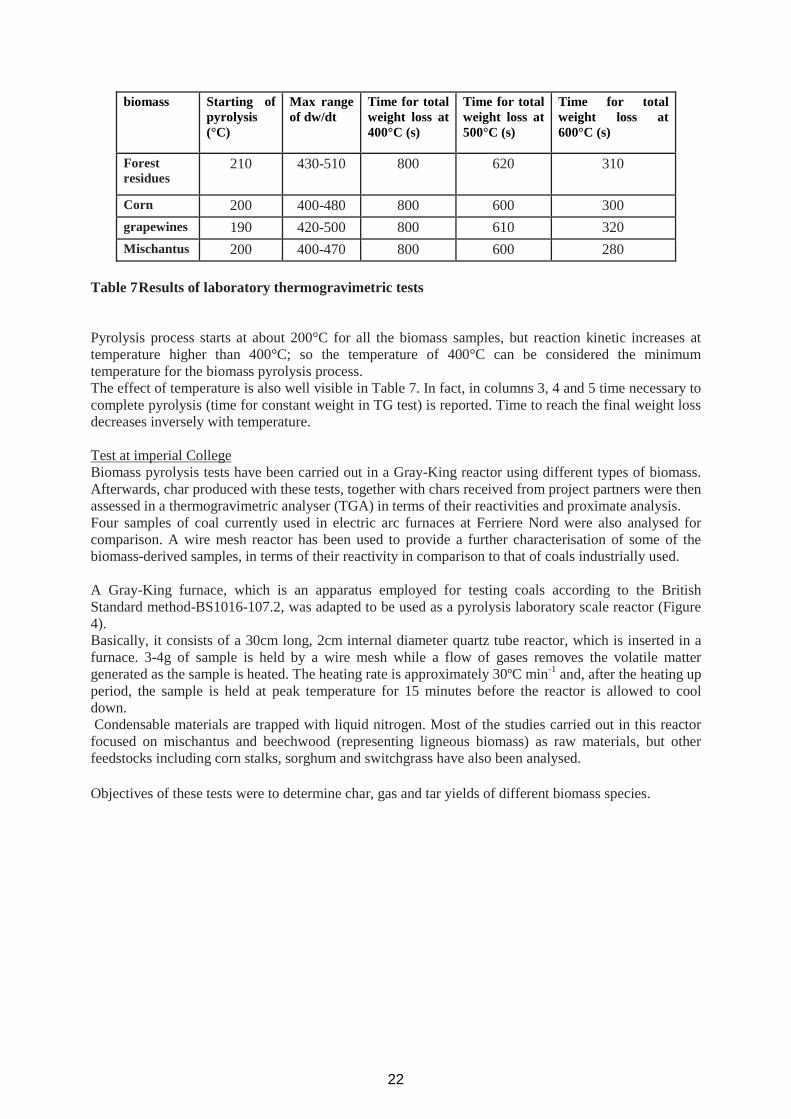
biomass Starting ofpyrolysis(°C)
Max rangeof dw/dt
Time for totalweight loss at400°C (s)
Time for totalweight loss at500°C (s)
Time for totalweight loss at600°C (s)
Forestresidues
210 430-510 800 620 310
Corn 200 400-480 800 600 300grapewines 190 420-500 800 610 320Mischantus 200 400-470 800 600 280
Table 7Results of laboratory thermogravimetric tests
Pyrolysis process starts at about 200°C for all the biomass samples, but reaction kinetic increases attemperature higher than 400°C; so the temperature of 400°C can be considered the minimumtemperature for the biomass pyrolysis process.The effect of temperature is also well visible in Table 7. In fact, in columns 3, 4 and 5 time necessary tocomplete pyrolysis (time for constant weight in TG test) is reported. Time to reach the final weight lossdecreases inversely with temperature.
Test at imperial CollegeBiomass pyrolysis tests have been carried out in a Gray-King reactor using different types of biomass.Afterwards, char produced with these tests, together with chars received from project partners were thenassessed in a thermogravimetric analyser (TGA) in terms of their reactivities and proximate analysis.Four samples of coal currently used in electric arc furnaces at Ferriere Nord were also analysed forcomparison. A wire mesh reactor has been used to provide a further characterisation of some of thebiomass-derived samples, in terms of their reactivity in comparison to that of coals industrially used.
A Gray-King furnace, which is an apparatus employed for testing coals according to the BritishStandard method-BS1016-107.2, was adapted to be used as a pyrolysis laboratory scale reactor (Figure4).Basically, it consists of a 30cm long, 2cm internal diameter quartz tube reactor, which is inserted in afurnace. 3-4g of sample is held by a wire mesh while a flow of gases removes the volatile mattergenerated as the sample is heated. The heating rate is approximately 30ºC min-1 and, after the heating upperiod, the sample is held at peak temperature for 15 minutes before the reactor is allowed to cooldown.Condensable materials are trapped with liquid nitrogen. Most of the studies carried out in this reactorfocused on mischantus and beechwood (representing ligneous biomass) as raw materials, but otherfeedstocks including corn stalks, sorghum and switchgrass have also been analysed.
Objectives of these tests were to determine char, gas and tar yields of different biomass species.
22

Figure 4 Pyrolysis reactor based on a Gray King Furnace
Beechwood (ligneous biomas) was used as feedstock in pyrolysis experiments to determine the relativeamounts of char, tar and gas recovered under different pyrolysis temperatures, ranging from 300 to900ºC. The char yield (Figure 5) was observed to decrease with temperature up to about 400ºC andremain stable afterwards.Tar and gas yields (not shown) also became stable after 400 ºC with values in the region of 50-60% and20-30% of the original biomass, respectively. These trends in char yields seem common to all differentkinds of biomass studied, including miscanthus (Figure 6) and corn stalk (CS), sorghum (SO) andswitchgrass (SW) (Figure 7).In all cases, char yields did not show much change with temperature above 400ºC and remained in theregion between 20-30%. It can be observed that as for the beechwood and miscanthus samplesdiscussed previously, the yield of char from these three biomass samples did not present significantvariations for temperatures above 500ºC. Variations in the particle size of the initial beechwood sampledid not significantly affect the yield of char in the three particle size ranges studied, 0.212-0.5 mm,0.85-1.7mm and 2.057-3.15mm, as shown in Figure 5.
Figure 5. Char yields (as percentage of the original biomass in dry ash free basis) in thepyrolysis of beechwood in a Gray-King reactor as a function of temperature forthree ranges of particle size.
23

Figure 6. Char, gas and tar yields as a percentage of the original biomass (dry basis) inpyrolysis of miscanthus (particle size range: 0.212-0.5 mm) in a Gray-King reactoras a function of temperature.
0%10%
20%30%
40%50%60%
70%80%
90%100%
100 200 300 400 500 600 700
CS- CHARdbSO- CHARdbSW- CHARdb
Figure 7. Char yield as a percentage of the original biomass (dry basis) as a function oftemperature (°C) in experiments conducted in the Gray-King reactor. Threebiomass samples were used: Corn Stalk (CS), Sorghum (SO) and Switchgrass(SW).
Char yields were observed to drop with temperature up to 500°C, after which the variations withincreasing temperature were minor. Yields have been found to be similar across the range of biomassstudied for equivalent pyrolysis conditions, which is promising in terms of flexibility of feedstock tosupply electric arc furnaces. Particle size did not have a major effect on char yields for the range ofparticle sizes studied. The pyrolysis operating conditions had a strong effect on char reactivity and thevolatile content of the chars. Reactivities similar to those of coals currently employed in electric arcfurnaces have been found.
Temperature (°C)
24
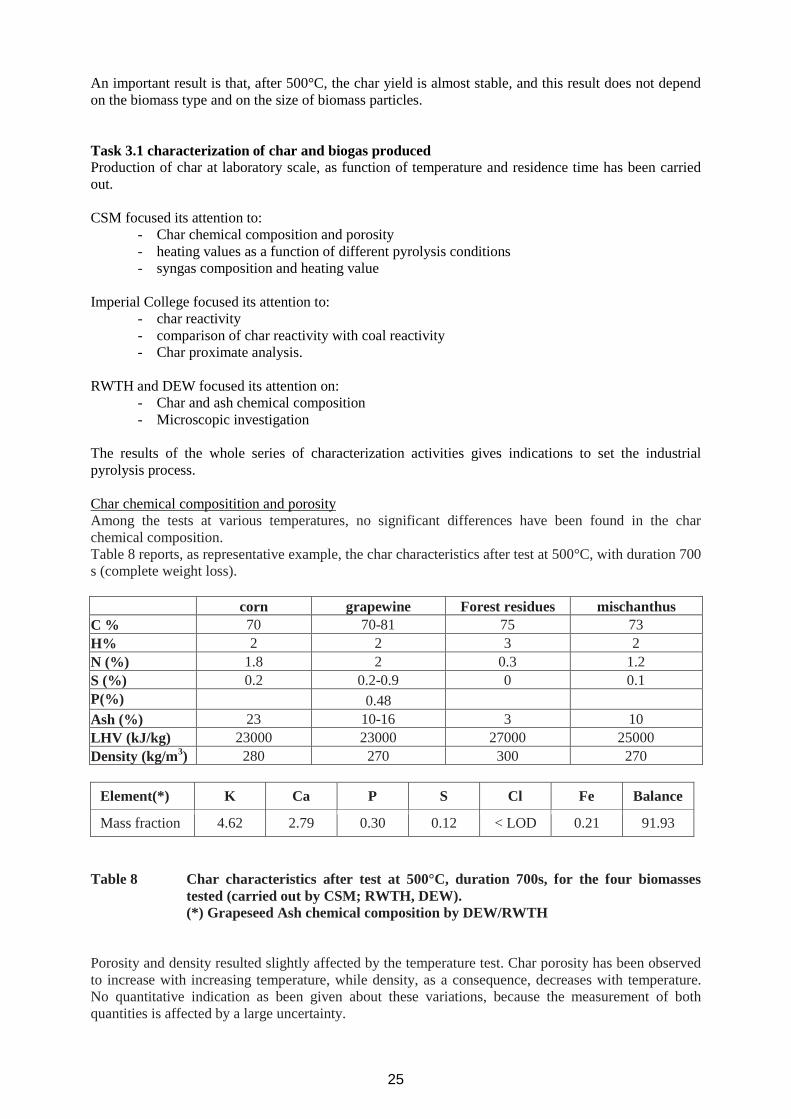
An important result is that, after 500°C, the char yield is almost stable, and this result does not dependon the biomass type and on the size of biomass particles.
Task 3.1 characterization of char and biogas producedProduction of char at laboratory scale, as function of temperature and residence time has been carriedout.
CSM focused its attention to:- Char chemical composition and porosity- heating values as a function of different pyrolysis conditions- syngas composition and heating value
Imperial College focused its attention to:- char reactivity- comparison of char reactivity with coal reactivity- Char proximate analysis.
RWTH and DEW focused its attention on:- Char and ash chemical composition- Microscopic investigation
The results of the whole series of characterization activities gives indications to set the industrialpyrolysis process.
Char chemical compositition and porosityAmong the tests at various temperatures, no significant differences have been found in the charchemical composition.Table 8 reports, as representative example, the char characteristics after test at 500°C, with duration 700s (complete weight loss).
corn grapewine Forest residues mischanthusC % 70 70-81 75 73H% 2 2 3 2N (%) 1.8 2 0.3 1.2S (%) 0.2 0.2-0.9 0 0.1P(%) 0.48Ash (%) 23 10-16 3 10LHV (kJ/kg) 23000 23000 27000 25000Density (kg/m3) 280 270 300 270
Element(*) K Ca P S Cl Fe Balance
Mass fraction 4.62 2.79 0.30 0.12 < LOD 0.21 91.93
Table 8 Char characteristics after test at 500°C, duration 700s, for the four biomassestested (carried out by CSM; RWTH, DEW).(*) Grapeseed Ash chemical composition by DEW/RWTH
Porosity and density resulted slightly affected by the temperature test. Char porosity has been observedto increase with increasing temperature, while density, as a consequence, decreases with temperature.No quantitative indication as been given about these variations, because the measurement of bothquantities is affected by a large uncertainty.
25
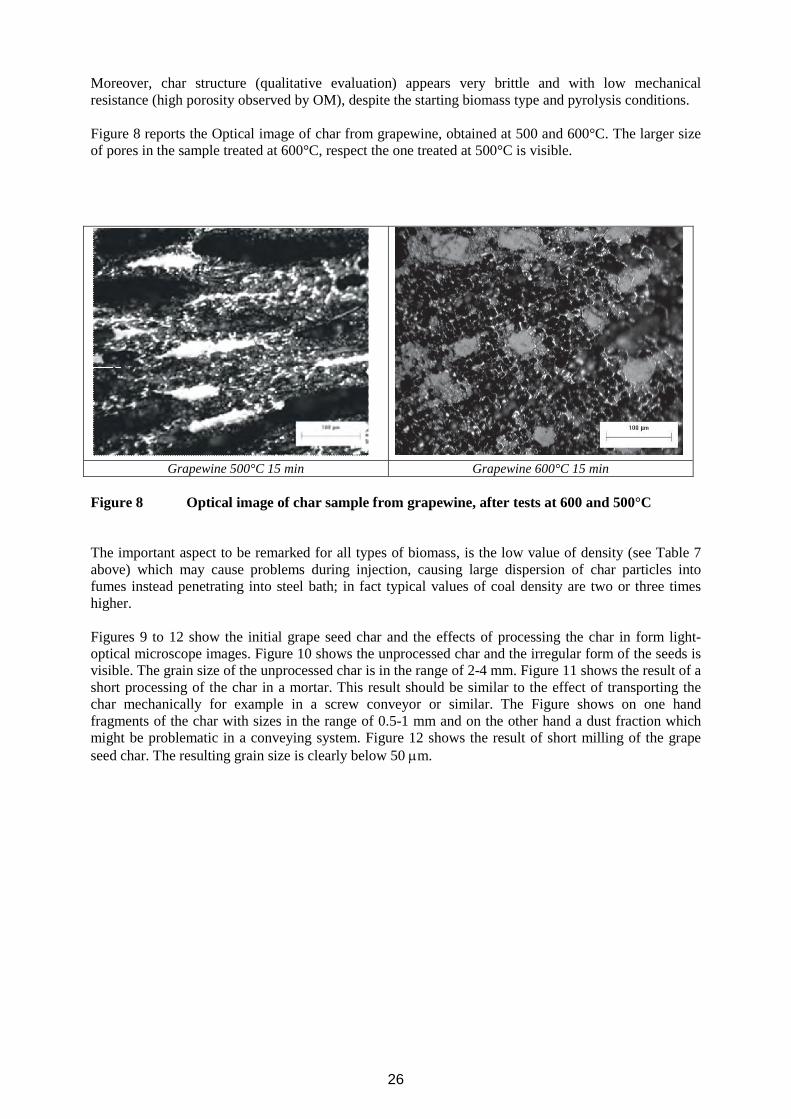
Moreover, char structure (qualitative evaluation) appears very brittle and with low mechanicalresistance (high porosity observed by OM), despite the starting biomass type and pyrolysis conditions.
Figure 8 reports the Optical image of char from grapewine, obtained at 500 and 600°C. The larger sizeof pores in the sample treated at 600°C, respect the one treated at 500°C is visible.
Grapewine 500°C 15 min Grapewine 600°C 15 min
Figure 8 Optical image of char sample from grapewine, after tests at 600 and 500°C
The important aspect to be remarked for all types of biomass, is the low value of density (see Table 7above) which may cause problems during injection, causing large dispersion of char particles intofumes instead penetrating into steel bath; in fact typical values of coal density are two or three timeshigher.
Figures 9 to 12 show the initial grape seed char and the effects of processing the char in form light-optical microscope images. Figure 10 shows the unprocessed char and the irregular form of the seeds isvisible. The grain size of the unprocessed char is in the range of 2-4 mm. Figure 11 shows the result of ashort processing of the char in a mortar. This result should be similar to the effect of transporting thechar mechanically for example in a screw conveyor or similar. The Figure shows on one handfragments of the char with sizes in the range of 0.5-1 mm and on the other hand a dust fraction whichmight be problematic in a conveying system. Figure 12 shows the result of short milling of the grapeseed char. The resulting grain size is clearly below 50 m.
26

Figure 9 Grain size distribution of char samples
Figure 10 Light-optical microscope image of unprocessed grape seed char (magnification20x)
27
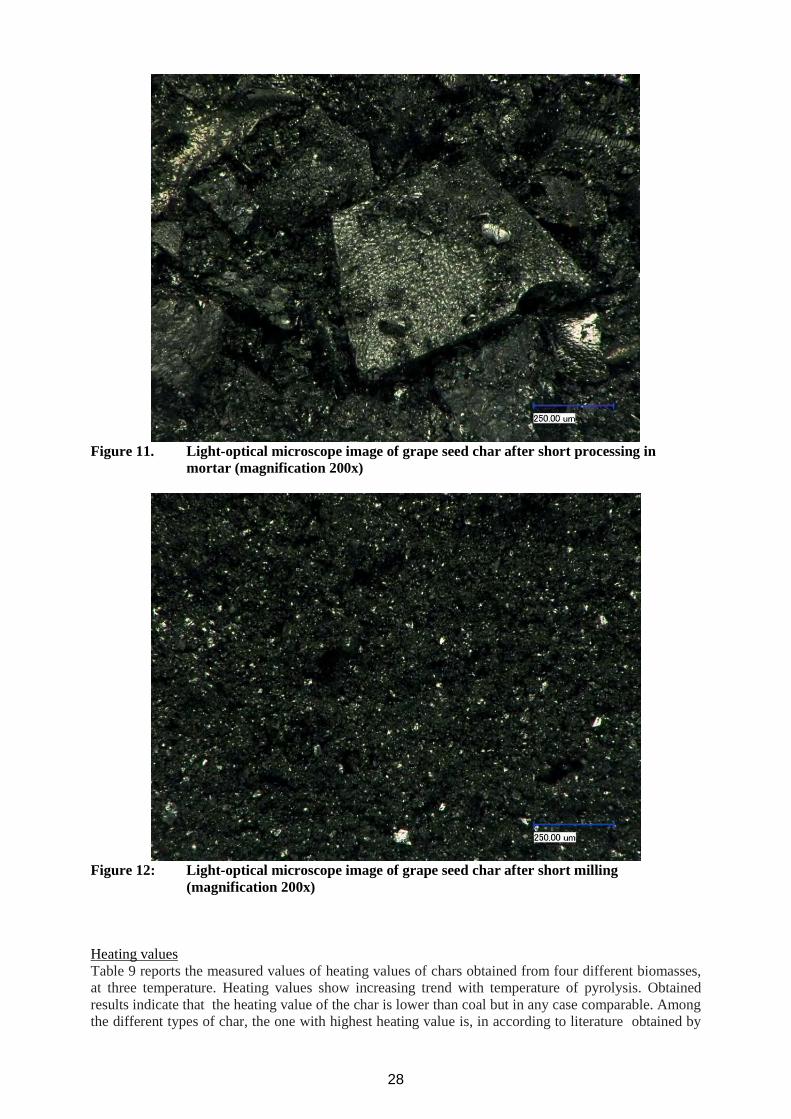
Figure 11. Light-optical microscope image of grape seed char after short processing inmortar (magnification 200x)
Figure 12: Light-optical microscope image of grape seed char after short milling(magnification 200x)
Heating valuesTable 9 reports the measured values of heating values of chars obtained from four different biomasses,at three temperature. Heating values show increasing trend with temperature of pyrolysis. Obtainedresults indicate that the heating value of the char is lower than coal but in any case comparable. Amongthe different types of char, the one with highest heating value is, in according to literature obtained by
28

ligneous biomass, even if (see WP 1), forest residues requires a relatively large energy expense forcollection and transportation.
LHV(kJ/kg)
Forestresidues corn grapewine Mischanthus
T=400°C 25000 23000 22000 25000T=500°C 27000 23000 23000 25000T=600°C 28000 25000 24000 26000
Table 9 Heating values of chars obtained from four different biomasses at threetemperatures
Syngas compositionGaseous evolution and composition has been measured in laboratory by mass spectrometer duringthermogravimetric (TG) tests. Details of TG tests are reported in previous paragraph. Tests undertemperature gradient have been used to characterise qualitatively the gas emission and to select asuitable number of gaseous species, to be measured quantitatively during isothermal tests. Tests arecarried out under flowing Ar atmosphere. Figure 13 reports an example of gas concentration measuredby mass spectrometer and Ar normalised.
Figure 13. Gas concentration measured by mass spectrometer and Ar normalised.
Table 10 reports the syngas composition, measured during mischantus pyrolysis. The syngas heatingvalue, reported in the Table, has been calculated by the heating values of the single species, multipliedthe molar ratio. The measurement of the gas evolution of the different considered biomass species didnot show significant differences in syngas composition and heating values.
29
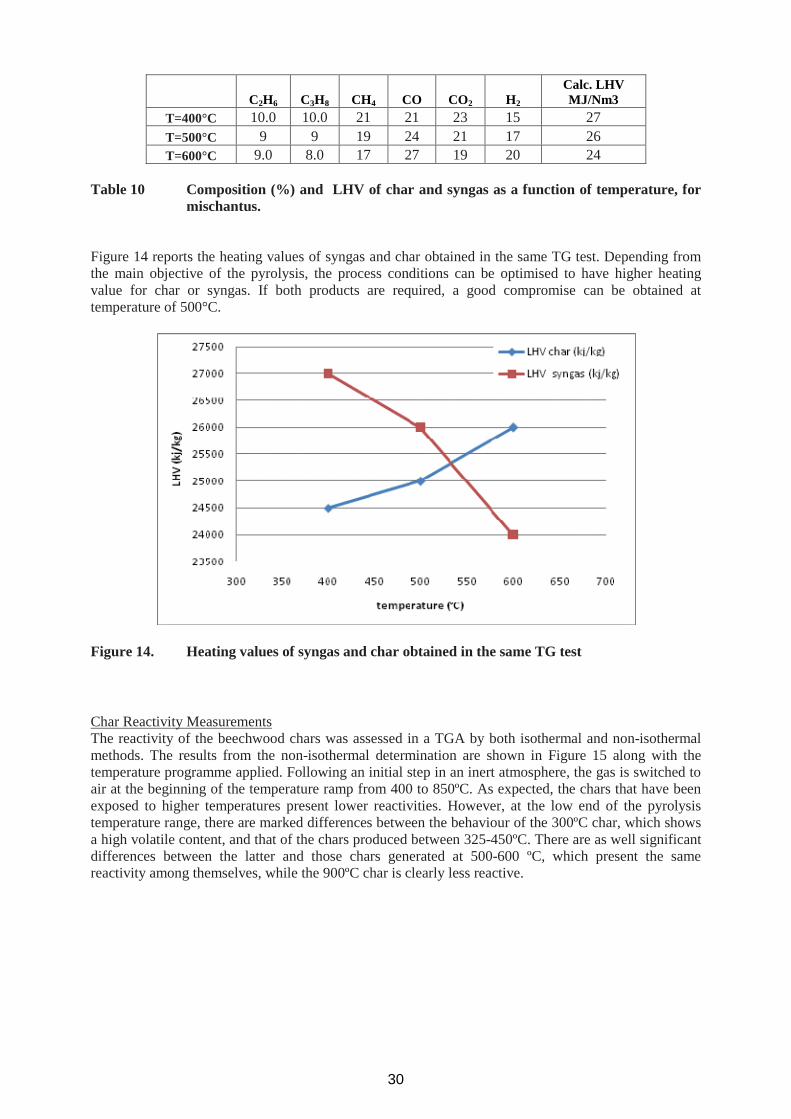
C2H6 C3H8 CH4 CO CO2 H2
Calc. LHVMJ/Nm3
T=400°C 10.0 10.0 21 21 23 15 27T=500°C 9 9 19 24 21 17 26T=600°C 9.0 8.0 17 27 19 20 24
Table 10 Composition (%) and LHV of char and syngas as a function of temperature, formischantus.
Figure 14 reports the heating values of syngas and char obtained in the same TG test. Depending fromthe main objective of the pyrolysis, the process conditions can be optimised to have higher heatingvalue for char or syngas. If both products are required, a good compromise can be obtained attemperature of 500°C.
Figure 14. Heating values of syngas and char obtained in the same TG test
Char Reactivity MeasurementsThe reactivity of the beechwood chars was assessed in a TGA by both isothermal and non-isothermalmethods. The results from the non-isothermal determination are shown in Figure 15 along with thetemperature programme applied. Following an initial step in an inert atmosphere, the gas is switched toair at the beginning of the temperature ramp from 400 to 850ºC. As expected, the chars that have beenexposed to higher temperatures present lower reactivities. However, at the low end of the pyrolysistemperature range, there are marked differences between the behaviour of the 300ºC char, which showsa high volatile content, and that of the chars produced between 325-450ºC. There are as well significantdifferences between the latter and those chars generated at 500-600 ºC, which present the samereactivity among themselves, while the 900ºC char is clearly less reactive.
30
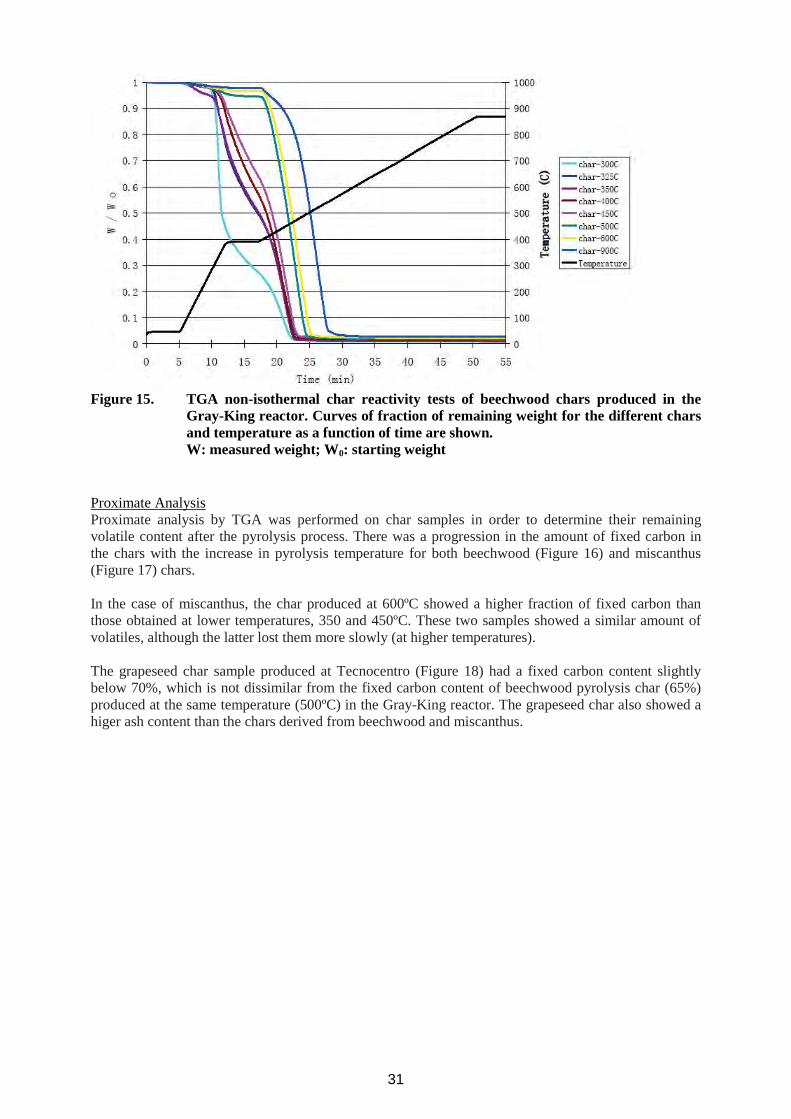
Figure 15. TGA non-isothermal char reactivity tests of beechwood chars produced in theGray-King reactor. Curves of fraction of remaining weight for the different charsand temperature as a function of time are shown.W: measured weight; W0: starting weight
Proximate AnalysisProximate analysis by TGA was performed on char samples in order to determine their remainingvolatile content after the pyrolysis process. There was a progression in the amount of fixed carbon inthe chars with the increase in pyrolysis temperature for both beechwood (Figure 16) and miscanthus(Figure 17) chars.
In the case of miscanthus, the char produced at 600ºC showed a higher fraction of fixed carbon thanthose obtained at lower temperatures, 350 and 450ºC. These two samples showed a similar amount ofvolatiles, although the latter lost them more slowly (at higher temperatures).
The grapeseed char sample produced at Tecnocentro (Figure 18) had a fixed carbon content slightlybelow 70%, which is not dissimilar from the fixed carbon content of beechwood pyrolysis char (65%)produced at the same temperature (500ºC) in the Gray-King reactor. The grapeseed char also showed ahiger ash content than the chars derived from beechwood and miscanthus.
31

Figure 16. TGA proximate analysis of raw beechwood and beechwood chars produced in theGray-King reactor. Curves of fraction of remaining weight of the different charsand temperature as a function of time are shown.
Figure 17. TGA proximate analysis of raw miscanthus and miscanthus chars produced in theGray-King reactor. Curves of fraction of remaining weight of the different charsand temperature as a function of time are shown.
32
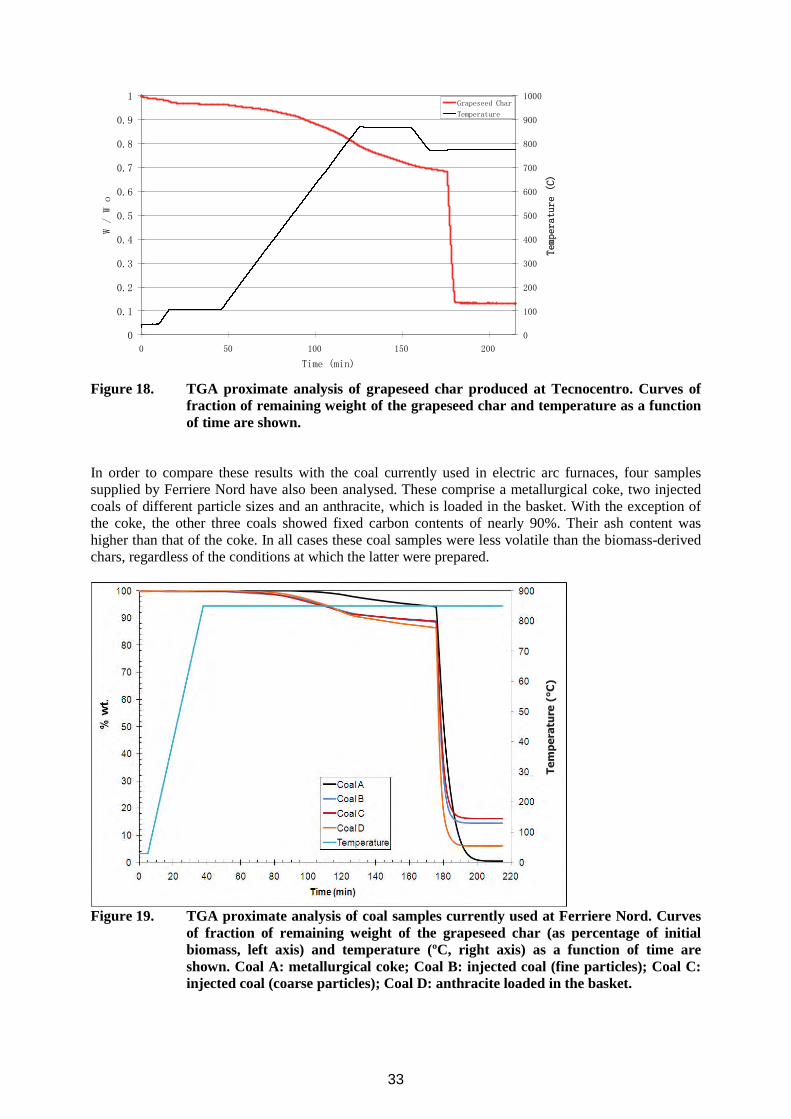
Figure 18. TGA proximate analysis of grapeseed char produced at Tecnocentro. Curves offraction of remaining weight of the grapeseed char and temperature as a functionof time are shown.
In order to compare these results with the coal currently used in electric arc furnaces, four samplessupplied by Ferriere Nord have also been analysed. These comprise a metallurgical coke, two injectedcoals of different particle sizes and an anthracite, which is loaded in the basket. With the exception ofthe coke, the other three coals showed fixed carbon contents of nearly 90%. Their ash content washigher than that of the coke. In all cases these coal samples were less volatile than the biomass-derivedchars, regardless of the conditions at which the latter were prepared.
Figure 19. TGA proximate analysis of coal samples currently used at Ferriere Nord. Curvesof fraction of remaining weight of the grapeseed char (as percentage of initialbiomass, left axis) and temperature (ºC, right axis) as a function of time areshown. Coal A: metallurgical coke; Coal B: injected coal (fine particles); Coal C:injected coal (coarse particles); Coal D: anthracite loaded in the basket.
Temperature(°C)
33
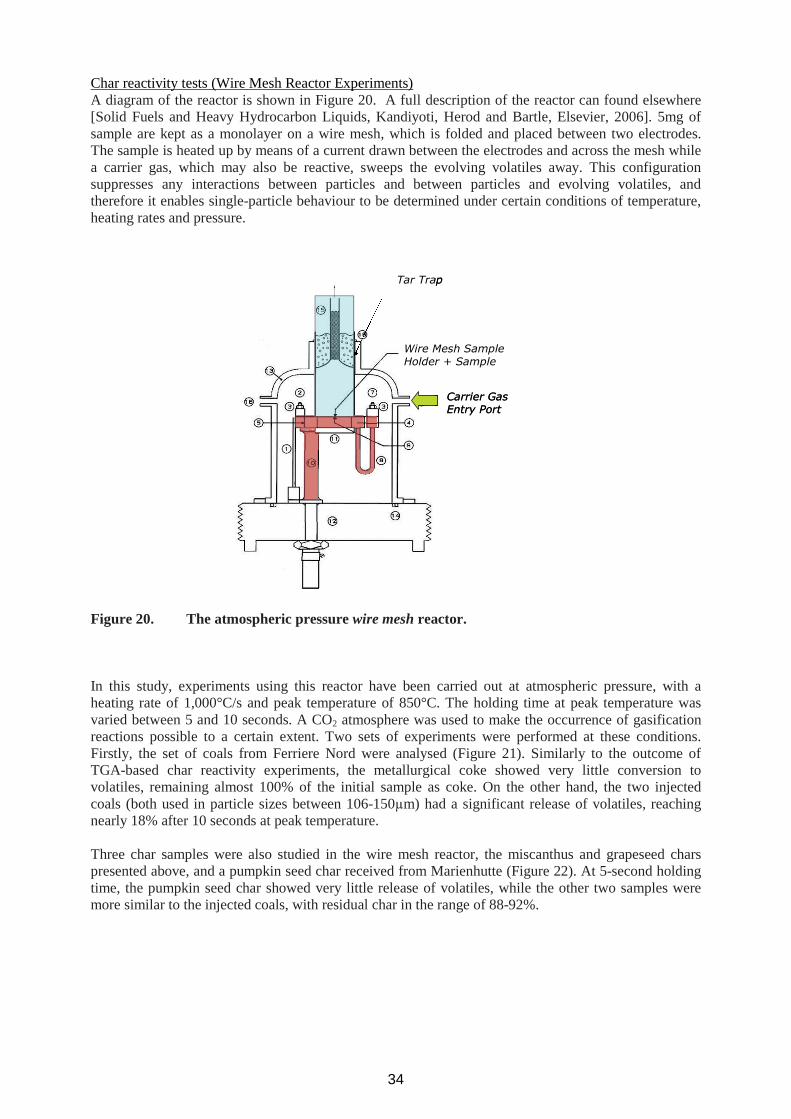
Char reactivity tests (Wire Mesh Reactor Experiments)A diagram of the reactor is shown in Figure 20. A full description of the reactor can found elsewhere[Solid Fuels and Heavy Hydrocarbon Liquids, Kandiyoti, Herod and Bartle, Elsevier, 2006]. 5mg ofsample are kept as a monolayer on a wire mesh, which is folded and placed between two electrodes.The sample is heated up by means of a current drawn between the electrodes and across the mesh whilea carrier gas, which may also be reactive, sweeps the evolving volatiles away. This configurationsuppresses any interactions between particles and between particles and evolving volatiles, andtherefore it enables single-particle behaviour to be determined under certain conditions of temperature,heating rates and pressure.
Figure 20. The atmospheric pressure wire mesh reactor.
In this study, experiments using this reactor have been carried out at atmospheric pressure, with aheating rate of 1,000°C/s and peak temperature of 850°C. The holding time at peak temperature wasvaried between 5 and 10 seconds. A CO2 atmosphere was used to make the occurrence of gasificationreactions possible to a certain extent. Two sets of experiments were performed at these conditions.Firstly, the set of coals from Ferriere Nord were analysed (Figure 21). Similarly to the outcome ofTGA-based char reactivity experiments, the metallurgical coke showed very little conversion tovolatiles, remaining almost 100% of the initial sample as coke. On the other hand, the two injectedcoals (both used in particle sizes between 106-150μm) had a significant release of volatiles, reachingnearly 18% after 10 seconds at peak temperature.
Three char samples were also studied in the wire mesh reactor, the miscanthus and grapeseed charspresented above, and a pumpkin seed char received from Marienhutte (Figure 22). At 5-second holdingtime, the pumpkin seed char showed very little release of volatiles, while the other two samples weremore similar to the injected coals, with residual char in the range of 88-92%.
Wire Mesh SampleHolder + Sample
Tar Trap
Carrier GasEntry Port
Wire Mesh SampleHolder + Sample
Tar Trap
Carrier GasEntry Port
34
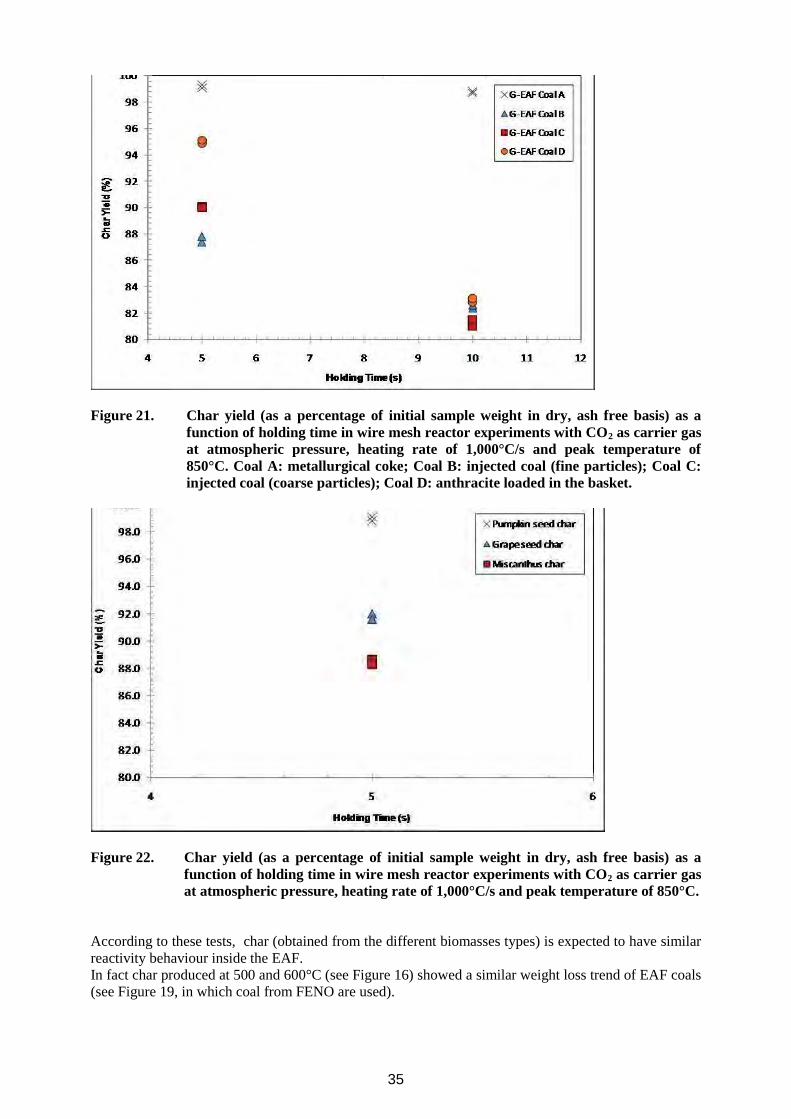
Figure 21. Char yield (as a percentage of initial sample weight in dry, ash free basis) as afunction of holding time in wire mesh reactor experiments with CO2 as carrier gasat atmospheric pressure, heating rate of 1,000°C/s and peak temperature of850°C. Coal A: metallurgical coke; Coal B: injected coal (fine particles); Coal C:injected coal (coarse particles); Coal D: anthracite loaded in the basket.
Figure 22. Char yield (as a percentage of initial sample weight in dry, ash free basis) as afunction of holding time in wire mesh reactor experiments with CO2 as carrier gasat atmospheric pressure, heating rate of 1,000°C/s and peak temperature of 850°C.
According to these tests, char (obtained from the different biomasses types) is expected to have similarreactivity behaviour inside the EAF.In fact char produced at 500 and 600°C (see Figure 16) showed a similar weight loss trend of EAF coals(see Figure 19, in which coal from FENO are used).
35
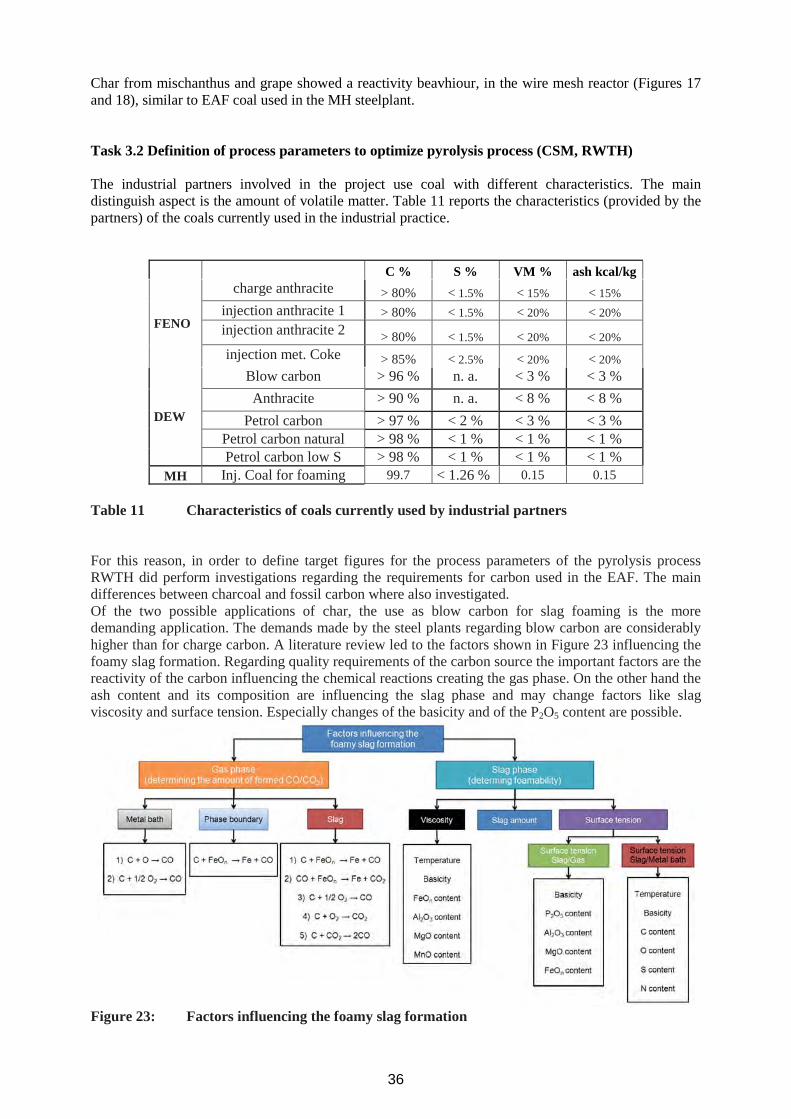
Char from mischanthus and grape showed a reactivity beavhiour, in the wire mesh reactor (Figures 17and 18), similar to EAF coal used in the MH steelplant.
Task 3.2 Definition of process parameters to optimize pyrolysis process (CSM, RWTH)
The industrial partners involved in the project use coal with different characteristics. The maindistinguish aspect is the amount of volatile matter. Table 11 reports the characteristics (provided by thepartners) of the coals currently used in the industrial practice.
C % S % VM % ash kcal/kg
FENO
charge anthracite > 80% < 1.5% < 15% < 15%injection anthracite 1 > 80% < 1.5% < 20% < 20%injection anthracite 2 > 80% < 1.5% < 20% < 20%injection met. Coke > 85% < 2.5% < 20% < 20%
DEW
Blow carbon > 96 % n. a. < 3 % < 3 %Anthracite > 90 % n. a. < 8 % < 8 %
Petrol carbon > 97 % < 2 % < 3 % < 3 %Petrol carbon natural > 98 % < 1 % < 1 % < 1 %Petrol carbon low S > 98 % < 1 % < 1 % < 1 %
MH Inj. Coal for foaming 99.7 < 1.26 % 0.15 0.15
Table 11 Characteristics of coals currently used by industrial partners
For this reason, in order to define target figures for the process parameters of the pyrolysis processRWTH did perform investigations regarding the requirements for carbon used in the EAF. The maindifferences between charcoal and fossil carbon where also investigated.Of the two possible applications of char, the use as blow carbon for slag foaming is the moredemanding application. The demands made by the steel plants regarding blow carbon are considerablyhigher than for charge carbon. A literature review led to the factors shown in Figure 23 influencing thefoamy slag formation. Regarding quality requirements of the carbon source the important factors are thereactivity of the carbon influencing the chemical reactions creating the gas phase. On the other hand theash content and its composition are influencing the slag phase and may change factors like slagviscosity and surface tension. Especially changes of the basicity and of the P2O5 content are possible.
Figure 23: Factors influencing the foamy slag formation
36
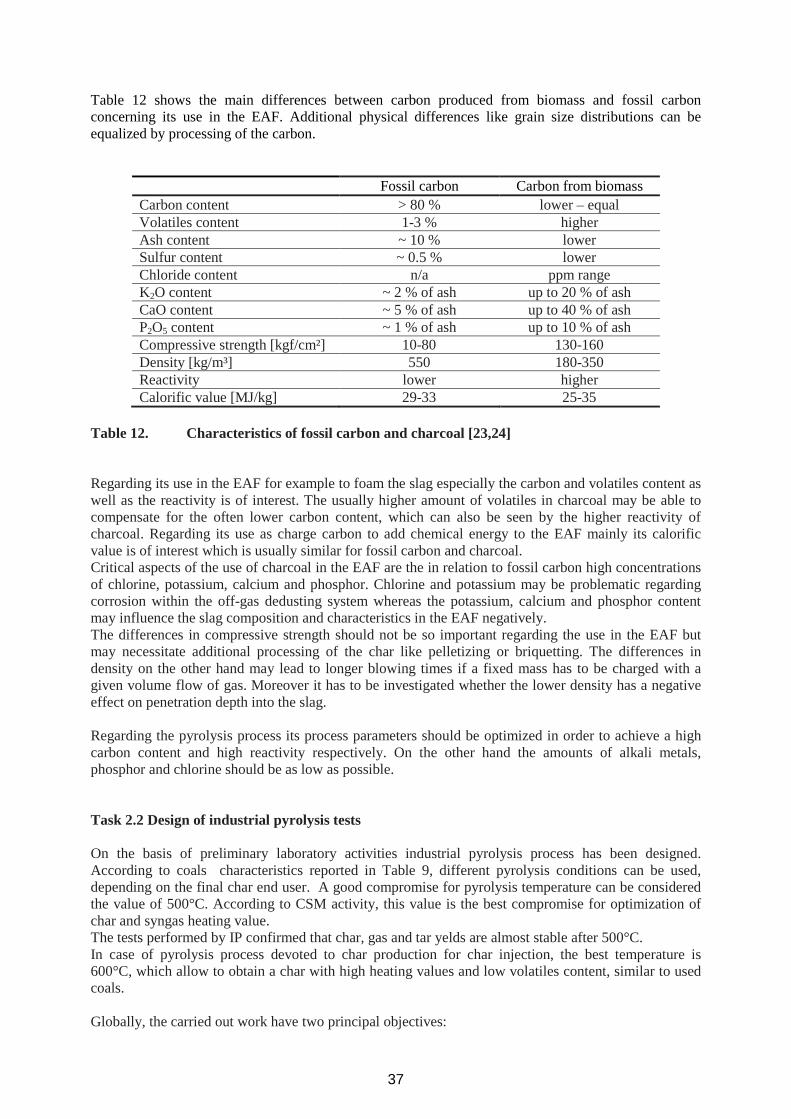
Table 12 shows the main differences between carbon produced from biomass and fossil carbonconcerning its use in the EAF. Additional physical differences like grain size distributions can beequalized by processing of the carbon.
Fossil carbon Carbon from biomassCarbon content > 80 % lower – equalVolatiles content 1-3 % higherAsh content ~ 10 % lowerSulfur content ~ 0.5 % lowerChloride content n/a ppm rangeK2O content ~ 2 % of ash up to 20 % of ashCaO content ~ 5 % of ash up to 40 % of ashP2O5 content ~ 1 % of ash up to 10 % of ashCompressive strength [kgf/cm²] 10-80 130-160Density [kg/m³] 550 180-350Reactivity lower higherCalorific value [MJ/kg] 29-33 25-35
Table 12. Characteristics of fossil carbon and charcoal [23,24]
Regarding its use in the EAF for example to foam the slag especially the carbon and volatiles content aswell as the reactivity is of interest. The usually higher amount of volatiles in charcoal may be able tocompensate for the often lower carbon content, which can also be seen by the higher reactivity ofcharcoal. Regarding its use as charge carbon to add chemical energy to the EAF mainly its calorificvalue is of interest which is usually similar for fossil carbon and charcoal.Critical aspects of the use of charcoal in the EAF are the in relation to fossil carbon high concentrationsof chlorine, potassium, calcium and phosphor. Chlorine and potassium may be problematic regardingcorrosion within the off-gas dedusting system whereas the potassium, calcium and phosphor contentmay influence the slag composition and characteristics in the EAF negatively.The differences in compressive strength should not be so important regarding the use in the EAF butmay necessitate additional processing of the char like pelletizing or briquetting. The differences indensity on the other hand may lead to longer blowing times if a fixed mass has to be charged with agiven volume flow of gas. Moreover it has to be investigated whether the lower density has a negativeeffect on penetration depth into the slag.
Regarding the pyrolysis process its process parameters should be optimized in order to achieve a highcarbon content and high reactivity respectively. On the other hand the amounts of alkali metals,phosphor and chlorine should be as low as possible.
Task 2.2 Design of industrial pyrolysis tests
On the basis of preliminary laboratory activities industrial pyrolysis process has been designed.According to coals characteristics reported in Table 9, different pyrolysis conditions can be used,depending on the final char end user. A good compromise for pyrolysis temperature can be consideredthe value of 500°C. According to CSM activity, this value is the best compromise for optimization ofchar and syngas heating value.The tests performed by IP confirmed that char, gas and tar yelds are almost stable after 500°C.In case of pyrolysis process devoted to char production for char injection, the best temperature is600°C, which allow to obtain a char with high heating values and low volatiles content, similar to usedcoals.
Globally, the carried out work have two principal objectives:
37

To study the range of variability of the pyrolysis process parameters and how these variationsaffect yelds and properties of products. The effect of different feedstocks on the process is alsoevaluated.Secondly, it is to understand how this range of control of pyrolysis may affect the overallenergy and carbon balance of pyrolysis char and pyrogas systems, and so affect their industrialutilization.
Pyrolysis campaigns have been planned and implemented on laboratory and demonstrative scale thatcould reproduce, with different limits, but with the advantages of small-scale tests, the transformationprocess of the fuel gas, char and tar on industrial plant, taking into account the results obtained by thepartners in the previous WPs.
Pyrolysis is thermochemical transformations which depend on thermodynamic parameters andoperating conditions that determine the characteristics of final products; those parameters influence thechoice of the industrial components plant. Three fractions are simultaneously present at the end of thepyrolysis process (char, tar and syngas) and the amount and characteristics can be varied, changing theprocess parameters governing the reactions of cracking, such as:
1. the temperature profile of the pyrolysis reactor;2. the rate of heating of the material;3. the residence time of material in the reactor;4. the size of the pyrolyzed material;
Points (1), (2), and (3) are deeply investigated and results are shown below; point (4) has been largelyinvestigated by Imperial college, which found out that, in slow pyrolysis the grain size of startingmaterials is not an influencing parameter.
Before making pyrolysis on demonstrative pyrolysis plant (named Enerpol) in Terni, a test system forsmall-scale has been set up to increase knowledge about the process of pyrolysis of different kind ofmaterials and characterize the intermediate and final products of the pyrolysis process by simulating theoperating conditions at laboratory scale. Figure 24 shows the laboratory scale pyrolysis apparatus.
Figure 24 Scheme of the demonstrative plant used by Tecnocentro to design industrialpyrolysis tests
This demonstrative apparatus represent the link of the laboratory apparatus (used by CSM and ImperialCollege) and pilot plant which has been used for definite assessment, and industrial plant, which is usedfor industrial char production
Legend:
A = Nitrogen;B = Manual valves;C = Pyrolyzer;D = Electric furnace;E = Tar collection filter;F = Dehumidifiers;G = Flowmeter;H = Pump;I = Gas bag;L = Thermocouple
38
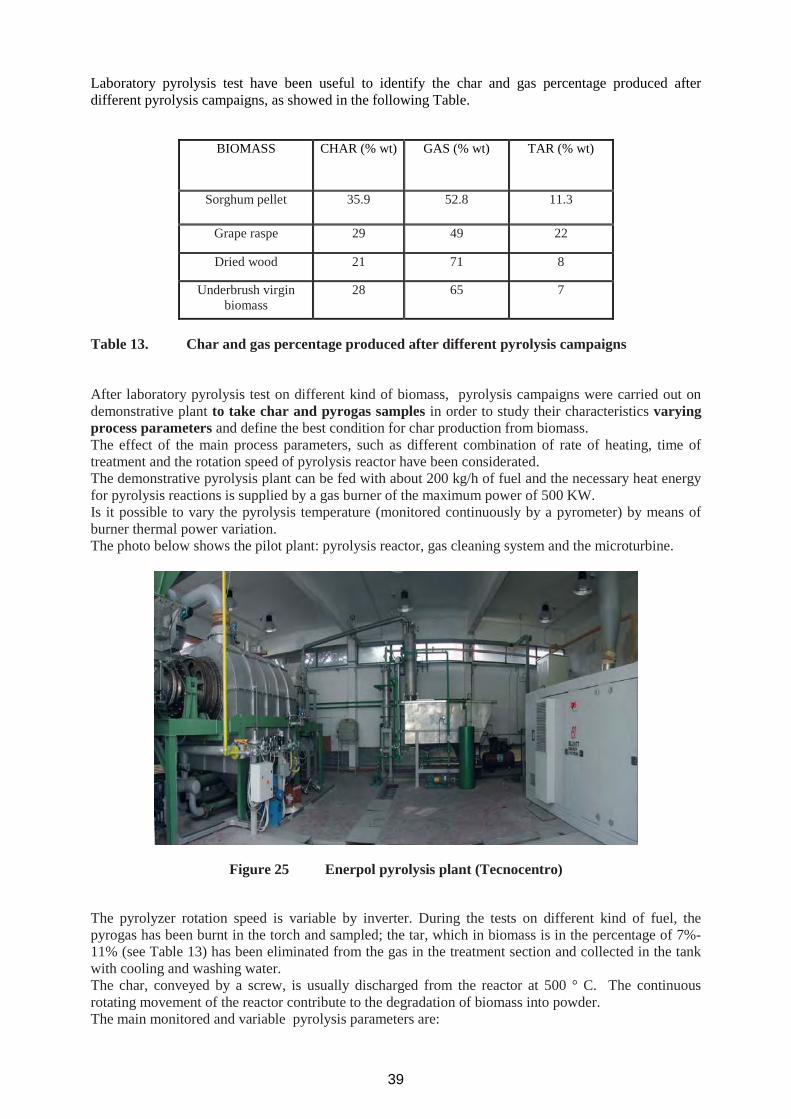
Laboratory pyrolysis test have been useful to identify the char and gas percentage produced afterdifferent pyrolysis campaigns, as showed in the following Table.
BIOMASS CHAR (% wt) GAS (% wt) TAR (% wt)
Sorghum pellet 35.9 52.8 11.3
Grape raspe 29 49 22
Dried wood 21 71 8
Underbrush virginbiomass
28 65 7
Table 13. Char and gas percentage produced after different pyrolysis campaigns
After laboratory pyrolysis test on different kind of biomass, pyrolysis campaigns were carried out ondemonstrative plant to take char and pyrogas samples in order to study their characteristics varyingprocess parameters and define the best condition for char production from biomass.The effect of the main process parameters, such as different combination of rate of heating, time oftreatment and the rotation speed of pyrolysis reactor have been considerated.The demonstrative pyrolysis plant can be fed with about 200 kg/h of fuel and the necessary heat energyfor pyrolysis reactions is supplied by a gas burner of the maximum power of 500 KW.Is it possible to vary the pyrolysis temperature (monitored continuously by a pyrometer) by means ofburner thermal power variation.The photo below shows the pilot plant: pyrolysis reactor, gas cleaning system and the microturbine.
Figure 25 Enerpol pyrolysis plant (Tecnocentro)
The pyrolyzer rotation speed is variable by inverter. During the tests on different kind of fuel, thepyrogas has been burnt in the torch and sampled; the tar, which in biomass is in the percentage of 7%-11% (see Table 13) has been eliminated from the gas in the treatment section and collected in the tankwith cooling and washing water.The char, conveyed by a screw, is usually discharged from the reactor at 500 ° C. The continuousrotating movement of the reactor contribute to the degradation of biomass into powder.The main monitored and variable pyrolysis parameters are:
39
Pyrolysis temperature (optical pyrometer);Gas temperature out from the reactor;Gas pressure out from the reactor;Internal reactor pressure;Rotation speed of the reactor (residence time);Feeding speed varying the rate of the feeding metering screw;Chemical and physical properties of the feeding fuel;Chemical - physical characteristics (density, elemental analysis, heavy metals), temperature andmass balances of char and gas obtained;
The main values of pyrolysis parameters during the tests have been:O2 content in the rotary kiln: 2-3 %;Internal reactor depression: -2/ -3 mmH2O;Biomass feeding to the reactor: 100 kg/h;Pyrolysis temperatures for the tests: 450°C, 550°C, 650°C;Residence time for different tests: 30, 40, 50 min
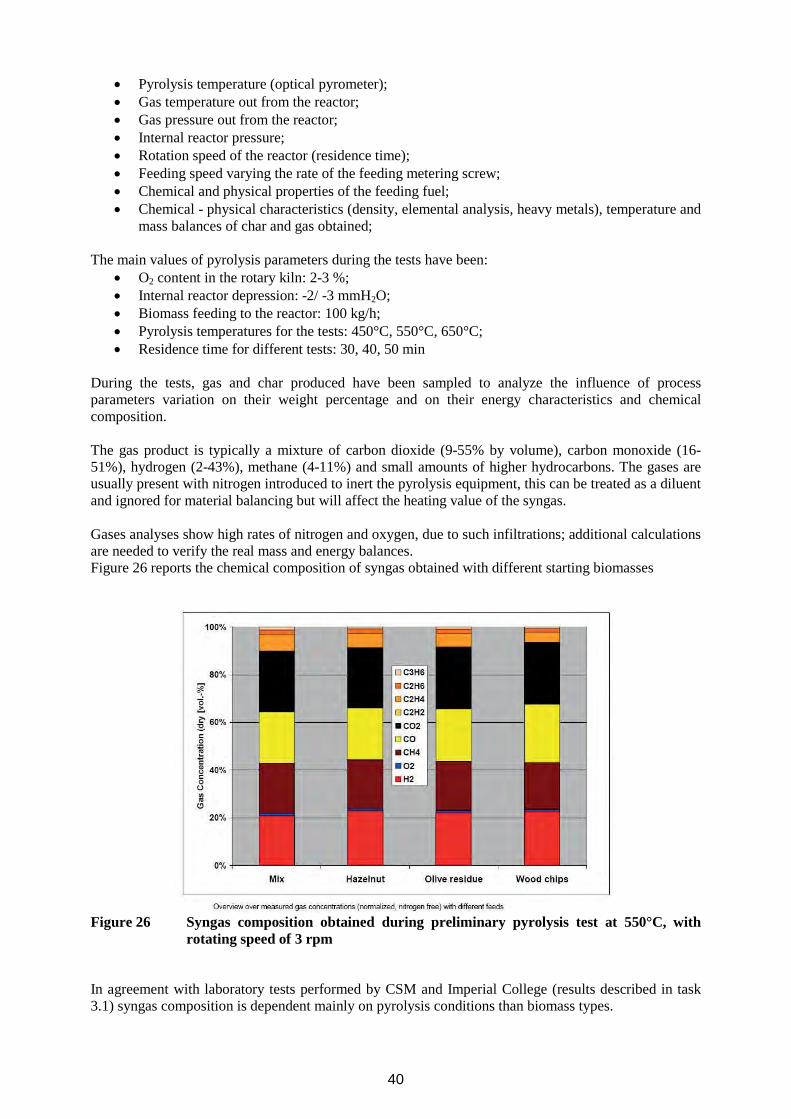
During the tests, gas and char produced have been sampled to analyze the influence of processparameters variation on their weight percentage and on their energy characteristics and chemicalcomposition.
The gas product is typically a mixture of carbon dioxide (9-55% by volume), carbon monoxide (16-51%), hydrogen (2-43%), methane (4-11%) and small amounts of higher hydrocarbons. The gases areusually present with nitrogen introduced to inert the pyrolysis equipment, this can be treated as a diluentand ignored for material balancing but will affect the heating value of the syngas.
Gases analyses show high rates of nitrogen and oxygen, due to such infiltrations; additional calculationsare needed to verify the real mass and energy balances.Figure 26 reports the chemical composition of syngas obtained with different starting biomasses
Figure 26 Syngas composition obtained during preliminary pyrolysis test at 550°C, withrotating speed of 3 rpm
In agreement with laboratory tests performed by CSM and Imperial College (results described in task3.1) syngas composition is dependent mainly on pyrolysis conditions than biomass types.
40
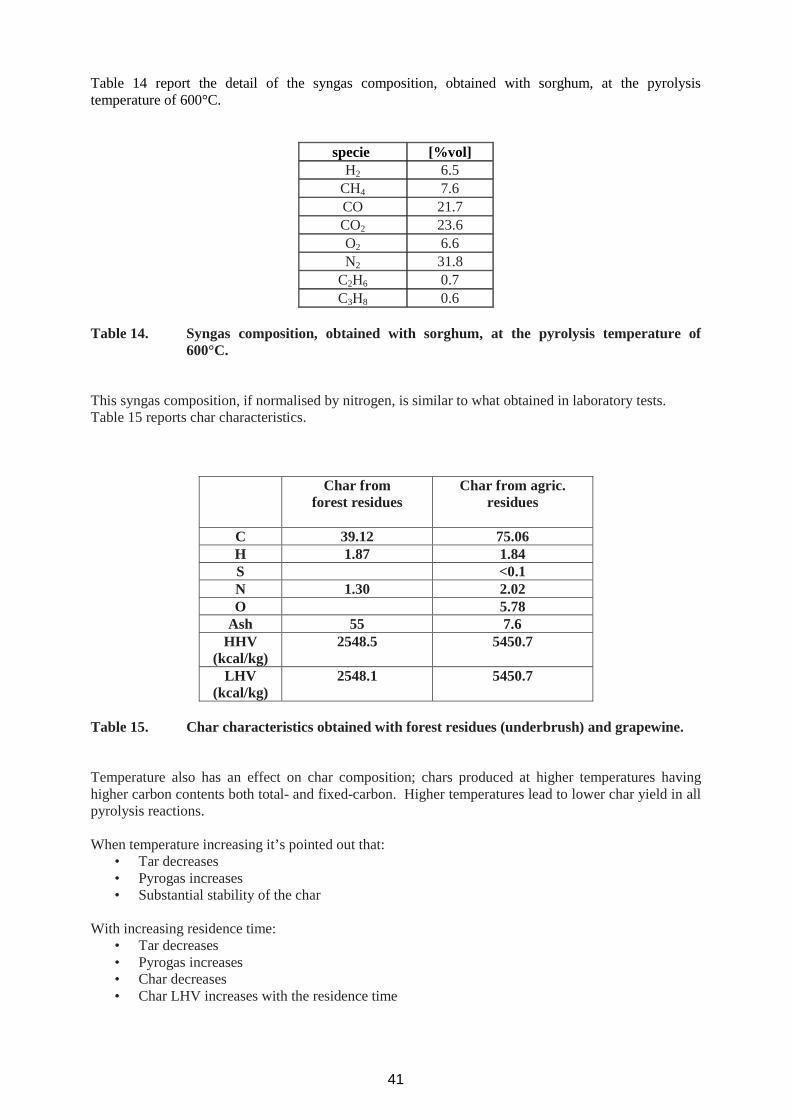
Table 14 report the detail of the syngas composition, obtained with sorghum, at the pyrolysistemperature of 600°C.
specie [%vol]H2 6.5
CH4 7.6CO 21.7CO2 23.6O2 6.6N2 31.8
C2H6 0.7C3H8 0.6
Table 14. Syngas composition, obtained with sorghum, at the pyrolysis temperature of600°C.
This syngas composition, if normalised by nitrogen, is similar to what obtained in laboratory tests.Table 15 reports char characteristics.
Char fromforest residues
Char from agric.residues
C 39.12 75.06H 1.87 1.84S <0.1N 1.30 2.02O 5.78
Ash 55 7.6HHV
(kcal/kg)2548.5 5450.7
LHV(kcal/kg)
2548.1 5450.7
Table 15. Char characteristics obtained with forest residues (underbrush) and grapewine.
Temperature also has an effect on char composition; chars produced at higher temperatures havinghigher carbon contents both total- and fixed-carbon. Higher temperatures lead to lower char yield in allpyrolysis reactions.
When temperature increasing it’s pointed out that:• Tar decreases• Pyrogas increases• Substantial stability of the char
With increasing residence time:• Tar decreases• Pyrogas increases• Char decreases• Char LHV increases with the residence time
41
Feedstock humidity control is a parameter of great importance for optimizing the efficiency of theprocess, because if the level increases, the heat necessary for pyrolysis of biomass is no longersufficient as used for evaporating the water in the fuel. For good process performances, fuel moisturecontents of 15-20% are typical. In all pyrolysis reactor, water is also a product and is usually collectedtogether with other condensable vapours in the liquid product.Chars formed under low flow, high pressure conditions with consequent higher char yields also havehigher fixed-carbon yields.As with the biomass feed, the char and liquid products have energy values roughly related to theircarbon contents.
For any given feedstock it is possible to vary the product distribution between char, liquid and gas,within limits, by choice of process type and operating conditions. Higher char yields are obtained byslow pyrolysis processes with lower temperatures and low flow rates; higher liquid yields arise fromfast pyrolysis processes, specific temperatures and high flow rates. The gas yield is not usually thefocus of slow or fast pyrolysis and is generally not actually measured but calculated by difference inmass balance.Similarly, for any given process and equipment set-up, different product distributions will arise fromdifferent feedstocks depending on their composition. However, this should not be a major factor inchoice of feedstock for pyrolysis, as controllable operating conditions, such as temperature, generallyhave a larger effect and could be changed to adjust product distributions. Choice of feedstock is morelikely to be dependent on factors such as availability, cost and sustainability considerations. Variation inbiomass feedstock, even if nominally a single source, is likely to be one of the main causes ofvariability. The exact composition of a type of biomass will vary depending on many factors relating towhen, where and how it was grown, for instance the weather, soil type and agricultural regime.
Figures for carbon contents in nominally the same type of biomass may differ by as much as 10%relative. The composition of a single supply of a particular biomass type should be more consistent butis not likely to be truly homogenous, except at small scale, unless special provisions for mixing andblending are made. Feedstock moisture content and particle size may vary within and between loadsand affect process yields.
Temperature control is also likely to be an important cause of variability, particularly for slowpyrolysis. The lower heat fluxes and longer residence times of slow pyrolysis give scope for variation inheating rate and peak temperature. Yields from traditional charcoal kilns are known to be affected byweather conditions , due to the effect on temperature control and fuel-wood consumption.
As general conclusion, it can be stated that char yield is about 20% of weight of starting biomass, andthis value decreases with temperature; yield is almost constant at temperatures higher than 500°C.Pyrolysis at temperatures higher than 500°C and longer residence time are necessary to obtain charcoalwith low values of volatile matter (suitable for charging); pyrolysis temperatures lower than 500°Cpermit to obtain charcoal with higher volatile matter content, suitable for injection and foaming.Regarding the amount of char, tar and syngas obtained after pyrolysis process, values are reported inTable 13. Increases of temperature and residence time determines the reduction of Tar and increases ofsyngas amount.
WP4 DEFINITION OF THE EAF OPERATING PRACTICES (DEW, FENO, CSM, RWTH,MU, TECNOCENTRO, IP)
Task 4.1 EAF cycle Analysis (RWTH, Ferriere Nord, DEW and MH)
An analysis of the EAF cycle of the three steelmakers participating to the project has been carried out.The analysis was aimed at:
- collect data of amount of coal used- collect data about coal utilization (charge/injection)- modification of current operating practices of coal utilization
42
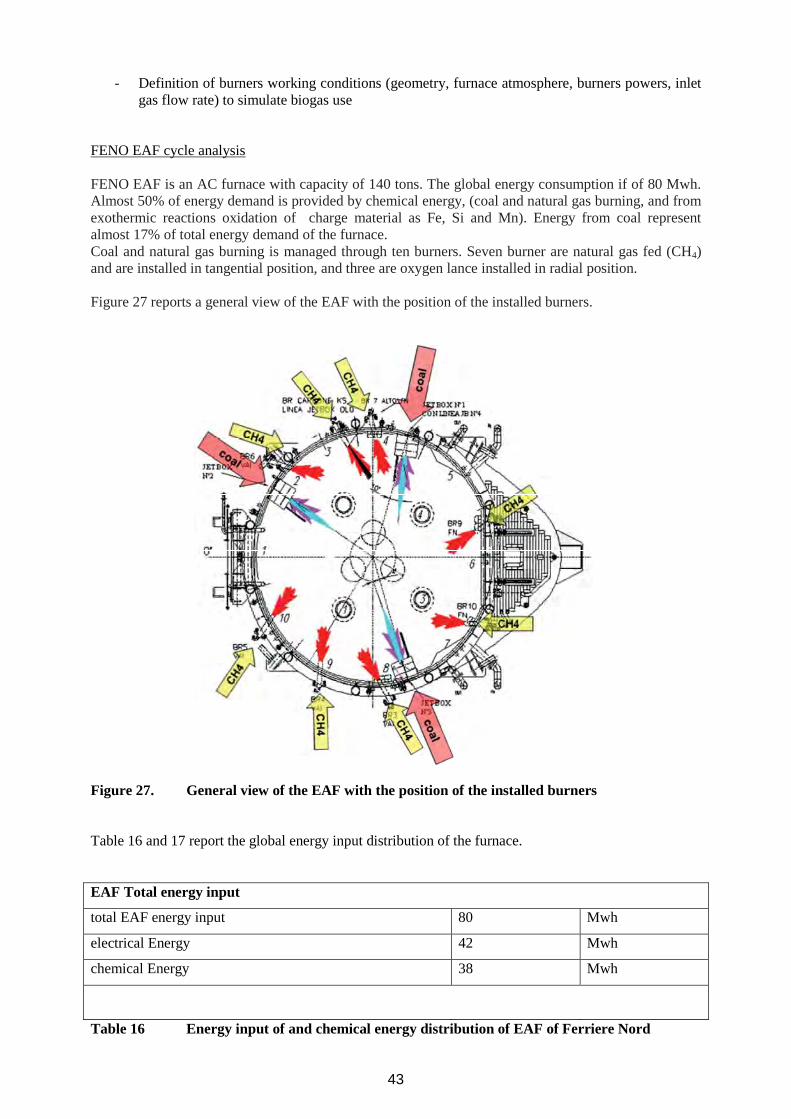
- Definition of burners working conditions (geometry, furnace atmosphere, burners powers, inletgas flow rate) to simulate biogas use
FENO EAF cycle analysis
FENO EAF is an AC furnace with capacity of 140 tons. The global energy consumption if of 80 Mwh.Almost 50% of energy demand is provided by chemical energy, (coal and natural gas burning, and fromexothermic reactions oxidation of charge material as Fe, Si and Mn). Energy from coal representalmost 17% of total energy demand of the furnace.Coal and natural gas burning is managed through ten burners. Seven burner are natural gas fed (CH4)and are installed in tangential position, and three are oxygen lance installed in radial position.
Figure 27 reports a general view of the EAF with the position of the installed burners.
Figure 27. General view of the EAF with the position of the installed burners
Table 16 and 17 report the global energy input distribution of the furnace.
EAF Total energy input
total EAF energy input 80 Mwh
electrical Energy 42 Mwh
chemical Energy 38 Mwh
Table 16 Energy input of and chemical energy distribution of EAF of Ferriere Nord
43
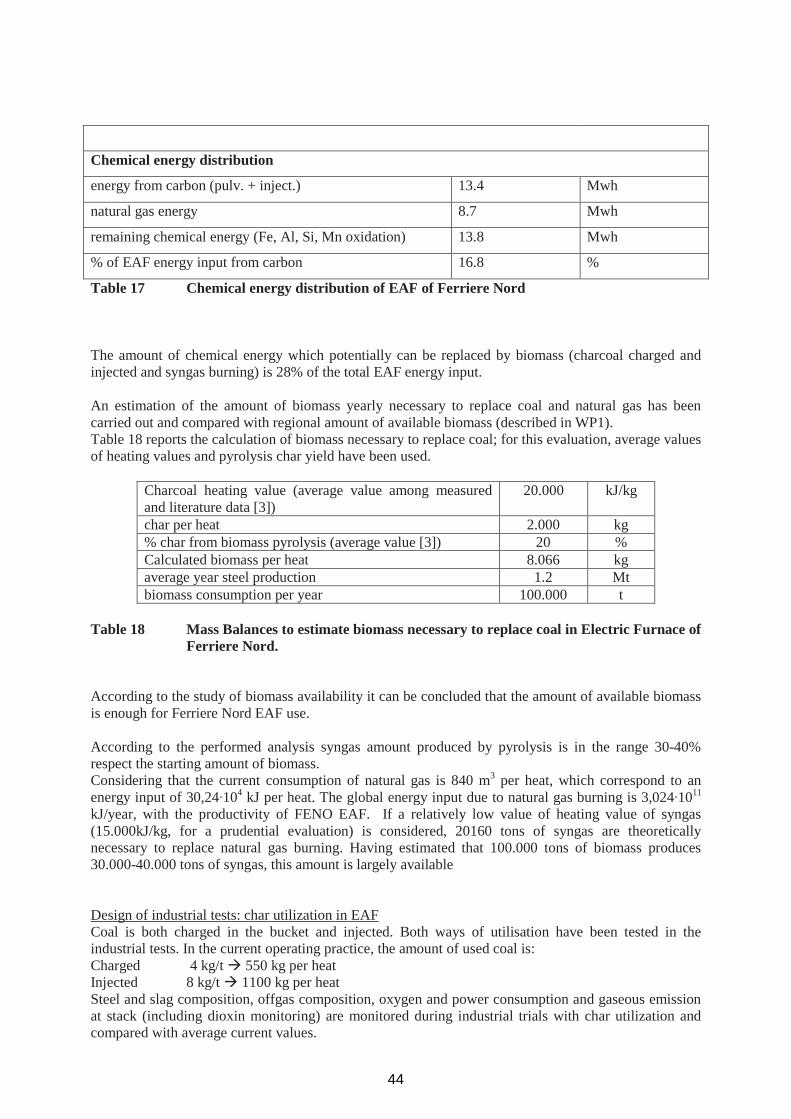
Chemical energy distribution
energy from carbon (pulv. + inject.) 13.4 Mwh
natural gas energy 8.7 Mwh
remaining chemical energy (Fe, Al, Si, Mn oxidation) 13.8 Mwh
% of EAF energy input from carbon 16.8 %
Table 17 Chemical energy distribution of EAF of Ferriere Nord
The amount of chemical energy which potentially can be replaced by biomass (charcoal charged andinjected and syngas burning) is 28% of the total EAF energy input.
An estimation of the amount of biomass yearly necessary to replace coal and natural gas has beencarried out and compared with regional amount of available biomass (described in WP1).Table 18 reports the calculation of biomass necessary to replace coal; for this evaluation, average valuesof heating values and pyrolysis char yield have been used.
Charcoal heating value (average value among measuredand literature data [3])
20.000 kJ/kg
char per heat 2.000 kg% char from biomass pyrolysis (average value [3]) 20 %Calculated biomass per heat 8.066 kgaverage year steel production 1.2 Mtbiomass consumption per year 100.000 t
Table 18 Mass Balances to estimate biomass necessary to replace coal in Electric Furnace ofFerriere Nord.
According to the study of biomass availability it can be concluded that the amount of available biomassis enough for Ferriere Nord EAF use.
According to the performed analysis syngas amount produced by pyrolysis is in the range 30-40%respect the starting amount of biomass.Considering that the current consumption of natural gas is 840 m3 per heat, which correspond to anenergy input of 30,24 104 kJ per heat. The global energy input due to natural gas burning is 3,024 1011
kJ/year, with the productivity of FENO EAF. If a relatively low value of heating value of syngas(15.000kJ/kg, for a prudential evaluation) is considered, 20160 tons of syngas are theoreticallynecessary to replace natural gas burning. Having estimated that 100.000 tons of biomass produces30.000-40.000 tons of syngas, this amount is largely available
Design of industrial tests: char utilization in EAFCoal is both charged in the bucket and injected. Both ways of utilisation have been tested in theindustrial tests. In the current operating practice, the amount of used coal is:Charged 4 kg/t 550 kg per heatInjected 8 kg/t 1100 kg per heatSteel and slag composition, offgas composition, oxygen and power consumption and gaseous emissionat stack (including dioxin monitoring) are monitored during industrial trials with char utilization andcompared with average current values.
44
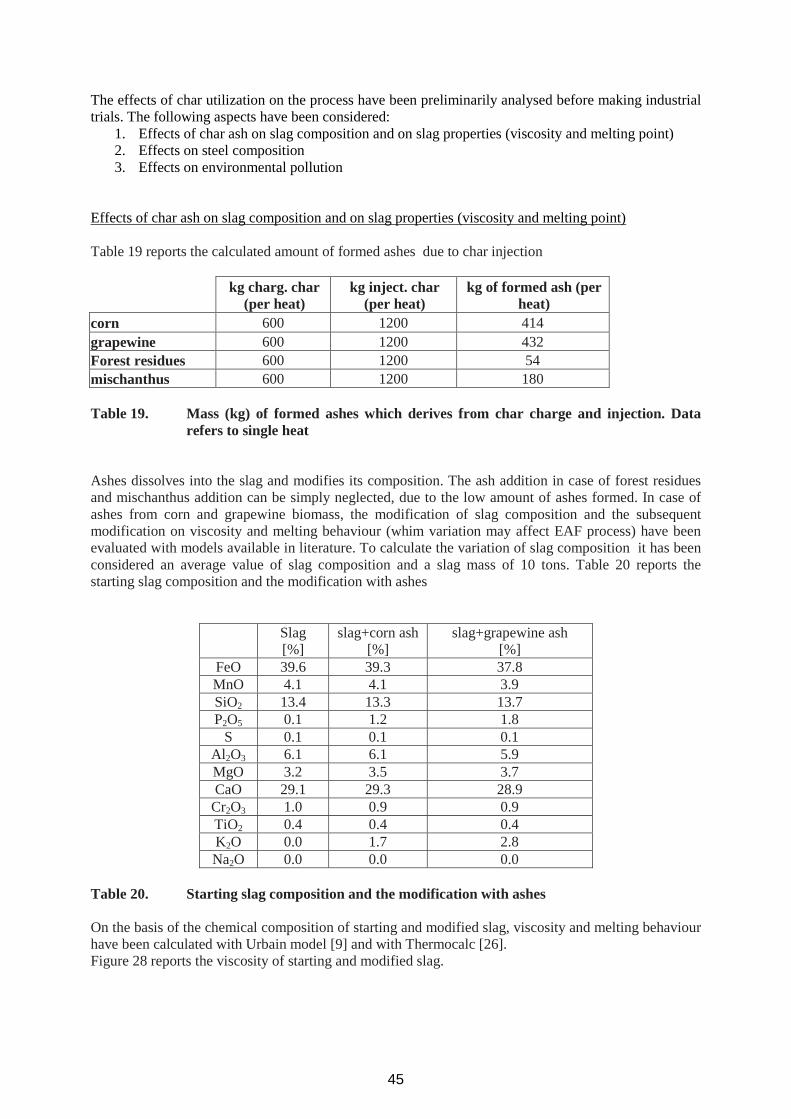
The effects of char utilization on the process have been preliminarily analysed before making industrialtrials. The following aspects have been considered:
1. Effects of char ash on slag composition and on slag properties (viscosity and melting point)2. Effects on steel composition3. Effects on environmental pollution
Effects of char ash on slag composition and on slag properties (viscosity and melting point)
Table 19 reports the calculated amount of formed ashes due to char injection
kg charg. char(per heat)
kg inject. char(per heat)
kg of formed ash (perheat)
corn 600 1200 414grapewine 600 1200 432Forest residues 600 1200 54mischanthus 600 1200 180
Table 19. Mass (kg) of formed ashes which derives from char charge and injection. Datarefers to single heat
Ashes dissolves into the slag and modifies its composition. The ash addition in case of forest residuesand mischanthus addition can be simply neglected, due to the low amount of ashes formed. In case ofashes from corn and grapewine biomass, the modification of slag composition and the subsequentmodification on viscosity and melting behaviour (whim variation may affect EAF process) have beenevaluated with models available in literature. To calculate the variation of slag composition it has beenconsidered an average value of slag composition and a slag mass of 10 tons. Table 20 reports thestarting slag composition and the modification with ashes
Slag[%]
slag+corn ash[%]
slag+grapewine ash[%]
FeO 39.6 39.3 37.8MnO 4.1 4.1 3.9SiO2 13.4 13.3 13.7P2O5 0.1 1.2 1.8
S 0.1 0.1 0.1Al2O3 6.1 6.1 5.9MgO 3.2 3.5 3.7CaO 29.1 29.3 28.9Cr2O3 1.0 0.9 0.9TiO2 0.4 0.4 0.4K2O 0.0 1.7 2.8Na2O 0.0 0.0 0.0
Table 20. Starting slag composition and the modification with ashes
On the basis of the chemical composition of starting and modified slag, viscosity and melting behaviourhave been calculated with Urbain model [9] and with Thermocalc [26].Figure 28 reports the viscosity of starting and modified slag.
45
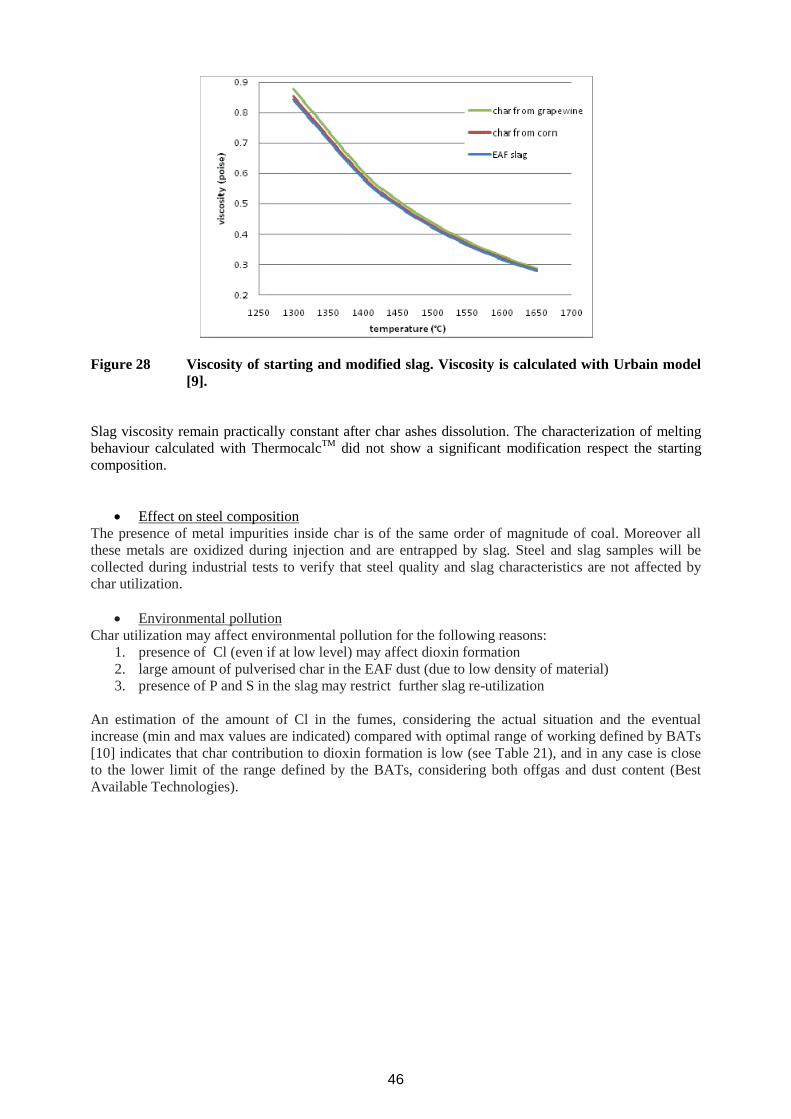
Figure 28 Viscosity of starting and modified slag. Viscosity is calculated with Urbain model[9].
Slag viscosity remain practically constant after char ashes dissolution. The characterization of meltingbehaviour calculated with ThermocalcTM did not show a significant modification respect the startingcomposition.
Effect on steel compositionThe presence of metal impurities inside char is of the same order of magnitude of coal. Moreover allthese metals are oxidized during injection and are entrapped by slag. Steel and slag samples will becollected during industrial tests to verify that steel quality and slag characteristics are not affected bychar utilization.
Environmental pollutionChar utilization may affect environmental pollution for the following reasons:
1. presence of Cl (even if at low level) may affect dioxin formation2. large amount of pulverised char in the EAF dust (due to low density of material)3. presence of P and S in the slag may restrict further slag re-utilization
An estimation of the amount of Cl in the fumes, considering the actual situation and the eventualincrease (min and max values are indicated) compared with optimal range of working defined by BATs[10] indicates that char contribution to dioxin formation is low (see Table 21), and in any case is closeto the lower limit of the range defined by the BATs, considering both offgas and dust content (BestAvailable Technologies).
46

Chlorine added with charCl in char
char Kg/heat Cl kg/heat[%]
Max 0,2 1600 3,2Min 0,05 1600 0,8
Dust FENO (current situation)Cl in EAF dust
Dust kg/heatCl in dust
[%] kg/heat1,5 1650 24,75
BATs Clorine content in Off gas HCl mg/t steel t.steel/heat Cl kg/heat
Max 9600 120 1,15
Min 800 120 0,10
BATs Clorine content in Dust Cl % in Dust Dust kg/heat Cl kg/heat
Max 1,5 1650 24,75
Min 4 1650 66Table 21. Estimation of Cl presence into fumes and comparison with acceptability range of
BATs [10]
DEW EAF cycle analysisAt DEW coal is used in the EAF cycle in two ways. Blow carbon is used to foam the slag whenproducing carbon steel qualities. Blow carbon is injected in order to foam the slag after melting downthe 2nd bucket. The carbon is lanced with air (carrier gas) in the layer between melt and slag. The slagfoaming procedure is used to shield the electric arc so that less energy is radiated onto the sidewalls ofthe furnace and therefore to lessen energy losses and to improve the heat transfer from the arc into slagand steel. Up to now there are no known foamable slags for the produced stainless steel grades.Therefore the EAF in the steelworks Siegen utilise no blowing carbon for stainless steel grades.Another way to use coal in the EAF cycle at DEW is to charge the coal together with the scrap in thebucket. The coal used this way is also called charge coal at DEW. Charge coal can be needed to reachcertain carbon levels in the steel depending on scrap qualities available. It can also be used to replaceelectrical energy by chemical energy when oxygen is used to decarburize the melt and the carbon isburned to CO and CO2 respectively.At the moment DEW is using fossil coal only. The characteristics of the used coal species are shown inTable 22. The specific amounts of coal used at DEW are shown in Figure 29. According to this datafor the years 2006-2009 the mean amount of blow carbon used per ton of steel produced is about 3.1 kg.The mean amount of charge carbon is 10.7 kg/tSteel.
47

0
2
4
6
8
10
12
14
spec
ific
amou
nt[k
g/ts
teel
]Blow carbonChargecarbon
Figure 29. Specific amounts of carbon used at DEW (2006-2009)
At DEW, per heat of carbon steel (140 t), are used on average 434 kg of blow carbon and 1498 kg ofcharge carbon.Based on the average carbon usage per heat and per ton of produced steel the annual demand forbiomass has been established for DEW. Taking the differences in carbon content into account andassuming that there are no further differences in the quality of charcoal and fossil coal regardingreactivity and therefore the ability to foam the slag the amounts of biochar and biomass needed havebeen calculated. Table 22 reports the amount of biomass necessary to replace fossil carbon at DEW.
Annual carbon demand 5000 - 8000 t/aCO2 emissions ~ 18000 – 30000 t/aAnnual biochar demand 6000 – 9600 t/aAverage yield for biomass pyrolysis 20 %Biomass demand 30000 – 48000 t/a
Table 22: Annual carbon and biomass demand at DEW Siegen EAF
Within the scope of the cycle analysis at DEW also reference values for the foamy slag compositionhave been established. These values will be used to investigate the influence of the charcoal and itsashes on the composition of the EAF slag. Table 23 reports slag compositions and average values of theslag composition for a series of heats at DEW.The industrial trials planned at DEW will start with the partial to total substitution of fossil charge coalwith charcoal. Especially mass and energy balances will be used to investigate to influence of thecharcoal use on EAF operations.In a further stage the substitution of blow carbon by charcoal was investigated. To prevent a negativeimpact of possible problems like line clogging on the production, a redundant carbon blowing systemwill be installed temporarily at the DEW EAF. The slag foaming capability of charcoal will be studiedqualitatively in comparison to fossil blow carbon.The influence of char composition, especially the ash, on slag and steel composition will be investigatedfor all trials by according analyses.
48

HeatFeOn[%]
CaO[%]
SiO2[%]
MgO[%]
MnO[%]
Al2O3[%]
Cr2O3[%]
TiO2[%]
S[%]
1 30,2 20,7 13,4 8,8 6,3 3,5 2,7 2,0 0,2
2 36,8 24,6 12,8 7,8 7,0 3,6 3,8 0,6 2,5
3 44,9 18,9 8,5 6,9 5,3 4,0 4,1 0,7 -
4 30,3 25,5 12,0 8,4 5,9 4,9 5,5 0,8 -
5 52,6 16,8 10,0 7,1 3,5 3,5 1,3 1,0 -
6 42,5 23,1 8,5 8,0 4,3 4,7 3,7 1,2 -
7 48,4 23,2 7,0 5,4 4,2 3,9 2,9 0,8 -
8 37,8 26,6 8,8 8,7 5,4 3,9 4,4 0,8 -
9 36,5 26,3 10,7 9,7 6,0 4,2 2,8 1,0 -
10 22,2 38,3 15,0 8,0 5,0 6,3 2,1 1,0 -
11 42,6 18,8 13,5 7,4 6,5 5,3 3,6 1,0 -
12 47,9 20,5 7,4 6,9 4,2 3,3 5,1 0,5 -
average 39,4 23,6 10,6 7,8 5,3 4,2 3,5 1,0 -
st. dev. 8,8 5,6 2,7 1,1 1,1 0,9 1,2 0,4 -
Table 23. Composition of foamy slag at DEW Siegen EAF
MH EAF cycle analysis
In case of Marienhutte steel plant, coal is injectd by a lance. So, beside the energetic input, the foamingbehavior is an important process aspect which must be taken into account for industrial testing of char.Slag foaming is a very complex equilibria depending on slag properties (mainly viscosity and surfacetension), amount of injected coal (which affect the amount of gaseous species necessary to promotefoaming) and also coal reactivity. Comparison of coal and char reactivity (works carried out in WP3)studied at laboratory scale indicated that a similar behaviour is expected.
For a better control of this process Marienhütte developed together with VATRON GmbH an opticalfoaming slag management system (OFSM [24]). The slag height is detected by a camera continuously.The camera is placed close to the slag door. A special image processing software calculates a slag indexto be used for the injection of the carbon amount required (Figure 30). Due to the real-time monitoringof the slag level it is possible to adjust the C-contents by injection of the optimal quantity of carbon.
49
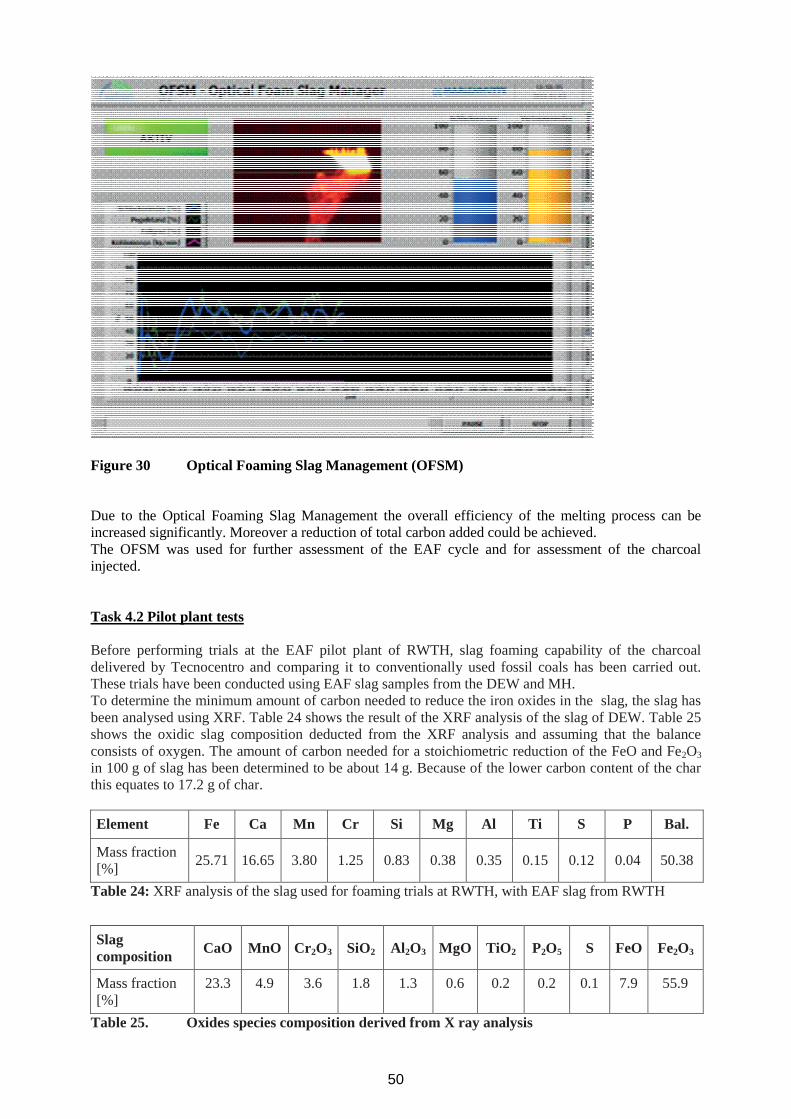
Figure 30 Optical Foaming Slag Management (OFSM)
Due to the Optical Foaming Slag Management the overall efficiency of the melting process can beincreased significantly. Moreover a reduction of total carbon added could be achieved.The OFSM was used for further assessment of the EAF cycle and for assessment of the charcoalinjected.
Task 4.2 Pilot plant tests
Before performing trials at the EAF pilot plant of RWTH, slag foaming capability of the charcoaldelivered by Tecnocentro and comparing it to conventionally used fossil coals has been carried out.These trials have been conducted using EAF slag samples from the DEW and MH.To determine the minimum amount of carbon needed to reduce the iron oxides in the slag, the slag hasbeen analysed using XRF. Table 24 shows the result of the XRF analysis of the slag of DEW. Table 25shows the oxidic slag composition deducted from the XRF analysis and assuming that the balanceconsists of oxygen. The amount of carbon needed for a stoichiometric reduction of the FeO and Fe2O3in 100 g of slag has been determined to be about 14 g. Because of the lower carbon content of the charthis equates to 17.2 g of char.
Element Fe Ca Mn Cr Si Mg Al Ti S P Bal.
Mass fraction[%] 25.71 16.65 3.80 1.25 0.83 0.38 0.35 0.15 0.12 0.04 50.38
Table 24: XRF analysis of the slag used for foaming trials at RWTH, with EAF slag from RWTH
Slagcomposition CaO MnO Cr2O3 SiO2 Al2O3 MgO TiO2 P2O5 S FeO Fe2O3
Mass fraction[%]
23.3 4.9 3.6 1.8 1.3 0.6 0.2 0.2 0.1 7.9 55.9
Table 25. Oxides species composition derived from X ray analysis
50

A defined amount of slag and carbon have been mixed and charged into alumina crucibles. Thecrucibles have then been put into a furnace heated by a natural gas/oxygen burner. The furnace has beenheated to temperatures of up to 1600°C. Figure 31 shows a charged crucible und the crucibles inside thefurnace.
Figure 31: Crucible filled with slag and carbon mixture (left) and crucibles in the furnace(right) in lab experiment carried out by RWTH.
During the trial after the melting of the slag the formation of gas and the foaming of the slag can beobserved. The foamy slag is increasing the slag volume and leads to a freezing of slag to the innercrucible wall up to a height indicative of the maximum volume increase during the trial. Figure 32 and33 show pictures of the crucibles after the DEW slag foaming trials. Within these pictures the foamyslag height reached during the trial is marked. Table 26 reports measured slag height in the crucible andrelative volume increase for the different trials.
Trial Foamy slag height [mm] Volume increase [%]Injection coal FENO 50 250Injection coal DEW 76 378Grape seed char 1 98 491Grape seed char 2 82 421
Table 26: Results of slag foaming trials
The achieved volume increases show the general suitability of the char for slag foaming.
51
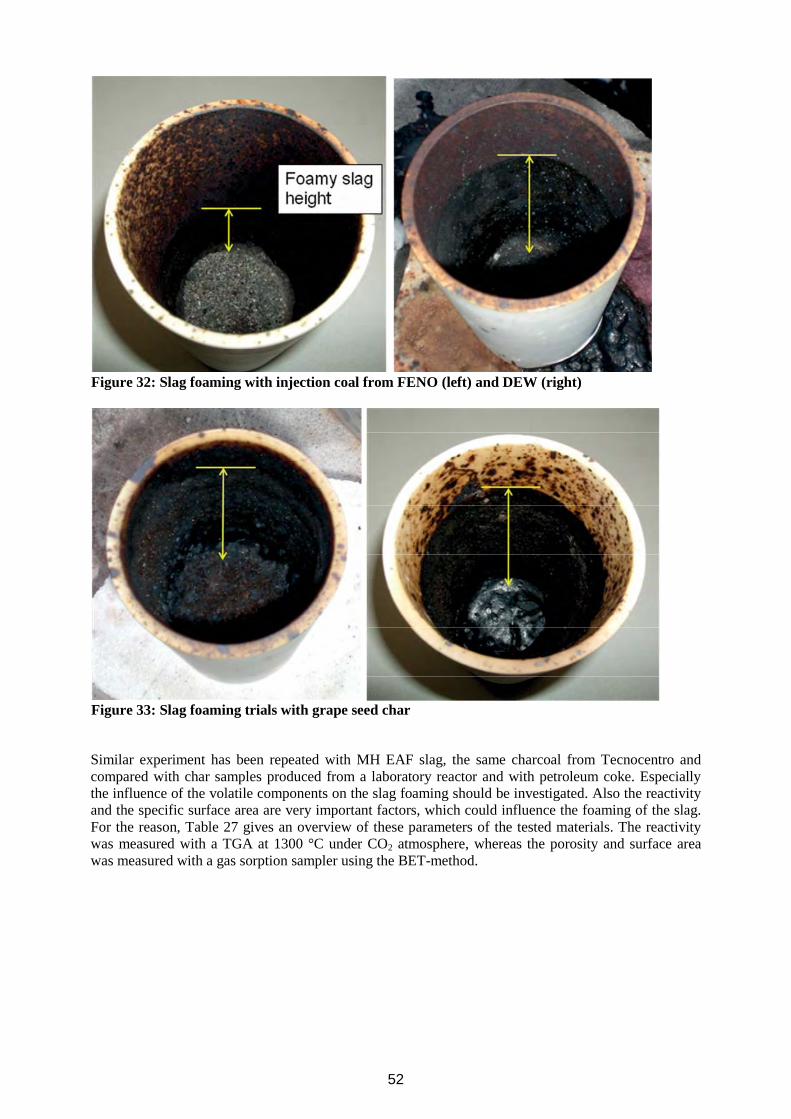
Similar experiment has been repeated with MH EAF slag, the same charcoal from Tecnocentro andcompared with char samples produced from a laboratory reactor and with petroleum coke. Especiallythe influence of the volatile components on the slag foaming should be investigated. Also the reactivityand the specific surface area are very important factors, which could influence the foaming of the slag.For the reason, Table 27 gives an overview of these parameters of the tested materials. The reactivitywas measured with a TGA at 1300 °C under CO2 atmosphere, whereas the porosity and surface areawas measured with a gas sorption sampler using the BET-method.
52
Figure 32: Slag foaming with injection coal from FENO (left) and DEW (right)
Figure 33: Slag foaming trials with grape seed char

Reactivity Surface area Pore volume[%/min] [m²/g] [cm³/g]
Calcined petroleum coke 1,51 2,34 0,002
Charcoal Tecnocentro 3,28 165,75 0,069
Charcoal 064/KO/07 6,96 327,69 0,135
Table 27 Reactivity, specific surface area and pore volume of the tested materials
It is obvious that charcoals have much higher porosity and therefore surface areas than petroleum coke,which leads to their higher reactivity.The investigations of the influence of these differences on the foaming behaviour were performed withthe so called “sessile drop test” as well as with some foaming test in small scale1.
The results of the “sessile drop tests” are illustrated in Figure 34, where some exemplary pictures arepicked out. These pictures are only a part of the whole video but visualize the sequence of the slagfoaming very clear. The first picture of each row gives the melting beginning of the slag which is atabout 1300 °C. The formation of a spherical form of the slag is obvious which indicates the non-wettable character of carbon. The next pictures show the reaction of the FeO in the liquid slag with thecarbon of the substrate with increasing temperature. In dependence of the carbonaceous material theintensity of the reaction differs, which results in varying CO bubble formation and therefore slagfoaming.The calcined petroleum coke forms very rapidly a foamed slag due to a fast slag-carbon-reaction. Thisfoamy slag stays stable very a long time period. The specimen pulsates during this period due to thepermanent new CO bubble formation.At the test with charcoal from Tecnocentro it can be seen, that at the beginning only a slightly foamedslag specimen is formed which also collapses very fast. The CO bubble formation in combination withslag foaming starts not before the slag is spread over the substrate by a strong reactionCharcoal 064/KO/07 is, in contrast, absolutely unwettable. Here the liquid slag drop stays absolutelyunchanged and stable on the carbon substrate and does not react. Only a kind of explosion leads to achanged situation. However, no slag foaming could be observed.In conclusion, the “sessile drop test” represents a good tool to estimate the foaming behaviour ofdifferent carbonaceous materials. Clear differences can be seen between the three tested materials.
1 The principle of the sessile drop test is illustrated in figure below. Here, a slag sample in cylindrical form is puton a crucible filled with the carbonaceous material which should be tested. Both are put on a ceramic holder andpushed in a furnace at 1500 °C under nitrogen atmosphere. There the slag liquefies and the FeO in the slag reactswith the carbon below forming CO-bubbles which foam the slag. These reactions are recorded by a CCD-cameraand analyzed afterwards.
Scheme of a sessile drop test
53

Whereas petroleum coke formed a well and stable foamed slag, the tested charcoals provided only badfoaming results. The most evident difference is the varying wettability which, in case of charcoals,prevents the reaction between FeO in the slag and the carbon and therefore the formation of CObubbles. The content of the volatile components in the carbonaceous material has in these trialsabsolutely no influence on the slag foaming.
Slag on calcined petroleum coke
Slag on charcoal from Tecnocentro
Slag on charcoal 064/KO/07Figure 34 Sequence of the slag-carbon-reaction with different carbonaceous materials as a
subject to the temperature (at the upper right corner in each picture)
To verify the results of the “sessile drop test” some additional foaming trials in a lab furnace wereperformed. Due to the fact that the injection of carbon in a liquid slag in lab scale is far too complex, amixture of slag with 10 % carbon was produced. This mixture was then filled in a ceramic crucible andput in a resistance heated furnace at 1400 °C. The furnace was flushed with nitrogen and monitoredwith a camera from the top. The foaming of the slag was recorded by the camera and afterwardschecked by the slag height of the crucible (see Figure 35).The best foaming performance shows, once again, petroleum coke. Here the slag even reaches the rimof the crucible. The slag heights at the experiments with charcoals were very low.
Slag + calcinedpetroleum coke
Slag + charcoalfrom Tecnocentro
Slag + charcoal064/KO/07
Figure 35 Comparison of the foaming height with different carbonaceous materials
54

Some pictures of the video recording are shown in Figure 36. With these recordings especially the wayand the rate of the CO bubble formation could be investigated.At the mixture with petroleum coke the bubble formation starts immediately after slag smelting andstays constant over a long time period which leads to a perfect foamy slag. The bubbles rise to the slaglevel and are obvious as dark points in the pictures.In contrast, at the experiments with charcoal hardly any bubble formation is recognizable. Only somebut in this case very big bubbles were detectable. However, such big bubbles do not really foam theslag. Once again, charcoals showed a worse performance.
Slag + calcined petroleum coke
Slag + charcoal from Tecnocentro
Slag + charcoal 064/KO/07Figure 36 Pictures from the video recording of the slag foaming trials in a lab furnace; CO
bubbles (dark spot with arrow)
In conclusion, the small scale tests gave a good overview about the foaming behaviour of differentcarbonaceous materials. In all trials petroleum coke delivered the better performance in case of slagfoaming and stability, whereas the slag foaming with charcoals was hardly recognizable in most cases.The reason for this seems to be the different wettability of fossil coke and charcoal. Nevertheless, it hasto keep in mind that these small scale experiments can only give tendencies. It is nearly impossible toreproduce the industrial process in lab scale due to the endless parameters. This is why in the next stepthe foaming behaviour of charcoals is tested in industrial scale.
Pilot plant tests at RWTH AachenThe pilot EAF tests were performed at the airtight pilot arc furnace of the department for industrialfurnaces and heat engineering (IOB). Figure 37 shows the furnace (left) and a schematic representationof the pilot furnace (right). The water cooled furnace consists of a fixed top reactor and a moveablecrucible with a maximum capacity of about 200 kg of steel melt. It is possible to operate in AC-modewith two electrodes or in DC-mode with one top electrode and an anode in the bottom of the crucible.In AC-mode the maximum active power is 600 kW and in DC-mode it is 300 kW. The biochar andreference material tests were performed in DC-mode. It is possible to take a sample of melt for
55
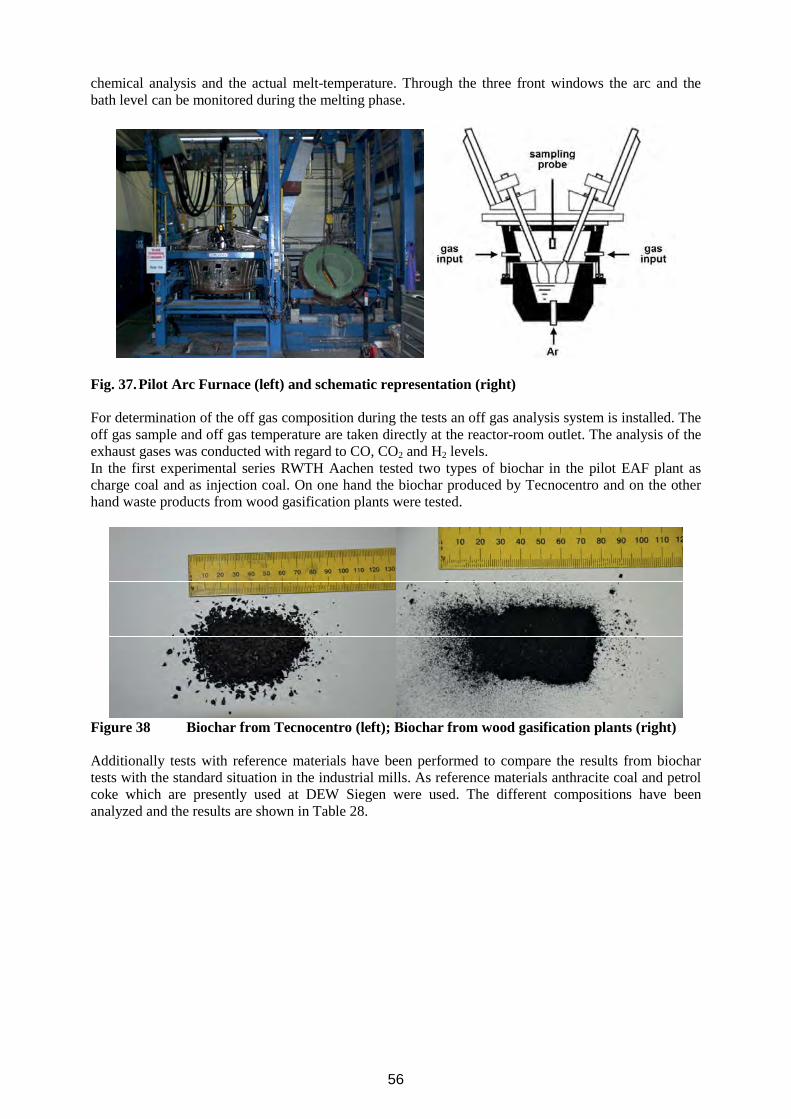
chemical analysis and the actual melt-temperature. Through the three front windows the arc and thebath level can be monitored during the melting phase.
Fig. 37.Pilot Arc Furnace (left) and schematic representation (right)
For determination of the off gas composition during the tests an off gas analysis system is installed. Theoff gas sample and off gas temperature are taken directly at the reactor-room outlet. The analysis of theexhaust gases was conducted with regard to CO, CO2 and H2 levels.In the first experimental series RWTH Aachen tested two types of biochar in the pilot EAF plant ascharge coal and as injection coal. On one hand the biochar produced by Tecnocentro and on the otherhand waste products from wood gasification plants were tested.
Figure 38 Biochar from Tecnocentro (left); Biochar from wood gasification plants (right)
Additionally tests with reference materials have been performed to compare the results from biochartests with the standard situation in the industrial mills. As reference materials anthracite coal and petrolcoke which are presently used at DEW Siegen were used. The different compositions have beenanalyzed and the results are shown in Table 28.
56

[%] Biochar fromgrape seed (TC)1
Biochar fromwood residues2
Anthracite(DEW)
Petrol Coke(DEW)
Carbon 81 72.3 86 93Ash 9 21 11.1 5.8Volatiles 7.7 13.5 2.6 1Humidity 5.6 5.2 - 0.2Sulphur 0.3 0.06 0.3 1Phosphor 0.5 0.4 - -Grain Size <5 mm <<1 mm 6-12 mm <1 mm
1: mean of 3 measurements; 2: mean of 24 measurements
Table 28. Composition of different biochar and reference materials
Due to the relatively high ash content of the biochar from wood gasification plants the ash compositionhas been analyzed to get information about the possible influence on the slag composition. Figure 39shows the results of the ash analysis.
3,82
34,73
2,17
8,23
5,47
3,28
4,48
35,76
2,06
0,00 10,00 20,00 30,00 40,00
Al2O3
CaO
Fe2O3
K2O
MgO
MnO
P2O5
SiO2
rest
[%]
Figure 39. Results from ash analysis of biochar from wood gasification plants.
As a basis the reference trials have been performed using an amount of 1 kg anthracite coal on 50 kg ofscrap. Due to the lower heating value in comparison to the anthracite coal 1.6 kg of non-processedbiochar from Tecnocentro and from wood gasification plants were charged to compensate thedifference. Figure 40 illustrates the significant difference in density of the biochar fines (left) and theanthracite coal (right).
Figure 40. 1.6 kg of biochar fines (left) and 1 kg of anthracite coal (right)
57

Figure 41 (left) illustrates the process of lancing coal and oxygen through one of the front windowsdirectly into the slag using the IOB pilot lancing system (right) after reaching the liquid phase. Whilelancing coal and oxygen by hand the furnace power had to be turned off.
Figure 41. Lancing operation of coal and oxygen (left) and IOB pilot lancing system (right)
Just before tapping at 1650°C a melt sample was taken for chemical analysis to get information aboutpossible negative effects of biochar use. After tapping all output fractions have been separated and theindividual output masses were recorded. Table 29 gives an overview of the conducted trials in the pilotplant.
Input [kg] 1 2 3 4 5 6 7 8
Scrap I 50 50 50 40 36 25 25 25
Scrap II 25 25 25 25 25
Scrap 50 50 50 65 61 50 50 50
Lime 0,5 1,5 1,5 2 2
Dolomite lime 0,5 1,5 1,5 0,5 0,5 1,5 1,5
Slag 4
Slag Former 0,5 1,5 4 2 2 2 3,5 3,5
Anthracite (DEW) 1 1
Biochar from wood gasification 1,6 1,6 1,6 1,6 1,6
TC biochar 1,6
Petrol Coke (DEW) 0,10
Biochar from wood gasificationas injection coal 0,10 0,25 0,15
Coal 1 1 1,6 1,7 1,6 1,7 1,85 1,75
Oxygen 1,23 1,1 1,71 2,89
Electrode Consumption 0,18 0,24 0,28 0,48 0,23 0,3 0,29 0,31Table 29. First conducted trials at pilot plant
58
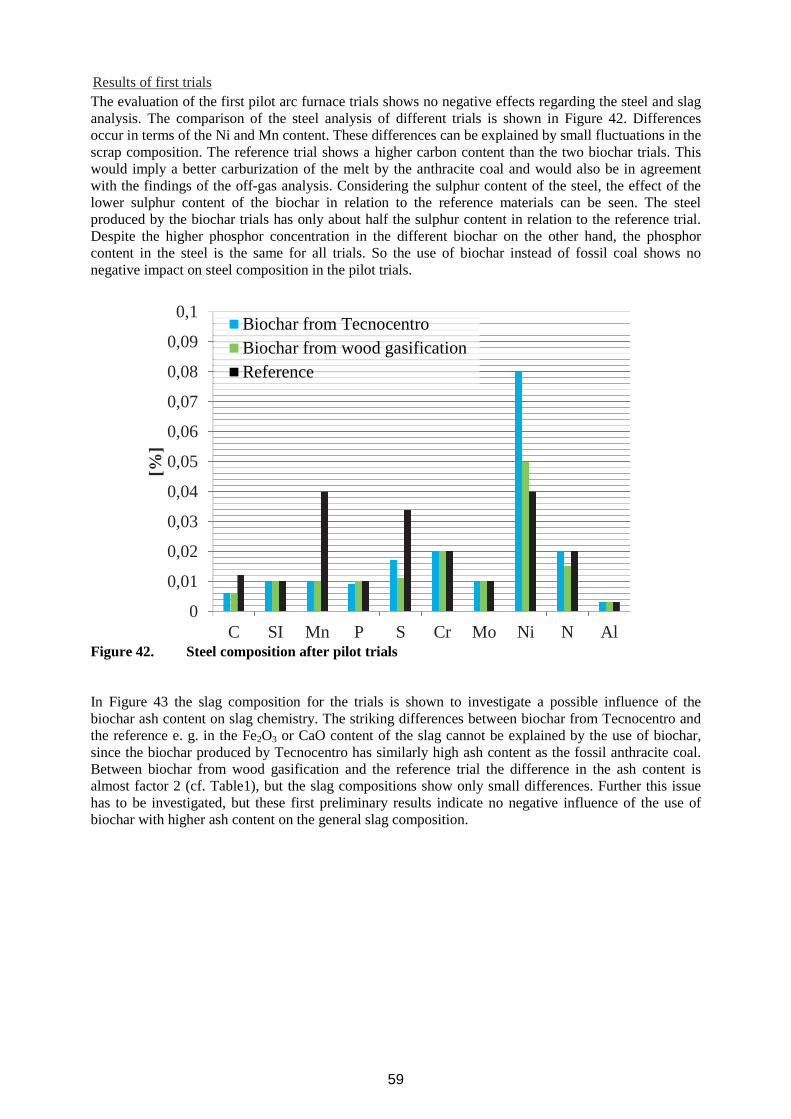
The evaluation of the first pilot arc furnace trials shows no negative effects regarding the steel and slaganalysis. The comparison of the steel analysis of different trials is shown in Figure 42. Differencesoccur in terms of the Ni and Mn content. These differences can be explained by small fluctuations in thescrap composition. The reference trial shows a higher carbon content than the two biochar trials. Thiswould imply a better carburization of the melt by the anthracite coal and would also be in agreementwith the findings of the off-gas analysis. Considering the sulphur content of the steel, the effect of thelower sulphur content of the biochar in relation to the reference materials can be seen. The steelproduced by the biochar trials has only about half the sulphur content in relation to the reference trial.Despite the higher phosphor concentration in the different biochar on the other hand, the phosphorcontent in the steel is the same for all trials. So the use of biochar instead of fossil coal shows nonegative impact on steel composition in the pilot trials.
0
0,01
0,02
0,03
0,04
0,05
0,06
0,07
0,08
0,09
0,1
C SI Mn P S Cr Mo Ni N Al
[%]
Biochar from TecnocentroBiochar from wood gasificationReference
Figure 42. Steel composition after pilot trials
In Figure 43 the slag composition for the trials is shown to investigate a possible influence of thebiochar ash content on slag chemistry. The striking differences between biochar from Tecnocentro andthe reference e. g. in the Fe2O3 or CaO content of the slag cannot be explained by the use of biochar,since the biochar produced by Tecnocentro has similarly high ash content as the fossil anthracite coal.Between biochar from wood gasification and the reference trial the difference in the ash content isalmost factor 2 (cf. Table1), but the slag compositions show only small differences. Further this issuehas to be investigated, but these first preliminary results indicate no negative influence of the use ofbiochar with higher ash content on the general slag composition.
Results of first trials
59

0
10
20
30
40
50
60
70
80
Al2O3 CaO Fe2O3 MgO MnO SiO2
[%]
Biochar from Tecnocentro
Biochar from wood gasification
Reference
Figure 43. Slag compositions of pilot furnace trials
Agglomeration of biocharDue to the handling problems using the biochar fines as charge coal in pilot scale at RWTH andindustrial tests at DEW agglomeration tests have been performed. The aim of the tests was to findsuitable binders and to establish the right blend to produce stable biochar agglomerates. At first sometests have been carried out to agglomerate the biochar fines without binders. An agglomeration was notpossible (Fig. 44 a)). Also a blend using 30 % of molasses and 20 % of water did not provide stableagglomerates (Fig. 44 b)). First stable agglomerates have been produced using 30 % of molasses and15 % of water and a forge pressure of 100 MPa (Fig. 44 c)). These agglomerates had a green strength of0.87 MPa and strength after 2 days of drying of 1.73 MPa.
Figure 44: First agglomeration tests (a-c)
On this basis further tests have been performed to increase the strength of the biochar agglomerates.Table 30 gives an overview of produced blends that have been tested.
a) b) c)
60

blendno. biochar [%] water [%] molasses
[%]green strength
[MPa]fatigue strength
[MPa]1 85 5 10 - -2 78 5 17 - -3 71 5 24 - -4 65 5 30 - -5 80 10 10 - -6 73 10 17 - -7 66 10 24 - -8 60 10 30 1,16 -9 75 15 10 0,78 -10 68 15 17 1,27 3,1211 61 15 24 1,73 6,1312 55 15 30 0,92 -13 70 20 10 0,69 -14 63 20 17 1,16 4,9115 56 20 24 1,30 -16 50 20 30 - -
Table 30. Produced and tested blends for agglomeration tests
Blend no. 11 showed the best performance and was elected to perform further pilot scale briquettingtests. The comparison of most stable blends is shown in Figure 45.
0
1
2
3
4
5
6
8 9 10 11 12 13 14 15
Stre
ngth
[MPa
]
blend
green strengthstrength after 3 days
Figure 45. Comparison of green strength and strength after 3 days of drying
Further an amount of about 30 kg of biochar briquettes was successfully produced on a pilot scaledouble roll press. Figure 46 shows a briquette (left) for comparison a piece of anthracite coal fromDEW (right).
Fatigue strength measured after 3 days of drying
61

Figure 46. Biochar briquette (left) and anthracite coal (right)
For the use of the agglomerates to replace anthracite as charge coal it is important to know the bulkbehavior and the abrasion resistance. To compare the behavior of the agglomerates to the behavior ofthe anthracite coal, tests in a vibrating sieve and drop tests have been performed. For vibrating sievetests 1 kg of biochar briquettes and anthracite have been tested for abrasion resistance. The results ofvibrating sieve tests (Figure 47) show nearly equal grain size distributions.
0%10%20%30%40%50%60%70%80%90%
100%
> 1610 - 166,3 - 106,3
pass
ing
grain size [mm]
Biochar from wood gasificationanthracite
Figure 47. Grain size distributions (left) and mass fractions (right) after vibrating sieve tests
Additionally drop tests in a closed tube of 150 mm diameter and 2 meter length have been performed tosimulate transportation and charging behavior. Also the results of the drop test below show that thereare only minimal differences between biochar briquettes and anthracite coal.
0%10%20%30%40%50%60%70%80%90%
100%
> 1610 - 166,3 - 106,3
pass
ing
grain size [mm]
Biochar from wood gasificationanthracite
Figure 48. Grain size distributions (left) and mass fractions (right) after drop tests
In summary it can be stated that the biochar could be briquetted successfully. The briquettes show goodstrength and resistance behavior. The handling of the biochar briquettes in the same way as the
62
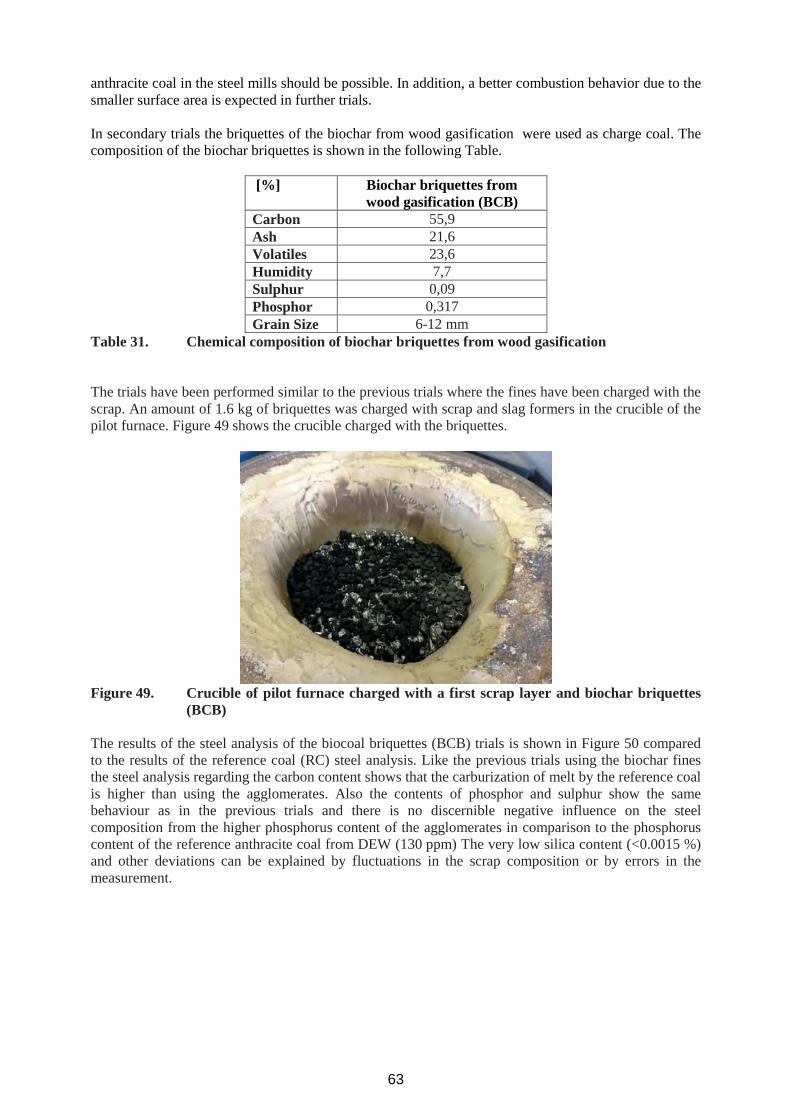
anthracite coal in the steel mills should be possible. In addition, a better combustion behavior due to thesmaller surface area is expected in further trials.
In secondary trials the briquettes of the biochar from wood gasification were used as charge coal. Thecomposition of the biochar briquettes is shown in the following Table.
[%] Biochar briquettes fromwood gasification (BCB)
Carbon 55,9Ash 21,6Volatiles 23,6Humidity 7,7Sulphur 0,09Phosphor 0,317Grain Size 6-12 mm
Table 31. Chemical composition of biochar briquettes from wood gasification
The trials have been performed similar to the previous trials where the fines have been charged with thescrap. An amount of 1.6 kg of briquettes was charged with scrap and slag formers in the crucible of thepilot furnace. Figure 49 shows the crucible charged with the briquettes.
Figure 49. Crucible of pilot furnace charged with a first scrap layer and biochar briquettes(BCB)
The results of the steel analysis of the biocoal briquettes (BCB) trials is shown in Figure 50 comparedto the results of the reference coal (RC) steel analysis. Like the previous trials using the biochar finesthe steel analysis regarding the carbon content shows that the carburization of melt by the reference coalis higher than using the agglomerates. Also the contents of phosphor and sulphur show the samebehaviour as in the previous trials and there is no discernible negative influence on the steelcomposition from the higher phosphorus content of the agglomerates in comparison to the phosphoruscontent of the reference anthracite coal from DEW (130 ppm) The very low silica content (<0.0015 %)and other deviations can be explained by fluctuations in the scrap composition or by errors in themeasurement.
63
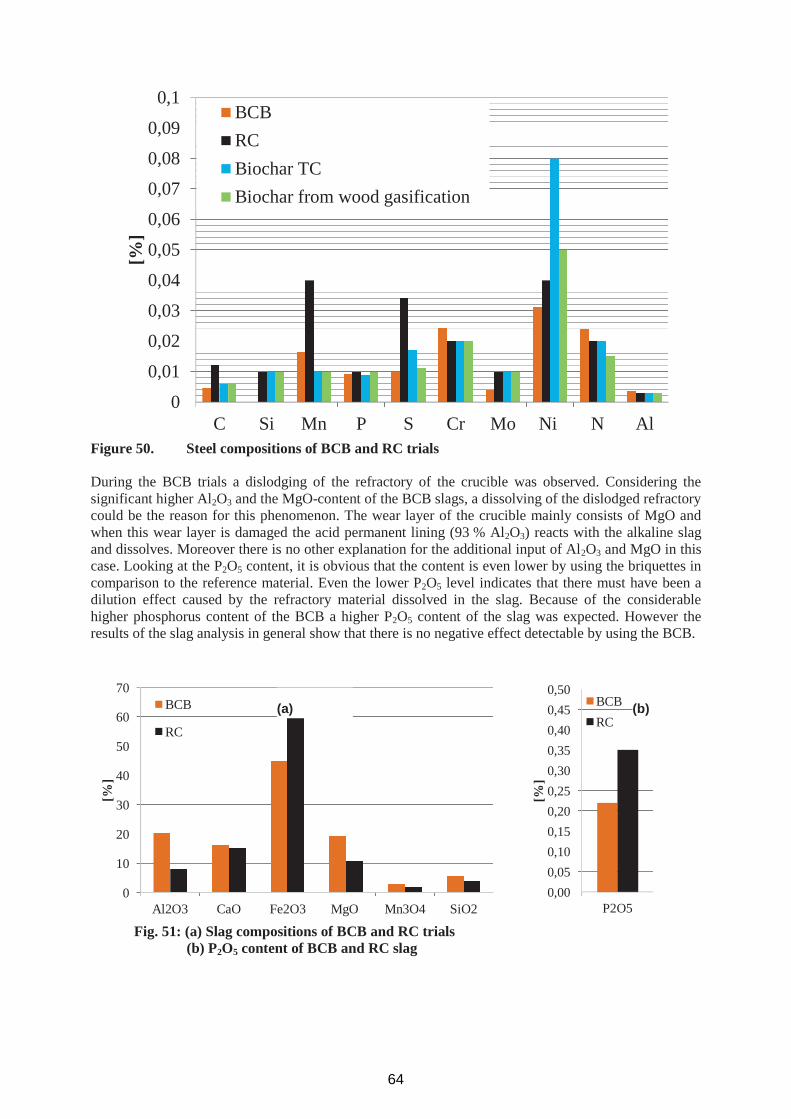
0
0,01
0,020,03
0,04
0,05
0,06
0,070,08
0,09
0,1
C Si Mn P S Cr Mo Ni N Al
[%]
BCBRCBiochar TCBiochar from wood gasification
Figure 50. Steel compositions of BCB and RC trials
During the BCB trials a dislodging of the refractory of the crucible was observed. Considering thesignificant higher Al2O3 and the MgO-content of the BCB slags, a dissolving of the dislodged refractorycould be the reason for this phenomenon. The wear layer of the crucible mainly consists of MgO andwhen this wear layer is damaged the acid permanent lining (93 % Al2O3) reacts with the alkaline slagand dissolves. Moreover there is no other explanation for the additional input of Al2O3 and MgO in thiscase. Looking at the P2O5 content, it is obvious that the content is even lower by using the briquettes incomparison to the reference material. Even the lower P2O5 level indicates that there must have been adilution effect caused by the refractory material dissolved in the slag. Because of the considerablehigher phosphorus content of the BCB a higher P2O5 content of the slag was expected. However theresults of the slag analysis in general show that there is no negative effect detectable by using the BCB.
0
10
20
30
40
50
60
70
Al2O3 CaO Fe2O3 MgO Mn3O4 SiO2
[%]
BCB
RC
Fig. 51: (a) Slag compositions of BCB and RC trials(b) P2O5 content of BCB and RC slag
0,000,050,100,150,200,250,300,350,400,450,50
P2O5
[%]
BCBRC
(a) (b)
64
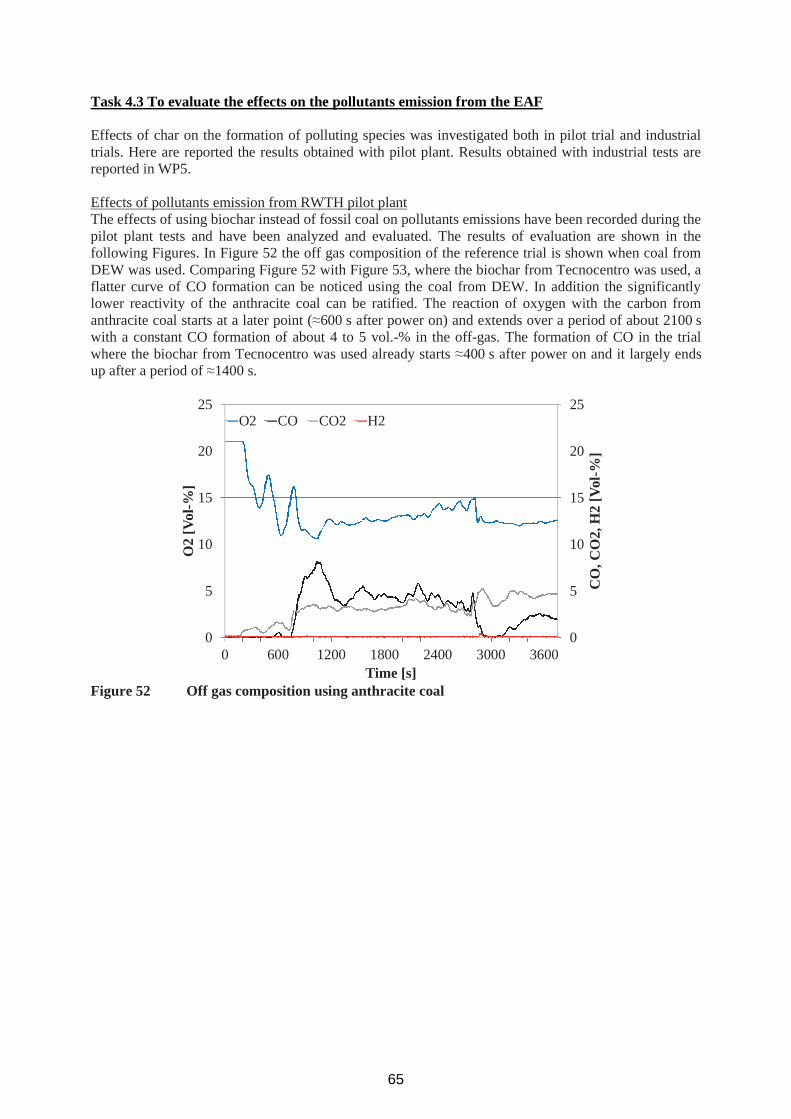
Task 4.3 To evaluate the effects on the pollutants emission from the EAF
Effects of char on the formation of polluting species was investigated both in pilot trial and industrialtrials. Here are reported the results obtained with pilot plant. Results obtained with industrial tests arereported in WP5.
Effects of pollutants emission from RWTH pilot plantThe effects of using biochar instead of fossil coal on pollutants emissions have been recorded during thepilot plant tests and have been analyzed and evaluated. The results of evaluation are shown in thefollowing Figures. In Figure 52 the off gas composition of the reference trial is shown when coal fromDEW was used. Comparing Figure 52 with Figure 53, where the biochar from Tecnocentro was used, aflatter curve of CO formation can be noticed using the coal from DEW. In addition the significantlylower reactivity of the anthracite coal can be ratified. The reaction of oxygen with the carbon fromanthracite coal starts at a later point ( 600 s after power on) and extends over a period of about 2100 swith a constant CO formation of about 4 to 5 vol.-% in the off-gas. The formation of CO in the trialwhere the biochar from Tecnocentro was used already starts 400 s after power on and it largely endsup after a period of 1400 s.
0
5
10
15
20
25
0
5
10
15
20
25
0 600 1200 1800 2400 3000 3600
CO
,CO
2,H
2[V
ol-%
]
O2
[Vol
-%]
Time [s]
O2 CO CO2 H2
Figure 52 Off gas composition using anthracite coal
65
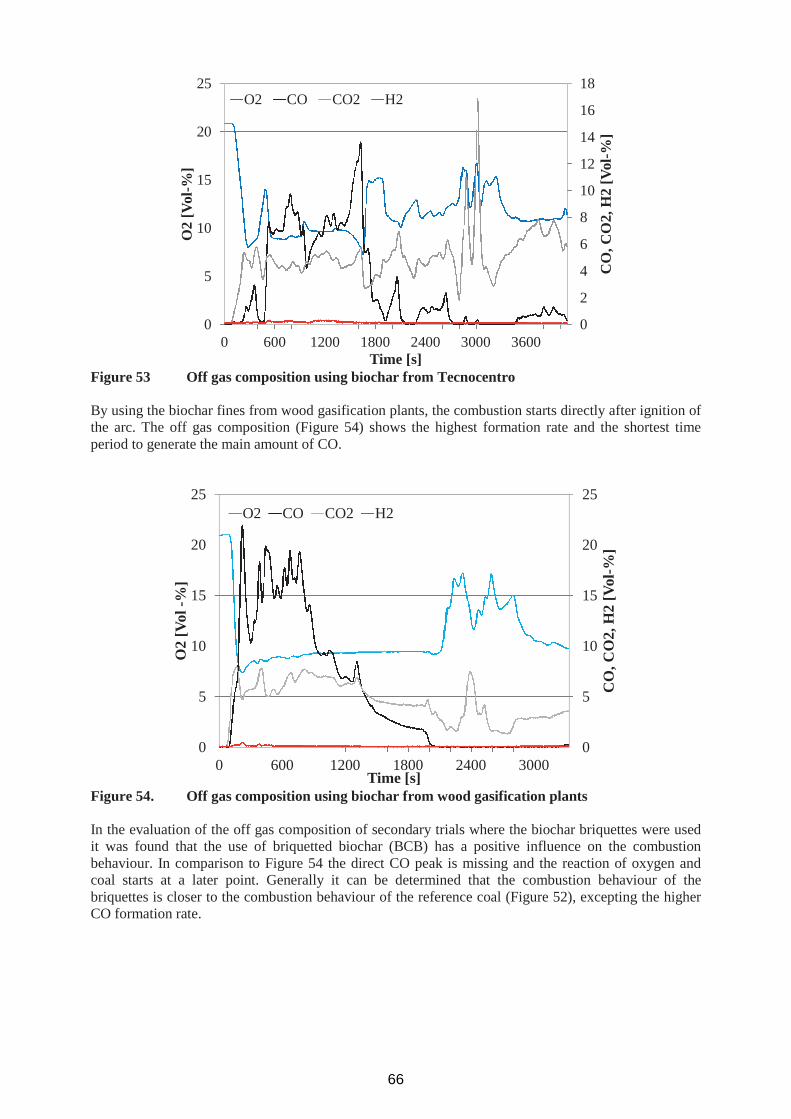
0
2
4
6
8
10
12
14
16
18
0
5
10
15
20
25
0 600 1200 1800 2400 3000 3600
CO
,CO
2,H
2[V
ol-%
]
O2
[Vol
-%]
Time [s]
O2 CO CO2 H2
Figure 53 Off gas composition using biochar from Tecnocentro
By using the biochar fines from wood gasification plants, the combustion starts directly after ignition ofthe arc. The off gas composition (Figure 54) shows the highest formation rate and the shortest timeperiod to generate the main amount of CO.
0
5
10
15
20
25
0
5
10
15
20
25
0 600 1200 1800 2400 3000
CO
,CO
2,H
2[V
ol-%
]
O2
[Vol
-%]
Time [s]
O2 CO CO2 H2
Figure 54. Off gas composition using biochar from wood gasification plants
In the evaluation of the off gas composition of secondary trials where the biochar briquettes were usedit was found that the use of briquetted biochar (BCB) has a positive influence on the combustionbehaviour. In comparison to Figure 54 the direct CO peak is missing and the reaction of oxygen andcoal starts at a later point. Generally it can be determined that the combustion behaviour of thebriquettes is closer to the combustion behaviour of the reference coal (Figure 52), excepting the higherCO formation rate.
66

0
5
10
15
20
25
0
5
10
15
20
25
0 600 1200 1800 2400 3000 3600
CO
,CO
2[V
ol-%
]
O2
[Vol
-%]
Time [s]
O2 CO CO2
Figure 55. BCB: Off gas composition using biochar briquettes (BCB)
In summary the results of the investigations regarding the pollutant emissions from biochar incomparison to the fossil coal show that the combustion behaviour of the fines is completely differentfrom using the reference material. Because of the large surface scale of the fines it comes to a directcombustion right after arc ignition. This may indicate problems by using the biochar fines in industrialscale trials to replace charge carbon. There will be the danger of explosive combustion by charging thebucket within the biochar together with scrap into the hot furnace. Only the briquetted char shows acombustion behaviour which is comparable to the combustion behaviour of the anthracite.
WP5 INDUSTRIAL EXPERIMENTATION (DEW, FERRIERE NORD, CSM, RWTH, MH,TECNOCENTRO, IP)
Task 5.1 Definition of the EAF operating practicesChar utilization into the EAF has been tested at industrial scale by the three industrial partnersparticipating to the GreenEaf project. The industrial partners involved in this project have differentEAF, which differs for size, capacity, amount of chemical energy. Following Table reports the mainEAF characteristics.
67

Chargeweight(TLS)
Num.buckets/heat
ElectricalenergyinputkWh/TLS
CH4Nm3/TLS
O2Nm3/TLS
Coallumpkg/TLS
InjectedCoalKg/TLS
Poweron(min)
Tap totap(min)
FENO 140 3 341 6 42 4 8 38 45DEW 130 2 417,2 0 21,8 10.7 1,53 54 69MH 40 3 375 7 45 0 12 31 45
FENO: Ferriere NordDEW: Deutsche Edelstahlwerke GmbHMH: Marienhütte Ges. m. b. h.
Table 32. Main characteristics of the electric furnaces of the industrial partners participating to the project.
FENO EAF uses coal for both carburization and foaming; coal is both charged and injected.DEW uses coal mainly for bath carburization: coal is manly charged and injected in a small amount.MH uses coal for foaming: coal in only injected.
The results of the investigations on the use of biochar instead of fossil coal in the EAF steelmakingprocess in comparison to reference material showed that in general there are no significant negativeimpacts on the steel or slag compositions. Problems occurred regarding the handling of fine-grainedcarbonaceous materials with a high specific surface in the presence of liquid steel and oxygen. Firsttests showed the direct combustion of the highly reactive biochar fines right after arc ignition in thepilot EAF.
In order to solve these problems, investigations on the agglomeration behaviour of biochar have beenmade. The biochar was briquetted successful. A stable briquette from a fully biogenic blend has beencreated with characteristics which are comparable to the characteristics of the anthracite coal that ispresently used in electric steel mills.These biogenic briquettes have been used as charge carbon in the pilot EAF of the department forindustrial furnaces and heat engineering (IOB). The evaluation of the results of these trials regardingsteel, slag and off gas composition shows no negative impact on the slag and steel chemistry.Concerning the off gas composition it could be shown that the combustion behaviour of the briquettes isclose to the combustion behaviour of the anthracite coal.
Char industrial testing with these three furnaces exploited a wide range of operational variability.Moreover, the utilization of syngas in EAF has been simulated through CFD modeling.
Task 5.2 Industrial tests with char and biogas.
Industrial tests at FENO – charge trialsThe Electric furnace of Ferriere Nord has a capacity of 120 t, with almost 50% of energy provided bychemical reactions. Coal is used both as charge material in the bucket and bot as powder for slagfoaming. The furnace is equipped also with the offgas online monitoring system EFSOPTM. Both charcharging and injection have been tested.Three industrial campaign were carried out:
- first campaign: charge test- Second campaign: charge tests with preliminary char briquetting- Third campaing: Injection tests
In the charge test, five heats have been tested with char charging and compared with five subsequentstandard heats. Charging conditions and steel analysis at tapping are reported in Table 33.In the first five consecutive heats, anthracite in the bottom of the first basket, has been partially orcompletely replaced with CHAR. The material was loaded into the basket after two layers of finematerial using a scrap yard crane equipped with grabbers.Off gas analysis system (EFSOP analyzer) has been used during tests. Measured data have beencompared with data of the production of CO/CO2/H2 during standard operations.
68
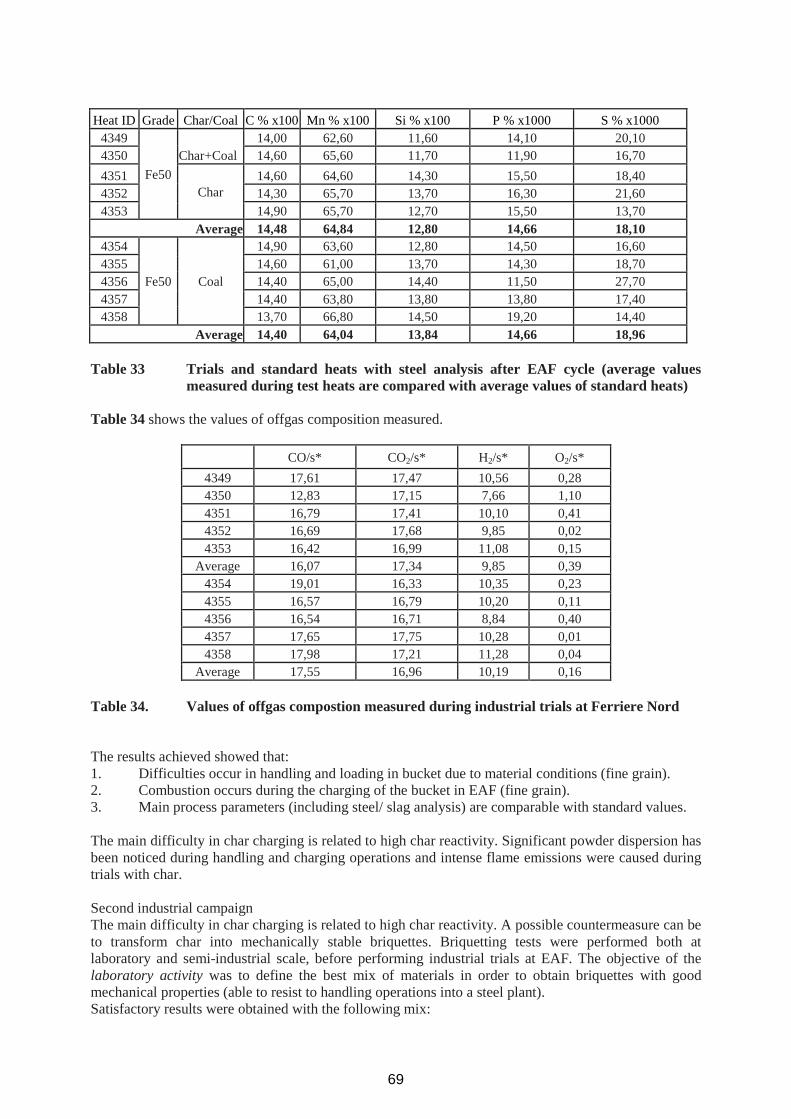
Heat ID Grade Char/Coal C % x100 Mn % x100 Si % x100 P % x1000 S % x10004349
Fe50Char+Coal
14,00 62,60 11,60 14,10 20,104350 14,60 65,60 11,70 11,90 16,704351
Char14,60 64,60 14,30 15,50 18,40
4352 14,30 65,70 13,70 16,30 21,604353 14,90 65,70 12,70 15,50 13,70
Average 14,48 64,84 12,80 14,66 18,104354
Fe50 Coal
14,90 63,60 12,80 14,50 16,604355 14,60 61,00 13,70 14,30 18,704356 14,40 65,00 14,40 11,50 27,704357 14,40 63,80 13,80 13,80 17,404358 13,70 66,80 14,50 19,20 14,40
Average 14,40 64,04 13,84 14,66 18,96
Table 33 Trials and standard heats with steel analysis after EAF cycle (average valuesmeasured during test heats are compared with average values of standard heats)
Table 34 shows the values of offgas composition measured.
CO/s* CO2/s* H2/s* O2/s*4349 17,61 17,47 10,56 0,284350 12,83 17,15 7,66 1,104351 16,79 17,41 10,10 0,414352 16,69 17,68 9,85 0,024353 16,42 16,99 11,08 0,15
Average 16,07 17,34 9,85 0,394354 19,01 16,33 10,35 0,234355 16,57 16,79 10,20 0,114356 16,54 16,71 8,84 0,404357 17,65 17,75 10,28 0,014358 17,98 17,21 11,28 0,04
Average 17,55 16,96 10,19 0,16
Table 34. Values of offgas compostion measured during industrial trials at Ferriere Nord
The results achieved showed that:1. Difficulties occur in handling and loading in bucket due to material conditions (fine grain).2. Combustion occurs during the charging of the bucket in EAF (fine grain).3. Main process parameters (including steel/ slag analysis) are comparable with standard values.
The main difficulty in char charging is related to high char reactivity. Significant powder dispersion hasbeen noticed during handling and charging operations and intense flame emissions were caused duringtrials with char.
Second industrial campaignThe main difficulty in char charging is related to high char reactivity. A possible countermeasure can beto transform char into mechanically stable briquettes. Briquetting tests were performed both atlaboratory and semi-industrial scale, before performing industrial trials at EAF. The objective of thelaboratory activity was to define the best mix of materials in order to obtain briquettes with goodmechanical properties (able to resist to handling operations into a steel plant).Satisfactory results were obtained with the following mix:
69

- 90% char,- 5% flour,- 5% bentonite,flour and bentonite being the binding agents.
Addition of ladle slag (in the range 10-15%) did not change briquettes properties. The briquettes werecharacterized by drop tests (based on drops number from 50 cm on flat metallic surface).
After the laboratory activity a semi industrial activity has been carried out at Ferriere Nord. A semi-industrial apparatus has been purposely set for briquettes production. Figure 56 shows a picture of theapparatus used at FENO for briquetting tests.
Figure 56. Semi industrial briquettes production
Five tests have been carried out using the same blend developed at laboratory scale. The materialmixing and the low grain size of the binding agents seem to be determinant in briquettes strengthening.In tests no. 4 and 5, the EAF dust have been mixed with char to increase the density of the material andto recover the powder. From a qualitative point of view, the addition of this powders seems to improvethe product stability. Briquettes have been characterized with drop tests from 1 m height. The presenceof powder fraction after drop formation was evaluated. Relevant data are shown in Table 35.
Test Char/%
Bent/% Flour/%
Filterdust/%
LFslag/%
Drop test
N1 90 5 5 - - negative
N2 90 5 (finer powder) 5 - - Partially positive
N3* 90 5 pure bent. 5 - -
N4* 85 5 pure bent. 5 5 positive
N5* 85 5 pure bent. 5 - 5 Partially positive
Table 35. Results of the briquetting tests at Ferriere Nord.
70
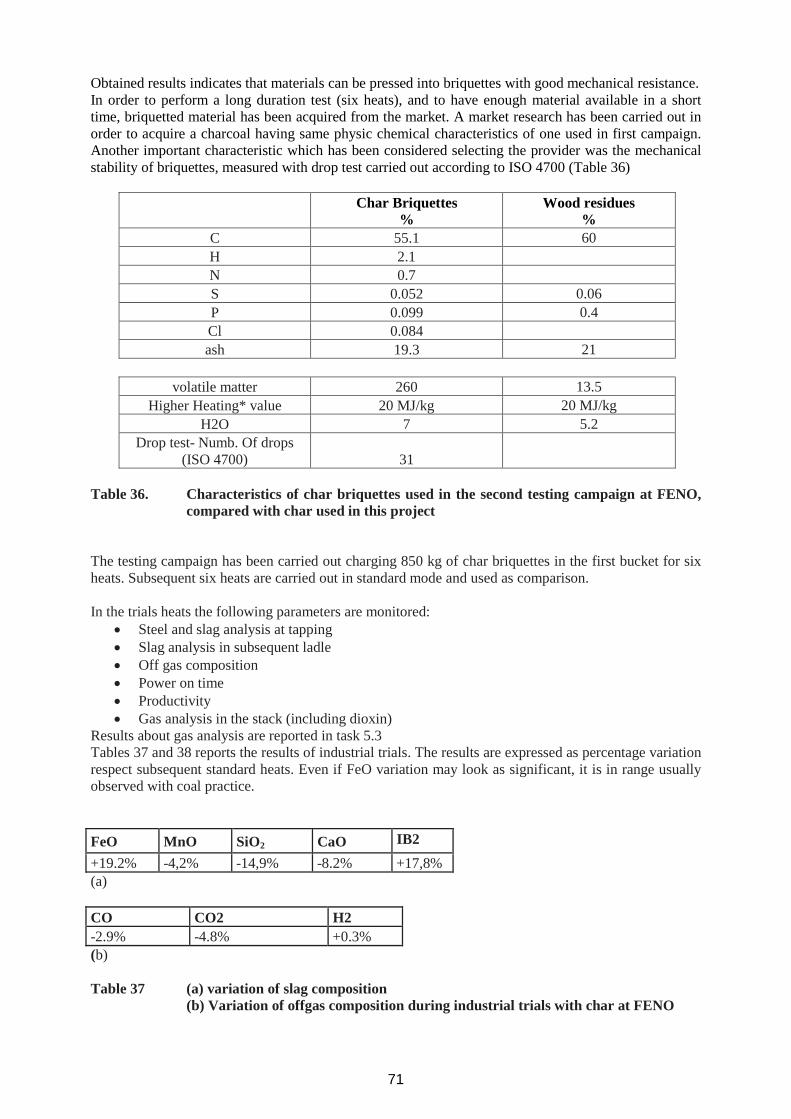
Obtained results indicates that materials can be pressed into briquettes with good mechanical resistance.In order to perform a long duration test (six heats), and to have enough material available in a shorttime, briquetted material has been acquired from the market. A market research has been carried out inorder to acquire a charcoal having same physic chemical characteristics of one used in first campaign.Another important characteristic which has been considered selecting the provider was the mechanicalstability of briquettes, measured with drop test carried out according to ISO 4700 (Table 36)
Char Briquettes%
Wood residues%
C 55.1 60H 2.1N 0.7S 0.052 0.06P 0.099 0.4Cl 0.084ash 19.3 21
volatile matter 260 13.5Higher Heating* value 20 MJ/kg 20 MJ/kg
H2O 7 5.2Drop test- Numb. Of drops
(ISO 4700) 31
Table 36. Characteristics of char briquettes used in the second testing campaign at FENO,compared with char used in this project
The testing campaign has been carried out charging 850 kg of char briquettes in the first bucket for sixheats. Subsequent six heats are carried out in standard mode and used as comparison.
In the trials heats the following parameters are monitored:Steel and slag analysis at tappingSlag analysis in subsequent ladleOff gas compositionPower on timeProductivityGas analysis in the stack (including dioxin)
Results about gas analysis are reported in task 5.3Tables 37 and 38 reports the results of industrial trials. The results are expressed as percentage variationrespect subsequent standard heats. Even if FeO variation may look as significant, it is in range usuallyobserved with coal practice.
FeO MnO SiO2 CaO IB2+19.2% -4,2% -14,9% -8.2% +17,8%(a)
CO CO2 H2-2.9% -4.8% +0.3%(b)
Table 37 (a) variation of slag composition(b) Variation of offgas composition during industrial trials with char at FENO
71

Steel prod. (t) productivity (t/h) Power On (min) Electrical consumption (kwh/t)-1,1% -2,0% +2,1% +3,5%
Table 38 Variation of main production parameters recorded during industrial trials withchar at FENO
Char addition as substitute of charge coal did not modify steel and slag characteristics; also the mainprocess parameters did not show relevant deviation from standard situation.
The intense flame emissions during char charge in bucket, observed in first campaign tests disappearedwith performing a preliminary briquetting stage.
Third industrial campaing at FENO: injection testsPulverised char has been injected by a secondary lance modified for industrial tests. This lance iscurrently used to spray refractory cement for furnace walls maintenance. Injection of 500 kg char wasmade with a mass flow rate within the range 12 16 kg/min.
The first results showed that the injected char did not penetrated inside the slag. In order to increase theefficiency of the char penetration into the slag, two possible solutions were individuated:- injection below the slag level;- use of a double jet to improve the injection system (see Figure 54).The double jet is achieved with one lance for oxygen and one lance for pulverized char with a carriergas. The jet penetration inside the slag can be calculated and it is mainly a function of lance distancefrom the slag and gas velocity.Calculation of jet penetration into the bath as a function of distance of lance from the bath and gasvelocity [23] has been carried out. The calculation takes as data input:- distance to the bath: S0 (see Figure 57)- coal/char flow rate- angle: (see Figure 54)- jet angle: (see Figure 54)- carrier gas velocity- slag density
72

S0
(a) Injection below slag level (b) double jet injection
Coal/char penetration into the slag Carrier gas velocity
(c) results of calculation of jet penetration
Figure 57 Improvement of char injection: (a): installing a lance for under slag injection; (b)using a double jet for slag penetration; (c) results of calculation of jet penetration
steel
slag
73
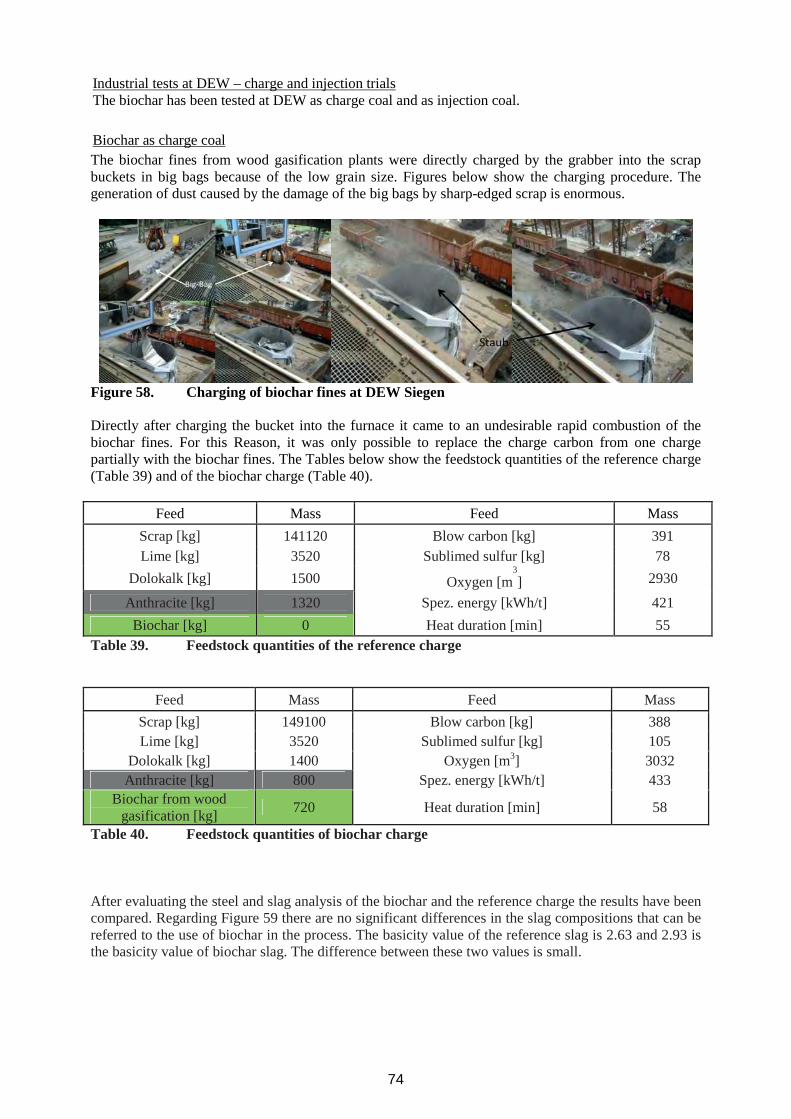
The biochar fines from wood gasification plants were directly charged by the grabber into the scrapbuckets in big bags because of the low grain size. Figures below show the charging procedure. Thegeneration of dust caused by the damage of the big bags by sharp-edged scrap is enormous.
Figure 58. Charging of biochar fines at DEW Siegen
Directly after charging the bucket into the furnace it came to an undesirable rapid combustion of thebiochar fines. For this Reason, it was only possible to replace the charge carbon from one chargepartially with the biochar fines. The Tables below show the feedstock quantities of the reference charge(Table 39) and of the biochar charge (Table 40).
Feed Mass Feed MassScrap [kg] 141120 Blow carbon [kg] 391Lime [kg] 3520 Sublimed sulfur [kg] 78
Dolokalk [kg] 1500 Oxygen [m3] 2930
Anthracite [kg] 1320 Spez. energy [kWh/t] 421Biochar [kg] 0 Heat duration [min] 55
Table 39. Feedstock quantities of the reference charge
Feed Mass Feed MassScrap [kg] 149100 Blow carbon [kg] 388Lime [kg] 3520 Sublimed sulfur [kg] 105
Dolokalk [kg] 1400 Oxygen [m3] 3032Anthracite [kg] 800 Spez. energy [kWh/t] 433
Biochar from woodgasification [kg] 720 Heat duration [min] 58
Table 40. Feedstock quantities of biochar charge
After evaluating the steel and slag analysis of the biochar and the reference charge the results have beencompared. Regarding Figure 59 there are no significant differences in the slag compositions that can bereferred to the use of biochar in the process. The basicity value of the reference slag is 2.63 and 2.93 isthe basicity value of biochar slag. The difference between these two values is small.
Industrial tests at DEW – charge and injection trialsThe biochar has been tested at DEW as charge coal and as injection coal.
Biochar as charge coal
74
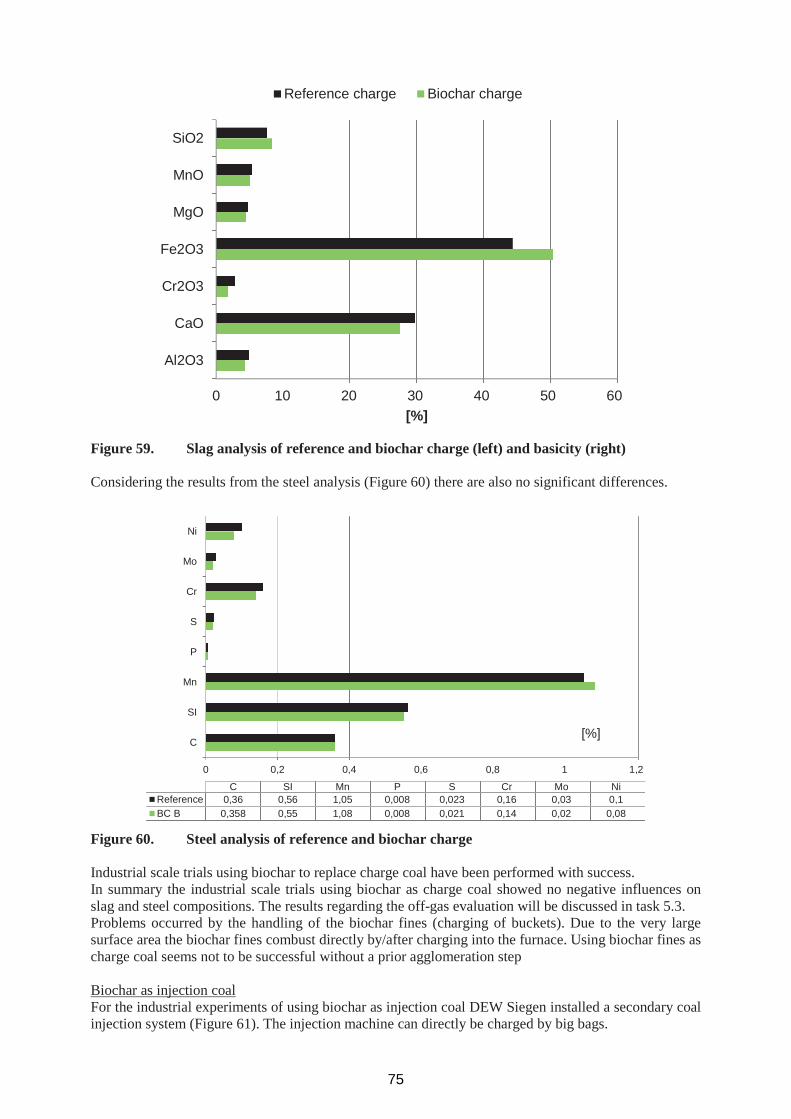
0 10 20 30 40 50 60
Al2O3
CaO
Cr2O3
Fe2O3
MgO
MnO
SiO2
[%]
Reference charge Biochar charge
Figure 59. Slag analysis of reference and biochar charge (left) and basicity (right)
Considering the results from the steel analysis (Figure 60) there are also no significant differences.
0 0,2 0,4 0,6 0,8 1 1,2
C
SI
Mn
P
S
Cr
Mo
Ni
C SI Mn P S Cr Mo NiReference 0,36 0,56 1,05 0,008 0,023 0,16 0,03 0,1BC B 0,358 0,55 1,08 0,008 0,021 0,14 0,02 0,08
Figure 60. Steel analysis of reference and biochar charge
Industrial scale trials using biochar to replace charge coal have been performed with success.In summary the industrial scale trials using biochar as charge coal showed no negative influences onslag and steel compositions. The results regarding the off-gas evaluation will be discussed in task 5.3.Problems occurred by the handling of the biochar fines (charging of buckets). Due to the very largesurface area the biochar fines combust directly by/after charging into the furnace. Using biochar fines ascharge coal seems not to be successful without a prior agglomeration step
Biochar as injection coalFor the industrial experiments of using biochar as injection coal DEW Siegen installed a secondary coalinjection system (Figure 61). The injection machine can directly be charged by big bags.
[%]
75

Figure 61. Secondary injection system for biochar fines
The following illustration shows the filling procedure of the injection system.
Figure 62 Charging the injection machine at DEW Siegen
Two trials have been performed using biochar fines as injection coal to foam the slag. The feedstocks ofthe two charges are shown in Table 41.
Feed Charge 1 Charge 2Scrap [kg] 139920 145000Lime [kg] 3060 2020
Dolokalk [kg] 1300 600Anthracite [kg] 2000 180
BC B as blow carbon [kg] 420 440Oxygen [m3] 2867 2912
Spez. energy [kwh/t] 407 415Heat duration [min] 52 59
Table 41 Feedstock of trial charges using biochar as injection coal
76

The foaming of slag using biochar fines from wood gasification plants was successful. The slagcompositions of the two trial charges have been analysed and evaluated. Regarding slag chemistry andbasicity no significant differences occur by using biochar instead of petrol coke to foam the slag.
0 10 20 30 40 50
Al2O3
CaO
Cr2O3
Fe2O3
MgO
MnO
SiO2
rest
[%]
Al2O3 CaO Cr2O3 Fe2O3 MgO MnO SiO2 restSlag 2 3,56 23,7 4,19 46,2 4,77 7,2 8,93 1,45Slag 1 5,07 30,6 2,35 37,9 5,56 5,92 10,7 1,9
Figure 63. Slag composition of biochar trials
Regarding the basicity of the reference and the biochar trial Figure 64 shows that the difference ismarginal.
Figure 64. Slag basicity of biochar trials
Industrial scale trials using biochar fines as injection carbon have been carried out successfully. Theresults showed no negative influences on slag composition and basicity. Additionally the foaming ofslag could be achieved.Problems appeared by the discharging of big bags into the injection system (Enormous dust emissions).In addition problems came up by plugging of the fine material in the pneumatic conveying system.Because of all these problems it came to delays in the logistics of the melting shop.
77

Figure 65. Problems occurring while using biochar fines as injection coal
MH industrial trials – injection trials
In order to evaluate the substitution of petroleum coke by charcoal as injection coal into the electric arcfurnace (EAF) large-scale experiments were performed. Different carbon sources provided byTecnocentro were tested for their slag foaming ability.The charcoal samples with different moisture contents were injected via the door lance manipulator.The reference material was calcined petroleum coke used at Marienhuette as standard carbon for slagfoaming purpose.The electric arc furnace has a diameter of 4700 mm, a height of 1870 mm and a capacity of around 40tonnes. Additionally to the door lance the KT system (Köster Technology) is installed at the water-cooled side wall panels near the "cold spots". The system combines three natural gas / oxygen-carbonblocks, with burner function, lance function in the supersonic range and coal injection, distributedevenly around the circumference.The injection of carbon sources with compressed air for experimental purposes is possible only throughthe door lance manipulator (see Figure 66). The injection started after melt down period of the scrap atthe beginning of the flat bath at a bath temperature of about 1540 °C. The carbon flow rate was about 20kg/min. Compressed air was used at 6 bar for this application. The experimental evaluation anddocumentation was done by the foaming slag management system OFSM (Optical Foaming SlagManagement), which determines the slag index. The slag index is a measure of the slag height.Additionally, a video camera for visual assessment of foaming effect was installed. Furthermore, slagsamples were taken.
78

Figure 66 Electric Arc Furnace and Injection Equipment at MH EAF.
The images of the video recording during the injection of three different char coals supplied byTecnocentro are illustrated in Figure 67. In the first field left the starting of the injection through thedoor lance is shown, while the second and third Figure represents the injection itself. The last pictureright shows part of the slag foaming after the start of the KT-lances with petroleum coke. It can be seenthat with exception of the charcoal sample with the highest moisture content (50 %) any of the coalstested even caused a foamy slag formation. Only with injection of calcined petroleum coke a slagfoaming and an overflow were achieved. Despite the injection time of about two minutes noimprovements were observed. Only the wet charcoal led the slag to overflow the furnace wall. Incomparison, after the start of the KT system with petroleum coke a strong reaction deployed and theslag immediately flow out of the furnace door. This shows evidence that the slags were foamable. Thecorresponding slag analysis shows Table 42. The compositions are in typical ranges but withoutparticular correlation.
charFeO Fe2O3 Al2O3 CaO SiO2 MgO MnO Cr2O3 S[%] [%] [%] [%] [%] [%] [%] [%] [%]
Sample C 25,45 4,08 17,79 24,56 12,64 8,42 4,38 1,34 0,09B Tecnocentro 34,45 5,58 9,25 28,85 9,34 4,59 4,58 2,29 0,12A Tecnocentro 38,53 7,52 8,41 21,65 9,42 6,10 4,24 2,91 0,13
Table 42 Slag analysis after char injection tests at MH
79
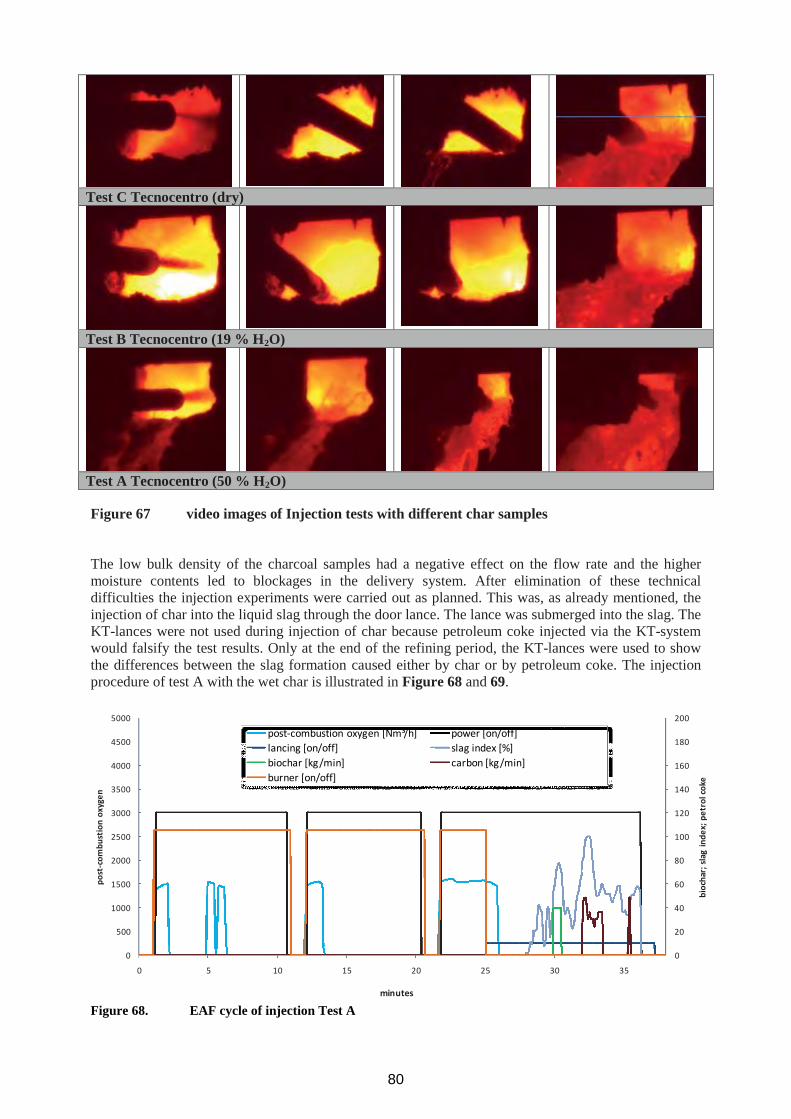
Test C Tecnocentro (dry)
Test B Tecnocentro (19 % H2O)
Test A Tecnocentro (50 % H2O)
Figure 67 video images of Injection tests with different char samples
The low bulk density of the charcoal samples had a negative effect on the flow rate and the highermoisture contents led to blockages in the delivery system. After elimination of these technicaldifficulties the injection experiments were carried out as planned. This was, as already mentioned, theinjection of char into the liquid slag through the door lance. The lance was submerged into the slag. TheKT-lances were not used during injection of char because petroleum coke injected via the KT-systemwould falsify the test results. Only at the end of the refining period, the KT-lances were used to showthe differences between the slag formation caused either by char or by petroleum coke. The injectionprocedure of test A with the wet char is illustrated in Figure 68 and 69.
0
20
40
60
80
100
120
140
160
180
200
0
500
1000
1500
2000
2500
3000
3500
4000
4500
5000
0 5 10 15 20 25 30 35
biochar;sla
ginde
x;pe
trolcoke
post-com
bustionoxygen
minutes
post-combustion oxygen [Nm³/h] power [on/off]lancing [on/off] slag index [%]biochar [kg/min] carbon [kg/min]burner [on/off]
Figure 68. EAF cycle of injection Test A
80

Figure 69. Slag Index detected by the OFSM system
Figure 70 summarizes theoretical mechanism for slag foaming using char.
CO formation by reduction of FeOVolatilesMoisture
The contribution of the CO bubbles formed by reduction of FeO to the slag foaming is called intoquestion.
Figure 70. slag foaming mechanism using char
The result of the injection tests of charcoal in the EAF at MH shows that charcoal doesn´t cause or ifany a very slight foaming of the slag. The reason for this could be a low wettability of charcoal by theliquid slag, which prevents a reaction of carbon with FeO of the slag to form enough CO bubbles. This
81

was demonstrated by a sessile drop test. The low bulk density of the charcoal bears a risk of floating onthe slag layer, which reduces the penetration in the slag significantly. Only the experiment with moistcharcoal led to the formation of an acceptable slag foam. Here, the resulting water vapour at the hightemperatures > 1500 °C due to the water-shift equilibrium resulted in formation of high quantities ofgas which lead to slag foaming, but without effect on reducing FeO. This is of course undesirable. Inaddition, high humidity in combination with liquid metal and / or slag bears the risk of explosive gasformation.
Syngas utilization in EAF
Syngas produced during biomass pyrolysis can be used in EAF burners instead of natural gas. Due tothe difficulty to have pilot syngas production close to the steel plant, according to the technical annexthe syngas use has been simulated through CFD calculations. Considering the situation of FENO EAF,the simulation has been designed according to the following steps:
i) Definition of a reference EAF situation with natural gas burners configurations.ii) Definition of quantitative criteria to compare burner performances with natural gas and syngas.iii) Definition of syngas characteristics and simulation with syngas burner feeding.iv) Global evaluation about syngas utilization in EAF. Definition of a reference EAF situation with
actual burners configurations with natural gas.
i) Definition of a reference situation. CFD simulation has been carried out in order to set a referencesituation, to be compared with subsequent simulations with syngas. The reference situation consider thedesign of the current used burner, the burners operating parameters and the EAF atmospherecomposition . Figure 71 shows the burner geometry.
Figure 71. Scheme of burner currently used at FENO steelplant
The calculation domain considers a cylinder with 2500 mm diameter and 6000 mm length. Atmospherecomposition is defined based on average values measured by EFSOP sensor. The burner is placed insymmetric position in one side of the domain, as indicated in Figure 72, where boundary conditions arealso shown.
82

Figure 72. Boundary conditions used for CFD calculations
Being the final objective of the calculations the syngas simulation, a detailed kinetic combustion modelhas been chosen. This model includes 16 species and 42 reactions.
ii) Definition of quantitative criteria to compare burner performances with natural gas andsyngas.Once the flow field and flame temperature has been calculated for the current process workingconditions, in order to simulate the EAF syngas utilization a quantitative criterion has been defined.The criterion is based on the comparison of the burners efficiencies, calculated with natural gas andwith syngas. Such efficiency is defined as:
Figure 73 reports the results of the calculations of the burner efficiency, for three different standardworking conditions (corresponding to three burner powers).
burnerthefromkWscrapthetokW
burner
83
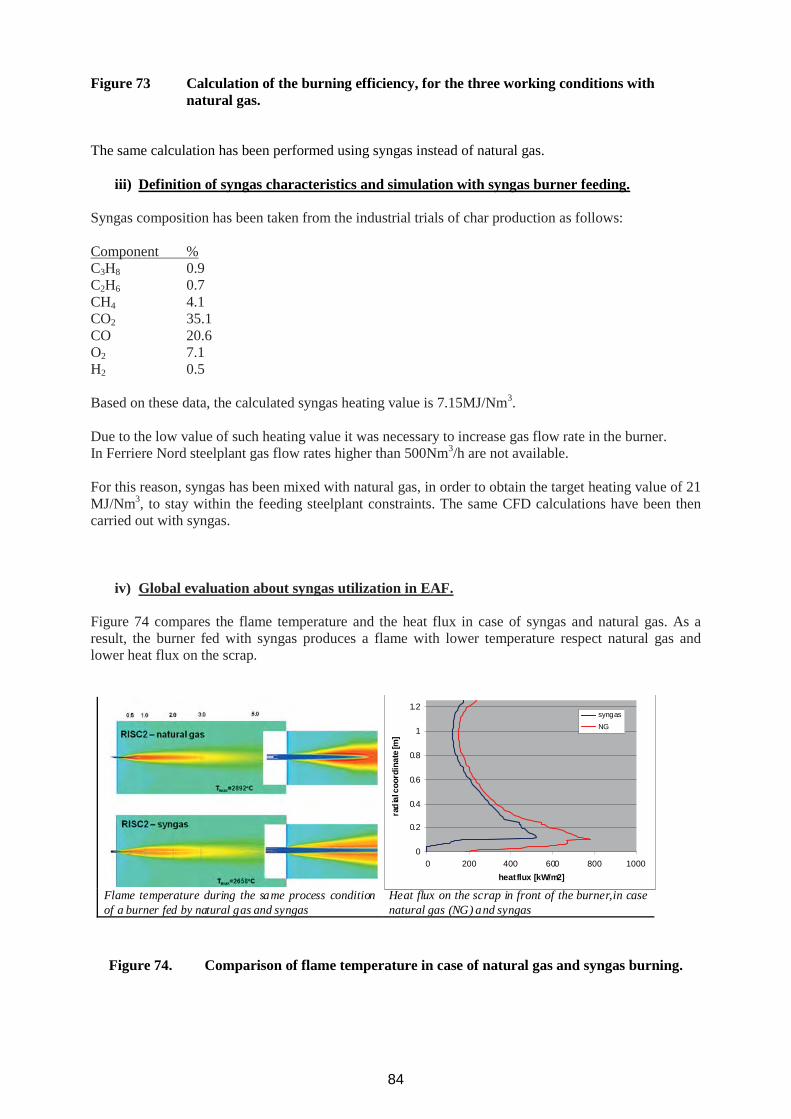
Figure 73 Calculation of the burning efficiency, for the three working conditions withnatural gas.
The same calculation has been performed using syngas instead of natural gas.
iii) Definition of syngas characteristics and simulation with syngas burner feeding.
Syngas composition has been taken from the industrial trials of char production as follows:
Component %C3H8 0.9C2H6 0.7CH4 4.1CO2 35.1CO 20.6O2 7.1H2 0.5
Based on these data, the calculated syngas heating value is 7.15MJ/Nm3.
Due to the low value of such heating value it was necessary to increase gas flow rate in the burner.In Ferriere Nord steelplant gas flow rates higher than 500Nm3/h are not available.
For this reason, syngas has been mixed with natural gas, in order to obtain the target heating value of 21MJ/Nm3, to stay within the feeding steelplant constraints. The same CFD calculations have been thencarried out with syngas.
iv) Global evaluation about syngas utilization in EAF.
Figure 74 compares the flame temperature and the heat flux in case of syngas and natural gas. As aresult, the burner fed with syngas produces a flame with lower temperature respect natural gas andlower heat flux on the scrap.
0
0.2
0.4
0.6
0.8
1
1.2
0 200 400 600 800 1000heatflux [kW/m2]
rad
ialc
oord
inat
e[m
]
syngasNG
Flame temperature during the same process conditionof a burner fed by natural gas and syngas
Heat flux on the scrap in front of the burner,in casenatural gas (NG) and syngas
Figure 74. Comparison of flame temperature in case of natural gas and syngas burning.
84

Comparing the performances of the burners in term of efficiency (Figure 75), it has been found that theuse of syngas determines a decreasing of efficiency of about 10%.
Figure 75. Difference of efficiency of burner in case of natural gas (NG) and syngas
To recovery the efficiency lost by syngas utilization, different burner configurations have beensimulated. Figure 76 reports the results on a simulation showing the flame aspect and temperature incase of feeding with syngas the current burner, a burner modified with swirl motion on oxygen andswirl motion on oxygen and syngas.
No swirl swirl O2 Swirl on O2 and syngas
Figure 76. Flame aspect and temperature in case of feeding with syngas the current burner, aburner modified with swirl motion on oxygen and swirl motion on oxygen andsyngas.
The calculation of efficiency in case of swirl motion did not a significant gain. Simulation show a largerportion of scrap heated by burner improved with swirl, but the global increase of efficiency is small.Summarising, the simulations showed a decreasing of efficiency of burner fed with syngas. In order to
85
keep the plant productivity at the same level, it is necessary to enrich the mix of natural gas, or toincreases the gas flow rate. This calls for plant modifications.
Task 5.3 Evaluation of the variations of pollutants emissions from the plant.
Environemtal monitoring during industrial trials has been carried out at Ferriere Nord and DEW. MHuses a smaller amount of char/ton of steel, respect the two other industrial partners, because carbon isused only as foaming agent, and not as charge material for steel recarburization of energy input.
Ferriere Nord, beside the current off gas analysis carried out with patented online installed system(EFSOP TM), performed extra analysis at the stack.
The results coming from stack analysis are compared with plant historical data.
Following species have been analysed.PowdersMetals (Pb, Cd, Cu, Zn, Cr, Cr(VI), V, Ni, Mn, Sn)HClPAHPCDD/PCDF
Below results of stack monitoring are reported and compared also with historical plant data:
measured historicalPowders (mg/Nm3) <0.5 <0.5HCl (mg/Nm3) <0.5 <0.5Dioxin (ng/Nm3) 0.004 0.005PAH (mg/Nm3) 0.008 0.002
The analysis at Ferriere Nord indicate that fumes chemical analysis is not modified by char utilization,compared to average historical data.
Pollutant emissions and off gas temperature of biochar and reference trials at DEW have beenmeasured, analyzed and evaluated. The measurements were carried out in the exhaust system of the arcfurnace. Figure 77 shows a drawing of the exhaust system. The measuring point is marked. At thisposition, there are openings in the pipe, which were used to install the measurement equipment.
86
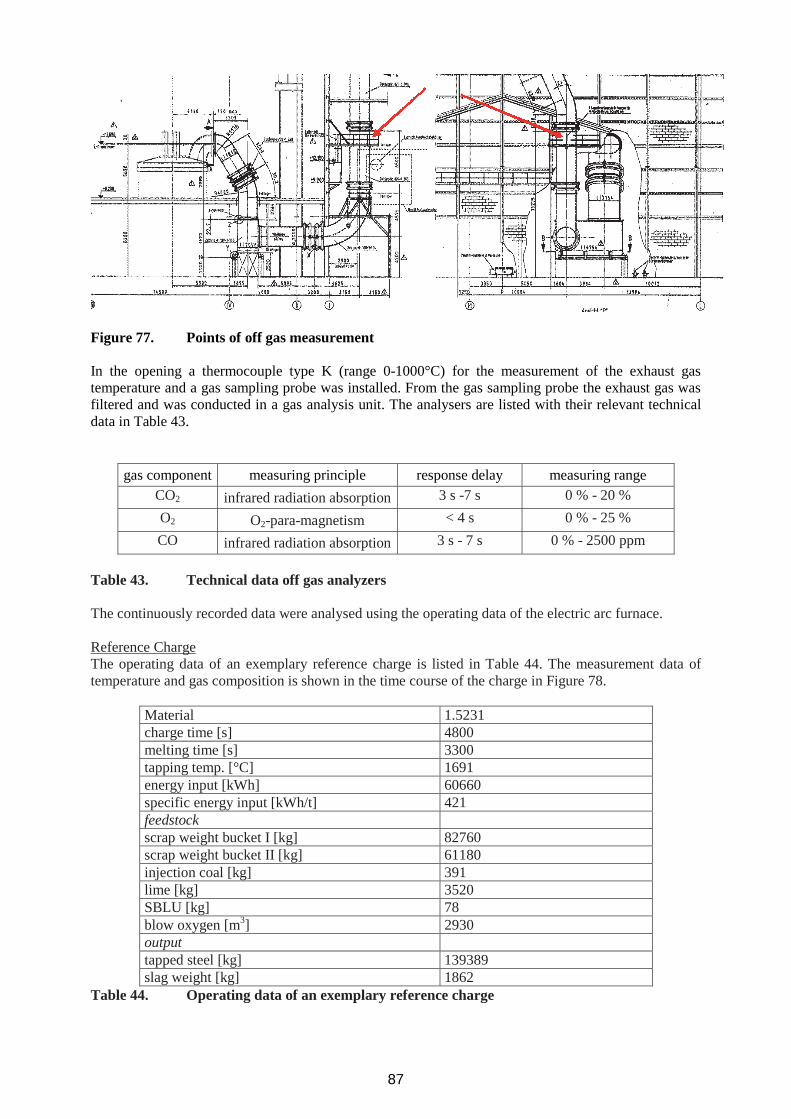
Figure 77. Points of off gas measurement
In the opening a thermocouple type K (range 0-1000°C) for the measurement of the exhaust gastemperature and a gas sampling probe was installed. From the gas sampling probe the exhaust gas wasfiltered and was conducted in a gas analysis unit. The analysers are listed with their relevant technicaldata in Table 43.
gas component measuring principle response delay measuring rangeCO2 infrared radiation absorption 3 s -7 s 0 % - 20 %O2 O2-para-magnetism < 4 s 0 % - 25 %CO infrared radiation absorption 3 s - 7 s 0 % - 2500 ppm
Table 43. Technical data off gas analyzers
The continuously recorded data were analysed using the operating data of the electric arc furnace.
Reference ChargeThe operating data of an exemplary reference charge is listed in Table 44. The measurement data oftemperature and gas composition is shown in the time course of the charge in Figure 78.
Material 1.5231charge time [s] 4800melting time [s] 3300tapping temp. [°C] 1691energy input [kWh] 60660specific energy input [kWh/t] 421feedstockscrap weight bucket I [kg] 82760scrap weight bucket II [kg] 61180injection coal [kg] 391lime [kg] 3520SBLU [kg] 78blow oxygen [m3] 2930outputtapped steel [kg] 139389slag weight [kg] 1862
Table 44. Operating data of an exemplary reference charge
87
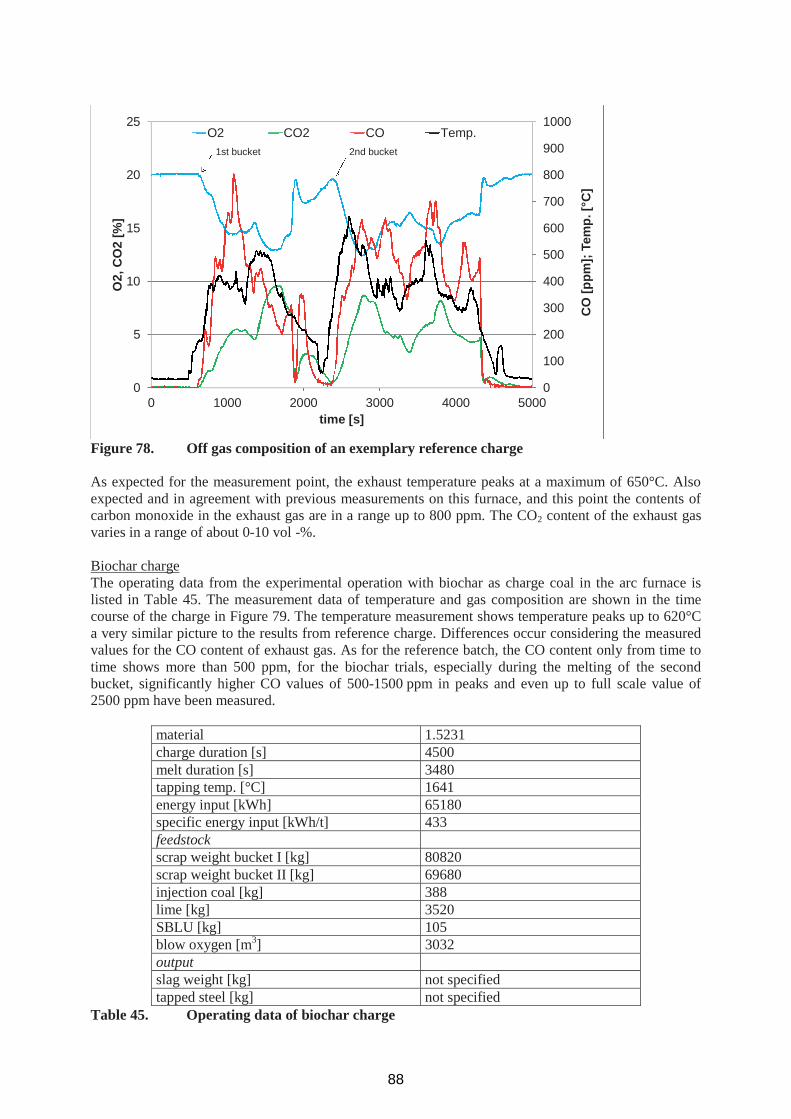
0
100
200
300
400
500
600
700
800
900
1000
0
5
10
15
20
25
0 1000 2000 3000 4000 5000
CO
[ppm
];Te
mp.
[°C
]
O2,
CO
2[%
]
time [s]
O2 CO2 CO Temp.1st bucket 2nd bucket
Figure 78. Off gas composition of an exemplary reference charge
As expected for the measurement point, the exhaust temperature peaks at a maximum of 650°C. Alsoexpected and in agreement with previous measurements on this furnace, and this point the contents ofcarbon monoxide in the exhaust gas are in a range up to 800 ppm. The CO2 content of the exhaust gasvaries in a range of about 0-10 vol -%.
Biochar chargeThe operating data from the experimental operation with biochar as charge coal in the arc furnace islisted in Table 45. The measurement data of temperature and gas composition are shown in the timecourse of the charge in Figure 79. The temperature measurement shows temperature peaks up to 620°Ca very similar picture to the results from reference charge. Differences occur considering the measuredvalues for the CO content of exhaust gas. As for the reference batch, the CO content only from time totime shows more than 500 ppm, for the biochar trials, especially during the melting of the secondbucket, significantly higher CO values of 500-1500 ppm in peaks and even up to full scale value of2500 ppm have been measured.
material 1.5231charge duration [s] 4500melt duration [s] 3480tapping temp. [°C] 1641energy input [kWh] 65180specific energy input [kWh/t] 433feedstockscrap weight bucket I [kg] 80820scrap weight bucket II [kg] 69680injection coal [kg] 388lime [kg] 3520SBLU [kg] 105blow oxygen [m3] 3032outputslag weight [kg] not specifiedtapped steel [kg] not specified
Table 45. Operating data of biochar charge
88
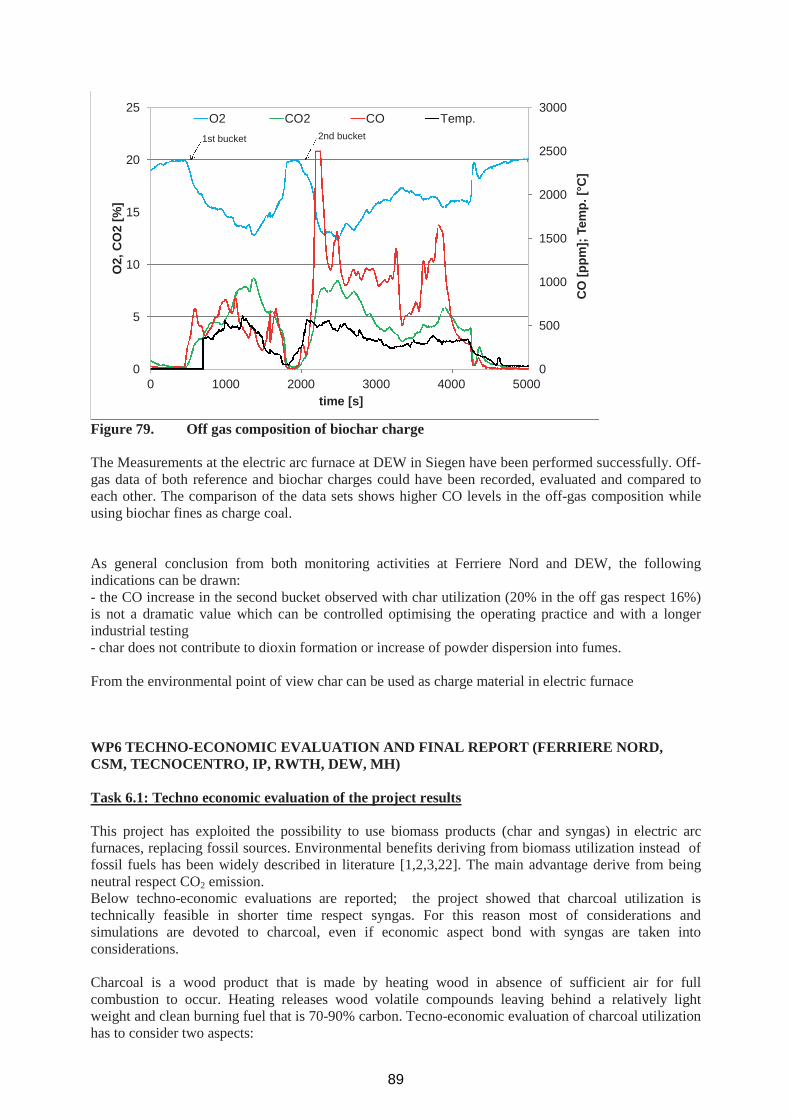
0
500
1000
1500
2000
2500
3000
0
5
10
15
20
25
0 1000 2000 3000 4000 5000
CO
[ppm
];Te
mp.
[°C
]
O2,
CO
2[%
]
time [s]
O2 CO2 CO Temp.1st bucket 2nd bucket
Figure 79. Off gas composition of biochar charge
The Measurements at the electric arc furnace at DEW in Siegen have been performed successfully. Off-gas data of both reference and biochar charges could have been recorded, evaluated and compared toeach other. The comparison of the data sets shows higher CO levels in the off-gas composition whileusing biochar fines as charge coal.
As general conclusion from both monitoring activities at Ferriere Nord and DEW, the followingindications can be drawn:- the CO increase in the second bucket observed with char utilization (20% in the off gas respect 16%)is not a dramatic value which can be controlled optimising the operating practice and with a longerindustrial testing- char does not contribute to dioxin formation or increase of powder dispersion into fumes.
From the environmental point of view char can be used as charge material in electric furnace
WP6 TECHNO-ECONOMIC EVALUATION AND FINAL REPORT (FERRIERE NORD,CSM, TECNOCENTRO, IP, RWTH, DEW, MH)
Task 6.1: Techno economic evaluation of the project results
This project has exploited the possibility to use biomass products (char and syngas) in electric arcfurnaces, replacing fossil sources. Environmental benefits deriving from biomass utilization instead offossil fuels has been widely described in literature [1,2,3,22]. The main advantage derive from beingneutral respect CO2 emission.Below techno-economic evaluations are reported; the project showed that charcoal utilization istechnically feasible in shorter time respect syngas. For this reason most of considerations andsimulations are devoted to charcoal, even if economic aspect bond with syngas are taken intoconsiderations.
Charcoal is a wood product that is made by heating wood in absence of sufficient air for fullcombustion to occur. Heating releases wood volatile compounds leaving behind a relatively lightweight and clean burning fuel that is 70-90% carbon. Tecno-economic evaluation of charcoal utilizationhas to consider two aspects:
89
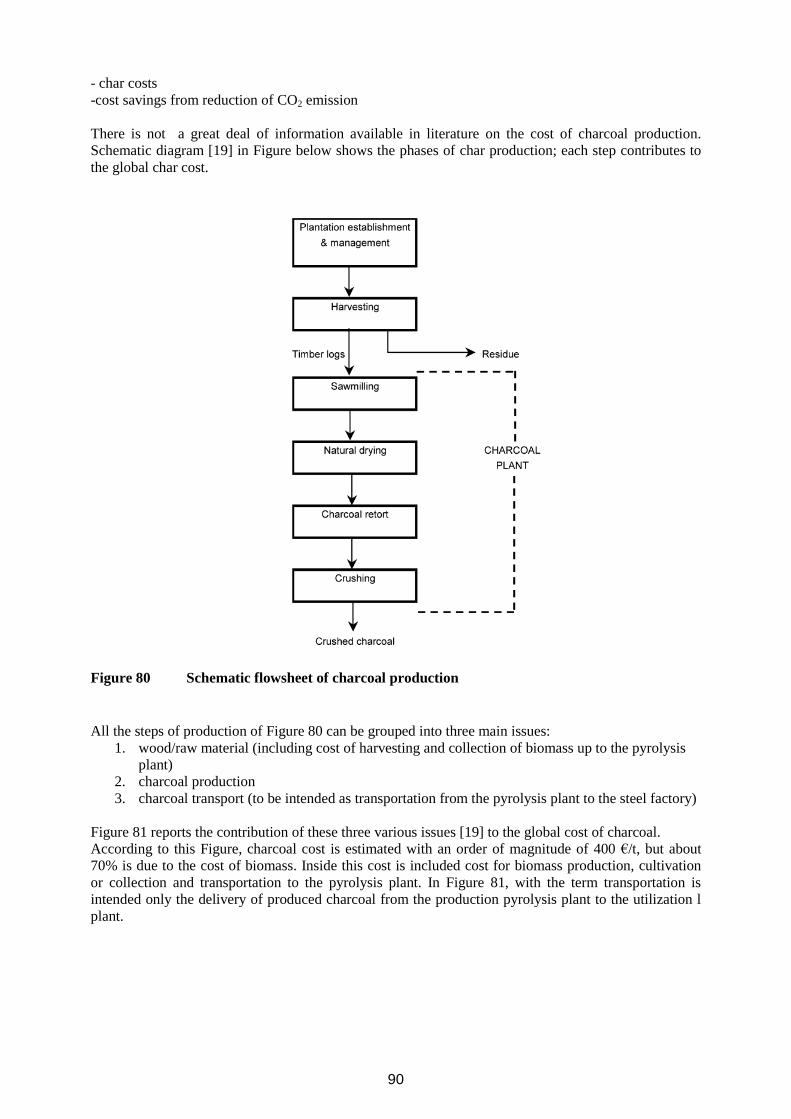
- char costs-cost savings from reduction of CO2 emission
There is not a great deal of information available in literature on the cost of charcoal production.Schematic diagram [19] in Figure below shows the phases of char production; each step contributes tothe global char cost.
Figure 80 Schematic flowsheet of charcoal production
All the steps of production of Figure 80 can be grouped into three main issues:1. wood/raw material (including cost of harvesting and collection of biomass up to the pyrolysis
plant)2. charcoal production3. charcoal transport (to be intended as transportation from the pyrolysis plant to the steel factory)
Figure 81 reports the contribution of these three various issues [19] to the global cost of charcoal.According to this Figure, charcoal cost is estimated with an order of magnitude of 400 /t, but about70% is due to the cost of biomass. Inside this cost is included cost for biomass production, cultivationor collection and transportation to the pyrolysis plant. In Figure 81, with the term transportation isintended only the delivery of produced charcoal from the production pyrolysis plant to the utilization lplant.
90
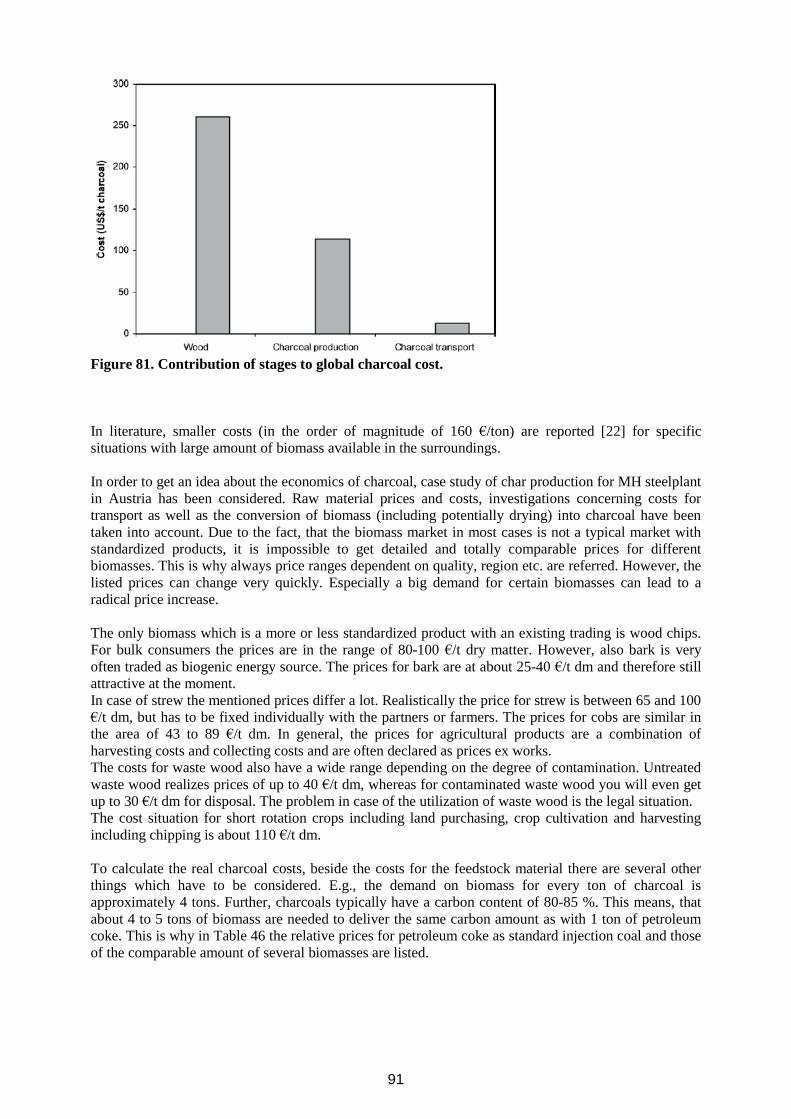
Figure 81. Contribution of stages to global charcoal cost.
In literature, smaller costs (in the order of magnitude of 160 /ton) are reported [22] for specificsituations with large amount of biomass available in the surroundings.
In order to get an idea about the economics of charcoal, case study of char production for MH steelplantin Austria has been considered. Raw material prices and costs, investigations concerning costs fortransport as well as the conversion of biomass (including potentially drying) into charcoal have beentaken into account. Due to the fact, that the biomass market in most cases is not a typical market withstandardized products, it is impossible to get detailed and totally comparable prices for differentbiomasses. This is why always price ranges dependent on quality, region etc. are referred. However, thelisted prices can change very quickly. Especially a big demand for certain biomasses can lead to aradical price increase.
The only biomass which is a more or less standardized product with an existing trading is wood chips.For bulk consumers the prices are in the range of 80-100 /t dry matter. However, also bark is veryoften traded as biogenic energy source. The prices for bark are at about 25-40 /t dm and therefore stillattractive at the moment.In case of strew the mentioned prices differ a lot. Realistically the price for strew is between 65 and 100/t dm, but has to be fixed individually with the partners or farmers. The prices for cobs are similar in
the area of 43 to 89 /t dm. In general, the prices for agricultural products are a combination ofharvesting costs and collecting costs and are often declared as prices ex works.The costs for waste wood also have a wide range depending on the degree of contamination. Untreatedwaste wood realizes prices of up to 40 /t dm, whereas for contaminated waste wood you will even getup to 30 /t dm for disposal. The problem in case of the utilization of waste wood is the legal situation.The cost situation for short rotation crops including land purchasing, crop cultivation and harvestingincluding chipping is about 110 /t dm.
To calculate the real charcoal costs, beside the costs for the feedstock material there are several otherthings which have to be considered. E.g., the demand on biomass for every ton of charcoal isapproximately 4 tons. Further, charcoals typically have a carbon content of 80-85 %. This means, thatabout 4 to 5 tons of biomass are needed to deliver the same carbon amount as with 1 ton of petroleumcoke. This is why in Table 46 the relative prices for petroleum coke as standard injection coal and thoseof the comparable amount of several biomasses are listed.
91

Material costs Annual demand Annual costs[%] [t/a] [%]
Petroleum coke 100 5400 100Wood chips 30 24300 135
Strew 26,7 24300 120Bark 10 24300 45Cobs 20 24300 90
Waste wood 3,3 24300 15Table 46 Cost comparison of different feedstock for injection coal
It is obvious, that in most cases even the raw material price for the biomass is nearly the same or evenhigher as the one for the standard injection coal, petroleum coke. Only really low priced biomass is aneconomically attractive alternative to fossil coke. However, the availability of such biomasses is not thebest one. Nevertheless, additionally to the feedstock prices also transportation costs, storage costsoperating costs of the carbonization plant etc. have to be considered. Table 47 shows a rough estimationfor total costs of injection chars of different origin, which are between 220 and 580 /t and therefore upto the double price of typical injection coals.
Raw material costs Transport Conversion costsStorage and
handling Total costs[ /t charcoal] [ /t biomass] [ /t charcoal] [ /t charcoal] [ /t]
Wood chips 405 10 150 15 580Strew 360 20 150 15 545Bark 135 15 150 15 315Cobs 270 20 150 15 455Waste wood 45 10 150 15 220Table 47 Cost comparison of total costs for charcoals from different origins
The range of costs for charcoal production individuated is in agreement with what reported in literature[19, 22]
Cost saving from reduction of CO2 emissionThe economical evaluation about to biomass utilizations needs to consider also the advantage derivingfrom the reduction of CO2 emissions.The CO2 sources from the EAF process are shown in Figure 82. The main proportion of the total CO2sources is provided by the injected/charged carbon. This calculation is tailored on the EAF of FerriereNord, but the order of magnitude can be considered valid for most of EAFs.
92

Figure 82 Percentage of CO2-sources of an EAF process
In oder to reduce the CO2 emission from the electric steel production, the main issue is to reduce thecoal consumption.
CO2 emissions are calculated with the mass balance approach that considers all the carbon entering andleaving the installation.The following formula is applicable for mass balance:
where:
EMmb emissions from all source streams included on the mass balance [ton CO2];f factor for converting the molar mass of carbon to CO2. The value is 3.664 tonCO2/tonC;i index for the material or fuel under consideration;ADi activity data of the material or fuel under consideration. Ingoing materials or fuels are taken
into account as positive, outgoing are taken into account as negative.CCi the carbon content of the component under consideration;
Figure 83 represents CO2 emissions for Ferriere Nord SPA for year 2011, a total amount of 92.804 tonsof CO2 have been generated. The specific emissions were 78 Kg of CO2 / ton of steel produced by EAF.
93
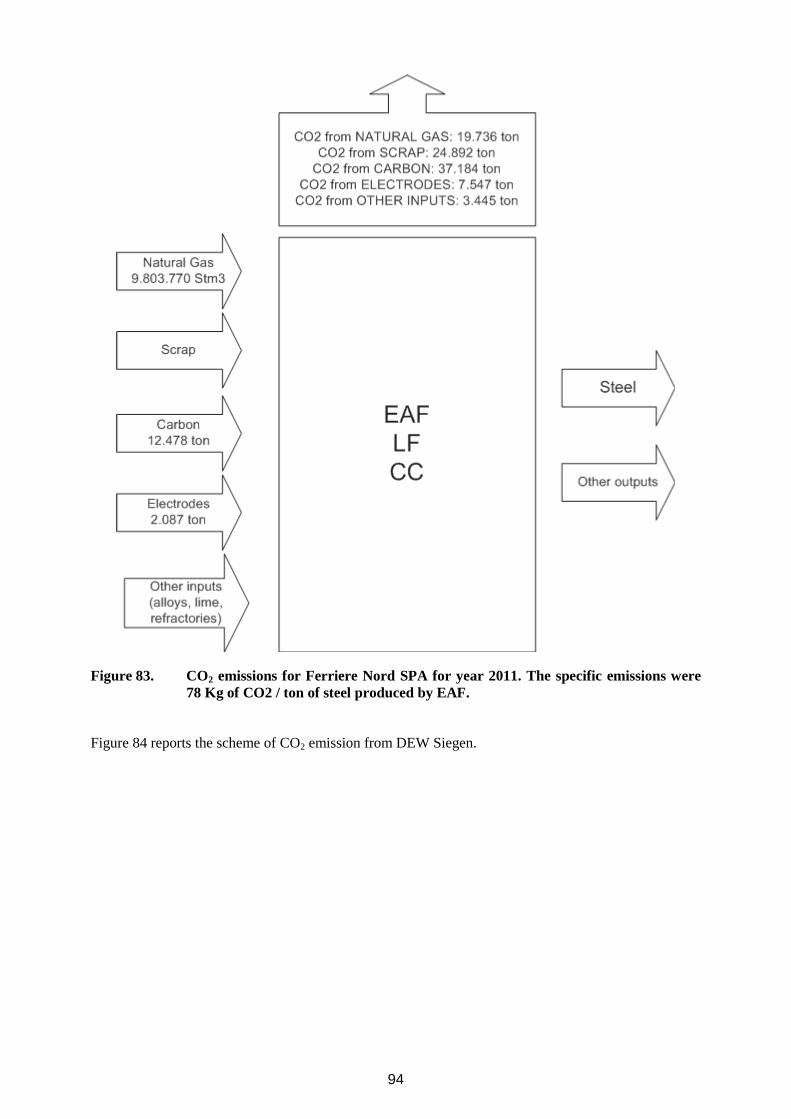
Figure 83. CO2 emissions for Ferriere Nord SPA for year 2011. The specific emissions were78 Kg of CO2 / ton of steel produced by EAF.
Figure 84 reports the scheme of CO2 emission from DEW Siegen.
94
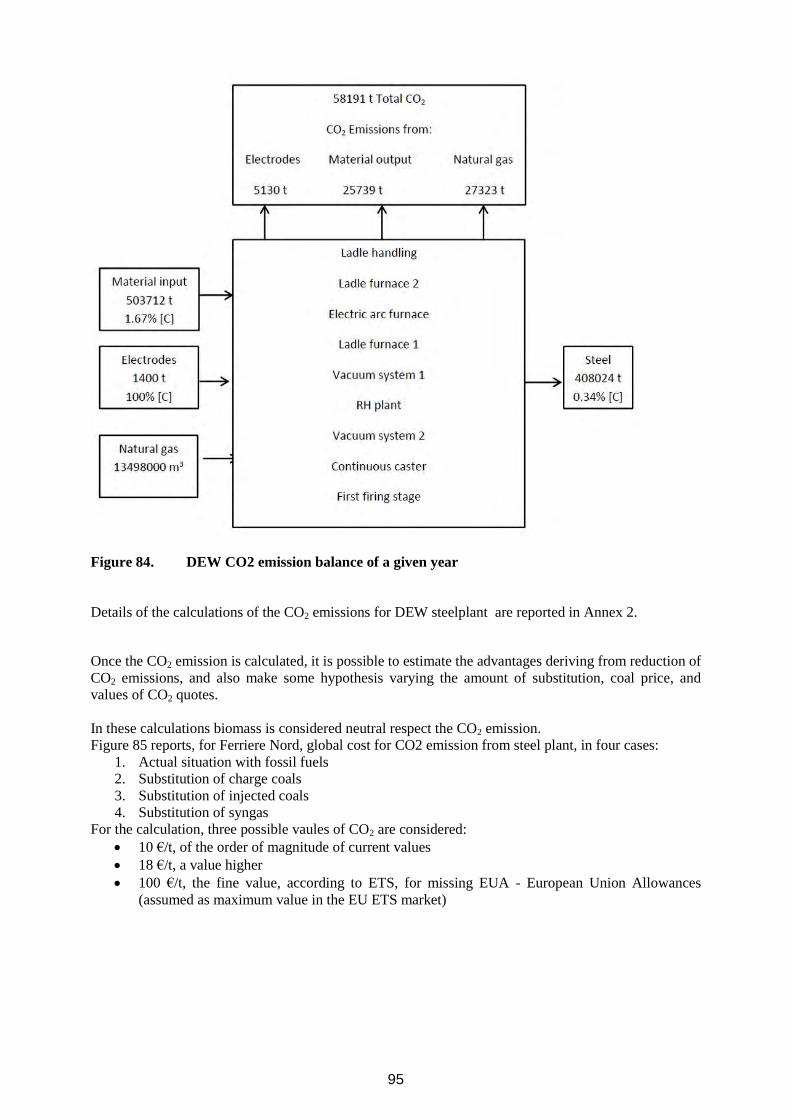
Figure 84. DEW CO2 emission balance of a given year
Details of the calculations of the CO2 emissions for DEW steelplant are reported in Annex 2.
Once the CO2 emission is calculated, it is possible to estimate the advantages deriving from reduction ofCO2 emissions, and also make some hypothesis varying the amount of substitution, coal price, andvalues of CO2 quotes.
In these calculations biomass is considered neutral respect the CO2 emission.Figure 85 reports, for Ferriere Nord, global cost for CO2 emission from steel plant, in four cases:
1. Actual situation with fossil fuels2. Substitution of charge coals3. Substitution of injected coals4. Substitution of syngas
For the calculation, three possible vaules of CO2 are considered:10 /t, of the order of magnitude of current values18 /t, a value higher100 /t, the fine value, according to ETS, for missing EUA - European Union Allowances(assumed as maximum value in the EU ETS market)
95

-
2.000.000
4.000.000
6.000.000
8.000.000
10.000.000
12.000.000
Fossil sources Total substitution ofcarbon in chargewith
biomass
Total substitution ofinjected carbonwith
biomass
Total substitution ofnatural gaswith syngas
Cost of CO2 emissions10 /ton CO2
18 /ton CO2
100 /ton CO2
Figure 85 Global cost for CO2 emission from steel plant (Ferriere Nord), in four cases:1.Actual situation with fossil fuels2.Substitution of charge coals3.Substitution of injected coals4.Substitution of syngas
Figure 86 reports the difference between the costs, calculated as a sum of supplying costs and CO2emission costs, using only fossil carbons and using biomass as a total substitute for carbon in chargeand injection, in seven different market conditions.
- 4.500.000
- 4.000.000
- 3.500.000
- 3.000.000
- 2.500.000
- 2.000.000
- 1.500.000
- 1.000.000
- 500.000
-
500.000
total substitution of carbon in charge withbiomass
total substitution of injected carbon withbiomass
10 /ton CO2170 /ton carbon200 /ton biomass
10 /ton CO2350 /ton carbon200 /ton biomass
10 /ton CO2170 /ton carbon50 /ton biomass
100 /ton CO2170 /ton carbon200 /ton biomass
10 /ton CO2350 /ton carbon50 /ton biomass
100 /ton CO2350 /ton carbon200 /ton biomass
100 /ton CO2350 /ton carbon50 /ton biomass
Figure 86 Difference between costs (supplying + CO2 emissions) using onlys fossil carbonsand using biomas as total substitute for carbon in charge and injection, in sevendifferent market conditions
96

The actual market conditions indicates that globally a small global cost increases can be expected, butrealistic future scenario indicate that an economical convenience in biomass utilization can be foreseen.
The diagram in Figure 87, calculated for MH steel plant, shows a rough overview about the necessaryCO2-prices to make a usage of biomass in form of charcoal economically attractive for the productionof steel in an electric arc furnace, considering a value of 170 /ton for coal.In the end, from the quantitative point of view, including the availability of biomass, and also thequalitative point of view, almost entirely woody biomass like wood chips are eligible feedstockmaterials for charcoal production. If this is the case, politically driven costs like CO2-taxes have to riseto a level of about 50-100 /t to make these CO2-neutral alternatives also economically competitive.
Figure 87 Necessary CO2-price for economical biomass utilization in electric steel production(calculated for MH steel plant)
Besides the increase of costs of CO2 certificates, the need to acquire CO2 quotes has been alsoconsidered. For example, the DEW in Siegen has an annual allocation of 48,150 CO2 certificate.Experience shows that, depending on the annual production output, more CO2 certificates would beneeded. This yields a missing quantity of about 10,000 CO2 certificates per year. In This case a partialsubstitution may be enough to avoid increases of costs. Following table reports, the global reduction ofCO2, depending on the amount of coal substitution.
Depending on the substitution, it is possible to reduce the total CO2 emissions by 19 %.
Substitution Operational CO2-Reduction Total Reduction[%] [%] [%]0 0 020 12 640 24 1360 36 19
Table 48. CO2-Reductions
In order to calculate the monetary value of the CO2 certificate, the highest spot market prices foremission allowances from 2008 to 2011 are being considered
97

A price of 18 – 35 is assumed for the year 2013, this lies above the average price in the last 3 years(16.40 ). The results of these calculations are summarized in Table 49. The case of non-substitutionwith bio carbon yields additional cost of about 181,000 to 351,000 . On the other hand, using 60%substitution could yield additional revenue between 18,000 and 37,000 .
SubstitutionCO2 allocated
certificatesCO2
certificates 18 25 35[%] [t] [t] [t]0 58,192 48,150 -10,042 -180,748 -251,038 -351,45420 54,493 48,150 -6,343 -114,173 -158,574 -222,00340 50,794 48,150 -2,644 -47,599 -66,109 -92,55360 47,096 48,150 1,054 18,976 26,355 36,898Table 49. Additional cost in the third trading period
Figure 88 shows the price variation as a result of substitution. Positive results are yielded from 54%Substitution.
Figure 88. Price Variation
This techno economic evaluation on the basis of the data from DEW Siegen shows for an exemplaryprice of 18 per ton of CO2 that the total savings for the steel plant by a replacement of 60 % of thecommon anthracite coal by biochar would be about 11,000 per year. Assuming a price of 35 per tonof CO2 that would mean even savings up to 388,000 per year.
These calculations are based on assumptions and the price for biochar is unaccounted. Up to now theredoes not exist an official market for biochar which can be used in steel mills. Most part of biocharproduction is still in pilot scale state. So the prices per ton of produced biochar are not representative.Industrial scale production and the development of different production processes for different qualitiesof biochar is currently under construction. In the next few years the industrial scale production ofdifferent biochar qualities is expected and according to this the development of a market and a marketprice.However, rising prices for additional CO2 certificates are expected for the future. In Addition to thatincreases of the prices for fossil coal are expected, too.
98

Moreover, in these evaluations possible savings from syngas can be considered. These project showedthe problems arising with syngas utilization in electric arc furnaces. Syngas can be used as fuel for othertype of furnace, as re-heating furnaces, or can be used for power generation, directly inside thepyrolysis plant.Another by-product from pyrolysis which can be used to save cost from biomass utilization is tar. Tarcan be mixed with charcoal itself as binding agent for char briquettes production, or can be sold aschemical.Syngas and tar utilization would increase the economical advantages from charcoal practice.
In general the use of biochar puts the electric steel mills in a position to avoid CO2 emissions which arerelevant for the EU ETS like the emissions from fossil carbon. Therefore, depending on prices forbiochar and its processing, the use of biochar instead of fossil carbon should, apart from the positiveecological effects, also have a positive effect on the economics of the electric steelmaking process.
99
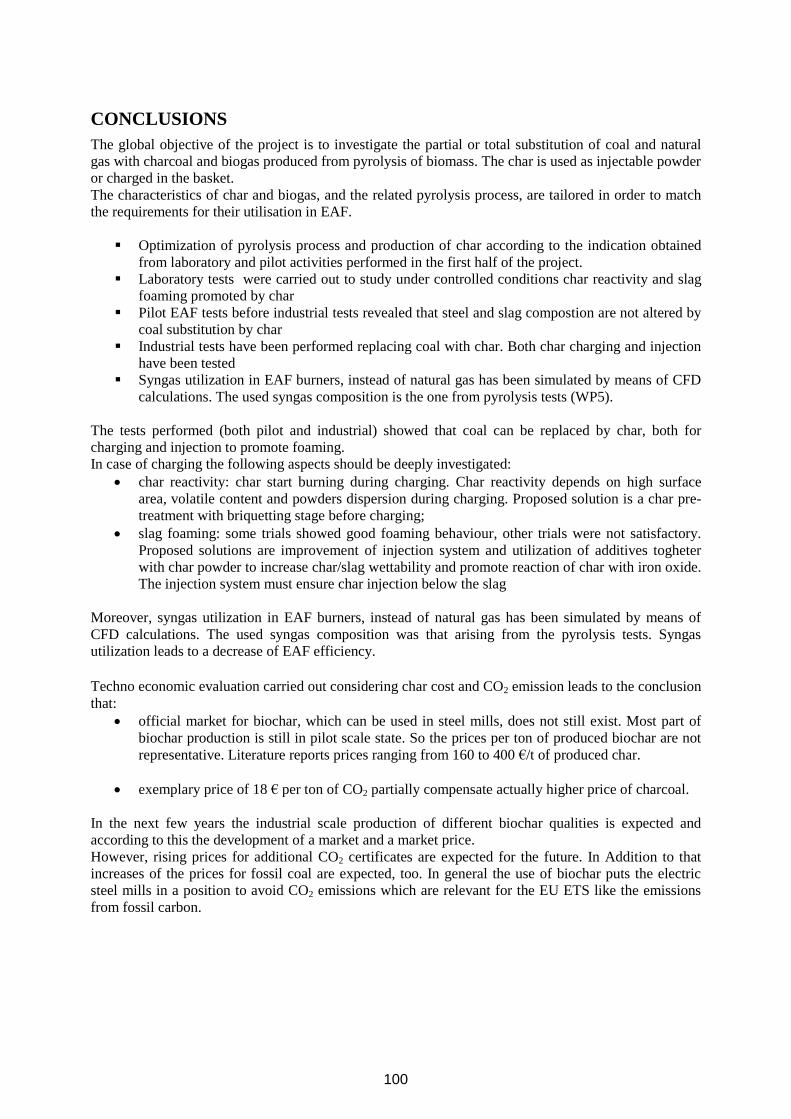
CONCLUSIONSThe global objective of the project is to investigate the partial or total substitution of coal and naturalgas with charcoal and biogas produced from pyrolysis of biomass. The char is used as injectable powderor charged in the basket.The characteristics of char and biogas, and the related pyrolysis process, are tailored in order to matchthe requirements for their utilisation in EAF.
Optimization of pyrolysis process and production of char according to the indication obtainedfrom laboratory and pilot activities performed in the first half of the project.Laboratory tests were carried out to study under controlled conditions char reactivity and slagfoaming promoted by charPilot EAF tests before industrial tests revealed that steel and slag compostion are not altered bycoal substitution by charIndustrial tests have been performed replacing coal with char. Both char charging and injectionhave been testedSyngas utilization in EAF burners, instead of natural gas has been simulated by means of CFDcalculations. The used syngas composition is the one from pyrolysis tests (WP5).
The tests performed (both pilot and industrial) showed that coal can be replaced by char, both forcharging and injection to promote foaming.In case of charging the following aspects should be deeply investigated:
char reactivity: char start burning during charging. Char reactivity depends on high surfacearea, volatile content and powders dispersion during charging. Proposed solution is a char pre-treatment with briquetting stage before charging;slag foaming: some trials showed good foaming behaviour, other trials were not satisfactory.Proposed solutions are improvement of injection system and utilization of additives togheterwith char powder to increase char/slag wettability and promote reaction of char with iron oxide.The injection system must ensure char injection below the slag
Moreover, syngas utilization in EAF burners, instead of natural gas has been simulated by means ofCFD calculations. The used syngas composition was that arising from the pyrolysis tests. Syngasutilization leads to a decrease of EAF efficiency.
Techno economic evaluation carried out considering char cost and CO2 emission leads to the conclusionthat:
official market for biochar, which can be used in steel mills, does not still exist. Most part ofbiochar production is still in pilot scale state. So the prices per ton of produced biochar are notrepresentative. Literature reports prices ranging from 160 to 400 /t of produced char.
exemplary price of 18 per ton of CO2 partially compensate actually higher price of charcoal.
In the next few years the industrial scale production of different biochar qualities is expected andaccording to this the development of a market and a market price.However, rising prices for additional CO2 certificates are expected for the future. In Addition to thatincreases of the prices for fossil coal are expected, too. In general the use of biochar puts the electricsteel mills in a position to avoid CO2 emissions which are relevant for the EU ETS like the emissionsfrom fossil carbon.
100
REFERENCES
1. Ulcos ULCOS Periodic activity report – 5th year2. R. Teodoro da Costa and F. Mayrink Morais: Charcoal, renewable energy source for steelmaking
process. Rev. Met. Paris, N°5 (May 2006), pp. 203-2093. Biomass sustainability La Revue de Métallurgie - CIT - Octobre 20094. H. Pfeifer, M. Kirschen and J.P. Simoes, Thermodynamic Analysis of EAF Electrical Energy
Demand, Proc. 8th European Electric Steelmaking Conference Birmingham, May 9-11 (2005), pp.211–232
5. Cedric Briens, Jan Piskorz, Franco Berruti: Biomass Valorization for Fuel and ChemicalsProduction -- A Review. International journal of chemical reactor enegineering, Vol 6, January2008
6. G. Chen, J. Andries, Z. Luo, H. Spliethoff: Biomass pyrolysis/gasification for product gasproduction: the overall investigation of parametric effects. Energy Conversion and Management;Volume 44, Issue 11, July 2003, Pages 1875-1884
7. Karin Ericsson_, Lars J. Nilsson: Assessment of the potential biomass supply in Europe using aresource-focused approach. Biomass and Bionergy, 30 (2006) 1–15
8. E. Alakankas, A.Heikkinen, T. Lensu, P. Vesterinen: Biomass Fuel Trade in Europe, summaryreport VTT-R-03508-07, March 2007
9. E. Alakankas, A.Heikkinen, T. Lensu, P. Vesterinen: Biomass Fuel Trade in Europe, summaryreport VTT-R-03508-07, March 2007
10. Integrated Pollution Prevention and Control (IPPC) – Best Available Techniques ReferenceDocument on the Production of Iron and Steel – December 2001; http://eippcb.jrc.ec.europa.eu
11. F. Lucia: Thesis, potenzialita’ dei biocombusibili solidi nelle Province italiane: metodologia estima. Università di Napoli, 2004
12. G. Fiorese, M.Gatto, G. Guariso; 14° conference of Italian society of ecology, October 200413. S. Pasini: “Agroenergie e nuove opportunita’ di Sviluppo in sinergia con il territorio “; Rovigo, 19
marzo 200814. Di Donato, A.; Martini, U.; Kleimt, B.; Zisser, S.; Pfeifer, H.; Kirschen, M.; Velikorodov, V.;
DeMiranda, U.; Schöring, M.; Siig, J.; Wahlers, F. J.: Development of operating conditions toimprove chemical energy yield and performance of dedusting in airtight EAF. ECSC project 7210-PR/328, Final Report. 2006
15. Improved EAF process control using on-line offgas analysis. 12RFCS-CT-2006-00004, project inprogress
16. H. Goodfellow, D. Zuliani, M. Bianchi Ferri: Holistic Optimization of EAF Furnaces - Past,Present and Future. 9th European Electric Steelmaking Conference, Krakow, Poland; May 2008
17. F.Bindi: Thesis, “A techno-economic assessment of the power production by biomass slowpyrolysis through real case study”. Università La Sapienza di Roma, a.a. 2006/2007
18. Chen, J.-Y. (1988). A General Procedure for Constructing Reduced Reaction Mechanisms withGiven Independent Relations, Combust. Sci. Technol., 57, 89-94.
19. Chen J.-Y. (1997). Development of Reduced Mechanisms for Numerical Modelling of TurbulentCombustion. CERMICS-ENPC Cite Descartes - Champus sur Marne, France 1997.
20 F. Magnussen: On the Structure of Turbulence and a Generalized Eddy Dissipation Concept forChemical Reaction in Turbulent Flow; 19th AIAA Meeting, St. Louis, 1981.
21 T. Norgate, D. Lanberg, Environmental and Economic Aspects of Charcoal Use in Steelmaking, ISIJInternational, vol 49 (2009), No. 4, pp 587-595
22 A. Fallot et al, Biomass sustainability, availability and productivity, la Revue de Metallurgie, CIT,October 2009
23 DE CASTRO, L.-F.-A.; TAVARES, R.-P.: Charcoal blast furnaces process control, Proc. ofAssociation of Iron and Steel Technology Conference, Nashville, USA, September 2004, P. 1.459-1.46724 LOVEL, R.-R.; VINING, K.-R.; DELL´AMICO, M.: The influence of fuel reactivity on iron
ore sintering, ISIJ international, 49 (2009), P. 195-202 OLSEN, S.E.; TANGSTAD, M.;LINSTAD, T.: Production of manganese ferroalloys, Sintef and tapis academic press,Trondheim, Norway, 2007
101

25 Krassnig, H.-J., H. Sommerauer, H. Fohringer, R. Krump und Ch. Koubek: Optische Detektionund Regelung der Schaumschlackenhöhe am Elektrolichtbogenofen, Stahl und Eisen (2011),Heft 10
26 Thermocalc
102
EXPLOITATION AND IMPACT OF THE RESEARCH RESULTS
Application: the project results can be applied in all EAFs. Project results that coal substitution by charis feasible: the steel, slag and furnace operating parameters are not modified significantly. Also theabsence of environmental increase of pollution due to char has been verified. The utilization of char ascharge material, on a routine basis needs industrial experimentation to optimize the operating practices.The application as foaming agent (injection) needs also further experimentation to stabilize the foamingprocess and modify the injection system and injection practice in general.
Advantages: char eliminate the dependency from fossil coal and reduces the CO2 emissions.
Patent: project results can not be transformed into a patent. The eventual modification of the injectionsystem may be protected by a patent, but further research activities is necessary and also subsequentindustrial validation is necessary
Publications: during the project have been produced five publications.
Other aspects: the possibility to use char form biomass to replace fossil coal is strongly related to thelocal availability of biomass. The availability of biomass in the surrounding of the steel plant, and thereduce of the CO2 emission increase the economicity of this technology.Moreover the utilization and transformation of biomass into charcoal can generate new localeconomies.
103

LIST OF SYMBOLS AND ABBREVIATIONSBCB biochar briquettesCSM Centro Sviluppo Materiali SpA - partnerDEW Deutsche Edelstahlwerke GmbH, Deutsche Edelstahlwerke, - partnerFENO Ferriere Nord - coordinatorHHV higher heating valueIP Imperial College - partnersLHV lower heating valueMH Stahl- und Walzwerk Marienhütte Ges. m. b. h.- partnerRC reference coalRWTH Rheinisch Westfälische Technische Hochschule Aachen, - partnerTG termogravimetric apparatus
LIST OF FIGURES
Figure 1. (a) Gross consumption of renewable energy sources in Austria in the year 2003(b) Biomass potential in Styria
Figure 2. Scheme of laboratory termogravimetric (TG) apparatus
Figure 3. Example of thermogravimetric tests under temperature gradient and constanttemperature
Figure 4. Pyrolysis reactor based on a Gray King Furnace
Figure 5. Char yields (as percentage of the original biomass in dry ash free basis) in the pyrolysisof beechwood in a Gray-King reactor as a function of temperature for three ranges ofparticle size.
Figure 6. Char, gas and tar yields as a percentage of the original biomass (dry basis) in pyrolysisof miscanthus (particle size range: 0.212-0.5 mm) in a Gray-King reactor as a functionof temperature.
Figure 7. Char yield as a percentage of the original biomass (dry basis) as a function oftemperature (°C) in experiments conducted in the Gray-King reactor. Three biomasssamples were used: Corn Stalk (CS), Sorghum (SO) and Switchgrass (SW).
Figure 8 Optical image of char sample from grapewine, after tests at 600 and 500°C
Figure 9 Grain size distribution of char samples
Figure 10 Light-optical microscope image of unprocessed grape seed char (magnification 20x)
Figure 11. Light-optical microscope image of grape seed char after short processing in mortar(magnification 200x)
Figure 12. Light-optical microscope image of grape seed char after short milling (magnification200x)
Figure 13. Gas concentration measured by mass spectrometer and Ar normalised.
104
Figure 14. Heating values of syngas and char obtained in the same TG test
Figure 15. TGA non-isothermal char reactivity tests of beechwood chars produced in the Gray-King reactor. Curves of fraction of remaining weight for the different chars andtemperature as a function of time are shown.W: measured weight; W0: starting weight
Figure 16. TGA proximate analysis of raw beechwood and beechwood chars produced in theGray-King reactor. Curves of fraction of remaining weight of the different chars andtemperature as a function of time are shown.
Figure 17. TGA proximate analysis of raw miscanthus and miscanthus chars produced in theGray-King reactor. Curves of fraction of remaining weight of the different chars andtemperature as a function of time are shown.
Figure 18. TGA proximate analysis of grapeseed char produced at Tecnocentro. Curves of fractionof remaining weight of the grapeseed char and temperature as a function of time areshown.
Figure 19. TGA proximate analysis of coal samples currently used at Ferriere Nord. Curves offraction of remaining weight of the grapeseed char (as percentage of initial biomass,left axis) and temperature (ºC, right axis) as a function of time are shown. Coal A:metallurgical coke; Coal B: injected coal (fine particles); Coal C: injected coal (coarseparticles); Coal D: anthracite loaded in the basket.
Figure 20. The atmospheric pressure wire mesh reactor.
Figure 21. Char yield (as a percentage of initial sample weight in dry, ash free basis) as a functionof holding time in wire mesh reactor experiments with CO2 as carrier gas atatmospheric pressure, heating rate of 1,000°C/s and peak temperature of 850°C. CoalA: metallurgical coke; Coal B: injected coal (fine particles); Coal C: injected coal(coarse particles); Coal D: anthracite loaded in the basket.
Figure 22. Char yield (as a percentage of initial sample weight in dry, ash free basis) as a functionof holding time in wire mesh reactor experiments with CO2 as carrier gas at atmosphericpressure, heating rate of 1,000°C/s and peak temperature of 850°C.
Figure 23. Factors influencing the foamy slag formation
Figure 24. Scheme of the demonstrative plant used by Tecnocentro to design industrial pyrolysistests
Figure 25. Enerpol pyrolysis plant (Tecnocentro)
Figure 26. Syngas composition obtained during preliminary pyrolysis test at 550°C, with rotatingspeed of 3 rpm
Figure 27. General view of the EAF with the position of the installed burners
Figure 28. Viscosity of starting and modified slag. Viscosity is calculated with Urbain model [9].
Figure 29. Specific amounts of carbon used at DEW (2006-2009)
Figure 30. Optical Foaming Slag Management (OFSM)
Figure 31. Crucible filled with slag and carbon mixture (left) and crucibles in the furnace (right)
105
Figure 32 Slag foaming with injection coal from FENO (left) and DEW (right)
Figure 33. Slag foaming trials with grape seed char
Figure 34 Sequence of the slag-carbon-reaction with different carbonaceous materials as a subjectto the temperature (at the upper right corner in each picture)
Figure 35 Comparison of the foaming height with different carbonaceous materials
Figure 36 Pictures from the video recording of the slag foaming trials in a lab furnace; CObubbles (dark spot with arrow)
Figure 37. Pilot Arc Furnace (left) and schematic representation (right)
Figure 38. Biochar from Tecnocentro (left); Biochar from wood gasification plants (right)
Figure 39. Results from ash analysis of biochar from wood gasification plants.
Figure 40. 1.6 kg of biochar fines (left) and 1 kg of anthracite coal (right)
Figure 41. Lancing operation of coal and oxygen (left) and IOB pilot lancing system (right)
Figure 42. Steel composition after pilot trials
Figure 43. Slag compositions of pilot furnace trials
Figure 44. First agglomeration tests (a-c)
Figure 45. Comparison of green strength and strength after 3 days of drying
Figure 46. Biochar briquette (left) and anthracite coal (right)
Figure 47. Grain size distributions (left) and mass fractions (right) after vibrating sieve tests
Figure 48. Grain size distributions (left) and mass fractions (right) after drop tests
Figure 49. Crucible of pilot furnace charged with a first scrap layer and biochar briquettes (BCB)
Figure 50. Steel compositions of BCB and RC trials
Figure 51 (a) Slag compositions of BCB and RC trials(b) P2O5 content of BCB and RC slag
Figure 52. Off gas composition using anthracite coal
Figure 53. Off gas composition using biochar from Tecnocentro
Figure 54. Off gas composition using biochar from wood gasification plants
Figure 55. BCB Off gas composition using biochar briquettes (BCB)
Figure 56 Semi industrial briquettes production
Figure 57 Improvement of char injection: (a): installing a lance for under slag injection; (b) usinga double jet for slag penetration
106
Figure 58. Charging of biochar fines at DEW Siegen
Figure 59. Slag analysis of reference and biochar charge (left) and basicity (right)
Figure 60. Steel analysis of reference and biochar charge
Figure 61. Secondary injection system for biochar fines
Figure 62. Charging the injection machine at DEW Siegen
Figure 63. Slag composition of biochar trials
Figure 64. Slag basicity of biochar trials
Figure 65. Problems occurring while using biochar fines as injection coal
Figure 66. Electric Arc Furnace and Injection Equipment at MH EAF.
Figure 67. Video images of Injection tests with different char samples
Figure 68. EAF cycle of injection Test A
Figure 69. Slag Index detected by the OFSM system
Figure 70. slag foaming mechanism using char
Figure 71. Scheme of burner currently used at FENO steelplant
Figure 72. Boundary conditions used for CFD calculations
Figure 73. Calculation of the burning efficiency, for the three working conditions with natural gas.
Figure 74. Comparison of flame temperature in case of natural gas and syngas burning.
Figure 75. Difference of efficiency of burner in case of natural gas (NG) and syngas
Figure 76. Flame aspect and temperature in case of feeding with syngas the current burner, aburner modified with swirl motion on oxygen and swirl motion on oxygen and syngas.
Figure 77. Points of off gas measurement
Figure 78. Off gas composition of an exemplary reference charge
Figure 79. Off gas composition of biochar charge
Figure 80. Schematic flowsheet of charcoal production
Figure 81. Contribution of stages to global charcoal cost.
Figure 82. Percentage of CO2-sources of an EAF process
Figure 83. CO2 emissions for Ferriere Nord SPA for year 2011. The specific emissions were 78Kg of CO2 / ton of steel produced by EAF.
Figure 84. DEW CO2 emission balance of a given year
Figure 85 Global cost for CO2 emission from steel plant (Ferriere Nord), in four cases:
107

1. Actual situation with fossil fuels2. Substitution of charge coals
3. Substitution of injected coals4. Substitution of syngas
Figure 86 Difference between costs (supplying + CO2 2missions) using onlys fossil carbons andusing biomas as total substitute for carbon in charge and injection, in seven differentmarket conditions
Figure 87 Necessary CO2-price for economical biomass utilization in electric steel production (calculatedfor MH steel plant)
108
LIST OF TABLES
Table 1 Friuli Biomass amount and potential energy availability [1,2,3]
Table 2. Cultivated ligneous biomass (Dendro mass) availability in Arnsberg district and NRW[13]
Table 3. Agricultural residues availability in NRW compared with availability in Germany [14]
Table 4 Main advantages/disadvantages of considered biomasses
Table 5. Physico-chemical characterization of selected biomasses. Moisture content ranges form10-12 % in all the samples
Table 6. Biomas ashes composition
Table 7 Results of laboratories thermogravimetric tests
Table 8. Char characteristics after test at 500°C, duration 700s, for the four biomasses tested(carried out by CSM; RWTH, DEW).(*) Grapeseed Ash chemical composition by DEW/RWTH
Table 9. Heating values of chars obtained from four different biomasses at three temperatures
Table 10. Composition (%) and LHV of char and syngas as a function of temperature, formischantus.
Table 11. Characteristics of coals currently used by industrial partners
Table 12. Characteristics of fossil carbon and charcoal [23,24]
Table 13. Char and gas percentage produced after different pyrolysis campaigns
Table 14. Syngas composition, obtained with sorghum, at the pyrolysis temperature of 600°C.
Table 15. Char characteristics obtained with forest residues (underbrush) and grapewine.
Table 16 Energy input of and chemical energy distribution of EAF of Ferriere Nord
Table 17 Chemical energy distribution of EAF of Ferriere Nord
Table 18 Mass Balances to estimate biomass necessary to replace coal in Electric Furnace ofFerriere Nord.
Table 19. Mass (kg) of formed ashes which derives from char charge and injection. Data refers tosingle heat
Table 20. Starting slag composition and the modification with ashes
Table 21. Estimation of Cl presence into fumes and comparison with acceptability range of BATs[10]
Table 22. Annual carbon and biomass demand at DEW Siegen EAF
109
Table 23. Composition of foamy slag at DEW Siegen EAF
Table 24. XRF analysis of the slag used for foaming trials
Table 25. Oxides species composition derived from X ray analysis
Table 26. Results of slag foaming trials
Table 27 Reactivity, specific surface area and pore volume of the tested materials
Table 28. Composition of different biochar and reference materials
Table 29. First conducted trials at pilot plant
Table 30. Produced and tested blends for agglomeration tests
Table 31. Chemical composition of biochar briquettes from wood gasification
Table 32. Main characteristics of the electric furnaces of the industrial partners participating to the project.
Table 33 Trials and standard heats with steel analysis after EAF cycle (average values measuredduring test heats are compared with average values of standard heats)
Table 34 Values of offgas compostion measured during industrial trials at Ferriere Nord
Table 35. Results of the briquetting tests at Ferriere Nord.
Table 36 Characteristics of char briquettes used in the second testing campaign at FENO,compared with char used in this project
Table 37. (a) Slag composition variation(b) Variation of offgas composition during industrial trials with char at FENO
Table 38 Variation of main production parameters recorded during industrial trials with char atFENO
Table 39. Feedstock quantities of the reference charge
Table 40. Feedstock quantities of biochar charge
Table 41. Feedstock of trial charges using biochar as injection coal
Table 42. Slag analysis after char injection tests at MH
Table 43. Technical data off gas analyzers
Table 44. Operating data of an exemplary reference charge
Table 45. Operating data of biochar charge
Table 46 Cost comparison of different feedstock for injection coal
110

Table 47 Cost comparison of total costs for charcoals from different origins
Table 48. CO2-Reductions
Table 49. Additional cost in the third trading period
111

ANNEX 1- SLAG FOAMING
By creating a foamy slag the following main benefits can be achieved: improvement of the heattransfer, better arc stability, and protection of refractory material inside the furnace. Because of betterarc stability and less radiation losses, foaming slag practice leads to reductions in energy consumption,electrode, consumption, noise level, and an increase in productivity. The foaming capability of the slagdepends on several parameters. The relationship of most important parameters is shown in Figure A1.
Figure A1 Parameters affecting the foaming capability [18]
The melting of scrap necessarily generates slag with a high level of silica from soil or sand inevitablyadhering to the scrap surface. Sulphur and phosphorus are usually present in the scrap as well. Toreduce their transfer to the steel it is necessary to employ a basic slag by adding lime and/or dolomite.Good foaming capabilities can be achieved with a basicity CaO/SiO2 between 2 and 2.5.Desulphurization and dephosphorization are the main metallurgical tasks for the slag. For example highsulphur contents in the scrap/melt requires an higher amount of lime and carbon as well as higherenergy consumption and processing time. Slag is foamed by the rising of CO bubbles from the bath orthe generation of such bubbles directly in the slag. The generation scheme is illustrated in Figure A2.
112

Figure A2 Process of elaboration of foamy slag [19]
During the initial foaming period the carbon content predominantly determines the process ofgeneration a foamy slag. This carbon content of the melt depends on the different scrap grades chargedto the furnace. To keep the C-content within the desired range for each single melt a constant mixture ofdifferent scrap grades has to be obtained. According to the scrap mixture the necessary carbon is to beinjected or added as lump coke. In the second period carbon is injected in to the slag to reduce FeO andto create CO bubbles leading to a further increase of the slag height.
113

ANNEX 2CALCULATION OF CO2 EMISSIONS FROM DEW STEELPLANT
According to Figure 80, the electrode and stock input are considered as operational (process related)CO2 emission. The calculation of operational CO2 emissions of the electrodes is done according toequation (1.1). The operational CO2 emission is the product of the annual electrode consumption, theemission factor and reaction factor of the electrodes.
2C, Electrodes CO ,Electrodesm *conversion factor m (0.1)
2CO ,Electrodesm 1400t*3.667 5130t
For the process of steel production in the electric steel plant, the entire operational annual CO2 emissionon the raw material input, as well as a carbon balance for the input and output of carbon on scrap, steeland other materials are calculated according to equation (7.4).
2material input Stahl CO ,Outputm * C % m * C % *conversion factor m (0.2)
2CO ,Outputm 503712 t* 1,67% 408024 t* 0.34% *3.667 25739 t
The monthly material consumption is listed in Table below. The material input includes scrap, alloys,coal and slag former. The material input yields an average of 1.67% for C-concentration value per year.According to DEW, the average C- concentration value for produced steel is 0.34%.
Material Input C in Input Portion[kg] [kg] [%]
January 48,996,019 786,237 1.60%February 49,602,327 854,427 1.72%March 34,436,328 517,907 1.50%April 50,149,661 828,786 1.65%May 47,005,128 794,885 1.69%June 49,197,936 813,560 1.65%July 42,702,569 732,714 1.72%August 43,945,440 734,344 1.67%September 38,452,922 671,336 1.75%October 31,214,081 551,218 1.77%November 28,045,043 466,197 1.66%December 39,964,360 682,265 1.71%Total 503,711,814 8,433,876 1.67%
C-concentration per batch
The annual energy related CO2 emissions of the combustion are the product of the fuel consumption,the net calorific value, the calorific value related emission factor and the oxidation factor of the fuel.
2natural gas CO , natural gasV * net calorific value * conversion factor m (0.3)
114

2
3 2CO , natural gas 3
COkWhm 13498000 Nm * 10.121 * 0.2 kg 27323 tNm kWh
For the case of substitution the operational CO2 emissions and the total CO2 emissions are calculated onthe basis of the available process data: A production quantity of 60% carbon steel and 40% stainlesssteel is considered in this example.
Carbon Steel:
503712 t* 1.67% * 100% 60% 408024 t* 0.34% *3.667* 60% 4347t
Stainless steel
503712 t* 1.67% 408024 t* 0.34% *3.667*(40%) 10295 t
The dependency of the balance of CO2 emissions is shown in table below.
Substitution StructuralSteel
Stainlesssteel Electrodes Natural gas CO2
[%] [t] [t] [t] [t] [t] [t]0 15,443 10,295 5,130 30,869 27,323 58,19220 11,745 10,295 5,130 27,170 27,323 54,49340 8,046 10,295 5,130 23,471 27,323 50,79460 4,347 10,295 5,130 19,773 27,323 47,096The balance of CO2 emissions
115


European Commission EUR 26208 — Sustainable EAF steel production (GREENEAF) Luxembourg: Publications Office of the European Union 2013 — 115 pp. — 21 × 29.7 cm ISBN 978-92-79-33614-0doi:10.2777/44502
117


EUROPEAN COMMISSION Directorate-General for Research and Innovation Directorate G — Industrial Technologies Unit G.5 — Research Fund for Coal and Steel
E-mail: [email protected] [email protected]
Contact: RFCS Publications
European Commission B-1049 Brussels
HOW TO OBTAIN EU PUBLICATIONS
Free publications: • one copy:
via EU Bookshop (http://bookshop.europa.eu);
• more than one copy or posters/maps: from the European Union’s representations (http://ec.europa.eu/represent_en.htm); from the delegations in non-EU countries (http://eeas.europa.eu/delegations/index_en.htm); by contacting the Europe Direct service (http://europa.eu/europedirect/index_en.htm) or calling 00 800 6 7 8 9 10 11 (freephone number from anywhere in the EU) (*). (*) The information given is free, as are most calls (though some operators, phone boxes or hotels may charge you).
Priced publications: • via EU Bookshop (http://bookshop.europa.eu).
Priced subscriptions: • via one of the sales agents of the Publications Office of the European Union
(http://publications.europa.eu/others/agents/index_en.htm).
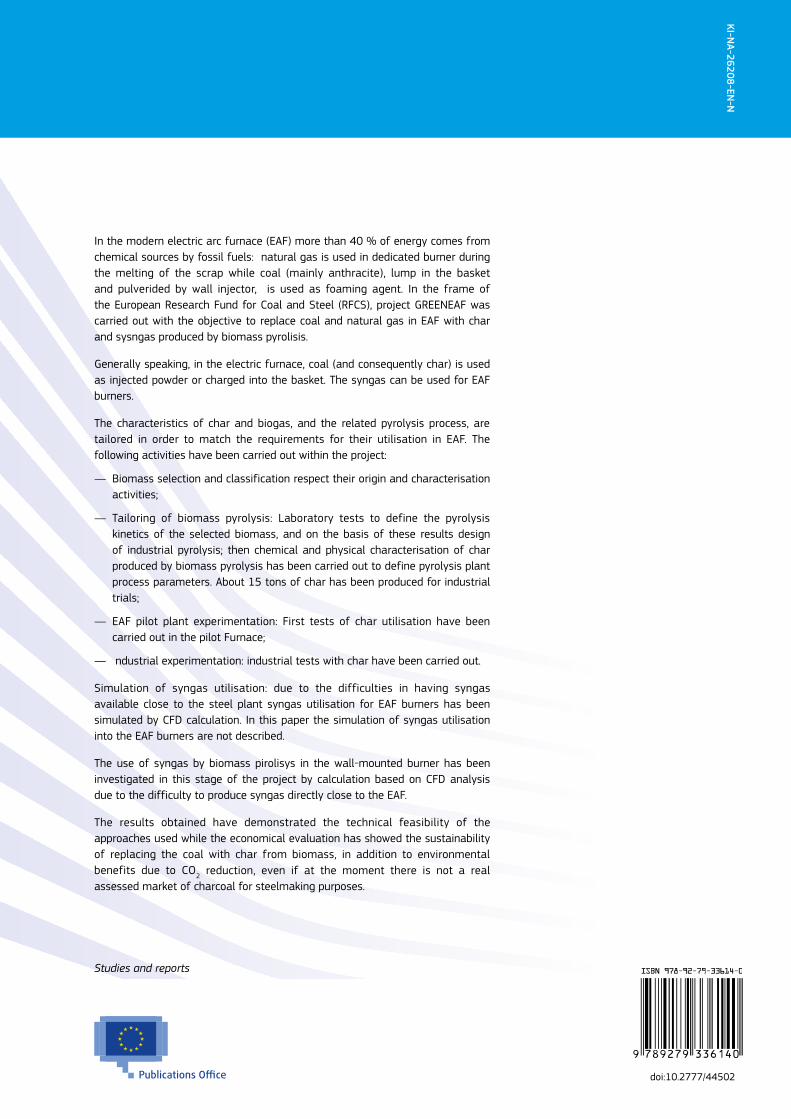
Sustainable EAF steel production
(GREENEAF)
doi:10.2777/44502
Sustainable EAF steel production (GREEN
EAF)EU
EUR 26208
KI-NA-26208-EN
-N
In the modern electric arc furnace (EAF) more than 40 % of energy comes from chemical sources by fossil fuels: natural gas is used in dedicated burner during the melting of the scrap while coal (mainly anthracite), lump in the basket and pulverided by wall injector, is used as foaming agent. In the frame of the European Research Fund for Coal and Steel (RFCS), project GREENEAF was carried out with the objective to replace coal and natural gas in EAF with char and sysngas produced by biomass pyrolisis.
Generally speaking, in the electric furnace, coal (and consequently char) is used as injected powder or charged into the basket. The syngas can be used for EAF burners.
The characteristics of char and biogas, and the related pyrolysis process, are tailored in order to match the requirements for their utilisation in EAF. The following activities have been carried out within the project:
— Biomass selection and classification respect their origin and characterisation activities;
— Tailoring of biomass pyrolysis: Laboratory tests to define the pyrolysis kinetics of the selected biomass, and on the basis of these results design of industrial pyrolysis; then chemical and physical characterisation of char produced by biomass pyrolysis has been carried out to define pyrolysis plant process parameters. About 15 tons of char has been produced for industrial trials;
— EAF pilot plant experimentation: First tests of char utilisation have been carried out in the pilot Furnace;
— ndustrial experimentation: industrial tests with char have been carried out.
Simulation of syngas utilisation: due to the difficulties in having syngas available close to the steel plant syngas utilisation for EAF burners has been simulated by CFD calculation. In this paper the simulation of syngas utilisation into the EAF burners are not described.
The use of syngas by biomass pirolisys in the wall-mounted burner has been investigated in this stage of the project by calculation based on CFD analysis due to the difficulty to produce syngas directly close to the EAF.
The results obtained have demonstrated the technical feasibility of the approaches used while the economical evaluation has showed the sustainability of replacing the coal with char from biomass, in addition to environmental benefits due to CO2 reduction, even if at the moment there is not a real assessed market of charcoal for steelmaking purposes.
Studies and reports
Research and Innovation EUR 26208 EN