sustainable management systems for unimproved neutral
TRANSCRIPT

Sustainable Management Systems for Unimproved Neutral Grassland
BD1460 final report
Report to Defra, Autumn 2013
Institute of Grassland and Environment Research (IGER)
North Wyke Research

1
Sustainable Management Systems for Unimproved Neutral Grassland BD1460 final report
Introduction
Background Project BD1460 was designed to build on the experimental findings of BD1440 (see BD1440 final report, submitted to Defra in 2005) and use the infrastructure that had been established in BD1440. BD1440 had been established on agriculturally unimproved species-rich neutral/mesotrophic grassland that had no history of inorganic fertilizer inputs and had been under extensive management principally involving hay cutting and/or grazing in the years immediately prior to the start of that experiment. The main objective of BD1440 was to determine the appropriate severity of grazing, by growing beef cattle, to maintain or enhance the abundance of positive indicator plant species of high nature conservation value and control pernicious weed abundance in such neutral grassland. The grazing treatments were: severe, moderate or lenient intensities of continuous grazing where mean sward heights of 6-8cm, 8-10 cm or 10-12 cm, respectively, were maintained over the growing season. Over the five year course of BD1440 positive indicator abundance remained at a low level and the cover of competitive plant species and pernicious weed cover increased across all grazing treatments. Functional shifts in the plant communities, as indicated by changes in the Ellenberg nutrient indicator (Ellenberg, 1988; Hill et al., 1999) score, suggested that there had been a general increase in nutrient availability across all grazing intensities. Increased nutrient availability was also indicated by changes in total nitrogen content in the surface horizon of the soil. It was contended that the changes in botanical composition were likely to be due, at least partly, to the change in management of the grasslands from a former hay cutting regime. It is well established that grazing enhances phosphorus (P) cycling (Harrison, 1978) and nitrogen (N) cycling in grassland systems (Floate, 1970). It is also contended that start of grazing in the spring is likely to have promoted nutrient cycling early in the growing season through dung and urine returns and physical disturbance of the soil surface. The use of continuous grazing will have maintained the availability of nutrients through these cycling processes. The change of management together with grazing induced soil nutrient cycling processes are likely to have provided an advantage to the more competitive and grazing tolerant species within the grassland over more stress tolerant species. In light of these observed changes in the plant community the following hypotheses were put forward for testing in BD1460: 1. Initiation of grazing early in the growing season promotes early availability of N in agriculturally unimproved grassland. 2. Lack of disturbance of grassland in early summer associated with closing for a hay cut reduces N availability early in the growing season in agriculturally unimproved grassland. It is probable that most lowland grassland under Environmental Stewardship agreement is likely to be managed primarily as pasture in the foreseeable future, because of practical and physical constraints on hay making. It is therefore axiomatic that research needs to be designed to ensure that ES objectives of grassland biodiversity maintenance/enhancement are met in the long-term. The changes in plant species-richness and positive indicator cover were not linear over the course of BD1440; species richness was maintained under the moderate and lenient grazing intensity treatments up to the third year of the experiment, which indicated that there could have been a tipping point or level of tolerance by the plant communities to the repeated grazing managements. It was, therefore, hypothesized that in order to maintain the plant diversity interests of such neutral grassland there should be a more dynamic approach to its management involving periodic hay

2
cutting, i.e. a rotation of hay-cutting with aftermath grazing in 1-2 years followed by up to 3 years of grazing only management during the summer. The long-term sustainability for maintaining plant diversity interests of such a rotational management system on lowland botanically diverse neutral grassland would, however, need to be tested against either grazing only or hay-cutting and aftermath grazing only managements. Dispersal limitations and lack of micro-sites for germination/seedling recruitment have been identified as major factors limiting restoration of botanical diversity in grasslands (BD1458 review). It is contended that these factors could limit the restoration of botanical diversity/positive indicator species on the former grazing treatment paddocks at the BD1440 site. Where hay cutting is re-imposed on this grassland it would be appropriate to examine whether the use of green hay spreading can induce botanical change. The results of BD1441 showed that green hay strewing and scarification of the ground is an effective technique to enhance botanical diversity. The following hypothesis was put forward for testing in BD1460: lack of dispersal limits positive indicator diversity restoration on positive indicator species poor unimproved grasslands. BD1460 objectives In light of the above background the overall objective of BD1460 was to identify management systems that would maintain or enhance the abundance of positive indicator plant species of high nature conservation value and control pernicious weed abundance on agriculturally unimproved species-rich lowland neutral grassland. The specific objectives of BD1460 were: 1. to identify the consequences for the cover of positive and negative plant indicator species, invertebrate assemblages and for cattle performance, of applying moderate – lenient continuous grazing pressure using growing beef cattle of a commercial breed over more than 5 successive years; 2. to identify whether a prolonged period of hay cutting restores botanical diversity, increases positive and controls negative plant indicator species abundance; 3. to identify whether periodic hay cutting of a pasture, referred to as dynamic management, could provide a practical method for maintaining/restoring botanical diversity, abundance of positive indicator species and control of negative indicator species; 4. to examine effects of prolonged or periodic hay cutting on invertebrate assemblages; 5. to examine effects of green hay addition and scarification on botanical composition and on invertebrate assemblages; 6. provide sustainable management system(s) for lowland neutral pastures for use in Environmental Stewardship agreements. As the following report indicates all of the above objectives have been achieved.
Methods
Site Project BD1460 was based on the experimental plots used in BD1440 (Figure 1). The project site, at Craddocks Farm, near Babcary in Somerset (UK Grid ref: ST582291) has a known management history from 2000 to the start of BD1460 in 2007. Each experimental plot had good baseline botanical and soil chemistry data at the start of BD1460. Since the finish of BD1440 in October 2004 the former experimental paddocks continued to be grazed at a moderate grazing pressure by beef cattle throughout the summers of 2005 and 2006.

3
Figure 1. Experimental layouts of BD1440 (SUSGRAZ) and BD1460 (SUSGRAZ 2). Within each plot
there are ten open circles, which mark the positions of permanent 1m2 quadrats that were used for
the botanical surveys in both BD1440 and BD1460.

4
Experimental design Randomised block with 3 replicates of the following main treatments: (SG) Static management - continuous grazing: grazed April/May – October to maintain an average compressed sward height of 7–9cm (which was designed to be a moderate-lenient grazing intensity equivalent to a sward surface height (ssh) of >10 cm, which was imposed in BD1440). (This treatment was designed to achieve objective 1). (SH) Static management - cut for hay in mid-late summer and then graze the regrowth/aftermath with cattle to an average compressed sward height of 7–9cm each year. This treatment was designed to achieve objective 2. (D) Dynamic management - periodic hay cutting: rotation involving 2 years, 2007 and 2008, of hay cutting with aftermath grazing, as in treatment SH, followed by 3 years, 2009 – 2011, of grazing only (as in treatment SG) to maintain an average compressed sward height of 7-9 cm throughout the summer (April/May – October). This treatment was designed to achieve objective 3. The SG, SH and D treatments were allocated to the former BD1440 treatment plots as follows:
BD1440 Severe BD1440 Moderate BD1440 Lenient
Replicate 1
Static grazed
Dynamic hay-grazed
Static hay
Replicate 2 Dynamic hay-grazed Static hay Static grazed Replicate 3 Static hay Static grazed Dynamic hay-grazed
(See Fig. 1) The restricted randomisation was designed to reduce the risk of previous BD1440 treatment effects confounding any emergent treatment effects in this project. Sub-treatment: green hay spreading to enhance botanical diversity. Following the hay harvest in the SH and D main treatments five 5m x 5m sub-plots on areas of low positive indicator species diversity and cover were selected in each replicate for green hay spreading in years 1 and 2. Each of these sub-plots was power harrowed to create 40-50 % bare ground prior to spreading the green hay. The percentage bare ground accorded with that used in BD1441 and with the recommendations given in TANs 28 and 29. In accordance with hay spreading rates used in BD1441 3-4 t fresh weight of green hay /ha was applied to each sub-plot. The green hay was harvested from non-experimental areas on Craddocks Farm with > 5 positive indicator species and with total positive indicator species cover of > 10 %. The green hay was threshed on the receiver plots to enhance seed shedding and was left on the plots for several days, re-threshed and then removed, as its presence appeared to encourage the cattle to lie on these plots. The hay spreading sub-plots were separated from each other and from the 10 fixed quadrat positions for botanical surveying by at least 5 m. This treatment is designed to achieve objective 4. Management details In the SG and D (2009-2011) treatments a moderate continuous grazing intensity using beef cattle was applied over the growing season by varying cattle numbers (‘put-and-take’) to achieve the target compressed sward height (csh) of c. 7-9 cm. Compressed sward heights were recorded at 40 regularly spaced locations within each grazed paddock at weekly intervals throughout the grazing season using an Ashgrove rising plate metre (Ashgrove Pastoral Products, Palmerston North, New Zealand) on both the SG and D treatments. A comparison between csh and sward surface height (ssh) using a sward stick at 100 locations per grazed paddock was made in mid grazing season, June – July, in 2008, 2009, 2010 and 2011 (Table 1).

5
Table 1. Comparison between average sward surface height (SSH) and compressed sward height (CSH) measurements taken in mid grazing season June/July in the static graze (SG) and dynamic (D) treatment plots.
Treatment (rep) SSH CSH
2008 SG(1) 12.5 8.9
2008 SG(2) 26.1 9.1
2008 SG(3) 13.5 8.7
2009 SG(1) 14.6 8.7
2009 SG(2) 18.5 8.3
2009 SG(3) 16.0 8.7
2009 D(1) 13.9 7.5
2009 D(2) 25.2 8.4
2009 D(3) 14.7 8.1
2010 SG 9.6 5.8
2010 SG 7.6 5.6
2010 D 8.6 7.6
2010 D 8.0 5.7
2011 SG(1) 12.4 9.1
2011 SG(2) 11.9 9.2
2011 SG(3) 10.1 7.8
2011 D(1) 11.9 8.6
2011 D(2) 19.5 8.0
2011 D(3) 14.4 9.2
The start of grazing in the spring in both the SG and D treatments was dependent on sward height and soil conditions. Grazing did not start before the csh had reached c. 7 cm and ground conditions were sufficiently dry to avoid undue poaching. The dates of the start of grazing each year, together with the date of the start of the hay regrowth grazing period and the cessation of grazing in the autumn are given in Table 2. Initially three core cattle of about 300 kg liveweight at turnout were allocated to each treatment plot. If the average csh increased to more than 8 cm then additional cattle were put onto a plot in order to maintain the swards within the target csh range. If the average csh fell below 6 cm then non-core cattle were removed from the plot. Note: non-core cattle were grazed on unimproved pasture when they are not on experimental plots. The extent to which the target CSH was achieved each year on each treatment plot throughout the grazing season is shown in Appendix Figure 1a-e.
The regrowth following the hay cutting in the SH and D treatments was grazed when the average csh reached >6 cm in the late summer/autumn (see Table 2). Three core cattle were allocated to each of the treatment plots and grazing pressure was controlled in the same way as in the static grazed treatment. When the average csh on a plot fell below 6 cm in October/November all the cattle were removed (see Table 2).

6
Table 2. Dates of cattle turnout onto the treatment plots, dates of the onset of grazing the regrowth following the hay cut and dates when grazing ceased in the autumn for each year of BD1460.
Start of grazing Start of hay regrowth grazing Cessation of grazing
2007 12th April 4th October 7th November
2008 29th April 2nd October 10th November
2009 7th May 6th October 12th November
2010 12th May 22nd September 20th October
2011 28th April 21st September 2nd November
BD1440 showed that a plot size of 1.5 ha was required to maintain 3 core animals over the grazing season under the moderate-lenient grazing pressure, i.e. the maintenance of an average csh of 7-9cm. In light of this the area of the former severe grazing treatment plots of BD1440, which were 1.3 ha in area, were increased by 0.2 ha. This plot size increase was readily achieved because there was spare grazed area around the former BD1440 plots. Cattle breed type As in BD1440 the emphasis was on the need to use animals that reflect commercial realities. Therefore store cattle of a commercial breed type (continental x Holstein/Friesian) weighing ca. 300 kg live-weight in April were used for the core and spare animals. Hay cutting The dates when the SH and D treatments were mown for hay are shown in Table 3. Table 3. Hay cutting dates on BD1460
2007 28th August
2008 27th August
2009 28th August
2010 27th August
2011 15th August
The D treatment was only mown for hay in 2007 and 2008. Measurements
Agronomic and animal performance Individual animal growth rates were recorded by weighing the core cattle on each treatment paddock at turnout, in mid grazing season e.g. in July, at the start of aftermath grazing and at the end of the grazing season. Grazing day totals were accumulated for each treatment paddock. The growth rates of the core animals and grazing day totals were used to calculate the grazing output per paddock. Herbage yield was recorded at the time of cutting for hay by weighing five randomly selected 5m lengths of swath of known cut width, which were sub sampled for dry matter determination. Samples of hay were taken for dry matter, mineral content and pepsin cellulose digestibility analysis.

7
Pluck samples of herbage from each grazed paddock were taken during May/June, July/August and September/October and analysed for mineral content and pepsin cellulase digestibility.
Botanical composition Cover (%) of all vascular plant species, dead vegetation and bare ground were surveyed between
25th June and 3rd July in 2007, 23rd June and 1st July in 2008, 22nd June and 30th June in 2009, and
between 27th June and 1st July in 2011 in ten 1m x 1m quadrats that had been placed at random
within each of the main treatment paddocks at the start of BD1440. In addition two 1m x 1m
quadrats were placed at random within the central 3m x 3m area of each of the green hay spread
sub-plots in 2007. The positions of these additional quadrats in the sub-plots were fixed for the
duration of the project. Because the green hay treated areas were within the main treatment
paddock it should be recognized that preferential grazing (or avoidance) effects on the sub-
treatment plots during the autumn grazing period could confound any comparison of botanical
change between the hay strewn and the non-strewn quadrats. Therefore, any observed differences
in botanical composition between the quadrats in the hay spread sub plots and the non-spread main
treatment plots should be treated with caution. The detailed survey of the 1m x 1m quadrats
provided estimates of the relative cover/abundance contribution of different plant species to the
plant communities under the various treatments. However, it was recognized that because of the
relatively small area of this detailed survey there could be an under-estimation of species richness at
the plot scale. To address this issue an additional survey was carried out - namely 'exhaustive
searching’ for all higher plant species in a 5m x 5m area around each fixed quadrat position or, in the
case of the hay spread sub-plot, within the 5m x 5m sub-plot area. Searching continued until a 'new'
species has not been found within 5 minutes. The additional searching within the 5m x 5m areas was
designed to provide information on less common species, which may be of significance in terms of
ecological value. It was predicted that there could be subtle but important differences between
some treatments.
The botanical data were used to calculate the richness (in terms of number m-2 and number 25m-2)
and cover of positive indicator (PI) species (Table 4) indicative of high nature conservation value
(Robertson and Jefferson, 2000), negative indicator (NI) species cover (Table 4), as well the
functional indicator of soil fertility status, namely Ellenberg N indices (Ellenberg, 1988; Hill et al.,
1999) for each treatment. Treatment effects on positive indicator diversity and abundance were
examined over the course of the project together with any changes in functional characteristics of
the grassland under the different treatments.
Table 4. Positive and negative indicator species recorded in at least one year on the experimental
treatments.
Positive Indicator species Negative indicator Achillea millefolium Lotus corniculatus Cirsium arvense
Agrimonia eupatoria Primula veris Cirsium vulgare Betonica officinalis Rhinanthus minor Galium aparine Centaurea nigra Sanguisorba officinalis Plantago major Galium verum Serratula tinctoria Rumex crispus Lathyrus pratensis Silaum silaus Senecio jacobaea Leontodon hispidus Succisa pratensis
Leontodon saxatilis Tragopogon pratensis
Leucanthemum vulgare

8
Spatial mapping of biotic and abiotic variables: interpolation and creating prediction surfaces
The prediction surfaces were created using the locations of the fixed botanical quadrats (x,y), where
all measurements were made, and data for the soil and botanical parameters (z). The analysis was
performed using the geostatistical analyst extension in ESRI Arc map, version 10.0
http://www.esri.com/software/arcgis/.
The interpolation method used to create the surfaces was ordinary Kriging. ‘Kriging is an advanced
geostatistical procedure that generates an estimated surface from a scattered set of points with z-
values. Unlike other interpolation methods, kriging involves an interactive investigation of the spatial
behavior of the phenomenon represented by the z-values before selecting the best estimation
method for generating the output surface.’ (ESRI Help files). A semivariogram, plotting the distance
between points against their similarity, was computed for each parameter and the model that best
fitted the data chosen for generation of the surface.
Single surfaces for the whole site were created, rather than produce separate surfaces for individual
plots, and then clipped to the boundaries of the relevant paddocks.
Invertebrate composition Pollinators (Bumblebees and Butterflies), beetles and spiders, representing three important components of invertebrate communities within grasslands, were sampled in 2007, 2008, 2009 and 2011. Surveys were carried out on three occasions in each year to reflect the phenological development of the sward in relation to the treatment management practices. Sampling periods were based on a pre-hay cut sample in June, a post-hay cut sample in August and a final September sample, which was to provide information on the post-hay cut / aftermath grazing period. Pollinator (Bumblebees and Butterflies) sampling was based on two 50 m transects randomly positioned within each treatment replicate, maintaining at least 10 m between each replicate. On each visit bumblebees and butterflies were recorded from two 6 x 50 m sampling areas, with the mid line centred on each of the two 50 m transects (Banaszak, 1980). As workers of Bombus terrestris and B. lucorum cannot be reliably differentiated in the field, they were treated as a single aggregate species. Pollinator sampling was carried out between 10.00 hrs and 17.00 hrs, when temperatures were greater than 13°C in clear conditions (at least 60% of the sky being clear) or greater than 17°C in more cloudy skies (Pollard & Yates, 1993). Beetles and spiders were sampled using vortis (Burkard Ltd) suction samplers. Each sample consisted of 15, 10 second sucks positioned randomly around each of the fixed point botanical quadrats. A total of ten vortis samples were therefore taken from each replicate paddock. In addition, where hay strewing was applied to sub-plots (Dynamic and Static Hay treatments), samples were taken from within each of the five fixed botanical quadrats. The beetles and spiders were identified to species.

9
Beetles and spiders were sampled using vortis (Burkard Ltd) suction samplers. Each sample consisted of 15, 10 second sucks positioned randomly around each of the fixed point botanical quadrats. A total of ten vortis samples were therefore taken from each replicate paddock. In addition, where hay strewing was applied to sub-plots (Dynamic and Static Hay treatments), samples were taken from within each of the five fixed botanical quadrats. The beetles and spiders were identified to species. Soil analyses. Five 7.5cm deep soil cores of known volume were taken from the immediate vicinity of each of the
10 fixed botanical survey quadrats in each main treatment and sub treatment replicate in years 1
and 5. Soil sampling was carried out when soil microbial mass was likely to be maximal i.e. when soil
temperature and moisture content was optimal for below ground microbial activity (which was
generally after May and before October) and when phospholipid fatty acid (PLFA) concentrations
were maximal. One core was selected at random for bulk density analysis (weighed fresh, dried to
constant weight and core volume adjusted for stones over 3mm diameter and large roots). The
other soil cores were bulked and a sub-sample of c. 100 g of fresh soil removed for microbial
community structure assessment via phospholipid fatty acid (PLFA) analysis. The remaining soil
sample was dried to constant weight at 30oC and then analysed for organic carbon (C), total nitrogen
(N), total phosphorus (P), Olsen extractable P, extractable potassium (K), calcium (Ca), magnesium
(Mg), sodium (Na) and pH.
The PLFA analysis was used to measure the relative effects of management on the fungal biomass
and other microbial groups, and also the fungal-to-bacterial biomass ratio. Fatty acid nomenclature
followed Frostegård et al. (1993), and the fatty acids i15:0, a15:0, 15:0, i16:0, 17:0, i17:0, cy17:0,
cis18:1v7 and cy19:0 were used to represent bacterial PLFAs (Federle 1986; Tunlid et al. 1989;
Frostegård et al. 1993) and 18:2v6 was used as an indicator of fungal biomass (Federle 1986). This
method also discriminates between other groups of microbes in soil, including gram-positive
bacteria (branched fatty acids i15, a15, i16, i17), gram-
and actinomycetes (10Me:18:0). The ratio of 18:2v6 to total bacterial PLFAs was taken to represent
the ratio of fungal:bacterial biomass in soil (Bardgett et al. 1996; Yeates et al. 1997). Total PLFA was
used as a measure of the active microbial biomass, as discussed by Bardgett and McAlister (1999).
Estimation of potential net nitrogen mineralization. Potentially mineralizable N is a measure of the active fraction of soil organic N, which is chiefly responsible for the release of mineral N through microbial action. Mineralizable N is composed of a heterogeneous array of organic substrates including microbial biomass, residues of recent crops, and humus. Twenty soil samples (25 mm diameter x 75 mm deep) were taken from each replicate of the main
treatments at fortnightly intervals from mid-March to July each year. The 20 samples from each plot
were combined and sieved to remove all stones of > 5 mm diameter and any macro organic matter
such as large tap roots, bulbs or tubers. Three sub samples (3 analytical reps) were then removed
from each of the combined samples for anaerobic incubation to measure ammonium-N production
as an index of potential mineralization using anaerobic incubation technique after Waring and
Bremner (1964), modified by Lober and Reeder (1993).

10
Statistical analyses The soil chemistry, herbage chemistry and botanical data were each analysed by Canonical Variate
Analysis (CVA) using Genstat version 14 from which similarity matrices for all the treatment
paddocks were derived. The CVA on the soil chemistry data was also run with percentage cover of
positive indicator species of nature conservation value (Robertson & Jefferson, 2000) as an
additional variate. The distributions of each variate of the soil chemistry, botanical, pluck sample
chemistry, sward height/structure, animal growth and liveweight output data were checked for
normality using probability distribution plots using Genstat version 14 and, where appropriate,
normalized using the most appropriate transformations. Repeated measures ANOVA were carried
out on data where there were equally spaced time points. Residual maximum likelihood (REML)
models were used where there were unequally spaced time points. Standard errors of the
differences between all pairs were generated and where the chi probability was 0.05, or less, Fishers
least significant difference test was used to examine treatment or time effects .
The cattle growth rate data were analysed using the distribution-free regression method proposed by
Theil (1950). The regression slope was calculated as the median of the slopes of all lines joining pairs of
points with different time values. The daily liveweight gain estimates (slope coefficients) derived from
the Theil regression for each treatment were then analysed as repeated measures using a multiple
variates model and Restricted Maximum Likelihood (REML) variance components analysis as detailed
above.
Analyses of the invertebrate data were undertaken using a repeated measures mixed effects model in
SAS version 9.01. Separate analyses were performed for pollinator (total, bumblebee and butterfly
separately), beetle and spider abundance and species richness responses to the main treatment effects
abundance and species richness values were Loge N+1 transformed to normalise data and are based on
summed season values.
Results
Animal growth rates The average across all years of BD1460 for the daily liveweight gain over the grazing season of the beef cattle on the static grazing (SG) treatment was 0.67 kg per day, and for the dynamic treatment between 2009 and 2011 it was 0.74 kg per day (sed 0.078, df 6). The differences in daily growth rates between the static graze and dynamic treatments were, however, not significant. Between 2009 and 2011 individual growth rates on both the static graze and dynamic treatments tended (P 0.097) to decline by about 20 percent (Fig. 2). A highly significant (P<0.001) treatment effect was found on the daily liveweight gain of cattle grazing the regrowth following the hay harvest. Cattle grazing the hay aftermath on the static hay treatment showed an average daily growth gain over the five years of BD1460 of 1.14 kg compared with an average of 0.12 kg per day on the static graze and 0.52 kg per day on the dynamic treatment (the standard error of the difference (sed) for treatment alone was 0.070 with 4 degrees of freedom). There was also a marked tendency (P 0.054) for a treatment x time (year) interaction, with daily liveweight gains showing a slight decline over time in the dynamic treatment, whereas in the

11
static graze treatment there was a modest improvement from negative growth rates to positive, albeit very low liveweight gains (Fig. 3). Figure 2. Liveweight gain per day throughout the grazing season by growing beef cattle on
botanically diverse neutral grassland under either the static grazing (SG) or dynamic (D) treatments.
Horizontal line at 0.81 kg day-1 represents the average daily growth rate over the grazing season for
the moderate grazing intensity treatment in BD1440. Error bars indicate 2x SEM.
Figure 3. Liveweight gain per day during late summer/autumn by growing beef cattle on botanically
diverse neutral grassland on the static grazing, static hay or dynamic treatments. Error bars indicate
2x SEM.
During the period from turn-out in spring to the start of the hay aftermath grazing period the average daily liveweight gain of the cattle on the static grazing treatment was 0.72 kg per day (sed 0.050, df 4). Although the daily liveweight gain of the cattle on the dynamic treatment tended to be higher, at 0.84 kg per day compared with the static graze treatment for the period 2009 – 2011, the difference was not significant (P 0.196). Between 2009 and 2011 daily liveweight gain during the early and mid-grazing season declined (P 0.041) by 20 – 25 percent.
0
0.2
0.4
0.6
0.8
1
2007 2008 2009 2010 2011
kg l
ivew
eigh
t ga
in d
ay-1
Static Graze Dynamic
-1.0
-0.5
0.0
0.5
1.0
1.5
2.0
2007 2008 2009 2010 2011
kg li
vew
eigh
t ga
in d
ay-1
Static Graze Static Hay Dynamic

12
Between 2007 and 2011 the carrying capacity, as indicated by the number of grazing days ha-1 per grazing season of the SG treatment declined (Fig. 4). The number of grazing days that the hay regrowth period supported was similar between the SG, SH and D treatments and was similar between years, amounting to on average 60 ± 14.41 grazing days ha-1, which represented about 14 percent of the grazing season total. Over the course of BD1460 the liveweight produced by the static grazed treatment fell (P <0.05) by >40 %, as shown by Figure 5. There was a tendency (P 0.068) for the liveweight production of the D treatment to be higher than for the static graze treatment during the period 2009 – 2011 (Fig. 5). Figure 4. Grazing day totals for the whole grazing season by growing beef cattle on botanically
diverse neutral grassland on either the static grazing or dynamic treatments. Error bars indicate 2x
SEM.
Figure 5. Liveweight produced throughout the grazing season on the static graze and dynamic
treatments on botanically diverse neutral grassland. Horizontal line at 320 kg ha-1 represents the
average liveweight produced over the grazing season by the moderate grazing intensity treatment in
BD1440. Error bars indicate 2x SEM.
0
100
200
300
400
500
600
700
2007 2008 2009 2010 2011
Gra
zin
g d
ays
ha-1
Static Graze Dynamic
0
100
200
300
400
500
2007 2008 2009 2010 2011
kg li
vew
eigh
t ga
in h
a-1
Static Graze Dynamic

13
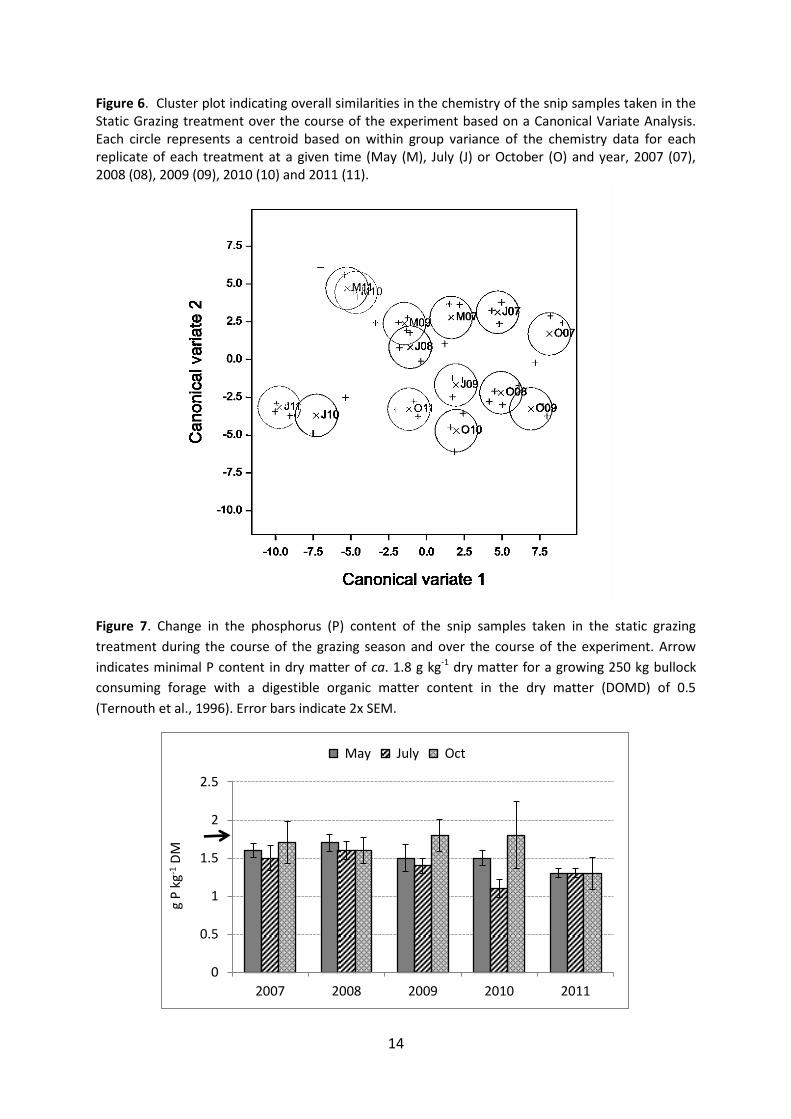
Herbage Chemistry – snip samples: static graze treatment Canonical variate analysis (CVA) showed that change had occurred in the chemistry of the snip samples taken in the static graze treatment over the course of the experiment (Fig. 6), with clear separation in the chemistry of samples taken in 2010 or 2011 to those taken in 2007 and 2008. The herbage magnesium (Mg), calcium (Ca) and phosphorus (P) content of the snip samples all had high vector loadings in the cva indicating that they had a major influence on cluster divergence. Herbage P content decreased (P 0.007) by approximately 20 percent between 2007/08 and 2011(Fig. 7). The P content of the herbage was generally lower (P 0.004) in mid grazing season compared with the autumn. Herbage P content tended (P 0.088) to show a year x season interaction, with herbage sampled in July tending to have a lower P content than in May and October, but this tendency disappeared in 2011. Herbage Ca to P ratio showed a highly significant (P<0.001) increase during the course of the experiment (Fig. 8), due to a combination of declining (P0.007) P content and an increase (P<0.001) in Ca content over time. Herbage Ca content showed a significant (P0.006) year x season interaction with herbage Ca content showing no increase until 2011 in herbage sampled in May, but a year on year increase in herbage sampled in July and October. There was a highly significant (P <0.001) seasonal effect and a significant (P 0.001) year x season interaction on the Ca to P ratio, with values for July increasing between 2007 and 2008/09 and then increasing further in 2010/11, whereas in May an increase in the Ca:P ratio was only observed in 2011. In October the Ca to P ratio showed no increase until after 2009. Herbage Mg to P ratio showed a very similar pattern of change to the Ca to P ratio, with a highly significant (P<0.001) increase during the course of the experiment. There were also significant (P0.003) seasonal differences and a significant (P 0.002) year x season interaction on herbage Mg to P ratio. As with Ca the Mg content of the herbage increased relative to the P content between 2007 and 2011 particularly in July. Herbage N to P ratio also showed an increase (P 0.013) during the course of the experiment (Fig. 9), with no significant seasonal effect or season x year interaction, largely due to the decline in P content, but no overall change in N content (Fig. 10). A significant year x season interaction on herbage N content was observed, with the N content in July and October varying between years, whereas there was little or no variation found in May. The herbage K to P ratio also showed a significant (P 0.027) increase between 2007 and 2011, and highly significant (P <0.001) seasonal variation, but no significant year x season interaction. The increase in K to P ratio over the course of the experiment (Fig. 11) was due the decrease in herbage P content while the herbage K content remained relatively unchanged (Fig. 12). The seasonal variation in K to P ratio reflected highly significant (P <0.001) variation in herbage K content, with the K content declining by over 20 percent between May and October. The estimated (in vitro) amount of digestible organic matter in the dry matter (DOMD) of the snip samples declined (P < 0.001) by ca. 13 percent between May and October, and by ca. 8 percent between May and July (Fig. 13). DOMD increased between 2007 and 2011 in snip samples taken in May, but showed no change for the samples taken in July and October.
14
Figure 6. Cluster plot indicating overall similarities in the chemistry of the snip samples taken in the Static Grazing treatment over the course of the experiment based on a Canonical Variate Analysis. Each circle represents a centroid based on within group variance of the chemistry data for each replicate of each treatment at a given time (May (M), July (J) or October (O) and year, 2007 (07), 2008 (08), 2009 (09), 2010 (10) and 2011 (11).
Figure 7. Change in the phosphorus (P) content of the snip samples taken in the static grazing
treatment during the course of the grazing season and over the course of the experiment. Arrow
indicates minimal P content in dry matter of ca. 1.8 g kg-1 dry matter for a growing 250 kg bullock
consuming forage with a digestible organic matter content in the dry matter (DOMD) of 0.5
(Ternouth et al., 1996). Error bars indicate 2x SEM.
0
0.5
1
1.5
2
2.5
2007 2008 2009 2010 2011
g P
kg-1
DM
May July Oct

15
Figure 8. Change in the calcium (Ca) to phosphorus (P) ratio of the snip samples taken in the static grazing treatment during the course of the grazing season and over the course of the experiment. Error bars indicate 2x SEM.
Figure 9. Change in the Nitrogen (N) to phosphorus (P) ratio of the snip samples taken in the static grazing treatment during the course of the grazing season and over the course of the experiment. Error bars indicate 2x SEM.
Figure 10. The nitrogen (N) content of the snip samples taken in the static grazing treatment during the course of the grazing season and over the course of the experiment. Error bars indicate 2x SEM.
0.001.002.003.004.005.006.007.008.009.00
2007 2008 2009 2010 2011
Ca:
P r
atio
May July Oct
10.00
12.00
14.00
16.00
18.00
2007 2008 2009 2010 2011
N:P
rat
io
May July Oct
0
5
10
15
20
25
30
2007 2008 2009 2010 2011
g N
kg-1
DM
May July Oct

16
Figure 11. Change in the potassium to phosphorus ratio of the snip samples taken in the static grazing treatment during the course of the grazing season and over the course of the experiment. Error bars indicate 2x SEM.
Figure 12. Change in the potassium (K) content of the snip samples taken in the static grazing treatment during the course of the grazing season and over the course of the experiment. Error bars indicate 2x SEM.
Figure 13. Change in the percentage of digestible organic matter in the dry matter (DOMD) of the snip samples taken in the static grazing treatment during the course of the grazing season and over the course of the experiment. Error bars indicate 2x SEM.
4
6
8
10
12
14
16
2007 2008 2009 2010 2011
K:P
rat
io
May July Oct
0
5
10
15
20
25
2007 2008 2009 2010 2011
g K
kg-1
DM
May July Oct
30
40
50
60
70
2007 2008 2009 2010 2011
DO
MD
%
May July Oct

17
Herbage Chemistry – snip samples: static graze (SG) vs dynamic (D) treatments The snip sample chemistry of the SG and D treatments showed close similarity in 2009 to 2011, as illustrated by the dendrogram (Fig 14) based on a CVA. Samples taken from the two treatments in July or October were generally more closely similar, i.e. nearest neighbours, than samples taken from the same treatment at different times of the grazing season. The chemistry of samples taken in May formed a separate cluster from the July and October samples. In May the similarity in overall chemistry between the two treatments was less consistent than for the samples taken in July and October, particularly for 2010 and 2011. The Mg and P content of the herbage had high vector loadings in the CVA indicating a major influence on the relative similarities between the snip samples. The only herbage chemistry variate to show a significant treatment effect was potassium (K). Herbage K content was lower (P 0.013) in the D treatment than the SG treatment in the July samples taken in 2009 – 2011, and there was also a marked tendency (P 0.058) for this to be the case in the October samples, as illustrated by Fig. 15. Herbage K content showed significant inter-annual variation in May (P 0.029) and July (P0.034), but with no consistent pattern to the changes. No significant treatment x year interaction on herbage K content was observed for any of the sampling occasions. Herbage P contents in the D treatment were generally similar to the levels found in the SG treatment, both seasonally and between years. Repeated measures ANOVA showed significant inter-annual variation in herbage P content in July (P 0.007) and October (P0.037). The P content of herbage sampled on October 2011 was lower than in samples taken in October 2009 or 2010. Repeated measures ANOVA showed significant inter-annual variation in herbage N content; in May (P 0.02), July (P0.04) and October (P0.045), but there was no consistent pattern to the changes between 2009 and 2011. No significant treatment effect or treatment x year interaction on herbage N content was observed. The N contents of the herbage in the D treatment were similar to the levels found in the SG treatment. Figure 14. Dendrogram indicating overall similarities in the snip sample chemistry of the static graze (S) and dynamic (D) treatments in May (M), July (J) and October (O) in 2009 (9), 2010 (10) or 2011 (11); for example, DJ10 represents the chemistry of samples taken from the dynamic treatment in July in 2010.

18
Figure 15. The potassium (K) content of the snip samples taken in the static grazing (SG) and dynamic (D) treatments in May, July and October (Oct) in 2009 (9), 2010 (10) or 2011 during the course of the grazing season and over the course of the experiment.
Hay yield No significant differences were observed in the dry matter yields or any of the measured chemistry variates or DOMD between the SH and D treatments in 2007 or 2008, and there were no significant differences in yield between the two years. In the SH treatment the dry matter yield fell (P 0.002) by > 50% between 2007/08 and 2010/11 (Fig. 16). The N content of the herbage cut for hay increased (P 0.049) over the course of the project (Fig. 17), as did the Ca content (P 0.001) (Fig. 18), Ca to P ratio (P0.050) (Fig. 19), Mg content (P0.017) (Fig. 20), and DOMD (P0.007) (Fig. 21). The K content of the herbage varied significantly (P 0.045) between years, but with no consistent pattern of change (Fig. 22). No significant change in the P content of the herbage was observed (Fig. 23). Associated with both the decline in hay yield on the SH treatment and the decline in output from the SG treatment over the course of BD 1460 was a decline in in both summer and winter rainfall in the region of the experimental site, as indicated by Figures 24 and 25, respectively. Figure 16. Dry matter yields at the time of cutting for hay on the static hay (SH) and dynamic (D) treatments on botanically diverse neutral grassland. Error bars indicate 2x SEM.
0
5
10
15
20
25
D May SG May D July SG July D Oct SG Oct
g K
kg-1
DM
2009 2010 2011
0
1000
2000
3000
4000
5000
6000
7000
2007 2008 2009 2010 2011
kg D
M h
a-1
SH D

19
Figure 17. Change in the nitrogen (N) content of the herbage cut for hay on the static hay (SH) and dynamic (D) treatments on botanically diverse neutral grassland. Error bars indicate 2x SEM.
Figure 18. Change in the calcium (Ca) content of the herbage cut for hay on the static hay (SH) and dynamic (D) treatments on botanically diverse neutral grassland. Error bars indicate 2x SEM.
Figure 19. Change in the calcium (Ca) to phosphorus (P) ratio of the herbage cut for hay on the static hay (SH) and dynamic (D) treatments on botanically diverse neutral grassland. Error bars indicate 2x SEM.
0.0
5.0
10.0
15.0
20.0
2007 2008 2009 2010 2011
SH Dg
N k
g-1
0
2
4
6
8
10
12
2007 2008 2009 2010 2011
SH D
g C
a kg
-1 D
M
0
5
10
15
2007 2008 2009 2010 2011
Ca
: P r
atio
SH D

20
Figure 20. Change in the magnesium (Mg) content of the herbage cut for hay on the static hay (SH) and dynamic (D) treatments on botanically diverse neutral grassland. Error bars indicate 2x SEM.
Figure 21. Change in the digestible organic matter content in the dry matter (DOMD) of the herbage cut for hay on the static hay (SH) and dynamic (D) treatments on botanically diverse neutral grassland. Error bars indicate 2x SEM.
Figure 22. Change in the potassium (K) content of the herbage cut for hay on the static hay (SH) and dynamic (D) treatments on botanically diverse neutral grassland. Error bars indicate 2x SEM.
0
0.5
1
1.5
2
2.5
3
2007 2008 2009 2010 2011
g M
g kg
-1 D
M
SH D
40
45
50
55
60
2007 2008 2009 2010 2011
DO
MD
(g
10
0-1
g D
M)
SH D
0
2
4
6
8
10
12
14
16
2007 2008 2009 2010 2011
SH D
g K
kg-1

21
Figure 23. Change in the phosphorus (P) content of the herbage cut for hay on the static hay (SH) and dynamic (D) treatments on botanically diverse neutral grassland. . Arrow indicates minimal P content in dry matter of ca. 1.8 g kg-1 dry matter for a growing 250 kg bullock consuming forage with a digestible organic matter content in the dry matter (DOMD) of 0.5 (Ternouth et al., 1996). Error bars indicate 2x SEM.
Figure 24. Summer (April to September) rainfall in the vicinity of BD1460 project site over the period 2007 to 2011.
Figure 25. Winter (October to March) rainfall in the vicinity of BD1460 project site over the period 2006/07 to 2010/11.
00.20.40.60.8
11.21.41.61.8
2
2007 2008 2009 2010 2011
g P
kg-1
DM
SH D
0
100
200
300
400
2007 2008 2009 2010 2011
mm
0
100
200
300
400
500
06-07 07-08 08-09 09-10 10-11
mm

22
Soil Chemistry Canonical variate analysis (CVA) showed that no clear divergence in the soil chemistry of the treatments had occurred during the course of the experiment, as illustrated by clustering of the different treatment replicates in 2011 (Fig. 26). The dendrogram (Fig. 27), based on nearest neighbours from the CVA, indicates that there was close similarity in soil chemistry within some replicates, as shown, for example, by the proximity of dynamic treatment replicate 2 (D2) to static graze replicate 2 (SG2), and dynamic treatment replicate 3 (D3) to static graze replicate 3 (SG3). The dendrogram also shows that the replicates of the static hay treatment were quite different in their overall soil chemistry with replicate SH1 being relatively different from replicates SH2 or SH3. Soil N (and organic C) had a major influence on separating the treatment plots in the CVA, as indicated by the relative vector lengths shown in Figure 28 biplot. The biplot also indicates that herb (broad-leaved species) cover and Ellenberg N score were strongly negatively correlated with soil N (and C) amount (Fig. 28), indicating that these two soil variates had a major influence on the plant community structure of the different treatment plots. Soil calcium content, which also had relatively high vector loading in the CVA, and extractable soil phosphorus showed little or no correlation with Ellenberg N, PI cover or herb cover. Soil pH was weakly correlated with the botanical variates indicative of high botanical nature conservation value grassland. There was a tendency (P0.063) for a treatment x time interaction on soil N, with an increase in the SG treatment between 2007 and 2011, and a tendency for a decrease between these years in the SH and D treatments (Fig. 29). The apparent decline in soil N content on the SH treatment could reflect an effect of repeated offtake via the hay cutting with no fertilizer input replenishment. The contention that the static hay depleted some soil minerals over time was supported by a significant (P 0.004) time effect, with exchangeable soil K amount declining between 2007 and 2011, but also weakened by the lack of a significant time x treatment interaction indicating that the K impoverishment of SH treatment was no different to that occurring in the other treatments (Fig. 30). Using and average soil bulk density of 0.71 g cm-3 for 2007 and 0.65 g cm-3 for 2011 the soil K and P amounts may be estimated in terms of mg per litre of soil to give the respective soil indices for grassland productivity, as detailed the Fertilizer Manual (RB209) (Defra, 2010); the K index was 2- in 2007 and 1 in 2011 and the P index was 0 throughout BD1460. Although there was an apparent downward trend in soil extractable phosphorus (Fig. 31) there was in fact no significant (P 0.173) change between 2007 and 2011, and there was no significant treatment effect or treatment x time interaction. Exchangeable Ca content of the soils showed a highly significant (P<0.001) decline over the five years of the experiment (Fig. 32), with no treatment effect or treatment x time interaction. There was a decline (P0.021) in soil carbon (C) content, but this was restricted to the static hay and dynamic treatments (Fig. 33), which probably reflected the lack of organic matter returns to the soil via dung in the treatments involving hay making. The decline in soil C, however, did not accord with observed changes in soil bulk density. Contrary to the observed loss in soil C (organic matter) soil bulk density showed a decline (P0.015) of 0.05 g cm-3 from an average across all treatment plots of 0.71 in 2007 to 0.66 g dry soil cm-3 in 2011 (Fig. 34), with no significant treatment effect or treatment x time interaction. Decreases in soil bulk density would normally be associated with increase in soil organic matter content. Soil carbon content was spatially variable across the experiment site, as indicated in Figure 35. The restriction of the decline in soil C between 2007 and 2011 to the static hay and dynamic treatment plots is illustrated when comparing Figure 35 with Figure 36.

23
Figure 26. Cluster plot based on a Canonical Variate Analysis of the soil chemistry data of 2011. Each circle represents a centroid based on within group variance of the chemistry data for each replicate of each treatment. The symbols SG, SH, and D represent the Static Graze, Static Hay and Dynamic treatments, respectively; the number, 1, 2, 3, attached to a treatment symbol represents the replicate number.
Figure 27. Dendrogram showing the nearest neighbour relationship of the soil chemistry between the different treatment replicates based on Canonical Variates Analysis. The treatment symbols are the same as in Figure S1.

24
Figure 28. Biplot showing the relative vector strengths (loadings), as indicated by length of arrow, of the different soil chemistry and plant functional variates. The symbols Org C, N, TotP, Ext_P, K, Ca, Mg, Na, pH, represent the soil organic carbon content, total nitrogen, total phosphorus, bicarbonate extractable phosphorus, exchangeable potassium, calcium, magnesium and sodium amounts and soil pH, respectively. The symbols HrbCov, EllN, PICov, PIno and NICov represent the following: herb (all dicotyledonous species combined) cover, Ellenberg N score, Positive Indicator species cover, Positive Indicator species number, and Negative Indicator species cover, respectively.
Figure 29. Soil total nitrogen (N) content of the static graze (SG), static hay (SH) and dynamic (D) treatments in 2007 and 2011.
6
6.5
7
7.5
8
SG SH D
g N
kg-1
dry
so
il
2007 2011
between trts: s.e.d. 0.5927 df 4.25 for same trt: s.e.d. 0.1458 df 6

25
Figure 30. Soil exchangeable potassium (K) content of the static graze (SG), static hay (SH) and dynamic (D) treatments in 2007 and 2011.
Figure 31. Soil extractable phosphorus (P) content of the static graze (SG), static hay (SH) and dynamic (D) treatments in 2007 and 2011.
0
100
200
300
400
SG SH Dmg
K k
g-1 d
ry s
oil
2007 2011
between trts: s.e.d. 39.43 df 6 for same trt: s.e.d. 25.17 df 6
0.0
2.0
4.0
6.0
8.0
10.0
12.0
SG SH D
mg
P k
g-1 d
ry s
oil
2007 2011
between trts: s.e.d. 39.43 df 6 for same trt: s.e.d. 25.17 df 6

26
Figure 32. Soil exchangeable calcium (Ca) content of the static graze (SG), static hay (SH) and dynamic (D) treatments in 2007 and 2011.
Figure 33. Soil organic carbon (C) content of the static graze (SG), static hay (SH) and dynamic (D) treatments in 2007 and 2011.
Figure 34. Soil bulk density of the static graze (SG), static hay (SH) and dynamic (D) treatments in 2007 and 2011.
0
1000
2000
3000
4000
5000
SG SH D
mg
Ca
kg-1
dry
so
il
2007 2011
between trts: s.e.d. 370.1 df 4.5 for same trt: s.e.d. 130.0 df 6
65
70
75
80
85
SG SH D
g C
kg-1
dry
so
il
2007 2011
between trts: s.e.d. 5.39 df 4.5 for same trt: s.e.d. 1.85 df 6
0
0.2
0.4
0.6
0.8
1
SG SH D
g d
ry s
oil
cm-3
2007 2011
between treatments: s.e.d. 0.0422 df 4 for same trts: s.e.d. 0.024 df 6

27
Figure 35. Spatial variation in the soil carbon (C) content across the experiment site in 2007.
Figure 36. Spatial variation in the soil carbon (C) content across the experiment site in 2011.
In line with the decline in soil Ca amount soil pH also declined (P 0.011) by ca. 0.2 of a pH unit between 2007 and 2011 (Fig. 37). However, despite the decline in soil pH the values observed in 2011 were still in line with the average value observed during the previous BD1440 project in 2000 and 2004. Therefore the apparent decline that was observed during BD1460 was not considered to have had a major influence on the botanical character of the grassland. Nevertheless over time further declines in soil pH, particularly where it is now below 5.5, as in plots D2 and D3, as illustrated by comparing Figures 38 and 39, could affect the plant community structure should any fertilizer be

28
applied and competitive interactions within the communities change. In BD1460 no significant treatment effect or treatment x time interaction on soil pH was observed. Olsen extractable soil phosphorous (P) showed no treatment or time effects or treatment x time interaction. The overall average for Olsen extractable P across the treatments in 2007 and 2011 was 8.2 (± 1.154 df 8.5) mg kg-1 of dry soil. Figure 37. Soil pH variation and change across the treatment plots and between the start and end of BD1460. Horizontal line at pH 5.7 represents the average soil pH across all treatments in 2000 and 2004 in BD1440. Error bars indicate 2x SEM.
0
2
4
6
8
SG1 SG2 SG3 SH1 SH2 SH3 D1 D2 D3
pH
pH2007 pH2011

29
Figure 38. Spatial variation in the soil pH across the experiment site in 2007.
Figure 39. Spatial variation in the soil pH across the experiment site in 2011.
Soil Microbial Community No significant treatment effects were found to have developed in BD1460 by 2011 on total soil bacterial PLFA or fungal PLFA amount or on the fungal to bacterial PLFA. The average fungal to bacterial PLFA ratio was 0.11 ± 0.014 (P 0.114, df 4); the average bacterial amount was 125312 ± 9420.2 ng/g dry weight, and the average fungal PLFA amount was 12777 ± 1170.0 ng/g dry weight. The hay strewing treatment had no significant effect on any of the above soil microbial variables. Botanical composition

30
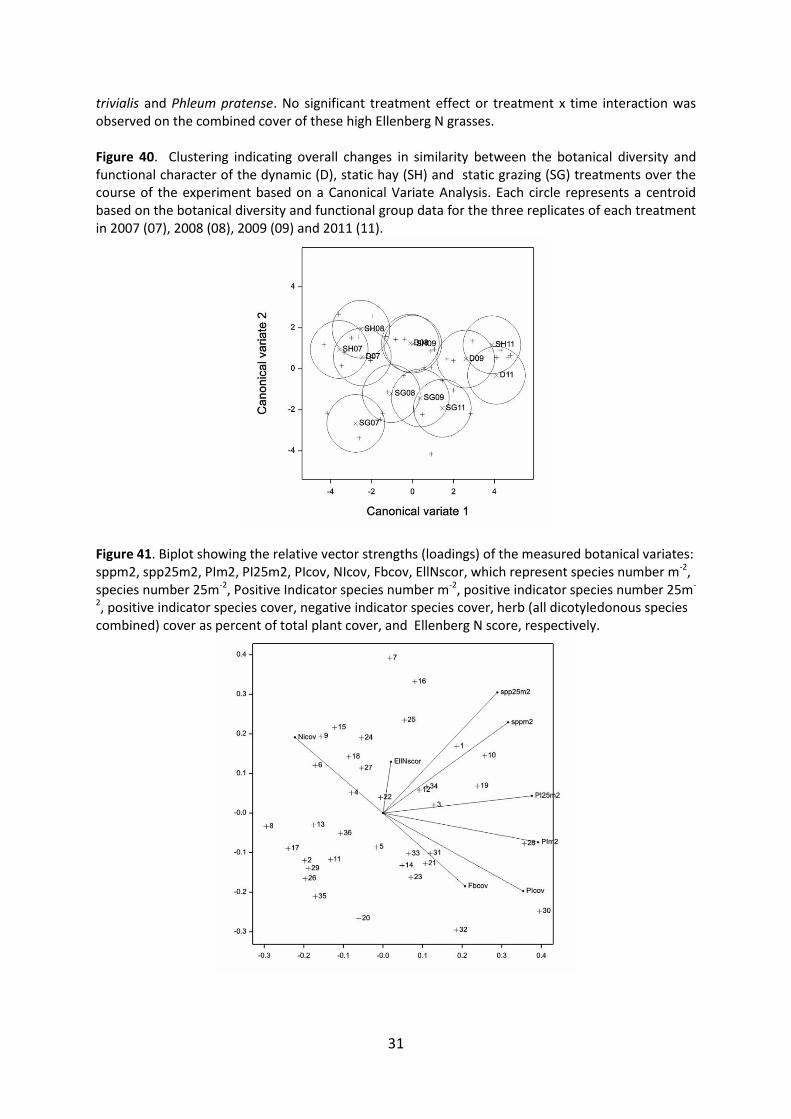
The functional character of the botanical communities on the three treatments changed during the course of the experiment, as indicated by the divergence of treatment based clusters between 2007 and 2011 (Fig. 40), which were derived from canonical variate analysis of the botanical data. The botanical data included total species richness, positive indicator species richness and cover, negative indicator species cover, Ellenberg N score and herb/forb cover as a proportion of total vegetation cover. Figure 40 also shows that the botanical character of the static graze (SG) treatment plots was distinct from the static hay (SH) and dynamic (D) treatment plots at the start of the experiment in 2007 and showed limited convergence with these treatments during the course of the experiment. Positive Indicator (PI) species number and the cover of negative indicator (NI) species both had major influences on the similarity between clusters, as indicated by their high vector loadings in the CVA. Total species richness, whether measured at the scale of 1m2 or 25m2 showed no correlation with PI species number, PI species cover or NI species cover (Fig. 41). Therefore, any change in species richness cannot be interpreted as a reliable indicator of change in the nature conservation quality of the grassland. Total species richness showed a time effect (P0.008) and a marked tendency (P0.077) for a time x treatment interaction, with the number of species m-2 increasing in the D and SH treatments during the course of the experiment, but not in the SG treatment (Fig. 42). There was, however, an apparent scale effect on species diversity response, with a marked tendency (P0.067) for species number per 25m2 to show an overall decline during the course of the experiment (Fig. 43), with no significant treatment or treatment x time interaction. Positive indicator (PI) species richness showed a positive time effect (P <0.001) with greater richness in 2011 compared with 2007 and 2008 (Fig. 44); despite an apparent trend indicating that PI species richness had improved more on the dynamic and static hay treatments than under the static graze treatment there was in fact no significant treatment x time interaction (P 0.382). The cover of PI species was angular transformed to normalize the data prior to carrying out repeated measures ANOVA. PI species cover increased (P0.01) across all treatments during the course of the experiment, but there was no significant treatment effect or treatment x time interaction. Figure 45 shows the mean untransformed values for PI species cover. Positive indicator species richness showed considerable variation across the experiment in 2007 (Fig. 46). During the course of the experiment there was evidence that spatial shifts in PI richness distribution had occurred, with the areas of moderate to high species richness expanding in some of the treatment plots, particularly D1 and D3, but also of areas of very low PI species richness expanding, for example in D2, as indicated by map for 2011 (Fig. 47). Distributional changes in the cover of PI species also occurred with the area of >15% PI cover expanding between 2007 and 2011 (Figs 48 and 49). The abundance of negative indicator (NI) species, such as Cirsium arvense and C. vulgare, was generally greater (P0.049) in the SG plots throughout the experiment than in the other two treatments (Fig. 50). NI species cover showed no significant time effects or treatment x time interactions. There were, however, spatial shifts in the distribution of NI cover between 2007 and 2011 (Figs. 51 and 52), with disappearance of the NI species from plots SH1 and D3. The Ellenberg N score showed no significant time or treatment effects or time x treatment interaction. The average Ellenberg N score was considerably higher than the values observed in 2004 at the end of BD1440 (Fig. 53). Herb/forb cover as a proportion of the total vegetation cover increased (P<0.001) across all treatments over the course of BD1460 (Fig. 54), with no significant treatment effect or treatment x time interaction. Ellenberg N score showed a positive correlation with herb/forb cover (Fig. 55). Herbs/forbs indicative of moderate to high fertility conditions, such as Trifolium pratense and in particular T. repens, with Ellenberg N indices of 5 and 6, respectively (Hill et al., 1999), showed significant (P 0.002 and P 0.016, respectively) increases in their cover over the course of BD1460 (Fig. 56), with no significant treatment effect or treatment x time interaction. Counter balancing the increase in high Ellenberg N forb cover, and accounting for the lack of significant treatment or time effects on the overall Ellenberg N score was a general decrease (P< 0.001) in the combined cover of moderate to high Ellenberg N grasses (Fig. 57), which included Agrostis stolonifera, Alopecurus pratensis, Dactylis glomerata, Holcus lanatus, Lolium perenne, Poa
31
trivialis and Phleum pratense. No significant treatment effect or treatment x time interaction was observed on the combined cover of these high Ellenberg N grasses. Figure 40. Clustering indicating overall changes in similarity between the botanical diversity and functional character of the dynamic (D), static hay (SH) and static grazing (SG) treatments over the course of the experiment based on a Canonical Variate Analysis. Each circle represents a centroid based on the botanical diversity and functional group data for the three replicates of each treatment in 2007 (07), 2008 (08), 2009 (09) and 2011 (11).
Figure 41. Biplot showing the relative vector strengths (loadings) of the measured botanical variates: sppm2, spp25m2, PIm2, PI25m2, PIcov, NIcov, Fbcov, EllNscor, which represent species number m-2, species number 25m-2, Positive Indicator species number m-2, positive indicator species number 25m-
2, positive indicator species cover, negative indicator species cover, herb (all dicotyledonous species combined) cover as percent of total plant cover, and Ellenberg N score, respectively.

32
Figure 42. Species richness per m2 of the dynamic (D), static hay (SH) and static graze (SG)
treatments over the course of BD1460. Error bars indicate 2x SEM.
Figure 43. Species richness per 25m2 of the dynamic (D), static hay (SH) and static graze (SG) treatments over the course of BD1460. Error bars indicate 2x SEM.
Figure 44. Positive indicator (PI) species richness of the dynamic (D), static hay (SH) and static graze (SG) treatments over the course of BD1460. Error bars indicate 2x SEM.
12
14
16
18
20
22
2007 2008 2009 2010 2011
Spec
ies
m-2
D SH SG
16
18
20
22
24
26
28
2007 2008 2009 2010 2011
Spec
ies
25
m-2
D SH SG

33
Figure 45. Positive indicator (PI) species cover of the dynamic (D), static hay (SH) and static graze (SG) treatments over the course of BD1460. Error bars indicate 2x SEM.
0
1
2
3
4
2007 2008 2009 2011
PI s
pp
No
s m
-2
D SH SG
0
5
10
15
20
25
2007 2008 2009 2011
PI s
pp
co
ver
(%)
D SH SG

34
Figure 46. Spatial variation in the positive indicator species richness across the experiment site in 2007.

35
Figure 47. Spatial variation in the positive indicator species richness across the experiment site in 2011.
Figure 48. Spatial variation in the positive indicator species cover across the experiment site in 2007.

36
Figure 49. Spatial variation in the positive indicator species cover across the experiment site in 2011.
Figure 50. Negative indicator (NI) species cover of the dynamic (D), static hay (SH) and static graze
(SG) treatments over the course of BD1460.
-0.5
0.0
0.5
1.0
1.5
2.0
2007 2008 2009 2010 2011
NI S
pp
co
ver
(%)
D SH SG

37
Figure 51. Spatial variation in the negative indicator (NI) species cover across the experiment site in 2007.
Figure 52. Spatial variation in the negative indicator (NI) species cover across the experiment site in 2011.

38
Figure 53. Ellenberg nutrient (N) score on the dynamic (D), static hay (SH) and static graze (SG) treatments over the course of BD1460. Horizontal dashed line represents the mean Ellenberg N score across all treatment plots in 2004 at the end of BD1440.
Figure 54. Herb/forb cover as a percent of total vegetation cover on the dynamic (D), static hay (SH) and static graze (SG) treatments over the course of BD1460.
Figure 55. Relationship between ellenberg nutrient (N) score and herb/forb cover as a percent of total vegetation cover on the dynamic (D), static hay (SH) and static graze (SG) treatments over the course of BD1460.
400
500
600
700
800
900
2007 2008 2009 2010 2011
Elle
nb
erg
N s
core
D SH SG
0
10
20
30
40
50
2007 2008 2009 2010 2011
Her
b c
ove
r (%
)
D SH SG

39
Figure 56. Cover of Trifolium pratense (Tp) and T. repens (Tr) on the dynamic (D), static hay (SH) and static graze (SG) treatments in 2007 (07), 2008 (08), 2009 (09) and 2011 (11). Columns with patterned fill represent Trifolium pratense, columns with solid fill represent T. repens.
Figure 57. Combined cover of moderate to high Ellenberg N grasses on the dynamic (D), static hay (SH) and static graze (SG) treatments over the course of BD1460.
y = 4.5448x + 455.78 R² = 0.678
400
600
800
1000
1200
1400
0 20 40 60 80 100 120
Elle
nb
erg
N s
core
Total herb species cover
Ellenberg N score vs herb cover
0
2
4
6
8
10
12
14
16
Tp 07 Tr 07 Tp 08 Tr 08 Tp 09 Tr 09 Tp 11 Tr 11
Trif
oliu
m s
pp
co
ver
(%)
D SH SG
0
20
40
60
80
100
120
2007 2008 2009 2011
Hig
h E
llN g
rass
co
ver
(%)
D SH SG

40
Green Hay spreading experiment Species-richness showed a significant (P0.003) time effect on the green hay spread plots, with the total number of species increasing from 15 m-2 in 2007 to 20 m-2 in 2009/2011 (Fig. 58). No treatment effect or treatment x time interaction on species richness was observed. A significant (P0.037) time x plot (main treatment versus green hay spread sub-plot) interaction occurred. The increase in species-richness on the hay spread plots was greater, by 1 – 2 species, than the observed increase over time on the main treatment plots of the SH and D treatments. An increase (P0.002) in positive indicator (PI) species richness was also observed on the hay spread plots between 2007 and 2011, by one species on the D treatment and two species on the SH treatment (Fig. 59). There was, however, no significant difference between the increases in PI species richness on the hay spread plots compared with the unspread main plots. There was a treatment x time interaction (P0.050) on PI species number change, with the PI species number increase in the D treatment being principally between 2007 and 2009 with little change between 2009 and 2011, whereas in the SH treatment the PI richness tended to increase throughout the course of BD1460. The cessation of PI species recruitment after 2008 in the D treatment corresponded with the transition from hay cutting in 2007 and 2008 to grazing only in 2009-2011, whereas in the SH treatment, where hay cutting continued each year, and where PI species richness was initially lower than in the D plots, the recruitment of PI species continued throughout the course of the project. The cover of PI species increased (P 0.010) on the hay spread plots over the course of BD1460 (Fig. 60). There was, however, no significant difference in the increase in PI species cover between the hay spread and the unspread main plots. Large variation in the cover of PI species between the replicates, particularly of the D treatment, as indicated by Fig.49, was almost certainly a factor in the lack of a clear treatment effect. Figure 58. Total species richness on the green hay strewn plots in the dynamic (D) and static hay (SH) treatments over the course of BD1460.
Figure 59. Positive Indicator (PI) species richness on the green hay strewn plots in the dynamic (D) and static hay (SH) treatments
0
5
10
15
20
25
2007 2008 2009 2011
Spp
no
s m
-2
D SH
0.0
1.0
2.0
3.0
4.0
5.0
2007 2008 2009 2011
PI s
pp
no
s m
-2
D SH

41
Figure 60. Positive Indicator (PI) species cover on the green hay strewn plots in the dynamic (D) and static hay (SH) treatments
0
5
10
15
20
25
30
2007 2008 2009 2011
PI c
ove
r (%
)
D SH

42
Potential mineralizable nitrogen Canonical variate analysis (CVA) of the potential mineralizable nitrogen (PMN) data showed some evidence of divergence of the treatments during the course of BD1460, with the static hay treatment separating from the static graze and dynamic treatments in 2009 and 2010 (Fig. 61). However, this separation of the static hay treatment from the other two treatments was lost in 2011. The CVA did however show that there had been a general shift in PMN between 2007/08 and 2009-2011. Repeated measures ANOVA showed that a significant (P0.043) treatment effect on PMN occurred in just one year, 2008, with the SH treatment having lower PMN values throughout the sampling period from mid-March to mid-July. However, the D treatment, which was the same as the SH treatment in 2008 although showing no significant difference to the SH treatment also showed no significant difference to the SG treatment. In 2008 there was also a time effect (P0.002), but no significant treatment x time interaction, with PMN varying during the course of the sampling period with high values in late May, but no difference at most of the other sampling occasions. No significant treatment effects or treatment x time interaction was observed in any of the other years. A highly significant (P<0.001) year effect on PMN with no significant time x treatment interaction was observed over the course of BD1460, with PMN increasing across all treatments between 2007/08 and 2010/11 (Fig. 62). Figure 61. Dendrogram showing relationships between the dynamic (D), static hay (SH) and static graze (SG) treatments based on canonical variates analysis of their potential mineralizable soil nitrogen amounts sampled at 14 day intervals between mid March and mid July each year, 2007 (07) – 2011 (11) .

43
Figure 62. Change in the average potential mineralizable nitrogen (PMN) in the soil of the dynamic (D), static hay (SH) and static graze (SG) treatments over the course of BD1460. The PMN values are the average values for the whole of the sampling period, from March to July each year.
Invertebrate studies
Pollinator responses A significant difference was found between years in the overall abundance and species richness for
the butterflies and bumblebees combined (total pollinators) (Table 5). Values of abundance and
species richness were significantly greater in 2007 and 2011 compared to 2008 and 2009 (Tukey test,
P < 0.05). This response was mirrored by values of butterfly abundance and species richness,
indicating that butterflies were mainly driving this collective response (Figures 63 & 64). The
variability in butterfly responses with year is likely to reflect differences in weather between years,
particularly in 2008 and 2009 which were associated with high rainfall and relatively cold summers.
Table 5. Results of repeated measures mixed model analysis of pollinator and surface active
invertebrate abundance and species richness responses to treatment (dynamic, static hay static
grazed) and year. Where: NS = p>0.05; * = p<0.05; **=p<0.01; ***=p<0.001.
Year Treatment Year Treatment
Pollinator responses
Total pollinator abundance F3,30= 30.7*** NS NS
Total pollinator species richness F3,28= 13.8*** NS NS
Butterfly abundance F3,30= 33.4*** NS NS
Butterfly species richness F3,30= 14.4*** NS NS
Bumblebee abundance F3,28= 5.9** NS NS
Bumblebee species richness F3,28= 4.8** NS NS
Surface active invertebrates
Beetle abundance F3,30= 28.6*** NS NS
Beetle species richness F3,28= 46.4*** F3,28= 3.6* NS
Spider abundance F3,28= 8.2*** NS NS
Spider species richness F3,28= 3.5* NS NS
0
100
200
300
400
500
600
700
2007 2008 2009 2010 2011
PM
N
(µg
g d
ry s
oil-1
) SG SH D

44
Figure 63. Effect of management treatment on mean butterfly abundance according to year. Original
data presented ±SE.
Figure 64. Effect of management treatment on butterfly species richness according to year.
Original data presented ±SE.
Plant visitations - Butterflies The majority of butterfly observations were recorded as in flight, and plant visitations were only observed for five butterfly species: meadow brown (Maniola jurtina), common blue (Polyommatus icarus), small copper (Lycaena phlaeas), large white (Pieris brassicae), and painted lady (Vanessa cardui). A total of ten different plant species were visited, the most frequently utilised was Centaurea nigra, which accounted for 25% of all butterfly visits, whilst the negative indicator species, Cirsium arvense accounted for 24% of visits (Table 6). The meadow brown was the most frequent visitor to C. nigra, and accounted for 38% of its foraging visits and 23% of all butterfly visits observed irrespective of plant species. Cirsium arvense also accounted for 36% of its visits and 22% of all visits. Lotus corniculatus was visited only by the common blue butterfly, and this made up 55% of all its plant visits.
0
5
10
15
20
25
30
35
40
45
Static Grazed Static Hay Dynamic
No
s 6
00
m-2
2007200820092011
0.0
1.0
2.0
3.0
4.0
5.0
6.0
Static Grazed Static Hay Dynamic
No
s 60
0 m
-2
2007 2008 2009 2011

45
Table 6. Percentage of butterfly visitations based on a total of 79 observations across all years and irrespective of treatment.
Forage Species Percentage
of visits
Centaurea nigra 25
Cirsium arvense 24
Lotus corniculatus 15
Trifolium pratense 11
Prunella vulgaris 8
Ranunuculus acris 5
Succisa pratensis 4
Ranunculus bulbosus 4
Leontodon autumnalis 3
Cerastium fontanum 1
Plant visitations - Bumblebees Plant visitations were mainly limited to two bumblebee species, namely Bombus lapidarius, and B.
pascuorum, although B. terrestris / B. lucorum was occasionally observed foraging. A total of ten
different plant species were visited, and as with the butterflies, the most frequently utilised species
was Centaurea nigra, which accounted for 27% of all visits (Table 7). However, in contrast to the
butterflies, the utilisation of Cirsium arvense by bumblebees was much less and made up only 1% of
the total number of visits observed. Lotus corniculatus and Trifolium pratense were also shown to be
important for the bumblebees.
Table 7. Percentage of bumblebee visitations based on a total of 76 observations across all years and
irrespective of treatment.
Forage Species Percentage
of visits
Centaurea nigra 27
Lotus corniculatus 20
Trifolium pratense 14
Taraxacum officinale 5
Prunella vulgaris 3
Ranunculus bulbosus 2
Ranunuculus acris 2
Cirsium arvense 1
Conopodium majus 1
Trifolium repens 1
Analysis of data collected from 2007 to 2009 previously demonstrated a significantly greater abundance of butterflies for the management treatments of dynamic grazing and static hay compared to static grazing (Westbury et al. 2011). This was believed to reflect the benefit of

46
introducing a traditional hay meadow management regime into an otherwise pastoral system. However, analysis of the complete data set, which included data recorded in 2011, has demonstrated no overall benefit for butterflies or bumblebees compared to plots that were under continuous grazing for either three years (Dynamic treatment) or five years (Static grazed). The greater abundance of butterflies in 2011 associated with the continuous grazing regime has therefore strongly influenced the outcome of the research. It is important to note that invertebrate assessments were conducted before and after the annual hay cut, with only one period of sampling in June before the August hay cut. The floral resources provided in the static hay paddocks were therefore substantially reduced for the two post hay cut sampling rounds (D.B. Westbury, personnel observation). When combined with the fact that peak flight periods for butterflies and bumblebees is July/August, sampling the invertebrates only once prior to the hay cut did not enable the full value of the management for hay to be determined. The post hay cut sampling rounds were also governed by when weather conditions permitted the hay cut in the first instance. Consequently, a delay in the hay cut might be expected to lead to a reduced abundance of pollinators as the season progresses. For example, in 2007, the post hay cut and aftermath grazing samples were completed in mid-August and mid-September, whilst in 2008 they were completed in early and mid-September, and in mid-September and mid-October during 2009. It is evident from Figure 65, that in 2011, the overall number of butterflies recorded in August (Round 2) was greater than in June and September (Rounds 1 and 3, respectively), particularly for the Static graze and Dynamic treatments (Fig. 66). However, by this point, the paddock had already been cut for hay. Differences in sampling time according to year will affect the range and abundance of butterflies and bumblebees recorded. Figure 65. Butterfly abundance (total numbers of individuals recorded during sampling visit for all
three replicates combined) according to treatment and sampling period in 2011. June = Round 1;
August = Round 2; September = Round 3. Original data presented.
No differences in management treatment were found for bumblebee abundance and species
number (Table 5). An overriding factor was the low abundance of bumblebees recorded across all
experimental paddocks despite the presence of suitable forage plant species. The low abundance of
bumblebees is likely to reflect landscape scale effects which were beyond the scope of the
0
10
20
30
40
50
60
70
80
90
Static Graze Static Hay Dynamic
No
s 18
00
m-2
June
August
September

47
experimental manipulations investigated. However, following three field seasons of low bumblebee
abundance (2007 - 2009), numbers recorded in 2011 were significantly greater than in previous
years (Table 5) (Fig. 66). This was also coupled with a significantly greater number of bumblebee
species (Table 5) (Fig. 67).
Figure 66. Bumblebee abundance (total numbers of individuals recorded during sampling visit)
according to management treatment and year. Original data presented ±SE.
Figure 67. Bumblebee species number according to management treatment and year. Original data
presented ±SE.
Beetle responses Beetle abundance was strongly dependent on year, with a significant year effect being found (Table
5). Numbers were greater in 2011 than in all previous years studied (Tukey test, P < 0.05) (Fig. 68).
No difference was found between 2008 and 2009 (Tukey test, P > 0.05), but all years were greater
0.0
2.0
4.0
6.0
8.0
10.0
12.0
14.0
16.0
Static Grazed Static Hay Dynamic
No
s 60
0 m
-2
2007 2008 2009 2011
0.0
0.5
1.0
1.5
2.0
2.5
3.0
Static Grazed Static Hay Dynamic
No
s 60
0 m
-2
2007 2008 2009 2011

48
than in 2007 (Tukey test, P < 0.05). Treatment was also shown to significantly influence beetle
species richness, with significantly greater values associated with the Dynamic treatment compared
to Static grazed (Tukey test, P < 0.05). No differences were found between Static graze and Static
hay, and Static hay and the Dynamic treatment (Tukey test, P > 0.05) (Fig. 69).
Figure 68. Effect of management treatment on beetle abundance according to year. Original data presented ±SE.
Figure 69. Effect of management treatment on beetle species number according to year. Original data presented ±SE. Treatments with same letter do not differ significantly (Tukey test, P > 0.05).
Spider Responses Spider abundance was strongly influenced by year (Table 5), with a significantly greater number
recorded in 2008 compared to other years (Tukey test, P < 0.05) (Figure 70). Values recorded in
0
50
100
150
200
250
300
350
Static Grazed Static Hay Dynamic
No
s 60
0 m
-2
2007 2008 2009 2011
0.0
5.0
10.0
15.0
20.0
25.0
30.0
Static Grazed Static Hay Dynamic
No
s 60
0 m
-2
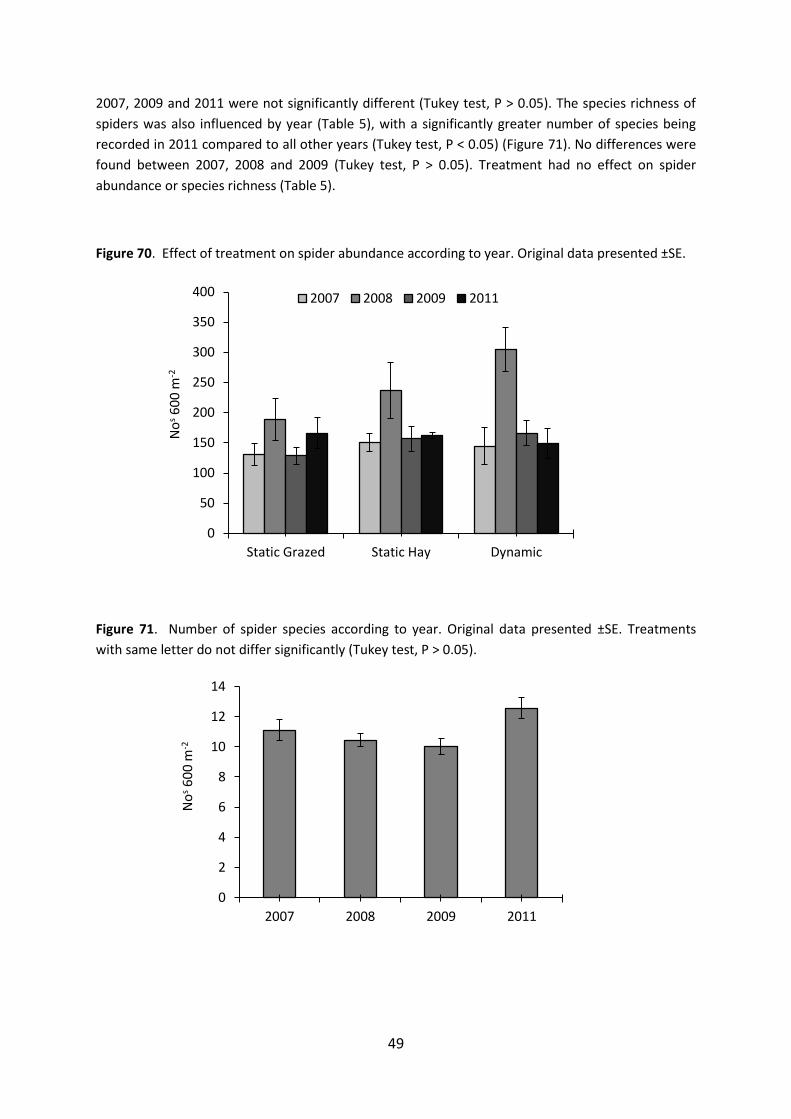
49
2007, 2009 and 2011 were not significantly different (Tukey test, P > 0.05). The species richness of
spiders was also influenced by year (Table 5), with a significantly greater number of species being
recorded in 2011 compared to all other years (Tukey test, P < 0.05) (Figure 71). No differences were
found between 2007, 2008 and 2009 (Tukey test, P > 0.05). Treatment had no effect on spider
abundance or species richness (Table 5).
Figure 70. Effect of treatment on spider abundance according to year. Original data presented ±SE.
Figure 71. Number of spider species according to year. Original data presented ±SE. Treatments
with same letter do not differ significantly (Tukey test, P > 0.05).
0
50
100
150
200
250
300
350
400
Static Grazed Static Hay Dynamic
No
s 60
0 m
-2
2007 2008 2009 2011
0
2
4
6
8
10
12
14
2007 2008 2009 2011
No
s 60
0 m
-2

50
Green hay spreading experiment: effects on invertebrates
The effect on invertebrates of green hay spreading, as a means of introducing key plant species into an existing sward, was tested for both the dynamic and static hay grazing treatments as a split plot effect. Its effects were assessed for the beetles and spiders using repeated measures mixed models. The static grazed treatments, with no hay spreading treatment were excluded from the analysis. All single and interaction terms of grazing treatment, hay spreading and year were tested. No significant difference was found between management treatments for values of beetle and spider species number and abundance. However, beetle abundance was strongly influenced by hay spreading (F1,35 = 7.0, P = 0.012). A greater abundance of beetles was found in plots not treated with the hay spreading treatment. This response was not expected, particularly as plots treated with hay have shown an increase in plant species diversity see Figs. 58 - 60). A significant interaction between the hay spreading treatment and year was also found for beetle abundance (F3,35 =5.8, P < 0.01), indicating that responses varied between years to the hay strewing treatment. No effects of hay spreading were found for the number of beetle species. Irrespective of management treatment and hay addition, beetle abundance was shown to vary significantly with year (F3,35 =57.8, P < 0.001), being significantly greater in 2011 compared to all previous years (Tukey test, P <0.05). Furthermore, the number of beetle species was also strongly influenced by year (F3,40 =38.5, P < 0.001), with a significantly greater number of species in 2011 compared to all previous years (Tukey test, P < 0.05). The hay spreading treatment had no significant effect on spider abundance and species richness. However, significant year effects were found for spider abundance (F3,40 = 13.7, P <0.001) and species number (F3,38 = 5.7, P <0.01). Spider abundance was significantly greater in 2008 compared to 2007, 2009 and 2011 (Tukey test, P < 0.05), whilst no difference in abundance was found between 2007 and 2009 (Tukey test, P > 0.05). In contrast, the number of species recorded in 2011 was significantly greater in 2011 (Tukey test, P < 0.05), with no difference between all other years (Tukey test, P > 0.05).
Lowland grassland SSSI condition assessment
For each of the main experimental plots of BD1460 a “Lowland grassland SSSI condition assessment”
for MG5 type grassland (Table 5) was carried out using data from the botanical surveys carried out at
the end of the project in 2011. The assessment would usually include a ‘Structured walk’, where the
assessor would walk through a site, stop at 20 random locations and record the presence or absence
of key positive and negative indicator species. If one of these species occurred at 1-4 of the
locations it would be regarded as ‘Rare’; 5-8 as ‘Occasional’ and >9 as ‘Frequent’. As this assessment
was done retrospectively using existing data , the 10 botanical quadrats and surrounding exhaustive
search areas from each paddock where substituted for the 20 random locations and thus the targets
reduced to 1-2 quadrats for ‘Rare’; 3-4 for occasional and >4 for ‘Frequent’.
The condition assessment involves assessing the sward against targets for a range of generic
attributes, as detailed in the table below. If the site fails to reach the set target for any of the
mandatory attributes it is considered to be in unfavourable condition.

51
Table 5. Lowland Grassland SSSI condition assessment form for MG5 type grassland
Attribute (*= mandatory attribute. One failure among
mandatory attributes = unfavourable condition)
Target
Estimate for attribute
*Extent of community (recoverable reduction =
unfavourable; non-recoverable reduction = partially
destroyed)
No loss without
prior consent
As maps 47 and 49 indicate together with
the evidence from the statistical analysis of
the botanical survey data both richness
and abundance/cover of MG5 positive
indicator species increased on most
treatment plots during the course of
BD1460 at this site. It was estimated that >
50 % of the site consisted of grassland with
a PI cover of > 25% with > 3 PI species
present. Spatial variation in PI cover and
richness indicated that factor(s) other than
the applied treatments had influenced the
extent of MG5 grassland development.
Anecdotal evidence suggested that
localised prolonged winter/spring flooding
of the lower lying plots may have been a
factor constraining the development of
MG5 type grassland.
*Sward composition: grass/herb (ie non-Graminae) ratio
40-90% herbs
In 2011 herb species contributed > 30% of
the total vegetation cover in the static hay
and dynamic treatment plots, but <25% in
the static grazed plots.
*Sward composition: frequency of positive indicator
species/taxa. (DAFOR scale: D = Dominant; A =
Abundant, F = Frequent, O = Occasional, R = Rare, N =
Not recorded)
Agrimonia eupatoria (R), Alchemilla spp. (N), Anenome nemorosa (N), Centaurea nigra (F), Euphrasia spp. (N), Filipendula ulmaria (N), Filipendula vulgaris (N), Galium verum (O), Genista tinctoria (N), Lathyrus linifolius (=L. montanus) (N), Lathyrus pratensis (F), Leontodon hispidus/L. saxatilis (R), Leucanthemum vulgare (O), Lotus corniculatus (F), Pimpinella saxifraga (N), Polygala spp. (N), Potentilla erecta (N), Primula veris (O), Rhinanthus minor (R), Sanguisorba minor (R), Sanguisorba officinalis (N), Serratula tinctoria (R), Silaum silaus (R), Stachys officinalis (R),Succisa pratensis (R), Tragopogon pratensis (R), small blue-green Carex spp. (leaves less than 5mm
wide) (=C. flacca, C. nigra, C. panicea) (O).
At least two
species/taxa
frequent and
four occasional
throughout the
sward
In 2011 there was on average > 2 PI
species m-2
in the static hay and dynamic
treatment plots, but < 2 PI species m-2
overall in the static grazed plots. Areas with
> 4 PI species were frequent.

52
Attribute (*= mandatory attribute. One failure among
mandatory attributes = unfavourable condition)
Target
Estimate for attribute
*Sward composition: frequency of negative indicator
species/taxa.
Anthriscus sylvestris (N), Cirsium arvense (O),
Cirsium vulgare (R), Galium aparine ( R), Plantago major (R), Pteridium aquilinum (N), Rumex crispus (R) ,
Rumex obtusifolius (R), Senecio jacobaea ( R),
Urtica dioica (N).
No species/taxa more
than occasional
throughout the sward
or singly or together
more than 5% cover
Combined total cover of these Negative
Indicator species was < 2 % on any
individual treatment plot
*Sward composition: indicators of waterlogging. Cover
% of Juncus spp, Deschampsia cespitosa, large Carex
spp. (leaves more than 5mm wide) eg Carex
acutiformis, large grasses (leaves more than 10mm
wide, stout stems) ie Glyceria maxima, Phalaris
arundinacea, Phragmites australis.
Note: Care is required on ridge-and-furrow fields where
the furrows may support a different interest feature (eg
wet grassland).
No species/taxa
together or singly
covering more than
10% of the sward
The combined cover of Juncus spp and
Deschampsia cespitosa was < 10 % on
any individual treatment plot
*Sward composition: frequency and % cover of all
scrub and tree species, considered together. NB If
scrub/tree species in pastures are more than occasional
throughout the sward but less than 5% cover, they are
soon likely to become a problem if grazing levels are
not sufficient or if scrub control is not being carried out.
No more than 5%
cover
The combined cover of all scrub species
was <1% on any individual treatment
plot
Sward structure: average height. Upper target refers to
pastures only.
5-15 cm
The average sward height on the grazed
plots was maintained within the target of
< 15cm
Sward structure: litter in a more or less continuous
layer, distributed either in patches or in one larger area.
Total extent no more
than 25% of the
sward
Litter generally comprised < 1%
Sward structure: extent of bare ground (not rock)
distributed through the sward, visible without disturbing
the vegetation.
No more than 5%
Bare ground generally comprised < 1%
The grassland under the static hay and dynamic managements in particular would be considered in
favourable – improving condition, failing only to meet the target of 40 – 90 % cover of herb species.
In total 90 individual assessments were made in 2011 across the experimental area (13.5 ha) and

53
only the high proportion of grasses in the vegetation cover, particularly in the static grazing
treatment plots, could be considered unfavourable.
Discussion
Agronomic responses to the managements:
The average daily growth rate of cattle on the agriculturally unimproved species-rich grassland in the static grazing treatment of BD1460 was 0.67 kg day-1. This performance over the grazing season was poor in comparison with similar sized and breed type cattle on the species-rich grassland grazing at a similar moderate intensity in the previous BD 1440 project at this site, where the average weight gain averaged 0.81 kg day-1 per grazing season (Griffith and Tallowin, 2007). The growth rates of the cattle on the species-rich grassland of BD1460 also tended to be below the average, of 0.70-0.80 kg day-1, for growing beef cattle on fertilized agriculturally improved species-poor grassland (Tallowin et al., 1990; Orr et al., in press) and below the expected performance of over 1.0 kg day-1 for large framed commercial beef cattle at pasture (Eblex Beef Better Returns Programme Manual 7: www.eblex.org.uk).
The higher growth rates of cattle on the D treatment in 2009, of 0.86 kg day-1, compared with 0.71 kg day-1 of the cattle on the SG treatment indicates that there was a carry-over effect from the hay cutting management of the previous year(s). This one year only benefit to animal performance on the D treatment was possibly due to structural effects on the vegetation rather than a “clean” grazing effect on pasture parasite/worm burden. This contention is supported by the fact that all of the cattle were routinely treated to control intestinal parasites. The vegetation structural effect is however, weakened by the fact that these plots were aftermath grazed. It is nevertheless contended that sensory cues that affect grazing behaviour such as old dung pat and rejection sites, which reduce overall utilization of a pasture and intake may not have become widely or well established on the D plots during the relatively short aftermath grazing period. Whatever the cause of the enhanced growth rates of the cattle on the D treatment plots in the year following hay cutting this would have had significant economic benefits. In terms of live weight output the D treatment plots produced 32 kg ha-1 more than the SG treatment in 2009, which would have represented >£70 ha-1 gain over the SG treatment (using a market value for store cattle of ca. 220p kg-1 based on Eblex cattle market outlook for April 2011, issue 11/02: www.eblex.org.uk).
The hay regrowths/aftermaths provided a significant benefit to cattle performance in the SH treatment plots. The hay aftermath period on the SH treatment supported on average 60 grazing days ha-1 and an average individual liveweight gain of 1.14 kg day-1 during course of BD1460. In contrast, the average individual liveweight gain during the aftermath period on the SG treatment was only 0.12 kg day-1. The aftermath grazing on the SH treatment produced on average 68 kg of liveweight gain ha-1, whereas over the same period the SG treatment plots produced only 7.2 kg live weight gain ha-1, which represented < 2.5 % of the total seasonal output of 303 kg ha-1 from the SG treatment. The aftermath grazing on the SH treatment plots therefore produced about 22 percent of the total liveweight produced by the SG treatment plots from this species-rich grassland. The poor performance and output of cattle grazing the SG treatment in late summer provides a case for confining the use of this period to grazing with relatively unproductive livestock, such as dry suckler cows or closing the pasture in late summer for a silage cut in the autumn.
From an ecological perspective there are likely to be advantages in leaving areas of pastures ungrazed/uncut in late summer/autumn to enhance structural heterogeneity at the field, farm and landscape scale, in accordance with the now evident connection between farmland biodiversity and habitat structural heterogeneity (Benton et al., 2003). By allowing grassland canopy architectural
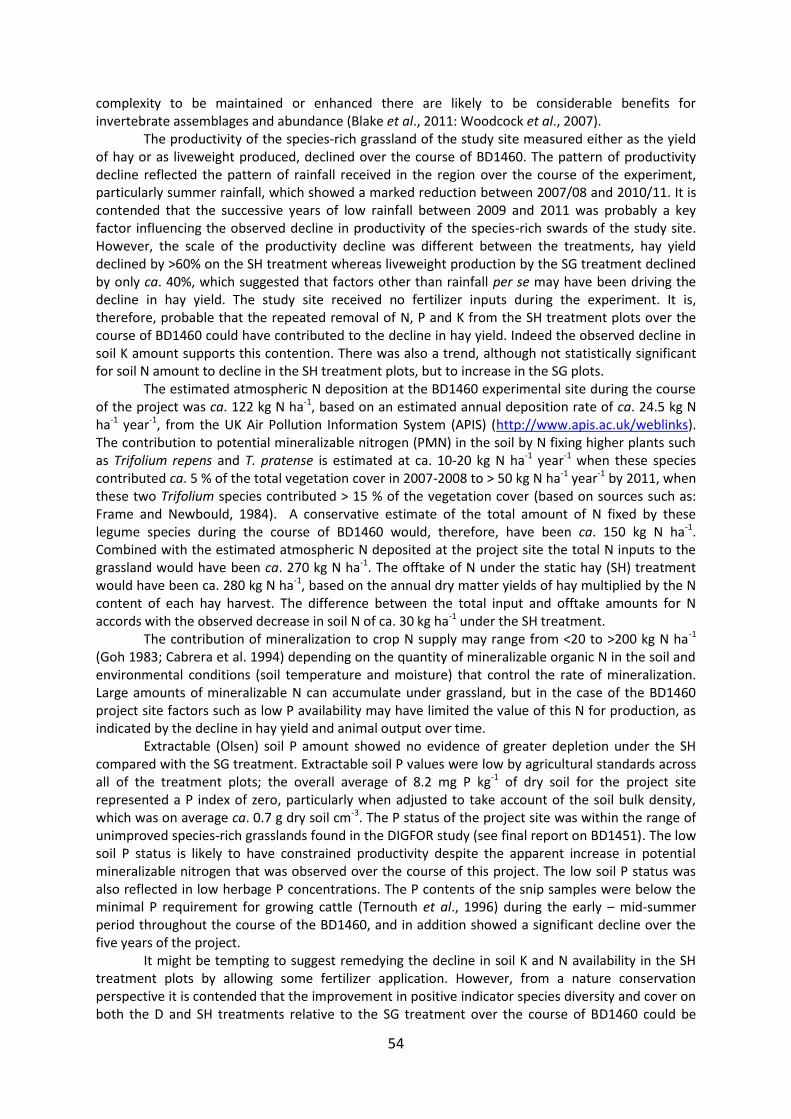
54
complexity to be maintained or enhanced there are likely to be considerable benefits for invertebrate assemblages and abundance (Blake et al., 2011: Woodcock et al., 2007).
The productivity of the species-rich grassland of the study site measured either as the yield of hay or as liveweight produced, declined over the course of BD1460. The pattern of productivity decline reflected the pattern of rainfall received in the region over the course of the experiment, particularly summer rainfall, which showed a marked reduction between 2007/08 and 2010/11. It is contended that the successive years of low rainfall between 2009 and 2011 was probably a key factor influencing the observed decline in productivity of the species-rich swards of the study site. However, the scale of the productivity decline was different between the treatments, hay yield declined by >60% on the SH treatment whereas liveweight production by the SG treatment declined by only ca. 40%, which suggested that factors other than rainfall per se may have been driving the decline in hay yield. The study site received no fertilizer inputs during the experiment. It is, therefore, probable that the repeated removal of N, P and K from the SH treatment plots over the course of BD1460 could have contributed to the decline in hay yield. Indeed the observed decline in soil K amount supports this contention. There was also a trend, although not statistically significant for soil N amount to decline in the SH treatment plots, but to increase in the SG plots.
The estimated atmospheric N deposition at the BD1460 experimental site during the course of the project was ca. 122 kg N ha-1, based on an estimated annual deposition rate of ca. 24.5 kg N ha-1 year-1, from the UK Air Pollution Information System (APIS) (http://www.apis.ac.uk/weblinks). The contribution to potential mineralizable nitrogen (PMN) in the soil by N fixing higher plants such as Trifolium repens and T. pratense is estimated at ca. 10-20 kg N ha-1 year-1 when these species contributed ca. 5 % of the total vegetation cover in 2007-2008 to > 50 kg N ha-1 year-1 by 2011, when these two Trifolium species contributed > 15 % of the vegetation cover (based on sources such as: Frame and Newbould, 1984). A conservative estimate of the total amount of N fixed by these legume species during the course of BD1460 would, therefore, have been ca. 150 kg N ha-1. Combined with the estimated atmospheric N deposited at the project site the total N inputs to the grassland would have been ca. 270 kg N ha-1. The offtake of N under the static hay (SH) treatment would have been ca. 280 kg N ha-1, based on the annual dry matter yields of hay multiplied by the N content of each hay harvest. The difference between the total input and offtake amounts for N accords with the observed decrease in soil N of ca. 30 kg ha-1 under the SH treatment.
The contribution of mineralization to crop N supply may range from <20 to >200 kg N ha-1 (Goh 1983; Cabrera et al. 1994) depending on the quantity of mineralizable organic N in the soil and environmental conditions (soil temperature and moisture) that control the rate of mineralization. Large amounts of mineralizable N can accumulate under grassland, but in the case of the BD1460 project site factors such as low P availability may have limited the value of this N for production, as indicated by the decline in hay yield and animal output over time.
Extractable (Olsen) soil P amount showed no evidence of greater depletion under the SH compared with the SG treatment. Extractable soil P values were low by agricultural standards across all of the treatment plots; the overall average of 8.2 mg P kg-1 of dry soil for the project site represented a P index of zero, particularly when adjusted to take account of the soil bulk density, which was on average ca. 0.7 g dry soil cm-3. The P status of the project site was within the range of unimproved species-rich grasslands found in the DIGFOR study (see final report on BD1451). The low soil P status is likely to have constrained productivity despite the apparent increase in potential mineralizable nitrogen that was observed over the course of this project. The low soil P status was also reflected in low herbage P concentrations. The P contents of the snip samples were below the minimal P requirement for growing cattle (Ternouth et al., 1996) during the early – mid-summer period throughout the course of the BD1460, and in addition showed a significant decline over the five years of the project.
It might be tempting to suggest remedying the decline in soil K and N availability in the SH treatment plots by allowing some fertilizer application. However, from a nature conservation perspective it is contended that the improvement in positive indicator species diversity and cover on both the D and SH treatments relative to the SG treatment over the course of BD1460 could be

55
jeopardized by any improvement in soil fertility. Until the grassland of the SH treatment plots has reached a favourable state, using the criteria of the lowland MG5 type grassland SSSI condition assessment , then it is recommended that no fertilizer should be applied.
The decline in individual performance on the SG treatment between 2007 and 2011, despite the maintenance of the target sward height, which should not have compromised intake, suggests that factors associated with forage quality may have been involved. The only major dietary component that was sub-optimal for growing cattle was the phosphorus (P) content of the herbage, as indicated in Figure 7. However, based on the concentration of P in the snip samples of 1.4 g kg-1 dry matter (DM) and assuming a daily DM intake for 300 – 350 growing beef cattle of 6.9 – 8.1 kg (based on 2.3 % of body weight (Eblex Beef Better Returns Programme Manual 7: www.eblex.org.uk), the daily intake of P would have been 9.2 – 11.3 g, which according to the Agricultural Research Council (ARC, 1980) would have represented an adequate to excessive intake of P. The increase in herbage Ca content during the course of BD1460 was at odds with the observed decline in soil exchangeable Ca and pH. This apparent conflict between plant and soil Ca amounts could be explained by the decline in the grassland productivity and thus reduced dilution effect: the observed reduction in dry matter production could have allowed a greater accumulation of Ca in the herbage dry matter. Despite the changes in herbage Ca content during the course of this project the concentration of this element still remained within the range required by growing cattle (Tallowin & Jefferson, 1999). Perhaps of more concern than the changes in concentration of the individual elements were the changes in their relative proportions. The Agricultural Research Council (ARC, 1980) recommended a dietary Ca:P ratio of between 2:1 and 1:1 to avoid deleterious effects on the growth and health of livestock, which can involve inadequate utilization of certain trace elements (ADAS, 1975). It is therefore possible that the high Ca:P ratios, of > 7 : 1 observed in the snipped forage samples from the SG treatment in July 2010 and the hay from the SH treatment in 2010 and 2011, which were due to a combination of increased herbage Ca content and low herbage P concentration, would compromise growth and feed conversion efficiency in cattle (Wise et al., 1963). The high Ca:P ratios of the forage could also have increased vitamin D requirement of the cattle (Scott and McLean, 1981), but this is unlikely to have been a problem for the cattle at pasture during the summers of 2010 and 11, when the prolonged periods of sunshine would have allowed the animals to produce enough of this vitamin themselves. However, there could be a problem with achieving adequate vitamin D provision feeding the hay during winter months.
Changes in the percentage digestibility of the dry matter (DOMD) of the snipped herbage samples from the SG treatment over the course of BD1460 provided no evidence of a decline in the feed quality of the forage, in fact DOMD for the herbage sampled in May increased between 2007 and 2011. The DOMD values of the snipped herbage samples were similar to the values obtained from the moderate grazing intensity treatment in BD1440, however, the digestibility of the herbage samples from the species-rich grassland tended to be low in comparison with agriculturally improved grassland and grass varieties (Tallowin et al., 1990; Beever et al., 2000). The DOMD of the hay showed a modest improvement between 2007/08 and 2010/11, which may have reflected changes in the botanical composition of the grassland such as the increase in herb/forb to grass ratio and the increase in legume content. The DOMD of the hay was similar to values for hay from other unfertilized semi-natural grasslands cut in mid to late summer (Tallowin & Jefferson, 1999).
Botanical responses to the managements:
The functional character of the grassland under the different management treatments changed during the course of BD1460, with changes in positive indicator (PI) species richness and cover having an important influence on these shifts. A functional characteristic of PI species is that their comparative ecologies are towards stress tolerance (sensu Grime, 2002). Therefore, the shifts that were generally observed during the course of BD1460, which included significant increases in PI species-richness and cover, were in effect shifts towards increased stress tolerance. The functional shifts in the ecology of the plant communities accord with the observed decline in soil fertility, as indicated by the decline in exchangeable K from an index of 2- to 1 and the apparent downward

56
trend in Olsen extractable P, albeit at P index 0 throughout BD1460, at the experimental site. The low soil P status of the experimental site was compatible with the existence of high nature conservation value semi-natural grasslands in the UK (see final report on project BD1451) and Europe (Janssens et al., 1998).
When all of the botanical functional groupings were examined together by CVA it was apparent that the SG treatment plots remained distinctly different from the other two treatments throughout the course of BD1460. The continued separation of the SG treatment from the SH and D treatments was in part due to lower species-richness being maintained on the SG plots and also due to the abundance of negative indicator (NI) species remaining generally greater on this treatment than in the SH and D treatments throughout the course of the experiment. Changes in total species-richness were, however, found to have little correlation with botanical nature conservation quality, as measured by PI species-richness or abundance. The maintenance of NI species under the static grazing treatment was in accordance with the findings of project BD1452 (Hayes & Tallowin, 2007), where continuous grazing by sheep of a mesotrophic grassland enhanced the abundance of Cirsium arvense. The abundance of NI species could have been higher on the SG plots, as there was some spot treatment with herbicide of Cirsium species by the site owner. Taking these issues into account it is apparent that the SG treatment constrained functional shifts in the botanical community of the BD1460 grassland towards higher nature conservation value. Comparing the SH and D treatments there was no evidence of any differences between these two treatments in their effects on the botanical quality of the grassland.
The botanical quality of the grassland, as indicated by PI species richness and cover generally improved under all of the management treatments over the course of BD1460. However, this improvement tended to be uneven between the treatments and between replicates within the same treatment, as indicated by the spatial mapping of the changes in PI species richness and abundance between 2007 and 2011. No clear edaphic cause of this unevenness in PI response was found when examining distributional changes in the measured soil variables. Soil organic carbon (C) content was the most strongly negatively correlated with PI species richness and cover. However, the spatial changes in soil C showed no clear pattern associated with the spatial changes in PI species richness. The area where PI richness showed little or no improvement was in a low lying part of the experimental site, which was prone to flooding, it is therefore possible that this could have been a factor that influenced some of the spatial changes in botanical quality.
The finding that despite PI richness and abundance increases and the decline in soil K, indicative of a general decline in site fertility, the lack of significant change in the Ellenberg N score over the course of BD1460 appears to be anomalous. This apparent anomaly was probably due to compensatory shifts in functional groups within the vegetation. The increases in high Ellenberg N herb species such as Trifolium pratense and T. repens were offset by the decline in high Ellenberg N grasses. What is uncertain, however, is whether the increases in the abundance of these legume species constrained or facilitated the increase in PI richness and abundance. In grasslands that receive low inputs of fertilizer N increase in abundance of T.repens generally facilitates population increases in highly competitive grass species (Hopkins, 2000), but this is generally in the context of P and K being non-limiting. However, the very low P and low K status of the BD1460 site may have facilitated increases in plant species diversity and the establishment of some PI species, as indicated by the relatively high botanical diversity of the high P plot 4/1 of the Park Grass experiment at Rothamsted (Williams, 1978).
The soil fungal to bacterial (F:B) PLFA ratio across all of the treatments was above the average value indicative of semi-natural grasslands of high nature conservation value that was found in the DIGFOR survey (see final report on project BD1451). The high F:B ratio in combination with the fact that the treatment plots had an average PI species-richness of < 3 m-2 and a total herb cover that was below target for a favourable SSSI condition score indicates that there was potential for general improvement in the botanical quality of the grassland. The spatial mapping showed considerable variation between experimental plots in PI species richness, which was largely maintained during the experiment. However, PI species cover showed more general improvement,

57
which also suggests that there was more wide scale potential for botanical quality improvement than the PI richness maps indicated. At the initiation of BD1460 it was contended that improvement in the PI species-richness was probably constrained by a lack of dispersal and a lack of seedling establishment sites within the existing vegetation of the site. The green hay spreading experiment was designed to test this contention. However, it provided little evidence that within site limitations on PI species recruitment could be enhanced by green hay spreading. It is worth noting that the increase in total species richness that was observed in the green hay spread plots was generally poorly correlated with any increase in the botanical quality, as indicated by PI species-richness or cover.
The relatively small improvement in botanical diversity that was achieved by green hay spreading may have been due to the limited time scale over which the spreading was carried out, with just two years of spreading of late cut hay and scarification in just the first year. In light of the findings of the Microsite project (BD1459) it is suggested that in order for green hay spreading to have been more effective in PI and botanical diversity enhancement the scarification treatment should create > 80 percent bare ground, and should have been repeated on different areas with green hay spreading over 2-3 years. It is also suggested that a more targeted approach to specific PI recruitment may be beneficial, for example through seed harvesting when target species have ripe seed and these seed should be sown onto the scarified ground at the same time as green hay spreading. In addition, there was some evidence from the SH treatment of a beneficial effect on species recruitment of continuation of hay cutting and aftermath grazing over several years compared with just two years in the D treatment. Another factor that may have constrained the benefits of the green hay spreading treatment could have been a scale effect: small plots in a relatively large grazed main plot, which allowed the cattle to focus attention on these small plots resulting in high disturbance at the critical times for plant seedling recruitment.
Another major constraint on botanical diversity improvement was probably the isolation of the experimental site from other sources of seed and propagules in the region through lack of livestock movement between high nature conservation sites and the fact that species-rich hay from other meadows is not currently bought in. Support is needed to encourage exchange of hay, green hay and targeted harvests of seed of selected PI species between HNV grassland sites.
Invertebrate studies
Pollinator responses Considerable variability in butterfly abundance and species richness between years due
largely to the effect of differences in weather between years obscured any responses of the
pollinators to the different management treatments. No statistically significant evidence was found
of particular management treatments benefitting either butterfly or bumblebee abundance or
species-richness. Nevertheless this study demonstrated that the moderate-lenient grazing
treatment (in the absence of an annual hay cut) was important for providing floral resources later in
the year for butterflies. The year to year variation in pollinator numbers also demonstrated the
importance of long term ecological studies in deciphering pollinator responses to different grassland
management systems. The lack of a significant difference between the Static graze and Dynamic
treatments also suggests that a two year period of hay cutting during the five year rotation can be
ineffective in increasing butterfly and bumblebee abundance.
Beetle and spider responses Beetle species-richness was enhanced in the Dynamic treatment compared to Static grazed,
but not between the Static graze and Static hay, and Static hay and the Dynamic treatment. The lack of a consistent benefit on beetle species-richness of the treatments involving hay cutting is surprising given that lack of disturbance of grassland provides considerable structural and other resources for invertebrates generally, as indicated by the studies of Woodcock et al. (2007a; 2007b;

58
2010a and 2010b). The fact that no treatment effects were observed on spider abundance or species richness is also unexpected, given that spiders are highly dependent on sward architecture and are so sensitive to subtle changes in grassland management practices (Gibson et al., 1992).
Effect of green hay spreading on invertebrates
Green hay spreading had a negative effect on beetle abundance and no effect on beetle species richness, despite this treatment providing an increase in plant species diversity. The hay spreading treatment had no effect on spider abundance and species richness.
The lack of significant effects of the green hay spreading on the abundance and species richness of spiders and beetles suggests that there were factors that negated any benefits of increasing spatial heterogeneity in the vegetation. The severe disturbance by harrowing the green hay strewn plots would have caused a short-term response, but it is assumed that this effect would have largely disappeared within 3-4 years of its imposition. However, the presence of the green hay strewn sub plots within the main plot is likely to have changed cattle behaviour during the aftermath grazing period in the SH treatment and when the D treatment changed to grazing only. Visual observations of the state of the hay strewn sub-plots and of cattle behaviour indicated that the sub plots had created a focus for inquisitive examination by the cattle, plus associated trampling, dung and urine deposition when they were established. It is contended that this localised response by the cattle to the presence of the sub-plots in years 1 and 2, and in subsequent years of the experiment could have had effects on both plant species recruitment and associated invertebrate community assembly.
Synthesis and potential applications of the findings of BD1460
To avoid the risk of poor performance of growing cattle the grazing period for agriculturally unimproved and species-rich lowland neutral grassland should be restricted to spring - mid-summer. In late-summer/autumn productive stock should be moved onto hay or silage regrowths to gain advantage of “clean grazing” effects on individual animal performance. In late summer/autumn agriculturally unimproved pastures should be either closed for a late silage cut or grazed by less productive stock such as dry suckler cows, and in both cases part (ca. 10 %) of the pasture area should be left undisturbed for ecological benefits such as maintenance of grassland canopy architectural complexity for invertebrates and seed and other food resources for higher trophic groups.
BD1460 provides evidence that a rotational management of agriculturally unimproved species-rich lowland neutral grassland can, as was demonstrated by the dynamic (D) system, provide similar ecological benefits to a static hay management in terms of botanical quality maintenance/improvement. Botanical quality was measured in terms of positive indicator species-richness and abundance. The dynamic management also provided agronomic/economic benefits over the static grazing management with enhanced growth rates of the cattle over the whole grazing season in the year following hay cutting.
BD1460 provided evidence of a decline in soil fertility and productivity as a consequence of repeated hay cutting without any fertilizer inputs under the static hay cutting management. It might therefore be tempting to suggest remedying the decline in soil K and N availability by allowing some fertilizer application. However, using the criteria of the lowland MG5 type grassland SSSI condition assessment, which showed that the BD1460 grassland was still in an improving state, it is recommended that no fertilizer should be applied. This should perhaps be a general rule for grasslands in a similar condition.
BD1460 provided evidence that large amounts of mineralizable N can accumulate under grassland, but factors such as very low P availability may limit the value of this N for production, and facilitate improvement in botanical quality, as indicated by increases in positive indicator plant species richness and abundance.

59
Herbage P concentrations were sub-optimal for productive livestock, but probably of greater concern were supra-optimal ratios of Ca:P in the forage, which could compromise growth, feed conversion efficiency and result in inadequate utilization of certain trace elements. These forage quality issues reinforce the proposal for restricting the grazing of such grasslands by productive livestock to the early – mid-summer period, and for limiting the proportion of the winter feed ration that uses the hay from such grassland to ≤ 10 percent, for example. Research is needed on the optimal use of late cut hay from species-rich meadows by ruminant livestock.
The soil P index of 0 and a soil fungal:bacterial phospho-lipid fatty acid ratio, of 0.11, were compatible with the existence of high nature value semi-natural grasslands generally in the UK. These factors together with the low positive indicator richness, < 3 PI species m-2, and low herb to grass cover ratio, indicated that the BD1460 grassland had potential for improvement in botanical quality. BD1460 provided evidence that static grazing management can constrain development of improved botanical quality compared with the static hay and dynamic managements. Both of the latter had similar benefits for improving the botanical quality of the grassland. Static grazing maintained botanical negative indicator species abundance such as the cover of creeping thistle.
The plant community indicator of site fertility status, the Ellenberg N (EllN) score, showed no change over the course of BD1460, possibly due to compensatory shifts in functional groups: increases in high EllN legumes such as red and white clover were offset by a decline in high EllN grasses. Whether the increases in the abundance of these legumes constrained or facilitated the increase in PI richness and abundance was uncertain and merits further research.
BD1460 provided little evidence that within site limitations on PI species recruitment could be enhanced by green hay spreading. This may have been due to the hay spreading being carried out in just two years using late cut hay in both cases and the scarification occurring in just the first year. The scarification only achieved 40-50% bare ground. Evidence from BD1459 showed that > 80 % bare ground is important for the recruitment of seedlings of many PI species. Another factor that may have constrained the benefits of the green hay spreading treatment was that it was done on small plots within relatively large grazed plots, which allowed the cattle to focus attention on these small plots resulting in high disturbance at the critical times for plant seedling recruitment and could also have constrained any benefits for invertebrates. It is also worth noting that the observed increase in total species richness was poorly correlated with any increase in the botanical quality in the green hay spread plots.
Acknowledgements
This project was funded by the Department for Environment, Food and Rural Affairs. We, the contractors, are most grateful for the support given by Richard Brand- Hardy, Richard Jefferson, and Steve Peel throughout this project. We would also like to thank Val Brown for all of her advice and the considerable support that she gave during this project. We are extremely grateful to Robert Orr for all of his help with the field work, and to Rob Dunn, Deborah Beaumont, Roger Smith and Belinda Wheeler for carrying out the botanical surveys. We owe a great debt of gratitude to Mr David Burnett, who owned Craddocks Farm, for all of his help and cooperation with setting up and running this project, for the provision and care of the livestock and for the tremendous assistance he gave us with day to day field operations.

60
References
ADAS (Agricultural Development and Advisory Service) (1975) The Important Mineral Elements in Animal Nutrition and their Optimum Concentration in Forages. ADAS Advisory Paper no. 16, Ministry of Agriculture, Fisheries and Food. London: HMSO. Agricultural Research Council (ARC), (1980) The Nutrient Requirements of Ruminant Livestock .Slough, UK: Commonwealth Agricultural Bureau. Banaszak, J. (1980) Studies on methods of censusing the numbers of bees (Hymenoptera: Apoidea). Polish Ecological Studies, 6, 355-366. Beever, D.E., Offer, N. and Gill, E.M. (2000) The Feeding Value of Grass and Grass Products. In: A. Hopkins (Ed), Grass its Production and Utilization. 3rd Edition. Published by the British Grassland Society, Blackwell Science Ltd., pp 140-195. Benton, T.G., Vickery, J.A. and Wilson, J.D. (2003) Farmland biodiversity: is habitat heterogeneity the key? Trends in Ecology and Evolution, 18, 182 – 188. Blake R. J., Woodcock B. A., Ramsay A. J., Pilgrim E., Brown V. K., Tallowin J. R. and Potts S. G. (2011) Novel margin management to enhance Auchenorrhyncha biodiversity in intensive grasslands. Agriculture Ecosystems and Environment, 140, 506-513. Cabrera, M.L., Kissel, D.E., and Vigil, M.F. (1994) Potential nitrogen mineralization: laboratory and field evaluation. In J.L. Havlin and J.S. Jacobsen, eds. Soil Testing: Prospects for Improving Nutrient Recommendations. Soil Science Society of America Special Publication No. 40. SSSA and ASA, Madison, WI, pp. 15–30. Defra (Department for Environment, Food and Rural Affairs), (2010). The Fertilizer Manual, RB209, 8th Edition. Published by The Stationery Office; ISBN 978 0 11 243286 9, www.tsoshop.co.uk Ellenberg, H. (1988) Vegetation Ecology of Central Europe. Cambridge: Cambridge University Press. Floate, M.J.S. (1970) Mineralization of nitrogen and phosphorus from organic materials and animal origin and its significance in the nutrient cycle in grazed uplands and hill soils. Journal of the British Grassland Society, 25, 295-302. Frame, J. and Newbould, P. (1984) Herbage production from grass/white clover swards. In D.J. Thomson, (ed). Forage Legumes. British Grassland Society Occasional Symposium No. 16, pp 15-35. Gibson, C.W.D., Hambler, C., & Brown, V.K. (1992) Changes in spider (Araneae) assemblages in relation to succession and grazing management. Journal of Applied Ecology, 29, 132-142. Griffith, B.A. and Tallowin, J.R.B. (2007) Agronomic Value of Biodiverse Grasslands. In J.J. Hopkins (ed) High value grassland: providing biodiversity, a clean environment and premium products. Proceedings of Occasional Symposium No. 38, British Grassland Society, Cirencester, UK. Pp. 225-228. Goh, K.M. 1983. Predicting nitrogen requirements for arable farming: a critical review and appraisal. Proc. Agron. Soc. New Zealand, 13, 1–14.

61
Grime, J.P. (2002) Plant Strategies, Vegetation Processes, and Ecosystem Properties, 2nd Edition. John Wiley and Sons Ltd. Harrison, A.F. (1978) Phosphorus cycles of forest and upland grassland ecosystem and some effects of land management practices, in Phosphorus and the Environment: its chemistry and biochemistry, (eds R. Potter and D.W. Fitzsimmon), pp. 175-199, Elsevier, Amsterdam. Hayes, M.J. and Tallowin, J.R.B. (2007) Recreating biodiverse grasslands:long-term evaluation of practical management options for farmers. In J.J. Hopkins (ed) High value grassland: providing biodiversity, a clean environment and premium products. Proceedings of Occasional Symposium No. 38, British Grassland Society, Cirencester, UK. Pp. 135-140. Hill, M.O., Mountford, J.O., Roy, D.B., & Bunce, R.G.H. (1999) Ellenberg's indicator values for British plants. ECOFACT Volume 2 Technical Annexe. HMSO, Norwich. Hopkins, A. (2000) Herbage Production. In: A. Hopkins (Ed), Grass its Production and Utilization. 3rd Edition. Published by the British Grassland Society, Blackwell Science Ltd., pp 90-110. Janssens, F., Peeters, A., Tallowin, J.R.B., Bakker, J.P., Bekker, R.M., Fillat, F. and Oomes, M.J.M. (1998) Relationship between soil chemical factors and grassland diversity. Plant and Soil 202, 69-78.
Lober, R.W. & Reeder, J.D. (1993) Modified waterlogged incubation method for assessing nitrogen mineralization in soils and soil aggregates. Soil Sci Soc Am J., 57, 400-403. Orr, R.J., Griffith, B.A., Champion, R.A. & Cook, J.E. (in press) Defaecation and urination behaviour in beef cattle grazing semi-natural grassland. Applied Animal Behaviour Science, 139.18-25. Pollard, E. & Yates, T.J. (1993) Monitoring Butterflies for Ecology and Conservation. Chapman and Hall, London. Robertson, H.J. & Jefferson, R.G. (2000) Monitoring the condition of lowland grassland SSSIs. I. English nature’s rapid assessment method. English Nature Research Report No. 315. English Nature, Peterborough. Scott, D., and McLean, A.F. (1981) Control of mineral absorption in ruminants. Proc. Nutr. Soc. 40:257. Tallowin, J. R. B. and Jefferson, R.G. (1999) Hay production from lowland semi-natural grasslands: a review of implications for livestock systems. Grass and Forage Science, 54, 99-115. Tallowin, J.R.B., Kirkham, F.W., Brookman, S.K.E. & Patefield, M. (1990). Response of an old pasture to applied nitrogen under steady-state continuous grazing. Journal of Agricultural Science, Cambridge 115, 179-194. Ternouth, J.H., Bortolussi, G., Coates, D.B., Hendricksen, R.E. and McLean, R.W. (1996) The
phosphorus requirements of growing cattle consuming forage diets. Journal of Agricultural Science,
Cambridge, 126, 503-510.
Theil, H. (1950) A rank invariant method of linear and polynomial regression analysis, I, II, III. Proc. Kon. Nederl. Akad. Wetensch. A, 53, 386-92,521-5, 1397-1412.

62
Waring, S.A. & Bremner, J.M. (1964) Ammonium production in soil under waterlogged conditions as an index of nitrogen availability. Nature 201, 951-952. Westbury, D.B., Woodcock, B.A., Harris, S.J., Griffith, B., Tallowin, J.R. (2011) Sustainable grassland management benefits butterflies. Aspects of Applied Biology, 108, 81-86. Williams, E.D. (1978) Botanical composition of the Park Grass Plots at Rothamsted, 1856-1976. Formerly Rothamsted Experimental Station, now Rothamsted Research, Harpenden, UK. Wilson, J.D., Morris, A.J., Arroyo, B.E., Clark, S.C., & Bradbury, R.B. (1999) A review of the abundance and diversity of invertebrate and plant foods of granivorous birds in northern Europe in relation to agricultural change. Agriculture Ecosystems & Environment, 75, 13-30. Wise, M.B., A.L. Ordoveza, and E.R. Barrick. 1963. Influence of variations in dietary calcium to
phosphorus ratio on performance and blood constituents of calves. Journal of Nutrition, 79, 79-84
Woodcock, B.A., Edwards, A.R., Lawson, C.S., Westbury, D.B., Brook, A.J., Harris, S.J., Masters, G., Booth, R., Brown, V.K., Mortimer, S.R., 2010a. The Restoration of Phytophagous Beetles in Species-Rich Chalk Grasslands. Restoration Ecology, 18, 638-644. Woodcock, B.A., Vogiatzakis, I.N., Westbury, D.B., Lawson, C.S., Edwards, A.R., Brook, A.J., Harris, S.J., Lock, K.A., Maczey, N., Masters, G., Brown, V.K., Mortimer, S.R., 2010b. The role of management and landscape context in the restoration of grassland phytophagous beetles. Journal of Applied Ecology, 47, 366-376. Woodcock, B.A., Potts, S.G., Pilgrim, E., Ramsay, A.J., Tscheulin, T., Parkinson, A., Smith, R.E.N., Gundrey, A.L., Brown, V.K., & Tallowin, J.R. (2007a) The potential of grass field margin management for enhancing beetle diversity in intensive livestock farms. Journal of Applied Ecology, 44, 60-69. Woodcock, B.A., Potts, S.G., Westbury, D.B., Ramsay, A.J., Lambert, M., Harris, S.J., & Brown, V.K. (2007b) The importance of sward architectural complexity in structuring predatory and phytophagous invertebrate assemblages. Ecological Entomology, 32, 302-311.