sustainable sediment remediation - clu-in · distribution statement a: approved for public release;...
TRANSCRIPT

Distribution Statement A: Approved for Public Release; Distribution is unlimited. Printed on recycled paper
TECHNICAL REPORT TR-NAVFAC EXWC-EV-1515
SUSTAINABLE SEDIMENT REMEDIATION
Prepared for NAVFAC EXWC under Contract No. N62583-11-D-0515
September 2015

This page is intentionally blank

iii
REPORT DOCUMENTATION PAGE FORM APPROVED OMB NO. 0704-0188
Public reporting burden for this collection of information is estimated to average 1 hour per response, including the time for reviewing instructions, searching existing data sources, gathering and maintaining the data needed, and completing and reviewing this collection of information. Send comments regarding this burden estimate or any other aspect of this collection of information, including suggestions for reducing this burden to Department of Defense, Washington Headquarters Services, Directorate for Information Operations and Reports (0704-0188), 1215 Jefferson Davis 1. REPORT DATE (DD-MM-YYYY) 2. REPORT TYPE 3. DATES COVERED (From – To)
08-09-2015 Technical Report 9/2015 -
4. TITLE AND SUBTITLE 5a. CONTRACT NUMBER
SUSTAINABLE SEDIMENT REMEDIATION N62583-11-D-0515/T.O. 64
5b. GRANT NUMBER
N/A 5c. PROGRAM ELEMENT NUMBER
N/A 6. AUTHOR(S) 5d. PROJECT NUMBER
Andrew Bullard (Battelle) Ryan Wensink (Battelle) Samuel Moore (Battelle)
N/A
5e. TASK NUMBER
N/A 5f. WORK UNIT NUMBER
N/A 7. PERFORMING ORGANIZATION NAME(S) AND ADDRESS(ES) 8. PERFORMING ORGANIZATION REPORT NUMBER
Battelle 505 King Avenue Columbus, OH 43201
N/A
9. SPONSORING / MONITORING AGENCY NAME(S) AND ADDRESS(ES) 10. SPONSOR / MONITOR’S ACRONYM(S)
NAVFAC EXWC 1000 23rd Ave. Port Hueneme, CA, 93043
NAVFAC EXWC
11. SPONSOR / MONITOR’S REPORT NUMBER(S)
TR-NAVFAC EXWC-EV-1515
12. DISTRIBUTION / AVAILABILITY STATEMENT
Distribution Statement A: Approved for Public Release; Distribution is unlimited
13. SUPPLEMENTARY NOTES
Click here to enter text.
14. ABSTRACT
To date, most green and sustainable remediation (GSR) evaluations have been focused on terrestrial sites with soil and/or groundwater contamination issues. Sediment sites are an important issue for the Navy; however, existing optimization/GSR guidance is not specifically aimed at contaminated sediment issues. This report provides a connection between existing Department of the Navy (DON) optimization/GSR guidance and DON guidance pertaining to sediment sites, and introduces a new version of SiteWise™ that has been developed to integrate sediment-specific remedial activities.
15. SUBJECT TERMS
Click here to enter text.
16. SECURITY CLASSIFICATION OF: 17. LIMITATION OF ABSTRACT
18. NUMBER OF PAGES
19a. NAME OF RESPONSIBLE PERSON
Amy Hawkins a. REPORT b. ABSTRACT c. THIS PAGE
U 55
19b. TELEPHONE NUMBER (include area code)
Click here Click here Click here 805-982-4890 Standard Form 298 (Rev. 8-98)
Prescribed by ANSI Std. Z39.18

iv
This page is intentionally left blank.

v
Acronyms and Abbreviations
ARAR applicable or relevant and appropriate requirement
BMP best management practice BRAC Base Realignment and Closure
CAP criteria air pollutant CERCLA Comprehensive Environmental Response, Compensation and Liability Act COC chemical of concern CSM conceptual side model CY cubic yard
DERP Defense Environmental Restoration Program DoD United States Department of Defense DON United States Department of the Navy DOT Department of Transportation
EO executive order EPA United States Environmental Protection Agency ER, N Environmental Restoration, Navy EU exposure unit
FS feasibility study
GHG greenhouse gas GPM gallon per minute GSR green and sustainable remediation
HP horsepower
IA Investigation Area IC institutional control ITRC Interstate Technology & Regulatory Council
MINS Mare Island Naval Shipyard MMA management and monitoring approach MNR monitored natural recovery
NAVFAC Naval Facilities Engineering Command NOx nitrogen oxide
PM particulate matter PVC polyvinyl chloride
RAA remedial alternatives analysis RA-O remedial action operations RAO remedial action objective RCRA Resource Conservation and Recovery Act RD remedial design RG remediation goal RI remedial investigation

vi
RPM remedial project manager
SOx sulfur oxide SPAWAR Space and Naval Warfare Systems Command SWAC surface area-weighted average concentration
TTZ target treatment zone
USACE United States Army Corps of Engineers
WCSD Watershed Contaminated Source Document
ZVI zero-valent iron
vii
Table of Contents
1.0 Introduction ............................................................................................................................ 1 2.0 Policy and Guidance Background .......................................................................................... 3
2.1 Executive Orders ........................................................................................................... 3 2.2 DON Sediment, Background, and Optimization/GSR Policy and Guidance ............... 3
2.2.1 DON Sediment Policy and Guidance ..................................................................3 2.2.2 DON Background Policy and Guidance .............................................................4 2.2.3 DON Optimization/GSR Policy and Guidance ...................................................5
2.3 DON GSR Metrics ........................................................................................................ 6 3.0 Sustainability Considerations for Sediment Remedial Alternatives ...................................... 8
3.1 Dredging ....................................................................................................................... 8 3.2 Capping ....................................................................................................................... 15 3.3 In Situ Amendments ................................................................................................... 19 3.4 Monitored Natural Recovery ...................................................................................... 20
4.0 Incorporating GSR into the Sediment Remedy Selection Framework ................................ 22 5.0 Case Study Review .............................................................................................................. 24
5.1 Case Study #1: Land-Based Remediation of Near-shore Sediments .......................... 24 5.2 Case Study #2: Sediment Remediation in Open Water .............................................. 30
6.0 Conclusions .......................................................................................................................... 40 7.0 References ............................................................................................................................ 42 Appendix A: Best Management Practices for Enhancing the Sustainability of Sediment
Sampling and Remediation ................................................................................................ A-1
List of Tables
Table 1. DON GSR Criteria (adapted from NAVFAC [2012a]). .................................................. 6
Table 2. SiteWise™ Assumptions to Evaluate Sediment Dredging. ........................................... 12
Table 3. SiteWise™ Assumptions to Evaluate Sediment Capping. ............................................ 18
Table 4. SiteWise™ Assumptions to Evaluate MNR. ................................................................. 21
Table 5. DON GSR Metrics Applicability to CERCLA Criteria (NAVFAC [2012b]). .............. 23
Table 6. SiteWise™ GSR Summary for the Preferred Alternative for Former MINS IA K Sediments. ...................................................................................................................... 27
Table 7. Summary of GSR Evaluation for Two Remedial Alternatives for Bishop Point Sediments Using SiteWise™ Version 3.1. .................................................................... 35

viii
List of Figures
Figure 1. Conceptual Diagram of an Example Environmental Dredging Operation. .................. 10
Figure 2. Conceptual Diagram of an Example Capping Project Using Passive Material Placement. .................................................................................................................... 17
Figure 3. TTZs within IA K at Former MINS in Valejo, California. .......................................... 25
Figure 4. SiteWise™ Results for Former MINS IA K Sediment Remedial Alternatives. .......... 29
Figure 5. Bishop Point Remediation Area at Pearl Harbor. ......................................................... 31
Figure 6. Proportional Impacts by Activity Type for the Focused Dredging with MNR Alternative for Bishop Point Sediments Using SiteWise™ Version 3.1. .................... 36
Figure 7. Comparative Impacts by Activity Type for the Focused Dredging with MNR and ENR Alternatives for Bishop Point Sediments Using SiteWise™ Version 3.1. ......... 38

1
1.0 INTRODUCTION
United States Department of the Navy (DON) policy on optimization calls for all environmental remediation sites to conduct a green and sustainable remediation (GSR) analysis using SiteWiseTM (DON, 2012). To date, most GSR evaluations have been focused on terrestrial sites with soil and/or groundwater contamination issues. Sediment sites are an important issue for the DON; however, existing optimization/GSR guidance is not specifically aimed at contaminated sediment issues and previous versions of the SiteWise™ tool were not generally constructed to assess sediment remedies. This White Paper provides a connection between existing DON optimization/GSR guidance and DON guidance pertaining to sediment sites, and to introduce a new version of SiteWise™ that has been developed to integrate sediment-specific remedial activities.
GSR is a technique that incorporates all environmental aspects of a remedial project to maximize the environmental benefit and minimize unwanted detrimental effects (United States Department of Defense [DoD], 2012). GSR informs remedy selection, design, and operation by considering possible detrimental effects, including, but not limited to, potential damage to green spaces or ecosystems by heavy machinery, the emission of greenhouse gases (GHGs) and other pollutants due to energy use, and the impacts to communities from increased pollution or lost access to land or water. GSR is intended to be a tool that guides environmental remediation professionals to consider all aspects of their remediation decision-making and remedy selection to avoid correcting one environmental problem, while creating another.
In 2012, Naval Facilities Engineering Command (NAVFAC) created the Department of the Navy Guidance on Green and Sustainable Remediation (NAVFAC, 2012a). This guidance document provides a DON-specific approach to incorporating GSR into DON remediation projects. The document presents the DON’s GSR metrics and priorities, methods and tools for evaluating the metrics, and considerations for site characterization, remedy selection and design, long-term monitoring, and reducing environmental impact. It also provides an overview of SiteWiseTM, a tool developed by the DON, the United States Army Corps of Engineers (USACE), and Battelle to evaluate the environmental impact of alternative remedial approaches. The SiteWise™ tool evaluates each remedial option based upon its performance in five primary areas of sustainability: emission of GHGs; consumption of energy; emission of criteria air pollutants (CAPs) (e.g., nitrogen oxides [NOx], sulfur oxides [SOx], and particulate matter [PM]); impacts to water; and protection of worker safety.
This White Paper describes the unique aspects of sediment sites as they are evaluated using DON GSR metrics. This paper also provides guidance for DON remedial project managers (RPMs) and their contractors on applying GSR evaluations to sediment sites in a manner that complies with both DON GSR and DON sediment policy. Case studies are provided to demonstrate the application of GSR at DON sediment sites and to apply a revised version of SiteWiseTM (Version 3.1) to evaluate sediment remedies.
The use of GSR at sediment remediation sites is reviewed in the following sections:
Section 2.0 Policy and Guidance Background: Provides an overview of pertinent policies and guidance documents for GSR, including executive orders (EOs), DON-specific guidance on GSR, sediment remediation and environmental policy, and DON-specific GSR metrics.

2
Section 3.0 Sustainability Considerations for Sediment Remedial Alternatives: Describes the most common remedial alternatives at sediment sites (dredging, capping, in situ amendments, and Monitored Natural Recovery [MNR]) and the application of GSR to each.
Section 4.0 Incorporating GSR into the Sediment Remedy Selection Framework: Describes the process of including GSR metrics into the evaluation and selection of a sediment remedy.
Section 5.0 Case Study Review: Explores the application of GSR at sediment sites using two case study examples: land-based remediation of near-shore sediments and water-based remediation of open water sediments.
Section 6.0 Conclusions and Recommendations: Provides conclusions and recommendations for the implementation of GSR at DON sediment remediation sites.
Section 7.0 References: Lists useful references relied upon in developing this White Paper for further review.

3
2.0 POLICY AND GUIDANCE BACKGROUND
Several DON policy and guidance documents apply to GSR and sediment remediation sites. An overview is provided below of relevant EOs, policies, and guidance that DON RPMs should be aware of when managing sediment sites. A description is also provided below of DON-specific GSR metrics.
2.1 Executive Orders
EOs applicable to promoting federal GSR efforts were historically released in 2007 and 2009: EO 13423, titled Strengthening Federal Environmental, Energy, and Transportation Management, was issued on January 26, 2007; and EO 13514, titled Federal Leadership in Environmental, Energy, and Economic Performance, was issued on October 8, 2009. These historic EOs initially served as the driver behind GSR in the Navy’s Environmental Restoration (ER) Program. However, EO 13693, titled Planning for Sustainability in the Next Decade, was issued on March 25, 2015, and supersedes EOs 13423 and 13514. In the case of EO 13423, EO 13693 specifically indicates that the new order will achieve equal or better environmental efficiency results. The provisions in EO 13693 require that federal agencies increase efficiency and improve environmental performance, in turn protecting the planet for future generations and saving taxpayer dollars through avoided energy costs. Specific goals in EO 13693 relate to increased reliance on renewable electric energy, reduced energy intensity, increased use of alternative energy sources, improved water use efficiency and management, increased use of green infrastructure features, and enhanced sustainability in acquisition and procurement through sustainable and environmentally preferable products and services. EO 13693 contains a number of quantitative sustainability goals that extend through the year 2025, and compels each federal agency (including the DoD) to develop, implement, and annually update a Strategic Sustainability Performance Plan.
2.2 DON Sediment, Background, and Optimization/GSR Policy and Guidance
2.2.1 DON Sediment Policy and Guidance
The Policy on Sediment Site Investigation and Response Action (DON, 2002) is a policy document that provides an overview of the DON-specific practices for sediment cleanup of DON and Marine Corps installations with remediation operations that fall under the Environmental Restoration, Navy (ER, N) or the Base Realignment and Closure (BRAC) programs. The policy is intended to provide an overview of the factors that must be considered when remediating sediments at DON sites. It requires that all Comprehensive Environmental Response, Compensation, and Liability Act (CERCLA) or Resource Conservation and Recovery Act (RCRA) response actions undertaken by the DON be directly linked to a DON or Marine Corps contaminated site. In addition, all sources of contamination, DON and non-DON, must be identified (note that DON policy requires a Watershed Contaminated Source Document [WCSD] be prepared for all sediment sites where non-DON sources may contribute to sediment contamination). This policy ensures that a site will not be re-contaminated after cleanup and helps differentiate responsibility and cost of cleanup by identifying all parties contributing to the contamination. The policy also requires that future land use (if known) be considered when planning response actions, all stakeholders be included in decision making, risk management and
4
background contaminant levels be considered throughout the remediation process, and remediation decisions be feasible, cost-effective, and defensible with a documented monitoring plan and exit strategy.
The Implementation Guide for Assessing and Managing Contaminated Sediment at Navy Facilities (NAVFAC, 2005) provides a comprehensive resource for managing DON contaminated sediment sites. The guidance covers assessing multiple (DON and non-DON) sources, developing a conceptual site model (CSM), assessing fate and transport and characterizing contaminant distribution and background levels, assessing risk to ecological receptors, using weight of evidence decision making, and evaluating remedial options.
The User’s Guide for Assessing Sediment Transport at Navy Facilities (SPAWAR, 2007) provides guidance on using sediment transport information to support sediment management decisions.
NAVFAC’s Guidance for Habitat Restoration Monitoring: Framework for Monitoring Plan Development and Implementation (NAVFAC, 2004) provides guidance for environmental monitoring, specifically for habitat restoration sites (sediment remediation sites can and often do involve habitat considerations, including potential habitat restoration). The purpose of the guidance document is to provide the framework for monitoring, establishing consistent approaches, and identifying decision criteria to assess success at habitat restoration sites. The six-step process requires identifying monitoring objectives, developing a hypothesis, developing decision rules, designing the monitoring scheme, collecting data and assessing results, and making a decision for habitat management.
The DON sediment policy and guidance documents summarized above do not directly address the concept of GSR. However, they do recognize the need for adequate sediment CSMs, source control, and sound decision making for the evaluation, selection, and implementation of sediment remedies. Therefore, the optimized strategies and management approaches outlined in these guidance resources ultimately support more sustainable sediment remedies.
2.2.2 DON Background Policy and Guidance
The Navy Policy on the Use of Background Chemical Levels (DON, 2004a) provides an overview of the DON-specific process for assessing and using background levels of chemicals to inform site-specific cleanup standards for all DON (ER, N and BRAC) sites. The process outlined in this document first requires that the chemicals released are identified, chemicals at or below natural ambient levels are eliminated from the list of chemicals of concern (COCs) requiring remediation, the risks of eliminating these chemicals from cleanup requirements are understood and documented, and remediation goals (RGs) are informed by (but are not below) ambient levels.
More detailed guidance for assessing and using chemical background levels to inform cleanup goals at DON sediment sites is provided in Guidance for Environmental Background Analysis, Volume II: Sediments (NAVFAC, 2003). This document provides a process for reviewing and assessing data needs and provides two methods for establishing background levels: a geochemical method; and a comparative method that includes statistical analysis. The document provides an example case study.

5
The DON background policy and guidance documents summarized above do not directly address the concept of GSR. However, they do support the need for optimizing the remediation footprint at sediment sites by ensuring that site background conditions are taken into account. This is a critical issue for sediment sites located in urbanized watersheds as the ability to achieve and maintain RGs in the presence of background contamination (or with lack of source control) must be considered before implementing a sustainable remedy.
2.2.3 DON Optimization/GSR Policy and Guidance
The DON Guidance for Planning and Optimizing Monitoring Strategies (NAVFAC, 2010) provides comprehensive guidance for optimizing environmental monitoring, including for contaminated sediments. The document provides information about the best placement of monitoring locations, optimized monitoring schedules, analytical methods, proper procedures and techniques, and best practices for data retention, quality assessment, and reporting. Information specific to sediment monitoring is included in the document.
The Defense Environmental Restoration Program (DERP) Manual was updated in March 2012 (DoD, 2012), and instructs DoD components to consider and implement GSR opportunities when feasible and ensure the use of GSR remediation practices where practicable based on economic and social benefits, as well as costs. The 2012 DERP Manual update superseded a GSR memorandum released in August 2009 by the Office of the Under Secretary of Defense (DoD, 2009), which stated the DoD’s commitment to conducting its environmental program in a sustainable manner.
The document Policy for Optimizing Remedial and Removal Actions at All DON Environmental Restoration Program Sites (DON, 2012) specifies when project optimization reviews are required and summarizes effective remediation strategies to meet remedial action objectives (RAOs). This policy superseded the 2004 policy Navy and Marine Corps Policy for Optimizing Remedial and Removal Actions at all Installation Restoration and Munitions Response Program Sites (DON, 2004b). The 2012 policy mandates that GSR be performed for all optimization reviews, that GSR evaluations be conducted using the SiteWise™ tool, and that a Remedial Alternatives Analysis (RAA) be completed to ensure optimization strategies are appropriately considered. As specified in the document, relevant phases of a project where GSR evaluation could be appropriate include the Remedial Investigation (RI), Feasibility Study (FS), Remedial Design (RD), Remedial Action Operations (RA-O), and/or long-term monitoring. This policy also recommends following the Management and Monitoring Approach (MMA) for DON sites. MMA is intended to provide for high quality documents for sites in the post-decision document phase. The approach was designed for use at sites where land use controls and monitoring are part of the remedy and focuses on clearly articulating cleanup goals and exit strategies.
The Department of the Navy Guidance on Green and Sustainable Remediation (NAVFAC, 2012a) provides specific guidance for incorporating GSR in environmental restoration projects at DON sites. This guidance provides a general overview of GSR metrics and presents a step-wise approach for the application of GSR techniques for projects in all phases of the remediation process, including site investigation, remedy selection, RD, construction, RA-O, and long-term monitoring. Methods for evaluating remedy footprints are presented, along with strategies for footprint reduction. This guidance document specifies that GSR is intended to improve a cleanup program by meeting remediation requirements, while also minimizing potential negative

6
environmental, societal, and economic impacts that could occur during or as a result of remedial action.
The DON optimization policy and GSR guidance do not specifically address sediment sites, although the requirements still hold for all ER sites to conduct a GSR evaluation for the relevant CERCLA phases. This White Paper is meant to support GSR efforts for sediment sites by providing for an enhanced discussion of GSR metrics in the context of sediment sites.
2.3 DON GSR Metrics
The DON has identified metrics for assessing GSR: energy consumption; GHG emissions; criteria pollutant emissions; water impacts; ecological impacts; resource consumption and waste generation; worker safety and accident risk; and community impacts. Table 1 describes the eight DON-specific GSR metrics in more detail.
Table 1. DON GSR Criteria (adapted from NAVFAC [2012a])
GSR Criteria Description Considerations
Energy Consumption Reducing the amount of energy consumed lessens impacts on local power suppliers and communities, and lessens the release of GHGs.
Electrical use Fuel for transportation and
equipment (generators, etc.) Energy used for producing
consumable materials
GHG Emissions Reducing the amount of GHG emissions helps to combat climate change. In addition, reducing GHG emissions helps to meet carbon reduction standards and allows the DON to set positive examples of curbing carbon releases.
Energy use Transportation Energy used for producing
consumable materials
Criteria Pollutant Emissions
Smog-causing criteria pollutants (e.g., SOx, NOx, and PM) can cause adverse health problems. Curbing their emission will help decrease the overall concentration in the air.
Energy use Transportation Heavy machinery
Water Impacts/Use Treatment systems can impact the amount of water available for a community. Water can be used by a treatment system (negatively impact availability) or be treated and redistributed to the area (positively impact availability).
Energy production Manufacturing for consumable
materials Treatment systems
Ecological Impacts Any adverse effects to an ecosystem should be considered and minimized. Positive impacts are also possible with treatment options (e.g., wetland construction).
Invasive species Changes in ecosystems Soil, sediment, water disturbances Destruction of habitat
Resource Consumption and Waste Generation
This category applies to any resources not considered in other metrics. Resource consumption and waste generation should be reduced or eliminated, where possible.
Land use Landfill Topsoil for re-grading sites
Worker Safety/Accident Risk
Focusing on worker safety and minimizing accident potential is a guiding principle to all DON activities (NAVFAC, 2012a).
Working around heavy machinery Increased traffic
Community Impacts Community impacts are defined as any local disturbance or positive impact resulting from remediation activities.
Health and safety issues Noise Increased traffic Emission of contaminants

7
The relevant metrics for any DON site are selected and prioritized on a site-specific basis. Issues that influence metric selection include site location, site history and use, local environment and communities, and intended site use (NAVFAC, 2012a). For instance, a site in a residential area would consider community impacts and accident risk more than a site located in a remote area. Alternatively, sites located near green spaces might weigh ecological impacts more than sites in urban areas. SiteWise™ is used to evaluate, quantify, and prioritize these metrics.

8
3.0 SUSTAINABILITY CONSIDERATIONS FOR SEDIMENT REMEDIAL ALTERNATIVES
The challenging nature of underwater sites is reflected by limited availability of remedial options for impacted sediments (NAVFAC, 2005). This section addresses four commonly used and industry-accepted remedial alternatives, including dredging, capping, in situ amendments, and MNR. To attain a sustainable remedial solution, DON RPMs should consider the impacts of potential remedial approaches on the GSR metrics identified by the DON. If possible, an approach or combination of approaches that sufficiently protect human health and the environment, while minimizing negative collateral impacts should be implemented at sediment contamination sites.
SiteWise™ has been used effectively to incorporate GSR into the remedial decision-making process by quantifying the environmental impact of remediation activities. The previous version of SiteWise™ (Version 3.0) did not account for operations specific to the remediation of contaminated sediments. Therefore, SiteWise™ Version 3.1 has been developed to account for the specialized materials, equipment, and activities associated with sediment remediation in GSR evaluations. Industry-accepted guidance, peer-reviewed research, and professional experience served as references for determining the factors and calculations used to estimate the environmental footprint of sediment remediation activities. The following sections present typical sediment-specific remediation activities and describe modules that have been added to Version 3.1 of SiteWise™ to support the application of DON GSR policy at sediment sites. In addition, Appendix A contains a compilation of best management practices (BMPs) for sustainable sediment remediation that can be readily adapted to site-specific needs and incorporated into the FS, remedial design, and/or remedy implementation as appropriate.
3.1 Dredging
Dredging involves the physical removal of contaminated sediments from the affected area for subsequent disposition. Dredging for environmental remediation is different from dredging for navigational purposes, in that the goal of navigational dredging is to remove the maximum amount of sediment possible or required to support operations, while the goal of environmental dredging is typically targeted removals to address contamination and risk in a focused manner (NAVFAC, 2005).
Dredging is the most disruptive remedial technology available to address contaminated sediments. Therefore, GSR considerations can provide useful data to inform remedial decision making related to dredging operations and can provide an additional line of evidence to minimize dredging footprints. Footprint minimization typically leads to focusing remediation on those finite areas that offer substantial remedial benefits, such as source removal or significant risk reduction. There are several benefits to limiting the amount of sediment dredged during environmental remediation:
Reduced potential for re-contamination from dredged sediments, Reduced energy consumption, GHG emission, and criteria pollutant emissions, Reduced ecosystem impacts due to a smaller impacted area, Reduced waste generation,
9
Reduced potential for workplace accidents, and Reduced impact to surrounding communities from vehicle/equipment movement and noise
from machinery
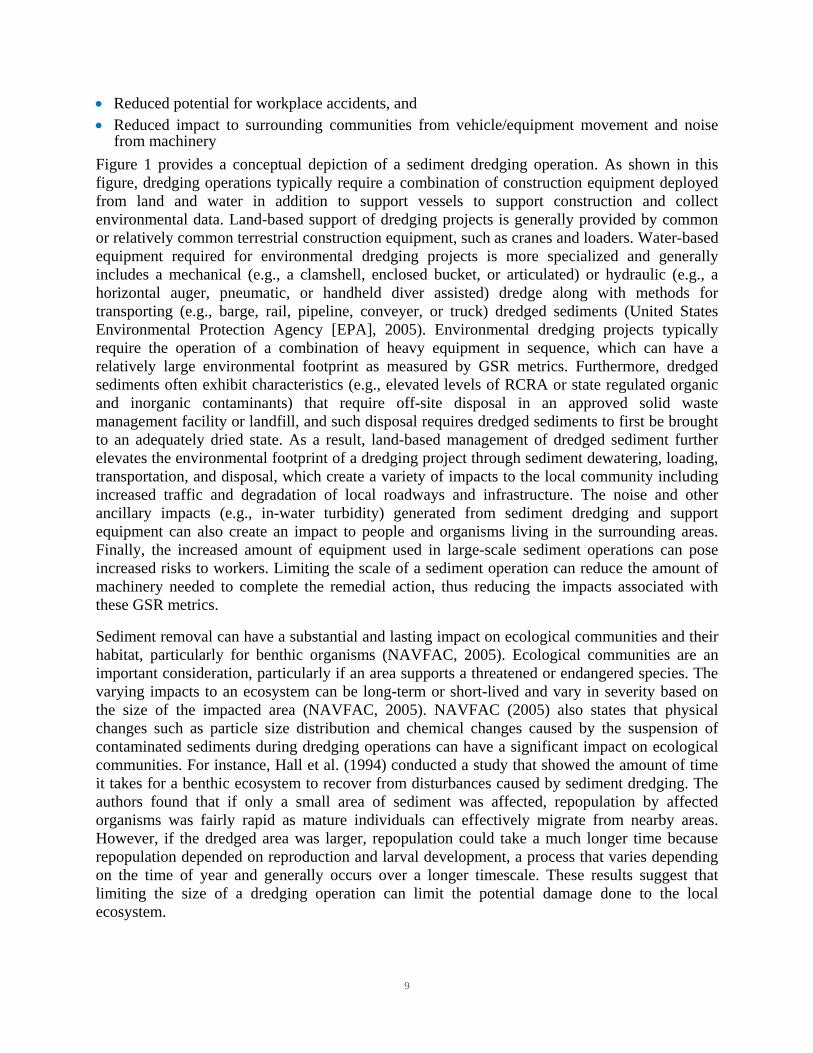
Figure 1 provides a conceptual depiction of a sediment dredging operation. As shown in this figure, dredging operations typically require a combination of construction equipment deployed from land and water in addition to support vessels to support construction and collect environmental data. Land-based support of dredging projects is generally provided by common or relatively common terrestrial construction equipment, such as cranes and loaders. Water-based equipment required for environmental dredging projects is more specialized and generally includes a mechanical (e.g., a clamshell, enclosed bucket, or articulated) or hydraulic (e.g., a horizontal auger, pneumatic, or handheld diver assisted) dredge along with methods for transporting (e.g., barge, rail, pipeline, conveyer, or truck) dredged sediments (United States Environmental Protection Agency [EPA], 2005). Environmental dredging projects typically require the operation of a combination of heavy equipment in sequence, which can have a relatively large environmental footprint as measured by GSR metrics. Furthermore, dredged sediments often exhibit characteristics (e.g., elevated levels of RCRA or state regulated organic and inorganic contaminants) that require off-site disposal in an approved solid waste management facility or landfill, and such disposal requires dredged sediments to first be brought to an adequately dried state. As a result, land-based management of dredged sediment further elevates the environmental footprint of a dredging project through sediment dewatering, loading, transportation, and disposal, which create a variety of impacts to the local community including increased traffic and degradation of local roadways and infrastructure. The noise and other ancillary impacts (e.g., in-water turbidity) generated from sediment dredging and support equipment can also create an impact to people and organisms living in the surrounding areas. Finally, the increased amount of equipment used in large-scale sediment operations can pose increased risks to workers. Limiting the scale of a sediment operation can reduce the amount of machinery needed to complete the remedial action, thus reducing the impacts associated with these GSR metrics.
Sediment removal can have a substantial and lasting impact on ecological communities and their habitat, particularly for benthic organisms (NAVFAC, 2005). Ecological communities are an important consideration, particularly if an area supports a threatened or endangered species. The varying impacts to an ecosystem can be long-term or short-lived and vary in severity based on the size of the impacted area (NAVFAC, 2005). NAVFAC (2005) also states that physical changes such as particle size distribution and chemical changes caused by the suspension of contaminated sediments during dredging operations can have a significant impact on ecological communities. For instance, Hall et al. (1994) conducted a study that showed the amount of time it takes for a benthic ecosystem to recover from disturbances caused by sediment dredging. The authors found that if only a small area of sediment was affected, repopulation by affected organisms was fairly rapid as mature individuals can effectively migrate from nearby areas. However, if the dredged area was larger, repopulation could take a much longer time because repopulation depended on reproduction and larval development, a process that varies depending on the time of year and generally occurs over a longer timescale. These results suggest that limiting the size of a dredging operation can limit the potential damage done to the local ecosystem.

10
(Cou
rtes
y of
Bat
tell
e)
Fig
ure
1. C
once
ptu
al D
iagr
am o
f an
Exa
mp
le E
nvi
ron
men
tal D
red
gin
g O
per
atio
n

11
Despite the sustainability considerations described above, certain conditions necessitate the use of dredging as a remedial response, such as sites where institutional controls (ICs) cannot be implemented, sites exhibiting an immediate and/or severe risk to human or ecological receptors, sites with hydrodynamic conditions that are not amenable to capping (i.e., dynamic and erosional environments), sites where dredging has a lower cost and/or environmental footprint than MNR, or sites where in situ remedies are not compatible with the type and/or level of contamination or are not accepted by regulators or other stakeholders.
Appendix A conveys BMPs that can be utilized during a sediment dredging remedy to improve overall sustainability.
Modeling Sediment Dredging with SiteWise™
Reflecting the numerous sustainability considerations associated with sediment dredging, and considering that GSR evaluations are a key component in the sediment remedy evaluation process, SiteWiseTM Version 3.1 has been updated to include additional GSR modules that augment software functionality to account for the specialized materials, equipment, and activities associated with sediment dredging. The additional modules are described below and key assumptions used to develop SiteWiseTM Version 3.1 are provided in Table 2.
Mechanical Dredge. The mechanical dredge is assumed to be a clamshell type dredge and is modelled in SiteWise™ Version 3.1 as a crawler crane affixed to the deck of a floating barge with spud anchoring capabilities. Four different bucket sizes are included for the user to select, but SiteWise™ Version 3.1 provides a recommended bucket size based on the volume of sediment to be dredged if the bucket size is not already known. Literature-based production rates for the various bucket sizes are used to estimate durations for dredging and dredging-related site operations (e.g., confirmation sampling activities). Supporting data are correlated to various sizes of buckets available to the user and include the suggested total volume range for dredging activities, horsepower (HP) ratings, production rates, fuel consumption rates, and emission factors; emission factors serve as the basis of the calculations for total environmental impact of dredge operation.
Hydraulic Dredge. The hydraulic dredge is assumed to be a large suction dredge and is modelled in SiteWise™ Version 3.1 using operational characteristics for slurry pumps, which are the primary mechanical component for a suction dredge. Two different pump sizes are included, but SiteWise™ Version 3.1 provides a recommended pump size based on the volume of sediment to be dredged if the pump size is not already known. HP ratings for the dredge pump heads have been calculated using the same assumptions for other pumps previously included in SiteWise™. Overall production rates for the various pump sizes are included, which in turn provide operating times for dredging and dredging-related site operations (e.g., confirmation sampling activities). GSR calculations consider hydraulic dredge heads, suggested total volume ranges, HP ratings, production rates, fuel consumption rates, and emission factors; emission factors serve as the basis of the calculations for total environmental impact of dredge operation.
The following measures can be effective in lowering the overall environmental footprint of a dredging remedy:
Minimize the dredging footprint by focusing on dredging areas and depths that yield the most significant remedial benefit.
Minimize remediation time by optimizing production rates and process flow.
Identify opportunities for beneficial reuse of dredged sediments and/or produced waters.
Utilize energy efficient equipment. Identify habitat avoidance options and/or
implement habitat restoration.

12
Table 2. SiteWise™ Assumptions to Evaluate Sediment Dredging
Component Input Process Calculation Assumptions
Clamshell Dredge Operation 1, 2, 3
Sediment Dredging: Crawler Crane
RSMeans specifies crew with 25 ton, 1 cubic yard (CY) crawler crane and a 213 to 310 CY/day production rate
From professional experience, production rates for several other bucket sizes (2, 4, 6, or 8 CY) were estimated
Manufacturer/Model specifications were retrieved relating tonnage and HP rating, assuming 25 ton rating per CY of bucket
Crawler cranes were binned according to EPA NONROAD emissions for each bucket size
Production rates were used to determine recommended volume ranges for bucket size (based on approximately maximum 100 days of operation)
Hydraulic Dredge Operation 4
Sediment Dredging: Hydraulic
RSMeans specifies crew with 6 inches (15 cm) centrifugal pump, pumping 1,000 ft to shore at a rate of 2,000 gallons water/CY (approximately 10:1 ratio), with a production rate of 46 CY/hr
Based on professional experience, production rates were specified for several pump sizes (15, 20, 25, 30 cm), with 15 cm pump producing 91.6 CY/hr
Assume two pump sizes: 15 cm, 30 HP pump with a production rate of 46 CY/hr and 25 cm, 90 HP pump with a production rate of 262 CY/hr; the larger size is recommended after 46,000 CY (100 days)
Dredge Tender Operation 5
Sediment Dredging: Dredge Tender
Dredge tender operational hours equal to calculated volumetric production rates for crawler crane, unless user overridden
One dredge tender is assumed, unless user overridden The dredge tender is assumed to be a Tier 1 harbor tug with 25%
Category 2 primary engines, average 1.9 primary engines of 711.4 kW, 1.5 auxiliary engines of 55.7 kW, 69% load factor
Scow/barge Tender Operation5
Sediment Dredging: Scow Tender
Scow Tender operational hours equal to calculated volumetric production rates for crawler crane, unless user overridden
Two Scow Tenders (one per scow/barge) are assumed, unless user overridden
The Scow Tender is assumed to be a Tier 1 Harbor Tug with 25% Category 2 Primary Engines, average 1.9 Primary Engines of 711.4 kW, 1.5 auxiliary engines of 55.7 kW, 31% load factor
Off-loading Operation 3, 6, 7
Sediment Management
Sediment Management module allows user to include various equipment, much like the Earthwork module
It is assumed an adjusted load factor applies for sediment handling, due to lower bulk density than soil (assume 1.44 g/mL)
The user should select saturated sediment and indicate that the volume input is that of saturated sediment
Sediment Dewatering
Pumps/Generators Operation
The user should use the current Pumps and/or Generators modules to accommodate
It is recommended from professional experience that the user should assume operation of a 300 gallon per minute (GPM) pump with 3 inch outlet
It is recommended from professional experience that the user should assume operation of a Honda EB1000 750 W generator, 0.72 L/hr fuel consumption, or equivalent

Table 2. SiteWise™ Assumptions to Evaluate Sediment Dredging (Continued)
13
Component Input Process Calculation Assumptions
Sediment Handling 3, 6, 7
Sediment Management
The user should use the Sediment Management module to accommodate for final sediment handling
The user should use the load factor for soil, but the total volume handled is adjusted using the density of dried sediment, assuming reduction to 20% moisture content from 46% (USGS, 2012, Lake Linganore Study)
Volume dry:wet = 0.5254:1 The user should indicate whether the volume input was that of saturated
or dry sediment
Contaminant Barrier/Silt Curtain 8
Silt Curtain Materials The user should use a new custom module to accommodate for silt curtain materials
Type II Department of Transportation (DOT) Curtain: 18 oz/sq yd (1.125 lb per square yard) polyvinyl chloride (PVC) curtain
Float: 0.6 lb/ft polystyrene float (assumed substitute HIGH IMPACT) Chain: 1.1 lb/ft Steel for 5/16 inch ballast chain Tension Cable: 0.17 lb/ft Steel vinyl coated aircraft cable Two Flotation Kits per 50 ft: 1.4 lb PVC buoy, 1 lb nylon rope
(assumed substitute HIGH IMPACT) Grommets, Steel Plate Connectors, Zip-Ties: de minimis Total Factors: 0.64 lb/ft HIGH IMPACT, 1.27 lb/ft Steel, 0.056 lb/ft
PVC, 0.125 lb/sqft PVC
Sediment Stockpile Lining
Bulk Materials The user should use the Bulk Materials module to accommodate for sediment stockpile lining
It is recommended that the user assume high-density polyethylene liner, unless the material is specified
Confirmation Sampling 5
Sediment Dredging: Research Vessel (Very Large)
Research Vessel operational hours equal to calculated volumetric production rates for crawler crane, unless user overridden
One research vessel is assumed for confirmation sampling and turbidity monitoring, unless user overridden
The very large research vessel is assumed to be a Tier 1 work boat, average 1.8 primary engines of 275.9 kW, 0.6 auxiliary engines of 55.7 kW, 43% load factor
A typical very large research vessel is a 60 ft craft with a hydraulic boom and trawl winch system (8,000 lb capacity), large pumps (several over 100 GPM), and fully functional dry laboratory space with electricity and running water
Confirmation Sampling 5
Sediment Dredging: Research Vessel (Large)
Research Vessel operational hours equal to calculated volumetric production rates for crawler crane, unless user overridden
One research vessel is assumed for confirmation sampling and turbidity monitoring, unless user overridden
The large research vessel is assumed to have Tier 1 emission factors, average two primary engines of 111.9 kW, 43% load factor
A typical large research vessel is a 35 ft craft designed for vibracore sediment sampling in shallow rivers and harbors (<50 ft water depth), equipped with a hydraulic boom winch system (1,000 lb capacity), electricity and dry cabin space, and raw water

Table 2. SiteWise™ Assumptions to Evaluate Sediment Dredging (Continued)
14
Component Input Process Calculation Assumptions
Other Sampling 5
Sediment Dredging: Light Craft (Medium)
Light Craft operational hours equal to calculated volumetric production rates for crawler crane, unless user overridden
One light craft is assumed for confirmation sampling and turbidity monitoring, unless user overridden
The medium light craft is assumed to have Tier 1 emission factors, average one primary engine of 74.6 kW, 43% load factor (same as research vessels)
A typical medium light craft is a 25 ft pontoon boat designed for sediment and surface water sampling in shallow rivers and lakes capable of push-core, ponar and van veen grab, and limited vibracore sampling
Other Sampling 5 Sediment Dredging: Light Craft (Small)
Light Craft operational hours equal to calculated volumetric production rates for crawler crane, unless user overridden
One light craft is assumed for confirmation sampling and turbidity monitoring, unless user overridden
The small light craft is assumed to have Tier 1 emission factors, average one primary engine of 37.3 kW, 43% load factor (same as Research Vessels)
A typical small light craft is a 18 ft pontoon boat designed for sediment and surface water sampling in shallow rivers and lakes capable of push-core, ponar and van veen grab sampling
Other Sampling 5
Sediment Dredging: Light Craft (Very Small)
Light Craft operational hours equal to calculated volumetric production rates for crawler crane, unless user overridden
One light craft is assumed for confirmation sampling and turbidity monitoring, unless user overridden
The very small light craft is assumed to have generator emission factors, average one primary engine of 3.73 kW, 43% load factor (same as research vessels)
A typical very small light craft is equipped with a 5 HP outboard motor designed for sediment and surface water sampling in shallow rivers and lakes capable of push-core, ponar and van veen grab sampling
Notes: 1. Crew and production rate data from RSMeans: Online - Complete Library,
<http://www.rsmeans.com/RSMeans_Online.aspx>. Accessed: 8 October, 2014. 2. Manufacturer data were collected from specification sheets provided by American, Liebherr, and Link Belt brand crawler
cranes. Accessed 14 October, 2014. 3. U.S. EPA NONROAD Emission Inventory Model, Version 2005c. 4. Crew and production rate data from RSMeans: Online - Complete Library,
<http://www.rsmeans.com/RSMeans_Online.aspx>. Accessed: 8 October, 2014. 5. EPA. 2009. Current Methodologies in Preparing Mobile Source Port-Related Emissions Inventories. 6. Volumetric ratios were calculated assuming a wet sediment density of 1.44 g/mL with a 40% moisture content (USGS.
2012. Water Volume and Sediment Volume and Density in Lake Lignanore between Boyers Mill Road Bridge and Bens Branch, Frederick County, Maryland.) with reduction to 20% moisture content and density of soil (1.85 g/mL).
7. Efficiency factors were estimated using the ratio of wet sediment density of 1.44 g/mL (USGS. 2012. Water Volume and Sediment Volume and Density in Lake Lignanore between Boyers Mill Road Bridge and Bens Branch, Frederick County, Maryland.) to the density of soil (1.85 g/mL).
8. Components and quantities of each were obtained from Granite Environmental, Inc., assuming a Type II DOT Curtain, accessed online 16 October, 2014.

15
Dredge Tender. The dredge tender provides navigation for the dredge, and is modelled in SiteWise™ Version 3.1 as a tugboat. The production rates for dredging are used to determine the total operating time for the dredge tender. Literature values were used to model operation of typical watercraft used to support dredging operations, including load factors, primary and auxiliary engine HP ratings, fuel consumption rates, and emission factors; emission factors serve as the basis of the calculations for total environmental impact of dredge tender operation.
Scow/Barge Tender. The scow/barge tender provides navigation for the scow or barge used for transporting dredged sediment, and has been modelled in SiteWise™ Version 3.1 as a tugboat. The default assumption in SiteWise™ Version 3.1 is that there will be two scow/barge tenders operating, one for each scow/barge (one scow/barge being loaded by the dredge, the other involved in off-loading operations). The production rates for the dredge operation are used as default operating times for the scow/barge tender. Much like the dredge tender, operating times are determined by the dredging duration and the environmental impact is calculated using literature-based emissions values.
Off-Loading. Off-loading operations (i.e., the movement of sediment from the scows/barges to on-shore facilities) are accounted for within the Sediment Management module in SiteWise™ Version 3.1 that includes various earthwork equipment and crane operations that may be required to support landside management of dredged sediment. Users input the total volume of sediment to be off-loaded for each equipment type specified. It should be noted that similar calculations were previously available in SiteWise™ for Earthwork; however, a different load factor is applied based on differences in the bulk density of soil and saturated sediment. SiteWise™ Version 3.1 allows off-loading operations to be quantified for both wet and dry sediments.
Sediment Dewatering. Sediment dewatering can include the operation of various pumps or the use of various construction equipment and materials (e.g., stockpile liners) which were previously included in SiteWise™. Due to the variability in dewatering methods and technologies, it has been left up to the user to construct a project-specific dewatering process using the modules already available.
Sediment Handling. Sediment handling (i.e., the management of sediment on shore) is accounted for within the Sediment Management module, which includes various construction equipment and crane operation as with off-loading operations. Users input the total volume of sediment to be handled for each equipment type. The analysis can be tailored based on sediment in either a wet or dry condition, which is specified by the user. Assumed sediment densities and equipment load factors are included and use the same assumptions described above for off-loading operations.
Containment Barrier. Containment barriers (otherwise known as silt or turbidity curtains) are typically deployed during dredging operations to prevent the migration of suspended sediment beyond the active work area. These barriers require the production of various materials that should be accounted for in a GSR evaluation. A new module has been included in SiteWise™ Version 3.1 that includes calculations for material used for a containment barrier on the basis of linear and square footage of the silt curtain deployed.
3.2 Capping
Capping involves covering contaminated sediments with clean material to prevent exposure. Capping is a passive isolation technology that leaves contaminated sediments in place. Contaminants can naturally attenuate while being contained. Traditional capping typically involves the use of common earth or synthetic materials of a sufficient thickness to fully isolate sediment contamination. Thin-layer capping (otherwise known as enhanced natural recovery [ENR]) is a modified approach to traditional capping, and typically involves the use of similar

16
capping materials, but at lesser thicknesses to provide an immediate reduction in exposure potential while taking advantage of natural processes to provide longer-term protection and minimizing otherwise potentially significant ecological disruption at the existing sediment surface. Reactive capping involves the introduction of reactive chemicals in the cap to directly sequester or degrade contaminants (discussed below in Section 3.3).
There are several components to a successful capping project, including achieving long-term physical isolation, stabilization, and chemical isolation of contaminated sediments (EPA, 2005). These components may be satisfied through an appropriately designed single-layer or multi-layered cap.
Figure 2 provides a conceptual depiction of a capping operation. While capping is less intrusive than environmental dredging, its implementation still requires careful consideration of GSR metrics in the selection and design of a capping approach, such as:
Energy consumption when emplacing capping material GHG and criteria pollutant emissions by machinery and vehicles required to emplace capping
material The potential for reduced hydraulic capacity and flood storage, and the decreased depth of a
water body State and community acceptance of leaving contaminants of concern in place/acceptance of a
remedy that may lead to restricted land use The consumption of resources for capping material (i.e., the material itself and the
manufacture/processing of the material) Worker safety.
Capping has potential benefits and limitations compared to other remedial approaches. For example, according to EPA (2005), a well-designed cap has the potential to quickly reduce or eliminate human and ecological exposure to contaminated sediments and can result in conditions that provide favorable habitat for aquatic organisms. In addition, capping is less disruptive than sediment removal alternatives. The primary disadvantage of capping is that contaminated sediments remain in place, such that if the cap is disturbed or fails, there is a potential for contaminants to be mobilized in the future (EPA, 2005). While capping is less energy intensive than dredging, heavy construction equipment is still required to install a cap. For example, capping materials must be transported and staged at the site, loaded onto barges, and, depending on the selected construction method, placed over the capping footprint using mechanical or hydraulic equipment. Appendix A conveys BMPs that can be utilized during a sediment capping remedy to improve overall sustainability.
The following measures can be effective in lowering the overall environmental footprint of a capping remedy:
Minimize the capping footprint by focusing on capping areas that yield the most significant remedial benefit.
Minimize the use of capping materials by optimizing cap thickness and using thinner caps when possible.
Optimize the delivery of capping materials to minimize transportation risks.
Integrate optimization principles in planning for and executing sampling and monitoring tasks.
Identify habitat avoidance/preservation options and/or implement habitat

17
(Cou
rtes
y of
Bat
tell
e)
Fig
ure
2. C
once
ptu
al D
iagr
am o
f an
Exa
mp
le C
app
ing
Pro
ject
Usi
ng
Pas
sive
Mat
eria
l Pla
cem
ent

18
Modeling Sediment Capping with SiteWise™
To support evaluations of capping alternatives (traditional and thin-layer), SiteWiseTM Version 3.1 has been updated to include additional GSR modules that augment software functionality to account for the specialized materials, equipment, and activities associated with sediment capping. The key assumptions used to develop SiteWiseTM Version 3.1 are provided in Table 3; the additional models are described below.
Table 3. SiteWise™ Assumptions to Evaluate Sediment Capping
Component Input Process Calculation Assumptions
Clamshell Dredge Operation
Sediment Capping: Crawler Crane
The same assumptions apply as in Table 2
Hydraulic Dredge Operation
Sediment Capping: Pipeline Placement
Same assumptions apply as for Sediment Dredging: Hydraulic in Table 2
Dredge Tender Operation
Sediment Capping: Dredge Tender
Dredge Tender operational hours equal the operating time for the dredge, unless user overridden
The same assumptions apply as in Table 2
Scow/barge Tender Operation
Sediment Capping: Scow Tender
Zero Scow Tenders are assumed for capping, unless overridden by the user
On-loading Operation
Sediment Management
The same assumptions apply as for Off-loading Operation in Table 2 The load factor for cap handling is kept the same as Earthwork, assuming
the cap material has the same bulk density as sand The user should select dry sediment and indicate that the volume input was
not that of saturated sediment
Contaminant Barrier/Silt Curtain
Silt Curtain Materials The same assumptions apply as in Table 2
Hopper Barge Operation
Sediment Capping: Dredge Tender
Operation of the hopper barge is assumed to be accounted for by the dredge tender operation
From professional experience, production rates were assumed to be 940 cubic meters dry capping material per hr
Confirmation/ Other Sampling
Sediment Capping: Research Vessel or Light Craft
The same assumptions apply as in Table 2
Cap Placement via Surface Release. Cap placement is assumed to occur via broadcast surface release from a hopper barge. Cap placement via surface release is based on the operation of two hopper barges, which are assumed to be split-bottom barges and are modelled in SiteWise™ Version 3.1 as barges positioned via a tender (tugboat). The ancillary operation of the barges is assumed to be powered by the tender as well. The overall production rate for the hopper barge operation is included as a default in the tool; this production rate is in turn used to calculate default operating times for capping-related site operations.
On-Loading Operations. On-loading operations (i.e., the loading of capping material onto the barge for deployment) is accounted for within the Sediment Management module similar to off-loading operations indicated in Section 3.1 for dredging. However, the load factor for earthmoving equipment is used, assuming that the capping material is similar to sand. The user can input the wet or dry volume of the capping material as the basis, but must specify which has been included in the Input Sheet.
Cap Placement via Direct Mechanical Placement. The assumptions and calculations for the components of direct mechanical cap placement are similar to mechanical dredging operations and surface release capping. Direct mechanical placement is assumed to be the reverse

19
operation of mechanical dredging (i.e., instead of material being removed by a clamshell bucket and placed in a scow/barge, the material from a barge is placed on the contaminated sediment surface by a clamshell bucket).
Cap Placement via Pipeline. The assumptions and calculations for the components of pipeline placement of a cap are similar to hydraulic dredging operations and surface release capping. Pipeline placement is modelled as a reverse operation of hydraulic dredging (i.e., instead of material being removed by a hydraulic dredge to an accumulation area, the cap material is pumped from an accumulation area and placed hydraulically via a pipeline).
3.3 In Situ Amendments
In situ amendments refer to remedial approaches that involve adding chemicals or other compounds to contaminated sediments to alter the chemical or biological conditions in the area to promote the destruction or immobilization of COCs. Examples of in situ amendments for sediment remediation include activated carbon, zero-valent iron (ZVI), biopolymers, or apatite to manipulate chemical conditions in the environment and reduce the bioavailability of contaminants. These amendments are usually emplaced directly on (or mixed into) contaminated sediments, as components in caps (described in Section 3.2), or within engineered mats that are placed on contaminated sediments (EPA, 2013).
In situ amendments must also be evaluated in the context of GSR metrics:
Energy consumption when emplacing amendments GHG and criteria pollutant emissions by machinery and vehicles required to emplace
amendments Impacts to ecological communities The consumption of resources for amendment material (i.e., the material itself and the
manufacture/processing of the material) Worker safety.
EPA (2013) explores three different ways in which amendments can be introduced into sediments: through the emplacement of a geotextile mat treated with an amendment; through amendments that are mixed with capping material; and through amendments applied directly to a contaminated sediment surface. When considering adding amendments using a geotextile mat or as a component of a cap, GSR metrics must also be considered for the additional treatments. Potential problems with in situ amendments include the difficulty of emplacing them in moving water and unknown efficacy or long-term persistence of some amendments (EPA, 2013).

20
Modeling Sediment Amendments with SiteWise™
The previous version of SiteWise™ included functionality allowing users to evaluate the deployment of typical amendments, such as activated carbon or ZVI, for applications in soil and groundwater remedies. Sediment remedial alternatives that include the use of in situ amendments can be modeled in SiteWiseTM Version 3.1 by using this existing functionality and the additional Capping modules described in Section 3.3 and summarized in Table 3. The functionality that was captured in the previous version of SiteWise™ to assess the sustainability metrics associated with the use of specified quantities of in situ amendments and geotextiles in land-based approaches is generally analogous to sediment remedies. SiteWise™ also contains previously developed functionality allowing the user to input a custom treatment material, in the event that critical footprint factors related to the material are known (e.g., the life-cycle of the manufacturing process from raw material extraction to final production and related energy consumption), or otherwise to select a generic material if the relative environmental footprint of the material is known in a comparative sense (i.e., very low, low, moderate, high, or very high). Collectively, the additional Capping modules and existing modules related to in situ amendments allow users to fully evaluate sediment alternatives that involve the use of in situ amendments to directly treat or serve as an enhancement to capping alternatives. Appendix A conveys BMPs that can be utilized during an in situ amendment sediment remedy to improve overall sustainability.
3.4 Monitored Natural Recovery
MNR of sediments involves allowing natural physical, chemical, and/or biological processes to contain or destroy contaminants while performing monitoring. Monitoring ensures that progress is made in containing contaminants or removing them from the environment, and that human health and the environment remain protected from the effects of the contamination.
The following measures can be effective in lowering the overall environmental footprint of an MNR remedy:
Integrate optimization principles in planning for and executing sampling and monitoring tasks.
Limit analytical requirements to those analyses directly supporting decision-making.
Optimize equipment usage during sampling and monitoring tasks.
Utilize energy efficient sampling and monitoring equipment.
The following measures can be effective in lowering the overall environmental footprint of an in situ amendment remedy:
Minimize the treatment footprint by focusing on treatment areas that yield the most significant remedial benefit.
Minimize the use of amendment materials by optimizing treatability of COC assemblage.
Optimize the delivery of amendment materials to minimize transportation risks.
Integrate optimization principles in planning for and executing sampling and monitoring tasks.
Identify habitat avoidance/preservation options while placing amendments.

21
While MNR is the least intrusive of the sediment remediation techniques discussed in this White Paper, certain GSR metrics must still be considered:
Worker safety: sampling personnel must be trained to properly sample sediments and a proper accident prevention plan and site safety and health plan should be in place prior to beginning MNR activities
Community impacts: leaving contaminants in place and monitoring their attenuation may prevent the affected site from being used for other beneficial uses; in addition, a strong case must be made that the remedy is truly protecting human health and the environment in order to gain state regulatory or community acceptance.
MNR has two main advantages: a relatively low cost of implementation; and no direct impact to aquatic organisms (EPA, 2005). In terms of GSR metrics, there are minimal emissions of GHGs or priority contaminants, negligible water impacts and resource consumption, and only limited impacts to surrounding communities. However, in some cases the long timeframe for MNR can result in an accumulation of environmental impacts, such that, over a sufficiently long duration, MNR could actually produce less favorable GSR metrics compared to more active and invasive alternatives that result in no further action. Appendix A conveys BMPs that can be utilized during an MNR sediment remedy to improve overall sustainability.
Modeling Sediment MNR with SiteWise™
The additional modules and key assumptions used to develop SiteWiseTM Version 3.1 are provided in Table 4.
Table 4. SiteWise™ Assumptions to Evaluate MNR
Component Input Process Calculation Assumptions
Waterborne Sampling Equipment
Waterborne Sampling: Research Vessel or Light Craft
The user is required to specify the number of working hours for the proposed sampling effort
Depending on the selection of the research vessel or light craft size, the same assumptions apply as specified in Table 2
Surface Water Samples
Waterborne Sampling
The user provides inputs for working time in the Waterborne Sampling module; based on professional experience, the recommended production rate is two grab samples per hour
Sediment Core Samples
Waterborne Sampling
The user provides inputs for working time in the Waterborne Sampling module; based on professional experience, the recommended production rate is 10 feet per hr
Miscellaneous Offshore Surveying
Waterborne Sampling
The user provides inputs for working time for all other sampling activities (e.g., specialized data collection, such as bathymetric surveys, acoustic Doppler profiling, or the collection of sediment profile imagery) in the Waterborne Sampling module
22
4.0 INCORPORATING GSR INTO THE SEDIMENT REMEDY SELECTION FRAMEWORK
The highest potential for improving the sustainability and reducing the overall negative impact of sediment remediation is by selecting a remedy with favorable GSR metrics. Selecting a specific remedy for a DON sediment site is based on a number of factors, including the typical comparative analysis of remedial alternatives developed in the FS. This comparative analysis should include consideration of GSR metrics using the SiteWise™ tool. Table 5 demonstrates how GSR metrics map to the nine criteria for the evaluation of remedial alternatives as specified in the National Oil and Hazardous Substances Pollution Contingency Plan. Further information is provided in Integrating Green and Sustainable Remediation Metrics within the CERCLA Process during the Feasibility Study (NAVFAC, 2012b).
Table 5 provides guidance to assist DON RPMs in appropriately considering GSR metrics during the detailed evaluation of remedial alternatives in the FS. As shown in Table 5, GSR metrics can be directly considered during evaluations for three of the five balancing criteria, including short-term effectiveness, long-term effectiveness, and cost. Many FS reports consolidate the assessment of GSR metrics into the short-term effectiveness criterion, as this is the one balancing criterion logically linked to all of the DON’s GSR metrics.
Ultimately, as with any remedy, a sediment remedy must adequately protect human health and the environment and must comply with applicable or relevant and appropriate requirements (ARARs). Once compliance with these threshold criteria is established, appropriate consideration of GSR metrics in the FS can have a substantial impact on the evaluation and selection of a more sustainable remedy. For example, the thoughtful integration of GSR metrics into the FS can enhance state and community acceptance of sediment remedies by more clearly conveying the adverse social and environmental impacts of a more intrusive remedial approach (e.g., noise, traffic, and GHG emissions from off-site transportation of dredged material). Consideration of the GSR metrics, including GHG emissions, criteria pollutant emissions, water impact or use, ecological impacts, and resource consumption is critical to selecting a protective remedy that complies with ARARs, but is also cost-effective and sustainable. Depending on site-specific conditions, sediment remedies that involve large scale removal efforts and/or extended monitoring timeframes may not ultimately meet sustainability goals.
Other factors involved in sediment remedy selection include regional norms, stakeholder consensus, site reuse compatibilities, synergies with other nearby construction/remediation programs, and available opportunities for beneficial use of produced materials (e.g., dredged sediment). Given the extensive scale of many contaminated sediment sites, as well as the relative concern for and perception of risk in water bodies among many stakeholders, selecting a remedy for a contaminated sediment site can be a considerable challenge.

23
Table 5. DON GSR Metrics Applicability to CERCLA Criteria (NAVFAC [2012b])
DON GSR Metrics
Threshold Criteria Balancing Criteria
Modifying Criteria
Pro
tect
s h
um
an h
ealt
h
and
envi
ronm
ent
AR
AR
s
Lon
g-te
rm
effe
ctiv
enes
s
Red
uct
ion
in t
oxic
ity,
m
obil
ity,
or
volu
me
Shor
t-te
rm
effe
ctiv
enes
s
Impl
emen
tabi
lity
Cos
t
Sta
te a
ccep
tan
ce
Com
mu
nit
y
acce
ptan
ce
Energy Consumption M
ust b
e m
et f
or
cons
ider
atio
n
Mus
t be
met
for
co
nsid
erat
ion
X x x x
GHG Emissions x X x x
Criteria Pollutant Emissions x X x x
Water Impacts/Use x X x x x
Ecological Impacts x X x x
Resource Consumption x X x x x
Worker Safety X x x x
Community Impacts X x x
The recent Interstate Regulatory & Technology Council (ITRC) guidance document titled Contaminated Sediment Remediation: Remedy Selection for Contaminated Sediments (ITRC, 2014) emphasizes GSR considerations during remedy selection for contaminated sediments. The objective of this ITRC guidance is to assist decision-makers in identifying which contaminated sediment remediation technology is most favorable for a site based on the evaluation of site-specific physical, sediment, contaminant, and land and waterway use characteristics. The guidance includes a six-step remedy selection framework to help identify favorable technologies and remedial alternatives as follows:
Step 1. Review Site Characteristics Step 2. Identify and Map Remedial Zones Step 3. Screen Remedial Technologies Step 4. Evaluate Remedial Technologies Step 5. Develop Remedial Action Alternatives Step 6. Evaluate Remedial Action Alternatives.
The consideration of GSR metrics is included in Step 6 of this framework, along with meeting RAOs, long-term effectiveness, short-term impacts, technical feasibility, administrative feasibility, practicality, cost, schedule, habitat and resource restoration, watershed considerations, and future land and waterway use. The ITRC framework also emphasizes the important role that GSR evaluations play in balancing the local benefits of sediment remediation with the larger global environmental costs (ITRC, 2014).

24
5.0 CASE STUDY REVIEW
This section provides two example case studies where GSR evaluations were conducted on sediment remedial alternatives for DON sites. Case Study #1 provides an example where land-based remediation of near-shore sediments was modeled using the previous version of SiteWise™. Case Study #2 provides an example where water-based remediation of open water sediments was modeled using the updated SiteWise™ Version 3.1. Previous versions of SiteWise™ could be used to simulate near-shore sediment remediation alternatives, as demonstrated by Case Study #1, using analogous inputs more closely associated with terrestrial remedies. However, for the remediation of contaminated sediments in an open water environment as described in Case Study #2, the lack of sediment-specific equipment and footprint factors in previous versions of SiteWise™ was limiting. Accordingly, the assessment of sediment remediation for Case Study #2 was performed using the updated SiteWise™ Version 3.1.
5.1 Case Study #1: Land-Based Remediation of Near-shore Sediments
Former Mare Island Naval Shipyard (MINS) is located on the western side of the City of Vallejo in southwestern Solano County, California, about 25 miles northeast of San Francisco. The offshore area at former MINS, designated Investigation Area (IA) K, extends the length of the eastern and southeastern shore of the former DON base along the Mare Island Strait and the Carquinez Strait and represents approximately 4.4 miles of coastline (see Figure 3). This Case Study #1 summary is based on the Final Remedial Investigation and Feasibility Study Report for Investigation Area K (Battelle, 2014).
Risk assessments conducted during the RI concluded that risks to human health and ecological receptors were acceptable and generally consistent with ambient conditions for the San Francisco Bay. However, the nature and extent evaluation identified contamination in sloughs (i.e., narrow channels) associated with four former storm sewer system outfalls that ultimately discharge to the Mare Island Strait. Through a surface area-weighted average concentration (SWAC) evaluation, the RI determined that three of the four sloughs contained sufficient contaminant mass within the top 2 feet of sediment to serve as a secondary source of contamination to the offshore areas to which they connect. Based on the conclusions of the RI, a single RAO was developed for Investigation Area (IA) K: mitigate the potential for sediment in sloughs associated with Outfalls 4, 33, and 100 to serve as a source of chemicals to adjacent ecological exposure units (EUs) of the Mare Island Strait. Based on the RAO established for IA K, three specific target treatment zones (TTZs) were identified, coinciding with the sloughs associated with Outfalls 4, 33, and 100. The extent of each TTZ was specifically defined as the location at which the associated outfall discharges to the slough and extending to the intersection of the slough and open water of the Mare Island Strait.
To achieve the established RAO, several sediment remedial alternatives were developed in the FS and evaluated for the three TTZs identified. Based on the detailed evaluation of the alternatives and the comparative alternatives analysis, Focused Removal, Waste Transportation, and Offsite Disposal was identified as the preferred alternative. Under this scenario, impacted sediment within the outfall TTZs would be removed to ensure long-term sediment quality in the

25
(Courtesy of Battelle)
Figure 3. TTZs within IA K at Former MINS in Valejo, California
26
offshore ecological EUs. Based on the data available for each TTZ, contamination above RGs is generally located in surface sediments, such that a uniform 2 foot excavation depth for each TTZ was selected. The preferred alternative incorporates confirmation sampling to ensure RGs are achieved at the excavation floor and along the excavation sidewalls. The FS limited the scope of this alternative to the TTZs only, such that no further action would be required if the TTZ areas were adequately remediated. Each of the outfalls proposed for remediation is surrounded by wetlands that are considered habitat for the salt marsh harvest mouse, a state and federally protected mammal. To implement the preferred alternative, wetland areas would need to be accessed by heavy machinery and laborers and any areas requiring access (either for equipment or personnel) to support remediation would require vegetation removal. Silt fencing would be installed around the work area and around access routes through the wetland to the work area. Upon completion of the remedial action, the silt fencing would be removed and the cleared wetland vegetation would be replanted by hand.
For the purposes of the FS, a total excavation area of 2,600 square feet was assumed across the three outfall TTZs. Further, it was assumed that the removal depth would be 2 feet and that sediment would be removed across the entire width of the slough in the excavation footprint, such that approximately 200 CY of sediment would be removed. Following removal, sediment would be managed on site, characterized, and properly disposed. It was assumed that the removed sediment would be stockpiled, passively dewatered, and then transported to and disposed at an off-site landfill with 50% of the excavated material disposed as non-hazardous waste and 50% disposed as non-RCRA hazardous waste. Depending on the final depth of excavation, the removal areas could be left to restore through natural deposition. However, the remedial alternative as contemplated in the FS would include backfilling of the excavated areas with 150 CY of locally-available virgin quarry material (sand and silt). After backfilling, additional restoration would be conducted by placing a geotextile, which would be armored with stone to protect against natural erosive forces. It was assumed that 75 CY of stone armoring (2-inch size) would be needed to restore the excavation areas.
A GSR evaluation for this site was conducted in the FS, using the previous version of SiteWise™ because the TTZs consist of nearshore sediments that could be removed using a land-based remediation approach implemented using standard terrestrial excavation equipment with an adequate reach. The FS assumed that removed sediments would be temporarily staged for dewatering, until such time as the material could be characterized through appropriate sampling and transported off site. Waste sediment would be transported off site in typical dump trucks; based on the amount of sediment it was assumed 16 dump truck loads would be required. Geotextile and clean cap materials would be transported to the site via truck. For clean stone material, and assuming the use of typical overland dump trucks, approximately eight dump truck loads would be required. Adequate roadway infrastructure exists at and around former MINS such that trucks and equipment could be brought directly to or near the TTZs. Restoration of the sloughs would be conducted from land using appropriate equipment and/or manual techniques. Installation of the geotextile material would occur first, followed by placement of the armoring stone. Assuming a conservative production rate and the use of standard equipment, focused sediment removal and slough restoration in the TTZs would likely require approximately six weeks.

27
The results of the SiteWise™ evaluation are summarized in Table 6. The GSR evaluation of IA K sediments was performed in the context of the short-term effectiveness evaluation criterion.
Table 6. SiteWise™ GSR Summary for the Preferred Alternative for Former MINS IA K Sediments
Activities
GHG Emissions
(metric tons)
Total Energy Used
(MMBTU)
Water Consumption
(gallons) NOx Emissions (metric tons)
Consumables 8.27 2.2E+02 NA NA
Transportation-Personnel 0.52 6.5E+00 NA 1.9E-04
Transportation-Equipment 0.21 2.9E+00 NA 6.7E-05
Equipment Use and Miscellaneous 3.68 5.3E+01 2.0E+03 1.0E-02
Residual Handling 2.04 2.8E+01 NA 6.9E-03
Subtotal 14.73 3.05E+02 2.00E+03 1.76E-02
Activities
Emissions (metric tons) Accident Risk
SOx PM10 Fatality Injury
Consumables NA NA NA NA
Transportation-Personnel 6.8E-06 3.9E-05 2.1E-05 1.7E-03
Transportation-Equipment 2.7E-06 5.4E-06 1.1E-06 8.8E-05
Equipment Use and Miscellaneous 1.2E-03 7.8E-04 1.6E-06 4.0E-04
Residual Handling 3.6E-03 1.9E-02 3.5E-06 2.8E-04
Subtotal 4.80E-03 1.99E-02 2.74E-05 2.48E-03
NA – Not Applicable
The other alternatives evaluated in detail for IA K sediments at former MINS were MNR with ICs, and a Stabilization Cap with ICs. The MNR alternative would rely on natural processes (e.g., ongoing sedimentation or sediment mixing through physical or biological processes) to contain and/or reduce the bioavailability and toxicity of sediment contaminants, and would include long-term monitoring through sediment sampling and topographic/bathymetric surveying. With the stabilization cap alternative, sediments in the TTZs would remain in place and would be covered by an armored geotextile cap intended to stabilize the sediments and isolate the sediments from the surrounding environment and potential receptors. ICs for these alternatives would be implemented to restrict or prohibit future actions that could alter site conditions in the TTZs or impact remedy effectiveness. ICs would be monitored over the long term (30 years was assumed in the FS).
The MNR with ICs alternative is characterized by the highest overall environmental footprint, despite being a generally passive alternative, largely because of the extensive duration of monitoring required and the analytical and equipment needs throughout the monitoring period. Monitoring for the MNR with ICs alternative would conceptually consist of baseline bathymetric/topographic surveying and sampling for sediment chemistry, followed by recurring bathymetric/topographic surveys and sediment chemistry sampling events to evaluate sediment stability and the recovery of sediment quality (30 years of monitoring was assumed in the FS, with baseline monitoring performed before remedial action, and long-term monitoring performed annually for the first five years and then at five year increments). The Stabilization Cap with ICs alternative and the Focused Removal, Waste Transportation, and Offsite Disposal alternative

28
have generally similar environmental footprint factors, with both having overall environmental footprints significantly lower than the MNR with ICs alternative. The overall duration to implement either the stabilization cap alternative or the focused removal alternative would be significantly shorter compared to the MNR with ICs alternative, and both alternatives would require only a minimal amount of typical construction equipment, yielding lower environmental footprint factors despite being active approaches.
While the Stabilization Cap with ICs alternative would present the lowest overall environmental footprint, the Focused Removal, Waste Transportation, and Offsite Disposal alternative was identified as the preferred alternative based on the overall evaluation of all FS evaluation criteria. This alternative was differentiated largely by its higher degree of long-term effectiveness and permanence. Ultimately, the GSR evaluation using SiteWise™, in combination with other criteria, was important in demonstrating that a more active alternative to address sediments in the IA K TTZs would be both effective/permanent and relatively less impactful to the environment. Figure 4 shows the GSR evaluation of the three alternatives considered for IA K sediments in graphical form.

29
Figure 4. SiteWise™ Results for Former MINS IA K Sediment Remedial Alternatives

30
5.2 Case Study #2: Sediment Remediation in Open Water
Pearl Harbor is a natural estuary extending over approximately 5,000 acres on the south-central coast of Oahu, Hawaii, and encompassing four major lochs (West, Middle, East, and Southeast). The harbor has a dredged navigation channel that opens to the Pacific Ocean, and is a natural sink for sediments and chemicals discharged with surface water runoff from approximately 110 square miles of watershed, or 20 percent of Oahu’s land surface. Due to the areal extent and number of areas evaluated for potential impacts within Pearl Harbor, Case Study #2 is specifically focused on the Bishop Point sediment site (see Figure 5). Bishop Point is located in the southern portion of the primary navigation channel, near the entrance to Pearl Harbor. The shoreline is characterized by DON facilities including piers for berthing ships, with water depths less than 20 feet mean lower low water. The area has two primary outfalls, one located within the finger piers and the other located off a small peninsula that bounds the southern limit of Bishop Point. This Case Study #2 summary is based on the Final Feasibility Study for Pearl Harbor Sediment (AECOM, 2015).
Based on elevated concentrations of several site-related, inorganic contaminants, further action was recommended to address impacts to sediments at Bishop Point. Sediment sampling indicated that elevated concentrations of several inorganic contaminants were present in surface sediment, generally less than 2 feet below the sediment surface. The remediation footprint developed to address contamination is relatively small, covering approximately 2.7 acres. Existing data indicate no areas where subsurface contamination underlying clean surface sediment could potentially be exposed; however, limited subsurface data are available within the remediation footprint to estimate the extent and volume of sediments for active remediation. Natural recovery potential is relatively high based on sedimentation rates derived from radioisotope analysis of sediment cores; however, the effectiveness of natural recovery may be limited due to the potential for disturbance during future maintenance dredging activities.
Moderate to high potential for recontamination at Bishop Point was identified as being associated with maintenance dredging, storm drain outfalls and runoff from sites, and erosion of contaminated sediments from under-pier areas. The potential for recontamination from storm drain outfalls is considered high based on the presence of elevated COC concentrations in harbor sediments adjacent to outfall locations. Sediment trap data indicated high levels of COCs within incoming suspended sediment; however, further observation revealed that these data likely represent resuspended sediments from the surrounding sediment bottom. Elevated zinc concentrations were reported near one of the outfalls. Results of additional geochemical association analysis performed to evaluate the relationship between metal COCs and iron as a reference metal indicated that most storm drain outfalls are enriched in metal COCs relative to iron content compared to clean stream sediments and sediments collected from areas with no elevated COC concentrations. The relatively steep slopes observed under the piers at Bishop Point indicate that sediments are potentially unstable under the piers and may represent moderate potential for recontamination to the adjacent harbor sediments. The potential for recontamination by contaminants released with surface water is considered minimal. Improved BMPs and the transient nature of ships in the harbor indicate that releases from ships are intermittent and may not represent significant ongoing sources of sediment contamination in the harbor.

31
(AECOM, 2015)
Figure 5. Bishop Point Remediation Area at Pearl Harbor

32
It was determined that the potential for exposure of contaminated subsurface sediments during maintenance dredging should be addressed during remedial action. Several remedial alternatives were investigated as possible strategies for resolving this issue, including MNR, dredging, ENR, capping and partial dredging, and focused dredging with MNR. For purposes of developing this case study, two of the alternatives evaluated in the FS were assessed: the focused dredging with MNR alternative; and the ENR alternative, which was selected as the preferred remedial alternative in the FS.
Focused dredging would encompass partial dredging to provide sufficient clearance to avoid impact from future maintenance dredging and to concurrently achieve contaminant mass reduction. Slope stabilization and capping were recommended during this remedial action to address potential erosion from steep under-pier slopes. Additional evaluation of storm drain outfalls was found to be necessary and was recommended to occur prior to implementing the remedy. It was further determined that screening of outfalls should be conducted for source control prior to implementation of the remedy, and that the source of zinc (potentially runoff from galvanized roofing) should also be identified prior to initiating remediation. This remedial approach would achieve the RAOs by dredging surface sediments with lead concentrations exceeding the remedial action level of 720 mg/kg, and implementing MNR for areas with lead concentrations between 420 mg/kg and 720 mg/kg and/or zinc concentrations greater than 1,200 mg/kg. ICs would be implemented, maintained, and modified as needed to ensure that buried contamination remains in place. This remedy alternative included focused dredging to reduce risks in the short term, followed by MNR to further reduce risks to achieve all RAOs over time.
For the ENR remedy, a minimum of 6 inches of sand would be placed across the contaminated area to act as a cap, assuming that maintenance dredging currently planned would provide adequate clearance for the ENR material to remain in place during subsequent maintenance dredging operations. A maintenance dredging clearance of 2 feet for the cap material was determined to allow for 60 years of sediment accumulation before potential disruption by dredging activities. An adaptive management strategy, in which ENR would be applied as needed in response to changing conditions caused by maintenance dredging or other disturbances, was determined to increase the effectiveness of implementing this alternative. In short, ENR was determined to yield the benefits of focused dredging with MNR, without the intensive and invasive process of dredging. ENR was therefore identified as the preferred alternative for sediments at Bishop Point.
As part of the FS, GSR metrics were determined for the focused dredging with MNR alternative and the preferred ENR alternative. Another sustainability tool was used to conduct the GSR evaluation for Bishop Point and more details on the tool can be found in the FS for the site (AECOM, 2015). To demonstrate the updates to the SiteWise™ tool, these two alternatives were also evaluated using SiteWise™ Version 3.1. Volumetric inputs that were specified in the FS were applied to the SiteWise™ Version 3.1 evaluation, as well as the specified components (note that MNR activities were not included in the SiteWise™ evaluation because they were also not included in the GSR evaluation conducted for the FS). Default operating times and assumptions from SiteWise™ were otherwise used (i.e., operating times for various equipment including dredge tenders and research vessels were not taken from the FS assumptions).
Focused dredging with MNR would consist of mechanically dredging 13,065 CY of sediment, transloading the sediment to shore, transporting the contaminated sediment to a landfill, transporting 3,267 CY of clean sand to the site, transloading clean sand to scows, and direct

33
mechanical placement of the clean sand as capping material over areas of residual contamination. Also included in the evaluation is the excavation of 13,065 CY of material by a loader and dozer, consistent with the GSR evaluation performed in the FS.
The following inputs were applied to the respective SiteWise™ Version 3.1 modules for the assessment of the focused dredging with MNR alternative.
In the Bulk Material Quantities module, 88,209 cubic feet of sand was specified; In the Silt Curtain Materials module, 1,000 linear feet of silt curtain to a depth of 15 feet was
specified; In the Equipment Transportation—Dedicated Load Road module, 10,188 miles one-way
travel for 20 ton loads with a return trip of 40 miles using diesel fuel were specified; In the Sediment Dredging module, 13,065 CY were assumed to be removed mechanically by
the equivalent of a 50 ton crawler crane with a 2 CY bucket; one dredge tender, one scow tender, and one medium research vessel were assumed to operate for the duration of the dredging process (200.0 hours), all of which were assumed to use diesel fuel;
In the Sediment Management module, 13,065 CY were assumed to be managed each by a crawler crane, dozer, and loader/backhoe, all of which assumed saturated sediment as the input and the material being managed;
In the Sediment Management module, 3,267 CY of dry sand were assumed to be managed by a crawler crane;
In the Sediment Capping module, 3,267 CY of material were assumed to be placed mechanically by the equivalent of a 50 ton crawler crane with a 2 CY bucket; one dredge tender, one scow tender, and one medium research vessel were assumed to operate for the duration of the capping process (50.0 hours), all of which were assumed to use diesel fuel;
In the Residue Disposal/Recycling module, 793 trips of 20 miles each with a load of 20 tons using diesel fuel were specified;
In the Landfill Operations module, 13,065 CY of non-hazardous landfill in the state of Hawaii were specified.
ENR would consist of transporting 3,267 CY of clean sand to the site, transloading clean sand to scows, and direct mechanical placement of the clean sand.
The following inputs were applied to the respective SiteWise™ Version 3.1 modules for the assessment of the preferred ENR alternative.
In the Bulk Material Quantities module, 88,209 cubic feet of sand was specified; In the Silt Curtain Materials module, 1,000 linear feet of silt curtain to a depth of 15 feet was
specified; In the Equipment Transportation—Dedicated Load Road module, 10,188 miles one-way
travel for 20 ton loads with a return trip of 40 miles using diesel fuel were specified; In the Sediment Management module, 3,267 CY of dry sand were assumed to be managed by
a crawler crane; In the Sediment Capping module, 3,267 CY of material were assumed to be placed
mechanically by the equivalent of a 50 ton crawler crane with a 2 CY bucket; one dredge tender, one scow tender, and one medium research vessel were assumed to operate for the duration of the capping process (50.0 hours), all of which were assumed to use diesel fuel.
The results of the GSR evaluation of focused dredging with MNR using SiteWise™ Version 3.1 are shown in Table 7 and graphically on Figure 6. The results of the GSR evaluation of the preferred ENR alternative using SiteWise™ Version 3.1 are also shown in Table 7 and are

34
compared graphically with the results of focused dredging with MNR in Figure 7. The results of the GSR evaluation for the focused dredging with MNR alternative are discussed in detail below as an illustrative example. The focused dredging with MNR alternative is discussed in detail rather than the ENR alternative due to the inclusion of a larger number and more diverse range of remedy components in the remedial process for the focused dredging with MNR approach, better demonstrating the functionality of SiteWise™ Version 3.1.
Equipment use and residual handling activities of focused dredging with MNR account for the majority of all impacts across all GSR metrics, as shown on Figure 6. Material production and transportation of equipment and materials to the site account for only a small portion of the overall footprint for all GSR metrics except for accident risk, where transportation of equipment results in a significant impact.
GHG Emissions. Dredge operation accounts for 39% of GHG emissions of the focused dredging with MNR alternative. For both dredging and cap material placement, activities associated with the operation of the tenders dominate, with dredge and research vessel operation accounting for less than 5% of the dredging and capping GHG emissions. Cap placement activities account for 10% of GHG emissions, due to the shorter operational time required for cap placement. Transloading of sediment and clean sand accounts for 17% of GHG emissions, with sediment management the source of the majority of impacts. Landfill operations accounts for 22% of GHG emissions calculated for the remedy, while transportation of contaminated sediment to the landfill accounts for only 5% of GHG emissions.
Energy Usage. Landfill operations accounts for 40% of total energy use calculated for the focused dredging with MNR alternative, while transportation of contaminated sediment to the landfill accounts for only 5%. Dredge operation accounts for 32% of energy use of the alternative. As with GHG emissions, activities associated with the operation of the tenders dominate dredging and cap placement impacts. Cap placement activities account for 8% of energy use, while transloading of sediment and clean sand accounts for 5% of energy use, with sediment management the source of the majority of transloading impacts.
Air Emissions. Consumption of diesel fuel for equipment use has slightly greater impacts on NOx and SOx emissions than does landfill operations, but a significantly lower impact on PM emissions. This results in an increased impact of dredge and cap material placement tender operation on NOx and SOx emissions, and conversely an increased role of landfill operations in total PM emissions, as seen in Figure 6. The proportionate impacts of sediment equipment operation and residual handling identified for GHG emissions and energy use are otherwise evident in criteria pollutant emissions, with activities such as research vessel and dredge operation resulting in significantly lower impacts than those of sediment management and tender operations.
Accident Risks. Accident risks from residual handling are associated solely with transportation of sediment to the landfill. Therefore, accident risks resulting from both residual handling and equipment transportation are the result of risks associated with road travel. Equipment operation on site plays a greater role in accident risk than road travel, given the risks posed by the operation of heavy machinery and the estimated operational times of earthmoving equipment. Transportation of personnel was not included in this evaluation and therefore is shown to result in no impacts in Figure 6. Considering the minimal impacts of transporting such a large quantity of materials to and from the site, it is assumed that personnel transportation would result in only a small portion of the impacts—with the exception of accident risk—if it were accounted for.
Water Consumption. Water consumption was included as a metric in this evaluation to highlight the fact that water impacts are not accounted for in typical SiteWise™ sediment remediation inputs listed above. Likewise, electricity consumption is not accounted for in

35
typical sediment remediation modules (as indicated in Table 7). If these impacts are anticipated, the evaluator should account for water consumption or electricity use in the tool as other known site activities.
Table 7. Summary of GSR Evaluation for Two Remedial Alternatives for Bishop Point Sediments Using SiteWise™ Version 3.1
GHG Emissions
(metric tons)
Total Energy Used
(MMBTU)
Water Consumption
(gallons)
Electricity Usage
(MWH)
Onsite Emissions (metric tons)
NOx SOx PM10
Focused Dredging with MNR
6.75E+02 8.65E+03 0.00E+00 0.00E+00 4.58E+00 7.43E-01 2.44E-01
ENR 1.44E+02 1.65E+03 0.00E+00 0.00E+00 9.12E-01 1.48E-01 4.84E-02
Total Emissions (metric tons) Accident Risk Non-Hazardous Waste Landfill
Space (tons) NOx SOx PM10 Fatality Injury
Focused Dredging with MNR
5.70E+00 1.40E+00 2.69E+00 4.14E-04 6.94E-02 1.31E+04
ENR 1.05E+00 2.81E-01 1.03E-01 1.21E-04 1.69E-02 0.00E+00
The preferred alternative, ENR, has significantly lower impacts across all the presented GSR metrics than focused dredging with MNR. Figure 7 visualizes the comparative GSR results by breaking down impacts by source. GHG emissions, total energy used, and NOx, SOx, and onsite PM10 emissions for the ENR alternative are approximately one-fifth of those for focused dredging with MNR. Total PM10 emissions associated with the ENR alternative are less than 5% of those associated with focused dredging with MNR due to the high PM10 emissions associated with residual handling. Accident risks associated with the ENR alternative are approximately one-quarter of those for focused dredging with MNR. Being comprised of generally similar tasks, but without the active dredging processes, these coincide with the descriptions of proportional impacts for the focused dredging with MNR remedy. These results concur qualitatively with those reported in the FS.
Overall, SiteWise™ Version 3.1 accounts for a wide array of primary and ancillary sediment dredging and capping activities. However, for a typical remedy involving dredging and cap/backfill placement, it can be assumed that the most significant impacts would primarily result from scow tender operation and from landfill operations.

36
Ma
teria
l Pro
duc
tion
s3%
Tra
nsp
orta
tion-
Equ
ip/m
ate
rials
5%
Equ
ipm
ent
Use
an
d M
isc
65%
Res
idua
l Ha
ndlin
g27
%
CO
2e E
mis
sio
ns
Mat
eria
l Pro
duct
ions
5%
Tra
nsp
orta
tion-
Equ
ip/m
ate
rials
5%
Eq
uipm
ent U
se a
nd
Mis
c45
%
Res
idu
al H
andl
ing
45%
En
erg
y U
sa
ge
Mat
eria
l Pro
duct
ions
8%
Equ
ipm
ent U
se a
nd
Mis
c6
0%
Re
sid
ual H
andl
ing
32%
SO
x E
mis
sio
ns
Mat
eria
l Pro
duct
ion
s2%
Equ
ipm
ent U
se a
nd
Mis
c83
%
Re
sidu
al H
and
ling
15%
NO
x E
mis
sio
ns
Fig
ure
6. P
rop
orti
onal
Im
pac
ts b
y A
ctiv
ity
Typ
e fo
r th
e F
ocu
sed
Dre
dgi
ng
wit
h M
NR
Alt
ern
ativ
e fo
r B
ish
op P
oin
t S
edim
ents
Usi
ng
Sit
eWis
e™ V
ersi
on 3
.1

37
Mat
eria
l Pro
duct
ions
2%
Equ
ipm
ent
Use
and
M
isc
10%
Re
sid
ual H
andl
ing
88%
PM
10
Em
iss
ion
s
Tra
nsp
orta
tion
-E
quip
/mat
eria
ls19
%
Equ
ipm
ent
Use
and
M
isc
51%
Res
idu
al H
andl
ing
30%
Acc
ide
nt
Ris
k (F
ata
lity
)
Tra
nsp
ort
atio
n-E
qui
p/m
ater
ials
9%
Equ
ipm
ent U
se a
nd
Mis
c77
%
Res
idu
al H
andl
ing
14%
Ac
cid
en
t R
isk
(In
jury
)
0%0%0%0%0%
Wa
ter
Co
ns
um
pti
on
Ma
teria
l Pro
duct
ions
Tra
nspo
rta
tion-
Per
sonn
el
Tra
nsp
orta
tion-
Equ
ipm
ent
Equ
ipm
ent U
se a
nd M
isc
Res
idua
l Han
dlin
g
Fig
ure
6 (
con
tin
ued
). P
rop
orti
onal
Im
pac
ts b
y A
ctiv
ity
Typ
e fo
r th
e F
ocu
sed
Dre
dgi
ng
wit
h M
NR
Alt
ern
ativ
e
for
Bis
hop
Poi
nt
Sed
imen
ts U
sing
Sit
eWis
e™ V
ersi
on 3
.1

38
0.00
100.00
200.00
300.00
400.00
500.00
600.00
700.00
800.00
Focused Dredging with M
NR
ENR
Metric TonsGHG Emissions
Residual Handling
Equipment Use and M
isc
Transportation‐Equipment
Transportation‐Personnel
Consumables
0.00E+00
1.00E+03
2.00E+03
3.00E+03
4.00E+03
5.00E+03
6.00E+03
7.00E+03
8.00E+03
9.00E+03
1.00E+04
Focused Dredging with M
NR
ENR
MMBTU
Total Energy Used
Residual Handling
Equipment Use and M
isc
Transportation‐Equipment
Transportation‐Personnel
Consumables
0.00E+00
1.00E+00
2.00E+00
3.00E+00
4.00E+00
5.00E+00
6.00E+00
Focused Dredging with M
NR
ENR
Metric Ton
Total N
Ox Em
issions
Residual Handling
Equipment Use and M
isc
Transportation‐Equipment
Transportation‐Personnel
Consumables
0.00E+00
2.00E‐01
4.00E‐01
6.00E‐01
8.00E‐01
1.00E+00
1.20E+00
1.40E+00
1.60E+00
Focused Dredging with M
NR
ENR
Metric Ton
Total SOx Em
issions
Residual Handling
Equipment Use and
Misc
Transportation‐
Equipment
Fig
ure
7. C
omp
arat
ive
Imp
acts
by
Act
ivit
y T
ype
for
the
Foc
use
d D
red
gin
g w
ith
MN
R a
nd
EN
R A
lter
nat
ives
for
B
ish
op P
oin
t S
edim
ents
Usi
ng
Sit
eWis
e™ V
ersi
on 3
.1

39
0.00E+00
5.00E‐05
1.00E‐04
1.50E‐04
2.00E‐04
2.50E‐04
3.00E‐04
3.50E‐04
4.00E‐04
4.50E‐04
Focused Dredging with M
NR
ENR
Risk of Fatality
Accident Risk ‐Fatality
Residual Handling
Equipmen
t Use and M
isc
Transportation‐Equipment
Transportation‐Personnel
Consumables
0.00E+00
1.00E‐02
2.00E‐02
3.00E‐02
4.00E‐02
5.00E‐02
6.00E‐02
7.00E‐02
8.00E‐02
Focused Dredging with M
NR
ENR
Risk of Injury
Accident Risk ‐Injury
Residual Handling
Equipmen
t Use and M
isc
Transportation‐Equipment
Transportation‐Personnel
Consumables
0.00E+00
5.00E‐01
1.00E+00
1.50E+00
2.00E+00
2.50E+00
3.00E+00
Focused Dredging with M
NR
ENR
Metric TonTotal PM
10Em
issions
Residual Handling
Equipmen
t Use and M
isc
Transportation‐Equipment
Transportation‐Personnel
Consumables
0.00E+00
1.00E‐01
2.00E‐01
3.00E‐01
4.00E‐01
5.00E‐01
6.00E‐01
7.00E‐01
8.00E‐01
9.00E‐01
1.00E+00
Focused Dredging with M
NR
ENR
Gallons
Water Consumption
Residual Handling
Equipmen
t Use and M
isc
Transportation‐Equipment
Transportation‐Personnel
Consumables
Fig
ure
7 (
con
tin
ued
). C
omp
arat
ive
Imp
acts
by
Act
ivit
y T
ype
for
the
Foc
use
d D
red
gin
g w
ith
MN
R a
nd
EN
R
Alt
ern
ativ
es f
or B
ish
op P
oin
t S
edim
ents
Usi
ng S
iteW
ise™
Ver
sion
3.1

40
6.0 CONCLUSIONS
GSR is a technique that promotes responsible environmental stewardship through the analysis of the sustainability and environmental impact of alternative remediation approaches. While DON sediment and background guidance and policy do not necessarily directly address the concept of GSR, there are certainly compatibilities. DON sediment policy and guidance recognize the need for adequate sediment CSMs, source control, and sound decision making for the evaluation, selection, and implementation of sediment remedies, and promote optimized strategies and management approaches that ultimately support more sustainable sediment remedies. DON background policy and guidance support the need for optimizing remediation footprints, which is a critical issue for sediment sites to achieve and maintain RGs and RAOs. DON optimization policy does not specifically address sediment sites; however, it does specify the use of GSR evaluations for all ER sites during relevant CERCLA phases.
DON guidance supports the application of GSR evaluations specifically at the FS stage, but also at other stages throughout the project lifecycle. The metrics for assessing GSR that have been identified by the DON include energy consumption, GHG emissions, criteria pollutant emissions, water use/impacts, ecological impacts, resource consumption, worker safety, and community impacts. A careful analysis of these criteria will help project managers to ensure that their selected remedial alternative does the maximum amount of good (remediation), while limiting negative side effects (i.e., the environmental footprint).
Despite contaminated sediments being a known environmental concern and the long history of addressing sediments through remedial action, GSR metrics have largely not been considered in the context of contaminated sediment remediation. Battelle has developed a revision to the SiteWiseTM tool to address this knowledge gap. SiteWise™ generally includes environmental footprint factors that consider primary, secondary, and even tertiary sustainability impacts. SiteWise™ Version 3.1 now includes modules that relate specifically and directly to sediments-related remediation approaches, including dredging, capping (including ENR), and MNR, which complement the existing capabilities of SiteWise™ to assess general construction approaches and other specialized materials and strategies.
Below are specific recommendations pertaining to the findings of this White Paper:
DON RPMs are encouraged to review the references provided in this White Paper for more information about DON GSR guidance (including relevant metrics), DON guidance on contaminated sediment remediation, and sediment remedy selection.
It is recommended that DON RPMs review the revised SiteWise™ tool and use it to determine the overall impact their selected sediment site remedy would have relative to the DON’s GSR metrics. Additional outreach to RPMs and contractors regarding the use of the updated SiteWise™ tool for sediment sites may be beneficial to facilitate increased understanding and utilization.
It is recommended to further evaluate the function of SiteWise™ Version 3.1 for several sediment case study sites including following-up on the Pearl Harbor case study to track on the application of GSR during finalization of the FS.
A primary driver of the GSR footprint for sediment sites is typically the TTZ size. Optimization techniques should be considered that minimize the TTZ size for sediment sites to the minimum effective TTZ in which remediation would yield an outcome achieving RGs

41
and RAOs. Further, case studies to specifically examine how TTZs are determined for sediment sites and tools/techniques to minimize TTZs could be helpful as a guide to RPMs.
Because dredging is typically a highly intensive process compared to other approaches (e.g., capping or MNR), the application of dredging to achieve site RAOs should be carefully considered relative to the ability to achieve RAOs through less intensive means, particularly for sites with more extensive TTZs.
Site workflow operations should be optimized to the extent possible for sediment remediation sites to maximize energy and other resource efficiencies and to reduce overall sustainability impacts.
Sediment site managers should evaluate opportunities to exploit synergies between other local and regional projects to provide mutual benefit, optimize resource use, and reduce overall sustainability impacts. For instance, site managers should evaluate the potential to beneficially reuse dredged sediment, to combine transportation and/or treatment streams between compatible programs, and to leverage restoration initiatives that provide environmental benefit while reducing remedy intensity.

42
7.0 REFERENCES
AECOM. 2015. Final Feasibility Study, Pearl Harbor Sediment, Joint Base Pearl Harbor-Hickam, Oahu, Hawaii. Prepared for NAVFAC Pacific. June.
Battelle. 2014. Final Remedial Investigation and Feasibility Study Report for Investigation Area K, Former Mare Island Naval Shipyard, Vallejo, California. Prepared for BRAC PMO West. November.
Department of Defense (DoD). 2012. Department of Defense Manual, Defense Environmental Restoration Program Management. Publication Number 4715.20. March.
Department of Defense (DoD). 2009. Consideration of GSR Practices in the Defense Environmental Restoration Program. August.
Department of the Navy (DON). 2012. Policy for Optimizing Remedial and Removal Actions at All DON Environmental Restoration Program Sites. April.
Department of the Navy (DON). 2004a. Navy Policy on the Use of Background Chemical Levels. January.
Department of the Navy (DON). 2004b. Navy and Marine Corps Policy for Optimizing Remedial and Removal Actions at all Installation Restoration and Munitions Response Program Sites. April.
Department of the Navy (DON). 2002. Policy on Sediment Site Investigation and Response Action. February.
United States Environmental Protection Agency (EPA). 2013. Use of Amendments for In-Situ Remediation at Superfund Sites. OSWER Directive 9200.2-128FS. April.
United States Environmental Protection Agency (EPA). 2008. Green Remediation: Incorporating Sustainable Environmental Practices into Remediation of Contaminated Sites. April.
United States Environmental Protection Agency (EPA). 2005. Contaminated Sediment Remediation Guidance for Hazardous Waste Sites. EPA-540-R-05-012. December.
Hall, S.J., D. Raffaelli, and S.F. Thrush. 1994. Patchiness and Disturbance in Shallow Water Benthic Assemblages. In: P.S. Giller, A.G. Hildrew, and D.G. Raffaelli (eds.), Dredging, Remediation, and Containment of Contaminated Sediments. ASTM, West Conshohocken, PA, p. 145-154.
Interstate Technology & Regulatory Council (ITRC). 2014. Contaminated Sediments Remediation: Remedy Selection for Contaminated Sediments. August.
Naval Facilities Engineering Command (NAVFAC). 2012a. Department of the Navy Guidance on Green and Sustainable Remediation. April.
Naval Facilities Engineering Command (NAVFAC). 2012b. Integrating Green and Sustainable Remediation Metrics within the CERCLA Process during the Feasibility Study. July.

43
Naval Facilities Engineering Command (NAVFAC). 2010. Department of the Navy Guidance for Planning and Optimizing Monitoring Strategies. UG-2081-ENV Rev.1. November.
Naval Facilities Engineering Command (NAVFAC). 2005. Implementation Guide for Assessing and Managing Contaminated Sediment at Navy Facilities. UG-2053-ENV.
Naval Facilities Engineering Command (NAVFAC). 2004. Guidance for Habitat Restoration and Monitoring: Framework for Monitoring Plan Development and Implementation. August.
Naval Facilities Engineering Command (NAVFAC). 2003. Guidance for Environmental Background Analysis, Volume II: Sediment. April.
Space and Naval Warfare Systems Command (SPAWAR). 2007. User’s Guide for Assessing Sediment Transport at Navy Facilities. September.

Appendix A: Best Management Practices for Enhancing the Sustainability
of Sediment Sampling and Remediation

APPENDIX A: BEST MANAGEMMENT PRACTICES FOR ENHANCING THE SUSTAINABILITY OF SEDIMENT SAMPLING AND REMEDIATION
A-1
This appendix provides a summary of example best management practices (BMPs) for making sediment remediation and sampling more sustainable.
Energy Consumption
Minimizing the amount of sediment remediated should be considered, as long as human health and the environment are always protected. Optimizing treatment systems and treatment areas by using combined approaches could help prevent energy consumption by using less energy-demanding treatment options in areas that do not require sediment removal.
Minimizing the amount of transportation of equipment, waste, and personnel should be considered.
Any opportunity to reduce the amount of consumable materials used (e.g., disposable sampling equipment) should be considered. Optimized equipment use (e.g., variable speed motors, high efficiency equipment, etc.) to reduce the use of electricity. Optimizing the staging of equipment and material deliveries to reduce the energy necessary to move them during use. Optimizing personnel, equipment, and waste transportation by alternative transportation (rail, public transportation, etc.), optimized routes and sampling strategies, using local disposal facilities, finding locally-sourced fill and clean material.
GHG Emissions
All of the BMPs for reducing energy consumption are also applicable to reducing GHG emissions.
Reducing engine idle time during remediation operations or generator idle time during sampling operations.
Using alternative fuels, such as biodiesel, and alternative energy sources, such as solar or wind, can help to reduce GHG emissions.
Criteria Pollutant Emissions
All of the BMPs for reducing energy consumption and GHG emissions are also applicable to reducing criteria pollutant emissions. After-market technologies to reduce criteria pollutant emissions from excavation equipment or trucks, including diesel oxidation catalysts, diesel particulate filters, selective catalytic reduction, and diesel multistage filters.

APPENDIX A: BEST MANAGEMMENT PRACTICES FOR ENHANCING THE SUSTAINABILITY OF SEDIMENT SAMPLING AND REMEDIATION
A-2
Water Impacts/Use
Minimizing the use of energy can eliminate the need for increased water consumption when producing energy. Traditional energy sources, such as coal fired power plants, as well as hydroelectric dams are water-intensive processes. Minimizing energy use not only helps with curbing the emission of GHGs and criteria pollutants but also with the consumption of water.
Considering certain renewable energy sources, such as solar energy, can help to reduce the amount of water needed for energy production. Minimizing the use of consumable materials that require water for manufacture. Designing remediation systems that do not consume water but rather treat water for beneficial use can help to meet community water needs and offset the water consumed for other purposes.
Ecological Impacts
Invasive remedies, such as dredging, can adversely affect ecosystems. Their use should be minimized to situations in which they are absolutely necessary. Adverse effects include disrupting benthic communities, habitat destruction, and the potential for promoting the movement of invasive species. These effects are largely dependent on the size and of the treatment operation, so invasive operation should be limited, when possible.
Returning a remediated site to natural conditions (e.g., wetland reconstruction) should be considered when feasible.
Resource Consumption and Waste Generation
Land use should be considered when designing treatment systems. Systems that leave contaminants in-place may lead to land use controls after remediation is completed. This must be considered if beneficial land-use is expected from a remedial site.
Disposal of material to landfills must be minimized whenever possible. For many remediation scenarios, this includes disposal of used equipment and other materials; however, for dredge and disposal operations, large quantities of sediment must also be disposed of. These quantities should be minimized when possible. The use of clean fill to re-grade dredged sites should be limited, when possible. If necessary, native soil should be used as fill to reduce the need for transporting off-site clean fill.
Worker Safety/Accident Risk
Minimizing the use of heavy machinery will reduce the risk of workplace accidents. Minimizing the amount of transport required will reduce the risk of workplace accidents and accidents in the surrounding community. Implementing effective health and safety plans with thorough reviews, daily tailgate safety meetings, and regular updates will help keep workers apprised of workplace hazards.

APPENDIX A: BEST MANAGEMMENT PRACTICES FOR ENHANCING THE SUSTAINABILITY OF SEDIMENT SAMPLING AND REMEDIATION
A-3
Community Impacts
Most of the BMPs for other categories are applicable to minimizing community impacts. Minimizing the extent of remedial activities to the areas necessary to protect human health and the environment will help to decrease the disturbance to surrounding communities. Minimizing dredged areas will decrease the risk of mobilizing contaminants from dredged sediments during treatment operations. Minimizing the use of heavy machinery will decrease the disturbance to communities by noise. Minimizing the need for transporting equipment and material will reduce the impact to surrounding communities by traffic.