sustainable technology and 35% infrastructure monthly ... · industrial iot & software nd nd nd...
TRANSCRIPT

Greentech / 1
3%
18%
24%
16%
(5%)
5%
15%
25%
35%
Sep-17 Nov-17 Jan-18 Mar-18 May-18 Jul-18 Sep-18
NASDAQ Clean Edge Green Energy Dow Jones Industrial Average NASDAQ Composite S&P 500
Corporate M&A and
Asset Transactions
Acquiror Target Transaction Description
Corporate Transactions
Agreement to buy manufacturer of
semiconductors for self-driving cars for $6.7bn
Acquisition of a 50% interest in provider of
distributed generation solar solutions
Acquisition of a minority equity position in
Origis Energy as a part of a joint investment
agreement
Asset Transactions
Agreement to acquire Sempra's U.S. non-utility
operating solar assets, solar and battery storage
development projects and one wind facility
Acquisition of a 612 MW wind portfolio in New
York and dedicated operations platform
Sustainable Technology and
Infrastructure Monthly Market Update
September 2018
About Greentech Capital Advisors
Our mission is to empower companies and investors who are creating a more efficient and sustainable global infrastructure. We are
purpose-built to ensure that our clients achieve success. We have deeply experienced senior bankers and investment professionals who
are sector experts and understand our clients' industry and needs. We reach a vast global network of buyers, growth companies, asset
owners and investors, and thereby provide clients with more ways to succeed through a deeper relationship network. We have directly
relevant transaction experience which enables us to find creative structures and solutions to close transactions. We are an expert team
of 65 professionals working seamlessly on our clients' behalf in New York, Zurich and San Francisco and through a strategic partnership
in Japan. Our team of experienced bankers and investment professionals provides conflict-free advice and thoughtful, innovative
solutions.
Note: M&A transaction values are in enterprise value, unless indicated otherwise.
Index Performance September Ending Versus First Day of the
September YTD CY 2017 52 Wk High 52 Wk Low
Dow Jones Industrial Average 4.0% 7.0% 25.1% (1.1%) 18.0%
NASDAQ Composite 4.8% 16.5% 28.2% (0.8%) 23.8%
S&P 500 3.5% 9.0% 19.4% (0.6%) 15.7%
NASDAQ Clean Edge Green Energy (0.7%) (2.3%) 30.8% (7.9%) 6.1%
Capital Raises
Company Transaction Description
Lucid Motors, the California-based electric vehicle maker, raised more
than $1bn in funding from Saudi Arabia’s Public Investment Fund
sPower completed a $499mm private placement financing for
approximately half of its 1,300 MW operating portfolio
Indigo Ag, a Boston-based developer of microbial products that
increase crop yields, raised $250mm in Series E funding
Performance of Key Market Indices
Notable Recent Transactions & Capital Raises
Greentech Advised on Transaction

Greentech / 2
Transaction
Transaction
Multiple(1)
Date Target Acquiror Transaction Description Subsector Value ($mm) Revenue EBITDA
9/4/2018 WegoWise AppFolio
Acquisition of WegoWise, a cloud-
based utility analytics software
company
Industrial IoT
& SoftwareND ND ND
9/4/2018 Relayr Munich Re
Acquisition of Relayr, a Germany-
based provider of industrial
internet of things solutions
Industrial IoT
& Software$300 ND ND
9/6/2018 AmarnaVantage Specialty
Chemicals Holdings
Acqusition of Colorado-based
maker of release products and
spray systems used in food
applications
AgTech $226 ND ND
9/11/2018Integrated Device
Technology Inc.
Renesas Electronics
Corp.
Agreement to buy Integrated
Device Technology Inc.,
manufacturer of semiconductors
for self-driving cars
Advanced
Mobility$6,700 ND ND
9/11/2018 Valdesolar Hive RepsolAcquisition of Spain-based solar
developer
Renewable
Energy$247 ND ND
9/12/2018 AMS Environmental Pine Lake Partners
Acquisition of AMS
Environmental, a commercial and
industrial waste management
solutions provider
Environmental
ServicesND ND ND
9/18/2018Leeward Renewable
Energy
OMERS Infrastructure
Management
Acquisition of Leeward
Renewable Energy - owner of 19
wind projects across nine states
with a total installed capacity of
about 1,700 MW in the U.S.
Renewable
EnergyND ND ND
9/19/2018 Direct Energie Total SAAcquisition of alternative power
supplier Direct Energie
Power Infra /
Smart Grid$1,700 ND ND
9/19/2018 G2mobility Total SA
Acquisition of electric vehicle
charging solutions provider
G2mobility
Advanced
MobilityND ND ND
9/20/2018Egear and Hawaii
Energy ConnectionSungevity
Agreement to concurrently
acquire EGear and Hawaii Energy
Connection, leaders in Hawaii's
advanced solar, storage and grid
services market
Renewable
EnergyND ND ND
9/24/2018 EnterSolar EDF Renewables
Acquisition of a 50% interest in
EnterSolar, a leading provider of
distributed generation solar
solutions to corporate
commercial and industrial (C&I)
customers
Renewable
EnergyND ND ND
9/24/2018 Origis EnergyGlobal Atlantic
Financial Group
Acquisition of a minority equity
position in Origis Energy as a
part of a joint investment
agreement
Renewable
EnergyND ND ND
Select Recent Sustainable Technology & Infrastructure
M&A Transactions (1/3)
Source: FactSet, company announcements, Greentech estimates, SEC filings and third party providers.
(1) Transaction multiples represent LTM EV/Adj. EBITDA and LTM EV/Sales.
Corporate Transactions
Greentech’s Take:
Integrated Device
Technology Inc. brings
valuable technology and
revenue synergy
opportunities to
Renesas's existing auto
business, while adding
diversification in
attractive markets like
data centers
Greentech’s Take:
With this purchase,
Repsol officially enters
the solar energy market,
following the trend of oil
& gas companies
investing in the
renewable energy space
Greentech’s Take:
The partnership will allow
both entities to capitalize
on the strong and
accelerating demand for
distributed generation
solutions from the
corporate C&I sector

Greentech / 3
Transaction
Transaction
Multiple(1)
Date Seller Acquiror Transaction Description Subsector Value ($mm) Revenue EBITDA
9/4/2018 SunPower
Clearway Energy
Group (backed by
Global Infrastructure
Partners)
Acquisition of a 4.7 GW portfolio
of solar development projectsSolar ND ND ND
9/5/2018Noble Environmental
PowerCarlyle Group
Acquisition of a 612 MW wind
portfolio in New York and
dedicated operations platform
Wind ND ND ND
9/5/2018NextEra Energy
Resources
NextEra Energy
Partners
Agreement to acquire a 1,388
MW portfolio of wind and solar
projects
Solar $1,280 ND ND
9/6/2018 Oaktree Capital Capital Power
Agreement to acquire the 580
MW Arlington Valley gas plant in
Arizona
Natural Gas $300 ND ND
9/6/2018 Canadian SolarCanadian Solar
Infrastructure Fund
Drop-down acquisition of 3 solar
plants in JapanSolar $103 ND ND
9/10/2018
Macquarie Capital
and Reneawable
Energy Systems
Partners Group
Acquisition of a wind farm under
development in Australia with
expected capacity of 226 MW
Wind $142 ND ND
9/12/2018 Voltalia SA Echoenergia
Participacoes SA
Acquisition of 197 MW portfolio
of wind parks in BrazilWind ND ND ND
9/12/2018 CoillteGreencoat
Renewables
Acquisition of interests in four
wind projects totaling 240 MW in
Ireland from Coillte
Wind $330 ND ND
9/17/2018Cypress Creek
Renewables
Helios Infrastructure
Fund
Agreement to acquire 135 MW of
solar assets in North CarolinaSolar ND ND ND
9/17/2018 EDF RenewablesPGGM Infrastructure
Fund
Acquisition of 50% stake in the
200 MW Red Pine wind project in
Minnesota and the 154 MW Rock
Falls wind project in Oklahoma
Wind ND ND ND
9/17/2018 Invenergy Boralex
Acquisition of economic interest
in five wind frams, totalling 201
MW
Wind $166 ND ND
9/18/2018Old Dominion
Electric CooperativeEssential Power
Acquisition of Old Dominion's
ownership interest in the gas-
fired Rock Springs power plant in
Maryland
Natural Gas $115 ND ND
9/19/2018 OrstedGlobal Infrastructure
Partners
Agreement to acquire a 50%
interest in the 1,218 MW
Hornsea 1 offshore wind farm
Wind $5,850 ND ND
Select Recent Sustainable Technology & Infrastructure
M&A Transactions (2/3)
Asset Transactions
Source: FactSet, company announcements, Greentech estimates, SEC filings and third party providers.
(1) Transaction multiples represent LTM EV/Adj. EBITDA and LTM EV/Sales.
Greentech’s Take:
This transaction replaces
the Canadian portfolio
that NextEra Energy
divested earlier this year
with higher yielding U.S.
assets
Greentech’s Take:
Along with the recent
acquisition of NRG
Energy’s renewable
portiolio, this acquisition
illustrates Global
Infrastructure Partners'
focus on renewable
assets
Greentech’s Take:
Represents the third
transaction in the
continued partnership
between Orsted and
Global Infrastructure
Partners
Greentech Advised on Transaction

Greentech / 4
Transaction
Transaction
Multiple(1)
Date Seller Acquiror Transaction Description Subsector Value ($mm) Revenue EBITDA
9/19/2018
Ares EIF and
Starwood Energy
Group Global
Argo Infrastructure
Partners
Agreement to acquire the 660
MW Hudson Transmission line
Power Infra /
Smart GridND ND ND
9/21/2018 Sempra Energy Con Edison
Agreement to acquire Sempra's
U.S. non-utility operating solar
assets, solar and battery storage
development projects and one
wind facility
Solar $1,540 ND ND
9/24/2018 EDF Renewables Atlantic Power Corp.
Agreement to acquire two
contracted biomass power plants
in South Carolina
Biomass $13 ND ND
9/27/20188minutenergy
RenewablesCapital Dynamics
Agreement to acquire the 121
MW Springbok 3 solar project in
Kern county, California
Solar ND ND ND
9/27/2018Renewable Energy
SystemsSkyline Renewables
Agreement to acquire the 166
MW Hackberry wind farm in
northwest Texas
Wind ND ND ND
9/27/2018 Saméole SAS ENGIE SA
Acquisition of a ~500 MW
portfolio of under-development
onshore wind projects in France
Wind ND ND ND
Select Recent Sustainable Technology & Infrastructure
M&A Transactions (3/3)
Asset Transactions
Source: FactSet, company announcements, Greentech estimates, SEC filings and third party providers.
(1) Transaction multiples represent LTM EV/Adj. EBITDA and LTM EV/Sales.
Greentech’s Take:
Illustrates Argo
Infrastructure's strategy
to invest in assets in
premium locations with
long-term contracted
cash flows

Greentech / 5
Amount Selected Disclosed
Date Company Transaction Description Raised ($mm) Subsector Investors
9/4/2018 Rappi
Colombian on-demand delivery startup Rappi
raised $200mm in funding at a valuation north
of $1bn
$200Advanced
MobilityDST Global
9/4/2018 AvirosSwiss startup raised $14mm for an AI-fueled
fleet management platform $14
Advanced
Mobility
Lakestar, Notion, Verve-
Capital, Siraj Khaliq
(Atomico), Andrew Flett
(Fleetmatics)
9/4/2018 AuterionSwitzerland-based open source drone software
company raised $10mm in seed funding$10
Advanced
Mobility
Lakestar, Mosaic Ventures,
Costanoa Ventures, Tectonic
Ventures
9/5/2018 Farmer's Fridge
A network of maintenance-free, low-energy and
health-focused vending machines raised a
$30mm Series C round led by Innovation
Endeavors
$30 AgTech Innovation Endeavors
9/6/2018 Sentera
Minneapolis-based supplier of integrated
remote sensing, analytics, and IoT solutions
for agricultural application raised $14mm in
Series A funding from S2G Ventures and
Continental Grain Company
$14 AgTechS2G Ventures, Continental
Grain Company
9/7/2018 Spyce
Provider of convenient and nutritional meals
from a fully robotic kitchen raised a $21mm
Series A round
$21 AgTechMaveron, Collaborative
Fund, Khosla Ventures
9/7/2018 Miss FreshChina-based e-commerce startup delivering
fresh produce raised $450mm $450
Advanced
MobilityGoldman Sachs, Tencent
9/7/2018 GrayOrangeDeveloper of fully-automated robotics for
warehouses raised $140mm $140
Industrial IoT
& Software
Mithril Capital, Flipkart co-
founder Binny Bansal, Blume
Ventures
9/11/2018 Akfen RenewablesEBRD provided up to $102mm financing to
Turkey’s Akfen Renewables $102
Renewable
EnergyEBRD
9/10/2018 AutoGrid Systems
AutoGrid Systems, the leader in artificial
intelligence (AI)-driven optimization and
controls for the energy industry, closed a
$32mm Series D funding round
$32Power Infra /
Smart Grid
CLP, Innogy, Orsted,
Tenaska
9/13/2018 Solid PowerColorado-based maker of solid battery cells
raised $20mm in funding$20
Power Infra /
Smart Grid
Hyundai CRADLE, Samsung
Venture Investment Corp.,
Sanoh Industrial Co., Solvay
Ventures, A123 Systems
9/13/2018 Yellow
Yellow, a startup focused on micro-mobility
services across Latin America, raised $63mm in
Series A funding
$63Advanced
Mobility
GGV Capital, Monashees,
Grishin Robotics, Base10
Partners, Class 5
9/14/2018 Applied IntuitionAutonomous driving simulation software
developer, raised $12mm in funding $12
Advanced
Mobility
Andreessen Horowitz, Lux
Capital, Floodgate, John
Doerr
9/17/2018 Lucid Motors
California-based electric vehicle maker raised
more than $1bn in funding from Saudi Arabia’s
Public Investment Fund
$1,000Advanced
Mobility
Saudi Arabia’s Public
Investment Fund
Select Recent Sustainable Technology & Infrastructure
Capital Raise Transactions (1/3)
Source: FactSet, company announcements, Greentech estimates, SEC filings and third party providers.
Corporate Transactions
Greentech’s Take:
Saudi Arabia's Public
Investment Fund
continues to be active in
the advanced mobility
space in the U.S.
Greentech’s Take:
With increasing
competition, on-demand
food delivery companies
continue to raise capital
in order to enhance
logistics and extend
broad coverage areas
Greentech / 6
Amount Selected Disclosed
Date Company Transaction Description Raised ($mm) Subsector Investors
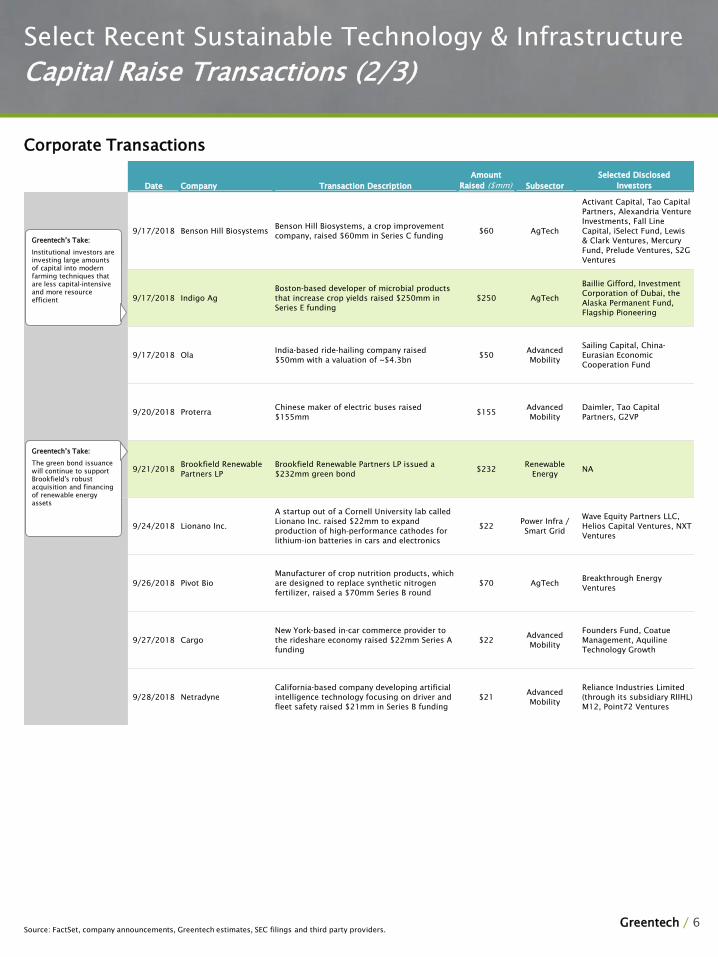
9/17/2018 Benson Hill BiosystemsBenson Hill Biosystems, a crop improvement
company, raised $60mm in Series C funding$60 AgTech
Activant Capital, Tao Capital
Partners, Alexandria Venture
Investments, Fall Line
Capital, iSelect Fund, Lewis
& Clark Ventures, Mercury
Fund, Prelude Ventures, S2G
Ventures
9/17/2018 Indigo Ag
Boston-based developer of microbial products
that increase crop yields raised $250mm in
Series E funding
$250 AgTech
Baillie Gifford, Investment
Corporation of Dubai, the
Alaska Permanent Fund,
Flagship Pioneering
9/17/2018 OlaIndia-based ride-hailing company raised
$50mm with a valuation of ~$4.3bn$50
Advanced
Mobility
Sailing Capital, China-
Eurasian Economic
Cooperation Fund
9/20/2018 ProterraChinese maker of electric buses raised
$155mm $155
Advanced
Mobility
Daimler, Tao Capital
Partners, G2VP
9/21/2018Brookfield Renewable
Partners LP
Brookfield Renewable Partners LP issued a
$232mm green bond $232
Renewable
EnergyNA
9/24/2018 Lionano Inc.
A startup out of a Cornell University lab called
Lionano Inc. raised $22mm to expand
production of high-performance cathodes for
lithium-ion batteries in cars and electronics
$22Power Infra /
Smart Grid
Wave Equity Partners LLC,
Helios Capital Ventures, NXT
Ventures
9/26/2018 Pivot Bio
Manufacturer of crop nutrition products, which
are designed to replace synthetic nitrogen
fertilizer, raised a $70mm Series B round
$70 AgTechBreakthrough Energy
Ventures
9/27/2018 Cargo
New York-based in-car commerce provider to
the rideshare economy raised $22mm Series A
funding
$22Advanced
Mobility
Founders Fund, Coatue
Management, Aquiline
Technology Growth
9/28/2018 Netradyne
California-based company developing artificial
intelligence technology focusing on driver and
fleet safety raised $21mm in Series B funding
$21Advanced
Mobility
Reliance Industries Limited
(through its subsidiary RIIHL)
M12, Point72 Ventures
Select Recent Sustainable Technology & Infrastructure
Capital Raise Transactions (2/3)
Source: FactSet, company announcements, Greentech estimates, SEC filings and third party providers.
Corporate Transactions
Greentech’s Take:
The green bond issuance
will continue to support
Brookfield's robust
acquisition and financing
of renewable energy
assets
Greentech’s Take:
Institutional investors are
investing large amounts
of capital into modern
farming techniques that
are less capital-intensive
and more resource
efficient

Greentech / 7
Amount Selected Disclosed
Date Company Transaction Description Raised ($mm) Subsector Investors
9/12/2018Quinbrook
Infrastructure Partners
Quinbrook Infrastructure Partners completed
construction debt and tax equity financing for
a 200 MW wind farm in Oklahoma
ND Wind
GE Energy Financial Services,
JP Morgan, ABN Amro, MUFG
and Rabobank
9/13/2018 Reden SolarReden Solar secured €101mm refinancing for
Portuguese and Spanish solar projects $119
Renewable
EnergyNatixis
9/14/2018 Bayern LBBayern LB closed $209mm Midwest wind
project debt$209 Wind
Citi, Hannon Armstrong
Sustainable Infrastructure
Capital, Geronimo
Renewable Infrastructure
Partners
9/14/2018Akfen Holding Anonim
Sirketi
European development bank loaned $102mm
for new Turkish solar and wind projects with a
total capacity of 242 MW
$102 Wind EBRD
9/17/2018 NRG EnergyNRG Energy closed construction financing with
Morgan Stanley for its 180 MW wind project $275 Wind Morgan Stanley
9/20/2018 EDP RenewablesEDP Renewables secured equity financing for 2
wind farms with total capacity of 277 MW in US$268 Wind ND
9/26/2018 sPower
sPower, a joint venture of AES Corp. and
Alberta Investment Management Corp.,
completed a $499mm private placement
financing for approximately half of its 1,300
MW operating portfolio
$499Renewable
EnergyNA
9/26/2018 Bloom Energy Corp.
Maker of fuel-cell power systems received
financing for commercial and industrial
projects
$100 Natural Gas KeyCorp
Select Recent Sustainable Technology & Infrastructure
Capital Raise Transactions (3/3)
Source: FactSet, company announcements, Greentech estimates, SEC filings and third party providers.
Asset Transactions
Greentech’s Take:
This transaction is among
the first ever widely-
distributed back-leverage
bond financings on tax
equity partnerships

Greentech / 8
Comparable Companies Trading Analysis
Diversified Industrials and Energy Infrastructure
Source: FactSet, SEC filings and third party providers. Values in U.S. Dollars. Share prices shown in local currencies.
(1) Enterprise Value = Market Value of Equity + Debt + Preferred Equity + Minority Interest - Investments in Affiliates - Cash and Marketable Securities.
(2) 2018 and 2019 EBITDA Multiples exclude multiples over 35x.
(3) 2018 and 2019 Price/Earnings Multiples exclude multiples over 50x.
Price as a % Market Enterprise Net Debt/
Price as of of 52 Wk Value Value (1)
EBITDA (2)
Price/ Earnings (3)
2018E Debt/
Company 9/28/2018 High ($mm) ($mm) 2018E 2019E 2018E 2019E EBITDA EV
Diversified Industrials
Diversified Industrials
GE $11.29 45.4% $98,122 $206,088 13.8x 11.7x 11.9x 11.1x 5.9x 56.1%
Siemens €110.34 87.6% $108,936 $131,652 10.8x 9.6x 15.0x 13.7x 2.0x 25.7%
United Technologies $139.81 97.0% $111,861 $131,214 11.6x 11.6x 19.4x 17.7x 1.5x 21.6%
Honeywell $166.40 99.3% $123,570 $130,982 14.3x 13.3x 20.4x 18.8x 0.8x 13.0%
Caterpillar $152.49 88.0% $90,629 $118,032 10.4x 9.6x 13.2x 11.9x 2.4x 30.6%
Mitsubishi ¥3,501 97.1% $49,011 $88,883 12.3x 12.1x 8.7x 8.4x 4.4x 49.4%
Danaher $108.66 99.4% $76,035 $86,464 18.2x 17.0x 24.2x 22.4x 2.2x 13.1%
Hyundai ₩129,500 77.3% $29,617 $76,100 11.3x 10.2x 9.3x 7.4x 6.1x 86.4%
ABB CHF23.19 85.1% $51,474 $57,416 10.7x 9.6x 17.3x 15.2x 1.2x 18.5%
Schneider €69.30 88.2% $46,601 $55,251 10.9x 10.1x 15.4x 14.0x 1.4x 19.4%
Emerson $76.58 97.2% $48,128 $50,752 13.4x 12.0x 22.1x 19.9x 0.7x 11.8%
Johnson Controls $35.00 82.2% $32,372 $45,302 9.1x 8.6x 12.2x 11.3x 2.3x 26.4%
Eaton Corp $86.73 96.5% $37,580 $44,808 11.5x 10.8x 16.2x 14.7x 1.8x 17.2%
Roper Technologies $296.21 94.7% $30,612 $35,813 20.2x 19.2x 25.7x 24.1x 2.9x 15.7%
Rockwell $187.52 89.0% $23,096 $22,835 14.8x 13.8x 22.7x 20.4x NM 5.4%
Legrand €62.78 93.1% $19,455 $22,187 13.9x 13.1x 20.9x 19.5x 1.7x 15.8%
Dover $88.53 98.1% $13,076 $16,093 13.1x 12.0x 18.4x 15.8x 2.5x 20.3%
Delta Electronics NT$131.00 83.2% $11,145 $10,451 11.6x 10.3x 21.5x 18.2x NM 8.5%
Alstom €38.49 92.7% $9,969 $9,995 12.3x 11.4x 19.2x 19.2x NM 19.8%
Hitachi ¥3,800 77.0% $7,197 $9,332 7.4x 6.9x 12.7x 11.6x 1.4x 25.9%
OMRON ¥4,800 62.6% $9,042 $7,903 7.6x 7.4x 16.0x 15.3x NM NM
Woodward $80.86 90.5% $4,988 $6,229 15.2x 11.6x 24.5x 17.2x 3.0x 21.8%
Regal Beloit $82.45 95.0% $3,583 $4,773 9.0x 8.5x 14.0x 12.7x 2.2x 28.0%
Moog $85.97 91.5% $3,083 $3,780 11.2x 9.9x 26.2x 16.8x 2.1x 22.8%
Bharat Heavy Electricals ₹68.40 63.3% $3,464 $1,921 6.6x 5.3x 21.3x 15.6x NM NM
CG Power & Industrial Solutions ₹44.70 45.2% $396 $551 7.2x 6.0x 18.5x 10.8x 2.1x 47.1%
Mean 11.9x 10.8x 18.0x 15.5x 2.4x 25.8%
Median 11.5x 10.6x 18.4x 15.5x 2.1x 20.9%
Energy Infrastructure
Primary Equipment and Power Electronics
TE Connectivity $87.93 81.2% $30,640 $33,878 10.4x 9.4x 15.4x 14.2x 1.0x 11.8%
Sensata $49.55 86.3% $8,408 $10,791 11.5x 10.9x 13.5x 12.2x 2.5x 30.2%
Delta Electronics NT$131.00 83.2% $11,145 $10,451 11.6x 10.3x 21.5x 18.2x NM 8.5%
Yaskawa ¥3,375 55.1% $7,924 $7,790 11.3x 10.5x 18.4x 17.4x NM 4.7%
Fuji Electric ¥4,550 95.3% $5,981 $7,028 8.7x 8.2x 15.8x 14.7x 1.2x 17.7%
NGK ¥1,874 81.3% $5,404 $5,640 5.7x 5.1x 11.8x 10.7x 0.2x 32.3%
LS Industrial Systems ₩74,600 91.0% $2,018 $2,161 7.7x 7.4x 14.1x 12.6x 0.7x 24.8%
SPX Corporation $33.31 84.8% $1,434 $1,841 8.5x 14.7x 12.5x 2.2x 25.7%
Mean 9.6x 8.8x 15.7x 14.1x 1.3x 19.5%
Median 10.4x 8.9x 15.1x 13.4x 1.1x 21.3%
EPC and Services
ACS Group €36.68 95.6% $13,406 $24,166 8.8x 8.1x 13.2x 10.8x 3.6x 76.8%
Jacobs $76.50 98.2% $10,856 $12,464 11.0x 9.5x 16.5x 14.2x 1.3x 18.8%
Acciona €78.06 99.6% $5,192 $11,270 7.9x 7.8x 17.4x 16.6x 4.2x 67.2%
Skanska kr174.55 90.8% $7,854 $9,017 11.5x 10.1x 15.1x 13.4x 1.2x 15.2%
AECOM $32.66 81.9% $5,251 $8,512 9.6x 8.7x 11.8x 10.5x 3.5x 45.6%
Fluor $58.10 93.6% $8,170 $8,184 10.8x 8.3x 25.2x 16.5x NM 20.2%
Quanta $33.38 83.2% $4,967 $5,722 6.7x 5.8x 12.2x 10.5x 0.9x 15.0%
MasTec $44.65 80.4% $3,584 $5,180 7.3x 6.7x 12.2x 10.6x 2.3x 31.2%
EMCOR $75.11 88.3% $4,370 $4,365 9.1x 8.5x 15.9x 14.9x NM 6.9%
Stantec C$32.13 86.5% $2,832 $3,382 11.2x 9.8x 18.0x 14.7x 1.8x 21.3%
Dycom Industries $84.60 68.2% $2,643 $3,376 10.0x 7.9x 29.2x 18.6x 2.2x 22.5%
Strabag €34.00 91.9% $4,344 $3,055 3.0x 2.9x 11.3x 10.9x NM 49.2%
Balfour Beatty £2.74 86.0% $2,465 $2,618 9.9x 8.4x 14.7x 12.1x 0.4x 51.5%
Granite Construction $45.70 66.6% $2,088 $2,154 8.5x 5.5x 20.6x 10.5x NM 60.1%
Bilfinger €43.48 92.9% $2,233 $2,141 14.7x 8.5x 42.7x 19.5x NM 27.7%
Primoris $24.82 83.0% $1,279 $1,536 7.9x 6.1x 16.5x 11.8x 1.3x 27.4%
Team $22.50 88.0% $675 $1,051 12.8x 9.5x NM NM 4.6x 37.2%
Mistras Group $21.67 90.9% $615 $763 9.7x 9.0x 27.6x 22.4x 1.9x 21.7%
Trevi-Finanziaria Industriale €0.30 38.5% $58 $722 10.2x 8.2x NM NM 9.2x 116.5%
Mean 9.5x 7.8x 18.8x 14.0x 2.2x 34.2%
Median 9.6x 8.4x 16.5x 13.4x 1.9x 27.5%
Oil & Gas Services
Liberty Oilfield Services $21.57 90.3% $2,549 $2,888 6.0x 6.3x 9.1x 11.6x 0.0x 3.7%
Select Energy Services $11.84 53.9% $1,263 $1,641 6.5x 5.4x 11.8x 9.9x 0.3x 5.0%
Keane Group $12.37 62.4% $1,356 $1,597 4.1x 4.4x 14.3x 18.8x 0.6x 22.0%
Pro Petro $16.49 72.1% $1,378 $1,456 4.2x 4.2x 7.6x 8.4x 0.2x 7.3%
Secure Energy C$8.46 86.2% $1,060 $1,325 9.3x 7.8x NM 31.0x 1.9x 20.1%
Mean 6.0x 5.6x 10.7x 15.9x 0.6x 11.6%
Median 6.0x 5.4x 10.4x 11.6x 0.3x 7.3%
EV as a Multiple of

Greentech / 9Source: FactSet, SEC filings and third party providers. Values in U.S. Dollars. Share prices shown in local currencies.
(1) Enterprise Value = Market Value of Equity + Debt + Preferred Equity + Minority Interest - Investments in Affiliates - Cash and Marketable Securities.
(2) 2018 and 2019 EBITDA Multiples exclude multiples over 35x.
(3) 2018 and 2019 Price/Earnings Multiples exclude multiples over 50x.
Comparable Companies Trading Analysis
Energy Technology
Price as a % Market Enterprise Net Debt/
Price as of of 52 Wk Value Value (1)
EBITDA (2)
Price/ Earnings (3)
2018E Debt/
Company 9/28/2018 High ($mm) ($mm) 2018E 2019E 2018E 2019E EBITDA EV
Energy Technology
Smart Grid Solutions
AMETEK $79.12 96.6% $18,348 $19,936 16.0x 15.0x 24.7x 22.5x 1.3x 10.8%
Terna €4.60 86.2% $10,742 $19,808 10.5x 10.0x 13.4x 12.7x 4.8x 51.8%
Keysight $66.28 94.1% $12,423 $13,471 15.4x 13.3x 20.6x 17.9x 1.2x 13.3%
Itron $64.20 80.3% $2,523 $3,501 13.8x 9.6x 22.8x 15.1x 3.8x 32.0%
Landis+Gyr CHF65.55 80.6% $1,980 $2,019 9.5x 9.0x 17.6x 13.6x 0.2x 6.9%
ESCO Technologies $68.05 96.9% $1,763 $1,982 14.1x NM 24.4x NM 1.6x 13.2%
S&T €25.22 89.9% $1,858 $1,847 18.2x 15.3x 34.2x 25.3x NM 5.9%
Smart Metering Systems £6.16 68.4% $903 $1,038 15.6x 11.8x 33.1x 23.7x 2.0x 18.9%
Utilitywise £0.23 31.6% $23 $43 NM NM 5.3x NM NA 83.2%
Mean 14.1x 12.0x 21.8x 18.7x 2.1x 26.2%
Median 14.7x 11.8x 22.8x 17.9x 1.6x 13.3%
Energy Storage
Tesla $264.77 68.3% $45,168 $57,558 NM 17.7x NM NM 6.8x 23.3%
BYD Co. HK$56.20 67.1% $19,510 $32,535 14.4x 12.4x 37.1x 28.2x 5.4x 42.2%
Panasonic ¥1,324 73.5% $28,583 $30,641 4.8x 4.5x 12.3x 11.1x 0.3x 37.0%
Samsung SDI ₩258,500 98.1% $16,171 $16,340 15.3x 11.9x 23.5x 16.2x 0.5x 10.8%
EnerSys $87.13 99.7% $3,670 $3,772 10.7x 9.8x 17.4x 15.7x 0.3x 16.2%
Ballard C$5.54 73.2% $766 $737 NM NM NM NM 8.7x NM
Plug Power $1.92 59.8% $412 $546 NM NM NM NM NM 29.6%
FuelCell Energy $1.07 43.0% $100 $222 NM NM NM NM NM 79.3%
Maxwell Technologies $3.49 55.7% $156 $176 NM NM NM NM NM 23.4%
Ultralife $8.15 74.4% $130 $109 NM NM NM NM NA NM
Hydrogenics C$9.44 62.5% $113 $109 NM NM NM NM 1.2x 10.0%
Mean 11.3x 11.3x 22.6x 17.8x 3.3x 30.2%
Median 12.6x 11.9x 20.5x 16.0x 1.2x 23.4%
LED Lighting
Hubbell $133.57 89.6% $7,316 $9,116 12.1x 11.2x 18.3x 16.7x 2.4x 21.8%
Acuity Brands $157.20 84.1% $6,316 $6,580 11.5x 11.0x 17.4x 15.5x 0.5x 5.4%
Universal Display Corporation $117.90 56.4% $5,552 $5,095 NM 23.8x NM 33.5x NM NM
Cree $37.87 73.1% $3,855 $3,765 22.5x 14.1x NM 42.0x NM 7.8%
OSRAM €34.26 43.1% $4,166 $3,752 5.6x 4.9x 15.0x 13.4x NM 5.9%
Fagerhult kr81.00 67.6% $1,053 $1,327 13.4x 12.1x 18.5x 16.5x 2.9x 26.8%
Epistar NT$34.70 51.6% $1,237 $1,172 6.1x 5.5x 35.6x 31.6x NM 7.8%
Zumtobel €8.21 50.4% $415 $597 7.0x 6.1x NM 21.1x 2.1x 46.3%
Veeco $10.25 45.9% $500 $519 NM 8.4x 18.1x 10.4x NM 54.2%
Dialight £4.76 57.3% $202 $193 10.6x 7.1x 22.8x 13.1x NM NM
Beghelli €0.30 66.1% $70 $151 NM NM NM NM NA 73.4%
Revolution Lighting $2.84 42.8% $64 $126 14.3x 8.5x NM 12.9x 7.1x 49.7%
Energy Focus $2.05 59.2% $25 $16 NM NM NM NM 1.2x NM
Mean 11.5x 10.3x 20.8x 20.6x 2.7x 29.9%
Median 11.5x 8.5x 18.3x 16.5x 2.3x 24.3%
EV as a Multiple of

Greentech / 10Source: FactSet, SEC filings and third party providers. Values in U.S. Dollars. Share prices shown in local currencies.
(1) Enterprise Value = Market Value of Equity + Debt + Preferred Equity + Minority Interest - Investments in Affiliates - Cash and Marketable Securities.
(2) 2018 and 2019 EBITDA Multiples exclude multiples over 35x.
(3) 2018 and 2019 Price/Earnings Multiples exclude multiples over 50x.
Comparable Companies Trading Analysis
Advanced Mobility (1/2)
Price as a % Market Enterprise Net Debt/
Price as of of 52 Wk Value Value (1)
EBITDA (2)
Price/ Earnings (3)
2018E Debt/
Company 9/28/2018 High ($mm) ($mm) 2018E 2019E 2018E 2019E EBITDA EV
Advanced Mobility
Automotive Companies
Toyota Motor ¥7,095 90.9% $203,821 $320,415 9.8x 9.4x 8.9x 8.7x 4.0x 57.0%
Volkswagen €150.10 78.3% $87,756 $256,615 6.4x 5.9x 5.9x 5.2x 4.2x 82.8%
Daimler €54.35 71.1% $67,536 $200,569 9.5x 9.0x 6.4x 6.1x 6.2x 79.4%
BMW €77.71 79.7% $58,709 $163,337 10.4x 9.6x 7.4x 7.1x 6.6x 69.4%
Ford Motor Company $9.25 68.6% $36,869 $153,363 13.0x 12.3x 6.8x 6.7x 9.9x 99.7%
General Motors Company $33.67 72.0% $47,505 $124,055 8.6x 8.1x 5.7x 5.7x 5.1x 79.2%
Honda Motor ¥3,439 82.8% $54,844 $98,515 8.3x 8.0x 7.8x 8.2x 3.6x 62.7%
Nissan Motor ¥1,064 88.8% $39,519 $97,701 10.0x 9.4x 7.1x 7.3x 6.0x 70.5%
Hyundai ₩129,500 77.3% $29,617 $76,100 11.3x 10.2x 9.3x 7.4x 6.1x 86.4%
SAIC Motor ¥33.28 88.4% $56,510 $69,506 12.2x 10.8x 10.2x 9.4x 1.1x 35.3%
Renault €74.50 73.9% $25,589 $69,186 9.0x 8.6x 4.9x 4.6x 5.6x 90.6%
Tesla $264.77 68.3% $45,168 $57,558 NM 17.7x NM NM 6.8x 23.3%
Fiat Chrysler Automobiles €15.14 75.0% $27,090 $37,404 2.4x 2.3x 4.9x 4.2x 0.2x 50.8%
BYD Co. HK$56.20 67.1% $19,510 $32,535 14.4x 12.4x 37.1x 28.2x 5.4x 42.2%
Suzuki Motor ¥6,508 84.7% $28,135 $27,884 5.6x 5.2x 11.9x 11.1x NM 18.5%
Peugeot €23.23 91.5% $24,414 $19,102 2.1x 2.0x 7.0x 6.2x NM 46.3%
Geely Auto HK$15.60 52.3% $17,900 $16,013 6.1x 5.2x 8.8x 7.1x NM 3.1%
Subaru ¥3,480 84.6% $23,566 $15,763 3.8x 3.6x 10.5x 9.2x NM 3.2%
Tata Motors ₹223.45 47.9% $9,717 $15,681 3.0x 2.6x 9.3x 7.4x 1.0x 78.3%
KIA ₩35,100 97.6% $12,827 $10,155 3.3x 2.9x 8.2x 6.6x NM 64.1%
Dongfeng Motor Group HK$8.06 70.3% $8,875 $10,108 30.4x 29.8x 4.2x 4.1x 0.6x 62.7%
NIO $6.98 50.6% $5,371 $9,950 NM NM NM NM NA 42.4%
Mitsubishi Motors ¥802.00 85.1% $10,523 $8,591 5.6x 4.7x 10.6x 9.7x NM 22.5%
GAC Motor HK$8.67 55.0% $14,861 $7,701 7.7x 7.0x 6.2x 5.6x NM 33.2%
Mazda Motor ¥1,364 76.5% $7,587 $7,034 3.9x 3.7x 9.8x 9.1x NM 70.1%
Mean 8.6x 8.3x 9.1x 8.0x 4.5x 54.9%
Median 8.3x 8.1x 7.8x 7.1x 5.3x 62.7%
Truck Companies
Daimler €54.35 71.1% $67,536 $200,569 9.5x 9.0x 6.4x 6.1x 6.2x 79.4%
Volvo kr157.10 91.7% $37,599 $47,394 7.9x 7.5x 11.7x 11.5x 1.9x 32.1%
PACCAR $68.19 85.6% $23,904 $29,571 10.3x 10.3x 11.2x 11.1x 2.0x 31.1%
MAN SE €93.65 95.7% $15,992 $19,430 15.5x 13.2x 24.8x 30.8x 2.6x 20.9%
Isuzu ¥1,791 89.4% $13,378 $13,077 6.1x 5.6x 11.9x 10.8x NM 18.5%
Navistar $38.50 80.7% $3,806 $8,148 9.8x 9.0x 11.6x 10.4x 5.2x 68.7%
Mean 9.8x 9.1x 12.9x 13.4x 3.6x 41.8%
Median 9.7x 9.0x 11.6x 10.9x 2.6x 31.6%
Tier 1 Suppliers
Denso ¥5,999 83.1% $41,939 $40,937 6.7x 6.3x 14.8x 13.9x NM 12.8%
Continental €149.95 58.3% $34,834 $38,720 5.2x 4.7x 10.3x 9.3x 0.5x 15.5%
Bridgestone ¥4,293 76.6% $28,783 $27,597 5.0x 4.8x 10.6x 10.6x NM 13.9%
Michelin €102.95 78.7% $21,402 $26,263 5.4x 4.9x 10.2x 9.0x 1.0x 22.9%
Magna C$67.85 77.9% $17,848 $22,030 5.1x 5.0x 7.6x 7.0x 0.9x 20.1%
Valeo €37.40 56.3% $10,437 $13,920 4.7x 4.2x 9.6x 8.5x 0.9x 41.7%
Goodyear $23.39 64.8% $5,544 $11,048 5.3x 4.9x 8.0x 6.6x 2.5x 57.5%
BorgWarner $42.78 73.5% $8,935 $10,840 6.1x 5.8x 9.7x 9.0x 1.0x 20.0%
Lear $145.00 70.3% $9,499 $10,401 4.5x 4.4x 7.6x 7.1x 0.3x 18.8%
Autoliv $86.68 75.1% $7,553 $9,341 6.8x 6.2x 10.9x 9.7x 1.3x 24.4%
Faurecia €51.84 67.3% $8,311 $9,225 3.8x 3.5x 9.6x 8.4x 0.2x 24.0%
Delphi $31.36 51.9% $2,784 $4,096 5.0x 4.8x 6.5x 6.1x 1.4x 37.3%
Visteon $92.90 66.1% $2,728 $2,678 7.5x 7.0x 14.3x 12.7x NM 14.1%
Automation Tooling Systems C$24.02 98.6% $1,747 $1,746 14.6x 12.8x 27.0x 22.9x NM 14.4%
Stoneridge $29.72 78.9% $847 $903 8.3x 7.6x 14.5x 13.2x 0.5x 12.7%
Mean 6.3x 5.8x 11.4x 10.3x 1.0x 23.3%
Median 5.3x 4.9x 10.2x 9.0x 0.9x 20.0%
Autonomous Driving Chip Makers
Intel $47.29 82.1% $218,054 $234,625 7.7x 7.7x 11.4x 11.2x 0.5x 12.3%
NVIDIA $281.02 98.5% $170,860 $164,918 32.0x 27.7x 39.8x 35.8x NM 1.2%
Qualcomm $72.03 94.2% $105,821 $92,392 14.0x 11.5x 18.8x 15.3x NM 24.3%
Advanced Micro Devices $30.89 90.5% $30,114 $30,519 NM 31.2x NM 46.4x 0.5x 4.6%
Renesas $3.13 46.5% $10,552 $11,086 6.3x 5.9x 17.7x 13.8x 0.4x 18.9%
Mean 15.0x 16.8x 21.9x 24.5x 0.5x 12.2%
Median 10.9x 11.5x 18.2x 15.3x 0.5x 12.3%
EV as a Multiple of
Greentech / 11Source: FactSet, SEC filings and third party providers. Values in U.S. Dollars. Share prices shown in local currencies.
(1) Enterprise Value = Market Value of Equity + Debt + Preferred Equity + Minority Interest - Investments in Affiliates - Cash and Marketable Securities.
(2) 2018 and 2019 EBITDA Multiples exclude multiples over 35x.
(3) 2018 and 2019 Price/Earnings Multiples exclude multiples over 50x.
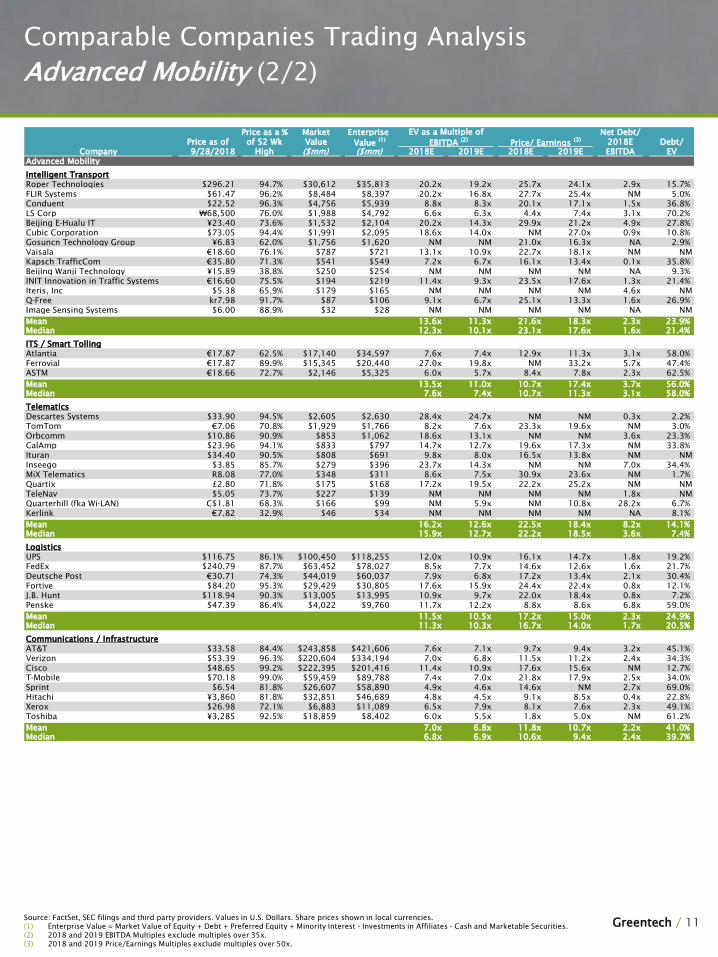
Comparable Companies Trading Analysis
Advanced Mobility (2/2)
Price as a % Market Enterprise Net Debt/
Price as of of 52 Wk Value Value (1)
EBITDA (2)
Price/ Earnings (3)
2018E Debt/
Company 9/28/2018 High ($mm) ($mm) 2018E 2019E 2018E 2019E EBITDA EV
Advanced Mobility
Intelligent Transport
Roper Technologies $296.21 94.7% $30,612 $35,813 20.2x 19.2x 25.7x 24.1x 2.9x 15.7%
FLIR Systems $61.47 96.2% $8,484 $8,397 20.2x 16.8x 27.7x 25.4x NM 5.0%
Conduent $22.52 96.3% $4,756 $5,939 8.8x 8.3x 20.1x 17.1x 1.5x 36.8%
LS Corp ₩68,500 76.0% $1,988 $4,792 6.6x 6.3x 4.4x 7.4x 3.1x 70.2%
Beijing E-Hualu IT ¥23.40 73.6% $1,532 $2,104 20.2x 14.3x 29.9x 21.2x 4.9x 27.8%
Cubic Corporation $73.05 94.4% $1,991 $2,095 18.6x 14.0x NM 27.0x 0.9x 10.8%
Gosuncn Technology Group ¥6.83 62.0% $1,756 $1,620 NM NM 21.0x 16.3x NA 2.9%
Vaisala €18.60 76.1% $787 $721 13.1x 10.9x 22.7x 18.1x NM NM
Kapsch TrafficCom €35.80 71.3% $541 $549 7.2x 6.7x 16.1x 13.4x 0.1x 35.8%
Beijing Wanji Technology ¥15.89 38.8% $250 $254 NM NM NM NM NA 9.3%
INIT Innovation in Traffic Systems €16.60 75.5% $194 $219 11.4x 9.3x 23.5x 17.6x 1.3x 21.4%
Iteris, Inc $5.38 65.9% $179 $165 NM NM NM NM 4.6x NM
Q-Free kr7.98 91.7% $87 $106 9.1x 6.7x 25.1x 13.3x 1.6x 26.9%
Image Sensing Systems $6.00 88.9% $32 $28 NM NM NM NM NA NM
Mean 13.6x 11.3x 21.6x 18.3x 2.3x 23.9%
Median 12.3x 10.1x 23.1x 17.6x 1.6x 21.4%
ITS / Smart Tolling
Atlantia €17.87 62.5% $17,140 $34,597 7.6x 7.4x 12.9x 11.3x 3.1x 58.0%
Ferrovial €17.87 89.9% $15,345 $20,440 27.0x 19.8x NM 33.2x 5.7x 47.4%
ASTM €18.66 72.7% $2,146 $5,325 6.0x 5.7x 8.4x 7.8x 2.3x 62.5%
Mean 13.5x 11.0x 10.7x 17.4x 3.7x 56.0%
Median 7.6x 7.4x 10.7x 11.3x 3.1x 58.0%
Telematics
Descartes Systems $33.90 94.5% $2,605 $2,630 28.4x 24.7x NM NM 0.3x 2.2%
TomTom €7.06 70.8% $1,929 $1,766 8.2x 7.6x 23.3x 19.6x NM 3.0%
Orbcomm $10.86 90.9% $853 $1,062 18.6x 13.1x NM NM 3.6x 23.3%
CalAmp $23.96 94.1% $833 $797 14.7x 12.7x 19.6x 17.3x NM 33.8%
Ituran $34.40 90.5% $808 $691 9.8x 8.0x 16.5x 13.8x NM NM
Inseego $3.85 85.7% $279 $396 23.7x 14.3x NM NM 7.0x 34.4%
MiX Telematics R8.08 77.0% $348 $311 8.6x 7.5x 30.9x 23.6x NM 1.7%
Quartix £2.80 71.8% $175 $168 17.2x 19.5x 22.2x 25.2x NM NM
TeleNav $5.05 73.7% $227 $139 NM NM NM NM 1.8x NM
Quarterhill (fka Wi-LAN) C$1.81 68.3% $166 $99 NM 5.9x NM 10.8x 28.2x 6.7%
Kerlink €7.82 32.9% $46 $34 NM NM NM NM NA 8.1%
Mean 16.2x 12.6x 22.5x 18.4x 8.2x 14.1%
Median 15.9x 12.7x 22.2x 18.5x 3.6x 7.4%
Logistics
UPS $116.75 86.1% $100,450 $118,255 12.0x 10.9x 16.1x 14.7x 1.8x 19.2%
FedEx $240.79 87.7% $63,452 $78,027 8.5x 7.7x 14.6x 12.6x 1.6x 21.7%
Deutsche Post €30.71 74.3% $44,019 $60,037 7.9x 6.8x 17.2x 13.4x 2.1x 30.4%
Fortive $84.20 95.3% $29,429 $30,805 17.6x 15.9x 24.4x 22.4x 0.8x 12.1%
J.B. Hunt $118.94 90.3% $13,005 $13,995 10.9x 9.7x 22.0x 18.4x 0.8x 7.2%
Penske $47.39 86.4% $4,022 $9,760 11.7x 12.2x 8.8x 8.6x 6.8x 59.0%
Mean 11.5x 10.5x 17.2x 15.0x 2.3x 24.9%
Median 11.3x 10.3x 16.7x 14.0x 1.7x 20.5%
Communications / Infrastructure
AT&T $33.58 84.4% $243,858 $421,606 7.6x 7.1x 9.7x 9.4x 3.2x 45.1%
Verizon $53.39 96.3% $220,604 $334,194 7.0x 6.8x 11.5x 11.2x 2.4x 34.3%
Cisco $48.65 99.2% $222,395 $201,416 11.4x 10.9x 17.6x 15.6x NM 12.7%
T-Mobile $70.18 99.0% $59,459 $89,788 7.4x 7.0x 21.8x 17.9x 2.5x 34.0%
Sprint $6.54 81.8% $26,607 $58,890 4.9x 4.6x 14.6x NM 2.7x 69.0%
Hitachi ¥3,860 81.8% $32,851 $46,689 4.8x 4.5x 9.1x 8.5x 0.4x 22.8%
Xerox $26.98 72.1% $6,883 $11,089 6.5x 7.9x 8.1x 7.6x 2.3x 49.1%
Toshiba ¥3,285 92.5% $18,859 $8,402 6.0x 5.5x 1.8x 5.0x NM 61.2%
Mean 7.0x 6.8x 11.8x 10.7x 2.2x 41.0%
Median 6.8x 6.9x 10.6x 9.4x 2.4x 39.7%
EV as a Multiple of

Greentech / 12
Comparable Companies Trading Analysis
Renewables
Source: FactSet, SEC filings and third party providers. Values in U.S. Dollars. Share prices shown in local currencies.
(1) Enterprise Value = Market Value of Equity + Debt + Preferred Equity + Minority Interest - Investments in Affiliates - Cash and Marketable Securities.
(2) 2018 and 2019 EBITDA Multiples exclude multiples over 35x.
(3) 2018 and 2019 Price/Earnings Multiples exclude multiples over 50x.
(4) Formerly known as Greentech Energy Systems.
Price as a % Market Enterprise Net Debt/
Price as of of 52 Wk Value Value (1)
EBITDA (2)
Price/ Earnings (3)
2018E Debt/
Company 9/28/2018 High ($mm) ($mm) 2018E 2019E 2018E 2019E EBITDA EV
Renewables
Integrated PV and PV Manufacturing
Hanwha ₩32,800 67.3% $2,895 $22,837 8.1x 7.9x 4.2x 4.3x 3.4x 60.8%
LONGi Green Energy Technology ¥14.20 46.3% $5,761 $6,817 11.9x 9.4x 14.7x 12.5x 1.8x 30.0%
TBEA Solar ¥7.17 62.7% $3,871 $6,816 10.5x 9.4x 11.5x 10.1x 3.5x 77.4%
GCL ¥4.95 92.0% $3,642 $4,363 29.3x 21.3x NM 35.2x 4.9x 30.0%
SunPower $7.30 73.0% $1,029 $2,685 22.1x 12.7x NM NM 12.7x 68.5%
First Solar $48.42 59.3% $5,075 $2,386 7.6x 3.9x 30.9x 15.6x NM 19.1%
Canadian Solar $14.50 76.0% $849 $2,236 6.6x 7.1x 9.5x 10.2x 4.0x 105.1%
Yingli Green Energy $0.26 9.2% $5 $1,832 NM NM NM NM NA 97.8%
Sungrow ¥6.91 30.5% $1,458 $1,747 9.7x 7.5x 9.9x 8.3x 1.7x 34.0%
Foxconn NT$74.50 77.1% $3,451 $1,694 4.2x 3.8x 10.3x 9.5x NM 54.2%
Jinko Solar $10.77 36.7% $421 $1,624 7.7x 8.8x 10.1x 17.6x 5.5x 132.7%
SolarEdge Technologies $37.65 53.2% $1,713 $1,362 7.1x 7.1x 13.2x 11.9x NM NM
Mersen €30.25 72.2% $725 $994 6.7x 6.2x 11.3x 10.3x 1.7x 29.5%
Enphase $4.85 63.8% $470 $469 29.9x 11.6x 49.5x 17.2x NM 11.1%
Daqo New Energy $26.11 36.0% $283 $383 3.0x 2.8x 5.8x 6.0x 0.3x 58.2%
SMA €20.18 32.0% $813 $359 13.2x 4.6x NM 41.3x NM 7.0%
Manz €36.45 89.2% $328 $343 21.7x 10.4x NM 20.5x 0.6x 18.0%
ReneSola $2.02 53.4% $77 $248 9.5x 22.7x 9.6x 20.2x 5.3x 66.7%
Mean 12.3x 9.2x 14.6x 15.7x 3.8x 53.0%
Median 9.5x 7.9x 10.3x 12.2x 3.4x 54.2%
Solar Development
BayWa €28.70 84.3% $1,170 $4,485 12.4x 11.2x 18.2x 13.5x 8.2x 74.2%
Sunrun $12.44 75.6% $1,380 $3,306 NM NM 16.7x 12.1x NM 53.8%
Vivint Solar $5.20 84.6% $617 $1,735 NM 21.5x NM NM 33.2x 65.1%
Scatec Solar kr60.20 90.8% $838 $1,441 12.1x 6.9x NM 35.8x 4.6x 59.7%
Etrion C$0.28 88.9% $72 $224 26.1x 20.2x NM NM 17.5x 97.6%
Mean 16.8x 14.9x 17.5x 20.5x 15.9x 70.1%
Median 12.4x 15.7x 17.5x 13.5x 12.8x 65.1%
Wind Development
Energiekontor €15.25 95.3% $258 $461 8.7x 5.9x 34.7x 11.7x 3.6x 59.0%
PNE Wind €2.78 86.1% $247 $266 8.9x 4.5x 23.5x 9.0x 1.0x 61.5%
Arise kr19.10 97.4% $72 $183 12.3x 10.4x NM NM 7.5x 64.1%
ABO Wind €13.50 92.5% $120 $129 3.7x 3.4x 9.1x 8.7x 0.3x 47.5%
Mean 8.4x 6.0x 22.4x 9.8x 3.1x 58.0%
Median 8.8x 5.2x 23.5x 9.0x 2.3x 60.3%
IPPs
Enel €4.41 79.0% $52,100 $122,028 6.5x 6.2x 11.0x 9.8x 2.7x 52.8%
Iberdrola €6.34 90.6% $47,097 $94,194 8.9x 8.4x 13.5x 12.7x 3.8x 48.6%
ENGIE €12.67 83.5% $35,824 $55,022 5.1x 4.9x 12.9x 11.6x 1.3x 76.6%
Innogy €38.49 90.2% $24,837 $45,305 9.4x 9.4x 19.1x 18.6x 3.8x 49.3%
EDP €3.18 89.5% $13,497 $35,578 9.0x 8.5x 14.9x 13.5x 4.5x 55.3%
AES $14.00 99.2% $9,264 $29,691 7.9x 7.7x 11.6x 10.7x 4.6x 68.9%
NRG $37.40 99.9% $11,348 $27,510 8.9x 13.0x 10.2x 11.2x 4.4x 57.3%
Northland Power C$21.70 85.7% $2,969 $8,836 12.8x 11.8x 15.1x 13.1x 7.7x 68.7%
ERG €17.54 84.3% $3,062 $4,829 8.3x 8.3x 21.5x 21.7x 3.1x 53.1%
Boralex C$18.03 72.0% $1,243 $3,605 11.8x 9.6x NM 33.2x 7.6x 69.2%
Scatec Solar kr60.20 90.8% $838 $1,441 12.1x 6.9x NM 35.8x 4.6x 59.7%
Falck Renewables €1.86 73.4% $630 $1,372 7.3x 7.1x 20.7x 20.1x 3.7x 69.0%
Atlantic Power C$2.78 84.5% $239 $1,122 6.2x 6.3x NM NM 3.7x 86.7%
Voltalia €9.68 83.8% $550 $1,027 13.3x 9.0x NM NM 5.2x 48.1%
Alerion Clean Power €2.97 82.5% $177 $390 NM NM NM NM NA 107.8%
Athena Investments kr7.80 80.7% $130 $252 NM NM NM NM NA 78.3%
Mean 9.1x 8.4x 15.1x 17.7x 4.3x 65.6%
Median 8.9x 8.3x 14.2x 13.3x 4.1x 64.2%
Wind and Other
Vestas kr434.40 74.9% $13,917 $11,419 6.7x 6.7x 15.4x 14.9x NM 5.1%
Xinjiang Goldwind HK$8.41 53.2% $5,771 $9,850 12.2x 10.6x 7.4x 6.6x 4.9x 46.6%
Siemens Gamesa Renewable €10.90 75.0% $8,624 $8,669 7.0x 6.1x 15.5x 12.5x 0.1x 21.7%
Ormat $54.11 76.6% $2,740 $3,919 10.6x 9.9x 23.7x 23.7x 2.8x 30.4%
China High Speed Transmissions HK$9.00 65.1% $1,881 $2,811 NM NM NM NM NA 73.1%
Suzlon ₹5.49 31.7% $403 $1,979 14.1x 8.6x NM 17.0x 11.2x 83.6%
Bonheur ASA kr103.00 83.9% $538 $1,458 NM NM NM NM NA 118.9%
Nordex €9.27 79.2% $1,044 $1,237 9.5x 6.7x NM NM 1.5x 61.1%
Sinovel ¥1.12 59.6% $982 $1,118 NM NM NM NM NA 20.1%
TPI Composites $28.55 88.6% $982 $994 14.1x 6.7x NM 15.3x 0.2x 13.1%
Senvion €6.05 47.8% $514 $814 6.7x 4.5x NM 11.6x 2.5x 56.8%
Sif Holding €16.00 82.1% $474 $536 14.2x 6.1x 31.2x 8.7x 1.6x 11.6%
Mean 10.6x 7.3x 18.6x 13.8x 3.1x 45.2%
Median 10.6x 6.7x 15.5x 13.7x 2.1x 38.5%
EV as a Multiple of
(4)

Greentech / 13
Source: FactSet, SEC filings and third party providers. Values in U.S. Dollars. Share prices shown in local currencies.
(1) Enterprise Value = Market Value of Equity + Debt + Preferred Equity + Minority Interest - Investments in Affiliates - Cash and Marketable Securities.
(2) 2018 and 2019 EBITDA Multiples exclude multiples over 35x.
(3) 2018 and 2019 Price/Earnings Multiples exclude multiples over 50x.
(4) Acquisition by Global Infrastructure Partners announced on February 7, 2018 and is expected to close in H2 2018.
Comparable Companies Trading Analysis
Yield Vehicles
Price as a % Market Enterprise
Price as of of 52 Wk Value Value (1)
EBITDA (2)
Price/ Earnings (3)
Current Debt/
Company 9/28/2018 High ($mm) ($mm) 2018E 2019E 2018E 2019E Yield EV
Yield Vehicles
North American Yield Vehicles
Brookfield Renewables C$39.14 86.1% $9,391 $30,341 14.4x 13.6x 46.6x 29.1x 6.5% 39.2%
NextEra Energy Partners $48.50 95.7% $7,550 $12,564 13.0x 11.2x 16.9x 26.1x 3.4% 32.8%
NRG Yield $19.04 92.1% $3,693 $9,738 9.9x 9.1x 18.1x 14.6x 6.4% 60.5%
Atlantica Yield $20.58 79.2% $2,061 $7,178 8.9x 8.2x 28.9x 22.3x 6.1% 81.6%
Innergex C$12.98 85.9% $1,334 $4,437 13.4x 11.5x NM 42.7x 5.2% 69.1%
TransAlta Renewables C$11.50 79.8% $2,334 $3,135 9.6x 9.2x 12.6x 12.8x 8.2% 25.2%
Hannon Armstrong $21.47 84.9% $1,160 $2,501 33.8x 31.8x 16.4x 15.7x 6.1% 57.9%
Mean 14.7x 13.5x 23.2x 23.3x 6.0% 52.3%
Median 13.0x 11.2x 17.5x 22.3x 6.1% 57.9%
European Yield Vehicles
Encavis AG €6.01 83.7% $904 $2,587 12.0x 11.2x 16.7x 14.3x 3.7% 69.9%
Greencoat UK Wind £1.28 98.8% $1,891 $2,402 8.1x 7.9x 7.7x 8.1x 5.3% 21.4%
Renewables Infrastructure Group £1.12 99.6% $1,620 $1,610 12.8x 12.8x 10.8x 10.8x 5.8% NM
Aventron CHF9.50 73.4% $425 $912 13.9x 12.5x 34.5x 33.9x 2.4% 56.0%
NextEnergy Solar Fund £1.12 96.5% $844 $741 9.5x 11.3x 15.5x 14.0x 6.0% NA
Bluefield Solar Income £1.21 97.8% $585 $584 26.1x 25.1x 19.2x 38.1x 6.3% NM
John Laing Environmental £1.05 94.5% $538 $531 14.4x 13.0x 15.3x 14.6x 6.2% NM
Foresight Solar £0.90 91.9% $51 $65 NM NM NM NM 6.7% 30.3%
Mean 13.8x 13.4x 17.1x 19.1x 5.3% 44.4%
Median 12.8x 12.5x 15.5x 14.3x 5.9% 43.2%
MLPs
Green Plains $17.20 78.5% $713 $1,842 11.4x 7.1x NM 23.8x 2.8% 70.3%
Enviva $31.80 95.8% $842 $1,124 10.3x 7.8x 46.3x 19.9x 7.9% 38.2%
Mean 10.9x 7.4x 46.3x 21.9x 5.4% 54.3%
Median 10.9x 7.4x 46.3x 21.9x 5.4% 54.3%
EV as a Multiple of
(4)

Greentech / 14
Comparable Companies Trading Analysis
Air & Environmental Services
Source: FactSet, SEC filings and third party providers. Values in U.S. Dollars. Share prices shown in local currencies.
(1) Enterprise Value = Market Value of Equity + Debt + Preferred Equity + Minority Interest - Investments in Affiliates - Cash and Marketable Securities.
(2) 2018 and 2019 EBITDA Multiples exclude multiples over 35x.
(3) 2018 and 2019 Price/Earnings Multiples exclude multiples over 50x.
Price as a % Market Enterprise Net Debt/
Price as of of 52 Wk Value Value (1)
EBITDA (2)
Price/ Earnings (3)
2018E Debt/
Company 9/28/2018 High ($mm) ($mm) 2018E 2019E 2018E 2019E EBITDA EV
Air & Environmental Services
Solid Waste
Waste Management $90.36 97.3% $38,739 $48,490 11.5x 11.0x 22.2x 20.5x 2.3x 20.2%
Republic Services $72.66 95.8% $23,641 $31,836 11.3x 10.6x 23.8x 22.2x 2.9x 25.9%
Waste Connections $79.77 98.0% $20,986 $24,658 15.8x 14.4x 32.0x 28.4x 2.4x 15.5%
Covanta $16.25 90.0% $2,126 $4,516 10.2x 9.9x NM NM 5.4x 54.6%
Advanced Disposal Services $27.08 97.0% $2,399 $4,297 10.0x 9.5x NM NM 4.4x 44.3%
Casella $31.06 91.5% $1,328 $1,830 13.2x 12.1x 45.1x 36.9x 3.6x 27.5%
Biffa £2.52 95.1% $822 $1,225 6.1x 5.9x 13.1x 12.3x 2.0x 38.3%
Mean 11.2x 10.5x 27.2x 24.0x 3.3x 32.3%
Median 11.3x 10.6x 23.8x 22.2x 2.9x 27.5%
Specialty Waste
Stericycle $58.68 76.5% $5,040 $7,661 10.1x 9.5x 13.2x 12.7x 3.4x 34.7%
Clean Harbors $71.58 98.7% $4,015 $5,410 11.3x 10.6x NM 48.7x 2.9x 30.1%
Darling Ingredients $19.32 92.2% $3,181 $4,847 10.7x 10.0x 22.5x 19.5x 3.5x 35.0%
US Ecology $73.75 95.6% $1,621 $1,845 14.7x 13.3x 32.7x 29.0x 1.8x 15.0%
Heritage-Crystal Clean $21.35 84.7% $492 $480 10.2x 8.3x 26.0x 18.4x NM 6.0%
Mean 11.4x 10.4x 23.6x 25.7x 2.9x 24.2%
Median 10.7x 10.0x 24.3x 19.5x 3.2x 30.1%
Pollution Control
Donaldson $58.26 98.0% $7,514 $7,930 16.4x 15.0x 27.0x 23.6x 0.7x 6.8%
CECO $7.88 83.7% $275 $325 11.5x 9.5x 27.6x 17.3x 1.8x 26.5%
Advanced Emissions Solutions $11.96 98.0% $241 $208 NM NM 5.2x 4.0x NA NM
Mean 14.0x 12.3x 20.0x 15.0x 1.2x 16.7%
Median 14.0x 12.3x 27.0x 17.3x 1.2x 16.7%
EV as a Multiple of

Greentech / 15
Comparable Companies Trading Analysis
Water
Source: FactSet, SEC filings and third party providers. Values in U.S. Dollars. Share prices shown in local currencies.
(1) Enterprise Value = Market Value of Equity + Debt + Preferred Equity + Minority Interest - Investments in Affiliates - Cash and Marketable Securities.
(2) 2018 and 2019 EBITDA Multiples exclude multiples over 35x.
(3) 2018 and 2019 Price/Earnings Multiples exclude multiples over 50x.
(4) SJW and Connecticut Water announced a merger of equals on 3/15/2018 which is expected to close in Q4 2018.
Price as a % Market Enterprise Net Debt/
Price as of of 52 Wk Value Value (1)
EBITDA (2)
Price/ Earnings (3)
2018E Debt/
Company 9/28/2018 High ($mm) ($mm) 2018E 2019E 2018E 2019E EBITDA EV
Water
Efficiency / Process
Pentair $43.35 86.3% $7,604 $8,305 14.0x 13.2x 18.8x 17.3x 1.2x 9.4%
Flowserve $54.69 96.2% $7,156 $8,184 16.9x 14.4x 32.3x 25.9x 2.1x 18.6%
Rexnord $30.80 95.9% $3,217 $4,376 10.3x 9.5x 18.9x 16.3x 2.7x 30.6%
Itron $64.20 80.3% $2,523 $3,501 13.8x 9.6x 22.8x 15.1x 3.8x 32.0%
Kemira €11.61 93.3% $2,095 $2,971 8.0x 7.4x 15.4x 13.5x 2.4x 35.3%
Evoqua $17.78 70.1% $2,055 $2,793 11.3x 10.0x 24.0x 19.9x 3.1x 29.4%
Badger Meter $52.95 93.9% $1,542 $1,572 19.1x 17.0x 41.6x 30.6x 0.4x 2.7%
Lindsay $100.24 97.3% $1,078 $1,081 15.4x 15.1x 35.3x 24.4x 0.0x 10.8%
Thermon Group $25.78 92.2% $839 $1,034 13.0x 11.6x 23.2x 19.6x 2.4x 21.5%
AquaVenture Holdings $18.07 96.5% $480 $543 11.0x 10.3x NM NM 1.3x 31.6%
Wabag ₹295.35 45.4% $223 $268 5.9x 5.2x 9.9x 8.4x 0.9x 24.8%
Mean 12.6x 11.2x 24.2x 19.1x 1.8x 22.4%
Median 13.0x 10.3x 23.0x 18.4x 2.1x 24.8%
Infrastructure, Monitoring & Compliance
Ecolab $156.78 98.0% $45,294 $52,498 16.9x 15.6x 29.2x 26.0x 2.3x 13.7%
Xylem $79.87 96.9% $14,346 $16,581 16.7x 14.9x 27.5x 23.4x 2.2x 15.3%
Watts Water $83.00 88.9% $2,833 $3,100 12.8x 12.2x 22.3x 20.4x 1.1x 13.2%
Advanced Drainage System $30.90 92.2% $1,737 $2,436 10.7x 9.8x 27.5x 23.2x 1.6x 27.6%
Mueller Water Products $11.51 88.6% $1,821 $1,936 10.4x 9.3x 20.6x 17.4x 0.6x 23.0%
Select Energy Services $11.84 53.9% $1,263 $1,641 6.5x 5.4x 11.8x 9.9x 0.3x 5.0%
Aegion $25.38 90.0% $820 $1,095 9.4x 8.0x 18.8x 16.0x 2.3x 31.1%
Mean 11.9x 10.7x 22.5x 19.5x 1.5x 18.4%
Median 10.7x 9.8x 22.3x 20.4x 1.6x 15.3%
Heating & Cooling
Lennox $218.40 95.0% $8,792 $10,105 17.1x 14.3x 23.4x 18.4x 2.2x 13.4%
A.O. Smith $53.37 78.0% $9,105 $8,695 13.1x 11.9x 20.5x 18.3x NM 2.9%
Comfort Systems USA $56.40 95.5% $2,101 $2,132 11.8x 10.6x 20.6x 18.4x 0.2x 2.8%
AAON $37.80 87.3% $1,976 $1,951 24.4x 16.8x 42.8x 26.8x NM NM
Mean 16.6x 13.4x 26.8x 20.5x 1.2x 6.3%
Median 15.1x 13.1x 22.0x 18.4x 1.2x 2.9%
Distribution
Veolia $19.97 75.5% $11,293 $24,937 6.5x 6.2x 15.0x 13.3x 3.3x 65.1%
SUEZ €12.24 76.7% $8,834 $24,246 7.9x 7.5x 21.1x 18.0x 4.1x 69.1%
American Water Works $87.97 95.2% $15,878 $24,148 14.3x 13.1x 26.7x 24.7x 4.9x 34.6%
Severn Trent £18.49 83.9% $5,716 $12,910 10.7x 10.2x 14.2x 13.3x 6.0x 56.2%
Aqua America $36.90 93.3% $6,565 $8,812 17.8x 16.6x 26.3x 24.7x 4.5x 26.1%
American States Water $61.14 99.2% $2,246 $2,639 16.2x 15.4x 35.5x 32.3x 2.4x 15.1%
SJW $61.15 88.3% $1,261 $1,742 12.2x 11.9x 29.1x 26.8x 3.4x 28.1%
Connecticut Water Service $69.37 99.4% $836 $1,130 20.5x 18.7x 35.2x 29.3x 5.3x 26.4%
Middlesex Water Company $48.42 98.8% $794 $982 NM NM 26.3x 26.0x NA 19.4%
York Water $30.40 77.9% $393 $485 NM NM NM NM NA 19.0%
Artesian $36.78 85.1% $339 $466 NM NM NM NM NA 27.1%
Mean 13.3x 12.5x 25.5x 23.2x 4.2x 35.1%
Median 13.2x 12.5x 26.3x 24.7x 4.3x 27.1%
EV as a Multiple of
(4)
(4)

Greentech / 16
Price as a % Market Enterprise Net Debt/
Price as of of 52 Wk Value Value (1)
EBITDA (2)
Price/ Earnings (3)
2018E Debt/
Company 9/28/2018 High ($mm) ($mm) 2018E 2019E 2018E 2019E EBITDA EV
AgTech
Large Crop / Life Science
DowDuPont $64.31 83.4% $148,387 $174,507 9.4x 8.5x 15.4x 13.3x 1.3x 19.6%
Bayer €76.51 64.8% $82,873 $137,720 12.0x 9.2x 13.1x 10.3x 4.8x 44.0%
BASF €76.55 77.5% $81,665 $97,325 6.6x 6.3x 11.7x 10.9x 1.0x 24.2%
Bunge Limited $68.71 82.6% $9,624 $16,768 8.6x 8.5x 13.1x 12.3x 3.0x 51.7%
Mosaic $32.48 98.5% $12,520 $16,713 8.8x 7.8x 19.1x 15.3x 2.1x 30.0%
Alico $33.80 97.4% $277 $432 NM NM NM NM NA 40.6%
Mean 9.1x 8.2x 14.5x 12.7x 2.3x 33.2%
Median 9.1x 8.5x 13.8x 12.8x 1.9x 30.0%
Irrigation / Equipment
Deere $150.33 85.8% $48,357 $86,340 17.5x 16.4x 15.2x 12.6x 7.7x 49.1%
CNH Industrial $12.01 76.8% $16,377 $40,133 15.9x 15.2x 16.3x 13.5x 7.6x 60.7%
Kubota ¥1,931 81.5% $20,980 $24,475 10.7x 10.1x 16.2x 15.1x 1.2x 29.8%
Mahindra & Mahindra ₹860.70 86.8% $14,761 $20,104 19.0x 16.5x 21.3x 18.2x 5.7x 38.4%
AGCO $60.79 80.0% $4,810 $6,536 8.3x 7.2x 16.1x 12.8x 2.1x 29.7%
Toro $59.97 88.4% $6,308 $6,376 14.3x 13.1x 21.9x 19.5x 0.1x 4.9%
Valmont $138.50 78.5% $3,104 $3,408 9.6x 8.7x 18.3x 16.1x 0.8x 29.0%
Raven Industries $45.75 91.9% $1,643 $1,577 17.0x 15.6x 28.5x 26.3x NM NM
Lindsay $100.24 97.3% $1,078 $1,081 15.4x 15.1x 35.3x 24.4x 0.0x 10.8%
Jain ₹60.95 40.5% $429 $1,002 6.1x 5.2x 9.7x 6.7x 3.3x 61.3%
Mean 13.4x 12.3x 19.9x 16.5x 3.2x 34.9%
Median 14.9x 14.1x 17.3x 15.6x 2.1x 29.8%
5
Industrial Biotechnology
Neste €71.20 93.0% $21,204 $21,437 11.4x 10.8x 18.2x 17.1x 0.1x 6.2%
Cosan R$32.41 67.0% $3,310 $4,829 4.1x 3.5x 11.9x 9.3x 1.2x 53.3%
Green Plains Renewable Energy $17.20 78.5% $713 $1,842 11.4x 7.1x NM 23.8x 6.3x 70.3%
MGP Ingredients $78.98 79.2% $1,331 $1,369 22.7x 19.3x 38.8x 32.1x 0.6x 3.0%
Renewable Energy Group $28.80 100.0% $1,073 $1,062 8.2x 8.4x 4.2x 16.8x NM 20.3%
Amyris $7.94 86.1% $509 $670 NM 13.5x NM 41.8x 21.7x 26.3%
FutureFuel $18.54 97.7% $811 $520 NM NM NM NM NA NM
REX American Resources $75.55 78.2% $480 $344 NM NM 15.4x 14.3x NA NM
Pacific Ethanol $1.90 31.7% $85 $297 11.1x 4.4x NM 7.4x 7.0x 86.8%
Mean 11.5x 10.4x 18.3x 23.5x 6.0x 29.9%
Median 11.4x 9.6x 15.0x 20.5x 1.2x 23.3%
Building Materials
Multi-Industry
CRH $32.72 83.2% $27,081 $37,108 9.3x 8.3x 14.9x 12.9x 2.3x 31.2%
Saint-Gobain €37.15 72.3% $23,842 $34,841 6.9x 6.4x 11.8x 10.4x 2.1x 38.5%
Masco $36.60 78.8% $11,254 $14,002 9.7x 8.9x 14.6x 12.6x 1.8x 21.2%
Owens Corning $54.27 56.2% $6,019 $9,545 6.9x 6.2x 10.4x 8.7x 2.5x 38.1%
Beacon Roofing Supply $36.19 54.4% $2,465 $5,849 10.7x 8.8x 11.2x 9.0x 5.4x 58.3%
Armstrong World Industries $69.60 94.8% $3,596 $4,301 12.1x 11.0x 18.5x 15.6x 2.0x 19.4%
Simpson Manufacturing $72.46 92.5% $3,357 $3,205 13.6x 11.9x 24.2x 20.1x NM NM
Griffon Corporation $16.15 65.9% $737 $1,809 10.4x 9.0x 19.5x 13.3x 6.2x 62.8%
Gibraltar $45.60 92.9% $1,459 $1,458 11.2x 10.2x 21.9x 19.6x NM 14.4%
Mean 10.1x 9.0x 16.3x 13.6x 3.2x 35.5%
Median 10.4x 8.9x 14.9x 12.9x 2.3x 34.7%
Sustainable Products/Materials
Kingspan €40.16 91.4% $8,403 $9,287 16.2x 14.6x 21.9x 19.5x 1.5x 11.3%
Cabot Corporation $62.72 91.4% $3,861 $4,864 8.4x 7.9x 14.7x 12.8x 1.5x 20.6%
Trex $76.98 84.8% $4,521 $4,526 22.7x 20.1x 32.9x 29.8x 0.0x NM
Quanex $18.20 74.0% $640 $837 8.2x NM 20.4x 17.2x 1.9x 25.1%
DIRTT Environmental Solutions C$6.53 92.0% $427 $390 10.7x 8.6x 36.0x 18.7x NM 2.2%
Aspen Aerogels $4.57 81.9% $109 $106 NM NM NM NM 0.5x 3.5%
Mean 13.2x 12.8x 25.2x 19.6x 1.1x 12.5%
Median 10.7x 11.6x 21.9x 18.7x 1.5x 11.3%
EV as a Multiple of
Source: FactSet, SEC filings and third party providers. Values in U.S. Dollars. Share prices shown in local currencies.
(1) Enterprise Value = Market Value of Equity + Debt + Preferred Equity + Minority Interest - Investments in Affiliates - Cash and Marketable Securities.
(2) 2018 and 2019 EBITDA Multiples exclude multiples over 35x.
(3) 2018 and 2019 Price/Earnings Multiples exclude multiples over 50x.
(4) 2 for 1 stock split on July 19, 2018
Comparable Companies Trading Analysis
AgTech, Industrial Biotechnology and
Building Materials
(4)
Greentech / 17
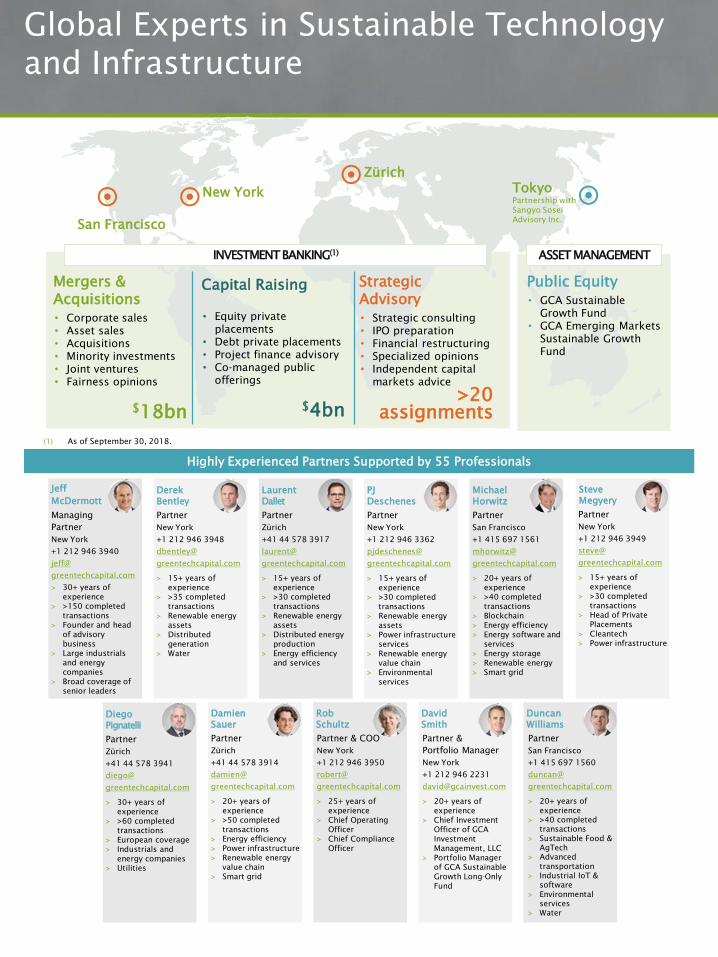
San Francisco
New York
Zürich
Tokyo
Partnership with
Sangyo Sosei
Advisory Inc.
Capital Raising
• Equity private
placements
• Debt private placements
• Project finance advisory
• Co-managed public
offerings
$4bn
INVESTMENT BANKING(1)
ASSET MANAGEMENT
Mergers &
Acquisitions
• Corporate sales
• Asset sales
• Acquisitions
• Minority investments
• Joint ventures
• Fairness opinions
$18bn
Strategic
Advisory
• Strategic consulting
• IPO preparation
• Financial restructuring
• Specialized opinions
• Independent capital
markets advice
>20
assignments
Public Equity
• GCA Sustainable
Growth Fund
• GCA Emerging Markets
Sustainable Growth
Fund
Highly Experienced Partners Supported by 55 Professionals
(1) As of September 30, 2018.
Global Experts in Sustainable Technology
and Infrastructure
Diego
Pignatelli
Partner
Zürich
+41 44 578 3941
diego@
greentechcapital.com
> 30+ years of
experience
> >60 completed
transactions
> European coverage
> Industrials and
energy companies
> Utilities
Laurent
Dallet
Partner
Zürich
+41 44 578 3917
laurent@
greentechcapital.com
> 15+ years of
experience
> >30 completed
transactions
> Renewable energy
assets
> Distributed energy
production
> Energy efficiency
and services
Jeff
McDermott
Managing
Partner
New York
+1 212 946 3940
jeff@
greentechcapital.com
> 30+ years of
experience
> >150 completed
transactions
> Founder and head
of advisory
business
> Large industrials
and energy
companies
> Broad coverage of
senior leaders
Derek
Bentley
Partner
New York
+1 212 946 3948
dbentley@
greentechcapital.com
> 15+ years of
experience
> >35 completed
transactions
> Renewable energy
assets
> Distributed
generation
> Water
PJ
Deschenes
Partner
New York
+1 212 946 3362
pjdeschenes@
greentechcapital.com
> 15+ years of
experience
> >30 completed
transactions
> Renewable energy
assets
> Power infrastructure
services
> Renewable energy
value chain
> Environmental
services
Steve
Megyery
Partner
New York
+1 212 946 3949
steve@
greentechcapital.com
> 15+ years of
experience
> >30 completed
transactions
> Head of Private
Placements
> Cleantech
> Power infrastructure
Michael
Horwitz
Partner
San Francisco
+1 415 697 1561
mhorwitz@
greentechcapital.com
> 20+ years of
experience
> >40 completed
transactions
> Blockchain
> Energy efficiency
> Energy software and
services
> Energy storage
> Renewable energy
> Smart grid
Damien
Sauer
Partner
Zürich
+41 44 578 3914
damien@
greentechcapital.com
> 20+ years of
experience
> >50 completed
transactions
> Energy efficiency
> Power infrastructure
> Renewable energy
value chain
> Smart grid
Rob
Schultz
Partner & COO
New York
+1 212 946 3950
robert@
greentechcapital.com
> 25+ years of
experience
> Chief Operating
Officer
> Chief Compliance
Officer
David
Smith
Partner &
Portfolio Manager
New York
+1 212 946 2231
> 20+ years of
experience
> Chief Investment
Officer of GCA
Investment
Management, LLC
> Portfolio Manager
of GCA Sustainable
Growth Long-Only
Fund
Duncan
Williams
Partner
San Francisco
+1 415 697 1560
duncan@
greentechcapital.com
> 20+ years of
experience
> >40 completed
transactions
> Sustainable Food &
AgTech
> Advanced
transportation
> Industrial IoT &
software
> Environmental
services
> Water