sustainable use of materials through automotive
TRANSCRIPT

Sustainable use of Materials through Automotive Remanufacturing to boost resource efficiency in the road Transport system (SMART)
JRC Exploratory Research
Project (2018–2020)
Final technical report
S. Bobba, F. Marques dos Santos, T. Maury, P. Tecchio, D. Mehn, F. Weiland, F. Pekar, F. Mathieux, F. Ardente
2021
EUR 30567 EN
This publication is a technical report by the Joint Research Centre (JRC), the European Commission’s science and knowledge
service. It aims to provide evidence-based scientific support to the European policymaking process. The scientific output
expressed does not imply a policy position of the European Commission. Neither the European Commission nor any person
acting on behalf of the Commission is responsible for the use that might be made of this publication. For information on the
methodology and quality underlying the data used in this publication for which the source is neither Eurostat nor other
Commission services, users should contact the referenced source. The designations employed and the presentation of material
on the maps do not imply the expression of any opinion whatsoever on the part of the European Union concerning the legal
status of any country, territory, city or area or of its authorities, or concerning the delimitation of its frontiers or boundaries.
Contact information
Name: Fabrice Mathieux
Email: [email protected]
EU Science Hub
https://ec.europa.eu/jrc
JRC123261
EUR 30567 EN
PDF ISBN 978-92-6-28645-5 ISSN 1831-9424 doi:10.2760/84767
Luxembourg: Publications Office of the European Union, 2021.
© European Union, 2021
The reuse policy of the European Commission is implemented by the Commission Decision 2011/833/EU of 12 December 2011
on the reuse of Commission documents (OJ L 330, 14.12.2011, p. 39). Except otherwise noted, the reuse of this document is
authorised under the Creative Commons Attribution 4.0 International (CC BY 4.0) licence
(https://creativecommons.org/licenses/by/4.0/). This means that reuse is allowed provided appropriate credit is given and any
changes are indicated. For any use or reproduction of photos or other material that is not owned by the EU, permission must be
sought directly from the copyright holders.
All content © European Union, 2021, except: Cover image modified from © Visual Generation – stock.adobe.com
How to cite this report:
Bobba, S., Marques dos Santos, F., Maury, T., Tecchio, P., Mehn, D., Weiland, F., Pekar, F., Mathieux, F. and Ardente, F.,
Sustainable use of Materials through Automotive Remanufacturing to boost resource efficiency in the road Transport system
(SMART), EUR 30567 EN, Publications Office of the European Union, Luxembourg, 2021, ISBN 978-92-76-28645-5,
doi:10.2760/84767, JRC123261.

i
Contents
Acknowledgements ............................................................................................................................. iii
Abstract ................................................................................................................................................ 1
Introduction ......................................................................................................................................... 2
1. Technical background and analysis of key aspects for the SMART project .................................. 4
1.1. Trends in mobility sector ....................................................................... 5
1.2. Remanufacturing in the EU value-chain of vehicles - key aspects for the
SMART project ................................................................................................. 9
1.2.1. Definition of remanufacturing ........................................................... 10
1.2.2. Remanufacturing in the automotive sector – literature review and main
outcomes from visits to the field and consultations with experts ........................ 11
1.2.3. Environmental impacts of remanufacturing: a brief literature survey ..... 16
1.2.4. Main drivers of and barriers to remanufacturing .................................. 17
1.3. Material composition of passenger vehicle: Literature review and primary data
from laboratory testing ................................................................................... 21
1.3.1. International Material Data System (IMDS) ........................................ 22
1.3.2. CRMs in vehicles ............................................................................. 24
1.3.3. Laboratory tests: The analysis of printed circuit board samples............. 27
1.4. Interpretation / final remarks .............................................................. 28
2. Analysis of the environmental performances of the future EU fleet ......................................... 30
2.1. The SMART model .............................................................................. 30
2.2. Common data for the assessment and definition of the assessed system .. 31
2.2.1. Type of vehicles and segments ......................................................... 31
2.2.2. Vehicle performances ...................................................................... 32
2.2.3. Lifetime of vehicles ......................................................................... 33
2.2.4. Focus on components and materials .................................................. 38
2.3. Projection of the EU fleet and ELV generation ........................................ 38
2.4. Environmental impact assessment ....................................................... 41
2.4.1. The value-chain of vehicles in the EU and the MFA model..................... 41
2.4.2. Stocks and flows of the EU fleet ........................................................ 43
2.4.3. Life Cycle Assessment of powertrain models ....................................... 52
2.4.4. MFA and LCA combination to estimate the environmental impacts of the EU
fleet and components ................................................................................... 62
2.4.5. LCA and MFA of specific components: the electric motor case-study ...... 63
2.5. SMART tool – a graphical user interface ................................................ 68
2.6. Interpretation of the results, discussions limitations and research
perspectives .................................................................................................. 69
3. Overall assessment ..................................................................................................................... 71
3.1. Summary of the work ......................................................................... 71
ii
3.2. Further work needed in relation to the SMART assessment framework ...... 74
3.3. Further analyses and policy implications ............................................... 75
3.4. Conclusions ....................................................................................... 76
SMART publications ........................................................................................................................... 77
References ......................................................................................................................................... 78
Abbreviations ..................................................................................................................................... 90
List of figures ...................................................................................................................................... 92
List of tables ....................................................................................................................................... 94
Annexes .............................................................................................................................................. 95
Annex 1. Research support to develop knowledge and capacity in the area of
remanufacturing of components and materials in the automotive sector ................ 95
Annex 2. Visits to remanufacturing and ELV recycling plants ................................ 99
Annex 3. Elemental composition measurements of electronic waste by total reflection
X-ray fluorescence ........................................................................................ 101
Annex 4. Notes for MFA calculations ................................................................ 108
iii
Acknowledgements
This project was developed in the context of Joint Research Centre (JRC) exploratory research call 2017.
We would like to thank the steering committee for the Sustainable use of Materials through Automotive Remanufacturing to boost resource efficiency in the road Transport system (SMART) project: Karin Aschberger (JRC A.5), Peter Eder (JRC B.5), Pierre Gaudillat (JRC B.5), Franco Di Persio (JRC C.1), Andreas Pfrang (JRC C.1), Biagio Ciuffo (JRC C.4), Laura Lonza (CLIMA C.4), Darina Blagoeva (JRC C.7) and Jonathan Gomez Vilchez (JRC C.4).
We thank colleagues from JRC.F.2, in particular Dora Mehn and Gilliland Douglas for their support of the laboratory testing activities.
Among the experts and collaborators, we would like to thank Marcello Colledani, Nicoletta Picone and Elena Mossali (Centro Nazionale di Ricerca - CNR) for their preparation of the sample, and the fruitful discussions and feedback throughout the SMART project. In addition, we thank Mr Fernand Weiland (Automotive Parts Remanufacturers Association, APRA) for the interesting discussions and his support in editing Chapter 1.2 based on his knowledge and experience of the remanufacturing sector.
We also thank all the stakeholders contacted during the SMART project for collaborating with the SMART team in sharing information and supporting/enlarging the network, in particular Rodolfo Koning, Maurice Funcken and Mark Ellis (Nissan), Ralf Dües (Lear), and Francesco Bonino (Fiat Chrysler Automobiles - FCA).
Finally, we thank colleagues from JRC.A.5, especially Karin and Karina, for the support they provided throughout the whole project, and the Exploratory Research Community.
Authors
Bobba, S., Marques dos Santos, F., Maury, T., Tecchio, P., Mehn, D., Weiland, F., Pekar, F, Mathieux, F. and Ardente F.
The authors made the following contributions.
— Silvia Bobba (JRC – European Commission) coordinated the work, developed the material flow analysis and its integration with the Life Cycle Assessment (LCA), and prepared the report.
— Fabio Marques dos Santos (JRC – European Commission) developed the SMART tool and the neural network analysis; he also contributed to the preparation of the report.
— Thibaut Maury (JRC – European Commission) developed the environmental assessment and the LCA in particular; he also contributed to the preparation of the report.
— Paolo Tecchio (JRC – European Commission) led the first part of the SMART project, focusing on data gathering through contact with experts and visits to the field; he also developed the initial analyses.
— Dora Mehn (JRC – European Commission) led the laboratory tests.
— Fernand Weiland (APRA) led the analysis of remanufacturing in the EU automotive sector, providing information, quantitative data and ad hoc advices.
— Ferenc Pekar (JRC – European Commission) helped coordinate the work.
— Fabrice Mathieux (JRC – European Commission) helped coordinate the work and reviewed the report.
— Fulvio Ardente (JRC – European Commission) coordinated the SMART project and reviewed the report.

1
Abstract
Vehicles are listed among the key product value-chains identified in the Circular Economy Action Plan (European Commission, 2020a), one of the main blocks of the Green Deal (European Commission, 2019a). In addition, synergies between sustainable and smart mobility and the circular economy transition will be further addressed in the forthcoming European Sustainable and Smart Mobility Strategy (European Commission, 2020a). Remanufacturing belongs to the strategies boosting resource efficiency and thus circularity of products minimising environmental impacts (Bobba et al., 2020b).
Sustainable use of Materials through Automotive Remanufacturing to boost resource efficiency in the road Transport system (SMART) is a Joint Research Centre (JRC) exploratory research project that investigates the contribution of end-of-life (EoL) practices to decreasing the environmental impacts of the European Union fleet in the future and increasing resource efficiency of vehicles. The main focus is on the potential contribution of remanufacturing vehicles.
Stakeholders involved in the project and available data from literature represent the first step in increasing knowledge of remanufacturing of vehicles in Europe and in identifying knowledge gaps along the value-chain of vehicles. The expertise of different JRC units was brought together to focus simultaneously on several aspects of mobility, e.g. environmental impacts and future developments.
Information and data collected were used to establish the framework for the following environmental assessment, in particular to identify the main processes along the whole value-chain of vehicles in Europe and the links (established or potentially available in the future) between such processes.
Projections of the EU fleet were developed through the adoption of a neural network considering simultaneously several aspects affecting the uptake of new technologies. The environmental assessment, which included both the assessment of the environmental impacts and the estimation of stocks and flows of products/materials, was developed based on the first steps of the project; to this end, the assessment tools adopted were the Life Cycle Assessment and the Material Flow Analysis. Based on past experience, the integration of such tools was expected to provide a wider understanding of the potential impacts of remanufacturing vehicles/components.
A graphical user interface (the SMART tool) was developed to ease the visualisation of the results of the assessment and to provide an overview of the environmental effects of different scenarios according to the users’ interests. In the developed assessment framework, parameters were adopted to make the models flexible and updatable, based on available inputs and research questions.
The developed work confirmed the importance of adopting a life-cycle and multi-dimensional approach, especially addressing sectors/products that are undergoing rapid technological development. The outcomes of the SMART project emphasised that remanufacturing potentially entails environmental benefits, especially concerning recirculation of materials in the EU, but such a resource efficiency strategy should be supported by ad hoc measures, e.g. incentives for the acceptance and the adoption of remanufactured products and a proper regulatory framework. Expertise already developed in Europe in remanufacturing and the design of products (including EoL strategies) is a key aspect emerging from the analysis. Furthermore, important drivers contributing to the development of remanufacturing in the EU automotive sector are designing business models to include remanufacturing and the digitalisation and automation of remanufacturing processes.
The topic is a complicated one for many reasons: actors are dispersed around the world, the products are complex, new markets are emerging and competitiveness is increasing, and technological development is rapid. As a result, the analysis of future mobility needs to consider multiple factors, in some cases acting in synergy, when estimating the future EU fleet and how EoL strategies can quantitatively contribute to improving its resource efficiency. Gathering information from industrial stakeholders, improving quality and detail of input data (e.g. bills of materials, raw material sourcing, collection and EoL treatments) for the environmental analysis, considering consumers’ expectations/behaviour and integrating methodological tools are some of the identified aspects to be further explored in future work.
2
Introduction
Sustainable and smart mobility is a key point in decarbonising the European Union (EU) and developing a clean, resource-efficient and carbon-neutral future. This is confirmed by several policy initiatives, including the European Green Deal (European Commission, 2019a), the ‘Reflection paper: Towards a Sustainable Europe by 2030’ (European Commission, 2019b) and the new Circular Economy Action Plan (CEAP II) for a cleaner and more competitive Europe (European Commission, 2020a). In addition, the transition towards a low-carbon mobility contributes to the United Nations Sustainable Development Goals, for instance Goal 7 – Ensure access to affordable, reliable, sustainable and modern energy for all (European Commission, 2019a). The transition towards a sustainable and smart mobility is clearly related to the reduction in emissions in the use phase, but attention needs to be paid to the whole value-chain of vehicles to further improve the performances of vehicles from a life-cycle perspective; this has been confirmed by the Green Deal, which encourages the adoption of ‘reusable, durable and repairable product’ (European Commission, 2019a), as well as by the CEAP II, in which ‘improving product durability, reusability, upgradability and reparability, addressing the presence of hazardous chemicals in products, and increasing their energy and resource efficiency’ and ‘enabling remanufacturing’ are listed among the aspects to be improved for designing sustainable products (European Commission, 2020a).
The SMART project
In this framework, the Sustainable use of Materials through Automotive Remanufacturing to boost resource efficiency in the road Transport system (SMART) project explores the contribution of end-of-life (EoL) practices to (1) decreasing the environmental impacts of the EU fleet in the future and (2) increasing the resource efficiency of vehicles. The SMART project started at the beginning of 2018 and lasted for 2 years. The expected research outputs are summarised hereafter. The scope of SMART regards passenger cars, which represent the majority of vehicles on EU roads.
Modelling future scenarios to identify the key aspects of more sustainable mobility requires a deep understanding of the value-chain of vehicles in the EU, knowledge of social and economic drivers able to enhance the penetration rate of vehicles with better environmental performance and knowledge of technological aspects of the different processes along the value-chain. In addition, knowledge of materials embedded in vehicles is currently quite poor, with few studies available and much key information not disclosed for confidentiality reasons. Collaboration with key stakeholders was a very important source of such information and aided the development of the above-mentioned model. Also, laboratory tests were used to provide quantitative information on materials embedded in key components for future vehicles (e.g. electronics).
The main research focus of SMART is on remanufacturing, which is defined as an industrial process that consists of prolonging the operational life of products (in this case vehicles and vehicle components), thus supporting the efficient and circular use of materials, which is of key importance, especially to Critical Raw Materials (CRMs) (European Commission, 2020b, 2020c). Despite the main focus on remanufacturing, all the EoL options were investigated and included in the assessment, as they are complementary resource-efficient strategies and potentially synergic to remanufacturing. Recycling is currently the preferred option for end-of-life vehicles (ELVs) sent to dismantling/depollution. Although recycling of ELVs involves mechanical processes that irreversibly destroy used vehicle units, with a loss of materials disposed of as residual shredded fraction, it is a necessary step for any vehicle part at its EoL. Finally, considering a holistic approach, reuse and remanufacturing can extend the lifetime of vehicle parts, maximising material efficiency and delaying recycling and disposal.
To answer the research question, available assessment tools were adopted and integrated to perform the assessment; an interactive interface (the SMART tool) was created to allow end-users to define scenarios and easily visualise the model outputs. In particular, the modelling of the future fleet was developed through the adoption of a neural network; the environmental assessment was performed through the adoption of both a Life Cycle Assessment (LCA) and Material Flow Analysis (MFA) to assess the impacts of vehicles (per type and segment) and the effects of different EoL options on flows of vehicles/components/materials.
The project combined the expertise of two different Joint Research Centre (JRC) units working on materials, environmental impacts and mobility, namely JRC.D.3 and JRC.C.4. JRC.D.3 mainly dealt with formalisation of the value-chain of vehicles in the EU, impact assessment of different type of vehicles and key components and aspects related to resource efficiency. JRC.C.4. mainly dealt with the modelling of the future EU fleet through the adoption of the neural network, elaborating information

3
provided by JRC.D.3 and providing input for a further MFA and LCA. In addition, an interface tool was developed by JRC.C.4. Moreover, JRC.F.2 was also involved in the project, providing expertise on testing materials in vehicles components.
During the project, actors in the different steps of the vehicle value-chain were contacted to gather both qualitative and quantitative information. In fact, few pieces of information in the literature are currently available on remanufacturing; hence experts in remanufacturing in the EU contributed to defining in detail the value-chain of remanufacturing and providing some insight for the quantitative analysis.
The experience gained in the SMART project and the contact made with various stakeholders represent an added value of the project, contributing to the review process of the ELV Directive (EU, 2000), the Strategic Transport Research and Innovation Agenda (STRIA) and the Flagship report on future mobility (Alonso Raposo et al., 2019).
This report summarises the main outcomes of the project. It should be noted that that the developed models are flexible and still used, and are updated when new research questions arise (e.g. different type of materials, new data on EoL practices).
Structure of the report
The report is organised into three main chapters (Figure 1). Chapter 1 reports the main outcomes of the developed literature review, together with relevant information obtained from consulted stakeholders and experts in the field and by carrying out laboratory tests, and complemented by literature data when necessary. In line with the goal of the SMART project, the chapter’s main focus is on mobility trends in the EU and the most relevant factors affecting such trends (Section 1.1), remanufacturing in the EU (Section 1.2), and materials embedded in vehicles (Section 1.3). Chapter 2 illustrates the SMART model developed during the 2-year project, describing how the future fleet was modelled and the developed MFA and LCA. In particular, after the description of the SMART model (Section 2.1), input data used for both projections of the fleet, the MFA and the LCA are reported in Section 2.2. Sections 2.3 and 2.4 report the developed projections of the EU fleet and the environmental assessment through the MFA (Section 2.4.1) and the LCA (Section 2.4.2) at different levels (fleet, vehicle, component and materials); it is highlighted that the outcomes of the EU fleet projects are used as input for the MFA. The MFA and LCA results are combined in Section 2.4.3. Finally, in Section 2.5 the developed graphical user interface is described. Concluding considerations about developed work, lessons learnt and potential next steps of the research are discussed in Chapter 3.
Figure 1: Schematic representation of the report and the links between chapters
Source: Own elaborations.
4
1. Technical background and analysis of key aspects for the SMART project
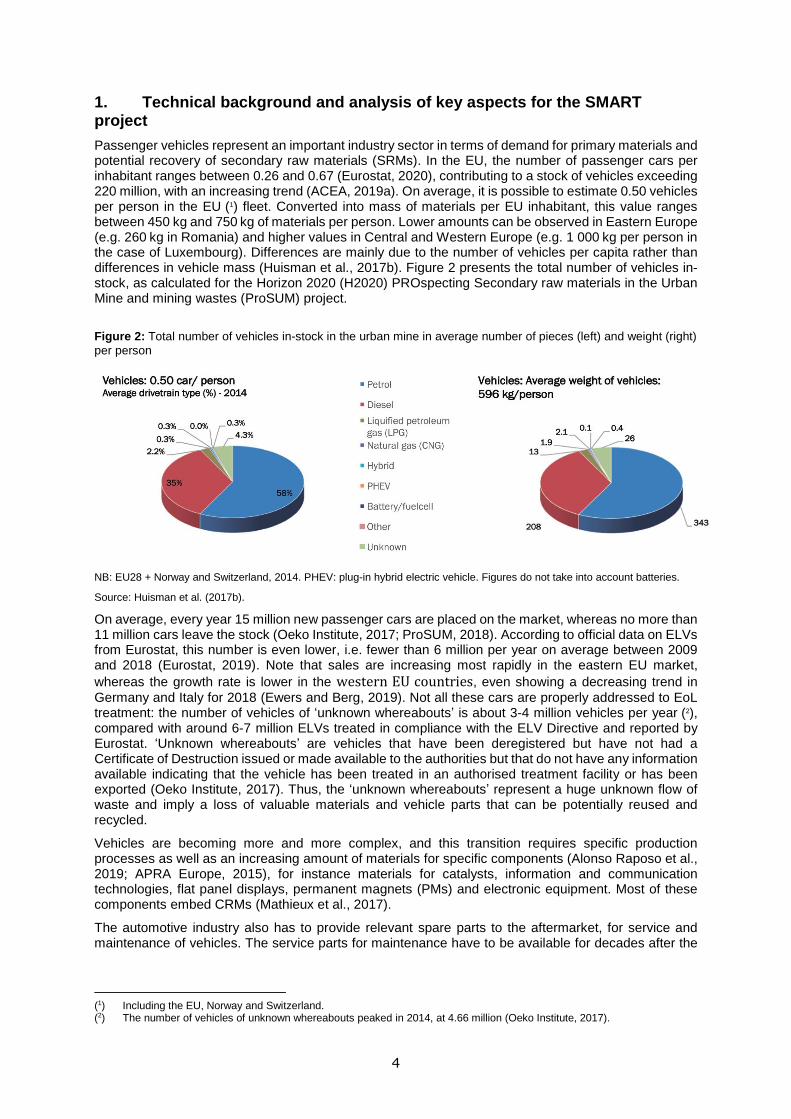
Passenger vehicles represent an important industry sector in terms of demand for primary materials and potential recovery of secondary raw materials (SRMs). In the EU, the number of passenger cars per inhabitant ranges between 0.26 and 0.67 (Eurostat, 2020), contributing to a stock of vehicles exceeding 220 million, with an increasing trend (ACEA, 2019a). On average, it is possible to estimate 0.50 vehicles per person in the EU (1) fleet. Converted into mass of materials per EU inhabitant, this value ranges between 450 kg and 750 kg of materials per person. Lower amounts can be observed in Eastern Europe (e.g. 260 kg in Romania) and higher values in Central and Western Europe (e.g. 1 000 kg per person in the case of Luxembourg). Differences are mainly due to the number of vehicles per capita rather than differences in vehicle mass (Huisman et al., 2017b). Figure 2 presents the total number of vehicles in-stock, as calculated for the Horizon 2020 (H2020) PROspecting Secondary raw materials in the Urban Mine and mining wastes (ProSUM) project.
Figure 2: Total number of vehicles in-stock in the urban mine in average number of pieces (left) and weight (right)
per person
NB: EU28 + Norway and Switzerland, 2014. PHEV: plug-in hybrid electric vehicle. Figures do not take into account batteries.
Source: Huisman et al. (2017b).
On average, every year 15 million new passenger cars are placed on the market, whereas no more than 11 million cars leave the stock (Oeko Institute, 2017; ProSUM, 2018). According to official data on ELVs from Eurostat, this number is even lower, i.e. fewer than 6 million per year on average between 2009 and 2018 (Eurostat, 2019). Note that sales are increasing most rapidly in the eastern EU market,
whereas the growth rate is lower in the western EU countries, even showing a decreasing trend in
Germany and Italy for 2018 (Ewers and Berg, 2019). Not all these cars are properly addressed to EoL treatment: the number of vehicles of ‘unknown whereabouts’ is about 3-4 million vehicles per year (2), compared with around 6-7 million ELVs treated in compliance with the ELV Directive and reported by Eurostat. ‘Unknown whereabouts’ are vehicles that have been deregistered but have not had a Certificate of Destruction issued or made available to the authorities but that do not have any information available indicating that the vehicle has been treated in an authorised treatment facility or has been exported (Oeko Institute, 2017). Thus, the ‘unknown whereabouts’ represent a huge unknown flow of waste and imply a loss of valuable materials and vehicle parts that can be potentially reused and recycled.
Vehicles are becoming more and more complex, and this transition requires specific production processes as well as an increasing amount of materials for specific components (Alonso Raposo et al., 2019; APRA Europe, 2015), for instance materials for catalysts, information and communication technologies, flat panel displays, permanent magnets (PMs) and electronic equipment. Most of these components embed CRMs (Mathieux et al., 2017).
The automotive industry also has to provide relevant spare parts to the aftermarket, for service and maintenance of vehicles. The service parts for maintenance have to be available for decades after the
(1) Including the EU, Norway and Switzerland. (2) The number of vehicles of unknown whereabouts peaked in 2014, at 4.66 million (Oeko Institute, 2017).

5
original parts have been developed and produced. The market demands high-quality spare parts at a reasonable price, even for older vehicles.
Although growth of remanufacturing in the automotive sector has been limited, mainly because of the significant changes in the organisational process and design approaches that are needed (Gerrard and Kandlikar, 2007), remanufacturing is generally recognised as being among the measures that will mitigate the expected increase in materials requirements in the next 50 years (Gerrard and Kandlikar, 2007; Matsumoto, 2020). In the EU, about 20 % of the remanufacturable spare parts in the automotive aftermarket are remanufactured (APRA Europe, 2015; Weiland, 2019). The key parameters for modelling the aftermarket demand are car registration (possibly per country or regional area), average lifetime of spare parts, accident frequency and maintenance intervals (Ewers and Berg, 2019). As an example, between 2007 and 2018, the maintenance work per car in Germany slightly decreased, to an average of about 0.9 events per car and an average cost of EUR 250 per car; of these events, about 0.6 related to wear-and-tear repairs (EUR 170) (3).
According to the Automotive Parts Remanufacturers Association (APRA) Europe, a remanufactured part fulfils a function that is at least equivalent to the function of the original part. It is restored from an existing part (core) using standardised industrial processes in line with specific technical specifications. A remanufactured part is given the same warranty as a new part, and the warranty clearly identifies the part as a remanufactured part and states the remanufacturer (APRA Europe, 2015). Remanufactured components are typically sold in the aftermarket as spare parts. For example, in the automotive industry, of the total gross profit of the car manufacturer, the sale of new cars contributes 18 % and servicing generates 14 % (Colledani et al., 2014). Aligned with the previous considerations, an aspect to be investigated in the study is the possibility of adopting remanufactured components in manufacturing new cars.
In line with the considerations illustrated above, this chapter describes the trends in the mobility sector to allow the modelling of the future EU fleet (Section 1.1). Then, remanufacturing in the automotive sector, with a special focus on the key aspects of the SMART project, are reported in Section 1.2. A special focus on materials related to the evolution of the fleet and available information is needed to better understand the potential of remanufacturing in boosting resource efficiency (Section 1.3). Final remarks of the performed literature review but especially of the stakeholders consulted during the SMART project are summarised in Section 1.4.
1.1. Trends in mobility sector
There are four main factors considered in this study that are related to future mobility and light-duty passenger vehicles: (1) powertrain electrification, (2) Mobility as a Service (MaaS), (3) autonomous driving and (4) connected mobility (Figure 3). The relevance of these topics is also highlighted by various technology groups researched in the H2020 framework programme (Figure 4).
Figure 3: Future mobility scenarios’ dependencies
Sources: Own elaborations and Alonso Raposo et al. (2019) on the right.
(3) As 44 million cars per year are in use in Germany, this means that each year almost 40 million cars experience a
maintenance event, of which more than 26 million are wear-and-tear repairs.

6
Figure 4: H2020 funded projects
Source: Alonso Raposo et al. (2019).
The analysis and the assessment of the potential of each of these features entail a high degree of uncertainty, as the complexity and the number of variables make them quite challenging to predict. In fact, despite although several scenarios are already available in the literature, forecasts of mobility are quite complex to compare because of the different underlying assumptions adopted by the models.
With regard to powertrain electrification, although there is no consensus in the scientific literature on a specific model to adopt in forecasting the uptake of electric vehicles (xEVs), the trend is quite clear: xEVs will rapidly increase and will have a significant share in the EU fleet up to 2050, with a consequential increase in electric powertrains (batteries and electric motors). In addition, new technologies may have an important role in the near future, even though nowadays they are at a very early stage. This is the case, for instance, for fuel cell electric vehicles (FCEVs): significant funding is available nowadays, but their future remains very uncertain (Alonso Raposo et al., 2019; EC, 2020b). It is highlighted that results of xEV forecasts in the EU vary according to the scope of the study, e.g. environmental targets, consumers’ lifestyles and behaviour, electric driving ranges and economic factors (Di Persio et al., 2020). For instance, Witkamp et al. (2017) identified three different scenarios for the uptake of Zero Emission Vehicles (ZEVs) (i.e. battery electric vehicles (BEVs) and FCEVs) and three back-cast scenarios to achieve the target of 100 % ZEVs in the 2050 fleet. The study considers different uptake levels of both BEVs and plug-in hybrid electric vehicles (PHEVs). A recent report of the JRC (EC, 2020b) adopted three scenarios according to the EU Long-Term Strategy (LTS 1.5 °C) (EC, 2018a) and the Low Carbon Energy Observatory (LCEO) project.
Figure 5 reports the main trends of BEVs and PHEVs in Europe according to the literature.

7
Figure 5: Some of the available forecasts about EU mobility in the literature
ICE = internal conventional engine; HEV = hybrid electric vehicles; PHEV = plug-in hybrid electric vehicles; BEV = battery electric vehicles; FCEV = fuel cell electric vehicles
Source: Harrison (2019).
MaaS is a term frequently used to describe the use of digital technologies that integrate various forms of transport services into a single mobility service accessible on demand (Alonso Raposo et al., 2019). Many factors have contributed to the rise in MaaS (4) including local (city) policies discouraging private vehicle ownership and the appearance of new business models for on-demand use. The latter have been enabled by the growth in popularity of smartphones and consequently the availability of data, which facilitates route and logistic planning.
Figure 6: Global car-sharing growth, 2006–2014
Source: Goodall et al. (2017).
Autonomous driving, however, is still at a relatively immature stage, as the technology is still under development and the safety and reliability of Autonomous Vehicles (AVs) still need to be proven. The European Commission’s Communication ‘Europe on the move’ (EC, 2018b) set the goals of automated and connected mobility, and was followed by guidelines for EU approval of automated vehicles (EC, 2019b). However, no harmonised certification procedure has been adopted so far, with different
(4) https://maas-alliance.eu/

8
approaches for assessing the safety of AVs still under discussion and evaluation (Galassi and Lagrange, 2020). Different levels of automation are expected to be made available in the EU market in the next decades (Figure 7). Sales of AVs are expected to follow an S-curve (Figure 8) and, even in optimistic scenarios, are not likely to reach saturation point before than 2040, (McKinsey & Company, 2016). Indeed, Statista (2019) estimates a slow uptake of AV penetration until 2025 and then a rapid increase in the EMEA region (i.e. Europe, Middle East and Africa) until 4 % of market penetration in 2030. The majority of AV sales in 2030 will be level 2, followed by levels 3 and 4; only about 6 million AVs sold worldwide will be level 5. Accordingly, level 5 automation will represent a significant share of the market only after 2045 (Cobb, 2018).
Figure 7: Levels of automation and their timescale
Source: Alonso Raposo et al. (2019).
Figure 8: Trends in autonomous vehicle (AV) market share
Source: McKinsey & Company (2016).
Connectivity can be seen as a platform designed to support autonomous technology through vehicle-to-vehicle and vehicle-to-infrastructure communication, as well as to continuously enhance MaaS capabilities.
Connectivity refers to the use of technologies that enable road vehicles to communicate with each other and with roadside infrastructure (e.g. traffic signals). Connectivity enables the concept of cooperative intelligent transport systems and is closely interlinked with automation, especially for the efficient management of AVs in traffic. ‘Connectivity, Cooperation and Automation are complementary

9
technologies that reinforce each other and will over time merge completely’ (CEN, 2019). The term ‘connected and automated vehicle’ (CAV) encompasses connectivity and automation (Alonso Raposo et al., 2019).
Finally, it is worth noting that there already exist various modelling methods to estimate the uptake of new technologies in the EU fleet, each with advantages and drawbacks (Choi et al., 2018; Daziano and Chiew, 2012; Harrison et al., 2016; Silvia and Krause, 2016; Trost et al., 2017). Data related to fleet projections are abundant, and studies and models are regularly updated to capture accurate predictions. Among the available methods, an S-curve (or logistic curve) is used to describe the trend in new technologies in a specific system based on past data and relevant parameters affecting the choice of consumers (e.g. price, availability of infrastructure, consumer choice, trustworthiness of new technologies). Note that the S-curve approach reflects the increasing trend in diesel vehicles (De Villafranca Casas et al., 2018). Examples of the adoption of the S-curve to estimate the future uptake of new mobility technologies are given in Byun et al. (2018), Gnann et al. (2018) and Morningstar Inc. (2018). It is to be noted that, according to the key drivers/assumptions of the estimation of the future fleet (e.g. emission targets, regulatory measures), the speed and the timing of the adoption of new technologies under analysis shift the S-curve to the right (Hannon et al., 2016).
The greatest disruption to current mobility occurs when all the factors illustrated above act in synergy – the rise in AVs might lead to a much higher number of kilometres travelled by automotive vehicles, which will lead to a drastic increase in emissions unless EVs are adopted. The widespread adoption of MaaS relies on very effective and cheaper mobility services, of which AVs could be a strong enabler. However, without proper governance, cheaper and more flexible options could increase the number of kilometres travelled as a result of individuals’ preferred mobility options (e.g. car sharing) (Alonso Raposo et al., 2019). Trade-offs between different options in the future mobility sector should be evaluated to better understand their potentialities from environmental perspectives.
The trends illustrated above will require more electronic systems/components in the automotive sector, such as sensors and central processing units/graphic processing units (CPUs/GPUs) for autonomous driving systems, with the percentage of electric motors expected to increase (Alonso Raposo et al., 2019). This will significantly increase the demand for specific materials that are key to such new technologies; this increasing demand also represents an opportunity for the repair/remanufacture market of specific components.
1.2. Remanufacturing in the EU value-chain of vehicles - key aspects for the SMART project
In this section, the main outcomes of the literature review concerning remanufacturing in the EU value-chain of vehicles are reported. Note that, because of a lack of detailed and quantitative information, experts in the field were consulted (see Section 1.2.2) during the project to increase knowledge not only of the remanufacturing sector in the EU but also of remanufacturing processes specifically. Information obtained was then used as input for the following environmental analysis.
According to Lange (2017), the remanufacturing industry represents about 2 % of the EU car manufacturing industry, and various manufacturers have in-house remanufacturing activities. In addition, remanufacturing is also a business for small and medium-sized companies, since remanufactured products can be either used in place of new components or integrated into the workflow of companies. This translates, for companies, into lower costs of production and increased profit margins.
The European Remanufacturing Network (ERN) (5) expects that, by 2030, the European remanufacturing sector in all manufacturing sectors combined (automotive, aerospace, trains, marine application, medical equipment, etc.) could attain an annual value of up to EUR 100 billion and employ 450 000 to 600 000 people, in mainly four regions, i.e. France, Germany, Italy and the United Kingdom and Ireland (Parker et al., 2015). Nonetheless, two main regions, the United States and China, already have a common vision and strategy for remanufacturing, and European remanufacturing could lose competitiveness against these more organised economies. In the United States, the largest remanufacturing market at the global level, the automotive sector is the second (following aerospace) most important remanufacturing sector. In the United States, the main issues facing remanufacturing derive from regulatory barriers in foreign markets, price and flows of cores. In China, the development of the remanufacturing market is relatively recent. After the adoption of a set of laws addressing
(5) https://www.remanufacturing.eu/

10
pollution, EoL and energy conservation in 2003, the remanufacturing sector started to increase: after two pilot programmes launched by China’s National Development and Reform Commission and the Ministry of Industry and Information Technology, guidance was published to promote the remanufacturing development. In both cases, the development of ad hoc measures to support and promote remanufacturing have an important role in such a sector. In addition, in the EU, there is a real need for a European-level solution to encourage remanufacturing throughout Europe (Parker et al., 2015). The automotive sector is the second largest sector in the EU in terms of number of companies involved (33 % of EU companies, following only the Electrical and Electronic Equipment (EEE) sector), including some Original Equipment Manufacturers (OEMs) (Lange, 2017). In the EU, remanufacturing entails job creation, and according to an expert in the field there is still room for improvement, especially since the EU has important expertise in the sector. In the current market, increasing remanufacturing and expanding the set of products involved in this sector is quite challenging (Matsumoto, 2020); moreover, this should be supported by both enhanced design and incentives (Weiland, 2019).
1.2.1. Definition of remanufacturing
A need for a clear definition of the term ‘remanufacturing’ has emerged as essential since the first steps of the SMART project, from both the literature and the interviewed stakeholders.
In fact, ‘the term “remanufacturing” does not have a standard internationally approved definition and the potentially recoverable “cores” (6) are often classified as “waste”’ (EU, 2017). However, in the consulted literature, various terms related to the reuse of products are often imprecise or used interchangeably (Ardente et al., 2018; Cooper and Gutowski, 2015; EU, 2017; Gharfalkar et al., 2016). For instance, Gharfalkar et al. (2016) observed that, in most of the assessed studies, it is very difficult to understand if the discussed options are part of direct reuse or other types of reuse. Some studies do not include remanufacturing in reuse; in other cases, remanufacturing is considered a specific type of reuse (7) (Bobba, 2019).
The British standard (BS 8887:2009) defines remanufacturing as ‘return[ing] a used product to at least its original performance with a warranty that is equivalent or better than that of the newly manufactured product’ (BSI, 2009). Note that this definition applies to products as a whole, not to single components. This definition has also been adopted by APRA (APRA, 2012). More recently, remanufacturing has been defined by British standard EN 45559 as an ‘industrial process which produces a product from used products or used parts where at least one change is made which influences the safety, original performance, purpose or type of the product’ (BSI, 2019). This definition is based on the definition provided by the ISO/DIS 14009 (ISO, 2020).
Ardente et al. (2018) summarised the different types of reuse, considering the ‘level of treatment undertaken and the quality of the output’ (Figure 9), based on both the British Standards Institution standard and the Waste Framework Directive (2008/98/EC) (EU, 2008).
From a customer viewpoint, the remanufactured product should be considered to be the same as the new product (APRA, 2012): the performance after remanufacturing is expected to be at least equivalent to the original performance specification (from a customer perspective), and any subsequent warranty is generally at least equal to that of a new product. Remanufacturing effort involves disassembling the product (or waste), restoring and replacing components, and testing the individual parts and whole product to ensure that it is within its original design specifications.
(6) Used parts collected to be remanufactured are called ‘cores’ (Parker et al., 2015); see Section 1.2.2. (7) To be more specific, only 34 % of the studies recognised ‘repair’, ‘recondition’, ‘refurbish’ or ‘remanufacture’ as a ‘reuse’
option; the remainder did not.

11
Figure 9: Classification of different type of reuse and the criteria to define ‘remanufacturing’
Source: Ardente et al. (2018).
Focusing on components that can be remanufactured, Figure 10 shows that remanufacturing includes both functional and defective components.
Figure 10: Classification of cores
NB: KrWG, German Waste Management Act. The term ‘defective condition’ describes the condition in which a unit is incapable of performing a required function’. ‘Functional condition’ means free of faults.
Source: Lange (2017).
1.2.2. Remanufacturing in the automotive sector – literature review and main outcomes from visits to the field and consultations with experts
The main outcomes of the data collection, interviews with stakeholders and experts (Annex 1), and visits to the field (Annex 2) are summarised in this section.
Remanufacturing activities in relation to vehicle and truck parts started in Europe in 1955 (Weiland, 2016), and involved mainly purely mechanical and hydraulic parts. Only recently remanufacturing has been performed/tested on mechatronics (8) and electronic components (and information/literature relating to these parts is generally lacking). Thus, remanufactured parts are not currently used for manufacturing new vehicles, even though this is theoretically possible. Carmakers point out that
(8) Mechatronics include three main aspects: mechanics, electronics and computer science. Some examples are anti-lock
braking systems (ABS) and collision warning.

12
remanufactured parts are generally old, as they are collected as cores from garages, dismantlers and demolishers some variable number of years after they were first put on the market. Although it technically possible to do so, remanufactured parts are not used because of changes in design and specifications (for new cars), and because of the limited number of remanufactured products available for use in the manufacturing process. Therefore, a design for disassembly, including reuse options, is required to counteract the increase in the market in low-cost components combining from extra-EU countries, especially those in Asia; it is also worth noting that the quality of such components is increasing, making them even more attractive (Weiland, 2019). It is also to be considered that the design cycle of new cars allows remanufacturers to adapt their technologies and production processes to new needs. In this framework, remanufacturing can still have a role and new technologies can be part of such a role; for example, three-dimensional (3D) printers are an option for producing old components that are no longer produced (Weiland, 2019), especially for small modules (Steinhiper and Nagel, 2017). In addition, remanufacturing can contribute to reducing the impact of products, as highlighted by Böckin and Tillman (2019) in their assessment of the environmental impacts of additive manufacturing (9) for truck engines.
The main actors are carmakers (e.g. remanufacturing of engines, gearboxes), OEMs and original equipment suppliers (OESs) (e.g. remanufacturing of starters, alternators, brakes, clutches), and independent private remanufacturers, dealing with a variety of products and different brands. In addition, as OESs have better access to information about components, they are expected to grow more than independent remanufacturers, although estimating the evolution of the market is quite complex (Weiland, 2019). This is in line with, for example, the situation in Germany, where 55 % of the car workshops are branded car workshops (Ewers and Berg, 2019). Furthermore, the analysis of the German market shows that the older the cars under maintenance are, the higher the preference of consumers for independent workshops instead of brand workshops (Ewers and Berg, 2019).
Given this, independent remanufacturers need to be creative to compete with OESs, especially if technical information is lacking; an additional possibility is that OESs could subcontract work to independent remanufacturers (Lange, 2017; Weiland, 2019). Among the key actors in the remanufacturing chain, core brokers have a key role in pre-sorting cores based on the market requests and managing their flow from garage/ELVs to remanufacturers and then again from remanufacturers to market (Lange, 2017; Weiland, 2019).
Figure 11: Main actors involved in remanufacturing process
(9) Additive manufacturing means the development of technologies to test and restore materials that are degraded through use
(wear and/or environmental conditions). In the automotive sector, additive manufacturing and 3D printing technologies allow surfaces to be restored, addressing surface wear, and specific parts that are no longer in production to be created (Lange, 2017; Nasar et al., 2017; Weiland, 2019).

13
Source: Lange (2017).
Remanufactured parts and components are supplied to the aftermarket mainly as spare parts for repair and maintenance (Gaudillat et al., 2017). Between 80 % and 90 % of cores come from garages, with the remainder from ELVs (Weiland, 2019).
One of the greatest challenges for remanufacturers is managing returns logistics, as remanufacturing can work only if EoL or defective units are sent back for reprocessing. Thus, intelligent systems have been created to put into practice take-back schemes, through which products can be sent from garages, dismantlers and demolishers to regional collecting points and finally to the remanufacturer’ (Weiland, 2016). Digitalisation of the business model and new management processes could further improve the take-back of products for remanufacturing (Ewers and Berg, 2019; Matsumoto, 2020; Weiland, 2016).
In principle, all parts of a car with a minimum value and complexity can be remanufactured (Weiland, 2016). Parts that are often economical to remanufacture include many mechanical and hydraulic parts, as well as a growing number of electrical/electronic parts (Gaudillat et al., 2017). Examples include air conditioning components, air brakes, alternators, brake calipers, carburettors, clutches, cylinder heads, driveshaft, electrical units, instrument clusters and controllers, engines and engine components, fan motors, heater blowers, front axles, fuel pumps, fuel injectors and ignition, generators, gearboxes, master cylinders, pumps (hydraulic, oil, water), rack and pinions, radiators, starters, alternators, steering units (manual, power), turbochargers, torque convertors, and transmissions (Optimat, 2013).
To the best knowledge of the authors, there are no general/specific standardised procedures for remanufacturing cores from passenger vehicles. Instead, internal procedures are developed by remanufacturers and are based on the experiences of engineers and technicians. Most of the time, remanufacturing activities are based on labour-intensive processes. This is not expected to change in the future because of the higher level of electronics and increasing complexity of equipment (Weiland, 2019). For instance, in the assessment developed by Liu et al. (2018), labour input for remanufacturing is assumed to be twice that required to manufacture new products.
The main steps in remanufacturing are illustrated in Figure 12 and are also aligned with British standard EN 45559 (BSI, 2019). Remanufacturing processes generally consist in the complete disassembly of used vehicle units (cores), inspecting cores and their components, repairing defective components or replacing them with new ones, reassembling the units, readjusting as necessary and submitting them for the final quality test, which is usually the same as the test used for new manufactured parts (Colledani et al., 2014; Gaudillat et al., 2017; Weiland, 2019). Note that inspection includes the diagnosis (i.e. assessment of the condition of used products) of used products and the estimation of the remaining lifetime of components, which is critical to potentially increasing the remanufacturing rate and therefore the material savings; it is also essential in increasing the reliability of remanufactured products (Matsumoto, 2020). From an economic perspective, the most critical steps in remanufacturing in the automotive sector are cleaning and repairing; by comparison disassembly does not seem to be an issue, at least according to Sundin and Bras (2005) (10). However, disassembly is a labour-intensive process and, although research into automatisation of the process is ongoing, it is proving quite difficult owing to the complexity and number of different products (Matsumoto, 2020; Pham, 2020).
Focusing on different steps of remanufacturing and peculiarities of products, Sundin and Bras (2005) proposed a matrix identifying how the properties of products potentially affect the different steps in remanufacturing (the RemPro matrix; see Figure 13). This can support design for remanufacturing, which should consider all the steps needed for remanufacturing depending on the specific product being designed’.
The main limitation identified during field visits (see Annex 2) was the lack of suitable diagnostic tools to enable the quality of used components to be assessed despite the fact that, according to Steinhiper and Nagel (2017), car servicing has moved from ‘experience and craftsmanship towards computerised failure diagnosis and replacement of identified (or suspected) components’. In many cases, the faults diagnosed by cars’ computers require very expensive components to be replaced with new ones; new service technologies are needed to overcome the ‘throw-away-mentality’ when cars become old. In this respect, remanufacturing is among the approaches most important to be incentivised.
(10) Whose results are based a survey carried out in 1998.

14
Figure 12: Main steps involved in the remanufacturing process
Source: Weiland (2019).
Figure 13: RemPro matrix showing the relationship between product properties and remanufacturing steps
Source: Sundin and Bras (2005).
The process of cleaning components of a vehicle part involves de-greasing, de-oiling, de-rusting and removal of old paint. Cleaning also requires washing and chemical agents, hot water jet or steam cleaning, chemical detergent sprays and chemical purifying baths. The technologies to be used may require ultrasonic cleaning, sand blasting, steel brushing and baking (Gaudillat et al., 2017). The cleaning process may be more environmentally sustainable if newer and more efficient cleaning technologies that do not generate hazardous waste are used (Steinhilper, 1998); in fact, cleaning has been identified as remanufacturing the process associated with the highest environmental burden (Matsumoto, 2020; Sundin and Bras, 2005). Among these best practices, it is possible to list cleaning processes that do not involve the use of chemical detergents (using, instead, less harmful products such as water-soluble detergent) and mechanical cleaning processes (e.g. via abrasive blasting) (Steinhilper, 1998).
The average annual volume of remanufactured parts for EU cars is about 22.5 million units, and is steadily increasing (Weiland, 2016). Combined, alternators and starters represent the majority of remanufactured cores (80 % according to Kim et al. (2008); 90 % according to Steinhilper (1998)), i.e. about 6 million units (Weiland, 2016). In the case of trucks, annual demand for remanufactured parts is considerably lower, at approximately 7.5 million units. However, parts from trucks and tractors are generally larger and heavier, so their mass flow may be greater than that of parts for passenger cars (Weiland, 2016).
Remanufactured units account for 55 % of the EU automotive aftermarket, with the remainder (45 %) being new units; however, market growth may push demand for remanufactured parts to a market share
15
of 80 % in the future (Weiland, 2016). However, as remanufactured components are used as spare parts in the aftermarket, they are also in competition with new units manufactured inside and outside the EU by OEMs or competitors. Thus, the European remanufacturing industry may experience a business decrease because of cheap new parts imported from extra-EU countries (according to stakeholders, EU remanufacturers cannot increase remanufacturing flows because of the import of cheap spare parts from extra-EU countries).
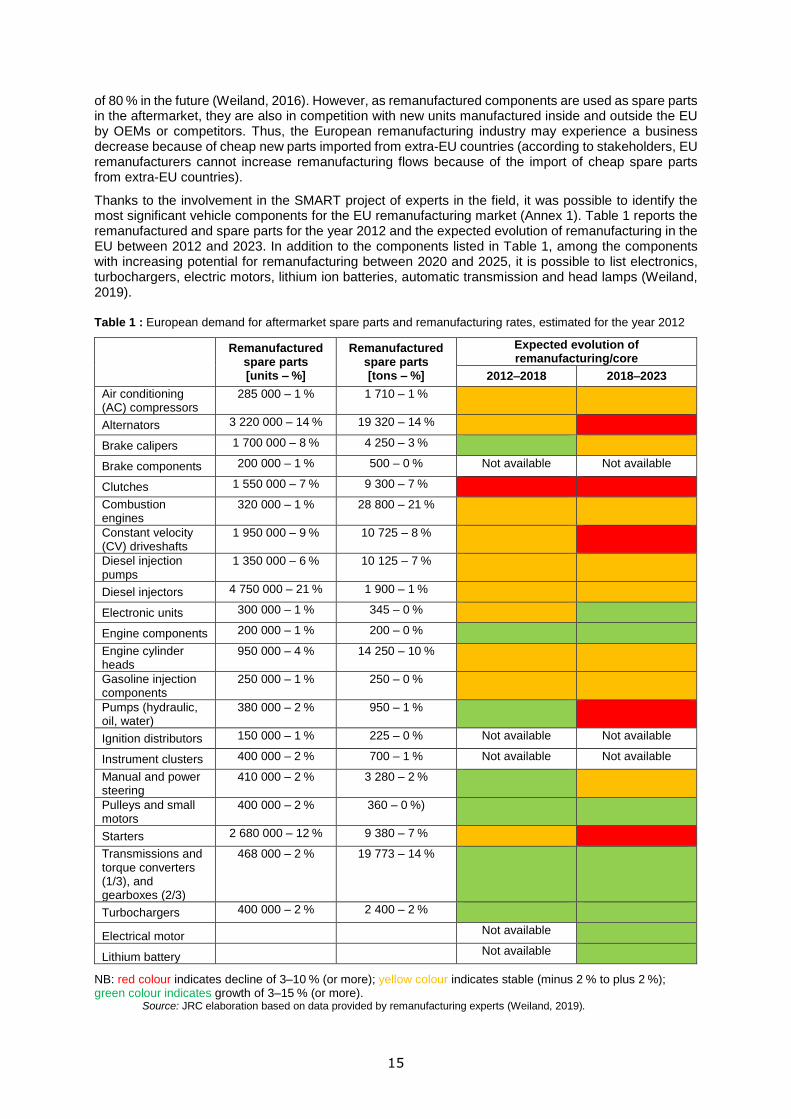
Thanks to the involvement in the SMART project of experts in the field, it was possible to identify the most significant vehicle components for the EU remanufacturing market (Annex 1). Table 1 reports the remanufactured and spare parts for the year 2012 and the expected evolution of remanufacturing in the EU between 2012 and 2023. In addition to the components listed in Table 1, among the components with increasing potential for remanufacturing between 2020 and 2025, it is possible to list electronics, turbochargers, electric motors, lithium ion batteries, automatic transmission and head lamps (Weiland, 2019).
Table 1 : European demand for aftermarket spare parts and remanufacturing rates, estimated for the year 2012
Remanufactured
spare parts [units – %]
Remanufactured spare parts [tons – %]
Expected evolution of remanufacturing/core
2012–2018 2018–2023
Air conditioning (AC) compressors
285 000 – 1 % 1 710 – 1 %
Alternators 3 220 000 – 14 % 19 320 – 14 %
Brake calipers 1 700 000 – 8 % 4 250 – 3 %
Brake components 200 000 – 1 % 500 – 0 % Not available Not available
Clutches 1 550 000 – 7 % 9 300 – 7 %
Combustion engines
320 000 – 1 % 28 800 – 21 %
Constant velocity (CV) driveshafts
1 950 000 – 9 % 10 725 – 8 %
Diesel injection pumps
1 350 000 – 6 % 10 125 – 7 %
Diesel injectors 4 750 000 – 21 % 1 900 – 1 %
Electronic units 300 000 – 1 % 345 – 0 %
Engine components 200 000 – 1 % 200 – 0 %
Engine cylinder heads
950 000 – 4 % 14 250 – 10 %
Gasoline injection components
250 000 – 1 % 250 – 0 %
Pumps (hydraulic, oil, water)
380 000 – 2 % 950 – 1 %
Ignition distributors 150 000 – 1 % 225 – 0 % Not available Not available
Instrument clusters 400 000 – 2 % 700 – 1 % Not available Not available
Manual and power steering
410 000 – 2 % 3 280 – 2 %
Pulleys and small motors
400 000 – 2 % 360 – 0 %)
Starters 2 680 000 – 12 % 9 380 – 7 %
Transmissions and torque converters (1/3), and gearboxes (2/3)
468 000 – 2 % 19 773 – 14 %
Turbochargers 400 000 – 2 % 2 400 – 2 %
Electrical motor Not available
Lithium battery Not available
NB: red colour indicates decline of 3–10 % (or more); yellow colour indicates stable (minus 2 % to plus 2 %); green colour indicates growth of 3–15 % (or more).
Source: JRC elaboration based on data provided by remanufacturing experts (Weiland, 2019).

16
Current remanufacturing of electric motors and batteries is practically non-existent, as OEMs prefer to sell new units, the potential for remanufacturing is currently very limited, and remanufacturers have not yet started remanufacturing such components. However, pilots of remanufacturing both electric motors and traction batteries are still ongoing in the EU and worldwide (11) (Bobba et al., 2018b). For the period 2018–2023, the start of remanufacturing such components can be envisaged, with aftermarket volumes of around 1 % for batteries and 0.5 % for motors of the vehicles in use. According to experts, remanufacturing of electric motors will not start before than 2030, when the number of cores available in the market will be significant (Rematec, 2020; Weiland, 2019). It is also highlighted that electric motors, induction motors or PM synchron motors are much simpler than combustion engines, since they consist of only a stator, a rotor and bearings; hence, remanufacturing will be, in principle, easier than an Internal Combustion Engine (ICE) (Rematec, 2020; Weiland, 2019). The main challenge will be the replacement of the windings of the stator or rotor for which processes do not exist yet.
Finally, innovation, automation and collaborating robots are the key elements needed to enhance remanufacturing in the EU, potentially meeting 80 % of the EU aftermarket demand. The contribution of collaborative robots is likely to increase efficiency and precision of the processes, and contribute to produce greater volumes more easily; moreover, the adoption of such robots can decrease risks for workers when handling heavy loads or complex products (Matsumoto, 2020; Ortgies, 2020; Pham, 2020; Rematec, 2020; Weiland, 2019).
1.2.3. Environmental impacts of remanufacturing: a brief literature survey
Most of the studies of impacts of remanufacturing are qualitative analyses, with very few quantitative data (Boustani, 2011). Moreover, the performed literature review highlighted that most of the studies address impacts from an economic perspective, whereas few studies address the environmental contribution in a quantitative manner, based on transparent inventory data retrieved from primary sources.
On average, compared with the production of new parts, the use of remanufactured parts generates the following savings, according to the Ellen MacArthur Foundation (2012): 80 % for energy demand, 88 % for water demand, 92 % for chemical product use and 70 % for avoided waste. This is in line with the work of Liu et al. (2018), who reported, following an expert consultation in China, a reduction in total materials input of 46–90 % for remanufactured products compared with new products, and a reduction in energy usage of between 68 % and 82 %. This corresponds to a reduction in product price of 30–70 %. Other sources claim a yearly material saving of 14 million tons due to remanufacturing in the automobile sector (BORG Automotive (12)) while, considering all the sectors, it is estimated that remanufacturing practices could reduce CO2 emissions by 16 million tons of per year (Weiland, 2019).
Similarly, a reduction of 88 % in materials and a reduction of 52 % in carbon dioxide equivalent (CO2eq) emissions for remanufacturing an ICE is reported by McKenna et al. (2013). Liu et al. (2014) estimated that manufacturing a new diesel engine requires about 2.3 times more energy than a remanufactured one; this turns in the reduction of the assessed impacts for the remanufactured engine compared with the new one of about 25 % for Abiotic Depletion Potential (ADP), 79 % of Global Warming Potential (GWP).
Two literature reviews of studies related to environmental aspects of remanufactured components in the automobile industry, have been conducted, one by Lange (2017) and one by Sundin and Lee (2012). The available studies identified in these reviews and by a further screening of the literature are listed in Table 2.
All these studies conclude that there is an environmental benefit to be gained from remanufacturing practice. However, the results show an important variability in terms of potential benefits, which are, most of the time, expressed only as savings in greenhouse gas (GHG) emissions (expressed as kg CO2eq). In addition, Lange (2017) promotes independence from CRMs. Nevertheless, the need to implement ‘design for remanufacturing’ good practices to enhance such environmental benefits is also highlighted by several authors (Lange, 2017; Sundin and Bras, 2005).
(11) Mercedes-Benz is already remanufacturing e-motors (https://remanparts.mercedes-benz.com/en-global/cars/alternative-
drives/electric-motor/). (12) https://www.borgautomotive.com/corporate-responsibility/?L=3

17
Table 2 : Environmental studies dealing with remanufacturing of car components
Remanufactured
products References
Alternators
Schau et al. (2012)
Kim et al. (2008)
Russell (2018)
Diesel engine
Liu et al. (2014)
Sutherland et al. (2008)
Russell (2018)
Dias et al. (2013)
Gearbox Warsen et al. (2011)
Car brake callipers Lindahl et al. (2006)
Starters Bartel (2015)
Russell (2018)
Cylinder heads Liu et al. (2016)
Source: Own elaborations based on the literature.
1.2.4. Main drivers of and barriers to remanufacturing
The literature review revealed several barriers to the strengthening of the remanufacture of vehicles and key components. In addition, key drivers to enhance such improvement can be identified and are summarised hereafter. Clearly, drivers and barriers are dependent on the geographical boundary of the analysis, as highlighted by Russell (2018).
According to the remanufacturing market study performed by the ERN, higher profit margins, environmental responsibility, strategic advantage and increasing market share are among the top motives for remanufacturers to perform their activities. These all point to an encouraging view of the future of the remanufacturing industry. Further drivers cited in the survey and discussions include securing spare parts supply, the potential to lower product prices, enabling and designing alternative business models, reduced resource security risks, customer pressure, product warranties, asset and brand protection, and, in general, reduced lead times to be able to answer customers’ requests (Matsumoto, 2020; Parker et al., 2015).
Among the tools that could improve the remanufacturing market, design for remanufacturing is recognised as key (Kamper et al., 2019; Liu et al., 2018; Nasar et al., 2017). A survey performed by the Research Institute of Rochester also revealed that areas where there is significant opportunity to strengthen the remanufacturing sector are prognostics, electronic life assessment and component restoration, especially for large companies (Nasar et al., 2017).
The increased digitalisation of not only vehicles but also the business model offers the opportunity to increase the competitiveness of players of the remanufacturing value-chain such as core brokers, to, for example, enable and ease the differentiation of products, thus improving the logistics. However, online players can enhance their position, increasing their share of the spare parts market at the expense of remanufacturers (Ewers and Berg, 2019; Matsumoto, 2020; Weiland, 2016).
Despite the positive aspects, remanufacturing has a number of barriers that potentially reduce its contribution to the circular economy. As mentioned above (Section 1.2), the EU remanufacturing sector is losing competitiveness, and solutions to enhance this sector are needed (Parker et al., 2015). The ERN project, sponsored under H2020, addressed these barriers. Although automotive remanufacturing activity generates around EUR 7–10 billion in turnover, and employs up to 43 000 people, the intensity of remanufacturing (the ratio of remanufacturing to new manufacturing) is only 1.9 % (Parker et al., 2015).
The top barriers include customer recognition, volume/availability of ‘cores’ (used parts intended to become a remanufactured product), the quality of cores and high labour costs (Boustani, 2011; Parker et al., 2015). Among the societal barriers, consumer acceptance is definitely a barrier, since in many cases the remanufactured products are perceived as being of lower quality than new products (Gaudillat et al., 2017; Liu et al., 2018; Matsumoto, 2020; Milios and Matsumoto, 2019; Parker et al., 2015; Russell, 2018). Certainly, the improvement of information on product quality (e.g. though quality certifications) and environmental benefits is a key aspect of improving remanufacturing (Lindkvist Haziri and Sundin, 2020; Matsumoto, 2020; Milios and Matsumoto, 2019). However, the main barrier to adopting

18
remanufactured components in new vehicles is the OEMs’ acceptance (Parker et al., 2015; Weiland, 2019).
Other barriers included legal ambiguity over remanufacturing in different jurisdictions, particularly around transnational shipments, lack of sales channels (linked to customer recognition), lack of product knowledge, including third-party product technical information, lack of technology, low-cost new product competition, skills shortages, poor design for remanufacturing, rapid evolution of the technology base and lack of remediation techniques (Parker et al., 2015). In general, information about the condition of cores and their origin, the timing of return (13), and the demand for remanufactured products is lacking (Kamper et al., 2019)
Furthermore, field visits revealed that one limitation is that some countries (e.g. Russia and Turkey) are not allowing remanufactured parts to be used as vehicle spare parts (Section 1.2.2). This is also confirmed by Matsumoto (2020), who pointed out that costs and trade conditions vary among regions; hence improving policies from this perspective is important to promoting remanufacturing in society.
Looking at future mobility, electrification and an increase in AVs can affect the aftermarket demand and therefore remanufacturing demand. In fact, it is possible to assume a lower number of accidents and less wear per kilometre, which means a lower need for the maintenance of cars (Ewers and Berg, 2019). The speed at which this transition will occur is an important aspect for remanufacturers, since remanufacturers need time to adapt their skills and processes to new components to provide affordable remanufactured spare parts. Certainly, the fast change in technology and the increasing complexity of both vehicles and components are key to the remanufacturing process. The identification of recurring fault patterns is more and more complex, not helped by the lack of reliable information on remanufacturing operations (Kamper et al., 2019).
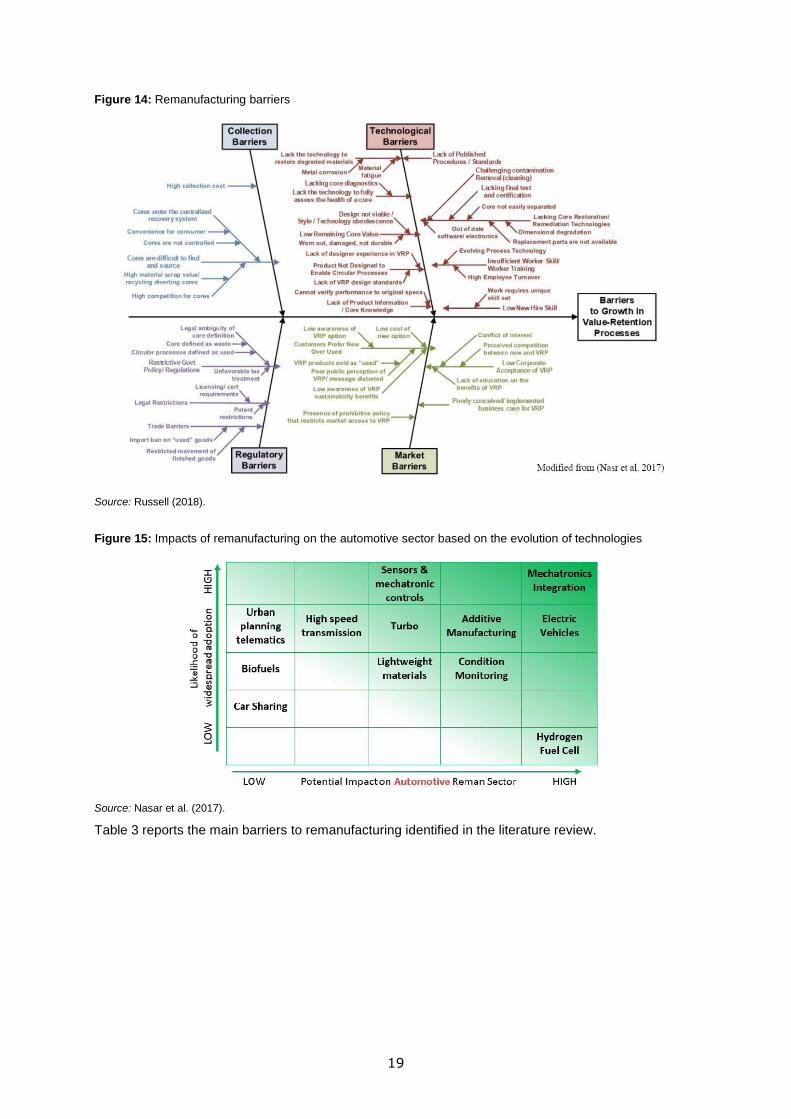
An interesting overview of remanufacturing barriers is provided by Russell (2018) through a fishbone diagram (Figure 14), in which the technical barriers are grouped into collection barriers, technological barriers, regulatory barriers and market barriers.
Furthermore, Nasar et al. (2017) provide an overview of the potential impacts of materials and innovations on remanufacturing; the highest impacts are related to mechatronics integration, xEVs and additive manufacturing.
(13 ) Timing of return could be longer than operational lifetime, e.g. in case of the core is stocked before being addressed to remanufacturing
19
Figure 14: Remanufacturing barriers
Source: Russell (2018).
Figure 15: Impacts of remanufacturing on the automotive sector based on the evolution of technologies
Source: Nasar et al. (2017).
Table 3 reports the main barriers to remanufacturing identified in the literature review.

20
Table 3: Summary of the main barriers identified in some of the studies consulted in the literature review on remanufacturing of vehicles
Source/type of barrier
Regulatory Technological Economic Social Knowledge
La
ck o
f a
cle
ar
de
fin
itio
n o
f
term
s
La
ck o
f sta
nd
ard
isa
tion
Tra
de
re
str
ictio
n
Ma
rke
t co
mp
etitio
n
Po
or
desig
n f
or
rem
anu
factu
rin
g
Lo
w e
ffic
ien
cy o
f
rem
anu
factu
rin
g-r
ela
ted
pro
cesse
s
Inn
ova
tio
n o
f
rem
anu
factu
rin
g p
roce
sse
s
Fa
st
tech
no
log
ica
l
ch
ang
es
Incre
ase
in
com
po
ne
nts
’
co
mp
lexity
Via
ble
busin
ess m
od
el
Access to
co
res a
nd
ava
ilable
vo
lum
es
Pe
rce
ptio
n/a
cce
pta
nce
of
reu
se f
rom
con
su
me
rs
La
ck o
f sp
ecific
skill
s
La
ck o
f in
form
atio
n
Russell (2018)
X X X X X X X X
Parker et al. (2015)
X X X X X X X X X X X X
Kamper et al. (2019)
X X X X X
Nasr et al. (2017)
X
Weiland (2019)
X X X X X X X X X X X X
Lange (2017) X X X X X X
Boustani (2011)
X X X X X
Matsumoto (2020)
X X X X X X X
Liu et al. (2018)
X X X X
3 2 2 3 4 3 3 3 5 3 5 5 4 3 Source: Own elaborations based on the literature.

21
1.3. Material composition of passenger vehicle: Literature review and primary data from laboratory testing
Reuse and remanufacturing are recognised as being attractive options in terms of economic viability and deserve to be further explored through environmental analyses. To achieve this, the mapping of selected components and a detailed bill of materials (BoM) is also needed. In this section, an overview of materials in vehicles is provided, with a special focus on key materials for new mobility. In addition, in line with the goal of the project, the content of CRMs at present and in the future is discussed.
One of the main barriers highlighted by previous experiences and confirmed by several LCA practitioners in the automotive sector is the lack of robust data, mostly because much information is confidential but also because the long value-chain of vehicle components makes it difficult to obtain a detailed breakdown of the material composition of some components. In fact, although in the scientific literature results of LCA are reported for different type of vehicles, complete and transparent inventories remain scarce (Del Duce et al., 2016; Hawkins et al., 2013) and those that are available are generally based on aggregated or confidential datasets. Therefore, a strict collaboration with stakeholders on the value-chain of vehicles is required to access reliable and robust data.
Looking at the current EU fleet, as mentioned in previous sections, constant growth during the past decade can be observed, reaching 268 million passenger vehicles in 2017 (14). Overall, the fleet represents over 370 million tons of materials (15), the most common materials being steel, aluminium and copper, which each account for millions of tons. Note that the increase/decrease in each material is more or less linear over a 20-year period, as shown in Figure 16.
Figure 16: Trends in materials in vehicles
Source: Dai et al. (2016).
Other elements (e.g. neodymium, niobium, cobalt and silver) are present in amounts that are significantly, i.e. several orders of magnitude, lower (i.e. thousands of tons). Typical materials used for passenger cars are available in the literature (e.g. Castellani et al., 2017; Gerrard and Kandlikar, 2007; Hovorun et al., 2017; Kanari et al., 2003; Messagie et al., 2014; Nemry et al., 2008). Some studies focused on specific materials embedded in vehicles and provide information on specific vehicle components, e.g. plastics (Emilsson et al., 2019; Kanari et al., 2003).
Table 4 shows some examples of BoM available in the literature.
Table 4: Example of Bill of Materials (BoMs) available in the literature
Material Kanari
(2003) Castellani (2017) Gerrard (2007) Hovorun (2017)
(14) https://www.acea.be/statistics/article/key-figures (15) Considering an average weight of passenger cars equal to 1.395 tons (ICCT, 2018).

22
Steel 59.0 % 67.6 % 68.3 % 55.0 %
Cast iron 6.4 %
Plastics 9.3 % 11.0 % 9.1 % 11.0 %
Aluminium 8.0 % 12.0 % 6.3 % 9.0 %
Rubber 5.6 % 3.5 % 5.1 % 7.0 %
Adhesive/paints 3.0 % 1.1 %
Glass 2.9 % 2.3 % 2.9 % 3.0 %
Copper
2.0 %
0.5 %
1.5 % 1.0 % Magnesium 0.1 %
Lead 1.1 %
Zinc
Fluids 0.9 % 0.6 % 2.1 %
Textile 0.9 % 1.3 % 0.4 %
Battery 1.1 %
Electrical/electronics 0.7 %
Other materials 2.0 % 0.1 % 1.5 % 14.0 %
Source: Own elaborations based on the literature.
Special materials are essential for several key functions and components of passenger vehicles, such as batteries and magnets (essential for electrification), electronics (for connectivity and sharing), sensors (for automation and connectivity) and lightweight structural parts (for electrification and, overall, for robust and efficient vehicles and infrastructure) (Alonso Raposo et al., 2019; Blagoeva et al., 2016). Examples of metals quantities whose use in the fleet has increased are neodymium, tripling between 2000 and 2020, and aluminium, increasing by two thirds (Huisman et al., 2017b). Detailed BoMs are lacking in the literature, especially for such materials.
In addition, current practice is for product designers to select materials, and not elements, when designing products. Elements are therefore selected implicitly rather than explicitly (Peck and Jansson, 2015). As a consequence, EoL management is not sufficiently advanced at present to enable the recovery of strategic materials. Indeed, vast quantities of scarce metals are being lost from Europe’s urban mine of vehicles, and the proportion of CRMs (Section 1.3.2) in vehicles is continuing to increase (EurekAlert!, 2018). It was estimated that in 2020, there would be nearly 18 000 tons of neodymium in the active vehicle fleet – this is nine times the amount that was present in 2000 (EurekAlert!, 2018).
In this framework, collaboration with stakeholders, especially manufacturers, is needed to build more recent and specific datasets. Despite intrinsic limitations, an interesting source of information is represented by the International Material Data System (IMDS) (see Section 1.3.1), a repository of data of materials used in vehicles. Little information from the IMDS is available for investigation.
1.3.1. International Material Data System (IMDS)
Among the information available in the literature, the IMDS is the system used by the automobile industry to share Material Declaration Data. It was initially developed by carmakers (e.g. Audi, BMW, Daimler, DXC, Ford, Opel, Porsche, VW, Volvo) and soon became a global tool used by almost all of the global OEMs/OESs. In the IMDS, materials used for vehicle part manufacturing are collected, maintained, analysed and stored. Through the IMDS, it is also possible to meet the obligations placed on automobile manufacturers and suppliers, by national and international standards, laws and regulations, such as the Registration, Evaluation, Authorisation and Restriction of Chemicals (REACH) Regulation (16) and the Restriction of Hazardous Substances in Electrical Equipment Directive (17) (IMDS, 2018). Data from the IMDS can be used only for legislative, environmental or health issues. Data from the IMDS cannot be used to negotiate prices with suppliers (Cullbrand and Magnusson, 2013).
In the IMDS, Material Declaration Data describe the specific chemical composition of a given vehicle part. Suppliers are thus required to report all substances that are covered in the Global Automotive
(16) http://ec.europa.eu/environment/chemicals/reach/reach_en.htm (17) http://ec.europa.eu/environment/waste/rohs_eee/legis_en.htm

23
Declarable Substance List (GADSL) (18). In the IMDS, materials need to be specified to 100 % by weight and type, but not all materials have to be specified by exact substance composition (e.g. in the case of a non-GADSL substance). The data gaps could be in the form of non-reported datasheets, or data marked as, for example, ‘confidential substances’ or ‘miscellaneous’. In the IMDS, a part is described by a tree structure whereby the top node is the part itself, followed by subcomponents and semi-components (Cullbrand and Magnusson, 2013).
According to Cullbrand and Magnusson (2013), the main advantage of the IMDS is that it contains vast quantities of detailed data that an IMDS user can easily access. The level of detail of the data available in the IMDS is high: it includes information on every component, from the part as a whole to the substance present in the smallest amount. Mapping material content at this level of detail would probably be impossible without a system like the IMDS. However, the main limitation of the IMDS is that the information it contains is based on suppliers’ self-declaration and, consequently,, relies on trust between the car manufacturer and the supplier (19). Furthermore, suppliers have the option to report substances as, for example, ‘confidential substances’ or ‘miscellaneous not to declare’, or as substance groups.
In the case of certain complex components, such as electronics, it is recognised that there are difficulties in collecting reliable information about composition. For this reason, the IMDS developed, in 2013, specific recommendations (named ‘Recommendation 019’ or Rec 019) to address the expanding requirements of the ELV Directive (2000/53/EC) and the communication requirements of REACH. Rec 019 describes the general requirements for the creation of Material Data Sheets (MDSs) applicable for electric/electronic components, materials at all levels of the supply chain, assembled printed circuit boards (PCBs) and printed wiring boards (PWBs), including flexible circuit boards, and hybrid electronics used in automotive applications. However, the robustness of this generic approach in the declaration of material content has been questioned for not being sufficiently detailed to capture the complexity of electronics, which stems from their very high level of heterogeneity in composition and rapid changes in technology. Owing to the lack of suppliers’ due diligence during the reporting process of electronics and the risk associated with these practices, the IMDS Steering Committee has recently decided to deactivate Rec 019, and remove the use of a standard datasheet for electronic components and reporting in the IMDS. The deactivation was planned to be fully in place from the first quarter of 2021 (ComplianceXL, 2020). This deactivation will present challenges for vehicle manufacturers, since more detailed data from the supply chain will have to be collected. However, it will promote the availability of more detailed knowledge of the composition of the electronics in cars, including the tracing of CRMs. To this end, research on the analysis of material composition of PCBs in cars has been conducted in this project, and methods and results are described in Section 1.3.3. and Annex 3.
In conclusion, the IMDS offers the opportunity to access and create comprehensive and detailed information on the material content in vehicles. Suppliers are required to report all substances that are covered in the GADSL, and thus the IMDS contains hundreds of thousands of reported datasheets of car parts.
In relation to the improvement in the knowledge of products and sharing of information in terms of material composition, the development of a digital (or electronic) ‘product passport’ could be an interesting tool. As mentioned in both the Green Deal (EC, 2019a) and the European Commission Communication ‘A European strategy for data’ (EC, 2020c), the ‘product passport’ can be used to provide ‘information on a product’s origin, durability, composition, reuse, repair and dismantling possibilities, and end-of-life handling’. Information and data are collected by different actors along the value-chain of the product and assigned to a unique product identifier. The advantages of adopting a product passport system include (from the perspective of the SMART project) the ease of defining resource efficiency and circular strategies, mainly thanks to the provision of reliable and robust data on materials embedded in products (Lemos, 2020).
(18) https://www.gadsl.org/ (19) According to Germany’s Electrical Industry (ZVEI), the ‘umbrella specifications greatly simplify the declaration without any
noticeable loss of accuracy and can also be used cross-company wide’. Moreover, for the documentation needed in the material declarations, ‘the harmonized standard EN 50581:2012 can be used’. According to this standard, manufacturers should assess the probability of restricted substances being present in materials, parts or subassemblies, and the trustworthiness of the supplier. The manufacturer should then collect information based on (1) supplier declarations and/or contractual agreements; (2) material declarations providing information on specific substance content and identifying any exemptions that have been applied; and (3) analytical test results. Finally, manufacturers should set procedures to evaluate and review the available information to determine their quality and trustworthiness.

24
1.3.2. CRMs in vehicles
Raw materials are the basis of Europe’s economy and are needed to ensure jobs and competitiveness; they are also essential for maintaining and improving quality of life. Although all raw materials are important, some of them are of more concern than others in terms of secure and sustainable supply (Mathieux et al., 2017). The European Commission regularly updates a list of CRMs for the EU, based on the economic importance and the risk of supply disruption (20); the last update of the CRM list was published in 2020 (EC, 2020d).
Several CRMs are embedded in different components of both conventional vehicles and xEVs (EC, 2020b; Mathieux et al., 2017). However, further research is needed to obtain detailed information about the amount of specific CRMs in vehicle components, since this information is essential to maximising the recovery of such materials from ELVs (Bobba et al., 2020b; Huisman et al., 2017a).
As illustrated in Section 1.3, the base metals (steel, aluminium and copper) represent up to 88 % of the total mass of ELVs, whereas other materials are present in much smaller amounts (a few per cent or even less) despite being embedded in multiple vehicle parts (Figure 17). The exceptions are cobalt and lithium, which are mainly embedded in traction batteries, and indium, which is found in electronics; of a similar magnitude is neodymium, which is embedded in both ELVs and waste EEE (WEEE). Major quantities of CRMs can be found in metals (parts containing alloys of steel, aluminium, nickel and zinc), catalytic converters and particulate filters, and electrical and electronic applications (high-strength magnets used in electric motors and audio systems, PCBs, batteries and electronic wiring) (Cullbrand and Magnusson, 2013; EC, 2020b; Mathieux et al., 2017).
Figure 17: Overview of Critical Raw Materials (CRMs) in vehicles
Source: Cullbrand and Magnusson (2013).
According to Cullbrand and Magnusson (2013), the major drivers to be considered when studying CRMs in vehicles are the following.
— Electrification increases the use of CRMs. Since most of the materials studied are used in the electrical and electronic technologies used in the electrical powertrain of hybrid vehicles, electrification is the greatest influencing factor. Increased electrification increases the use of not only neodymium, dysprosium, copper, samarium, silver, terbium, manganese and lithium, but also of palladium and platinum.
(20) https://rmis.jrc.ec.europa.eu/

25
— A higher equipment level results in increased use of CRMs. The use of the studied materials is increased significantly by the addition of optional equipment such as high-performance sound systems and electric seat adjustments. An increase in the level of equipment was found to be the second most influential factor, resulting in an increase in the use of mainly neodymium, dysprosium, copper, gallium, lithium, praseodymium and tantalum, but also niobium, palladium and platinum.
— The choice of catalytic treatment system determines the quantities of cerium, lanthanum, palladium and platinum but not rhodium, which is commonly used in catalytic applications. This factor has the greatest effect on the use of cerium and lanthanum, but the use of palladium and platinum is also influenced.
— For the majority of the materials studied, use is not influenced by the size of the car. No increased use could be identified in parts from a conventional large car compared with the mid-size cars studied. The use of materials used as alloys in the body structure was expected to higher in the larger car, but no evidence of this could be found. A possible explanation for this is that the conventional large car was designed several years before the other cars.
Focusing on conventional cars, Cullbrand and Magnusson (2013) estimated that internal combustion engine vehicles (ICEVs) with a low equipment level contain between 0.13 kg and 0.15 kg of CRMs, but ICEVs with a high equipment level contain more than 0.36 kg. The increased control of tail-pipe emissions from ICEVs requires more Platinum Group Metals (PGMs) and Rare Earth Elements (REEs), in different mixes and amounts depending on the fuel used.
Indeed, the use of platinum and palladium in catalytic converters is one of the main CRM dependencies in the automotive sector (Peck and Jansson, 2015), and is not expected to decrease in the future, since the technology is already mature and pollution controls will become even more stringent (Harvey, 2018). The overall amount of PGMs in catalytic converters is estimated to be 2 g, and it will increase to 3 g in the future (Busch et al., 2014 (21); Harvey, 2018). Platinum can be replaced by palladium in vehicle applications, as it is less expensive and with more diverse end-uses. However, there are currently no other substitutes for the CRMs used as catalysts in catalytic converters. The same is true for exhaust after-treatment applications that replace catalytic converters (Peck and Jansson, 2015). At the EU fleet level, the ProSUM project estimated that, in 2014, 530 tons of platinum would be stocked in catalytic converters (Huisman et al., 2017b). In addition, platinum are already among those with the highest recycling rate (around 50 %), highlighting their strategic importance (Graedel et al., 2011). Since catalytic converters are not used in BEVs, an increase in this technology in the fleet means a potential reduction in the amount of platinum in catalytic converters. However, although they are not yet fully developed, the next generation of FCEVs will use a similar amount of platinum to ICEVs (between 3 g and 7 g) (Hao et al., 2019; Harvey, 2018).
REEs are mainly concentrated in the electrical, suspension and drivetrain subsystems (Alonso et al., 2012; Field et al., 2017), and are mainly used in PMs of small motors (e.g. for adjusting seats, in the steering system and in the climate control system) (Guyonnet et al., 2015; Witkamp, 2018). The amount of REEs estimated to be used in ICEVs ranges between 0.08 kg (Field et al., 2017) and 0.44 kg (Alonso et al., 2012), with approximately 80 % of the rare earth content in magnets; neodymium is the most used REE, and it is followed by cerium, which is used mainly in catalytic converters. Witkamp (2018) and Guyonnet et al. (2015) confirmed an average concentration of 0.25 kg per car. In addition, REEs are key elements of infotainment electric and electronic systems, which play an increasingly central role not only in cars available on the market nowadays but also in future scenarios (Section 1.1); for example, some systems, such as fuel injection control, anti-lock braking systems (ABS), safety and driver assistance features, powertrain control and infotainment, depend on electric and electronic systems (Huisman et al., 2017b). Basic cars have at least 30 electronic control units, whereas luxury cars may have up to 100.
Finally, different types of high-strength steels are of great importance to vehicles because of safety requirements. Niobium-alloyed steel is mainly used, and in some parts of the car tantalum-alloyed steel is used. In addition, titanium and titanium alloys are used not only for their high strength and low density, but also because of their resistance to corrosion and oxidation (e.g. in internal combustion engine components such as valves, turbochargers, and the exhaust system and muffler) (22); however, owing
(21) The breakdown of PGMs in catalytic converters in Europe is 14 % platinum, 78 % palladium and 8 % rhodium in petrol
vehicles. Note that, originally, only platinum was used for diesel vehicles, but the use of palladium has increased, reaching a 1:1 platinum–palladium ratio (Harvey, 2008).
(22) https://www.azom.com/article.aspx?ArticleID=553

26
to its high cost, titanium is mainly used in luxury and sports cars (23). Any material used to replace those in safety functions must meet the same requirements as the steel currently used. The chassis contains some parts that are made of high-strength or ultra-high-strength steel. These parts usually have a key role in safety, for example in the pillars that support the windscreen and in car seats. The steering, the brake system, the security system and the heat exchanger all contain CRMs (Peck and Jansson, 2015).
Furthermore, the push for mass-reduction designs introduces a greater variety of steels, aluminium and magnesium and their alloying elements, which was confirmed by field visits (24) and discussions with experts in manufacturing companies.
The major changes brought about by the increase in electrification relate to REEs, copper, silver, terbium, cobalt, manganese and lithium (EC, 2020c; Mathieux et al., 2017), whereas the major changes brought about by the increase in the equipment level affect not only REEs, copper, lithium and tantalum, but also niobium, palladium and platinum (Cullbrand and Magnusson, 2013). In fact, some CRMs are key to current and future traction batteries, e.g. cobalt, lithium and manganese. However, as batteries are not the core of the SMART project, such materials will not be discussed in detail in this section.
REEs are widely used in PMs of electric motors, on average in a quantity of 3.8 g/kW (Månberger and Stenqvist, 2018; Pavel et al., 2017). An electric motor of 50 kW in a hybrid vehicle uses around 1.3 kg of PMs (Peck and Jansson, 2015); in xEVs, this increases, according to Habib et al. (2020), to 3.72 kg of per vehicle, with REE content ranging between 31 % and 37 %. These figures are in alignment with the work of Nordelöf and Tillman (2018) and Pavel et al. (2017).
In summary, the main applications in which CRMs are used in both conventional and hybrid vehicles are:
— PMs for the high-voltage power supply – REEs (dysprosium, lanthanum, neodymium, praseodymium, samarium, terbium) and gallium;
— infotainment and electronics – REEs (cerium, erbium), indium and tantalum;
— batteries and accumulators – lithium (not a CRM, but it could become critical in the near future), cobalt, and natural graphite;
— body structure nickel alloys and steel alloys – niobium;
— catalytic converters – PGM elements (platinum, palladium, rhodium).
As illustrated above, quantitative information is still lacking, even though it is recognised as necessary to further enhance the recovery of CRMs from different components of vehicles and increase the flow of SRMs. In combination with available datasets (e.g. the IMDS; see Section 1.3.1), quantitative information can be obtained through laboratory tests (Section 1.3.3). In this framework, narrowing down the analysis to electronics, Bookhagen et al. (2018) developed an analytical protocol for the comprehensive determination of the elemental composition of PCBs. Although these authors carried out their experiments on smartphones, the key findings can be extended to other sectors, including the automotive industry. PCBs are the most complex automotive parts in terms of variability of type and number of components. To determine the material composition, PCBs were first processed using a microwave-assisted acid digestion method, following which elemental composition was measured using inductively coupled plasma optical emission spectrometry and Inductively Coupled Plasma Mass Spectrometry (ICP-MS). In the PCBs examined, the contents of up to 57 elements could be quantified. The 10 most abundant elements in descending order were copper, iron, silicon, nickel, tin, zinc, barium, aluminium, chromium and titanium, which accounted for approximately 80 % of the weight of the PCBs. In total, 16 REEs were identified (cerium, dysprosium, erbium, gadolinium, holmium, lanthanum, lutetium, neodymium, praseodymium, scandium, samarium, terbium, thulium, yttrium ytterbium), with neodymium present in the greatest amount (106 mg/g ± 36 mg/g) and lutetium the least (74 ng/g ± 14 ng/g).
Such an analysis not only provides the basis for the estimation and prediction of future metal usage, but also constitutes a comprehensive investigation into recycling constraints and the circular economy (Bookhagen et al., 2018). Indeed, according to Chancerel et al. (2016), not all of the materials used for manufacturing PCBs are recycled. Elements typically recovered as SRMs from treatment of waste PCBs are silver (95 %), gold (95 %), bismuth (80 %), copper (95 %), nickel (90 %), lead (80 %), palladium (95
(23) https://www.refractorymetal.org/applications-of-titanium-alloy-in-automobile-industry/ (24) Considerations are based on a visit to a plant in Italy that manufactures car components. The company can be classified as
an OES tier 1 in the IMDS structure.

27
%), tin (75 %) and zinc (50 %). This suggests that REEs and other CRMs are not recovered as SRMs in the recycling processes.
Finally, understanding the flows of CRMs in vehicles in the years to come in the EU is a topic that has already been addressed by several authors in the literature, despite the high level of uncertainty related to the lack of data and the difficulty of considering a large number of variables. To boost circular resource efficiency through the adoption of more circular practices, both reuse and recycling should be considered in such analyses. In fact, extending the lifetime of (components and) vehicles means increasing the amount of CRMs stocked in the EU and postponing the availability of materials for recycling. However, the evolution of the recycling industry, through improved collection and more efficient recycling, will increase the amount of CRMs that are kept in the EU (Bobba et al., 2019; Bobba et al., 2020a; EC, 2020c). Focusing on the CRMs embedded in vehicles, some studies specifically addressed the future increase in embedded materials, e.g. REEs in xEVs (Busch et al., 2014; EC, 2020c; Habib et al., 2020; Harvey, 2018; Månberger and Stenqvist, 2018; Pavel et al., 2017). Among the sources of information on the amount of CRMs embedded in vehicles in the EU is the Urban Mine Platform (25), developed as part of the H2020 ProSUM project, a dedicated web portal populated by a centralised database containing all readily available data on market inputs, stocks in use and hibernated, compositions and waste flows of EEE, vehicles and batteries for 27 Member States of the EU, plus United Kingdom, Switzerland and Norway (Huisman et al., 2017b). Components/materials/elements embedded in vehicles placed on the market (POM), stocks of materials and waste generated are provided from 2005 to 2020.
It should also be noted that material efficiency is expected to increase, and, despite the increase in material demand for PMs, the REE content is expected to decrease. For instance, (Harvey, 2018) estimated a decrease in neodymium from 3.43 g/kW to 2.29 g/kW and a decrease in dysprosium from 1.06 g/kW to 0.71 g/kW.
For the abovementioned reasons, in estimating the future demand for materials, both primary and secondary materials should be considered; however, few studies are currently focusing on such a dimension, mostly because of a lack of data or a high level of uncertainty surrounding forecasting the evolution of recycling. In almost all the consulted studies, quantitative information related to remanufacturing is not available, and therefore it is quite complex to estimate the potential benefits of extending the lifetime of cores.
1.3.3. Laboratory tests: The analysis of printed circuit board samples
Another source of information of (C)RMs in vehicles and specific components is laboratory tests. The main issues related to such testing are knowledge development and data validation. An example is represented by the comparison between results obtained by the laboratory tests and the IMDS data. However, as highlighted by the stakeholders consulted during the project, the main issue related to the comparison is that it should be made using the IMDS data of those specific components; if not, there is a risk that old data (usually components available for testing are extracted from vehicles that are no longer usable) and recent IMDS data will be compared. In such a case, collaboration between research and development (R&D) activities and industrial stakeholders is necessary.
In the following sections, the main conclusions of the performed laboratory tests are reported, whereas the detailed description of the tests is reported in Annex 3.
As a result of collaboration with a car dismantler, a car manufacturer and a car component manufacturer, an experimental analysis was conducted on PCB samples to increase the knowledge base of the composition of PCBs used in automotive components. The samples were extracted from a car central control unit PCB, a seat control PCB and a PCB from a battery management system (BMS). Their shredding occurred in the scientific laboratory of STIIMA-CNR (Laboratory for Re-De/manufacturing (26)), whereas the testing was developed in JRC laboratories through a total reflection X-ray fluorescence (TXRF).
The results identified copper as the most abundant metal component in all three samples (41 % in sample 1, 32 % in sample 2 and 26 % in sample 3).
In sample 1, the metallic content was lower than 5 %; the highest are tin content, amounting to 3.5 %, and the lead concentration, amounting to about 1.8 %. In sample 2, the content of iron and nickel was
(25) http://www.urbanmineplatform.eu/homepage (26) https://www.stiima.cnr.it/it/index.php?sez=9&ssez=4

28
much higher, whereas the tin content was similar to that of sample 1. The lowest total (extractable) metallic fraction content among the three samples was observed in sample 3. Table 5 reports the results of the laboratory tests for all the three samples.
Table 5: Mass concentration results for various selected elements in the microwave-digested samples
Element
Sample 1 Sample 2 Sample 3
Mass (%) Standard
deviation Mass (%)
Standard
deviation Mass (%)
Standard
deviation
Chromium 0.046 0.007 0.052 0.002 0.057 0.011
Manganese 0.014 0.003 0 0 0.005 0.002
Iron* 1.02 0.08 16.2 2.2 2.48 0.25
Cobalt 0.003 0.001 0.022 0.006 0 0
Nickel 0.13 0.02 0.63 0.04 0.34 0.06
Copper* 41.3 3.2 32.0 3.9 26.2 2.5
Zinc 0.025 0.008 0.021 0.001 0.98 0.11
Gallium 0 0 0 0 0 0
Bromine 0.017 0.004 0.043 0.010 0.056 0.050
Cadmium 0 0 0 0 0 0
Tin 3.49 1.70 2.98 0.19 1.51 0.11
Gold 0.025 0.006 0 0 0 0
Lead 1.76* 0.15 0.013 0.001 0.026 0.002
*Concentrations detected by applying 1 000x dilutions.
NB: The values represent the average of the mean concentrations determined for three independently measured and digested subsamples.
Source: Own elaborations.
The measurements confirmed that various car electronic components show different compositions and that the control unit PCB is the richest in valuable metals; this could be related to the age of the sample (i.e. 10–15 years), and therefore it is possible that current technologies embed different metals at different concentrations. In addition, the control unit PCB sample contained the highest concentration of lead.
A research goal would be to compare such results with IMDS data of these specific components. However, because of the confidentiality of the data and related difficulties, such data were not available during the project. This task could represent a further research step to be developed if data become available.
1.4. Interpretation / final remarks
Several scenarios about future mobility in the EU are available in the literature. However, comparisons are difficult because of the variety of assumptions, hypotheses and the low granularity of datasets (e.g. vehicle segmentation and fuel types). The rapid change in mobility is related to different aspects that can be summarised as (1) powertrain mix, (2) autonomous driving, (3) connected mobility and (4) MaaS. The complexity of the mobility system requires several dimensions affecting the uptake of new technologies, including social aspects (e.g. users’ behaviour and awareness of environmental aspects, MaaS) and policy/economic aspects (e.g. incentives, purchasing price and operating costs, environmental targets), to be considered at the same time.
Remanufacturing, as a circular economy strategy, has the potential to increase resource efficiency by extending the lifetime of vehicles and decrease the environmental impacts of vehicles, as demonstrated in the literature. In the EU, remanufacturing has the potential to be improved, but some barriers have to be overcome and incentives are needed to foster the practice. Significant elements in developing remanufacturing include quality and volume of spare parts (including the improvement in a reverse logistic), experts or remanufacturers, availability and sorting of spare parts, development of diagnosis/testing system, and time to adapt the remanufacturing processes to new vehicles. New technologies and new components represent an opportunity for the remanufacturing market in the EU (if properly supported), which could be the case for, for example, electric motors and 3D printing.
In the assessment developed in the SMART project, three elements are of primary importance: (1) material composition of the vehicle fleet; (2) future scenarios of fleet and EOL strategies; and (3) life-cycle environmental impacts. The combination of these three features allows the modelling of large-

29
scale systems (at the whole EU fleet level) aiming to simulate the potential trends regarding the mobility sector in the coming decades.
With regard to materials embedded in vehicles, robust data on the composition of vehicles/components are still lacking; in addition, the evolution of mobility significantly affects the demand for (C)RMs embedded in vehicles (e.g. in electric powertrains and electronics). In this context, detailed data on the material composition of vehicles and key components, as well as better data on EoL practices, are needed. Data can be extracted from available datasets, e.g. the IMDS, even though contacts and the involvement of key stakeholders (e.g. manufacturers, remanufacturers, recyclers) is essential to improving the knowledge of materials. In addition, laboratory tests on components can provide information that can be compared with available datasets. This is particularly relevant considering the CRMs, which are already embedded in both conventional and electric cars, and for which an increasing demand is expected in the near future. In addition, the understanding of stocks and flows on materials embedded in key components will increase knowledge of availability of such materials in the EU, of their availability for remanufacturing, and of the potential for recovery and recirculation of such materials as SRMs.
As far as environmental impacts are concerned, quantitative assessments of potential environmental benefits are available at component level, but large-scale studies are missing at present. The identified studies do not consider potential environmental benefits when component remanufacturing is addressed at the whole vehicle fleet level. This gap makes an in-depth understanding of potential benefits of remanufacturing practices in the automotive sector difficult. Going further, potential improvements would lie in the development of a harmonised methodological framework for vehicle components remanufacturing based on sectorial good practices. Then, consistent datasets, including primary data retrieved from state-of-the-art industrial processes, would play a major role in the quantification, comparison and potential mitigation of the environmental impacts. Nonetheless, information obtained from both the literature and the stakeholders and illustrated in this chapter is used as input to the environmental assessment presented in Chapter 2.
Finally, according to the developed research, remanufactured components are traditionally not reused in the manufacturing process so that they can be assembled in new products, although our analysis identified that the quality achieved by remanufactured components makes them potentially reusable, even in new vehicles. The adoption of the latter approach needs to be supported by ad hoc measures (e.g. incentives, remanufacturing policies), and it could represent a very important added value for the remanufacturing market in the EU. In addition, potential barriers to this strategy (e.g. availability of remanufactured components, reverse logistic difficulties, time mismatch between remanufacturing components and manufacturing of new vehicles) need to be further investigated.

30
2. Analysis of the environmental performances of the future EU fleet
In this chapter, Section 2.1 provides an overview of the SMART model, describing the links between the different components adopted throughout the assessment; the common assumptions made about the performed analyses are summarised in Section 2.2. The evolution of the EU fleet is the first step of the developed assessment, and the main assumptions are reported in Section 2.3. The environmental impact assessment is performed through both an MFA and an LCA (Section 2.4). The graphical user interface created to allow the user, according to their specific research question, to identify the impacts of different scenarios and EoL strategies is introduced in Section 2.5.
2.1. The SMART model
The SMART model intends to develop and combine several mobility scenarios. Figure 18 represents the conceptual visualisation of the complex model, which relies on available information and the ability to generate outputs from the available datasets. The principal areas are the following.
— EU fleet projections (grey boxes in Figure 18), which collect, develop and combine information on:
● drivetrain projections (e.g. internal combustion engines versus electrification);
● lifetime of vehicles (e.g. in years and in kilometres);
● market penetration of new business models (connectivity, MaaS, autonomous drive);
● use phase impact (energy and resource consumption).
— Material compositions and remanufacturing rates (yellow boxes in Figure 18), which collect, develop and combine information on:
● weights and material composition of vehicle parts, with details of CRMs;
● flows of ELVs reported in collection and estimation of unknown whereabouts;
● remanufacturing rates and demand for remanufactured spare parts;
● reuse, repair and ELV management practices (circular economy practices that are complementary to remanufacturing).
— environmental impacts, which collect, develop and combine information on:
● life-cycle impacts of different vehicles segments;
● current and future GWP according to policy targets;
● impacts of remanufacturing and recycling of vehicles/components.

31
Figure 18: Conceptual visualisation of the SMART model
ELV = end-of-live vehicles; HEV = hybrid electric vehicles; PHEV = plug-in hybrid electric vehicles; BEV = battery electric vehicles; FCEV = fuel cell electric vehicles; BoM = bill of materials; CRMs = critical raw materials; LCI = life cycle inventory; LCIA = life cycle impact assessment; EoL = end-of-life;
Source: Own elaborations.
2.2. Common data for the assessment and definition of the assessed system
Considering the three main blocks of the modelling, i.e. the projection of the EU fleet, the MFA and the LCA, data common to all the blocks were identified and systematically used in all the assessment tools. Expertise from the three fields was combined to increase consistency between inputs and results of the assessment.
2.2.1. Type of vehicles and segments
In the SMART project, the type of vehicles included in the assessment entail ICEVs (diesel and petrol), hybrid electric vehicles (HEV), PHEVs and BEVs. All other powertrains currently available in the EU fleet and expected to emerge in the near future, e.g. FCEVs, are not included in the assessment. However, a category ‘other’ is considered to allow and ease the future update of the model and the analysis of different scenarios. Purchasing price, driving range and low-emission incentives are examples of relevant aspects that also affect not only the uptake of the different types of technologies but also the segmentation of the EU fleet, and therefore the overall impact of the fleet. Such aspects are considered in the assessment in both the projections of the EU fleet and the environmental assessment.
Vehicles have different performances depending on their characteristics. This is a key aspect not only in assessing the environmental performances of future vehicles but also in understanding the future uptake of specific technologies. The uptake of vehicles affects not only the remanufacturing of components but also the demand for (C)RMs. Therefore, the segmentation of the fleet relates to both the type of vehicle and the size of car. In particular, four different segments per type of vehicle are considered; these are aligned with ACEA (2020a) and Ricardo AEA (2015) (Table 6).

32
Table 6: Average weight of the four segments of vehicles considered in the assessment
Average weight (kg)
Segment Petrol Diesel HEV* PHEV* BEVs
Small (A) 953 1 106 1 097 1 281 1 480
Lower medium (B/C) 1 194 1 259 1 342 1 434 1 523
Upper medium (C/D) 1 451 1 468 1 608 1 643 1 615
Executive 1 631 1 737 1 821 1 912 1 945
*Note for calculation:
HEV weight = weight of petrol + half mass of the battery (assuming that the capacity of batteries for HEVs as their energy density are much lower than the capacity of batteries for BEVs and PHEVs (see, for example, Christidis et al. (2005)).
PHEV weight = weight of diesel + 175 kg battery (Bobba et al., 2018a). Source: Own elaborations.
Based on the information available in the literature and provided by the consulted stakeholders, the BoM of all segments was modelled. Figure 19 reports the breakdown of the materials for the lower medium segments.
Figure 19: Graphic representation of the Bill of Materials (BoM) for four different types of vehicle
Source: Own elaborations based on consultation with stakeholders and the literature review.
2.2.2. Vehicle performances
2.2.2.1. Energy consumption of internal combustion engine vehicles
The energy use per kilometre of ICEVs is derived from the work of Bauer et al. (2015), in which the energy (fuel) consumption of recent-past and near-future (2030) mid-size vehicles is simulated for a large set of powertrains. The value (in MJ/km) selected for ICEV-petrol and ICEV-diesel is based on the C/D segment (upper medium), since in both of these vehicle types the weight of the powertrain is around 1 500 kg. A linear regression is applied to estimate current and future vehicle performance (2020, 2040, 2050). To cover all the segments, the values of energy use are scaled based on the fuel consumption of vehicles of different size in the Euro 5 category (small < 1 200 kg, medium < 1 600 kg, large < 2 000 kg) given by Simons (2016). The results are adapted according to the segments defined above and are presented in Table 7. It should be noted that the linear regression might overestimate the reduction in the energy use of ICEVs that can be achieved in the future (years 2040 and 2050).

33
Table 7: Energy consumption per kilometre for ICEV fossil fuel
Energy consumption (MJ/km)
ICEV-petrol ICEV-diesel
Year Smal
l
Lower
medium
Upper
medium
Executiv
e
Smal
l
Lower
medium
Upper
medium
Executiv
e
201
5 1.8 2.3 2.8 3.3 1.4 2.0 2.4 2.9
202
0 1.7 2.1 2.6 3.1 1.3 1.9 2.3 2.8
203
0 1.4 1.8 2.2 2.6 1.1 1.6 1.9 2.4
204
0 1.1 1.4 1.8 2.1 1.0 1.4 1.7 2.1
205
0 0.9 1.1 1.3 1.6 0.7 1.1 1.3 1.6
NB: The data in bold for the upper medium segment are retrieved from Bauer et al. (2015). A linear regression is applied to cover the full period. The results for the other segments are scaled according to the fuel consumption presented in Simons (2016).
Sources: Bauer et al. (2015) and Simons (2016).
2.2.2.2. Energy consumption of electric vehicles
The energy use per kilometre (kWh/km) of xEVs is adapted from the literature (Ellingsen et al., 2016; ERTRAC et al., 2017) and presented in Table 8.
Table 8: Energy consumption per kilometre of electric vehicles (xEVs)
xEV energy consumption (kWh/km)
Year Small Lower
medium
Upper
medium Executive
201
5 0.15 0.17 0.19 0.21
202
0 0.14 0.16 0.17 0.19
203
0 0.12 0.14 0.15 0.17
204
0 0.11 0.12 0.14 0.15
205
0 0.09 0.11 0.12 0.13
NB: The data in bold are directly retrieved from Ellingsen et al. (2016). The exponential regression used to cover the full period 2015–2050 is derived from the European Roadmap Electrification of Road Transport estimations (ERTRAC et al., 2017).
Sources: Ellingsen et al. (2016) and ERTRAC et al. (2017).
In the case of PHEVs, a major parameter to take into account is the utility factor (UF), which is defined as the ratio of all-electric range kilometres to total kilometres driven between recharges. This factor varies depending mainly on the distance driven and the PHEV models. In the first approach, a fixed averaged value is estimated for all the segments based on the literature (Hill et al., 2020; Plötz et al., 2018, 2017). In the present study, the UF equals 0.6.
2.2.3. Lifetime of vehicles
As mentioned in several studies, the lifetime of vehicles is a key aspect of estimating the amount of ELVs and the life-cycle impacts of vehicles. Most of the studies consider a fix lifetime measured in years or kilometres (e.g. 200 000 km, which is aligned with Directive 2009/33/EC) (Hill et al., 2020; Marques et al., 2013; Messagie et al., 2014; Nemry et al., 2008). According to the European Automobile Manufacturers’ Association (ACEA) (27), the average lifetime of passenger cars in the EU increased from 10.4 years to 11 years between 2013 and 2016. Note that, in the case of BEVs, the lifetime of the cars
(27) https://twitter.com/ACEA_eu/status/1015229642721112065

34
is often assumed to be equal to the lifetime of the traction battery (see, for example, McKinsey & Company (2010)). Specific considerations on the lifetime of vehicles in each segment are provided by, among others, Ellingsen et al. (2016), and Weymar and Finkbeiner (2016).
However, this assumption does not take into consideration the fact that lifetime can be prolonged by, for example, the second-hand market or shortened by an accident. To also take into account such aspects, a Weibull distribution is adopted for the assessment, which aims to calculate the number of ELVs each year, based on their usage.
A literature review focusing on the Weibull distribution of vehicles was performed (a summary is provided in Table 9), and the data collected show that most of the studies consider a lifetime lifetime measured in years (e.g. Reimer et al. (2018)), whereas few studies consider the mileage. In addition, the same lifetime, and therefore the same scale and shape, for different types of vehicles is often assumed. Only very few studies (e.g. Yano et al. (2016)) consider the variation in the Weibull parameters over time, which means that the distribution is assumed to remain constant in the assessed scenarios.
Weymar and Finkbeiner (2016) conclude that lifetime in years and lifetime in mileage are different depending on the segment and type of the vehicle considered. Overall, cars with an Otto engine have a lifetime of 18 years, independent of the segment, whereas the mileage ranges between 150 000 km and 210 000 km; in general, the higher the segment, the higher the mileage when cars become ELVs. Diesel cars follow the same trend, even though they have a shorter lifetime (13–15 years) and higher mileage (180 000–240 000 km).
For the study, the adopted parameters for the Weibull distribution are ‘shape = 2’ and ‘scale = 259 000 (km)’.
Table 9: Scale and shape parameters for different types of vehicles according to the performed literature review
Vehicle type Scale Shape Average
lifetime
Unit of
measur
e
Source
First generation (28) – FY1997 21.00 1.43 19.08 [years] Yano et al. (2016)
First generation – FY1998 18.00 2.21 15.94 [years]
First generation – FY1999 18.20 2.13 16.12 [years]
First generation – FY2000 16.00 2.43 14.19 [years]
First generation – FY2001 15.50 2.51 13.75 [years]
First generation – FY2002 14.90 2.57 13.23 [years]
Second generation – FY2003 24.70 2.23 21.88 [years]
Second generation – FY2004 19.70 2.85 17.55 [years]
Second generation – FY2005 23.20 2.11 20.55 [years]
Second generation – FY2006–
2008 23.80 2.26 21.08
[years]
Third generation – FY2009–2030 23.80 2.26 21.08 [years]
Average first generation 17.27 2.21 15.38 [years]
Average second generation 22.53 2.40 19.99 [years]
Average third generation 23.80 2.26 21.08 [years]
Gasoline (petrol) 15.39 1.99 13.64 [years]
Kolli (2011) Diesel 12.09 1.79 10.76 [years]
All cars 13.87 1.85 12.32 [years]
Gasoline (petrol) 169 618 1.64 151 753 [km]
Diesel 189 612 1.62 169 850 [km]
Total sample 178 719 1.62 160 053 [km]
HEV 13.20 3.60 11.89 [years]
(28) According to the authors, HEVs are classified into three different generations depending on their technological upgrades
(Yano et al., 2016).

35
Japan conventional petrol vehicles 11.60 1.90 10.29 [years] Seo and Morimoto (2014)
Passenger cars in general 16.70 3.30 14.98 [years] Uchida et al. (2019)
French fleet 160 053 2.06 141 779 [km] Andersen et al. (2008)
Passenger car (2002) 149 566 4.35 136 222 [km] Kolli et al. (2010)
Hybrid/electric vehicles 15 3.75 13.55 [years] Based on Lu (2006)
Source: Own elaborations based on the literature review.
2.2.3.1. Scenarios definition/description
Based on the literature review and expert judgement, four different scenarios have been established for assessing the effects of improving EoL practices, especially remanufacturing, and the effects of the expected change in mobility. The scenarios are based on the variation in two aspects: (1) changes in business models and user patterns; and (2) changes in production systems (Figure 20).
Figure 20: Scenarios for the analysis
Source: Own elaborations.
The business-as-usual scenario (BaU-sc) largely represents the current situation and takes a pessimistic view of improvements in both production systems and future mobility. This means that the BaU-sc does not assume a strong improvement in remanufacturing practices, and therefore remanufacturing volumes remain similar to the ongoing situation. Based on the views of the consulted experts and the information provided in Section 1.2, demand for remanufactured spare parts in the aftermarket is assumed to remain constant (i.e. 44 %); this means that the majority of the aftermarket volume is provided by third countries. Similar to remanufacturing, a very poor improvement in EoL practices is assumed, which means that unknown whereabouts will remain essentially constant (about 35 % of the ELV generation), and the recycling and incineration rate will be similar to the current situation. As far as fleet evolution is concerned, conservative scenarios are considered, i.e. xEVs, especially BEVs, will increase but new technologies such as FCEVs will not be relevant to the EU fleet composition up to 2050. In addition, mainly private cars will be on the roads and very few CAVs will be adopted until 2050.
In the improved remanufacturing scenario (IR-sc), the main differences relate to remanufacturing and the ELVs generated. In fact, it is assumed that there will be a strong improvement in the collection rate of ELVs through the reduction in ‘unknown whereabouts’ compared with the current situation (29). The evolution of the fleet will remain the same as in the BaU-sc.
However, the innovative mobility scenario (IM-sc) considers an optimistic uptake of xEVs in the near future in the EU, especially of BEVs, together with new technologies such as FCEVs (this increase is captured though the group ‘others’; see Section 2.2.1). It is also assumed that the occupancy rate will
(29) It is assumed that there will be a linear decrease in unknown whereabouts from 39.6 % to 10 % for ICEVs and from 25 % to
5 % for xEVs during the period 2015–2050.

36
remain the same as in the BaU-sc, whereas there will be improvements in terms of performances of vehicles in the use phase. Note that the occupancy rate is modelled through a parameter so that it can be updated once there are more data on, for example, car sharing.
All the improvements assumed in both the IR-sc and the IM-sc are considered in the circular mobility scenario (CM-sc), which is the more optimistic scenario considered in the assessment.
The above information and assumptions are translated into parameters used in the MFA model. Table 10 summarises the assumptions and values used for the analysis.
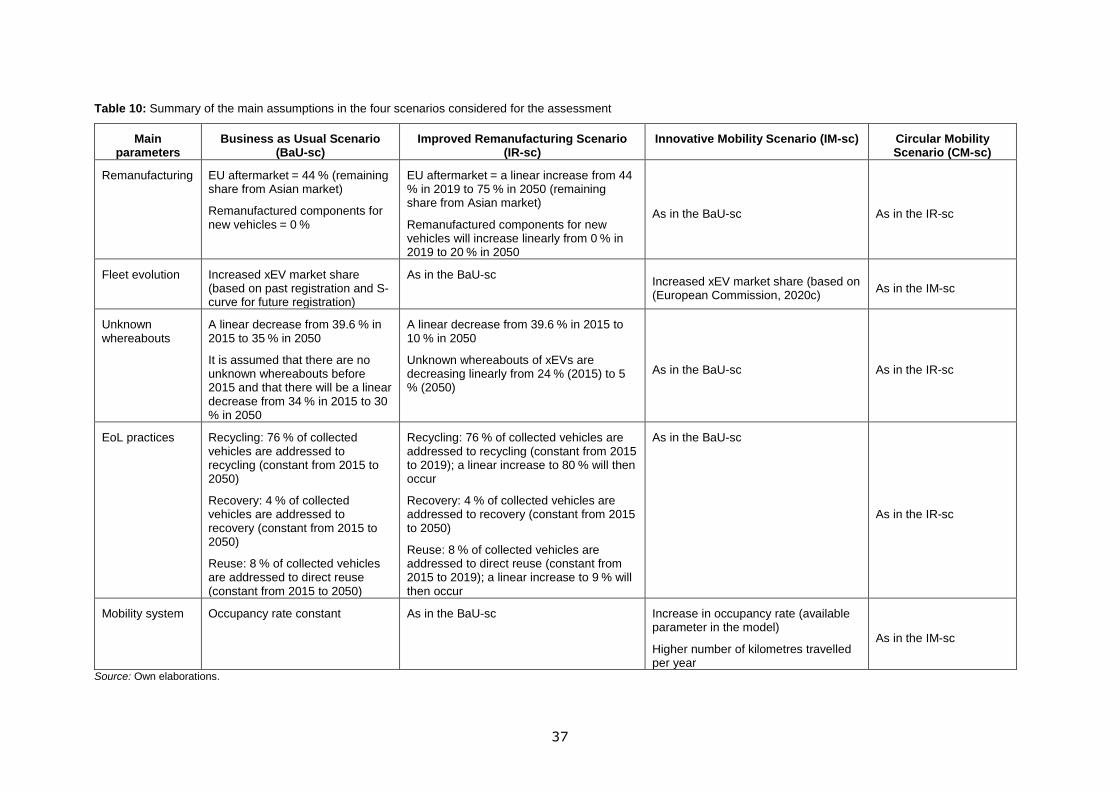
37
Table 10: Summary of the main assumptions in the four scenarios considered for the assessment
Main parameters
Business as Usual Scenario (BaU-sc)
Improved Remanufacturing Scenario (IR-sc)
Innovative Mobility Scenario (IM-sc) Circular Mobility Scenario (CM-sc)
Remanufacturing EU aftermarket = 44 % (remaining share from Asian market)
Remanufactured components for new vehicles = 0 %
EU aftermarket = a linear increase from 44 % in 2019 to 75 % in 2050 (remaining share from Asian market)
Remanufactured components for new vehicles will increase linearly from 0 % in 2019 to 20 % in 2050
As in the BaU-sc As in the IR-sc
Fleet evolution Increased xEV market share (based on past registration and S-curve for future registration)
As in the BaU-sc Increased xEV market share (based on (European Commission, 2020c)
As in the IM-sc
Unknown whereabouts
A linear decrease from 39.6 % in 2015 to 35 % in 2050
It is assumed that there are no unknown whereabouts before 2015 and that there will be a linear decrease from 34 % in 2015 to 30 % in 2050
A linear decrease from 39.6 % in 2015 to 10 % in 2050
Unknown whereabouts of xEVs are decreasing linearly from 24 % (2015) to 5 % (2050)
As in the BaU-sc As in the IR-sc
EoL practices Recycling: 76 % of collected vehicles are addressed to recycling (constant from 2015 to 2050)
Recovery: 4 % of collected vehicles are addressed to recovery (constant from 2015 to 2050)
Reuse: 8 % of collected vehicles are addressed to direct reuse (constant from 2015 to 2050)
Recycling: 76 % of collected vehicles are addressed to recycling (constant from 2015 to 2019); a linear increase to 80 % will then occur
Recovery: 4 % of collected vehicles are addressed to recovery (constant from 2015 to 2050)
Reuse: 8 % of collected vehicles are addressed to direct reuse (constant from 2015 to 2019); a linear increase to 9 % will then occur
As in the BaU-sc
As in the IR-sc
Mobility system Occupancy rate constant As in the BaU-sc Increase in occupancy rate (available parameter in the model)
Higher number of kilometres travelled per year
As in the IM-sc
Source: Own elaborations.
38
2.2.4. Focus on components and materials
The developed models were used to assess the potential benefits of remanufacturing, and with this goal and the available information in mind part of the study focused on relevant components and materials in the automotive sector.
The selected case study component is electric motors. Electric motors are key in the transition towards a higher uptake of xEVs. In addition, CRMs are embedded in electric motors, especially in PMs (e.g. REEs); furthermore, their lifetime at normal operating conditions can reach 20 years (Krishnan, 2018), which means that they can serve the whole life of a vehicle. Moreover, electric motors are similar to starters and generators from a technological perspective; hence technical change in the type of vehicle will have a low impact on the remanufacturing of electric motors (Rematec, 2020; Toptas and Fekete, 2019; Weiland, 2019). From a materials perspective, PMs used in electric motors are commonly ferro-neodymium magnets (Nd(Dy)FeB), which embed the following REEs: neodymium and dysprosium (EC, 2020b; Nordelöf et al., 2018; Pavel et al., 2017). Although for such a PM a significant degradation is not observed over the whole lifetime of the electric motor, currently the demand for used PM is almost null (Van Hout, 2018). For the assessment, according to Van Hout (2018), it is assumed that electric motors are remanufactured without extracting the PMs; if the electric motor cannot be remanufactured, PMs can be extracted and reused (30) in new vehicles.
Based on Nordelöf and Tillman (2018), who provided a scalable inventory, the mass of the electric motor for each segment of xEVs was calculated. From the calculations, and as an input for the analysis, it is considered that PMs weight on average 1.12 kg, and they contain 0.29 kg of neodymium and 0.04 kg of dysprosium, which account for 26 % and 4 % of the PM mass, respectively.
2.3. Projection of the EU fleet and ELV generation
The projection of the EU automotive fleet is a subject that has been thoroughly researched, and different modelling methods with advantages and drawbacks are available in the literature (Choi et al., 2018; Daziano and Chiew, 2012; Harrison et al., 2016; Silvia and Krause, 2016; Trost et al., 2017) . In this respect, there is an abundance of data related to fleet projections, including studies and models that have been created and are regularly updated to capture accurate predictions (Di Persio et al., 2020).
The SMART model uses fleet sales projection data from available data in the literature (31) as the base dataset for vehicle– powertrain mix, which can be then altered using a consumer choice model based on neural networks (Marques dos Santos et al., 2020). This model has inputs related to the characteristics of ICEVs and xEVs (e.g. driving range, cost per kilometre, purchase price, time to refuel/recharge) and gives, as an output, the percentage of users who choose to buy ICEVs (including mild hybrids) or xEVs (including HEVs, PHEVs and BEVs). Figure 21 shows an example of the fleet sales projection by changing xEV purchase price and xEV range.
(30) In this case, we assume a linear increase in the extracted PMs that are directly reused (a linear increase from 7.92 % to
10 % between 2020 and 2050 for the BaU-sc and the IM-sc and from 7.92 % to 25 % for the IR-sc and the CM-sc).
(31) Between 1990 and 2018, data are derived from consolidated registration by country provided by the ACEA (ACEA, 2018a). Then, data were derived from Erich (2018).

39
Figure 21: Example of SMART model sales projection: (a) moderate xEV adoption; (b) slow xEV uptake; (c) fast
xEV uptake
Source: Own elaborations.
ELV flows and vehicles in stock are calculated based on a Weibull distribution, as previously described in Section 2.2.3. The Weibull distribution is used to calculate the probability of a vehicle reaching the end of its life according to how many kilometres it has travelled. Figure 22 shows the Weibull distribution used for the model ELV calculations.
The steps to calculate stock and ELVs are as follows.
— Vehicle sales are used, including historic values starting from 1980.
— Average kilometres travelled per year is another input, including historic values starting from 1980.
— Weibull distribution shape and scale are defined.
— Using the Weibull distribution, for each year, starting from 1980, ELVs and stock are calculated based on the stock (and their kilometres travelled) from the previous years (0 for the starting year in the calculation) and the number of vehicles POM (sales).
— A table is created relating to each year’s stock with vehicles POM for all the previous years. A similar table for ELVs is also stored.
— The ELV flows and stock in a given year are the sum of the individual values related to each of the previous years.

40
Figure 22: Weibull distribution probability density and cumulative probability based on vehicle kilometres
Source: Own elaborations.
The SMART model takes into consideration the period 2011 – 2050. However, to obtain proper results from the calculation in this time period, it is important to use much earlier data; hence the calculation starts in 1980. Figure 23 shows the stock and ELV data calculated using the BaU-sc sales.
Figure 23: Internal combustion engine vehicles (ICEV) and electric vehicles (xEV) stock and end-of-life (ELV) data
(right)
Source: Own elaborations.
The goal of the SMART project required a more in-depth analysis of different segments of vehicles, one focusing on flows of components and materials throughout the various processes in the value chain of vehicles. Hence, based on the data provided by the neural network analysis (i.e. flows of sales and ICEV and xEV ELVs), flows of diesel, petrol, HEVs, PHEVs, BEVs and others (Section 2.2.1) have been estimated. In addition, for each type of vehicle, flows of four segments (as in Section 2.2.1) have been considered to estimate the mass of materials for each vehicle type. More information on the calculations is available in Annex 4. Figure 24 reports the total mass of vehicles POM in the EU and generated as ELVs between 2011 and 2050.

41
Figure 24: Vehicles’ mass placed on the EU market and generated as end-of-life (ELVs) per type of vehicle
Source: Own elaborations.
2.4. Environmental impact assessment
To assess the environmental impacts of the current and future EU fleet, including the effects of extending the lifetime of vehicles through remanufacturing, a MFA and a LCA were adopted.
The necessary background of the assessment is the in-depth understanding (and modelling) of the value-chain of vehicles in the EU (Section 2.4.1). Flows of vehicles, key components and materials are then estimated (Section 2.4.2) according to the set of parameters defined for each of the assessed scenarios (see Section 2.2). The LCA of different types of vehicles is performed at vehicle level (Section 2.4.3) considering four different powertrains (ICEV-petrol, ICEV-diesel, BEVs, PHEVs) (32) and the four segments previously presented (see Section 2.2.1). The results are then extended to the fleet level (Section 2.4.4), to obtain an estimate of the whole EU fleet’s impacts over time.
2.4.1. The value-chain of vehicles in the EU and the MFA model
Based on the information provided in the available literature and by the consulted experts (Chapter 1), Figure 25 reports the developed model of the value-chain of vehicles in the EU, including stocks and flows from the manufacturing of vehicles to their disposal. In the model, the input/output of vehicles and materials along the whole value-chain are included (e.g. the import/export of both vehicles and components), as well as all the EoL options (i.e. reuse, recycling, incineration and landfilling). For almost all the flows in the model, parameters are used so that the model is flexible and updatable; this assures the possibility of not only updating the model with new and more recent data when available, but also creating different scenarios depending on the questions of interest.
(32) HEVs are not directly investigated in this study because of the expected limited deployment of this technology in the future
compared with xEVs and PHEVs (Harrison, 2019).

42
Figure 25: Value-chain of vehicles in the EU
ICEV/xEV, y Share of ‘unknown whereabouts’ in waste generated
recovery Share of ELVs to landfill in treated ELVs
ICEV/xEV, y Share of collected ELVs in waste generated θrecy, ICEV/xEV, y Recycling efficiency
ICEV/xEV, y Share of ELV exports in waste collected θreco, ICEV/xEV, y Recovery efficiency
ICEV/xEV, y Share of ELVs to recycling in treated ELVs σrem, ICEV/xEV, y Share of remanufactured components to new vehicles in the total amount of remanufactured components
recovery, ICEV/xEV, y Share of ELVs to recovery in treated ELVs rem, ICEV/xEV, y Share of ELVs to remanufacturing in treated ELVs
direct reuse, ICEV/xEV, y Share of ELVs to direct reuse in treated ELVs rem, ICEV/xEV, y Share of waste to remanufacturing from ELV pre-treatment

43
Throughout the lifetime of vehicles (the ‘Use phase’ process), vehicles are maintained and some components are replaced with either new (‘New components from the Asian market’) or remanufactured components (‘Remanufactured components’).
The main input flow of the remanufacturing process is represented by components from the ‘Use phase’ process, i.e. from maintenance; a small share of the inputs is provided by ELV components (the ‘ELVs pre-treatment (dismantling)’ process). Although the adoption of remanufactured components in new vehicles is currently null according to experts, such a possibility is included in the system to address its potential development in the future and to assess potential new scenarios (‘Remanufactured components to new vehicles’). Note that, even though they are not represented in the MFA model, core brokers pre-select cores and manage sales on the market, and thus indirectly influence the flows of materials (Weiland, 2019). Less than 5 % of the cores are directly reused, i.e. without being remanufactured (‘Direct reused components’) (Weiland, 2019).
When vehicles are no longer usable, they should be appropriately collected and assigned to EoL treatments. However, every year an important share of ELVs is lost (‘unknown whereabouts’). Collected vehicles can be legally exported (‘ELV exports’) or assigned to ‘ELV pre-treatment’. After the first step of depollution, in which some components are extracted, such as batteries, fluids, windows and tires (Annex 2), the main steps of the disposal route for a vehicle are disassembly, shredding and material treatments (Bobba et al., 2016). In the EU, most of the ELVs collected are assigned to recycling (33). Materials recovered from recycling processes can be recirculated in the automotive sector, e.g. to manufacture new cars (‘Recycled materials’), or in other sectors (‘Recycled materials to other sectors’) depending on the quality needs of the new products.
For the quantitative analysis, the input and parameters adopted are summarised in Table 11.
2.4.2. Stocks and flows of the EU fleet
The stocks and flows of the EU fleet from 2012 to 2050 were quantified for each year. In this section, the most relevant data for 2010, 2020, 2030, 2040 and 2050 are reported.
Figure 26 reports the Sankey diagrams of the flows of the EU fleet in 2020 and 2050 for the more pessimistic and optimistic scenarios, i.e. the BaU-sc and the CM-sc. The main differences that can be seen are in the flows of unknown whereabouts and SRMs from xEVs that are recycled. The decrease in ‘unknown whereabouts’ is visible since 2030 in the CM-sc, when this flow still represents 27 % of the waste generated, corresponding to 4.8 kt of materials. When comparing scenarios, no significant differences are observed concerning remanufacturing flows, even though in terms of absolute values the amount of recirculated materials is quite important (150 kt in 2012), especially in the event that the aftermarket demand is mainly addressed through remanufactured products in the EU (i.e. not from third countries).
(33) 75 % on average. Own estimation based on Eurostat data (data code: env_waselvt) (Eurostat, 2019).
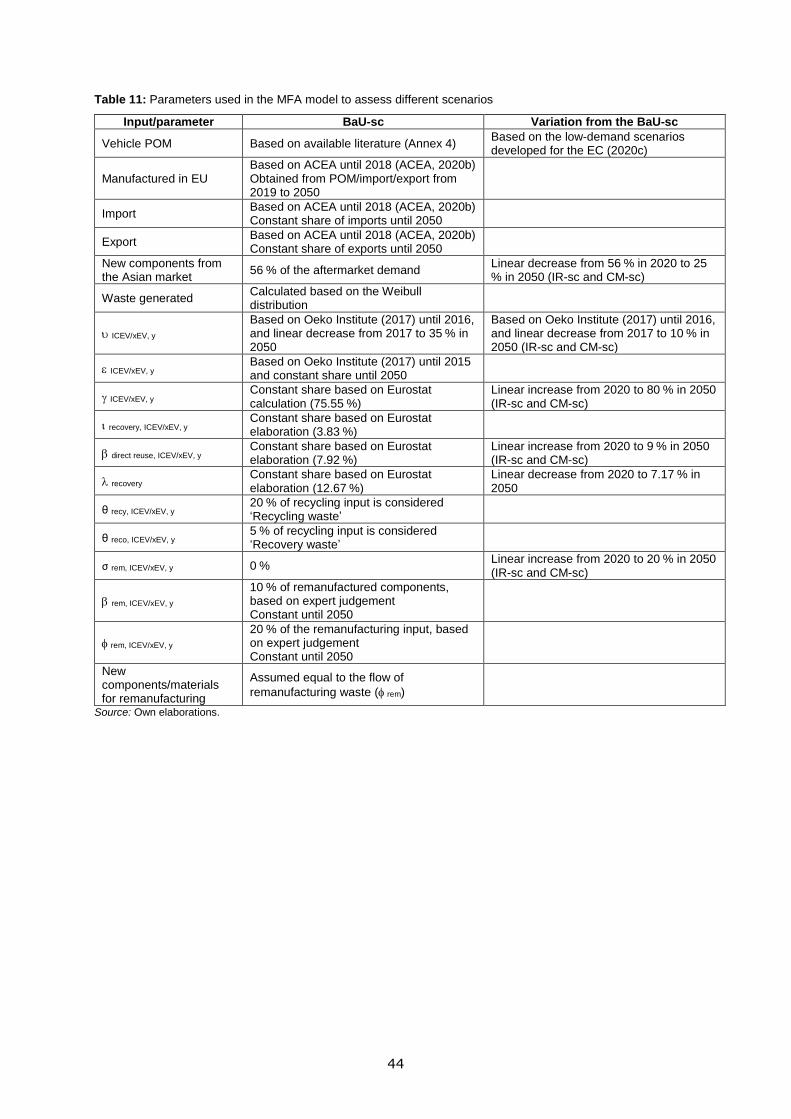
44
Table 11: Parameters used in the MFA model to assess different scenarios
Input/parameter BaU-sc Variation from the BaU-sc
Vehicle POM Based on available literature (Annex 4) Based on the low-demand scenarios developed for the EC (2020c)
Manufactured in EU Based on ACEA until 2018 (ACEA, 2020b) Obtained from POM/import/export from 2019 to 2050
Import Based on ACEA until 2018 (ACEA, 2020b) Constant share of imports until 2050
Export Based on ACEA until 2018 (ACEA, 2020b) Constant share of exports until 2050
New components from the Asian market
56 % of the aftermarket demand Linear decrease from 56 % in 2020 to 25 % in 2050 (IR-sc and CM-sc)
Waste generated Calculated based on the Weibull distribution
ICEV/xEV, y
Based on Oeko Institute (2017) until 2016, and linear decrease from 2017 to 35 % in 2050
Based on Oeko Institute (2017) until 2016, and linear decrease from 2017 to 10 % in 2050 (IR-sc and CM-sc)
ICEV/xEV, y Based on Oeko Institute (2017) until 2015 and constant share until 2050
ICEV/xEV, y Constant share based on Eurostat calculation (75.55 %)
Linear increase from 2020 to 80 % in 2050 (IR-sc and CM-sc)
recovery, ICEV/xEV, y Constant share based on Eurostat elaboration (3.83 %)
direct reuse, ICEV/xEV, y Constant share based on Eurostat elaboration (7.92 %)
Linear increase from 2020 to 9 % in 2050 (IR-sc and CM-sc)
recovery Constant share based on Eurostat elaboration (12.67 %)
Linear decrease from 2020 to 7.17 % in 2050
θrecy, ICEV/xEV, y 20 % of recycling input is considered ‘Recycling waste’
θreco, ICEV/xEV, y 5 % of recycling input is considered ‘Recovery waste’
σrem, ICEV/xEV, y 0 % Linear increase from 2020 to 20 % in 2050 (IR-sc and CM-sc)
rem, ICEV/xEV, y
10 % of remanufactured components, based on expert judgement Constant until 2050
rem, ICEV/xEV, y
20 % of the remanufacturing input, based on expert judgement Constant until 2050
New components/materials for remanufacturing
Assumed equal to the flow of
remanufacturing waste ( rem)
Source: Own elaborations.
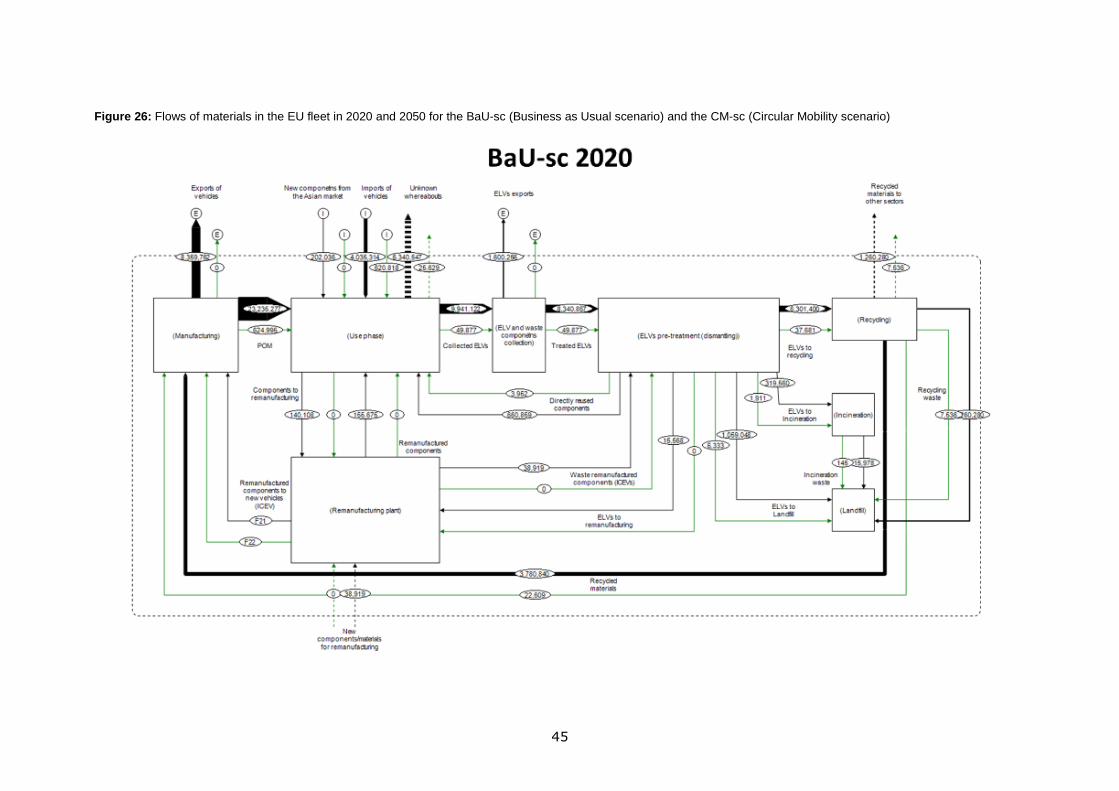
45
Figure 26: Flows of materials in the EU fleet in 2020 and 2050 for the BaU-sc (Business as Usual scenario) and the CM-sc (Circular Mobility scenario)

46

47

48

49
The results show that, because of the decrease in ‘unknown whereabouts’, in 2050 more than 5 000 kt of materials embedded in vehicles, compared with 600 kt in 2020, can be maintained in the EU, kt and can be appropriately collected and addressed to EoL treatments. The collection rate then increases: for the BaU-sc, the collection rate slightly increases from 61 % in 2020 to 67 % in 2050, and for the CM-sc it reaches 92 % in 2050 (Figure 27). Furthermore, there is a significant improvement in the materials available for recycling (+400 kt in 2020 and +5 000 kt in 2050 for the CM-sc, compared with the BaU-sc flows).
The effects on recycling were estimated through the EoL Recycling Input Rate (EoL-RIR) and the EoL Recycling Rate EoL-RR (Blengini et al., 2017). The RR (the stars in Figure 28) is increasing for all scenarios, especially for the CM-sc, because of an improved collection rate (decrease in unknown whereabouts) and improved recycling. Similarly for the RIR, the index for the BaU-sc increases from 11 % in 2020 to 19 % in 2050; although the RIR for the CM-sc in 2020 is similar to the RIR for the BaU-sc, it reaches 27 % in 2050. This corresponds to an increased amount of almost 400 kt of materials recovered in 2020 for the CM-sc compared with the BaU-sc (and 4 500 kt in 2050) (Figure 28).
Aftermarket demand accounted for less than 2 % of POM vehicles in 2020. Considering the increase in the aftermarket that can be projected given the increase in the stock (34), the flow of remanufactured components will increase to at least 8 % in 2050 (5 % due to ICEVs and the remainder to xEVs). This figure increases to up to 11 % in the CM-sc (more xEVs and improved remanufacturing). Remanufactured components account for about half of the aftermarket flow in the BaU-sc, corresponding to 160 kt of materials in 2020 and almost 300 kt in 2050 (of which 200 kt is from ICEVs). In the CM-sc, in which a strong improvement in remanufacturing in the EU is considered, materials in the remanufactured flows exceed 700 kt in 2050 (of which about 300 kt is provided by xEVs). This quantity of materials corresponds to more than 8 % of the materials POM in the same year. Note that, in this case, the majority of the materials are recirculated in the EU fleet, with a smaller amount (120 kt) assumed to be used to manufacture new cars kt(Figure 29).
In addition, if remanufactured components are used to manufacture new vehicles, it is estimated that, in 2030, in the IR-sc, ktit may be possible to recirculate about 16 kt of materials in ICEVs (i.e. less than 0.5 % of POM ICEVs); this will increase in 2050 up to 66 kt for ICEVs and 43 kt for xEVs (i.e. about 1 % and 0.5 % of the POM ICEVs and xEVs, respectively). In the case of more optimistic scenarios, such as the CM-sc, the benefit is slightly higher: 38 kt and 54 kt for ICEVs and EVs, respectively.
It should be noted that, in the absence more reliable and detailed data of some flows, including remanufacturing volumes, it is quite complex to understand which components and materials are involved in such a process.
(34) That is it is assumed that the manufacturing market will remain constant in the future.

50
Figure 27: Flow of materials of the unknown whereabouts (top) and collection rate (bottom) in the BaU-sc
(Business as Usual scenario) and the CM-sc (Circular Mobility scenario) in different years
Source: Own elaborations.
Figure 28: Flow of materials available for recycling (top) and EOL-RIR/RR (bottom) in the BaU-sc (Business as
Usual scenario) and the CM-sc (Circular Mobility scenario) in different years
Source: Own elaborations.
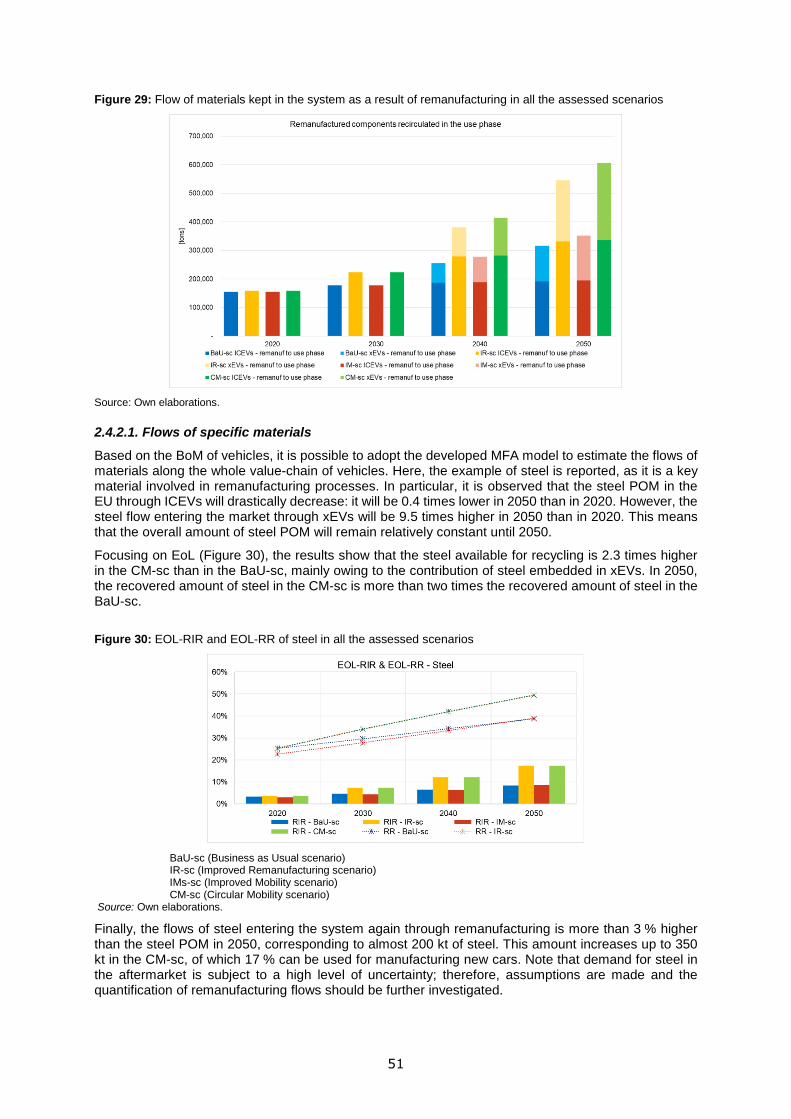
51
Figure 29: Flow of materials kept in the system as a result of remanufacturing in all the assessed scenarios
Source: Own elaborations.
2.4.2.1. Flows of specific materials
Based on the BoM of vehicles, it is possible to adopt the developed MFA model to estimate the flows of materials along the whole value-chain of vehicles. Here, the example of steel is reported, as it is a key material involved in remanufacturing processes. In particular, it is observed that the steel POM in the EU through ICEVs will drastically decrease: it will be 0.4 times lower in 2050 than in 2020. However, the steel flow entering the market through xEVs will be 9.5 times higher in 2050 than in 2020. This means that the overall amount of steel POM will remain relatively constant until 2050.
Focusing on EoL (Figure 30), the results show that the steel available for recycling is 2.3 times higher in the CM-sc than in the BaU-sc, mainly owing to the contribution of steel embedded in xEVs. In 2050, the recovered amount of steel in the CM-sc is more than two times the recovered amount of steel in the BaU-sc.
Figure 30: EOL-RIR and EOL-RR of steel in all the assessed scenarios
BaU-sc (Business as Usual scenario) IR-sc (Improved Remanufacturing scenario) IMs-sc (Improved Mobility scenario) CM-sc (Circular Mobility scenario)
Source: Own elaborations.
Finally, the flows of steel entering the system again through remanufacturing is more than 3 % higher than the steel POM in 2050, corresponding to almost 200 kt of steel. This amount increases up to 350 kt in the CM-sc, of which 17 % can be used for manufacturing new cars. Note that demand for steel in the aftermarket is subject to a high level of uncertainty; therefore, assumptions are made and the quantification of remanufacturing flows should be further investigated.

52
The results here are shown to test the potentialities of the developed model. A more detailed estimation of the flows of materials kept in the system through remanufacturing requires more information on the components in which such materials are embedded. The MFA model was also used for this reason, to quantify the flows of specific materials in specific components for which information are available or for which it is possible to make a more robust assumption, e.g. REEs in PMs (Bobba et al., 2020b).
2.4.3. Life Cycle Assessment of powertrain models
2.4.3.1 Context
In 2019, the European Commission committed to the EU objective of climate neutrality by 2050. However, the 2030 GHG emissions reduction target of at least 40 % (compared with 1990 levels) was agreed before the EU climate neutrality objective was adopted and is based on a less ambitious pathway. Thus, in September 2020 the European Commission proposed a plan (EC, 2020e) to reduce EU greenhouse gas emissions by at least 55 % by 2030, compared with 1990 levels. This level of ambition for the next decade will put the EU on a balanced pathway to reaching climate neutrality by 2050, as presented in Figure 32. This work is based on the European Commission’s in-depth analysis, which was carried out in support of the Communication ‘A clean planet for all’ (EC, 2018a) detailing the climate neutrality objective.
Figure 31: Proposed EU’s pathway to sustained climate neutrality, 1990–2050
Note: GDP, Gross Domestic Product
Source: EU climate target plan 2030 (European Commission, 2020e).
As it currently contributes 75 % of total GHG emissions in the EU, the energy sector is central to the achievement of the 55 % reduction in GHG emissions by 2030. The shift to a less carbon-intensive energy system has a direct influence on the GHG emission reductions related to electric mobility systems. According to the European Commission’s forecast scenarios (EC, 2020f), CO2 emissions from passenger transport will decline by around 15 % by 2030 compared with 2015. The largest contributor in this sector is expected to be passenger cars, with emissions expected to decline by 27 %, driven by vehicle efficiency standards. In addition, the International Resources Panel estimates that GHG emissions from the material cycle of passenger cars in 2050, considering their production, use and disposal, could be reduced by up to 70 % in Group of Seven (G7) (35) countries through smart mobility practices such as ride sharing and car sharing, and a shift towards trip-appropriate smaller cars (Hertwich et al., 2020).
In addition, the relevance of assessing life-cycle impacts in the automotive sector is emphasised by the fact that, on 3 October 2018, the European Parliament announced that car manufacturers, from 2020, would be required to communicate the life-cycle impacts of vehicles (36).
(35) The G7 is an intergovernmental organisation consisting of Canada, France, Germany, Italy, Japan, the United Kingdom and
the United States. (36) ‘Amendments adopted by the European Parliament on 3 October 2018 on the proposal for a regulation of the European

53
Consequently, we proposed in this section a simplified LCA study focusing on the comparison of passenger car powertrain models (ICEV-petrol, ICEV-diesel, xEVs, PHEV). Only GWP100 (37) results are compiled in the report and reflect the importance of climate target policies carried out by the European Commission (38). The goal of the LCA is also to highlight the influence of the Green Deal adoption in terms of CO2 savings in the different passenger car categories. The results obtained in this section are then extended to the whole vehicle fleet (see Section 2.4.4).
2.4.3.2. LCA goal and scope
The goal of the study is to compare the GWP-related impacts of four different vehicles powertrains. For each of the powertrains, four segments are assessed based on the average mass of vehicles presented in Section 2.2.1. As a result, there are 16 different product systems. Here, we focus our analysis on the manufacturing, use phase and maintenance stages of the life-cycle. The vehicles’ EoL scenarios are disregarded for the moment and will be included beyond the SMART project in a further dedicated analysis (39).
The selected functional unit is ‘1 km driven by a vehicle averaged along its mileage and at a certain period of time’. This means that impacts related to the manufacturing phase will be scaled per kilometre travelled for each of the selected powertrains and segments. With regard to the use phase, the average fuel/energy consumption per kilometre presented Section 2.2.2 is attributed to each powertrain and segment; in addition, the maintenance phase is also scaled per kilometre. The fuel/energy consumptions adopt a well-to-wheel approach. The system boundaries are presented in Figure 32. The final outcome of the LCA study is the carbon footprint of the vehicle considering the manufacturing and use phases expressed in kg CO2eq per kilometre travelled (kg CO2eq/km).
Figure 32: System boundaries for the LCA
The lifetime distance travelled by each type of car category is presented in Table 12.
Parliament and of the Council setting emission performance standards for new passenger cars and for new light commercial vehicles as part of the Union’s integrated approach to reduce CO2 emissions from light-duty vehicles and amending Regulation (EC) No 715/2007 (recast) (COM(2017)0676 – C8-0395/2017 – 2017/0293(COD))’ (European Parliament,
2018). (37) Radiative forcing as GWP100 based on IPCC (2013). (38) Other impact categories can be addressed by the developed LCA; however, more efforts are still needed and some work is
still ongoing. (39) A cut-off modelling for the EoL is adopted in the first approach without allocating any environmental impacts or benefits to
this stage.
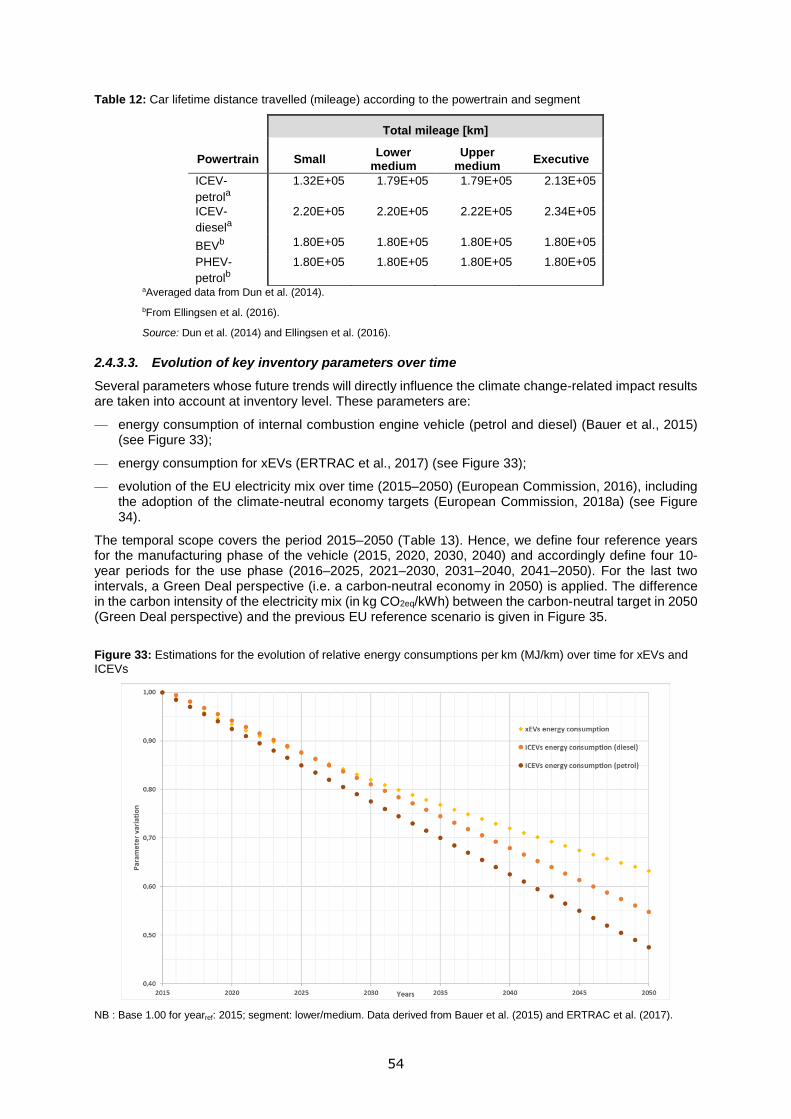
54
Table 12: Car lifetime distance travelled (mileage) according to the powertrain and segment
Total mileage [km]
Powertrain Small Lower
medium Upper
medium Executive
ICEV-
petrola
1.32E+05 1.79E+05 1.79E+05 2.13E+05
ICEV-
diesela
2.20E+05 2.20E+05 2.22E+05 2.34E+05
BEVb 1.80E+05 1.80E+05 1.80E+05 1.80E+05
PHEV-
petrolb
1.80E+05 1.80E+05 1.80E+05 1.80E+05
aAveraged data from Dun et al. (2014).
bFrom Ellingsen et al. (2016).
Source: Dun et al. (2014) and Ellingsen et al. (2016).
2.4.3.3. Evolution of key inventory parameters over time
Several parameters whose future trends will directly influence the climate change-related impact results are taken into account at inventory level. These parameters are:
— energy consumption of internal combustion engine vehicle (petrol and diesel) (Bauer et al., 2015) (see Figure 33);
— energy consumption for xEVs (ERTRAC et al., 2017) (see Figure 33);
— evolution of the EU electricity mix over time (2015–2050) (European Commission, 2016), including the adoption of the climate-neutral economy targets (European Commission, 2018a) (see Figure 34).
The temporal scope covers the period 2015–2050 (Table 13). Hence, we define four reference years for the manufacturing phase of the vehicle (2015, 2020, 2030, 2040) and accordingly define four 10-year periods for the use phase (2016–2025, 2021–2030, 2031–2040, 2041–2050). For the last two intervals, a Green Deal perspective (i.e. a carbon-neutral economy in 2050) is applied. The difference in the carbon intensity of the electricity mix (in kg CO2eq/kWh) between the carbon-neutral target in 2050 (Green Deal perspective) and the previous EU reference scenario is given in Figure 35.
Figure 33: Estimations for the evolution of relative energy consumptions per km (MJ/km) over time for xEVs and
ICEVs
NB : Base 1.00 for yearref: 2015; segment: lower/medium. Data derived from Bauer et al. (2015) and ERTRAC et al. (2017).

55
Source: Own elaborations.
Table 13: Year of the car manufacturing and period of use
Temporal scope (year)
Manufacturing Use phase
2015a 2016–2025b
2020b 2021–2030b
2030b,c 2031–2040b,c
2040b,c 2041–2050b,c aThe electricity mix forecasts are retrieved from ENTSO-E (2016).
bThe electricity mix forecasts are retrieved from European Commission (2016).
cThe electricity mix forecasts are retrieved from European Commission (2018a).
Figure 34: Trends in EU electricity production mix by source according to the references presented in Table 12
Figure 35: Carbon intensity of the EU electricity mix (medium voltage) adapted from current ecoinvent datasets – kg CO2eq/kWh produced (based on references presented in Table 12)
** Green Deal perspective

56
Source: Own elaborations.
2.4.3.4. Life Cycle Inventory (LCI)
The inventory data are compiled from the existing inventories published in the literature. The car product system is modelled as an assembly of the subsystems adapted from Hawkins et al. (2013) and presented in Table 13. The segment of reference is the lower medium one. With regard to the manufacturing phase (vehicle production), the inventory systems for the other vehicle segments are scaled according to the mass ratios presented in Table 14, which are based on the values presented in Table 5. These scaling factors are also used for the maintenance operations during the use phase. The energy consumption throughout the lifetime of the vehicle is modelled according to (1) the consumption per kilometre for each segment and powertrain obtained from Tables 6 and T7; and (2) the car total mileage presented in Table 12. The elementary flows are directly retrieved or adapted from the ecoinvent version 3 database using Simapro 9.1 software.
Sensors for CAVs are not taken into account in the framework of this study but could also be included. The Life Cycle Inventory of such devices with associated potential savings regarding fuel/energy consumption can be adapted from Gawron et al. (2018).
Table 14: Inventory subsystems for car manufacturing and use phase
(*) Similar to an EM57 motor (2018), with the following parameters 110 kW – 320 Nm – 55.6 kg.
(**) xEV battery sizing: 30 kWh, PHEV battery sizing based on Cusenza et al. (2019), 11.4 kWh.
Source: a – (Hawkins et al., 2013); b – (Nordelöf and Tillman, 2018); c – Corrigendum to: Hawkins et al. (2013); d – (Cusenza et
al., 2019); e – (Ellingsen et al., 2016); f – (Dun et al., 2014); g – (Simons, 2016); h – (Plötz et al., 2018); i – (Bauer et al., 2015), j
– (Nordelöf et al., 2019)
Ref. Unit
ICEV
petrol
ICEV
diesel
BEV
NCM
PHEV
petrol
Body and doorsa 1p 1 1 1 1
Brakes frictiona 1p 1 1 1 1
Chassisa 1p 1 1 1 1
Interior and exteriora 1p 1 1 1 1
Tires and wheelsa 1p 1 1 1 1
Internal combustion enginea 1p 1 1 0 1
ICEV powertraina 1p 1 1 0 1
ICEV Transmissiona 1p 1 1 0 1
ICEV fluidsa 1p 1 1 0 1
Battery (PbA, lead acid)a 1p 1 1 0 1
Electric motor with Nd permanent magnet b,j, (*) 1p 0 0 1 1
xEV powertrain, Controllera 1p 0 0 1 1
xEV powertrain, Inverterc 1p 0 0 1 1
xEV powertrain, Chargerc 1p 0 0 1 1
xEV transmissiona 1p 0 0 1 1
Lithium battery, NCM chemistryd, (**) kg battery 0 0 314 175
Fluids, ICEV & xEVa 1p 1 1 1 1
Final_Assemblya 1p 1 1 1 1
Total petrol consumption, euro5, mileage (km) 1,79E05f,g,i MJ 4,1E+05 0 0 0
Total diesel consumption, euro5, mileage (km) 2,2E05f,g,i MJ 0 4,4E+05 0 0
Total electricity for BEV charge, low voltage (ENTSO-E), mileage (km) 1,8E05e MJ 0 0 1,1E+05
Total energy use for PHEV, 60% electric consumption, mileage (km) 1,8E05h MJ 0 0 0 2,3E+05
Use phase, ICEV and xEV, maintenanceg km 1,80E+05 2,20E+05 1,80E+05 1,80E+05
Segment B/C - lower mediumInventory subsystems for the total lifetime of the vehicle
Blue: non-specific parts / red: internal combustion-related part / yellow: electric
powertrain-related parts
Ve
hic
le p
rod
uct
ion
Op
era
tio
n a
nd
mai
nte
nan
ce
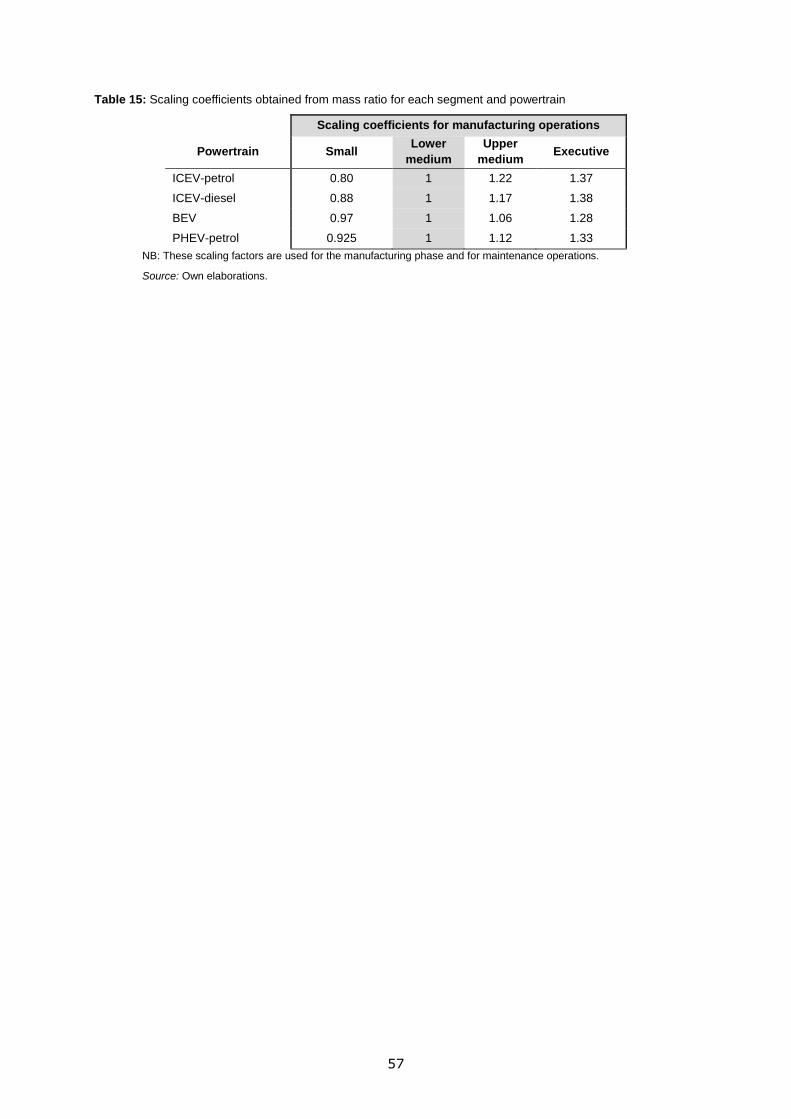
57
Table 15: Scaling coefficients obtained from mass ratio for each segment and powertrain
Scaling coefficients for manufacturing operations
Powertrain Small Lower
medium
Upper
medium Executive
ICEV-petrol 0.80 1 1.22 1.37
ICEV-diesel 0.88 1 1.17 1.38
BEV 0.97 1 1.06 1.28
PHEV-petrol 0.925 1 1.12 1.33
NB: These scaling factors are used for the manufacturing phase and for maintenance operations.
Source: Own elaborations.
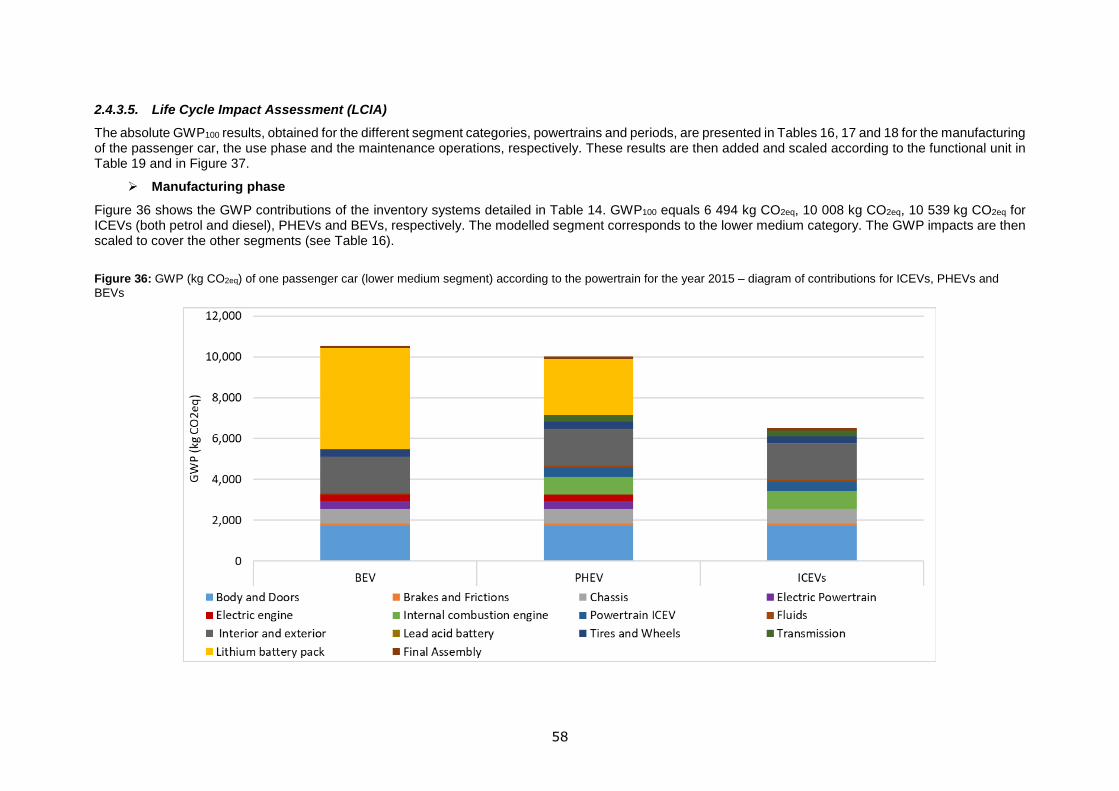
58
2.4.3.5. Life Cycle Impact Assessment (LCIA)
The absolute GWP100 results, obtained for the different segment categories, powertrains and periods, are presented in Tables 16, 17 and 18 for the manufacturing of the passenger car, the use phase and the maintenance operations, respectively. These results are then added and scaled according to the functional unit in Table 19 and in Figure 37.
Manufacturing phase
Figure 36 shows the GWP contributions of the inventory systems detailed in Table 14. GWP100 equals 6 494 kg CO2eq, 10 008 kg CO2eq, 10 539 kg CO2eq for ICEVs (both petrol and diesel), PHEVs and BEVs, respectively. The modelled segment corresponds to the lower medium category. The GWP impacts are then scaled to cover the other segments (see Table 16).
Figure 36: GWP (kg CO2eq) of one passenger car (lower medium segment) according to the powertrain for the year 2015 – diagram of contributions for ICEVs, PHEVs and
BEVs

59
Table 16: Manufacturing phase – GWP100 results (kg CO2eq) according to the segment, powertrain and year of manufacturing
Use phase (full mileage)
Table 17: Use phase – GWP100 results (kg CO2eq) for the total mileage according to the segment, powertrain and period of use
segments small lower med. upper med. executive small lower med. upper med. executive small lower med. upper med. executive small lower med. upper med. executive
scaling factor 0,8 1 1,22 1,37 0,88 1 1,17 1,38 0,97 1 1,06 1,28 0,925 1 1,12 1,33
manuf. year
2015 5195 6494 7922 8896 5714 6494 7598 8961 10222 10539 10702 12924 9258 10008 11209 13311
2020 5118 6397 7805 8764 5630 6397 7485 8828 10139 10452 11079 13379 9159 9902 11090 13170
2030 4921 6151 7504 8426 5413 6151 7196 8488 9925 10232 10846 13097 8908 9631 10786 12809
2040 4800 6000 7320 8219 5280 6000 7020 8279 9794 10097 10702 12924 8755 9464 10600 12588
ICEV petrol ICEV diesel BEV PHEV
small lower med. upper med. exec. small lower med. upper med. exec. small lower med. upper med. exec. small lower med. upper med. exec.
lifetime (yrs)
10 1,32E+05 1,79E+05 1,79E+05 2,13E+05 2,20E+05 2,20E+05 2,22E+05 2,34E+05 1,80E+05 1,80E+05 1,80E+05 1,80E+05 1,80E+05 1,80E+05 1,80E+05 1,80E+05
Diesel share 40%
1,46E-01 1,70E-01 1,85E-01 2,07E-01 Electric share 60%
2016-2025 18639 32494 40054 56428 22432 32154 41181 51539 9704 11299 12345 13758 13162 17300 20881 25118
2021-2030 17116 29838 36780 51815 20857 29897 38291 47922 8032 9352 10282 11387 11643 15394 18698 22512
2031-2040 14068 24525 30232 42590 17708 25384 32510 40687 3235 3767 4192 4587 7735 10566 13152 16065
2041-2050 11021 19213 23683 33365 14560 20870 26729 33453 1379 1605 1809 1955 5591 7792 9831 12119
ICEV diesel BEV PHEV
Total mileageTotal mileage
Utility factor (kWh/km)
Total mileage Total mileage
ICEV petrol

60
Maintenance phase (full mileage)
Table 18: Maintenance operations – GWP100 results (kg CO2eq) for the total mileage according to the segment, powertrain and period of use of the passenger car
GWP100 results per functional unit (kg CO2eq/km) for the manufacturing, use and maintenance phases
Table 19: Manufacturing, maintenance and use phase contribution to GWP100, expressed in (kg CO2eq/km)
small lower med. upper med. executive small lower med. upper med. executive small lower med. upper med. executive small lower med. upper med. executive
lifetime (years)
10 1,32E+05 1,79E+05 1,79E+05 2,13E+05 2,20E+05 2,20E+05 2,22E+05 2,34E+05 1,80E+05 1,80E+05 1,80E+05 1,80E+05 1,80E+05 1,80E+05 1,80E+05 1,80E+05
scaling factor 0,8 1 1,22 1,37 0,88 1 1,17 1,38 0,97 1 1,06 1,28 0,925 1 1,12 1,33
40%
1,46E-01 1,70E-01 1,85E-01 2,07E-01 60%
2016-2025 622 1057 1290 1717 1200 1297 1467 1834 993 1024 1085 1310 988 1038 1126 1215
2021-2030 604 1027 1253 1667 1108 1260 1488 1849 963 993 1053 1271 941 1008 1114 1200
2031-2040 530 901 1099 1463 973 1105 1306 1622 840 866 918 1108 822 881 974 1050
2041-2050 498 847 1033 1375 914 1039 1227 1524 787 811 860 1038 771 827 914 985
ICEV gasoline
Diesel share
Electric share
ICEV diesel EV PHEV
Utility factor (kWh / km)
Total mileage Total mileage Total mileage Total mileage
segments small lower med. upper med. executive small lower med. upper med. executive small lower med. upper med. executive small lower med. upper med. executive
scaling factor (manuf.) 0,8 1 1,22 1,37 0,88 1 1,17 1,38 0,97 1 1,06 1,28 0,925 1 1,12 1,33
mileage (km) 1,32E+05 1,79E+05 1,79E+05 2,13E+05 2,20E+05 2,20E+05 2,22E+05 2,34E+05 1,80E+05 1,80E+05 1,80E+05 1,80E+05 1,80E+05 1,80E+05 1,80E+05 1,80E+05
2015-2025 1,85E-01 2,23E-01 2,75E-01 3,15E-01 1,33E-01 1,82E-01 2,26E-01 2,66E-01 1,16E-01 1,27E-01 1,37E-01 1,59E-01 1,30E-01 1,57E-01 1,85E-01 2,20E-01
2020-2030 1,73E-01 2,08E-01 2,56E-01 2,93E-01 1,25E-01 1,71E-01 2,13E-01 2,50E-01 1,06E-01 1,16E-01 1,25E-01 1,45E-01 1,21E-01 1,46E-01 1,72E-01 2,05E-01
2030-2040 1,48E-01 1,76E-01 2,16E-01 2,47E-01 1,09E-01 1,48E-01 1,85E-01 2,17E-01 7,78E-02 8,26E-02 8,86E-02 1,04E-01 9,70E-02 1,17E-01 1,38E-01 1,66E-01
2040-2050 1,24E-01 1,45E-01 1,79E-01 2,02E-01 9,43E-02 1,27E-01 1,57E-01 1,85E-01 6,64E-02 6,95E-02 7,43E-02 8,84E-02 8,40E-02 1,00E-01 1,19E-01 1,43E-01
time interval
ICEV petrol ICEV diesel BEV PHEV
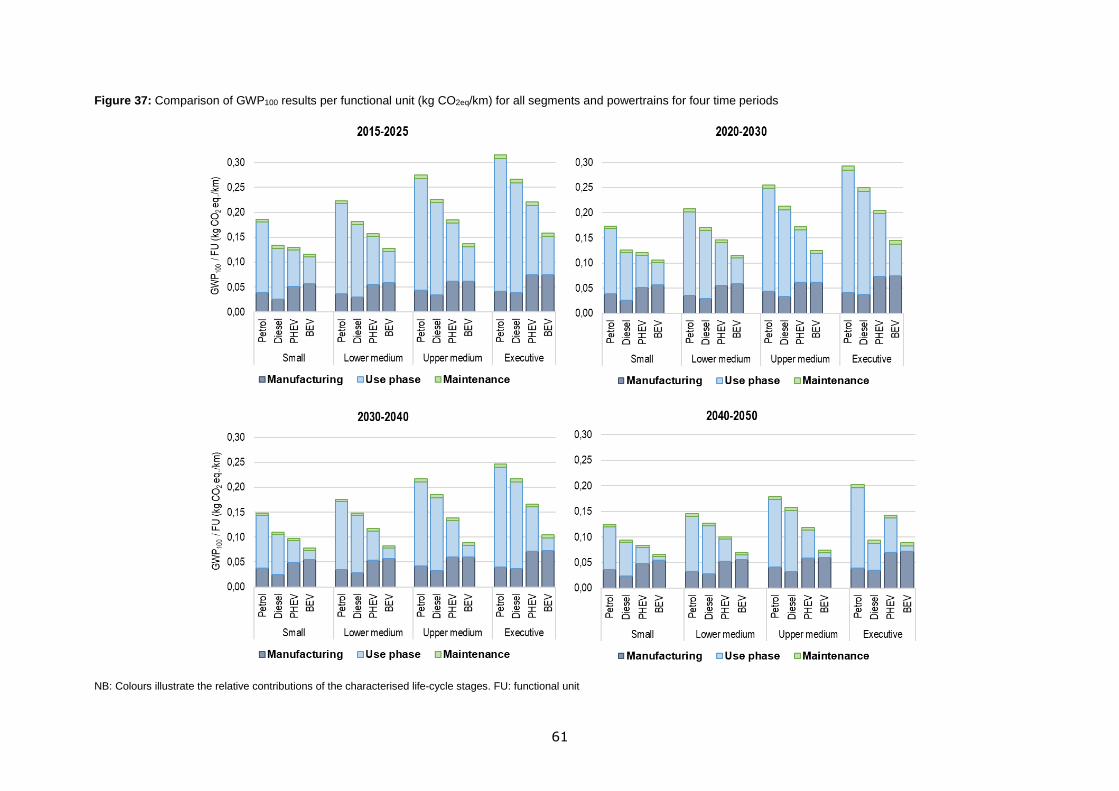
61
Figure 37: Comparison of GWP100 results per functional unit (kg CO2eq/km) for all segments and powertrains for four time periods
NB: Colours illustrate the relative contributions of the characterised life-cycle stages. FU: functional unit

62
2.4.4. MFA and LCA combination to estimate the environmental impacts of the EU fleet and components
Based on the results of the MFA and the LCA, the GWP of the EU fleet was estimated (De Meester et al., 2019).
The GWP of different type of vehicles and different segments, as illustrated in Section 2.4.3, was used to estimate the GWP of the EU fleet between 2010 and 2050. Figure 38 shows that the GWP of the EU fleet is expected to decrease between 2020 and 2050, from about 650,000 kt CO2eq to 300,000 kt CO2eq. The strongest decrease is expected for ICEV-petrol. In addition, it is observed that the most relevant impact decrease between 2020 and 2050 occurs for the flow of small ICEV-diesel (-94 %), followed by the flow of small ICEV-petrol; however, the most relevant increase in impacts due to xEVs is related to flows of small and upper medium PHEVs.
Figure 38: Life-cycle GWP (Global Warming Potential) for the BaU-sc (Business as Usual scenario) in different
years
Source: Own elaborations.
To estimate the potential benefits of extending the lifetime of vehicles through different strategies (e.g. remanufacturing), an initial analysis on the potential GWP related to longer-lasting vehicles in the system was developed. It was then assumed that, from 2020, the lifetime of vehicles would increase up to 25 % of the current lifetime in 2050, following a linear trend. This turns into an increase in the mileage (up to 25 % in 2050 compared with the BaU-sc considering a fixed lifetime) and a consequent increase in the GWP not only in the use phase of vehicles, but also in the maintenance and potential repair/remanufacturing phases. At vehicle level, the impact per kilometre slightly decreases, as shown in Figure 39.

63
Figure 39: Comparison between the GWP (Global Warming Potential) per kilometre in the BaU-sc (Business as
Usual scenario) considering a fixed lifetime (left graph) and the GWP per kilometre in the BaU-sc with an increased lifetime (right graph)
Source: Own elaborations.
Figure 40: Life-cycle GWP (Global Warming Potential) in the BaU-sc (Business as Usual scenario) in different
years and with an increase in the lifetime of vehicles of 25 %
Source: Own elaborations.
2.4.5. LCA and MFA of specific components: the electric motor case-study
As mentioned in Section 2.2.4, the component analysis focused on electric motors and, as far as materials are concerned, REEs embedded in PMs are of interest as they are listed among CRMs (EC, 2020d).
Inventory data to estimate the weight of electric motors and the embedded materials is based on Nordelöf and Tillman (2018). Inventory data for Dysprosium oxide and Neodymium, as well as allocation

64
procedures for steel and aluminium scrap comes from the updated datasets proposed in Nordelöf et al. (2019). On average, it is assumed that electric motors weigh about 20 kg, 34 kg and 60 kg for HEVs, PHEVs and BEVs, respectively, and that PMs embedded in electric motors are about 3 % of the weight of the electric motor. Note that, for the analysis, it is assumed that all the PMs are ferro-neodymium PMs. The LCA and the MFA models previously illustrated are used to estimate the impact of electric motors on the current and future EU fleet, and on the flows of CRMs embedded in PMs.
As illustrated in Figure 36, the GWP of an electric motor is lower than 350 kg CO2eq. The main contributors to such an impact are materials production (namely copper, aluminium and steel); the production of the PM account for about 16% of the GWP (Figure 41).
Figure 41: GWP (Global Warming Potential) of electric motors (lower medium segment) for different years
NB: The following parameters are applied: 110 kW – 320 Nm – 55.6 kg (BEV)
Source: Own elaborations. Inventory retrieved from (Nordelöf et al., 2019; Nordelöf and Tillman, 2018)
This mean that extending the lifetime of electric motors by remanufacturing would be expected to lead to a significant gain in terms of GWP. According to the literature, as remanufacturing can reduce the energy required for manufacturing by 80 % and the use of virgin materials by around 50 %, the GWP of remanufactured electric motors is about half that of new manufactured electric motors (Figure 42).
Figure 42: GWP (Global Warming Potential) of electric motors (lower medium segment) with and without
remanufacturing
Source: Own elaborations.
The results of the MFA show that, as expected, the biggest improvements are achieved under the IR-sc and the CM-sc, in both of which EoL management has improved. In the IM-sc, 87 kt of materials embedded in electric motors will be lost in 2050 (red bar in Figure 43), i.e. 15 kt more than in the BaU-sc; this is because, in the IM-sc, the flows of electric motors POM will increase but the flow of unknown whereabouts will not. On the contrary, the decrease in ‘unknown whereabouts’ (in the IR-sc and the CM-sc) allows about 60 kt of additional materials to be kept in the system in 2050 compared with the BaU-

65
sc. The improved collection of electric motors through the decreasing flow of ‘unknown whereabouts’ turns into an increasing flow of electric motors available for recycling: the additional materials available for recycling in the IR-sc and the CM-sc, compared with the BaU-sc, in 2050 amount to 39 tons and 56 tons, respectively. The flow of materials in remanufactured components in the BaU-sc represents 3.8 % of the flow of POM materials in 2050. This share increases in the CM-sc up to 7.4 % in the same year. Note that 4 kt of remanufactured materials in the CM-sc is used in new vehicles, and in all scenarios the flow of materials in remanufactured components will start to become apparent only after 2030.
Figure 43: Materials embedded in electric motors not collected due to ‘unknown whereabouts’ in different years
Source: Own elaborations.
The demand for neodymium in 2050 will range between 2.9 kt and 3.5 kt, which is aligned with the literature (e.g. EC, 2020c). Similarly, demand for dysprosium for electric motors is estimated to range between 450 tons and 550 tons; these values are also aligned with the literature, even though in some optimistic scenarios for electro mobility amounts are even higher. For instance, the high scenario of the recent JRC report (EC, 2020b) estimates a much higher demand for dysprosium in 2050, mainly owing to a higher content of dysprosium in the assumptions.
Focusing on recycling, currently only around 1 % of the REEs are recycled from end products, with the rest being sent to landfill and being removed from the materials cycle (Binnemans et al., 2013; Jowitt et al., 2018). This is reflected in the BaU-sc, in which the neodymium available for recycling is about 30 % of the neodymium demand in 2050, whereas the amount recovered is almost null, which means that secondary neodymium does not contribute to the neodymium demand in the future. In the event of improved EoL and mobility, i.e. in the CM-sc, almost all the neodymium available for recycling is recovered as secondary material and kept in the EU. This amount represents 31 % of the demand for neodymium for PMs in electric motors, i.e. about 1 kt. Note that the quality of secondary neodymium should be further investigated to estimate the flow of secondary neodymium recirculated in a closed loop, i.e. again in PMs. A similar situation is observed for the dysprosium: in the more optimistic scenario, i.e., in the CM-sc, 122 tons of dysprosium is recovered as SRMs in 2050, whereas almost no dysprosium is available for recycling in the BaU-sc. In both scenarios, the improved collection rate and the consequent decrease in unknown whereabouts allow 450 tons of neodymium and 70 tons of dysprosium to be kept in the system.

66
Figure 44: Neodymium embedded in electric motors available for recycling and recovered in different years
Source: Own elaborations.
Figure 45: Dysprosium embedded in electric motors available for recycling and recovered in different years
10
Source: Own elaborations.

67
Similar to the fleet (see Figure 38 and Figure 40), the MFA and LCA results were combined so that it was possible to estimate the potential GWP of electric motors in the EU fleet between 2010 and 2050. Figure 46 shows the GWP of newly manufactured electric motors in the EU fleet in different years. A decrease in the carbon intensity of the electricity mix in the near future (see Figure 35) is assumed and the same GWP impact is estimated for both BEV and PHEV electric motors. Note that the similar GWP in both 2040 and 2050 is mainly due to the saturation level of the S-curve adopted in the projection of the EU fleet.
Figure 46: GWP (Global Warming Potential) of electric motors in the EU fleet for different years considering all
motors newly manufactured
Source: Own elaborations.
To estimate the potential benefits related to the adoption of remanufactured electric motors in place of new ones, the same procedure as illustrated in section 2.4.4. was adopted (i.e. from 2020, it was assumed that the lifetime of vehicles would increase up to 25 % of the current lifetime in 2050, following a linear trend). The results (Figure 47) show that the impact of electric motors in the EU will slightly decrease: in 2050, the GWP associated with the manufacturing of electric motors (of which 30 % are remanufactured) is about half a ton of CO2eq lower than the impact in 2050 if no electric motors are remanufactured.
Figure 47: GWP (Global Warming Potential) of electric motors in the EU fleet for different years considering an
increasing share of remanufactured electric motors over time
Source: Own elaborations.

68
2.5. SMART tool – a graphical user interface
There are gaps in how to effectively use and apply models, especially as their complexity grows, with multiple submodel parameters and interactions. In this context, understanding and interpreting the data and the model is not always easy. Therefore, two objectives were kept in mind when making the SMART model.
— Facilitate the use of the model by non-expert users: in this way, any stakeholder can easily visualise the causality of some parameters in the model.
— Generate data for different scenarios: the SMART tool can be used to export data generated from the inputs. In this way, the data can be used for the MFA or any other additional analysis that might be carried out.
For this purpose, the SMART model was included in an interactive tool, as a means of assisting with the interpretation of data. The tool allows for a dynamic sensitivity analysis, and an understanding of the interaction between multiple input and output parameters. This approach can be used in an impact assessment of new policy measures (e.g. understanding what the tipping point is for EV adoption and up to which point there is an environmental advantage) and help with understanding and correlating the impacts and interrelation of parameters to policy decisions, thus facilitating the policymaking process. As such, it is useful to give accessibility to even more complex problems.
The tool consists of two panels, which provide an interface to the inputs in the model. Figure 48 shows the tool interface for the panel related to vehicle sales and data export, while Figure 49 shows the tool interface related to the ELV data.
Figure 48: SMART tool interface – vehicle sales and data export panel
Source: Own elaborations.

69
Figure 49: SMART tool interface – ELV panel
Source: Own elaborations.
2.6. Interpretation of the results, discussions limitations and research perspectives
The projection of fleet data (sales, stock, ELVs) is subject to a high degree of uncertainty, because many unforeseen variables can affect vehicle sales and the uptake of new technologies. By adopting different scenarios through the variation in significant parameters available in the modelling (or by using the SMART tool for exploratory purposes), it is possible to understand the effect that diverse fleet compositions and numbers would have on ELVs and material flows. Thus, the development and use of the SMART model can aid in the assessment of the main scenarios and facilitate the generation of data to be used in the LCA and MFA. Different scenarios were projected, taking into account fleet data, future mobility and circularity. The analysis of the environmental performances of the future EU fleet was performed by combining different components and by taking into account the most relevant aspects identified by the interviewed stakeholders of the vehicle value-chain.
The information and data gathered through collaboration with stakeholders of the automotive value-chain and experts in remanufacturing are the inputs of the dynamic stocks and flows model used to estimate the flows of vehicles/components/materials in the EU according to four established scenarios. Note that all EoL strategies, with a special focus on remanufacturing, are included in such a model, which is flexible which is flexible and can be updated in further analyses. The developed model was tested on batteries to estimate the stocks and flows of materials embedded in different types of traction batteries in the EU fleet (Bobba et al., 2020a).
The results of the developed MFA showed that remanufacturing has potential as an EoL strategy to maximise the value of materials embedded in vehicles. In addition, an improved collection rate in the near future is key to enhancing resource efficiency in the automotive sector and enhancing the circularity of materials.
The main differences between the results available from the LCA of vehicles developed for the Directorate-General for Climate Action (Hill et al., 2020) and those of the SMART project are reported hereafter.
In Hill et al. (2020), the results are reported for lower medium and van vehicles and include conventional and alternatively fuelled vehicles. A future timeframe is proposed with a forecast of GWP impacts for new 2030 vehicles. Thus, this study funded by the Directorate-General for Climate Action represents a good basis for future studies and offers a comprehensive compilation of datasets already available in the current literature. In the SMART project, the segmentation of vehicles, drivetrains and the timeframe aspects are extensively developed; for instance, a description of the evolution of some key parameters over time is provided, and the consequences of the European Commission Green Deal implementation for future mobility are also considered. Moreover, the model is ready to further split the segmentation of vehicles and to adapt to the future material composition of vehicles. Finally, the SMART framework allows new technologies to be easily added (e.g. through the category ‘others’, as in Section 2.3).

70
In the study funded by the Directorate-General for Climate Action, the GWP impacts expressed per functional unit (i.e. per kilometre) are around 280 g CO2eq/km, 230 g CO2eq/km and 130 g CO2eq/km for ICEV-petrol, ICEV-diesel and BEVs (lower medium segment for the year 2020), respectively. For the same vehicle segment, we obtained 223 g CO2eq/km (ICEV-petrol), 182 g CO2eq/km (ICEV-diesel) and 127 g CO2eq/km (BEV) for the period 2015–2025. We can conclude that similar results were obtained for the BEV impact, whereas we obtained a lower impact for ICEV powertrains. This difference in results of about 20 % derives from the fossil energy consumption during the use phase. The estimations of the present SMART study (based on Bauer et al. (2015)) considers a significant decrease in energy consumption over time, which reduces significantly the use phase-related impact, compared with Hill et al. (2020) (based on European Environment Agency publications (40) for the year 2019).
The same variation ranges for ICEVs are observed when comparing exclusively the manufacturing phases of both studies (–25 % of GWP impacts for the SMART project). Hill et al. (2020) obtained 40 g CO2eq/km for both petrol and diesel powertrains by considering a common total mileage of 225 000 km. In the SMART project, the GWP impact for the lower medium manufacturing phase equals 6 496 kg CO2eq, corresponding to 36 g CO2eq/km in the case of ICEV-petrol (total mileage: 179 000 km) and 30 g CO2eq/km in the case of ICEV-diesel (total mileage: 220 000 km). These lower results for manufacturing are in line with the work of Hawkins et al. (2013), who obtained 6 450 kg CO2eq for ICEVs (43 g CO2eq/km for 150 000 km). Further work could focus on a better modelling of co-products during the manufacturing phase, which currently considers potential ‘avoided impacts’ for the production of metals when the process generates metallic scrap. In addition, further work is needed to take into account the EoL phase, which could counterbalance such results; in particular, the potential adoption of remanufactured products that would reduce the GWP of the manufacturing phase should also be included.
In Hill et al. (2020), user behaviour is mainly considered in terms of the electric driving range of PHEVs. This aspect is disregarded in our present work, in which an averaged energy consumption is taken into account for ICEVs and BEVs, and a constant ratio (40 % petrol and 60 % electricity) is applied to all the PHEV segments. In the SMART project, GWP impacts are around 160 g CO2eq/km for a PHEV (segment B/C; 2015–2025 period), compared with 134 g CO2eq/km and 168 g CO2eq/km in the high and low scenarios, respectively, in the Directorate-General for Climate Action study.
The data are available in the literature for lorries and buses are much less numerous. However, this area deserves dedicated research because of the emergence of new technologies, such as MaaS and electric-driven vehicles, which are appearing in the EU in lorries and buses. In addition, remanufacturing of engine blocks or truck injectors is already a common practice in the sector (Ellen MacArthur Foundation (2017), Volvo Group (2016), Renault (2018)).
It is highlighted that, in Hill et al. (2020), the contribution of cobalt and lithium is not significant in the LCA results because of the small quantities embedded. However, such strategic/critical raw materials could be a bottleneck from a supply point of view due to the role they play for the future of road transport. Hence, the combination of the LCA and the MFA in the SMART project allowed the variation in flows of (critical) raw materials (e.g. REEs in e-motors) to be estimated.
(40) https://www.eea.europa.eu/data-and-maps/data/co2-cars-emission-15
71
3. Overall assessment
3.1. Summary of the work
Remanufacturing now as a key strategy to increase circularity of the EU
Transport can significantly contribute not only to the decarbonisation of the EU but also to the transition towards a more resource-efficient and circular economy (EC, 2019c). Zero- and low-emission vehicles uptake is expected to ramp up in order to increase the sustainability of transport (EC, 2019a), and in 2030 a further decrease of around 14 % compared with 2015 is expected (EC, 2020f). This transition requires new materials compared with those required for ICEVs, e.g. those used to produce electric powertrains. Some of these materials are listed in the CRM list for the EU (EC, 2020d); therefore, keeping such materials in the EU is strategic.
Measures to increase the adoption of a ‘reusable, durable and repairable product’ are encouraged by the Green Deal and the Circular Economy Action Plan (EC, 2020a, 2019a). The 2020 Circular Economy Action Plan also contains a sectorial section on vehicles and batteries. The link between design and EoL treatment is recognised as an opportunity to promote more circular business models (EC, 2020a). ‘Enabling remanufacturing’ is one of the key strategies listed in the circular economy action plan launched at the beginning of 2020. Indeed, remanufacturing is one of the measures that can be used to mitigate the increasing demand for materials expected in the EU as a result of the transition to more sustainable and smart mobility. As a specific type of reuse (Ardente et al., 2018), remanufacturing allows the lifetime of products to be extended and the resource efficiency of products to be maximised (Bobba
et al., 2020b). Despite the automotive sector being one of the most important sectors for the EU remanufacturing industry, the adoption of remanufactured products is challenged by different barriers (regulatory, social, economic), and the environmental benefits in terms of impacts and materials for the system have still not been fully demonstrated. Still, ‘remanufacturing’ (for batteries) is likely to be explicitly cited in the battery legislation that is about to be adopted as part of the review of the Batteries Directive (Directive 2006/66/EC).
Analysis of automotive components remanufacturing practices
Field visits and the involvement of stakeholders and experts, complemented by a literature review, provided important information to enable a better understanding of remanufacturing practices in the EU. Information and primary data gathered during the first part of the SMART project became the input for modelling the value-chain of vehicles and the remanufacturing process in particular, and for forecasting the evolution of the EU fleet (and waste generated) and assessing the environmental performances of vehicles in the EU fleet, with a special focus on EoL practices.
It is pointed out that, although the main focus of the SMART project was on remanufacturing, this strategy cannot be analysed in isolation; hence, other EoL practices were also considered in the study to (1) build a model of the value-chain of vehicles and components, including all the main processes along the chain, and (2) provide a wide overview of the effects of remanufacturing and other EoL practices in terms of environmental impacts.
Cooperation with industries and the involvement of remanufacturing experts provided relevant information for the modelling of the value-chain of vehicles and for the identification of the main input/output flows of components/materials for the remanufacturing sector in the EU, including the main drivers and challenges to be faced. In addition, data on the material composition of vehicles and the breakdown of some key components were collected, although obtaining such data was challenging because of confidentiality issues; such an analysis still needs more effort if it is to be translated into data input for the MFA/LCA.
The SMART assessment framework
The three main blocks of the assessment developed in the SMART project are (1) the projection of the EU fleet considering multiple aspects according to stakeholder interests; (2) the dynamic MFA estimating the stocks and flows of vehicles/components/materials; and (3) the LCA designed to assess the environmental impacts at fleet/vehicle/component level. The combination of the three assessment blocks was found to be essential in obtaining a satisfactory overview of a complex sector such as mobility. As the backbone of the assessment, a graphical user interface (the SMART tool) was developed to allow users to identify some relevant considerations on the future EU fleet in terms of environmental impacts. The beta version of the SMART tool can be used to understand how relevant parameters (e.g. electric driving range, vehicle performances, price, lifetime) can affect future scenarios,
72
e.g. in terms of uptake of EVs of waste generated. In addition, according to the set of selected parameters, it is possible to have an overview of the environmental impacts of the considered fleet scenario (e.g. GWP).
With regard to the projection of the EU fleet, different parameters were recognised as relevant (i.e. powertrain mix, autonomous driving, MaaS and connected mobility) and therefore considered input for data-based modelling through which several scenarios of fleet evolution were developed; to take into account longer/shorter lifetime of vehicles and avoid fix parameters, the amount of ELVs was estimated through a Weibull distribution.
For the environmental assessment, the MFA and LCA methodologies were combined to (1) estimate the flows of vehicles/components/materials entering the main processes (including remanufacturing) along the value-chain of vehicles in the EU, (2) capture the effects of extending the lifetime of products from a materials perspective and (3) estimate the impacts of the current/future EU fleet for various scenarios.
The main processes along the whole value-chain of vehicles are included in the MFA model, and links between the processes were established based on information gathered from stakeholders and experts consulted during the project. The MFA was built using parameters, so that there was the possibility of assessing flows and stocks at both vehicle and component level and so that it could be made flexible and updatable, depending on future users’ questions and available input data. Parameters allow only the processes of interest to be taken into account in calculations, which means that the model can be applied to any components (and related embedded materials) (41). Furthermore, the structure of the MFA model allows the potential evolution of various parameters in the future and/or according to the scenario under analysis to be considered (e.g. a decrease in material content, increased recycling efficiency/collection rate, improved remanufacturing). The results of the MFA highlighted that the decrease in ‘unknown whereabouts’ could allow a significant volume of materials to be kept in the system, which is particularly relevant in the case of CRMs; moreover, major benefits in terms of valuable materials kept in the EU are observed in scenarios in which proper EoL management is increased (e.g. high recycling efficiency and higher remanufacturing rate).
A life-cycle approach has been implemented to estimate the environmental impacts of vehicles on the current/future EU fleet and EoL scenarios (42). In relation to the LCA, the analysis can also be developed at both vehicle and component levels. Owing to the lack of data and confidentiality issues regarding the data collected, especially regarding the future composition of vehicles and new materials, the BoM used in the inventory systems was retrieved and adapted from the current literature. The outcomes of the LCA study at vehicle level were then extended to the whole EU fleet to feed into the MFA of specific components/materials. Note that the BoM developed was used as input for both the LCA and the MFA, and the structure of the BoM allows for potential modifications (e.g. considering new materials), depending on new data availability. Environmental policy targets concerning mobility in 2030 and 2050 were included in the assessment through the increased performances of vehicles and the decreased GWP of the EU energy mix.
As an outcome of the analysis, an assessment framework addressing all possible EoL options (i.e. direct reuse, remanufacturing, second use, recycling, incineration and landfill) is now ready to be applied to different scenarios of the EU fleet and to various vehicle types/components/materials. Another output is the developed graphical user interface, the SMART tool. This can help to (1) ease the adoption of the model by non-expert users, (2) generate data for different scenarios and (3) visualise stocks and flows of vehicles/materials as well as LCA results. Stocks and flows of materials can be used to evaluate index illustrating the performances of EoL strategies, e.g. the EoL-RR and the EoL-RIR. Finally, the model is structured to ease the link between LCA and MFA outcomes.
Learning on remanufacturing industry
The SMART project not only developed an assessment framework to estimate the potential contribution of different EoL strategies in the future vehicle fleet but also built the relevant knowledge at the JRC of this emerging practice. Expertise from two different JRC units (one on mobility, JRC.C.4, and one on life-cycle thinking and resource efficiency, JRC.D.3) was combined, and relevant stakeholders and experts on the topic were involved in the project. During the project, the following emerged.
(41) As an example, owing to the lack of primary data on specific components, the model was validated for the traction batteries
case study (Bobba et al., 2020). (42) Note that the main focus of the LCA is on GWP, since GWP is recognised as the main driver of environmental damage
caused by energy-related systems and major policy documents focus on GWP (Eynard et al., 2018).

73
— A life-cycle approach in estimating the impacts of vehicles at sector/vehicle/component level needs to be adopted, considering all life-cycle steps; this is particularly relevant because of the rapid technological development of mobility (e.g. new vehicles, change in the energy mix, EoL practices).
— Remanufacturing in the automotive sector could play an important role in keeping the values of materials in the system and potentially decrease the life-cycle impacts of vehicles, although robust data on both processes and embedded materials in vehicles for quantitative assessments are still incomplete.
— Remanufacturing should be a key element of products’ life-cycle management as it can take the form of measures designed to mitigate the expected increase in materials demand in the next 50 years; it should also be a key element, since there is room to dramatically increase the flows and stocks of remanufactured components if such action is properly supported by the regulatory framework and the economic system. Design for business models including remanufacturing is essential for further developing the remanufacturing market (Matsumoto, 2020).
— The fast change in mobility is definitely a challenge for the traditional remanufacturing industry, but EU remanufacturing companies have the expertise to adapt to the new market and become more competitive in the aftermarket. Digitalisation and automation of systems, together with new technologies, are added value in extending the remanufacturing of products and increasing volumes. Additive manufacturing (or 3D printing) and collaborative robots, as well as an increasing automation of remanufacturing processes (e.g. dismantling, packing), can significantly support this market development.
— Remanufactured components can routinely be adopted in the manufacturing of new vehicles, decreasing the demand for new materials for manufacturing, but the acceptance of both consumers and OEMs is key to this adoption.
— Finally, supporting a design that is oriented towards more reusable, durable and repairable
products, together with incentives to increase the volumes of products entering the
remanufacturing market (including adoption of remanufactured components in new products), is
important leverage in this development.
Additional unexpected findings and outcomes
Although they were not originally planned among the tasks of the SMART project, laboratory tests allowed the composition of certain materials for some specific components (i.e. electronic boards of different vehicle parts) to be determined. This task allowed a method for carrying out the measurement (although this method is still rough and would require further testing and refining in the future, before being applied for more comprehensive analyses) to be developed first. The laboratory measurements provided some interesting information on the material composition of PCBs. Possible future steps of the research should focus on comparing such results with data from the literature (including data derived from the IMDS database) and then using the outcome to refine the BoM of vehicles. The IMDS stores industrial data of vehicles/components/materials, which is an important source of knowledge for assessing the environmental impacts of vehicles. Access to this database is still very difficult for non-manufacturers, although the information stored in it is highly relevant for scientific purposes and policymaking. Despite this, some information about the material composition of vehicles could be retrieved, thanks to a dialogue with several proactive manufacturers during the SMART project, which also revealed the interest of industries in our research goals and approach. Cooperation with manufacturers as well as further work in laboratories is still needed to reinforce the developed analysis.
This work on fleets of vehicles also allowed competences concerning the materials in vehicles and an analysis of the EoL treatment that will now be used by the JRC to answer upcoming policy questions to be developed: the focus of future research will address the question of recycled materials in new vehicles, although the focus has been moved more towards plastics. Although this activity is not directly related to remanufacturing and CRMs, some components of the SMART assessment framework will definitely be useful for this activity, and the knowledge developed during the project will support the assessments.
Related to the recent policy agenda, a recent study developed for the Directorate-General for Climate Action (Hill et al., 2020) proved that the inclusion of EoL aspects in assessing the environmental performances of vehicles is a topic to be further explored. The impacts of EoL treatments are more important for new types of vehicles than for the conventional ones, especially in relation to the recovery potential for materials embedded in vehicles. Despite several studies on the potential burdens/benefits

74
of the EoL of vehicles (and specific components) in the literature, different approaches are still used and further research in this area is still needed to harmonise the adopted methodology, to provide more reliable and comparable results. In addition, strategies extending the lifetime of vehicles and/or components (e.g. repair, remanufacturing) are significant in decreasing the demand for new/virgin materials for manufacturing new vehicles, which is a key aspect to be considered in such analyses. This was confirmed by various actors of the vehicle value-chain.
The knowledge developed on remanufacturing in the automotive sector was also useful in technically supporting the ongoing review of the ELV Directive and the Batteries Directive. Remanufacturing (and repurposing) of traction batteries is now likely to be considered an EoL option to enhance the lifetime of batteries before their recycling, especially for the Batteries Directive.
The SMART project has also led to direct follow-up activities in the current JRC work programme. For example, the interest in the EoL of vehicle components is also highlighted by a H2020 project accepted after the SMART project kick-off, the CarE-Service project (43), to which the JRC is expected to be a major contributor, dealing with the circularity assessment of several vehicle components value-chains. Indeed, the development of innovative circular business models applied to xEVs address the reuse, remanufacturing and selective recycling of three main value-chains: batteries, metal components and techno-polymeric components. It is expected that the SMART model will provide robust technical inputs for the CarE-service project. Furthermore, the expertise gained will support the ongoing work on the circularity assessment of components value-chains. In addition, the need to improve the knowledge of the material composition of vehicles is related to the launch of a further study on the composition of vehicles (especially on CRMs), carried out with academic partners Swiss Federal Laboratories for Materials Science and Technology (EMPA) and Chalmers University (Sweden) in the context of the SureVAL JRC institutional project.
3.2. Further work needed in relation to the SMART assessment framework
Based on the considerations highlighted in the previous sections, an important limitation of the study relates the LCA modelling of the EoL of vehicles. Indeed, the current literature is quite limited, and data from industries are lacking. The development of a parametrised LCA, including all the life-cycle phases and key parameters, will allow a sensitivity analysis to be performed so that the uncertainty over complex products such as vehicles can be faced. Together with the complexity of vehicles, multiple factors affecting the mobility system inevitably relate to a high level of uncertainty about the results obtained. The main difficulties encountered during the SMART project concerned the data and information gap of EoL-specific practices and the modelling aspects of very different aspects affecting the system under analysis.
Since the literature review, and based on past experiences, an important feature in developing future scenarios of the EU fleet is the simultaneous consideration of social, economic, policy, environmental and technical aspects; this necessarily increases the level of difficulty of the analysis and the uncertainty of the results. From this perspective, expertise in different sectors should be integrated to obtain more robust data and information and improve the modelling of future mobility scenarios.
The increasing complexity of the automotive market, which can be attributed not only to its now global nature but also to the increasing competitiveness of players in the remanufacturing value-chain and the greater availability of low-cost spare parts, makes difficult to gather reliable information and quantitative data. However, the involvement of industrial stakeholders in the vehicle value-chain allowed more and valuable information to be gathered.
From a materials perspective, the knowledge of where and when the flows of specific components will be available is key to estimating the amounts of (critical) materials available for, for example,
remanufacturing/recycling (Sundin and Bras, 2005). A more structured collection of data and information along the whole value-chain of vehicles and components is essential to improving the knowledge not only of remanufacturing processes (e.g. input/output flows, amount of energy needed, processes’ efficiency)
but also of flows of materials in time. The link between environmental assessment tools and data obtained by either laboratory test or industrial dataset (e.g. the IMDS) should be further developed. In this framework, the structure of the inventory used for both the LCA and the MFA allows a BoM to easily shift from a static BoM to a dynamic one, considering, for example, the variation in material content or the introduction of new
(43) https://www.careserviceproject.eu/
75
components/materials in time. The ongoing activity with EMPA and Chalmers University is the first follow-up initiative in this area.
In addition, the current shift to electric mobility and the continuous improvements in the efficiency of ICEVs and xEVs directly influence the environmental impact not only of the use phase but also of the manufacturing of vehicles and the EoL processes, e.g. aerodynamics, engine efficiency, downsizing, light-weighting and improvement in recycling practices (Mathieu and Poliscanova, 2020). As a result of these improvements, the relative contribution of each phase of the life-cycle (manufacturing, use phase and EoL) will most probably change dramatically in the coming decade. A shift in the impacts is expected, from the use and EoL phases to the manufacturing operations.
As mentioned above, parameters embedded in the SMART assessment framework allow the processes that are not included in the assessment, depending the component under analysis (44), to be ‘switched off’. Owing to the lack of data, the model was validated and tested with a set of data mainly obtained from the literature. Both the MFA and the LCA models are ready to be applied to further specific components to make the assessment more specific and to reinforce the link between the MFA and the LCA, providing a more in-depth understanding of the link between environmental impacts and resource efficiency in the automotive sector. The link between a forward-looking approach (taking into account, for example, technological evolution and new materials in components), the market development of remanufacturing (thanks to economic incentives and social acceptance) and the potential decrease in environmental impacts is also relevant to developing more recommendations to support decision-making concerning remanufacturing. From this perspective, the SMART project significantly contributes to the new remanufacturing and resource efficiency assessment domain in linking different aspects, but some work in the field is still needed to provide more robust results. In addition, more complete and detailed EoL datasets based on primary data are needed to improve the knowledge of resource efficiency and environmental impacts in the automotive sector.
Finally, more work is needed to make the graphical user interface in the SMART tool better communicating with both the MFA and the LCA, but also available to different types of users.
Considering the need for a design for remanufacturing, the ELV Directive under review should facilitate the link between vehicles’ production and remanufacturing. To do this, it is likely that remanufacturing will be studied more and more in the years to come. If design for remanufacturing automotive products is to be addressed by legislation, as is currently the case with energy-related products under the Ecodesign Directive (Directive 2009/125/EC) (EU, 2009), standardisation activities to assess the ability of an automotive product to be remanufactured (see, for example, CEN-CLC/JTC (2019)) will need to be launched.
3.3. Further analyses and policy implications
From the results of the project, the need to support remanufacturing strategies not only through more structured knowledge but also through specific ad hoc policies and economic incentives strongly emerged. To maximise the resource efficiency of products at society level, measures related to improving the design for remanufacturing (e.g. incentivising ease for disassembly, modularity of products) are needed, and acceptance of the processes and of the remanufactured products by both citizens and OEMs is key to increasing the flow of remanufactured components recirculated into the automotive sector, and also in manufacturing new vehicles. Digitalisation and automation are key enablers in strengthening remanufacturing processes for both conventional and new components and making them more competitive, but such a topic still needs considerable research efforts.
From a policy perspective, the work developed during the SMART project contributed to the current revision of the ELV Directive (EU, 2000), as the JRC is informally supporting the Directorate-General for Environment in the Inter-service Group and the STRIA (JRC, 2020); the SMART team has been ‘advocating’ remanufacturing and resource efficiency, particularly for CRMs, in these various policy initiatives. The interest in the topic is also evident through the LCA of vehicles recently developed for the Directorate-General for Climate Action (Hill et al., 2020). Such a study is considered by the Directorate-General for Climate Action as an opportunity to further develop and adapt the LCA methodology and to obtain quantitative LCA results for the automotive sector, even though there are no direct links between the quantitative results presented and any specific regulatory purposes. In addition, the relevance of the topic is underlined by a report published by the United Nations Environment
(44) For instance, if the study focuses on plastic components and reuse of such components does not occur in the EU, the
remanufacturing process in the MFA model could be simply ‘switched off’.

76
Programme (UNEP) on redefining the value of products (Nasr et al., 2018). The JRC is ready to use the SMART work to support various policies in the near future.
Member States have recently adopted several measures to face the impact of the coronavirus disease 2019 (COVID-19) crisis on the automotive sector. In fact, a drop in car sales (38 %) in the first half of 2020 was registered, as a result of which 26 out of 27 EU countries put in place stimulus measures, including direct incentives to xEV buyers (Mathieu and Poliscanova, 2020). In the post-crisis period, the behaviour of people is changing (Hendrikse, 2020): working time in the office will be shorter and people are working remotely, which is not only decreasing the number of kilometres travelled per person but also increasing the multi-car-owner (e.g. fewer cars per family). However, people seem to be more comfortable with using cars than public transport, mainly for safety reasons, which will affect the sharing of vehicles. Nevertheless, xEVs sales in 2020 increased compared with 2019, which is a clear sign of the transition of mobility. The crisis has already been considered an opportunity to ‘deeply restructure the production’ (Mathieu and Poliscanova, 2020). From the point of view of OEMs, expenditure on R&D should be more frugal than in the past, which means concentrating on what is really important and strategic for the near future. This will probably accelerate the trend in electrification, increasing the flow of components potentially available for remanufacturing and EoL practices in general (de Ribet, 2020). Finally, the situation of the past months may also have implications for new vehicle technologies, such as MaaS and connected vehicles; sharing options will definitely be affected, but the new life style in the EU, which was discussed at a recent conference (45), has also highlighted that, during the COVID-19 crisis, it was important to localise people, which entailed discussions on privacy issues. Personal data related to mobility are clearly part of discussions, and proper data management will become essential (Bultmann, 2020). As a conclusion, forecasting new technologies might not be a linear trend based on past data; hence the inclusion of social/economic aspects and scenario analysis is of paramount importance, and reflecting different voices/expertise as well as different approaches in estimating technological changes is needed. Although during the development of the SMART activities a forecasting approach was adopted, a back-casting approach focusing on the desirable (or undesirable) future could also provide valuable insights (Kishita, 2020).
Finally, from a social perspective, it is important to highlight that remanufacturing is a relatively labour-intensive activity and consequently an opportunity for job creation. However, to increase productivity it is expected that remanufacturing processes will be more and more automated, thus implying a change in the nature of labour (Matsumoto, 2020). This makes it difficult to directly quantify the impact of remanufacturing on job creation, and therefore this is a sector requiring more research efforts.
3.4. Conclusions
This report describes the activities developed during the exploratory research project SMART (2018–2020). The interest in the topic and the importance of combining expertise, especially in addressing emerging technologies (including considering the COVID-19 crisis), was highlighted by the cooperation not only between different JRC units (JRC.C.4, JRC.D.3 and JRC.F.2), but also with industrial stakeholders and experts in the field. This enhanced the knowledge of the vehicle value-chain and remanufacturing processes, and contributed to the development of both the data collection and the environmental assessment framework.
The developed work highlighted that multidimensionality is needed in addressing complex systems: the simultaneous consideration of several aspects was key in developing a reliable forecast of future mobility, and relevant parameters to be considered were identified and used as input for a neural network analysis. In addition, the MFA and LCA models developed throughout the project are now ready to further enlarge the assessment, covering more components and materials and assessing different scenarios of future mobility.
The results of the assessment show that the extension of the lifetime of vehicles has environmental benefits, especially in terms of materials recirculation. A strong collaboration between research bodies, policymakers and industrial stakeholders is essential to facing the data gaps of processes (e.g. efficiency of processes) and flow of input/output materials. In this framework, a stronger monitoring framework of stocks and flows of products along the whole value-chain can both increase knowledge of the value-chain of vehicles and be used as strategic information to dramatically improve the overall circulation of components and materials.
45 BNEF Summit Munich(19/05/2020)

77
SMART publications
Scientific papers:
Marques dos Santos, F. L., Tecchio, P., Ardente, F. and Pekár, F (2021), ‘User automotive powertrain-type choice model and analysis using neural networks’, Sustainability 2021, Vol. 13, No 2, p. 585.
Bobba, S., Bianco, I., Eynard, U., Carrara, S., Mathieux, F. and Blengini, G. A. (2020), ‘Bridging tools to better understand environmental performances and raw materials supply of traction batteries in the future EU fleet’, Energies, Vol. 13, No 10, p. 2513.
Presentations at conferences:
2–3 April 2019, EUCAD 2019 – 2nd European Conference on Connected and Automated Driving, organised by the European Commission, with the support of the European Commission-funded project ARCADE.
30 September 2019, Marques dos Santos, F. ., Tecchio, P., Ardente, F., Mathieux, F. and Pekar, F. (2019), ‘SMART – Sustainable use of materials through automotive remanufacturing to boost resource efficiency in the road transport system’, European Commission’s Knowledge Week, Brussels.
27–30 April 2020, Marques dos Santos, F. L., Tecchio, P., Ardente, F., Mathieux, F. and Pekar, F. (2020), ‘User powertrain-type choice model and analysis using neural networks’, 8th Transport Research Arena TRA 2020, Helsinki.
13–15 May 2020, Bobba, S., Tecchio, P., Ardente, F., Mathieux, F., Marques dos Santos, F. L. and Pekar, F. (2020), ‘Analysing the contribution of automotive remanufacturing to the circularity of materials’, 27th CIRP Life Cycle Engineering Conference (LCE2020), virtual event, doi:10.1016/j.procir.2020.02.052.
7–8 July 2020, Bobba, S., Maury, T., Mathieux, Ardente, F., F., Marques dos Santos, F. L. and Pekar, F. (2020)'Potential contribution of reuse of key components to the environmental life-cycle performances of vehicles', CO2 Reduction for Transportation Systems Conference, organised by Associazione Nazionale Filiera Industria Automobilistica (ANFIA) and SAE International Torino Section, virtual event.
JRC internal seminars:
— JRC Directorate C internal seminar (11 March 2019);
— seminar by Fernand Weiland (APRA EU): ‘Make-new-again: Remanufacturing support to the transition to a circular economy’, 5 November 2019;
— seminar by Dr Yusuke Kishita (University of Tokyo): ‘Backcasting and scenario design method in the context of future mobility’, 20 February 2020.

78
References
ACEA (European Automobile Manufacturers Association) (2008), The Automobile Industry Pocket Guide – 2008, ACEA, Brussels (https://www.acea.be/uploads/publications/POCKET_GUIDE_2008.pdf).
ACEA (European Automobile Manufacturers Association) (2018a), ‘Consolidated registrations – by country’ (https://www.acea.be/statistics/article/consolidated-figures-by-country) (accessed 2 September 2018).
ACEA (European Automobile Manufacturers Association) (2018b), The Automobile Industry Pocket Guide – 2018/2019, ACEA, Brussels (https://www.acea.be/uploads/publications/ACEA_Pocket_Guide_2018-2019.pdf).
ACEA (European Automobile Manufacturers Association) (2019a), ‘Size and distribution of the EU vehicle fleet’ (https://www.acea.be/statistics/tag/category/size-distribution-of-vehicle-fleet) (accessed 2 January 2019).
ACEA (European Automobile Manufacturers Association) (2019b), ‘Fuel types of new cars: diesel –17.9 %, petrol +3.3 %, electric +40.0 % in first quarter of 2019’, press release, 8 May 2019 (https://www.acea.be/press-releases/article/fuel-types-of-new-cars-diesel-17.9-petrol-3.3-electric-40.0-in-first-quarte) (accessed 2 June 2019).
ACEA (European Automobile Manufacturers Association) (2020a), ‘New cars by segment in the EU’ (https://www.acea.be/statistics/article/segment-breakdown-body-country) (accessed 2 August 2020).
ACEA (European Automobile Manufacturers Association) (2020b), The Automobile Industry Pocket Guide – 2019/2020, ACEA, Brussels (https://www.acea.be/uploads/publications/ACEA_Pocket_Guide_2019-2020.pdf).
Agra CEAS Consulting and E4tech (2015), Fuel Ethanol Demand-Supply – Scenarios 2017–2035 (https://www.epure.org/wp-content/uploads/2020/11/high-ethanol-blends-demand-supply-scenarios-report-for-epure-by-agra-ceas-consulting-and-e4tech.pdf).
Alonso, E., Wallington, T., Sherman, A., Everson, M., Field, F., Roth, R. and Kirchain, R. (2012), ‘An assessment of the rare earth element content of conventional and electric vehicles’, SAE International Journal of Materials and Manufacturing, Vol. 5, No 2, doi:10.4271/2012-01-1061.
Alonso Raposo, M., Ciuffo, B., Ardente, F., Aurambout, J. P., Baldini, G., Braun, R., Christidis, P., Christodoulou, A., Duboz, A., Felici, S., Ferragut Martinez Vara de Rey, J., Georgakaki, A., Gkoumas, K., Grosso, M., Iglesias Portela, M., Julea, A. M., Krause, J., Martens, B., Mathieux, F., Menzel, G., Mondello, S., Navajas Cawood, E., Pekar, F., Raileanu, I., Scholz, H., Tamba, M., Tsakalidis, A., van Balen, M. and Vandecasteele, I. (2019), The future of road transport – Implications of automated, connected, low-carbon and shared mobility, Publications Office of the European Union, Luxembourg, doi:10.4271/2012-01-1061.
Andersen, F. M., Larsen, H. V. and Skovgaard, M. (2008), ‘Modelling and forecasting the number of ELVs in 25 EU Member States’, 16th GERPISA International Colloquium, 18–20 June 2008, Moncalieri, Italy.
ANFIA (Associazione Nazionale Filiera Industria Automobilistica) (2018), ‘World automotive industry 2008 –2017’ (https://www.ansa.it/documents/1537264757836_INDUSTRIA_AUTOMOTIVE_MONDIALE_2008-2017.pdf).
APRA (Automotive Parts Remanufacturers Association) (2012), Remanufacturing Terminology, APRA, Alexandria, VA (https://apra.org/page/RemanResources).
APRA Europe (Automotive Parts Remanufacturers Association – Europe) (2015), Remanufacturing as best practice of the circular economy – A position paper of the Automotive Parts Remanufacturer Association – Europe, APRA (https://apra.org/page/RemanResources).
Ardente, F., Talens Peiró, L., Mathieux, F. and Polverini, D. (2018), ‘Accounting for the environmental benefits of remanufactured products: Method and application’, Journal of Cleaner Production, Vol. 198, pp. 1 545–1 558, doi:10.1016/J.JCLEPRO.2018.07.012.
Bartel, P. (2015), ‘Aktuelle Herausforderungen und Strategien des Remanufacturing von Automobilteilen’, in Remanufacturing – Ein Zweites Leben Für Investitionsgüter, Ressourceneffizienz-

79
und Kreislaufwirtschaftskongress 2015, 7 October 2015, Stuttgart (https://www.kongress-bw.de/sites/default/files/2016-07/151007_ressourcen_forum_4.pdf).
Bauer, C., Hofer, J., Althaus, H.-J., Del Duce, A. and Simons, A. (2015), ‘The environmental performance of current and future passenger vehicles: Life cycle assessment based on a novel scenario analysis framework’, Applied Energy, Vol. 157, pp. 871–883, doi:10.1016/j.apenergy.2015.01.019.
Binnemans, K., Jones, P. T., Blanpain, B., Van Gerven, T., Yang, Y., Walton, A. and Buchert, M. (2013), ‘Recycling of rare earths: A critical review’, Journal of Cleaner Production, Vol. 51, pp. 1–22, doi:10.1016/j.jclepro.2012.12.037.
Blagoeva, D. T., Aves Dias, P., Marmier, A. and Pavel, C. C. (2016), Assessment of potential bottlenecks along the materials supply chain for the future deployment of low-carbon energy and transport technologies in the EU – Wind power, photovoltaic and electric vehicles technologies, time frame: 2015–2030, JRC103778, Publications Office of the European Union, Luxembourg, doi:10.2790/08169.
Blengini, G. A., Blagoeva, D., Dewulf, J., Torres de Matos, C., Baranzelli, C., Ciupagea, C., Dias, P., Kayam, Y., Latunussa, C. E. L., Mancini, L., Manfredi, S., Marmier, A., Mathieux, F., Nita, V., Nuss, P., Pavel, C. C., Talens Peiró, L., Tzimas, E., Vidal-Legaz, B. and Pennington, D. (2017), Methodology for establishing the EU list of critical raw materials, Publications Office of the European Union, Luxembourg, doi:10.2873/769526.
Bobba, S. (2019), ‘Lifetime extension of products as circular economy strategy – Applications in key sectors for the EU’, doctoral programme in environmental and civil engineering, Politecnico di Torino, Turin, Italy.
Bobba, S., Farina, A., Blengini, G. A., Zanetti, M. C., Bonino, F. and Lattore, M. (2016), ‘Life cycle assessment applied to vehicles’ end-of-life: Case study of FCA Panda and EU policy context’, 5th International Conference on Industrial and Hazardous Waste Management, Crete , 27–30 September2016.
Bobba, S., Mathieux, F., Ardente, F., Blengini, G. A., Cusenza, M. A., Podias, A. and Pfrang, A. (2018a), ‘Life cycle Aasessment of repurposed electric vehicle batteries: An adapted method based on modelling energy flows’, Journal of Energy Storage, Vol. 19, pp. 213–225, doi:10.1016/J.EST.2018.07.008.
Bobba, S., Podias, A., Di Persio, F., Messagie, M., Tecchio, P., Cusenza, M. A., Eynard, U., Mathieux, F. and Pfrang, A. (2018b), Sustainability assessment of second life application of automotive batteries (SASLAB): JRC exploratory research (2016–2017): Final technical report: August 2018, JRC112543 , Publications Office of the European Union, Luxembourg, doi:10.2760/53624 .
Bobba, S., Mathieux, F. and Blengini, G. A. (2019), ‘How will second-use of batteries affect stocks and flows in the EU? A model for traction Li-ion batteries’, Resources, Conservation and Recycling, Vol. 145, pp. 279–291, doi:10.1016/J.RESCONREC.2019.02.022.
Bobba, S., Bianco, I., Eynard, U., Carrara, S., Mathieux, F. and Blengini, G. A. (2020a), ‘Bridging tools to better understand environmental performances and raw materials supply of traction batteries in the future EU fleet’, Energies, Vol. 13, No 10, p. 2 513, doi:10.3390/en13102513.
Bobba, S., Tecchio, P., Ardente, F., Mathieux, F., Marques dos Santos, F.L. and Pekar, F. (2020b), ‘Analysing the contribution of automotive remanufacturing to the circularity of materials’, 27th CIRP Life Cycle Engineering Conference (LCE2020), 13–15 May 2020, virtual event, doi:10.1016/j.procir.2020.02.052.
Böckin, D. and Tillman, A. M. (2019), ‘Environmental assessment of additive manufacturing in the automotive industry’, Journal of Cleaner Production, Vol. 226, pp. 977–987, doi:10.1016/j.jclepro.2019.04.086.
Bookhagen, B., Obermaier, W., Opper, C., Koeberl, C., Hofmann, T., Prohaska, T. and Irrgeher, J. (2018), ‘Development of a versatile analytical protocol for the comprehensive determination of the elemental composition of smartphone compartments on the example of printed circuit boards’, Analytical Methods , Vol. 10, pp. 3 864–3 871, doi:10.1039/C8AY01192C.
Boustani, A. (2011), ‘Remanufacturing and energy savings’, Environmental Science and Technology, Vol. 45, No 10, pp. 4 540–4 547, doi:10.1021/es102598b.

80
BSI (British Standards Institution) (2009), BS 8887–2:2009 – Design for manufacture, assembly, disassembly and end-of-life processing (MADE) – Part 2: Terms and definitions, BSI, London .
BSI (British Standards Institution) (2019), BS EN 45559: 2019 – Methods for providing information relating to material efficiency aspects of energy-related products, BSI, London.
Bultmann, M. (2020), ‘Industrial and transport policy at a crossroads – Safeguarding jobs, driving competitiveness, BNEF Summit, 19 May 2020, virtual event.
Busch, J., Steinberger, J. K., Dawson, D. A., Purnell, P. and Roelich, K. (2014), ‘Managing critical materials with a technology-specific stocks and flows model’, Environmental Science and Technology, Vol. 48, pp. 1 298–1 305, doi:10.1021/es404877u.
Byun, H., Shin, J. and Lee, C. Y. (2018), ‘Using a discrete choice experiment to predict the penetration possibility of environmentally friendly vehicles’, Energy, Vol. 144, pp. 312–321, doi:10.1016/j.energy.2017.12.035.
Castellani, V., Fantoni, M., Cristòbal, J., Zampori, L. and Sala, S. (2017), Consumer Footprint – Basket of products indicator on mobility, JRC107954, Publications Office of the European Union, doi:10.2760/12043.
CEN (European Committee for Standardization) (2019), CEN/TS 17395 – Intelligent transport systems – eSafety – eCall for automated and autonomous vehicles, CEN, Brussels.
CEN-CLC/JTC (European Committee for Standardization–European Committee for Electrotechnical Standardization Joint Technical Committee) (2019), EN 45553:2019 – General method for assessing the ability of an energy-related product to be remanufactured, CEN/CLC/JTC.
Chancerel, P., Marwede, M., Mathieux, F. and Talens Peiró, L. (2016), Feasibility study for setting-up reference values to support the calculation of recyclability/recoverability rates of electr(on)ic products, JRC101426, Publications Office of the European Union, doi:10.2788/901715.
Choi, H., Shin, J. and Woo, J. R. (2018), ‘Effect of electricity generation mix on battery electric vehicle adoption and its environmental impact’, Energy Policy, Vol. 121, pp. 13–24, doi:10.1016/j.enpol.2018.06.013.
Christidis, P., Hernandez, H., Georgakaki, A. and Peteves, S. D. (2005), Hybrids for road transport – Status and prospects of hybrid technology and the regeneration of energy in road vehicles, Joint Research Centre of the European Commission, Ispra, Italy (https://op.europa.eu/en/publication-detail/-/publication/22bb42f4-8525-4bf3-9621-5800801f7a0e).
Cobb, A. (2018), ‘Preparation from autonomous driving era’ (https://slideplayer.com/slide/13254959/#https://slideplayer.com/slide/13254959/).
Colledani, M., Copani, G. and Tolio, T. (2014), ‘De-manufacturing systems’, Procedia CIRP , Vol. 17, No 2014, pp. 14–19 https://doi.org/10.1016/J.PROCIR.2014.04.075
ComplianceXL (2020), ‘IMDS compliance in automotive supply chain and Recommendation 019’ (https://www.compliancexl.com/blog/imds/imds-compliance-in-automotive-supply-chain-recommendation-019#:~:text=IMDS).
Cooper, D. R. and Gutowski, T. G. (2015) ‘The environmental impacts of reuse: A review’, Journal of Industrial Ecology, Vol. 21, pp. 38–56, doi:10.1111/jiec.12388.
Cullbrand, K. and Magnusson, O. (2013), The use of potentially critical materials in passenger cars, Chalmers University of Technology, Gothenburg, Sweden (http://publications.lib.chalmers.se/records/fulltext/162842.pdf).
Cusenza, M. A., Bobba, S., Ardente, F., Cellura, M. and Di Persio, F. (2019), ‘Energy and environmental assessment of a traction lithium-ion battery pack for plug–in hybrid electric vehicles’, Journal of Cleaner Production, Vol. 215, pp. 634–649, doi:10.1016/j.jclepro.2019.01.056.
Dai, Q., Kelly, J. and Elgowainy, A. (2016), Vehicle Materials: Material composition of U. S. light-duty vehicles, Argonne National Laboratory, Lemont, IL (https://greet.es.anl.gov/files/light-duty-vehicle-2016).
Daziano, R. A. and Chiew, E. (2012), ‘Electric vehicles rising from the dead: Data needs for forecasting consumer response toward sustainable energy sources in personal transportation’, Energy Policy , Vol. 51, pp. 876–894, doi:10.1016/j.enpol.2012.09.040.
81
De Meester, S., Nachtergaele, P., Debaveye, S., Vos, P. and Dewulf, J. (2019), ‘Using material flow analysis and life cycle assessment in decision support: A case study on WEEE valorization in Belgium’, Resources, Conservation and Recycling , Vol. 142, pp. 1–9, doi:10.1016/J.RESCONREC.2018.10.015.
de Ribet, F. (2020), ‘Electrification and remanufacturing’, Symposium on Innovation and Automation in Remanufacturing, 1 November 2020, virtual event.
De Villafranca Casas, M. J., Kuramochi, T., Hagemann, M., Fekete, H., Höhne, N. and van Breevoort, P. (2018), Electric Vehicles Policy Impact Quantification Tool, New Climate Institute (http://newclimate.org/publications).
Del Duce, A., Gauch, M. and Althaus, H. J. (2016), ‘Electric passenger car transport and passenger car life cycle inventories in ecoinvent version 3’, International Journal of Life Cycle Assessment , Vol. 21, pp. 1 314–1 326. doi:10.1007/s11367-014-0792-4.
Di Persio, F., Huisman, J., Bobba
Dun, C., Pridmore, A., Gibson, G., Kollamthodi, S. and Skinner, I. (2014), Data gathering and analysis to assess the impact of mileage on the cost effectiveness of the LDV CO2 regulations, Ricardo AEA Ltd, Didcot, United Kingdom. , S., Dias, P. A., Blengini, G. A. and Blagoeva, D. (2020), Information gap analysis for decision-makers to move EU towards a circular economy for the lithium-ion battery value chain, JRC121140, Publications Office of the European Union, Luxembourg, doi:10.2760/069052.
Dias, A. S., Kim, H., Sivakumar, P. K., Liu, Z. and Zhang, H. (2013), ‘Life cycle assessment: a comparison of manufacturing and remanufacturing processes of a diesel engine’, in Nee, A. Y. C., Song, B. and Ong, S.-K. (eds), Re-engineering Manufacturing for Sustainability – Proceedings of the 20th CIRP International Conference on Life Cycle Engineering, Singapore, 17–19 April, 2013, pp. 675–678, doi:/10.1007/978-981-4451-48-2.
Economic and Social Committee and the Committee of the Regions – Stepping up Europe’s 2030 climate ambition – Investing in a climate-neutral future for the benefit of our people, SWD(2020)176 final, Brussels, 17.9.2020.
Ellen MacAthur Foundation (2017), ‘Design and business model considerations for heavy machinery remanufacturing’, (https://www.ellenmacarthurfoundation.org/case-studies/design-and-business-model-considerations-for-heavy-machinery-remanufacturing) (accessed September 2018).
Ellen MacAthur Foundation (2012), ‘The circular economy applied to the automotive industry’, 9 October 2012 (https://www.ellenmacarthurfoundation.org/news/the-circular-economy-applied-to-the-automotive-industry-2) (accessed 2 September 2018).
Ellingsen, L. A. W., Singh, B. and Strømman, A. H. (2016), ‘The size and range effect: Lifecycle greenhouse gas emissions of electric vehicles’, Environmental Research Letters, Vol. 11, doi:10.1088/1748-9326/11/5/054010.
Emilsson, E., Dahllöf, L. and Söderman, M. L. (2019), Plastics in passenger cars: A comparison over types and time, IVL Swedish Environmental Institute, Stockholm, doi:10.13140/RG.2.2.16313.93280.
ENTSO-E (European Network of Transmission System Operators for Electricity) (2016), ‘Statistical factsheet 2015’ (https://eepublicdownloads.entsoe.eu/clean-documents/Publications/Statistics/Factsheet/entsoe_sfs2015_web.pdf).
Erich, M. (2018), Car Sharing Unlocked in Europe by 2035, ING Group, Amsterdam (https://think.ing.com/uploads/reports/ING_-_Car_sharing_unlocked.pdf).
ERTRAC, EPoSS and ETIP SNET (European Road Transport Research Advisory Council, European Technical Platform on Smart Systems Integration and European Technology and Innovation Platform Smart Networks for Energy Transition) (2017), European Roadmap Electrification of Road Transport, ERTRAC, EPoSS and ETIP SNET, Belgium.
European Commission (2016), EU Reference Scenario 2016 – Energy, transport and GHG emissions: Trends to 2050, Publications Office of the European Union, Luxembourg, doi:10.2833/554470.
European Commission (2018a), In-depth analysis in support of COM(2018) 773: A clean planet for all – A European long-term strategic vision for a prosperous, modern, competitive and climate neutral economy. COM(2018) 773, Brussels, 28 November 2018.

82
European Commission (2018b), Communication from the Commission to the European Parliament, the Council, the European Economic and Social Committee and the Committee of the Regions – Europe on the move – Sustainable mobility for Europe: Safe, connected, and clean, COM(2018)293 final, Brussels, 17.5.2018.
European Commission (2019a), Communication from the Commission to the European Parliament, the European Council, the Council, the European Economic and Social Committee and the Committee of the Regions – The European Green Deal, COM(2019)640 final, Brussels, 11.12.2019.
European Commission (2019b), Reflection Paper – Towards a Sustainable Europe by 2030, COM(2019)22 final, Brussels, 30.1.2019.
European Commission (2019c), Guidelines on the exemption procedure for the EU approval of automated vehicles, European Commission, Brussels (https://ec.europa.eu/docsroom/documents/34802).
European Commission (2019d), Commission Staff Working Document – Sustainable products in a circular economy – Towards an EU product policy framework contributing to the circular economy, SWD(2019)91 final, Brussels, 4.3.2019.
European Commission (2020a), Communication from the Commission to the European Parliament, the Council, the European Economic and Social Committee and the Committee of the Regions – A new circular economy action plan – For a cleaner and more competitive Europe, COM(2020) 98 final, Brussels, 11.3.2020.
European Commission (2020b), Communication from the Commission to the European Parliament, the Council, the European Economic and Social Committee and the Committee of the Regions – Critical raw materials resilience: Charting a path towards greater security and sustainability, COM(2020)474 final, Brussels, 3.9.2020.
European Commission (2020c), Critical raw materials for strategic technologies and sectors in the EU – A foresight study, Publications Office of the European Union, doi:10.2873/865242.
European Commission (2020d), Communication from the Commission to the European Parliament, the Council, the European Economic and Social Committee and the Committee of the Regions – A European strategy for data, COM(2020)66 final, Brussels, 19.2.2020.
European Commission (2020e), Communication from the Commission to the European Parliament, the Council, the European Economic and Social Committee and the Committee of the Regions – Stepping up Europe’s 2030 climate ambition – Investing in a climate-neutral future for the benefit of our people, COM(2020)562 final, Brussels, 17.9.2020.
European Commission (2020f), Commission Staff Working Document – Impact assessment accompanying the document Communication from the Commission to the European Parliament, the Council, the European
EU (European Union) (2000), Directive 2000/53/EC of the European Parliament and of the Council of 18 September 2000 on end-of life vehicles, OJ L269, 21.10.2000, p. 34–43.
EU (European Union) (2009), Directive 2009/125/EC of the European Parliament and the Council of 21 October 2009 establishing a framework for the setting of ecodesign requirements for energy-related products. OJ L285/10, 31.10.2009, p. 10–35.
EU (European Union) (2017), Workshop report – Promoting remanufacturing, refurbishment, repair and direct reuse, EU, Brussels, doi:10.2779/181003.
EU (European Union) (2008). Directive 2008/98/EC of the European parliament and of the Council of 19 November 2008 on waste and repealing certain Directives. OJ L 312, 22.11.2008, p. 3–30
EurekAlert! (2018), ‘Untapped gold mine is lost from end-of-life vehicles’, 6 March 2018 (https://www.eurekalert.org/pub_releases/2018-03/cuot-ugm030618.php) (accessed 2 January 2019).
European Parliament (2018), Emission performance standards for new passenger cars and for new light commercial vehicles, P8_TA(2018)0370, (http://www.europarl.europa.eu/sides/getDoc.do?pubRef=-//EP//TEXT+TA+P8-TA-2018-0370+0+DOC+XML+V0//EN).
Eurostat (2019), ‘End-of-life vehicles – reuse, recycling and recovery, totals’ (http://appsso.eurostat.ec.europa.eu/nui/show.do?dataset=env_waselvt&lang=en).

83
Eurostat (2020), ‘Passenger cars in the EU’ (https://ec.europa.eu/eurostat/statistics-explained/index.php/Passenger_cars_in_the_EU)
Ewers, A. and Berg, F. (2019), ‘Automotive aftermarket – Consolidated keeps rolling’, (http://www.i-advise.de/wp-content/uploads/2019/08/190828-Spotlight-Auto-IAM-ENG.pdf).
Eynard, U., Bobba, S., Cusenza, M. A. and Blengini, G. A. (2018), ‘Lithium-ion batteries for electric vehicles: combining environmental and social life cycle assessments’, in Mondello, G., Mistretta, M., Salomone, R., Dominici Loprieno, A., Cortesi, S. and Mancuso, E., Life cycle thinking in decision-making for sustainability: From public policies to private businesses – Proceedings of the 12th Italian LCA Network Conference, 11 – 12 June 2018, Messina, Italy.
Field, F. R., Wallington, T. J., Everson, M. and Kirchain, R. E. (2017), ‘Strategic materials in the automobile: A comprehensive assessment of strategic and minor metals use in passenger cars and light trucks’, Environmental Science and Technology, Vol. 51, pp. 14 436–14 444, doi:10.1021/acs.est.6b06063.
Galassi, M. C. and Lagrange, A. (2020), New approaches for automated vehicles certification: Part I – Current and upcoming methods for safety assessment, JRC119345, Publications Office of the European Union, Luxembourg, doi:10.2760/766068.
Gaudillat, P. F., Antonopoulos, I. S., Dri, M., Canfora, P. and Traverso, M. (2017), Best environmental management practice for the car manufacturing sector, Publications Office of the European Union, Luxembourg doi:10.2760/202143.
Gawron, J. H., Keoleian, G. A., Kleine, R. D. De, Wallington, T. J. and Kim, H. C. (2018) , ‘Life cycle assessment of connected and automated vehicles: Sensing and computing subsystem and vehicle level effects’, Environmental Science and Technology, Vol. 52, No 5, pp. 3249–3256, doi:10.1021/acs.est.7b04576.
Gerrard, J. and Kandlikar, M. (2007), ‘Is European end-of-life vehicle legislation living up to expectations? Assessing the impact of the ELV Directive on “green” innovation and vehicle recovery’, Journal of Cleaner Production, Vol. 15, pp. 17–27, doi:10.1016/J.JCLEPRO.2005.06.004.
Gharfalkar, M., Ali, Z. and Hillier, G. (2016), ‘Clarifying the disagreements on various reuse options: Repair, recondition, refurbish and remanufacture’, Waste Management and Research, Vol. 34, pp. 995–1 005, doi:10.1177/0734242X16628981.
Gnann, T., Stephens, T. S., Lin, Z., Plötz, P., Liu, C. and Brokate, J. (2018), ‘What drives the market for plug-in electric vehicles? – A review of international PEV market diffusion models’, Renewable and Sustainable Energy Reviews, Vol. 93, pp. 158–164, doi:10.1016/J.RSER.2018.03.055.
Goodall, W., Dovey Fishman, T., Bornstein, J. and Bonthron, B. (2017), ‘The rise of mobility as a service: Reshaping how urbanites get around’, Delotitte Review, No 20, pp. 111–130.
Graedel, T. E., Allwood, J., Birat, J. P., Buchert, M., Hagelüken, C., Reck, B. K., Sibley, S. F. and Sonnemann, G. (2011), ‘What do we know about metal recycling rates?’, Journal of Industrial Ecology, Vol. 15, No 3, pp. 355–366, doi:10.1111/j.1530-9290.2011.00342.x.
Grelier, F., Poliscanova, J., Ambel, C. C., Bannon, E., and Alexandridou, S. (2019), Electric surge: Carmakers’ electric car plans across Europe 2019–2025, European Federation for Transport and Environment AISBL , Brussels (https://www.transportenvironment.org/sites/te/files/publications/2019_07_TE_electric_cars_report_final.pdf).
Guyonnet, D., Planchon, M., Rollat, A., Escalon, V., Tuduri, J., Charles, N., Vaxelaire, S., Dubois, D. and Fargier, H. (2015), ‘Material flow analysis applied to rare earth elements in Europe’, Journal of Cleaner Production, Vol. 107, pp. 215–228, doi:10.1016/J.JCLEPRO.2015.04.123.
Habib, K., Hansdóttir, S. T. and Habib, H. (2020), ‘Critical metals for electromobility: Global demand scenarios for passenger vehicles, 2015–2050’, Resources, Conservation and Recycling, Vol. 154, p. 104603, doi:10.1016/j.resconrec.2019.104603.
Hannon, E., McKerracher, C., Orlandi, I. and Ramkumar, S. (2016), ‘An integrated perspective on the future of mobility’, McKinsey & Company, New York, NY (https://www.mckinsey.com/business-functions/sustainability-and-resource-productivity/our-insights/an-integrated-perspective-on-the-future-of-mobility).

84
Hao, H., Geng, Y., Tate, J. E., Liu, F., Sun, X., Mu, Z., Xun, D., Liu, Z. and Zhao, F. (2019), ‘Securing platinum-group metals for transport low-carbon transition’, One Earth, Vol. 1, No 1, pp. 117–125, doi:10.1016/J.ONEEAR.2019.08.012.
Harrison, G., Thiel, C. and Jones, L. (2016), Powertrain technology transition market agent model (PTTMAM) – An introduction, JRC100418, Publications Office of the European Union, Luxembourg.
Harrison, P. (2019), Fuelling Europe’s future: How the transition from oil strengthens the economy, Cambridge Econometrics, Cambridge (https://europeanclimate.org/content/uploads/2019/12/20-02-2018-fuelling-europes-future-how-the-transition-from-oil-strengthens-the-economy-summary-report.pdf).
Harvey, J. (2018), ‘Platinum’s days as fuel cell car component may be numbered, 23 March 2018 (https://uk.reuters.com/article/uk-platinum-fuelcells/platinums-days-as-fuel-cell-car-component-may-be-numbered-idUKKBN1GZ2KO).
Harvey, L. D. D. (2018), ‘Resource implications of alternative strategies for achieving zero greenhouse gas emissions from light-duty vehicles by 2060’, Applied Energy, Vol. 212, pp. 663–679. doi:10.1016/J.APENERGY.2017.11.074.
Hawkins, T. R. (2013), ‘Corrigendum to: Hawkins, T. R., B. Singh, G. Majeau‐ Bettez, and A. H. Strømman. 2012. Comparative environmental life cycle assessment of conventional and electric vehicles. Journal of Industrial Ecology DOI: 10.1111/j.1530‐ 9290.2012.00532.x’, Journal of Industrial Ecology, Vol. 17, pp. 158–160, doi:10.1111/jiec.12011.
Hawkins, T. R., Singh, B., Majeau-Bettez, G. and Strømman, A. H. (2013), ‘Comparative environmental life cycle assessment of conventional and electric vehicles’, Journal of Industrial Ecology, Vol. 17, pp. 53–64. doi:10.1111/j.1530–9290.2012.00532.x.
Hendrikse, H. (2020), ‘Bridging priorities – From pandemic recovery and compliance driven-sales to revenue-led EV sales’, BNEF Summit, 19 May 2020, virtual event.
Hertwich, E., Lifset, R., Pauliuk, S. and Heeren, N. (2020), Resource efficiency and climate change: Material efficiency strategies for a low-carbon future, United Nations Environment Programme, Nairobi doi:10.5281/zenodo.3542680.
Hill, N., Amaral, S., Morgan-Price, S., Nokes, T., Bates, J., Helms, H., Fehrenbach, H., Biemann, K., Abdalla, N., Jöhrens, J., Cotton, E., German, L., Harris, A., Haye, S., Sim, C. and Bauen, A. (2020), Determining the environmental impacts of conventional and alternatively fuelled vehicles through LCA, European Commission, Brussels.
Hill, N., Clarke, D., Blair, L. and Menadue, H. (2019), Circular economy perspectives for the management of batteries used in electric vehicles, JRC117790, Publications Office of the European Union, Luxembourg doi:10.2760/537140.
Hovorun, T. P., Berladir, K. V., Pererva, V. I., Rudenko, S. G. and Martynov, A. I. (2017), ‘Modern materials for automotive industry’, Journal of Engineering Science, Vol. 4, No 2, pp. f8–f18, doi:10.21272/jes.2017.4(2).f8.
Huisman, J., Downes, S., Leroy, P., Söderman, M. L., Kushnir, D., Løvik, A. N., Wäger, P., Rotter, V. S., Mählitz, P., Chancerel, P., Emmerich, J., Hallberg, A., Tertre, F. and Cassard, D. (2017a), PROSUM recommendations report – Prospecting secondary raw materials in the urban mine and mining wastes (ProSUM), Brussels .
Huisman, J., Leroy, P., Tertre, F., Söderman, M. L., Chancerel, P., Cassard, D., Amund, N., Wäger, P., Kushnir, D., Rotter, V. S., Mählitz, P., Herreras, L., Emmerich, J., Ljunggren Söderman, M., Chancerel, P., Cassard, D., Løvik, A. N., Wäger, P., Kushnir, D., Susanne Rotter, V., Mählitz, P., Herreras, L., Emmerich, J., Hallberg, A., Habib, H., Wagner, M. (2017b), Prospecting secondary raw materials in the urban mine and mining wastes (ProSUM) – Final report, Brussels .
ICCT (International Council on Clean Transportation) (2018), European Vehicle Market Statistics – Pocketbook 2018/2019, ICCT, Washington DC.
IMDS (International Material Data System) (2018), ‘IMDS information pages’ (https://public.mdsystem.com/en/web/imds-public-pages/home) (accessed 2 January 2019).
85
ISO (International Organization for Standardization) (2020), ISO/DIS 14009: Environmental management systems – Guidelines for incorporating material circulation in design and development, ISO, Geneva.
JATO (2017), ‘Europe H1 2017: Diesel car registrations at their lowest share since 2009’, 17 August 2017 (https://www.jato.com/europe-h1-2017-diesel-car-registrations-lowest-share-since-2009/) (accessed 2 June 2019).
Jowitt, S. M., Werner, T. T., Weng, Z. and Mudd, G. M. (2018), ‘Recycling of the rare earth elements’, Current Opinion in Green Sustainable Chemistry, Vol. 13, pp. 1–7, doi:10.1016/J.COGSC.2018.02.008.
JRC (Joint Research Centre of the European Commission) (2020), Vehicle Design and Manufacturing – Roadmaps, JRC, Ispra, Italy (https://publications.jrc.ec.europa.eu/repository/bitstream/JRC109304/stria_vehicle_design_and_manufacturing_roadmap.pdf).
Kamper, A., Triebs, J., Hollah, A. and Lienemann, C. (2019), ‘Remanufacturing of electric vehicles: Challenges in production planning and control’, Procedia Manufacturing, Vol. 33, pp. 280–287, doi:10.1016/j.promfg.2019.04.034.
Kanari, N., Pineau, J.-L. and Shallari, S. (2003), ‘End-of-life vehicle recycling in the European Union’, The Journal of the Minerals, Metals and Materials Society, Vol. 55, No 8, pp. 15–19.
Kim, H.-J., Severengiz, S., Skerlos, S. J. and Seliger, G. (2008), ‘Economic and environmental assessment of remanufacturing in the automotive industry’, 15th CIRP Life Cycle Engineering Conference (LCE2008), 7-19 March 2008, Sydney.
Kishita, Y. (2020), ‘Scenario design and backcasting for sustainable futures: Theory and practice’, JRC internal 1seminar, 19 February 2020.
Kolli, Z. (2011), ‘Car longevity: A biometric approach’, Young Researcher Seminar – Transport Sustainability and Environment, 8–10 June, Technical University of Denmark, Copenhagen, Denmark.
Kolli, Z., Dupont-Kieffer, A. and Hivert, L. (2010), ‘Car survival in a national car fleet: Non-parametric and parametric approaches applied to French data’, 12th World Conference for Transportation Research, 11-15 July 2010, Lisbon.
Krishnan, S. (2018), ‘Electric car motor life expectancy: How long an EV Motor last?’, 23 October 2018 (https://getelectricvehicle.com/electric-car-motor-life-expectancy-how-long-an-ev-motor-last/) (accessed 2 December 2019).
Lange, U. (2017), Resource Efficiency through Remanufacturing, VDI ZRE publications, Berlin (https://www.resource-germany.com/fileadmin/user_upload/downloads/kurzanalysen/VDI_ZRE_KA18_Remanufacturing_en_bf.pdf).
Lemos, P. (2020), ‘Towards a circular economy – Presentation on product passport s’, 2nd Hamburg Sustainability Session – Towards a Circular Economy, 5 November 2020, European School of Sustainability Science and Research, virtual event (https://esssr.eu/events/hamburg-sustainability-session-2-entering-the-path-towards-a-circular-economy/).
Lindahl, M., Sundin, E. and Östlin, J. (2006), ‘Environmental issues within the remanufacturing industry’, 13th CIRP Life Cycle Engineering Conference (LCE2006), 31 May – 2 June 2006, Leuven.
Lindkvist Haziri, L. and Sundin, E. (2020), ‘Supporting design for remanufacturing – A framework for implementing information feedback from remanufacturing to product design’, Journal of Remanufacturing, Vol. 10, pp. 57–76, doi:10.1007/s13243-019-00074-7.
Liu, Z., Li, T., Jiang, Q. and Zhang, H. (2014), ‘Life cycle assessment -based comparative evaluation of originally manufactured and remanufactured diesel engines’, Journal of Industrial Ecology, Vol. 18, No 4, pp. 567–576, doi:10.1111/jiec.12137.
Liu, Z., Jiang, Q., Li, T., Dong, S., Yan, S., Zhang, H. and Xu, B. (2016.), ‘Environmental benefits of remanufacturing: A case study of cylinder heads remanufactured through laser cladding’, Journal of Cleaner Production, Vol. 133, pp. 1027–1033, doi:10.1016/j.jclepro.2016.06.049.
Liu, B., Chen, D., Zhou, W., Nasr, N., Wang, T., Hu, S. and Zhu, B. (2018), ‘The effect of remanufacturing and direct reuse on resource productivity of China’s automotive production’, Journal of Cleaner Production, Vol. 194, pp. 309–317, doi:10.1016/j.jclepro.2018.05.119.

86
Lu, S. (2006), Vehicle Survivability and Travel Mileage Schedules, National Centre for Statistics and Analysis, Washington DC (https://crashstats.nhtsa.dot.gov/Api/Public/ViewPublication/809952).
Månberger, A. and Stenqvist, B. (2018), ‘Global metal flows in the renewable energy transition: Exploring the effects of substitutes, technological mix and development’, Energy Policy, Vol. 119, pp. 226–241, doi:10.1016/j.enpol.2018.04.056.
Marques dos Santos, F. L., Tecchio, P., Ardente, F., Mathieux, F. and Pekar, F., 2020. ‘User powertrain type choice model and analysis using neural networks’, 8th Transport Research Arena TRA 2020, 27–30 April 2020, Helsinki, Finland.
Marques, P., Garcia, R. and Freire, F. (2013), ‘Life cycle assessment of electric and conventional cars in Portugal’, Energy for Sustainability 2013 – Sustainable Cities: Designing for People and the Planet, 8–10 September, Coimbra, Portugal .
Mathieu, L. and Poliscanova, J. (2020), ‘Mission (almost) accomplished’, European Federation for Transport and Environment AISBL, Brussels (https://www.transportenvironment.org/publications/mission-almost-accomplished-carmakers-race-meet-202021-co2-targets-and-eu-electric-cars).
Mathieux, F., Ardente, F., Bobba, S., Nuss, P., Blengini, G. A., Alves Dias, P., Blagoeva, D., Torres De Matos, C., Wittmer, D., Pavel, C., Hamor, T., Saveyn, H., Gawlik, B., Orveillon, G., Huygens, D., Garbarino, E., Tzimas, E., Bouraoui, F. and Solar, S. (2017), Critical raw materials and the circular economy – Background report, JRC108710, Publications Office of the European Union, Luxembourg, doi:10.2760/378123.
Matsumoto, M. (2020), ‘Product remanufacturing in Japan: Trends and challenges’, 27th CIRP Life Cycle Engineering Conference (LCE2020), 13–15 May 2020, virtual event.
McKenna, R., Reith, S., Cail, S., Kessler, A. and Fichtner, W. (2013), ‘Energy savings through direct secondary reuse: An exemplary analysis of the German automotive sector’, Journal of Cleaner Production, Vol. 52, pp. 103–112, doi:10.1016/j.jclepro.2013.02.032.
McKinsey & Company (2010), A portfolio of power-trains for Europe: a fact-based analysis – The role of battery electric vehicles, plug-in hybrids and fuel cell electric vehicles, McKinsey & Company, New York, NY (https://www.fch.europa.eu/sites/default/files/documents/Power_trains_for_Europe.pdf).
McKinsey & Company (2016), ‘Automotive revolution – Perspective towards 2030 – How the convergence of disruptive technology-driven trends could transform the auto industry’, Auto Tech Review, Vol. 5, pp. 20–25. doi:10.1365/s40112-016-1117-8.
Messagie, M., Boureima, F. S., Coosemans, T., Macharis, C. and Van Mierlo, J. (2014), ‘A range-based vehicle life cycle assessment incorporating variability in the environmental assessment of different vehicle technologies and fuels’, Energies, Vol. 7, pp. 1 467–1 482, doi:10.3390/en7031467.
Milios, L. and Matsumoto, M. (2019), ‘Consumer perception of remanufactured automotive parts and policy implications for transitioning to a circular economy in Sweden’, Sustainability, Vol. 11, doi:10.3390/su11226264.
Morningstar Inc. (2018), ‘Electric vehicle observer: September 2018’, 26 September 2018 (https://www.smartkarma.com/insights/electric-vehicle-observer-september-2018).
Nasr, N., Hilton, B., Haselkorn, M., Parnell, K., Brun, V. and Hanson, F. (2017), Technology roadmap for remanufacturing in the circular economy, Rochester Institute of Technology, Rochester NY (https://www.rit.edu/sustainabilityinstitute/public/Reman_Roadmap_2017.pdf).
Nasr, N., Russell, J., Bringezu, S., Hellweg, S., Hilton, B., Kreiss, C. and von Gries, N. (2018), Redefining value – The manufacturing revolution – Remanufacturing, refurbishment, repair and direct reuse in the circular economy, a report of the International Resource Panel, United Nations Environment Programme, Nairobi .
Nemry, F., Leduc, G., Mongelli, I. and Uihlein, A. (2008), Environmental Improvement of Passenger Cars (IMPRO-car), Office for Official Publications of the European Communities, Luxembourg, doi:10.2791/63451.
Nordelöf, A. and Tillman, A.-M. (2018), ‘A scalable life cycle inventory of an electrical automotive traction machine – Part II: manufacturing processes’, The International Journal of Life Cycle Assessment, Vol. 23, pp. 295–313, doi:10.1007/s11367-017-1309-8.

87
Nordelöf, A., Grunditz, E., Tillman, A.-M., Thiringer, T. and Alatalo, M. (2018), ‘A scalable life cycle inventory of an electrical automotive traction machine – Part I: Design and composition’, The International Journal of Life Cycle Assessment, Vol. 23, pp. 55–69, doi:10.1007/s11367-017-1308-9.
Oeko Institute (2017), Assessment of the implementation of Directive 2000/53/EU on end-of-life vehicles (the ELV Directive) with emphasis on the end of life vehicles of unknown whereabouts, Oeko Institute e.V. – Institute for Applied Ecology, Darmstadt, Germany.
Optimat (2013), Remanufacture, refurbishment, reuse and recycling of vehicles: Trends and opportunities, Optimat, Glasgow, United Kingdom (https://www.gov.scot/publications/remanufacture-refurbishment-reuse-recycling-vehicles-trends-opportunities/).
Ortgies, C. (2020), ‘Automatisation and mechanization in engine remanufacturing’, Symposium on Innovation and Automation in Remanufacturing, 9 September 2020, virtual event.
Parker, D., Riley, K., Robinson, S., Symington, H. and Hollins, O. (2015), Remanufacturing Market Study, European Remanufacturing Network, Aylesbury, United Kingdom (https://www.remanufacturing.eu/assets/pdfs/remanufacturing-market-study.pdf).
Pavel, C. C., Thiel, C., Degreif, S., Blagoeva, D., Buchert, M., Schüler, D. and Tzimas, E. (2017), ‘Role of substitution in mitigating the supply pressure of rare earths in electric road transport applications’, Sustainable Materials and Technologies, Vol. 12, pp. 62–72. doi:10.1016/j.susmat.2017.01.003.
Peck, D. and Jansson, K. (2015), Advanced Materials, European Remanufacturing Network, Aylesbury, United Kingdom (https://www.remanufacturing.eu/assets/pdfs/EC--09%20404%20D2.3%20-%20D2.3%20Advanced%20material%20report.pdf).
Pham, D. (2020), ‘Robotic disassembly research at the University of Birmingham’, Symposium on Innovation and Automation in Remanufacturing, 9 September 2020, virtual event.
Plötz, P., Funke, S. Á. and Jochem, P. (2018), ‘Empirical fuel consumption and CO2 emissions of plug–in hybrid electric vehicles’, Journal of Industrial Ecology, Vol. 22, pp. 773–784, doi:10.1111/jiec.12623.
Plötz, P., Funke, S. A., Jochem, P. and Wietschel, M. (2017), ‘CO2 mitigation potential of plug-in hybrid electric vehicles larger than expected’, Scientific Reports, Vol. 7, doi:10.1038/s41598-017-16684-9.
ProSUM (2018), ‘Urban mine platform’ (http://www.urbanmineplatform.eu/homepage) (accessed 2 January 2019).
Reimer, M. V., Schenk-Mathes, H. Y., Hoffmann, M. F. and Elwert, T. (2018), ‘Recycling decisions in 2020, 2030, and 2040 – When can substantial NdFeB extraction be expected in the EU?’, Metals, Vol. 8, doi:10.3390/met8110867.
Rematec (2020), ‘Electric vehicle challenges and opportunities for European remanufacturers’, 7 April 2020 (https://www.rematec.com/news/electric-vehicle-challenges/) (accessed 15 April 2020).
Renault (2018), ‘Renault trucks reconditioned spare parts: reliable, cost-effective and sustainable parts’, (https://www.renault-trucks.com/en/newsroom/press-releases/renault-trucks-reconditioned-spare-parts-reliable-cost-effective-and) (accessed December 2018).
Ricardo AEA (2015), The potential for mass reduction of passenger cars and light commercial vehicles in relation to future CO2 regulatory requirements, Ricardo AEA, Didcot, United Kingdom.
Russell, J. D. (2018), Market transformation for value-retention processes as a strategy for circular economy, Rochester Institute of Technology, Rochester, NY.
Schau, E. M., Traverso, M. and Finkbeiner, M. (2012), ‘Life cycle approach to sustainability assessment: A case study of remanufactured alternators’, Journal of Remanufacturing, Vol. 2, doi:10.1186/2210-4690-2-5.
Seo, Y. and Morimoto, S. (2014), ‘Comparison of dysprosium security strategies in Japan for 2010–2030’, Resources Policy, Vol. 39, pp. 15–20, doi:10.1016/j.resourpol.2013.10.007.
Silvia, C. and Krause, R. M. (2016), ‘Assessing the impact of policy interventions on the adoption of plug-in electric vehicles: An agent-based model’, Energy Policy, Vol. 96, pp. 105–118, doi:10.1016/j.enpol.2016.05.039.

88
Simons, A. (2016), ‘Road transport: New life cycle inventories for fossil-fuelled passenger cars and non-exhaust emissions in ecoinvent v3’, The International Journal of Life Cycle Assessment, Vol. 21, pp. 1 299–1 313, doi:10.1007/s11367-013-0642-9.
Statista (2019), ‘Projected autonomous vehicle market penetration between 2020 and 2030’ (https://www.statista.com/statistics/713443/autonomous-vehicle-market-penetration-by-region/).
Steinhilper, R. (1998), Remanufacturing: The Ultimate Form of recycling, Fraunhofer-IRB-Verlag, Stuttgart Germany.
Steinhiper, R. and Nagel, A. (2017), ‘New opportunities and incentives for remanufacturing by 2020s car service trends’, Procedia CIRP, Vol. 61, pp. 183–188, doi:10.1016/j.procir.2016.11.233.
Sundin, E. and Bras, B. (2005), ‘Making functional sales environmentally and economically beneficial through product remanufacturing’, Journal of Cleaner Production, Vol. 13, pp. 913–925, https://doi.org/10.1016/j.jclepro.2004.04.006
Sundin, E. and Lee, H. M. (2012), ‘In what way is remanufacturing good for the environment?’, in Matsumoto, M., Umeda, Y., Masui, K. and Fukushige, S. (eds), Design for innovative value towards a sustainable society – Proceedings of EcoDesign 2011: 7th International Symposium on Environmentally Conscious Design and Inverse Manufacturing, Springer, Dordrecht, the Netherlands, doi:10.1007/978-94-007-3010-6_106.
Sutherland, J. W., Adler, D. P., Haapala, K. R. and Kumar, V. (2008), ‘A comparison of manufacturing and remanufacturing energy intensities with application to diesel engine production’, CIRP Annals, Vol. 57, No 1, pp. 5–8, doi:10.1016/j.cirp.2008.03.004.
Toptas, A. and Fekete, M. (2019), ‘The influence of product lifetime on remanufacturing of vehicles components’, 3rd International Scientific Conference – EMAN 2019 – Economics and Management: How to Cope with Disrupted Times, 28 March 2019, Ljubljana, Slovenia, doi:10.31410/eman.2019.723.
Trost, T., Sterner, M. and Bruckner, T. (2017), ‘Impact of electric vehicles and synthetic gaseous fuels on final energy consumption and carbon dioxide emissions in Germany based on long-term vehicle fleet modelling’, Energy, Vol. 141, pp. 1 215–1 225, doi:10.1016/j.energy.2017.10.006.
Uchida, I., Nakamoto, Y. and Kagawa, S. (2019), ‘Estimation of vehicle lifetime in the used car market’, 27th IIOA Conference, 30 June–5 July, Glasgow, United Kingdom.
Van Hout, D. (2018), ‘Comprehensive LCA of EV motor with examination direct reuse scenario of SmCo permanent magnets’, KU Leuven, Leuven, Belgium.
Volvo Group (2016), ‘Redesigned for reman – adapting to a growing remanufacturing business’, (https://www.volvogroup.com/content/dam/volvo/volvo-group/markets/global/en-en/news-and-media/volvo-group-magazine/news-and-media-vgm-1-2016-technology.pdf) (accessed September 2018).
Warsen, J., Laumer, M. and Momberg, W. (2011), ‘Comparative life cycle assessment of remanufacturing and new manufacturing of a manual transmission’, in Hesselbach, J. and Herrmann, C. (eds), Glocalized solutions for sustainability in manufacturing – Proceedings of the 18th CIRP International Conference on Life Cycle Engineering, Springer-Verlag, Berlin, doi:10.1007/978-3-642-19692-8-12.
Weiland, F. (2016), ‘Make-new-again by remanufacturing, rebuilding or refurbishing’, fernand j. weiland, ISBN-10: 3000523812.
Weiland, F. (2019), ‘Make-new-again: Remanufacturing support to the transition to a circular economy’, JRC internal seminar, 5 November 2019.
Weymar, E. and Finkbeiner, M. (2016), ‘Statistical analysis of empirical lifetime mileage data for automotive LCA’, The International Journal of Life Cycle Assessment, Vol. 21, pp. 215–223, doi:10.1007/s11367-015-1020-6.
Witkamp, B. (2018), ‘Relevance of rare earths recycling from permanent magnets’, EVS 31 & EVTeC 2018, 1–3 October 2018, Kobe, Japan.
Witkamp, B., van Gijlswijk, R., Bolech, M., Coosemans, T. and Hooftman, N. (2017), The transition to a zero emission vehicles fleet for cars in the EU by 2050 – Pathways and impacts: an evaluation of forecasts and backcasting the COP21 commitments, European Alternative Fuel Observatory.

89
Yano, J., Muroi, T. and Sakai, S. -I. (2016), ‘Rare earth element recovery potentials from end–of-life hybrid electric vehicle components in 2010–2030’, Journal of Material Cycles and Waste Management, Vol. 18, pp. 655–664, doi:10.1007/s10163-015-0360-4

90
Abbreviations
3D three-dimensional
ACEA European Automobile Manufacturers’ Association
ADP Abiotic Depletion Potential
APRA Automotive Parts Remanufacturers Association
AV Autonomous Vehicles
BaU-sc Business as Usual scenario
BEV Battery Electric Vehicles
BoM Bill of Materials
CAV Connected and Automated Vehicle
CM-sc Circular Mobility scenario
CO2eq carbon dioxide equivalent
COVID-19 coronavirus disease 2019
CRM Critical Raw Material
EEE electronic and electrical equipment
ENTSO-E European Network of Transmission System Operators for Electricity
ELV End-of-Life Vehicle
EoL End of Life
ERN European Remanufacturing Network
EU European Union
FCEV Fuel cell Electric Vehicle
GADSL Global Automotive Declarable Substance List
GHG Greenhouse Gas
GWP Global Warming Potential
H2020 Horizon 2020
HEV Hybrid Electric Vehicle
ICEV internal combustion engine vehicle
IMDS International Material Data System
IM-sc Improved Mobility scenario
IPCC Intergovernmental Panel on Climate Change
IR-sc Improved Remanufacturing scenario
JRC Joint Research Centre
LCA Life Cycle Assessment
MaaS Mobility as a Service
MFA Material Flow An analysis
OEM Original Equipment Manufacturers
OES Original Equipment Supplier
PCB printed circuit board
PGM platinum group metal
PHEV Plug-in Electric Vehicle

91
PM Permanent Pagnet
POM placed on the market
REE Rare Earth Element
SMART Sustainable use of Materials through Automotive Remanufacturing to boost resource efficiency in the road Transport system
SRM Secondary Raw Material
xEV Electrified Vehicle

92
List of figures
Figure 1: Schematic representation of the report and the links between chapters ................................. 3
Figure 2: Total number of vehicles in-stock in the urban mine in average number of pieces (left) and weight (right) per person .......................................................................................................................... 4
Figure 3: Future mobility scenarios’ dependencies ................................................................................ 5
Figure 4: H2020 funded projects ............................................................................................................ 6
Figure 5: Some of the available forecasts about EU mobility in the literature ........................................ 7
Figure 6: Global car-sharing growth, 2006–2014 ................................................................................... 7
Figure 7: Levels of automation and their timescale ................................................................................ 8
Figure 8: Trends in autonomous vehicle (AV) market share .................................................................. 8
Figure 9: Classification of different type of reuse and the criteria to define ‘remanufacturing’ ............ 11
Figure 10: Classification of cores ......................................................................................................... 11
Figure 11: Main actors involved in remanufacturing process ............................................................... 12
Figure 12: Main steps involved in the remanufacturing process .......................................................... 14
Figure 13: RemPro matrix showing the relationship between product properties and remanufacturing steps ...................................................................................................................................................... 14
Figure 14: Remanufacturing barriers .................................................................................................... 19
Figure 15: Impacts of remanufacturing on the automotive sector based on the evolution of technologies ............................................................................................................................................................... 19
Figure 16: Trends in materials in vehicles ............................................................................................ 21
Figure 17: Overview of Critical Raw Materials (CRMs) in vehicles ...................................................... 24
Figure 18: Conceptual visualisation of the SMART model ................................................................... 31
Figure 19: Graphic representation of the Bill of Materials (BoM) for four different types of vehicle..... 32
Figure 20: Scenarios for the analysis ................................................................................................... 35
Figure 21: Example of SMART model sales projection: (a) moderate xEV adoption; (b) slow xEV uptake; (c) fast xEV uptake ................................................................................................................................ 39
Figure 22: Weibull distribution probability density and cumulative probability based on vehicle kilometres .............................................................................................................................................. 40
Figure 23: Internal combustion engine vehicles (ICEV) and electric vehicles (xEV) stock and end-of-life (ELV) data (right) ................................................................................................................................... 40
Figure 24: Vehicles’ mass placed on the EU market and generated as end-of-life (ELVs) per type of vehicle .................................................................................................................................................... 41
Figure 25: Value-chain of vehicles in the EU ....................................................................................... 42
Figure 26: Flows of materials in the EU fleet in 2020 and 2050 for the BaU-sc (Business as Usual scenario) and the CM-sc (Circular Mobility scenario) ........................................................................... 45
Figure 27: Flow of materials of the unknown whereabouts (top) and collection rate (bottom) in the BaU-sc (Business as Usual scenario) and the CM-sc (Circular Mobility scenario) in different years ........... 50
Figure 28: Flow of materials available for recycling (top) and EOL-RIR/RR (bottom) in the BaU-sc (Business as Usual scenario) and the CM-sc (Circular Mobility scenario) in different years ................ 50
Figure 29: Flow of materials kept in the system as a result of remanufacturing in all the assessed scenarios ............................................................................................................................................... 51
Figure 30: EOL-RIR and EOL-RR of steel in all the assessed scenarios ............................................ 51
Figure 31: Proposed EU’s pathway to sustained climate neutrality, 1990–2050 ................................. 52

93
Figure 32: System boundaries for the LCA .......................................................................................... 53
Figure 33: Estimations for the evolution of relative energy consumptions per km (MJ/km) over time for xEVs and ICEVs .................................................................................................................................... 54
Figure 34: Trends in EU electricity production mix by source according to the references presented in Table 12 ................................................................................................................................................. 55
Figure 35: Carbon intensity of the EU electricity mix (medium voltage) adapted from current ecoinvent datasets – kg CO2eq/kWh produced (based on references presented in Table 12) .............................. 55
Figure 36: GWP (kg CO2eq) of one passenger car (lower medium segment) according to the powertrain for the year 2015 – diagram of contributions for ICEVs, PHEVs and BEVs ......................................... 58
Figure 37: Comparison of GWP100 results per functional unit (kg CO2eq/km) for all segments and powertrains for four time periods ........................................................................................................... 61
Figure 38: Life-cycle GWP (Global Warming Potential) for the BaU-sc (Business as Usual scenario) in different years ........................................................................................................................................ 62
Figure 39: Comparison between the GWP (Global Warming Potential) per kilometre in the BaU-sc (Business as Usual scenario) considering a fixed lifetime (left graph) and the GWP per kilometre in the BaU-sc with an increased lifetime (right graph)..................................................................................... 63
Figure 40: Life-cycle GWP (Global Warming Potential) in the BaU-sc (Business as Usual scenario) in different years and with an increase in the lifetime of vehicles of 25 % ................................................ 63
Figure 41: GWP (Global Warming Potential) of electric motors (lower medium segment) for different years ...................................................................................................................................................... 64
Figure 42: GWP (Global Warming Potential) of electric motors (lower medium segment) with and without remanufacturing ........................................................................................................................ 64
Figure 43: Materials embedded in electric motors not collected due to ‘unknown whereabouts’ in different years ........................................................................................................................................ 65
Figure 44: Neodymium embedded in electric motors available for recycling and recovered in different years ...................................................................................................................................................... 66
Figure 45: Dysprosium embedded in electric motors available for recycling and recovered in different years ...................................................................................................................................................... 66
Figure 46: GWP (Global Warming Potential) of electric motors in the EU fleet for different years considering all motors newly manufactured .......................................................................................... 67
Figure 47: GWP (Global Warming Potential) of electric motors in the EU fleet for different years considering an increasing share of remanufactured electric motors over time ..................................... 67
Figure 48: SMART tool interface – vehicle sales and data export panel ............................................. 68
Figure 49: SMART tool interface – ELV panel ..................................................................................... 69

94
List of tables
Table 1 : European demand for aftermarket spare parts and remanufacturing rates, estimated for the year 2012 ............................................................................................................................................... 15
Table 2 : Environmental studies dealing with remanufacturing of car components ............................. 17
Table 3: Summary of the main barriers identified in some of the studies consulted in the literature review on remanufacturing of vehicles ............................................................................................................. 20
Table 4: Example of Bill of Materials (BoMs) available in the literature ............................................... 21
Table 5: Mass concentration results for various selected elements in the microwave-digested samples ............................................................................................................................................................... 28
Table 6: Average weight of the four segments of vehicles considered in the assessment .................. 32
Table 7: Energy consumption per kilometre for ICEV fossil fuel .......................................................... 33
Table 8: Energy consumption per kilometre of electric vehicles (xEVs) ............................................... 33
Table 9: Scale and shape parameters for different types of vehicles according to the performed literature review .................................................................................................................................................... 34
Table 10: Summary of the main assumptions in the four scenarios considered for the assessment .. 37
Table 11: Parameters used in the MFA model to assess different scenarios ...................................... 44
Table 12: Car lifetime distance travelled (mileage) according to the powertrain and segment ............ 54
Table 13: Year of the car manufacturing and period of use ................................................................. 55
Table 14: Inventory subsystems for car manufacturing and use phase ............................................... 56
Table 15: Scaling coefficients obtained from mass ratio for each segment and powertrain ................ 57
Table 16: Manufacturing phase – GWP100 results (kg CO2eq) according to the segment, powertrain and year of manufacturing ............................................................................................................................ 59
Table 17: Use phase – GWP100 results (kg CO2eq) for the total mileage according to the segment, powertrain and period of use ................................................................................................................. 59
Table 18: Maintenance operations – GWP100 results (kg CO2eq) for the total mileage according to the segment, powertrain and period of use of the passenger car ............................................................... 60
Table 19: Manufacturing, maintenance and use phase contribution to GWP100, expressed in (kg CO2eq/km) .............................................................................................................................................. 60

95
Annexes
Annex 1. Research support to develop knowledge and capacity in the area of remanufacturing of components and materials in the automotive sector
A1.1. Introduction
The goal of this contract was to support the JRC in better understanding current and future remanufacturing practices. In particular, the two objectives were:
1. to provide information about the vehicle parts that are collected from ELVs or from vehicles under maintenance and repair to be remanufactured;
2. to explore current or future remanufacturing processes of parts used for future mobility (e.g. for xEVs).
A1.2. Methodology
The following tasks were carried out to reach the objectives.
— An analysis of remanufactured and rebuilt vehicle parts put on the EU aftermarket. The analysis considered a breakdown of the already existing 2012 statistics.
— An analysis of updated statistics on remanufactured and rebuilt vehicle parts put on the EU aftermarket. The investigation considered the current (2018) situation and short-term future (2023) situation.
— A description about the remanufacturing process of electronic units and instrument electronics, and high -voltage electric motors.
— Average weights of parts. If possible, average or range of weights per part (kg/part) were specified.
— A discussion about the remanufacturing and/or rebuilding potential and limitations for xEV parts, such as traction batteries and high- voltage electric motors.
A1.3. A. European remanufacturing automotive car component industry – definitions
Remanufacturing. This is a standardised industrial process* by which cores are returned to same-as-new, or better, condition and performance. The process is in line with specific technical specifications, including engineering, quality and testing standards. The process yields fully warranted products.
*An industrial process is an established process that is fully documented and capable of fulfilling the requirements established by the remanufacturer.
Rebuilding. This is a process by which cores are returned to same-as-new, or better, condition and performance. The process is in line with specific technical specifications, including engineering, quality and testing standards. The process yields fully warranted products.
A1.4. B. Survey for components with useful feedback from the trade
NB: The figures quoted are all approximate estimations; they should not be used for business plans.
A1.4.1 Potential for remanufacturing of rotating machines for the period 2012–2023
Rotating machines include starter motors and generators/alternators.
The survey method was to interview remanufacturers and ask them about trends in the remanufacturing volume evolution since 2012 and their views on the next period to 2023.
1) How have remanufacturing volumes evolved since the last survey made in 2012? The bottom line of the interviews was that remanufacturing production did not progress, though the market demand for remanufactured units did in fact rise. The main reason why remanufacturing/production did not progress was that new copied units from Asia entered the market and replaced some of the demand for remanufactured units. Unfortunately, some distributors of remanufacturing products prefer not to return old units and tend to give new products (from Asia) first choice.

96
2) How do you see the remanufacturing production volumes changing from 2017 to 2023? The demand for remanufacturing products will be flat at best. The design of the units has improved, leading to lower failure rates resulting in less demand. Unfortunately, the trend for replacing remanufacturing units with new units from Asia will continue, leading to another reduction in remanufactured/production units.
3) By looking at the three categories of remanufacturers (OEMs, Tier 1 and independents), how will each perform over the period 2012–2023? Like for questions 1 and 2, it is extremely difficult to quote numbers. Some large remanufacturers claim that they are not losing business to the competition of new units from Asian manufacturers, but others admit a decline. Most SME remanufacturers all admit losses over the period.
A1.4.2 Potential for remanufacturing of power steering for the period 2012–2023
In 2012, we estimated a European annual car hydraulic power steering (pumps and racks) remanufacturing volume of approximately 800 000 units.
During the period 2012–2017, with the introduction of electric hydraulic power steering and electric (pinion and column) power steering, the total volume of remanufacturing power steering grew.
During the next period 2018–2023, the remanufacturing volume for hydraulic power steering will decline, while for electric power steering it will continue to grow moderately but not compensate for the loss of hydraulic steering. In total, power steering will decline.
New Asian copied hydraulic pumps (for cars and Heavy Duty) are developing rapidly.
The potential for remanufactured Heavy Duty power steering has been stable over the last period (2012-20017), with an opportunity for future small growth.
A1.4.3 Potential for electronic controllers and instrument for the period 2012–2023
The business for electronics and instruments has been stable over the period 2012–2018, though there has been some growth. For the future period 2018–2023, growth will certainly be higher.
Unfortunately, the remanufacturers are very reluctant to quote numbers. OE (Original equipment remanufacturers) remanufacturers and many independent remanufacturers are sharing this market. The complexity and the fierce competition of this remanufacturing sector are probably the reasons why it is not open to communicating data.
A1.4.4 Potential for combustion engine for the period 2012–2023
1) For remanufacturers of engines for off-road vehicles and for industrial applications, production/demand has been stable since 2012, and it will be a similar amount for the period up to 2023.
2) For car engines and truck engines, remanufacturing has been stable since 2012 and will grow slowly during the next period up to 2023. This evolution is not valid for all remanufacturers; some gained business, others lost business. Large remanufacturers (OEMs and independents) will grow at the expense of small remanufacturers.
3) Specialised remanufacturers will, in the future, benefit from the problems garage dealers will encounter in servicing/repairing cars with new technologies. The stress and lower reliability of new engine technologies (downsizing, Stop & Go, turbocharger and electronics) will cause higher failure rates and benefit the business of specialised remanufacturers.
4) The level of willingness to invest in the future of remanufacturing is low for many small remanufacturers, modest for OEMs and high for specialists/medium-sized independent remanufacturers.
NB: To conclude, figure for the remanufacturing of engines the same as for the whole automotive remanufacturing industry, which is in a transition phase.
A1.4.5 Potential for clutches for the period 2012–2023
The survey method was to interview remanufacturers and ask them about trends in the remanufacturing volume evolution since 2012 and their views on the next period up to 2023.

97
1) OE remanufacturers of car clutches, in the past, dominated this market, leaving little room for independent remanufacturers.
2) OE remanufacturers have in the meantime significantly reduced their remanufacturing operations for car clutches but now focus on Heavy Duty clutches.
3) As a consequence for the EU aftermarket, car parts distributors and car manufacturers now focus on selling new clutches.
4) Few independent remanufacturers are still in the business of remanufacturing car clutches.
A1.4.6 Potential for constant velocity (CV) drive shafts for the period 2012–2023
1) In recent years (and probably in the future), the remanufacturing volumes in Europe have been declining because of the improved OE quality and reliability.
2) The ‘Tier 1’ companies are still very dedicated to remanufacturing and continue to supply remanufacturing CV drive shafts to the car manufacturer and the independent trade.
3) The competition from Chinese new copied products has increased significantly.
4) As a consequence of 1) and 3), the remanufacturing volumes in Europe are declining, though slowly.
A1.5. C. Survey for components with poor data inputs from the trade
For the following components, little information was obtained from the trade. The information quoted here is based on the estimation the expert made from former knowledge. To obtain better results, a further study would be required.
— Injection equipment. The remanufacturing business for petrol injection was stable and will stay at the same level. For Diesel Injection, the remanufacturing business was stable but will decline in the future.
— Turbocharger. This is an attractive product, since the equipment is growing substantially in modern cars. The remanufacturing business will benefit greatly from this evolution.
— Brake calipers and components. This remanufacturing business is stable and growing but will mature in the future.
— Transmissions remanufacturing. This is an attractive and growing business, mainly because the proportion of automatic transmission equipped in modern cars is growing all the time. However, it may mature in the medium- term future.
— AC compressor. This is a difficult remanufacturing business. The proportion of new vs remanufacturing is much higher. The new copied units from Asia are disturbing the remanufacturing business.
A1.6. D. Traditional mechanical remanufacturing versus electronics remanufacturing
Mechanical components are usually exposed to the combustion engine environment and are, as a consequence, greasy and corroded. Dismantling them is difficult and painful for workers and cleaning them with chemical products is intensive. All the subcomponents are treated, rebuilt and inspected individually. The production is performed in lots, and the final component is reconstructed with parts selected at random. In other words, the original unit loses its identity. The final test of mechanical components (or electrical components) is most of the time run on ‘standard’ test machines.
Returned electronic controllers (and instrument clusters) are physically in a much better condition and will be processed in a much cleaner environment. Fully dismantling them is not necessary. However, it is not just about opening the case and repairing the defective component, but also a full inspection of all components and a replacement of all critical components. For remanufacturers, it is often a tough challenge to get access to the final required performances (and software) of the unit to be remanufactured. Often, reverse engineering is the only method required. Test machines for diagnosis or final test are not available; they must be specially built for that purpose by the remanufacturer. The electronic process compared with the mechanical one looks like the example below.
1. The unit is not completely disassembled, only the PCB is separated from the metal case.
2. Extensive cleaning is not required.

98
3. Inspection of the PCB.
4. Component replacement of all critical components, not only the one that failed.
5. The PCB is tested in semi- assembled status, then water ingress protection is applied, followed by final assembling.
6. Final inspection on a test machine.
A.1.7. E. Electric cars – remanufacturing of motors and batteries
Regarding electric and hybrid cars and their electric motors, the current remanufacturing volume is practically non-existent. OEMs prefer to sell new units. The potential remanufacturing business volume is currently so low that remanufacturers have not yet started to remanufacture. For the period 2018–2023, the start of remanufacturing motors and batteries can be envisaged with aftermarket volumes of around 1 % for batteries and 0.5 % for motors of the vehicles in use. Assuming a number of 10 million hybrid and electrical cars in use, the aftermarket volumes will amount annually to approximately 100 000 batteries and 50 000 electric motors. It is difficult to say at this juncture what proportion of this will be remanufactured.
However, the real start of remanufacturing motors and batteries will occur in 2030. By that date, the number of electric, hybrid and mild hybrid cars in use will be approximately 40 million. With a failure of 0.5 %, the annual potential for the remanufacturing volume could start around 100 000 motors and reach 200 000 by 2035.
Combustion engines have many components such as a camshaft, a crankshaft, a cylinder head, pitons and bearings, and all parts need to be machined and reconditioned. This is labour intensive. Many machines and a lot of equipment are necessary.
Electric motors, induction motors or permanent magnet synchron motors are much simpler; they consist of only a stator, a rotor and bearings. Remanufacturing is, in principle, much easier than an internal combustion engine. Changing the bearings is not a problem, but the main challenge will be replacing failed windings of the stator or rotor for which processes do not exist yet.

99
Annex 2. Visits to remanufacturing and ELV recycling plants
During the first year of the project, visits were organised to observe the processes of a vehicle-part remanufacturing plant and an ELV recycling plant. Both sites are based in Europe.
A2.1. Visit to remanufacturing plant
The visited remanufacturing plant processes more than 1 000 different products and provides almost 30 % of aftermarket spare parts. The inputs (cores) are provided by a network of garages, dismantlers and more than 300 demolishers. Vehicles parts processed at the remanufacturing plant are mainly proprietary parts (engines, transmissions), with the possibility of also remanufacturing some specific parts provided by suppliers (e.g. turbochargers, injection pumps, injectors). Nowadays, the so-called minor manufacturing (e.g. automotive parts such as injectors) is performed less and less by car makers, which are served by suppliers.
The remanufacturing plant produces spare parts for the aftermarket, ensuring that spare parts are also available 10 years after the manufacturing of the last car of a given model. Indeed, from 2014 onwards the remanufacturing plant started treating variable geometry turbochargers, electric powertrain components and electric power- steering systems (but only mechanic parts), and diesel particulate filters .
The remanufacturing process involves the following processes: core identification, stripping (full disassembly), washing (up to five different types of washing with chemical agents) and cleaning (which may be abrasive and is done with brushes), sorting (different steps of sorting), remanufacturing, parts assembly, testing (visual, noise, vibrations, etc.), packaging and shipping. Note the following.
— The remanufacturing process involves mainly mechanical parts, whereas for electronic parts (almost all are provided by suppliers) skills and knowledge are lacking, as well as the tools to check electronics and the propriety of the suppliers.
— Along this chain, some components (fasteners, gaskets, etc.) are necessarily replaced with new ones, because it is almost impossible to determine their quality.
— About 70 % of core material in input at the remanufacturing plant is valorised through remanufacturing, whereas the remaining 30 % is recycled in foundries. In the case of engines, the ratio is 1.4 engines in input to 1 remanufactured engine.
Remanufactured parts are available as spare parts for the aftermarket, with a 1-year warranty. The limitation highlighted during the visit was the lack of diagnosis tools to assess the quality of used components. Given this, the experience of skilled technicians is key, but remanufactured parts are not used in new vehicles.
One limitation that emerged from the visit to the field is that some countries (Russia, Turkey, etc.) are not allowing remanufactured parts to be used as vehicle spare parts. Focusing on future mobility, it emerged that (1) the current rapid change will have an effect on remanufacturing only in some years; (2) remanufacturing of new xEV components is at a laboratory scale right now; (3) knowledge and tools from suppliers will be needed to plan remanufacturing at the software level; and (4) the increase in mobility as a service will ensure higher collection rates.
A2.2. Visit to ELV recycling plant
The visited ELV recycling plant, with its dismantling, shredding, post-shredding and sorting assets, treats an average of 120 cars per day, with a potential maximum capacity of 200 cars per day. The main steps include (1) dismantling and depollution, (2) spare parts collection, (3) shredding and (4) treatment of shredder residues. The key features of these four steps of the ELV recycling plant are summarised hereafter.
1. The parts and materials removed during depollution are batteries, wheels (because of tyres), all fluids, oil filters, liquefied petroleum gas (LPG) and compressed natural gas( CNG) tanks, and catalytic converters.
2. Other parts are collected only if traders are interested in having spare parts for repair. In the event that other parts have to be collected, operators are informed before the secure dismantling and depollution. These parts are mainly collected to be exported.
3. In the shredding step, the rest of the car is pressed (glass included) and then sent to a mechanical shredder, which reduces the size of all kinds of materials.
100
4. In the sorting step, shredded material flows are treated. The goal is to have an efficient sorting of shredded materials, such as ferrous metals, non-ferrous metals, plastics and shredded residue (light fraction). The flows of ferrous metals, non-ferrous metals and plastics represent 80 % of the materials, whereas the light fraction accounts for the remaining 20 %.
The discussion with car recyclers also included a discussion about limitations and the potential of ELV recycling. ELV dismantlers and recyclers need to understand where problematic or strategic parts are located. Firstly, legislation obliges recyclers to depollute the car (batteries, fluids, tires, etc.). Secondly, certain components also represent an important economic value if properly collected and sorted before shredding, such as the catalytic converter, which is rich in platinum.
It was also remarked that the more circular the automotive industry is, the less carmakers are subject to ‘law pressure’. Cases of closed loops, such as the remanufacturing of automotive parts by the same original manufacturer, subsequently represent an interesting circular- economy option.
As remarked by the Parker (2015), platinum and other PGMs are recycled to some extent, but there are no dedicated procedures or processes for recovering and recycling other CRMs, e.g. neodymium, and other REEs from key components.

101
Annex 3. Elemental composition measurements of electronic waste by total reflection X-ray fluorescence
Note that this activity was realised, thanks to collaboration with colleagues of the JRC.F.2 units, in particular Douglas Gililandand and Dora Mehn.
A.3.1. Introduction
PCBs are an essential component of several products, including electrical and electronic equipment and vehicles. Knowledge of the chemical composition of PCBs is crucial to enabling enhanced recycling, especially for CRMs, which are relevant because of their economic importance and supply risk (e.g. precious metals or several specialty metals) (46) (47).
There is still little knowledge of CRM content in PCBs for several reasons, which include (1) a large variability among different components in different applications; (2) quick changes in composition of PCBs due to technological changes in the electronics; (3) a lack of robust databases about material composition of PCBs; and (4) a lack of standardised methods for laboratory analysis of composition of PCBs.
Some experimental analyses have been conducted in the literature about material composition in EEE (48) (49) (50) (51) (52). However, very little knowledge is available so far concerning the composition of PCBs in vehicles.
As current practice, the IMDS (53) tool is used by the automotive manufacturers to collect information from their supply chain. This allows them to have a detailed picture of every component currently used in vehicles. However, in relation to PCBs and other electronic components in vehicles, it was decided that average reference values (as contained in the so-called Recommendation 019 (54)) would be referred to. These recommendations were created to ease the data submission process for electronic components in the automotive industry and have long been in place (55). In September 2019, the IMDS Steering Committee voted to deactivate Rec 019, because material compositions were not properly investigated and Rec 019 modules were being used to hide prohibited substances, such as lead (56).
The present research (including the development of the testing method and the analysis of some PCB samples) was conducted in relation to the exploratory research project SMART (57). In particular, it aims to increase the knowledge base on the composition of PCBs used in automotive components.
A3.2. Selection and pre-treatment of the samples
The first step of the research referred to the collection of some samples of PCBs used in vehicles. Three data sources were used:
— PCBs from vehicles reaching their EoL and being treated by a car scrapper,
— PCBs from components of vehicles (i.e. batteries), sorted out by reuse operators for their potential reuse,
— PCBs from new components for vehicles.
(46) https://www.sciencedirect.com/science/article/pii/S0956053X19302922?via %3Dihub (47) https://op.europa.eu/s/nDXv (48) https://www.sciencedirect.com/science/article/pii/S0956053X19302922?via %3Dihub (49) https://www.sciencedirect.com/science/article/pii/S0304389414007705 (50) https://www.sciencedirect.com/science/article/pii/S0956053X11003114 (51) https://www.sciencedirect.com/science/article/pii/S0956053X09000853 (52) https://www.sciencedirect.com/science/article/pii/S0301479710003890 (53) https://www.mdsystem.com/imdsnt/startpage/index.jsp (54) https://www.multi-circuit-boards.eu/fileadmin/pdf/glossar/imds_recommendation_019_circuit_boards.pdf (55) Automotive manufacturers are required to disclose accurately all materials used throughout the automotive supply chain. To do this,
companies must collect material data from all suppliers and then incorporate those data into the final assembly in the IMDS. Because of the complex material compositions and the very small weights of the components in an electronics assembly, the reporting of these materials was no easy feat. In 2003, the IMDS Steering Committee developed IMDS Rec 019, intending to ease the burden of reporting the necessary data for electronic components. It has allowed IMDS users to employ standard modules, which were published as semi-component datasheets with fixed materials and weights.
(56) https://blog.assentcompliance.com/index.php/imds-recommendation-impact-on-electronic-suppliers/ (57) The SMART project aims to develop knowledge of resource efficiency practices and to evaluate promising strategies to boost resource
efficiency in the automotive sector, with a special focus on CRMs.

102
These samples are considered quite heterogeneous in terms of age and application in the vehicle (as detailed in the Table A3.1). It is expected that this will allow a large variability in terms of material composition of the PCBs.
Table A3.1: Description of the three samples
No Type Source of the sample Age (estimated)
Sample 1 Car central control unit PCBs
Extracted from a vehicle at the EoL (from a car scrapper)
10–15 years
Sample 2 Seat control PCBs Extracted from a new component New (1 year old)
Sample 3 PCBs from battery management system
Extracted from an xEV’s battery, extracted for preparation for reuse
5–10 years
The samples were pre-treated in the scientific laboratory of STIIMA-CNR (Laboratory for Re-De/manufacturing (58)), to be shredded up to a size below 300 μm so that they would then be suitable for further treatment and the testing.
A3.3. Testing instrument: total reflection X-ray fluorescence
TXRF was used for the testing of the material composition of the samples. TXRF is an energy dispersive X-ray fluorescence technique arranged in a special geometry. An incident beam is directed onto a polished flat sample holder at angles below the critical angle of external total reflection for X-rays, resulting in the reflection of most of the excitation beam photons. The sample is deposited as a thin film on the sample holder. When X-ray photons hit an inner shell electron in an atom, the electron moves to a higher energy level and the atom goes into an excited state. Then the missing inner shell electron is replaced by an electron from an outer shell. The energy difference between the inner and outer shells is emitted as a photon (fluorescence). The energy, and therefore the wavelength of this fluorescence photon, is characteristic of the different chemical elements allowing qualitative analysis. The intensity of the X-ray fluorescence radiation is proportional to the element concentration allowing quantitative analysis in the presence of the known amount of internal standard. The special geometric arrangement of some TXRF spectrometers with horizontally stored and irradiated sample holders also allows the analysis of powder samples with a typical particle size of < 300 µm.
Preliminary measurements (Figure A3.1) suggested that the TXRF might be a useful tool in the evaluation of elemental composition of electronic waste samples.
Figure A3.1: Preliminary results comparing Inductively Coupled Plasma (ICP-AES) (orange) and TXRF (blue)
results of ground electronic waste fractions
NB: ICP-AES = Inductively Coupled Plasma – Atomic; Emission Spectrometry; TXRF = TXRF = Total Reflection X-ray Fluorescence
(58) https://www.stiima.cnr.it/it/index.php?sez=9&ssez=4

103
Samples for ICP-AES study were treated by microwave digestion in the presence of aqua regia and H2O2. Samples for the TXRF pilot study were digested using aqua regia at room temperature, applying a 48 -hour digestion time.
The large particle size was found to be one of the parameters that was most probably strongly contributing to the relatively high differences between subsamples inside one laboratory. Therefore, samples were ground to a particle size of < 300 µm, which also allowed the testing of the theoretical capability of TXRF in the direct analysis of fine powder samples.
A3.4. Materials and methods
The PCB samples were collected and pre-treated as described above.
All chemicals were purchased from Sigma-Aldrich if not stated otherwise. A direct analysis of fine powder samples was tested by using sample 1, suspending about 100 mg of powder in 200 µL of 1 % Triton X -100 solution and adding an aliquot of titanium standard solution to it (10 mg/l final concentration). A drop (5 µl) of the homogenised suspension was deposited onto an acrylic sample holder disc and left to air-dry on a hot plate at 45 °C. Samples were analysed in triplicates.
The optimisation of the digestion method was performed using sample 1. The powder was homogenised by shaking the container bag. Subsamples of about 0.5 g were weighted using an analytical balance (0.1 mg resolution) and transferred to pre-cleaned (10 % HNO3, MilliQ water) and dried glass microwave digestion tubes. During the ‘cold’ digestion process, 8 ml of aqua regia (1:3 ccHNO3: ccHCl) was slowly added to the samples, followed by the drop- by -drop addition of 1 ml of concentrated H2O2 solution. Samples were left to get dissolved overnight. During the ‘microwave’ digestion process, the samples (sample 1, sample 2 and sample 3) were prepared in a similar way, but a Teflon -coated stirrer was added to each vial; the vials were transferred to an automatised CEM Explorer SP-D microwave digestion system and treated at 220 °C for 10 minutes (after 10 minutes, the temperature was ramped up to the final temperature).
The digested samples were filtered using 100 kDa filters (Millipore), the filtrate was diluted to 15 ml, and the mass of the filtrate was determined using an analytical balance. The samples were further diluted (1 000 times for measuring elements in high concentrations and 100 times for measuring trace elements) in 10 % HNO3, and, after the addition of the titanium internal standard (10 mg/l final concentration) and 0.1 % Triton X- 100 solution, drops of 5 µl were deposited on acrylic sample holders. The samples were prepared in triplicates, air-dried on a hot plate at 45 °C and analysed immediately.
The TXRF measurements were performed in a S4 T-Star 4 TXRF spectrometer (Bruker) equipped with a molybdenum (and a W) X-ray source. Measurement data were collected for 600 s using the molybdenum source, and spectra were deconvoluted considering the presence of the elements highlighted in Figure A3.2. Titanium was selected as internal standard, as this element was not expected to be present in metal alloys used in PCBs.
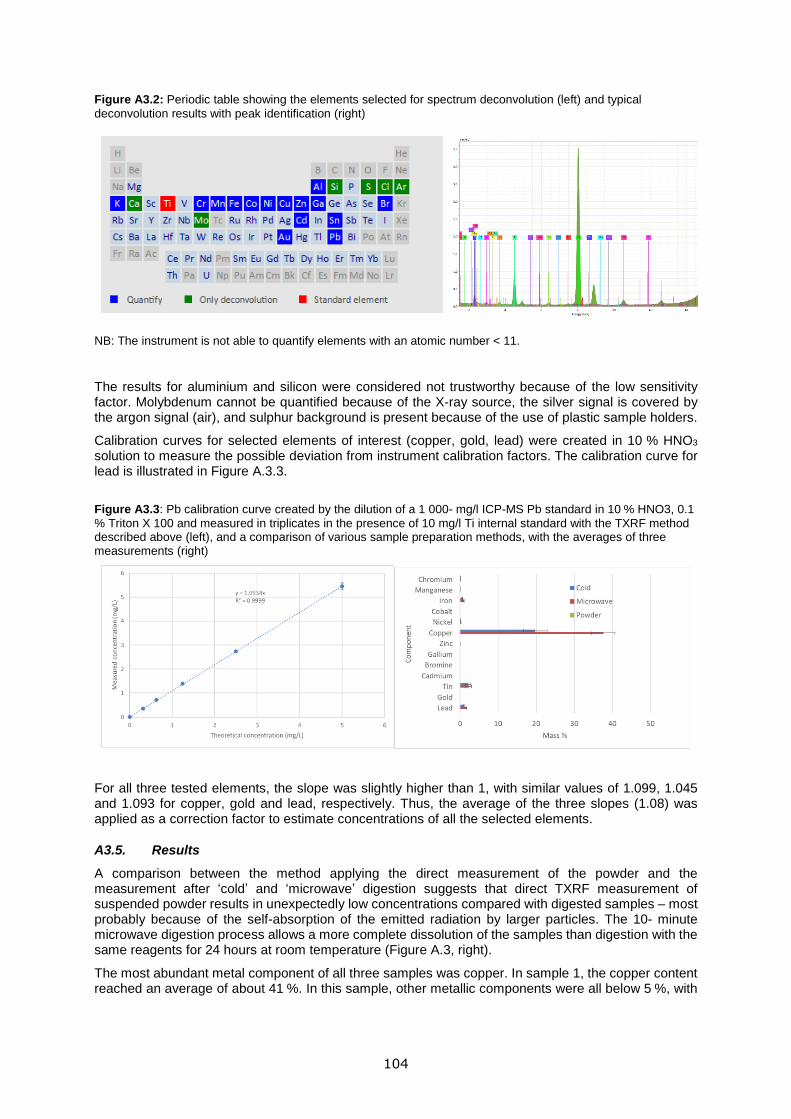
104
Figure A3.2: Periodic table showing the elements selected for spectrum deconvolution (left) and typical
deconvolution results with peak identification (right)
NB: The instrument is not able to quantify elements with an atomic number < 11.
The results for aluminium and silicon were considered not trustworthy because of the low sensitivity factor. Molybdenum cannot be quantified because of the X-ray source, the silver signal is covered by the argon signal (air), and sulphur background is present because of the use of plastic sample holders.
Calibration curves for selected elements of interest (copper, gold, lead) were created in 10 % HNO3 solution to measure the possible deviation from instrument calibration factors. The calibration curve for lead is illustrated in Figure A.3.3.
Figure A3.3: Pb calibration curve created by the dilution of a 1 000- mg/l ICP-MS Pb standard in 10 % HNO3, 0.1 % Triton X 100 and measured in triplicates in the presence of 10 mg/l Ti internal standard with the TXRF method described above (left), and a comparison of various sample preparation methods, with the averages of three measurements (right)
For all three tested elements, the slope was slightly higher than 1, with similar values of 1.099, 1.045 and 1.093 for copper, gold and lead, respectively. Thus, the average of the three slopes (1.08) was applied as a correction factor to estimate concentrations of all the selected elements.
A3.5. Results
A comparison between the method applying the direct measurement of the powder and the measurement after ‘cold’ and ‘microwave’ digestion suggests that direct TXRF measurement of suspended powder results in unexpectedly low concentrations compared with digested samples – most probably because of the self-absorption of the emitted radiation by larger particles. The 10- minute microwave digestion process allows a more complete dissolution of the samples than digestion with the same reagents for 24 hours at room temperature (Figure A.3, right).
The most abundant metal component of all three samples was copper. In sample 1, the copper content reached an average of about 41 %. In this sample, other metallic components were all below 5 %, with

105
the tin content amounting to 3.5 % and the lead concentration amounting to about 1.8 % (Figure A3.4). The average gold concentration of the three subsamples was found to reach 0.025 %.
Figure A3.4: TXRF analysis results of sample 1 – component concentrations determined at 1 000 × dilution of the
filtrate (left) and low concentration element contributions determined at 100 × dilution of the filtrate (right)
Sample 2 contains about 32 % of copper but a much higher amount of iron (an average of 16 %). The nickel content is also about four times higher, whereas the tin content of this sample is similar to that of sample 1. The gold concentration was found to be below the detection limit under the applied conditions (Figure A3.5).
Figure A3.5: TXRF analysis results of sample 1 – component concentrations determined at 1 000 × dilution of the
filtrate (left) and low concentration element contributions determined at 100 × dilution of the filtrate (right)
Sample 3 has the lowest total (extractable) metallic fraction content among the three samples, with about 26 % of copper and 2.5 % of iron. Although the tin content is also lower than the other two samples, zinc concentration reached more than 1.4 % concentration in sample 3 (Figure A3.6). The gold concentration was found to be below the detection limit under the applied conditions.
Figure A3.6: TXRF analysis results of sample 1 – component concentrations determined at 1 000 × dilution of the
filtrate (left) and low concentration element contributions determined at 100 × dilution of the filtrate (right)

106
Table A3.2 summarises the detected concentrations for various selected elements in the three samples.
Table A3.2: Mass concentration results for various selected elements in the microwave -digested samples
Element Sample 1 Sample 2 Sample 3
Mass (%) Standard deviation
Mass (%) Standard deviation
Mass (%) Standard deviation
Chromium 0.046 0.007 0.052 0.002 0.057 0.011
Manganese 0.014 0.003 0 0 0.005 0.002
Iron* 1.020 0.080 16.200 2.200 2.480 0.250
Cobalt 0.003 0.001 0.022 0.006 0 0
Nickel 0.130 0.020 0.630 0.040 0.340 0.060
Copper* 41.300 3.200 32.000 3.900 26.200 2.50
Zinc 0.025 0.008 0.021 0.001 0.980 0.110
Gallium 0 0 0 0 0 0
Bromine 0.017 0.004 0.043 0.010 0.056 0.050
Cadmium 0 0 0 0 0 0
Tin 3.490 1.700 2.980 0.190 1.510 0.110
Gold 0.025 0.006 0 0 0 0
Lead 1.760* 0.150 0.013 0.001 0.026 0.002
*Concentrations detected by applying 1000 × dilutions.
NB: The values represent the average of the mean concentrations determined for three independently measured and digested subsamples.
A3.6. Discussion
TXRF is a method that – theoretically – allows a simple multielement analysis of complex samples, including even fine powders. Our results show that a good- quality analysis of electronic waste samples by TXRF still requires a laborious method development process, including sample digestion, measurements of various dilutions to reach the linear signal versus the concentration range of various elements, and calibration of the instrument by using standards in the relevant matrix. In these kind of samples, metallic elements are partially embedded in plastic components, thus oxidative digestion of the sample seems to be inevitable. Although large particles do not allow the precise analysis of powder samples, the presence of smaller, colloid- sized aggregates is not a problem for the detection system. The concentrations of tin that are present as precipitated fine colloid under the applied sample digestion conditions were not reported by laboratory 1 using ICP-AES. The detection of tin seems to be less critical when using TXRF – even if the large relative standard deviations between samples from the same vial might indicate that the compound is not homogenously dispersed in the suspension.
Unfortunately, no universal TXRF method can be set up for the analysis of all interesting elements. However, the analysis of silver can be solved by measuring samples in the nitrogen flow, and elements with spectral lines overlapping with the actually used internal standard (titanium) might be analysed by applying another standard ( such as gallium).
Our measurements confirmed that various car electronic components show different compositions. The central control unit PCB of a vehicle was proven to be the richest in valuable metal components including gold (Figure A3. 7). These high values could also be related to the higher age of the sample (10–15 years) and older technologies adopted for the manufacturing of PCBs. The same sample also contained the highest concentration of lead. The other two samples are good examples of electronic circuit boards in which conventional high lead -containing solder alloys were most probably replaced by new alloy materials containing less lead and, for example, more zinc in the case of sample 3.
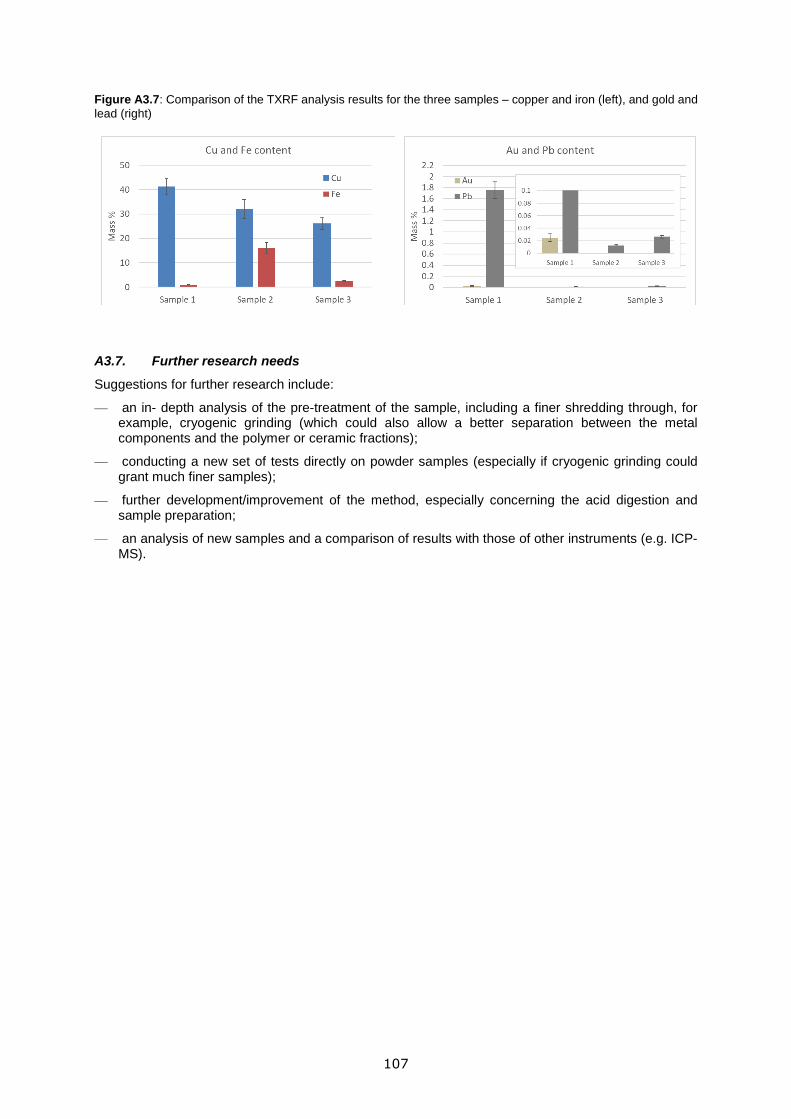
107
Figure A3.7: Comparison of the TXRF analysis results for the three samples – copper and iron (left), and gold and
lead (right)
A3.7. Further research needs
Suggestions for further research include:
— an in- depth analysis of the pre-treatment of the sample, including a finer shredding through, for example, cryogenic grinding (which could also allow a better separation between the metal components and the polymer or ceramic fractions);
— conducting a new set of tests directly on powder samples (especially if cryogenic grinding could grant much finer samples);
— further development/improvement of the method, especially concerning the acid digestion and sample preparation;
— an analysis of new samples and a comparison of results with those of other instruments (e.g. ICP-MS).

108
Annex 4. Notes for MFA calculations
A4.1. Notes for the sales estimation
Past data (between 1990 and 2018) on sales are derived from ACEA (2018a). Sales from 2018 and 2050 were estimated through the neural network, using an S-curve (or logistic curve) approach. The results show that BEVs, PHEVs and HEVs will represent 35 %, 16 % and 3 % of the vehicles sales, respectively, in 2050 (16 %, 12 % and 4 % in 2030).
Until 2019, the number of sold ICEVs is derived from the diesel penetration rate of both ‘Diesel’ and ‘Petrol’ provided by different sources (ACEA, 2019b, 2020b; Agra CEAS Consulting and E4tech, 2015; ANFIA, 2018; JATO, 2017, Statista, 2019 (59)). From 2019, it is assumed that ‘Diesel’ vehicles make up 30 % of the ICEVs, which is aligned with 2020 data (Mathieu and Poliscanova, 2020).
A4.2. Notes for the segmentation
— Between 2000 and 2006, the share of small/lower medium/upper medium/executive vehicles is considered the same for both ICEVs and xEVs.
— Between 2007 and 2018, specific data for vehicles segment share are based on ACEA (ACEA, 2008, 2018b.
— Between 2019 and 2025, specific data for vehicles segment share are based on Grelier et al. (2019).
— From 2026 to 2050, the vehicles segment share is considered equal to the vehicles segment share of 2025.
A4.3. Notes for the import/export
Data from 2000 to 2018 are derived from Eurostat (product code: ‘781 – Motor cars and other motor vehicles for transport of persons’). From 2019 to 2050, overall import/export flows were calculated as the average ratio between the import/export and the POM for the previous 9 years. Note that it is assumed that, until 2030, no xEVs are exported (Grelier et al., 2019), and starting from 2031 a linear increase from 0 % to 10 % of the xEVs POM in 2050 is assumed. With regard to the import flow, it is assumed that all xEVs POM since 2011 are imported into the EU, whereas from 2011 imports of xEVs decrease (20 % of the total imports in 2050).
(59) https://www.statista.com/outlook/1000000/102/passenger-cars/europe#market-fuelVolumeShare

109

GETTING IN TOUCH WITH THE EU
In person
All over the European Union there are hundreds of Europe Direct information centres. You can find the address of the centre nearest you at: https://europa.eu/european-union/contact_en
On the phone or by email
Europe Direct is a service that answers your questions about the European Union. You can contact this service:
- by freephone: 00 800 6 7 8 9 10 11 (certain operators may charge for these calls),
- at the following standard number: +32 22999696, or
- by electronic mail via: https://europa.eu/european-union/contact_en
FINDING INFORMATION ABOUT THE EU
Online
Information about the European Union in all the official languages of the EU is available on the Europa website at: https://europa.eu/european-union/index_en
EU publications
You can download or order free and priced EU publications from EU Bookshop at:
https://publications.europa.eu/en/publications. Multiple copies of free publications may be obtained by contacting Europe
Direct or your local information centre (see https://europa.eu/european-union/contact_en).

KJ-N
A-3
05
67
-EN
-N
doi:10.2760/84767
ISBN 978-92-76-28645-5