sustainable utility placement via multi-utility...
TRANSCRIPT

University of Birmingham
Sustainable utility placement via Multi-UtilityTunnelsHunt, D.v.l.; Nash, D.; Rogers, Christopher
DOI:10.1016/j.tust.2012.02.001
License:Creative Commons: Attribution (CC BY)
Document VersionPublisher's PDF, also known as Version of record
Citation for published version (Harvard):Hunt, DVL, Nash, D & Rogers, C 2014, 'Sustainable utility placement via Multi-Utility Tunnels', Tunnelling andUnderground Space Technology, vol. 39, pp. 15-26. https://doi.org/10.1016/j.tust.2012.02.001
Link to publication on Research at Birmingham portal
Publisher Rights Statement:Eligibility for repository : checked 03/03/2014
General rightsUnless a licence is specified above, all rights (including copyright and moral rights) in this document are retained by the authors and/or thecopyright holders. The express permission of the copyright holder must be obtained for any use of this material other than for purposespermitted by law.
•Users may freely distribute the URL that is used to identify this publication.•Users may download and/or print one copy of the publication from the University of Birmingham research portal for the purpose of privatestudy or non-commercial research.•User may use extracts from the document in line with the concept of ‘fair dealing’ under the Copyright, Designs and Patents Act 1988 (?)•Users may not further distribute the material nor use it for the purposes of commercial gain.
Where a licence is displayed above, please note the terms and conditions of the licence govern your use of this document.
When citing, please reference the published version.
Take down policyWhile the University of Birmingham exercises care and attention in making items available there are rare occasions when an item has beenuploaded in error or has been deemed to be commercially or otherwise sensitive.
If you believe that this is the case for this document, please contact [email protected] providing details and we will remove access tothe work immediately and investigate.
Download date: 27. Dec. 2019

Tunnelling and Underground Space Technology 39 (2014) 15–26
Contents lists available at SciVerse ScienceDirect
Tunnelling and Underground Space Technology
journal homepage: www.elsevier .com/ locate/ tust
Trenchless Technology Research
Sustainable utility placement via Multi-Utility Tunnels
D.V.L. Hunt ⇑, D. Nash, C.D.F. RogersSchool of Civil Engineering, University of Birmingham, Birmingham B15 2TT, United Kingdom
a r t i c l e i n f o a b s t r a c t
Article history:Available online 3 March 2012
Keywords:SustainabilityMulti-Utility TunnelsEconomic modelling
0886-7798/$ - see front matter � 2012 Elsevier Ltd. Adoi:10.1016/j.tust.2012.02.001
⇑ Corresponding author. Tel.: +44 (0) 121 414 3544E-mail address: [email protected] (D.V.L. Hunt).
Due to the adoption of short-term planning cycles and the requirement for lowest initial constructioncosts, the conventional method for utility installation and maintenance in the UK is via open-cut. Whentaking a long-term sustainability perspective there is a growing body of evidence which indicates thatthis method is socially disruptive, environmentally damaging and significantly more expensive, i.e.unsustainable. One long-term solution to this problem could be the adoption of Multi-Utility Tunnels(MUTs); a tunnel that co-locates more than one utility underground facilitating their subsequent repairand renewal while eliminating the need for continuous surface excavation. Unfortunately considerablyhigher short-term direct costs remain a significant barrier to adoption of MUTs. However, there is a lackof research to show where the economic tipping point between the two methods occurs and how it mightbe influenced by utility type, pipe number (i.e. density), pipe diameter, number of excavation and rein-statement (E&R) procedures avoided, location (i.e. undeveloped, suburban and urban areas), and thechoice of MUT being adopted (i.e. flush-fitting, shallow and deep).
This paper aims to fulfil this research need by investigating the effect of these influences on the eco-nomic viability of various types of MUTs. The results indicate that MUTs can provide a more economicallysustainable method of utility placement in all three local contexts, with the tipping points occurringwhere street works are likely more frequent and/or where utility density is high.
� 2012 Elsevier Ltd. All rights reserved.
1. Introduction
For the last 200 years open-cut excavation (i.e. trenching) hasbeen the most widely adopted solution for placing utilities belowground in the UK (Rogers and Hunt, 2006). This solution mightbe considered economically appropriate over a century ago forthe installation of potable mains water networks and wastewaternetworks below ground; there were no alternatives available otherthan full-scale, man-entry tunnelling, and, with only these pipenetworks being located below ground, future disruptions wouldhave been assumed minimal. Allied to this, the ground surface inundeveloped, suburban and urban areas was primarily unpavedand considerably less dense than today. Moreover plentiful labourand construction materials existed while social and environmentalcosts were less well-defined, and either ignored or simply not con-sidered important enough to offset the health and other social ben-efits of clean water and sewerage provision.
In 2012 open-cut remains the most widely adopted solution forutility placement by practitioners and yet various alternativesolutions exist, such as trenchless technologies and Multi-UtilityTunnels (MUTs) (Canto-Perello and Curiel-Esparza, 2003;Curiel-Esparza and Canto-Perello, 2005; Ludovic et al., 2004).
ll rights reserved.
; fax: +44 (0) 121 414 3675.
Moreover open-cut, as an engineering method, has seen littlechange in its fundamental approach since the early days, the pri-mary improvements being mechanization of the excavation andreinstatement processes, mechanical support of the walls of deepexcavations, and significant improvement to pipe material quality.These benefits would have been most helpful were it not for thefact that the local contexts have changed out of all recognition:the overlying surface transport (road, pedestrian or cycle) infra-structures are more sophisticated structurally and susceptible todamage by excavation, there are many more utility types now in-stalled below ground (e.g. stormwater drainage, gas, LV and HVelectricity cables, telecommunications cables, street lightingcables), and in the not too distant future, as urban centres grow,significantly more utility types could be prevalent (e.g. non-pota-ble water networks, Pneumatic Waste Collection – PWC, CombinedHeat and Power pipelines – CHPs, district heating/cooling, hydro-gen; see Hunt et al., 2011). In addition there is growing awarenessthat future competition for use of underground space (e.g. wastestorage, resource extraction, transport and people movement,and living space) is increasing at an accelerated rate (Jeffersonet al., 2006; Bobylev, 2009; Parker, 2004; Evans et al., 2009;Sterling et al., 2012). Allied to this ground surfaces are now pre-dominantly paved or built over both in suburban and urban areas(and even in rural areas, where green verges exist, utility servicesare commonly buried beneath paved roads) leading to significantlygreater cost requirements, in terms of: asset location Costello et al.

16 D.V.L. Hunt et al. / Tunnelling and Underground Space Technology 39 (2014) 15–26
(2007); excavation and reinstatement for utility placement; main-tenance; repair and renewal; and decommissioning. In addition theBrundtland (1987) report has made engineers significantly moreaware that everything they do, including utility placement, needsto take into account current and future costs related to a muchbroader spectrum than direct economic costs alone (i.e. indirecteconomic costs, and costs to society and the environment).
As more costs are being recognised for utility placement (e.g.traffic disruption, deleterious environmental effects, health andsafety hazards, premature deterioration of paved surfaces, and ma-jor risks of damage to adjacent infrastructure, see Tighe et al.,2002) there is a strengthening argument against open-cut beingthe predominant form of pipe installation and renewal. For exam-ple, a significant driver in placing electricity cables within boredtunnels in London, UK was to avoid disturbance claims for repeatedexcavation and reinstatement procedures. However, if the benefitsof reducing environmental and social impacts (through the adop-tion of MUTs) are to be nationally recognised they need to be fullyquantified/qualified and offset against the extra monetary costsassociated with building and operating them. Notwithstanding thisrequirement, they need to be included within utility and road cost-ing schemes. One option would be to include the value of habitat,social amenities, landscape and other ‘external’ factors directlywithin ‘cost-benefit’ equations (POST, 1997). However it has beensuggested that alternative ‘cost-effectiveness’ appraisals may berequired; whereby decisions are based upon schemes achievingpredetermined objectives (economic, social and environmental)for least marginal cost (POST, 1997). Whatever the route taken,the first requirement must be to define more clearly each sustain-ability cost for open-cut utility placement (i.e. direct and indirecteconomic, social and environmental) and within this context to de-scribe all sustainability advantages and disadvantages offeredthrough MUTs (Sections 2 and 3). The next stage would be to quan-tify/qualify and compare each cost for open-cut utility placementwith MUTs (in various situations) in order to build a compellingsustainability argument for or against the adoption of MUTs. InSection 4 we develop a methodology for such a purpose, illustratedthrough the use of costs which reflect best current real world deci-sions (i.e. direct economic costs – labour, material and equipment).These direct economic costs are considered using three importantstages of open-cut construction (i.e. excavation, pipe placementand renewal) in three locations (undeveloped, suburban and urbanareas) and are compared to the direct economic costs of installingthree different types of MUT (i.e. flush-fitting, shallow and deep).Future research will look toward adopting this same methodologyfor the remaining sustainability costs described herein. It is shownthat even in the absence of social and environmental costs, whichare assumed essential for wider uptake of underground solutions,such as tunnelling (POST, 1997), there is an economic case fordeploying certain types of MUT’s in certain situations.
2. Sustainability costs for open-cut utility placement
A growing body of research suggests that the total cost for open-cut utility placement should go beyond economic costs alone (e.g.Iseley and Tanwani, 1990; Chapman et al., 2003; Najafi and Kim,2004; Rogers and Hunt, 2006; Jung and Sinha, 2007; Woodroffeand Ariaratnam, 2008; Ormsby, 2009). For example, Iseley andTanwani (1990) and Woodroffe and Ariaratnam (2008) suggestthat total costs (TC) should be considered as the summation of Di-rect, Indirect and Social costs whereas Jung and Sinha (2007) ex-pressed TC as the summation of the direct costs (e.g. earthworks,restoration, overheads, material, labour, equipment), Environmen-tal costs (e.g. noise and air pollution), Social costs (e.g. traffic delaysand loss of business income) and other factors (e.g. safety, produc-tivity and structural behaviour). Ormsby (2009) assumed TC to be
divided into Direct, Indirect and External costs (i.e. Economic, So-cial and Environmental), where external economic costs includedtwo factors (i.e. loss of property value due to noise and loss of busi-ness income; these being considered as social costs within theother studies. In line with the work of Chapman et al. (2003) andRogers and Hunt (2006), this study suggests that the total sustain-ability costs should consist of three distinct pillars of sustainability:
CSUSTAINABILITY ¼ CECONOMICðDIRECTþINDIRECTÞ þ CSOCIAL þ CENVIRONMENTAL
ð1Þ
However this study includes also the time element, which iscrucial within the overall decision-making and construction pro-cess. The development timeline framework, as shown in Fig. 1,builds upon the work of Hunt et al. (2008a,b) and Lombardi et al.(2011) and provides a visual representation for mapping decisions,impacts and costs (i.e. CSUSTAINABILITY) over time (working from thetop left to bottom right). The arrows highlighted in bold show thefocus of the numerical analysis performed in Section 4. The stagesof the utility construction process (1 – Pre-Construction, 2 – Con-struction, and 3 – Post-Construction) are in line with that reportedby Najafi and Kim (2004). Iseley and Tanwani (1990) previously as-signed a fourth stage to this process (4 – Decommissioning and Re-newal) and this has been included as a broader aspect of Stage 3.Stages 1 and 2 incorporate decisions and CSUSTAINABILITY over theshort-term (i.e. days to years), whereas Stage 3 considers impactswhich may last significantly beyond the lifetime of the asset (i.e.50 or even 100 years). These costs may be comparable or consider-ably higher than the contract value (Ormsby, 2009). A broader dis-cussion related to each pillar of sustainability shown in Fig. 1 isgiven in Sections 2.1-2.3.
2.1. Economic costs
Pre-construction costs can be considerable and include groundinvestigations and survey work required before the physical con-struction of the utility takes place. As an integral part of this stage,asset location can attract large costs due to limitations associatedwith soil type, utility type and depth (Sterling, 2000; Thomaset al., 2008). Uncertainty here can increase the risk of unplannedevents/construction activities, hence the contractor requires pro-tection (e.g. insurance) against expensive legal claims (Stein andDrewniok, 1998). Whilst design decisions (e.g. open-cut versustrenchless versus MUT) will impact significantly upon life cycle costsincluding social and environmental (Iseley and Tanwani, 1990) forthe project, they are rarely considered in bid preparation for utilityprojects (Ormsby, 2009). The primary costing here is CECO-
NOMIC (DIRECT), traditionally measured in £/m (Podevin, 1998 McKim,1997) or £/m3 (in order to normalise for the fact that utility opera-tions can be of varying size). Najafi and Kim (2004) suggest thatCECONOMIC (INDIRECT), examples of which are shown in Fig. 1, isapproximately 15% of CECONOMIC (DIRECT), whereas actual construc-tion costs (e.g. materials, labour and equipment; McKim, 1997),which require double handling of soil and reinstatement of surfaces(Fig. 1), amount to approximately 70% of CECONOMIC (DIRECT AND INDI-
RECT). This is in broad agreement with Jung and Sinha (2007) whoreported the following cost breakdown: 21% – earthworks; 30% –pipe laying; 21% – restoration; and 28% – other costs (e.g. officeoverheads, traffic control measures and temporary utilities).
CECONOMIC (DIRECT AND INDIRECT) can vary considerably between pro-jects (Ormsby, 2009) due to the influence of specific local factors:speed of construction (Najafi, 2005); utility type (i.e. diameterand material); and depth of excavation (Mohring, 1987; Chapmanet al., 2003). With respect to the last of these influences deeperexcavations may require dewatering and shoring (e.g. sheet piling)as opposed to sloping work (Najafi and Kim, 2004) and large-scale

N.B. Positions are approximate and may vary considerably from project to project
Fig. 1. Utility sustainability costs within a development timeline framework (bold arrows, show focus of this study).
D.V.L. Hunt et al. / Tunnelling and Underground Space Technology 39 (2014) 15–26 17
installations may require road closures and detours (Jung and Sinha,2007). In addition congested underground space may requireplanned temporary utilities and/or diversions and careful excava-tion to avoid damage to third party utilities (McKim, 1997; Rogersand Hunt, 2006). These slower speeds of construction (e.g.8 m/day for open-cut construction as compared to 22 m/day fortrenchless; Jung and Sinha, 2007) can be expensive for overheads(Najafi and Kim, 2004), but also for prolonged activities such asdewatering and lane occupancy (Balance et al., 2002).
Post-construction costs include operational costs, emergency re-pairs, maintenance, decommissioning and renewal. The costs asso-ciated with repair and maintenance are not dissimilar to thoseoutlined already in Stages 1 and 2 (i.e. these stages will be repeatedto varying degrees through the lifetime of the utilities) and the im-pact of these costs can be significant. For example, in 2003 in the UKthere were estimated to be approximately 1 million street works(DfT, 2003) or 7 million days of utilities’ street works (Goodwin,2005) necessitating more than 4 million excavations within high-ways and footpaths by utility companies with a direct cost of£1bn (McMahon et al., 2005). Notwithstanding these large costs,it is estimated that pavement service life is reduced by 30% oncean open-cut operation has been completed (Tighe et al., 2002). Thusfurther repairs to the surfacing materials are increasingly morelikely. This is attributed to the fact that as trenches are dug,stress-relief softening of the ground occurs, pavements deform pro-gressively and cracks will occur near the edges (Pucker et al., 2006).
2.2. Social costs
For the UK it is estimated that on average CSOCIAL is around 30–80% of CECONOMIC (DIRECT), although figures in excess of 400% havebeen reported (Peters, 1984; McKim, 1997; McMahon et al.,2005). Recent studies in Pennsylvania, USA have estimated trafficimpacts on busy roadways to be more than 80 times the contractcost (Jung and Sinha, 2007). It becomes apparent that the
contribution of CSOCIAL to CSUSTAINABILITY depends upon what hasbeen included, and how costs (typically economic) are measuredor factored in. For example, Rahman et al. (2005) includeoverheads, construction, utility damage, structural damage andreinstatement as social costs, whereas this study, in line with themajority of studies previously mentioned, refer to these as directand indirect economic costs. That said, when property damageoccurs at a later date and is not attributable to the contractor thisdoes become a social cost (Kolator, 1998), as is the case whenutility damage leads to service disruption (such as Water and Waste-water Service Interruption – WSI; Ormsby, 2009). Notwithstandingthese shortfalls it is estimated that 50% of CSOCIAL is attributed totraffic delays (Matthews and Allouche, 2010), sometimes referredto as traffic disruption costs (Boyce and Bried, 1994). These aremonetary vehicular costs (Jung and Sinha, 2007; Ormsby, 2009)incurred due to increases in: traffic congestion; frequency of colli-sions; vehicular travel time; and associated operating costs – VOC’s(which are increased significantly due to road damage, Rahmanet al., 2005).
The remaining costs include: health and safety (Jung and Sinha,2007), for example Accidental Injury and Death – AID (Ormsby,2009) related to falling into excavations or trench collapses (Iseleyand Tanwani, 1990), but also mobile plant and vehicles (HSE,2010a,b). The accident rates for trenching activities are reportedto be 112% higher than general construction (Everett and Frank,1996). There are however wider issues related to health, for exam-ple Obstruction to passage of Emergency Vehicles – OEV and Psy-chological and Physical Ailments – PPA (Ormsby, 2009). Thelatter of these could be related to the impact of noise, not leastvibration of heavy machinery (Jung and Sinha, 2007) which cancause high blood pressure, sleep disturbance and a drop in produc-tivity (Gilchrist and Allouche, 2005), but perhaps also visual intru-sion (Ling et al., 1989). Noise is known also to be connected withreductions in property values of up to 1% per dBA (Allouche andGilchrist, 2004) whilst loss of public space and amenities (Rogers

18 D.V.L. Hunt et al. / Tunnelling and Underground Space Technology 39 (2014) 15–26
and Hunt, 2006; Ormsby, 2009) is connected to pedestrian delayswhen interference with walkways occurs (Matthews and Allouche,2010). Another inconvenience is loss of parking spaces, which re-sults in pedestrians parking further away and being less productive(Matthews and Allouche, 2010), while in addition there may berevenue lost for those spaces (McKim, 1997; Kolator, 1998). Trafficdisruption and lack of access, at best, can cause loss of business be-tween 10% and 60% (Lemoine, 2008) and at worst it can cause clo-sure. For example over longer-term projects (i.e. >2 years) Laistner(1997) reported a survival rate of between 40% and 80%.
2.3. Environmental costs
The quantification of CENVIRONMENTAL for utilities has receivedless attention than the other two pillars of sustainability and thisis not surprising as the costs are not always considered, or their im-pacts are not recognised, until many years after the works havebeen carried out. For example Jung and Sinha (2007) recognisedthat open-cut damages the landscape in terms of loss of green space(e.g. removal of trees, grass and other landscape features). How-ever, no mention is made of loss of habitat or the impact of rootdamage, where roots are continually damaged during utility oper-ations, subsequently causing the tree to wilt and die (Rogers andHunt, 2006); there is a flip side (and an economic cost) to this,where tree roots inadvertently damage utilities (Costello et al.,2000). An alternative reason for the poor representation of CENVI-
RONMENTAL is because many costs are associated with the othertwo pillars. For example in older costing models landfill is identi-fied as an environmental cost, whereas the introduction of LandfillTax (£/tonne) has become a direct economic cost. This serves as agood example of how political influences can change behaviourof the cost equation rapidly and significantly (Chapman et al.,2003), and the same argument can now be used for carbon taxes(£/tonne) in the case of air pollutants and greenhouse gas emissions(also known as APEs; Ormsby, 2009). A methodology (Rehan andKnight, 2007) and associated calculator (Griffin, 2009a) exist forcalculating CO2 costs (£/passenger-km; Zhang et al., 2004) relatedto variations in traffic control plans (Tighe et al., 1999), traffic vol-umes and uses of construction equipment/machinery. However noconsideration is given for other emissions (e.g. chlorofluorocar-bons, nitrous oxides, toxic substances, heavy metals, Dust and DirtPollution (referred to as DPP; Ormsby, 2009) and other greenhousegases (Gilchrist and Allouche, 2005), although these can be consid-ered to some extent in E-Calc (Griffin, 2009b). Ormsby (2009) rec-ognises that Environmental Damage and Contamination – EDC (e.g.fuel, oil, chemicals) provides a significant contribution to overallenvironmental costs, and one that often extends beyond theboundaries of the construction site due to propagation throughsoil, water and air. Even dust, which carries health risks throughskin irritation/cancers (Ferguson, 1995), has been reported up to150 m from the construction sites (Watkins, 1980).
Fig. 2. Different types of MUT construction.
3. MUTs: a sustainable alternative to open-cut?
The underlying question allied to the above discussion is: howcan a Multi-Utility Tunnel (MUT) help to reduce some of thesecosts? A Multi-Utility Tunnel (MUT) can be defined as ‘‘any systemof underground structure containing one or more utility service whichpermits the placement, renewal, maintenance, repair or revision of theservice without the necessity of making excavations; this implies thatthe structure is traversable by people and, in some cases, traversableby some sort of vehicle as well’’ (APWA, 1997). As this definition sug-gests, MUTs can take a variety of forms. Rogers and Hunt (2006)present more than 60 worldwide examples of MUTs which varyin size, shape, depth, material and type of utilities housed. The
accessibility offered within an MUT is either searchable – allowingfor selective access usually through removable lids – or visitable– allowing for man entry along the entire length of the MUT(Cano-Hurtado and Canto-Perello, 1999; Curiel-Esparza et al.,2004). Rogers and Hunt (2006) further categorised MUTs accordingto depth of placement:
A. Flush-fitting: 0.0 m cover (Fig. 2a).B. Shallow: 0.5–2 m cover (Fig. 2b).C. Deep: 2–80 m cover (Fig. 2c).
For direct comparison the current National Joint Utilities Guide-lines (NJUG, 2003) for placement of utilities in trenches is shown inFig. 3. The advantages and disadvantages of the MUT approach willnow be discussed in Sections 3.1 and 3.2 respectively.
3.1. Advantages of MUTs
The MUT eradicates the need for repeated excavation and rein-statement (E&R) procedures over its lifetime (60–100 years) andtherefore eliminates many of the longer-term costs relating toCSUSTAINABILITY (Cano-Hurtado and Canto-Perello, 1999; Laistner,1997; Rogers and Hunt, 2006). For example, maintenance worksare carried out within the MUT therefore reducing significantlythe size of working areas (above ground) and requirements forequipment (e.g. heavy machinery), labour and materials. Mobilisa-tion is quicker and cheaper because roads are not closed and tem-porary lights and detours are not required; moreover associatedimpacts on local businesses and residents (e.g. noise, loss of publicspace and business) are minimised. Damage to roads, footways, 3rdparty utilities/structures and tree roots is avoided, while a flush-fitting MUT could also act as a vertical barrier to prevent tree rootsdamaging utilities within a footway rather than constructing a ver-tical concrete barrier to do the same job. Costs are further reducedbecause asset location is no longer an issue and lane occupancycharges are not applicable (Rogers and Hunt, 2006), and improved

Fig. 3. NJUG guidelines for utility installation in the UK (NJUG, 2003).
D.V.L. Hunt et al. / Tunnelling and Underground Space Technology 39 (2014) 15–26 19
accessibility allows for improved inspection and condition assess-ment. Faults and breakdowns are reduced by approximately 80–95% and asset life is extended by approximately 15–30% (Laistner,1997), improving the quality of service to the consumer (Cano-Hurtado and Canto-Perello, 1999; Canto-Perello et al., 2009) whilstreducing costs for the utility provider. MUTs facilitate renewal anddecommissioning (or perhaps even re-use for a purpose other thanwhich it was intended) and upgrading. This is particularly relevantto the communications industry where technological evolutionconstantly requires the networks to be changed (ITA, 2010). Forexample, it is estimated that 80% of the costs associated with roll-ing out super-fast fibre optic broadband in the UK were related tocivil engineering works (BIS, 2010). Allied to this is the introduc-tion of new utilities (e.g. PWC systems, hydrogen, and CHP sys-tems; see Hunt and Rogers, 2005) which are being, or could be,adopted in the not too distant future. MUTs require a smaller com-bined area than the equivalent utilities installed via open-cut(Cano-Hurtado and Canto-Perello, 1999; Riera and Pasqual, 1992)thereby allowing for more organised planning of undergroundspace for which there are many other uses (Sterling et al., 2012).
3.2. Disadvantages of MUTs
It is clear that a longer-term sustainability perspective is re-quired in order for MUTs to become a viable and widely acceptedform of utility placement. This remains a significant barrier to theiradoption and thus a significant disadvantage, particularly in thecontext of short-term planning cycles (Hunt and Rogers, 2005). Al-lied to this is the fact that there is an expected high initial invest-ment outlay and associated long-term maintenance responsibility,which is highly unlikely to come from any single utility company(Rogers and Hunt, 2006) even though it could rent the space toother utility owners. However these barriers are easily overcome
in university campuses, for example, where this type of investmentis encouraged and long-term maintenance requirements of MUTsare well known, hence there are useful examples in the UK (Huntet al., 2012).
The construction method is reportedly not well known,although a knowledge base certainly exists and is growing asworldwide examples increase (Hunt and Rogers, 2005). It is morelikely that a 200 year legacy of placing utilities below ground byopen-cut is hard to change (Rogers and Hunt, 2006) and many va-lid reasons have been put forward to support this disadvantage. Forexample, costs associated with the Pre-Construction and Construc-tion stages would likely be increased considerably, not least inareas where logistically complex retrofitting of such a solutionwould be required (Curiel-Esparza et al., 2004; Hunt and Rogers,2005). Indeed in some urban areas the congestion below groundis so extreme that only deep MUTs are likely to be contemplatedif continuity of service provision is to be provided while the newsystem is commissioned. In addition there is the added problemof compatibility and safety issues, both now and in the future(Cano-Hurtado and Canto-Perello, 1999; Hunt and Rogers, 2005).For example, concerns are quoted for housing gas and electricitytogether (although these are straightforwardly overcome by com-partmentalising utilities), and for housing stormwater, wastewateror combined systems that require large diameter pipes and gravityflow (Canto-Perello and Curiel-Esparza, 2001; Legrand et al., 2004;Canto-Perello et al., 2009). In addition, concerns are raised in rela-tion to the above co-location arguments over the added complica-tions of confined spaces, fire risk, poor lighting and ventilation(Rogers and Hunt, 2006; Chasco et al., 2011), and the fact that ifone utility fails dramatically the other utility services are poten-tially put at risk of damage. Nevertheless no single element posesan engineering risk, and there are examples of where each concernhas been satisfactorily addressed.

20 D.V.L. Hunt et al. / Tunnelling and Underground Space Technology 39 (2014) 15–26
4. Methodological approach
It is clear that a methodology is required to allow for directcomparison of CSUSTAINABILITY when considering open-cut utilityplacement and MUTs. However this must come with an apprecia-tion that, in the real world, decisions are still taken on basis offinancial or monetary models, i.e. a comparison between CECONOMIC
for both open-cut and MUT utility placement. In this chapter amethodological approach is presented for conducting a rigorousanalysis using CECONOMIC (DIRECT). Future research will look towardadopting the same methodological approach for the broader CSUS-
TAINABILITY set. Even with discounting CSOCIAL and CENVIRONMENTAL, itis shown that a valid case for deploying certain types of MUT incertain situations can be made. Therefore it is expected that therole of CSUSTAINABILITY, once fully developed, will evidently favourMUTs. This paper puts in place a methodology that moves us pro-gressively towards such an end-state.
4.1. CECONOMIC (DIRECT)
Decision-making for the adoption of MUTs will be predicated onshort-term costs and long-term savings: A financial appraisal willcompare revenues with expenses (i.e. initial investment againstmaintenance and operation costs) for open-cut utility placementand MUTs and calculate the financial return ratios (e.g. IRR) foreach; In contrast an economic appraisal will identify and compareeconomic and social benefits accruing to the economy as a whole.In this section we concentrate on the former as a precursor to thelater being undertaken in future research.
Whilst many authors have argued that the long-term advanta-ges, not least cost savings, related to the adoption of MUTs far out-weigh the short-term disadvantages (Laistner, 1997; Rogers andHunt, 2006; Canto-Perello et al., 2009), there is a lack of evidenceto show where the tipping points occur between open-cut con-struction and MUT constructions when short-term and long-termcosts are considered; a tipping point being defined as the pointat which costs balance for each method. Moreover there is a lackof evidence to show how these tipping points are influenced bychoice of MUT (i.e. flush-fitting, shallow, deep), location (i.e.undeveloped, suburban, urban), pipe number (i.e. density) and pipediameter. This section investigates these further through the use ofshort-term direct costs (Section 3.1) and long-term direct costs(Section 3.2).
4.1.1. Short-term direct costs (one utility)In the majority of cases the direct short-term economic costs
(i.e. equipment, labour and materials) used during excavation, pipeplacement and reinstatement are broadly similar and take into ac-count the following (CSMG, 2010):
1. Depth of installation.2. Ground conditions.3. Material excavated.4. Size of conduit/pipe/cable.5. Surface type.
However many of the other short-term direct costs can be sig-nificantly different across projects and are influenced greatly byfactors outside of the construction itself (CSMG, 2010; Henderson,2011). These include:
6. Contract size (discounts for larger contracts).7. Contractor used.8. Way leave costs.9. Construction permits (lane closures, parking bay suspensions,
etc.).
10. Restrictions on time of works (therefore higher labour ratesfor night work).
11. Traffic management.
Therefore in order for the findings of this research to be broadlygeneric, consideration will be given only to the breakdown of di-rect short-term costs for excavation, pipe placement and surfacereinstatement (Tables 1a–1c respectively). Fig. 1 shows the focusof the study in relation to the broader sustainability costing model.All UK-based costs have been estimated using SPON’s Civil Engi-neering and Highway Works Price Book (Langdon, 2009). Through-out these are compared to reported cost data for utilityinstallations via open-cut (UK-specific data) and via MUTs (Euro-pean-specific data); nevertheless the trends are evident and canbe interpreted for any country worldwide via the use of local con-text knowledge of costing.
4.1.1.1. Open-cut. The various cost data related to three locations(undeveloped, suburban and urban) are shown in Fig. 4. For datagenerated during this study several utility sizes (100, 150, 200and 300 mm diameter) are adopted in order to represent thoselikely to be placed at shallow depth via open-cut installation with-in a footway (Fig. 3). In addition placement at a depth of 900 mmrepresents the maximum likely to occur (the UK does not haveconcerns over frost penetration). In undeveloped areas it is as-sumed that excavation occurs in soft material, which is subse-quently used as backfill. In urban areas it is assumed that a500 mm depth of bitumen macadam (including a bound basecourse and contaminated sub-base) is removed and sent to landfill(within 15 km), the remaining 500 mm of soft material is exca-vated and reinstated as backfill. The surface is reinstated using ahardcore sub-base (200 mm), overlain by a dense bitumen mac-adam base course (150 m), binder course (100 mm) and surfacecourse (150 m). Preparation of all surfaces is assumed. In bothcases excess soft material (i.e. a volume equivalent to that of thepipes) is assumed to be sent to landfill (within 15 km). The datafrom CSMG (2010) relate to telecommunications, gas and HV andLV electricity cables located in footways (Fig. 3), and 100 mmwater pipes located at 900 mm depth in carriageways/footways.The data are collected from three UK network operators, onenon-UK network operator, four construction contractors and awater contractor. The costs from an experienced engineer (Hender-son, 2011) are from a water utility company and refer to variouswater pipe diameters (100, 150, 200, 300 mm) located at900 mm depth. Fig. 4 shows that the cost of utility installation in-creases steadily with pipe size and the cost ratio for undeveloped,suburban and urban areas, using average values this is approxi-mately 1.0: 1.8: 2.3.
4.1.1.2. MUTs. The various cost data related to three different typesof MUT installation (i.e. flush-fitting, shallow and deep) are shownin Fig. 5. It is assumed that a flush-fitting MUT (1.0 m � 1.0 m cul-vert with lid) has 0.0 m cover and a shallow MUT (1.0 m � 1.0 m)has 2.0 m cover. Excavation for both is assumed to require 45�slopes for stability and working space. The volume of soft materialand tarmacadam taken to landfill is substantially greater thanopen-cut due to the size of excavation required and the size ofthe MUT conduit being installed. The deep tunnels are assumedto be 3.0 m in diameter (200 mm liner thickness) and are con-structed at 40.0 m below ground surface level. The costs for shaftconstruction (every 500.0 m) and removal of excavated materialsis considerable (£1575/m) and the cost of tunnelling in rock isalmost twice that of a soft material. Laistner (1997) reported thatthe cost of a fully equipped MUT would be approximately 5–20%more than the equivalent open-cut installation. However, inline with the expectations of Hunt and Rogers (2005) and

Table 1aExcavation costs for utility construction (adapted from SPONS 2010, see Langdon, 2009).
Construction phase Material D – diameter (m), Z – depth (m) Labour (£/m3) Plant (£/m3) Total (£/m3)
Excavationa Tarmacadam Z = 0.0–0.25 9.2 13.6 22.8Z = 0.25–0.5 10.4 15.4 25.8
Soft materialb Z = 0.0–0.25 1.01 1.38 2.38Z = 0.25–0.5 1.01 1.40 2.40Z = 0.5–1.0 1.34 1.79 3.13Z = 1.0–2.0 2.01 2.72 4.73Z = 2.0–5.0 3.36 4.51 7.86
Tunnel shaft excavation Soft material D = 3.0 – – 107.5Rock D = 3.0 – – 185.0
Tunnel excavation Soft material D = 3.0 – – 125.0Rock D = 3.0 – – 300.0
Soil disposalc
Excavated earth – – – 19.72Rock/tarmacadam – – – 20.44
a Including removal/breakage of carriageway and other works.b Material other than topsoil, rock or artificial hard material.c Includes landfill at a rate of 3.75/m3 disposed 15 km off site.
Table 1bPlacement costs for utility construction (adapted from SPONS 2010, see Langdon, 2009).
Construction phase Material D – diameter,d = dimensions (m)
Labour(£/m)
Plant (£/m)
Material(£/m)
Total (£/m)
Pipe placement (cost of pipeinstallation)
Carbon steel pipes to BS EN 10126; welded joints;(placed in trenches)a
D = 0.1 10.5 8.2 25.6 44.2
D = 0.15 11.9 9.3 39.4 60.6D = 0.2 12.6 9.9 41.7 64.1D = 0.3 14.0 11.0 60.1 85.0
Carbon steel pipes to BS EN 10126; welded joints;(placed in MUT)
D = 0.1 3.18 0.49 25.58 29.24
D = 0.15 3.18 0.49 39.40 43.06D = 0.2 4.08 2.27 41.67 48.03D = 0.3 4.99 0.77 60.09 65.85
(additional cost of MUT) MUT culvert (with lid)b d = 1.0 � 1.0 – – – 500.0MUT culvert d = 2.0 � 2.0 – – 850.0
d = 3.0 � 2.0 – – – 1050.0Pre-cast shaft lining D = 3.0 – – – 439.82Pre-cast tunnel lining D = 3.0 – – – 501.40
a Applicable only to pipes laid in excavation (supported) and backfilled up to 1.5 m depth.b Cost information on pre-cast concrete sections has been provided by Hanson – Heidelberg Cement Group.
D.V.L. Hunt et al. / Tunnelling and Underground Space Technology 39 (2014) 15–26 21
Cano-Hurtado and Canto-Perello (1999) this study shows the coststo be considerably more. For example when considering the costsfor excavation, pipe placement (one 200 mm carbon steel pipe)and reinstatement the following increases were found: flush-fit-ting (+800%), shallow (+1700%), and deep (+2300%). Whilst casehistory data does report significantly higher costs (Fig. 5), this isnot surprising due to the fact that more than one utility is in-stalled; moreover costs related to items 6–11 listed in Section 4.1.1are included.
4.1.2. Long-term direct costs (>one utility)In this section the long-term costs savings are considered when
adopting MUTs in each of the three locations. These long-term sav-ings are created through elimination of excavation and reinstate-ment (E&R) procedures required for emergency repairs and/orroutine maintenance (Fig. 1). E&R costs adopted for open-cut con-struction in each location, with and without pipe placement, areshown in Fig. 5. Unfortunately, within the confinement of this pa-per it is not possible to include analysis of the complete range ofutility types in Fig. 4 hence the focus will once again be on carbonsteel pipes.
4.1.2.1. Undeveloped. Fig. 6 shows the costs for constructing threetypes of MUT in undeveloped areas. It can be seen that the costs
increase as the number of (200 mm) carbon steel pipes installedincreases when compared to the cost for placing these samepipes using open-cut installation. It can be seen that the eco-nomic gap between flush-fitting MUTs and open-cut decreasesas more pipes are placed, however open-cut remains 20% lessexpensive than the cheapest MUT when 15 pipes are placed. Ifit is now assumed that 1 (E&R)/m occurs for each pipe placedover the lifetime of the MUT (Fig. 6), a tipping point (A) occursfor flush-fitting MUTs at 14 pipes placed. In other words thismeans that for the costs to break even 14 E&Rs, i.e. 14 pi-pes � 1(E&R), per metre of MUT would need to be saved overthe design life for the MUT (assumed 60 years). This equates to1 (E&R) per metre of MUT every 4.3 years (i.e. 60/14) or 0.23(E&Rs)/m/year. If the number of E&Rs is increased to, say, 3, 6,9 or 12 a range of other tipping points can be found (Fig. 6).For example a tipping point (B) occurs for flush-fitting MUTswhen three utility pipes are placed and nine (E&Rs) are required.This means that three utilities would need to be placed and 27,i.e. 3 � 9, (E&Rs)/m would need to have been saved for the tippingpoint to occur. This equates to 1 (E&R) per m every 2.3 years (i.e.60/27) or 0.43 (E&Rs)/m/year. For deep MUTs in soft ground(assuming a 100 year design life) the tipping point (C) occurswhen 14 utilities are placed with 1 (E&R)/m every 0.6 years (i.e.100/12 � 14) or 1.67 (E&Rs)/m/year.

Table 1cReinstatement costs for utility construction (adapted from SPONS 2010, see Langdon, 2009).
Construction phase Material T –thickness(m)
Labour(£/m3)
Plant(£/m3)
Material(£/m3)
Total(£/m3)
Reinstatement (including all surface works) Fill using selected excavated materials – 1.62 3.41 – 5.03Hardcore ‘sub-base’; spread and graded T = 0.2 4.34 5.35 18.04 27.72Dense bitumen macadam ‘base’ course T = 0.15 19.45 24.15 49.90 93.50Dense bitumen macadam ‘binder’ course T = 0.1 15.55 19.35 28.05 62.95Dense bitumen macadam ‘surface’ course T = 0.5 11.65 14.50 19.95 46.10Preparation of filled surface (£/m2) 0.54 1.19 – 2.45
0
25
50
75
100
125
150
175
200
225
Cos
t (£/
m)
Fig. 4. Urbanisation and the short-term cost of open-cut utility installation.
0
1000
2000
3000
4000
5000
6000
7000
Cos
t (£/
m)
Fig. 5. Urbanisation and the short-term cost of MUT installation. (See above-mentioned references for further information.)
22 D.V.L. Hunt et al. / Tunnelling and Underground Space Technology 39 (2014) 15–26

0.00
0.50
1.00
1.50
2.00
2.50
3.00
3.50
4.00
4.50
0 1 2 3 4 5 6 7 8 9 10 11 12 13 14 15
Open-cut Flush-fitting MUTShallow MUTDeep MUT (Soft)Deep MUT (Rock)
Fig. 6. MUT costs versus open-cut costs with and without yearly E&Rs (200 mm pipe, undeveloped).
0.00
0.50
1.00
1.50
2.00
2.50
3.00
3.50
4.00
4.50
0 1 2 3 4 5 6 7 8 9 10 11 12 13 14 15
Open-cut Flush-fitting MUTShallow MUTDeep MUT(Soft)Deep MUT(Rock)
Fig. 7. MUT costs versus open-cut costs with and without yearly E&Rs (200 mm pipe, suburban).
D.V.L. Hunt et al. / Tunnelling and Underground Space Technology 39 (2014) 15–26 23
4.1.2.2. Suburban and urban. The same analysis was conductedusing the costs for suburban and urban areas (Figs. 7 and 8). Onceagain it can be seen that the economic gap between flush-fittingMUTs and open-cut decreases as more pipes are placed, howeverthis time a tipping point (D) occurs on the line 1 (E&R) in suburbanareas when five utilities are placed (Fig. 7), likewise a tipping point(E) occurs in urban areas when two utilities are placed (Fig. 8). Incontrast to undeveloped areas the cost of placing 15 utilities byopen-cut is significantly more expensive than flush-fitting MUTsin both suburban (+132%) and urban areas (+220%). Thus the solu-tion could be assumed cost effective. Numerous other tippingpoints can be seen in Figs. 7 and 8. For example, tipping pointsfor a flush-fitting MUT in urban areas, assuming a 60 years designlife and three utility pipes placed, is 1 (E&R) per m every 40 years(i.e. 60/3 � 0.5), whereas in suburban areas it is 1 (E&R) per m every6.67 years (i.e. 60/3 � 3). The same is true for deep MUTs although
the value is somewhat lower (i.e. the frequency of E&R’s to achievea break-even status is less).
Each tipping point in Figs. 6–9 is essentially the result of a cost-benefit analysis. The advantage is that multiple criteria have beenassessed and economic competitiveness has been highlighted indifferent locations for completely different reasons. This is anessential requirement for decision makers when deciding to under-take an investment in MUTs rather than open-cut. It can be seenfrom Figs. 6–9 that some of the E&R lines do not exactly cross datapoints and therefore calculation is required to find their exact val-ues. Fig. 9 shows exact values for 100 tipping points (i.e. the equiv-alent of 100 cost benefit analyses) for a flush-fitting MUT in allthree areas, and shows the number of E&Rs required for cost effec-tiveness to occur when considering different pipe numbers (i.e.density) and pipe diameters. It can be seen tipping points are low-est in urban areas followed by suburban and undeveloped areas.
0.00
0.50
1.00
1.50
2.00
2.50
3.00
3.50
4.00
4.50
0 1 2 3 4 5 6 7 8 9 10 11 12 13 14 15
Open-cutFlush-fitting MUTShallow MUTDeep MUT (Soft)Deep MUT (Rock)
Fig. 8. MUT costs versus open-cut costs with and without yearly E&Rs (200 mm pipe, urban).
0.00
0.20
0.40
0.60 100mm pipe200mm pipe300mm pipe
0 5 10 15 20 0 5 10 15 0 5
Fig. 9. Influence of pipe number (density) and diameter on tipping points for flush-fitting MUT’s.
Fig. 10. Utility operations in 20 locations over a 5 year period (Bluett, 2011).
24 D.V.L. Hunt et al. / Tunnelling and Underground Space Technology 39 (2014) 15–26
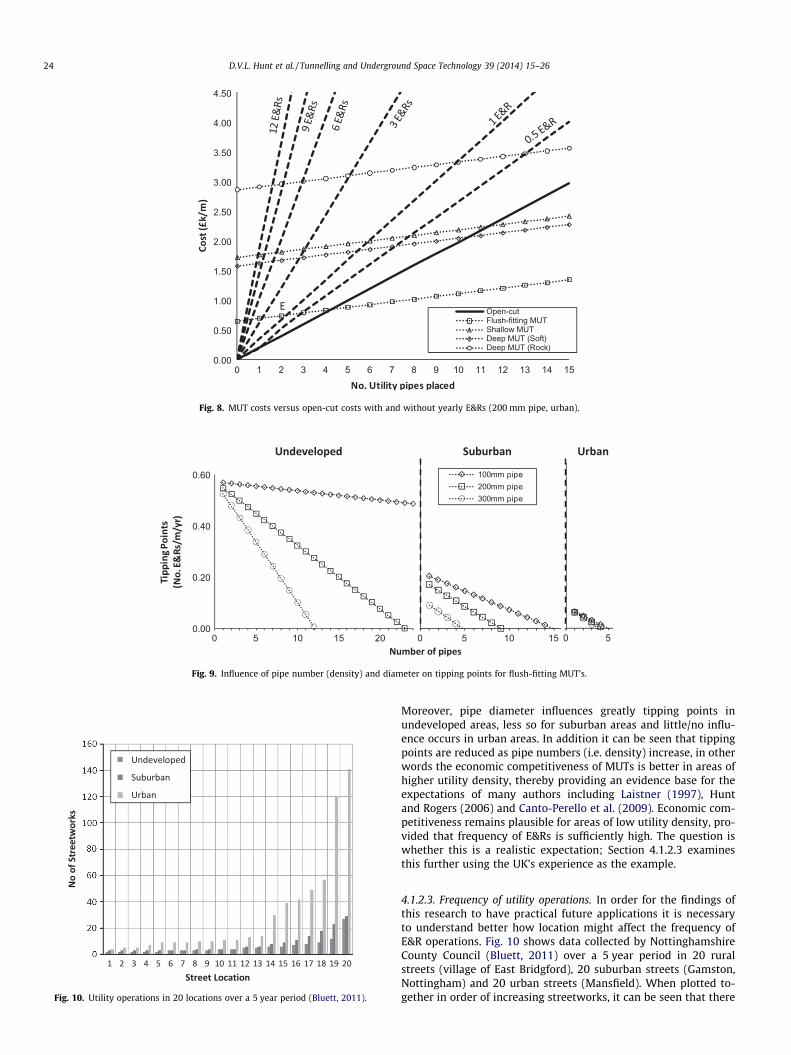
Moreover, pipe diameter influences greatly tipping points inundeveloped areas, less so for suburban areas and little/no influ-ence occurs in urban areas. In addition it can be seen that tippingpoints are reduced as pipe numbers (i.e. density) increase, in otherwords the economic competitiveness of MUTs is better in areas ofhigher utility density, thereby providing an evidence base for theexpectations of many authors including Laistner (1997), Huntand Rogers (2006) and Canto-Perello et al. (2009). Economic com-petitiveness remains plausible for areas of low utility density, pro-vided that frequency of E&Rs is sufficiently high. The question iswhether this is a realistic expectation; Section 4.1.2.3 examinesthis further using the UK’s experience as the example.
4.1.2.3. Frequency of utility operations. In order for the findings ofthis research to have practical future applications it is necessaryto understand better how location might affect the frequency ofE&R operations. Fig. 10 shows data collected by NottinghamshireCounty Council (Bluett, 2011) over a 5 year period in 20 ruralstreets (village of East Bridgford), 20 suburban streets (Gamston,Nottingham) and 20 urban streets (Mansfield). When plotted to-gether in order of increasing streetworks, it can be seen that there

D.V.L. Hunt et al. / Tunnelling and Underground Space Technology 39 (2014) 15–26 25
is a general trend toward the number of utility operations (henceE&Rs) increasing when going from undeveloped to urban areas.However it shows also that streets in undeveloped areas can havejust as many utility operations performed as suburban and urbanareas. For example Street location 20 has more utility operationsperformed in undeveloped areas than Streets 1–13 have in urbanareas. In other words, frequency of E&Rs in low utility density areasmay be sufficiently high for economic competitiveness to occur.Whilst the study is far from exhaustive, it is believed from anec-dotal evidence to be typical of the frequency of street works occur-ring elsewhere in the UK. Future work could look towardscollecting, collating and comparing such data for the UK, or forany country in which utility streetworks pose a problem.
5. Conclusion
Results of this research suggest that an MUT, during its lifetime,can provide a more economically sustainable method of utilityplacement as long as it is used in the right location and housesthe right number of utilities, i.e. is used in a situation that other-wise would require numerous E&R procedures if placed usingopen-cut. A detailed and comprehensive review has been providedto establish the context in which the above analysis must takeplace, and this indicates many features of streetworks that mightbe given greater or lesser emphasis in any cost model. It might,for example, be swayed by local political or societal influences: ifair pollution is a long-term sensitive issue for a city, then itsweighting in any cost model would necessarily increase. A betterunderstanding of the tipping points for the economics of MUTs inthree locations (undeveloped, suburban and urban) has beengained and the evidence base thus provided will contribute signif-icantly towards building a robust economic costing model. Suchmodelling is required as part of a much larger sustainability cost-ing model if the case for MUTs is to be made, but the results re-ported herein provide the starting point for a step-change inthinking for utility service infrastructure provision in cities where‘more of the same’ is becoming untenable and traffic congestiondue to repeated streetworks is becoming politically, as well as so-cially and environmentally, unacceptable.
Acknowledgments
The authors gratefully acknowledge the financial support forthis work provided by the UK’s Engineering and Physical SciencesResearch Council (EPSRC) under Grant EP/F007426/1.
References
Allouche, E.N., Gilchrist, A., 2004. In: Quantifying Construction Related Social Costs,2004 NASTT No-Dig Conference, New Orleans, Louisiana, March 22–24, Paper A-1-02, NASTT, Arlington, Virginia.
APWA, 1997. The ‘How-to’ Book on Utility Coordination Committees, Report by theAmerican Public Works Association (APWA). Kansas City, MO, 21pp.
Balance, T., Reid, S., Chalmers, L., 2002. Lane Rental Charging: A Way Forward. Stoneand Webster Consultants, London, p. 28.
BIS, 2010. Broadband Development and Sharing Other Utilities’ Infrastructure.Department for Business, Innovation and Skills.
Bluett, 2011. Personal Communication.Bobylev, N., 2009. Mainstreaming sustainable development into a city’s Master
plan: a case of urban under-ground space use. Land Use Policy 26 (4), 1128–1137.
Boyce, G.M., Bried, E.M., 1994. Benefit-cost analysis of microtunneling in an urbanarea. In: 1994 NASTT No-Dig Conference, Dallas, Texas, April 10–13, Paper A1,NASTT, Arlington, Virginia.
Brundtland, G.H., 1987. Our Common Future. Oxford University Press, Oxford.Cano-Hurtado, J.J., Canto-Perello, J., 1999. Sustainable development of urban
underground space for utilities. Tunnelling and Underground SpaceTechnology 14 (3), 335–340.
Canto-Perello, J., Curiel-Esparza, J., 2001. Human factors engineering in utilitytunnel design. Tunnelling and Underground Space Technology 16, 211–215.
Canto-Perello, J., Curiel-Esparza, J., 2003. Risks and potential hazards in utilitytunnels for urban areas. Proceedings of the Institution of Civil Engineers:Municipal Engineer 156 (1), 51–56.
Canto-Perello, J., Curiel-Esparza, J., Calvo, V., 2009. Analysing utility tunnels andhighway network coordination dilemma. Tunnelling and Underground SpaceTechnology 24 (2), 185–189.
Chapman, D.N., Vickridge, I., Rogers, C.D.F., Karri, R.S., 2003. Economics (direct andsocial costs), legislation and standards including comparison with traditionalmethods. Internal Network Report 2, 30.
Chasco, A.R., Meneses, A.S., Cobo, E.P., 2011. The Lezkairu utilities tunnel. ASCE,Practice Periodical on Structural Design and Construction 16 (2), 9.
Costello, L.R., McPherson, E.G., Burger, D.W., Dodge, L.L., 2000. Strategies to ReduceInfrastructure Damage by Tree Roots: Proceedings of a Symposium forResearchers and Practitioners. Western Chapter, International Society ofArboriculture, Cohasset, CA.
Costello, S.B., Chapman, D.N., Rogers, C.D.F., et al., 2007. Underground asset locationand condition assessment technologies. Tunnelling and Underground SpaceTechnology 22 (6), 524–542.
CSMG, 2010. Economics of shared infrastructure access. Prepared on behalf ofOfcom.
Curiel-Esparza, J., Canto-Perello, J., 2005. Indoor atmospheric hazard identificationin person entry urban utility tunnels. Tunnelling and Underground SpaceTechnology 20 (5), 426–434.
Curiel-Esparza, J., Canto-Perello, J., Calvo, M.A., 2004. Establishing sustainablestrategies in urban underground engineering. Science and Engineering Ethics 10(3), 523–530.
DfT, 2003. The Traffic Management Bill: Regulatory Impact Assessments (RIA).Department for Transport, London, UK.
Evans, D., Stephenson, M., Shaw, R., 2009. The present and future use of ‘land’ belowground. Land Use Policy 26, 302–316.
Everett, J.G., Frank, P.B.J., 1996. Costs of accidents and injuries to the constructionindustry. Journal of Construction Engineering and Management 122 (2), 158–164.
Ferguson, I., 1995. Dust and Noise on the Construction Process.Gilchrist, A., Allouche, E.N., 2005. Quantification of social costs associated with
construction projects: state-of-the-art review. Tunnelling and UndergroundSpace Technology 20, 89–104.
Goodwin, P., 2005. Utilities Street Works and the Cost of Congestion. Draft ReportDiscussed with Dft. NJUG and Halcrow Group Ltd, 37pp.
Griffin, J., 2009a. Carbon calculator determines trenchless benefits. <www.pwtrenchless.com/carbon.pdf> (accessed 22.06.11).
Griffin, J., 2009b. First look: software compares carbon footprint of trenchless, open-cut construction methods. Underground Construction, p. 64.
Henderson, M., 2011. Utility costs – personal communication.Hokkanen, V., Forssen, I.And., Niva, M., 1994. Four examples of subsurface uses in
Finland. Tunnelling and Underground Space Technology 9 (3), 385–393.HSE, 2010a. Construction – Structural Stability During Excavations [online]. <http://
www.hse.gov.uk/construction/safetytopics/excavations.htm> (accessed 22.11.10).HSE, 2010b. Construction – moving plant and vehicles [online]. <http://www.
hse.gov.uk/construction/safetytopics/mobileplant.htm> (accessed 22.11.10).Hunt, D.V.L., Rogers, C.D.F., 2005. Barriers to sustainable infrastructure in urban
regeneration. Proceedings of the Institution of Civil Engineers, EngineeringSustainability 2 (158), 67–81.
Hunt, D.V.L., Lombardi, R.D., Jefferson, I., Rogers, C.D.F., 2008a. In: The DevelopmentTimeline Framework: A Tool for Engendering Sustainable Use of UndergroundSpace. Geotechnical Special Publication 178. Proc. of Geocongress 2008, ASCE,New Orleans, USA, March 2008, pp. 859–866.
Hunt, D.V.L., Lombardi, D.R., Rogers, C.D.F., Jefferson, I., 2008b. Application ofsustainability indicators in decision-making processes for urban regenerationprojects. Proceedings of the Institution of Civil Engineers, EngineeringSustainability 161 (1), 77–92.
Hunt, D.V.L., Jefferson, I., Rogers, C.D.F., 2011. Assessing the sustainability ofunderground space usage – a toolkit for testing possible urban futures. Journalof Mountain Science 8 (2), 212–222.
Hunt, D.V.L., Jefferson, I., Drinkwater, N.K., Rogers, C.D.F. (2012). Sustainable utilityplacement for University campuses. In: Proc. of Geocongress 2012, ASCE, SanFrancisco, USA, March 2012. 10pp.
Iseley, D.T., Tanwani, R., 1990. Social costs of traditional methods of utilityinstallation. In: Proc. of Microtunnelling and Horizontal Directional Drilling,Symposium, AA1-7.
ITA, 2010. Electrical and Communication Cables. International Tunnelling andUnderground Space Association <http://www.ita-aites.org/index.php?id=196>(accessed 03.03.11).
Jefferson, I., Rogers, C.D.F., Hunt, D.V.L., 2006. Achieving Sustainable UndergroundConstruction in Birmingham Eastside? The 10th International Congress of theIAEG, Nottingham, UK, September 2006 (CD-ROM).
Jung, Y.J., Sinha, K., 2007. Evaluation of trenchless technology methods formunicipal infrastructure systems. ASCE, Journal of Infrastructure Systems 13(2), 144–156.
Kolator, R., 1998. Economic comparison between conventional trench method andtrenchless technology in an urban environment. In: Proc. of the 16th Int. No-Dig, ISTT, Laussanne, June, pp. 51–64.
Laistner, A., 1997. In: Utility Tunnels – Long Term Investment or Short TermExpenses? 1997 International No-Dig Conference, Taipei.
Langdon, D., 2009. Spon’s Civil Engineering and Highway Works Price Book 2010.Taylor & Francis Ltd., London, 792pp.

26 D.V.L. Hunt et al. / Tunnelling and Underground Space Technology 39 (2014) 15–26
Legrand, L., Blanpain, O., Buyle-Bodin, F., 2004. Promoting the urban utilities tunneltechnique using a decision making approach. Tunnelling and UndergroundSpace Technology 19 (1), 79–83.
Lemoine, D., 2008. Boul. Saint-Laurent: Plans de Relance Compromis.<www.lesaffaires.com> (accessed 24.06.11).
Ling, D.J., Vickridge, I.G., Letherman, L.M., Read, G.F., Bristow, A.L., 1989. Social costsof sewerage rehabilitation – where can no-dig techniques help? Tunnelling andUnderground Space Technology 4, 495–501.
Lombardi, D.R., Caserio, M., Donovan, R., Hale, J., Hunt, D.V.L., Weingaertner, C.,Barber, A., Bryson, J.R., Coles, R., Gaterell, M., Jankovic, L., Jefferson, I., Sadler, J.,Rogers, C.D.F., 2011. Elucidating sustainability sequencing tensions andtradeoffs in development decision-making. Environmental Planning B. 38 (6),1105–1121.
Ludovic, L., Blanpain, O., Buyle-Bodin, F., 2004. Promoting the urban utility tunneltechnique using a decision-making approach. Tunnelling and UndergroundSpace Technology 19 (1), 79–83.
Matthews, J.C., Allouche, E.N., 2010. A social cost calculator for utility constructionprojects. North American Society for Trenchless Technology (NASTT) No-DigShow. Paper F-4-03. 10 pp.
McKim, R.A., 1997. Bidding strategies for conventional and trenchless technologiesconsidering social costs. Canadian Journal of Civil Engineering 5 (24), 819–827.
McMahon, W., Burtwell, M.H., Evans, M., 2005. Minimising Street WorksDisruption: The Real Costs of Street Works to the Utility Industry and Society(05/WM/12/8). UK Water Industry Research, London.
Mohring, K., 1987. ‘Erfahrungen und technisch-wirtschaftlich bertrachtungen beider planung und beim bau von abswasserkanalen kleiner nennweiten ingeschlossner bauweise. Vortrag anlablich des 100 jahrigen der societa del gresing. Sala, Bergamo, October.
Najafi, M., 2005. Trenchless Technology: Pipeline and Utility Design, Constructionand Renewal. McGraw-Hill, New York.
Najafi, M., Kim, K.O., 2004. Life-cycle-cost comparison of trenchless andconventional open-cut pipeline construction projects. In: ASCE, ConferenceProceedings Paper – Pipeline Engineering and Construction.
NJUG, 2003. Utilities Guidelines on Positioning and Colour Coding of Apparatus.National Joint Utilities Group, London, UK.
Ormsby, C., 2009. A framework for estimating the total cost of buried municipalinfrastructure renewal projects. M.S. Thesis, Department of Civil Engineeringand Applied Mechanics, McGill University, Montreal, CN, June 2009.
Parker, H.W., 2004. Underground space: good for sustainable development, & viceversa. In: Proceedings, WTC, ITA, Singapore, May 2004.
Peters, D.C., 1984. The social costs of sewer rehabilitation. International conferenceon the planning, construction, maintenance and operation of sewerage systems.
Podevin, C., 1998. Clé de sol, démarche de progression pour les galeriesmultiréseaux. 153pp (in French).
POST, 1997. Tunnel Vision – The Future Role of Tunnels in Transport Infrastructure.Parliamentary Office of Science and Technology. 45pp.
Pucker, J., Allouche, E.N., Sterling, R.L., 2006. In: Social Costs Associated withTrenchless Projects: Case Histories in North American and Europe, 2006 NASTTNo-Dig Conference, Nashville, Tennessee, March 26–28, Paper C-4-04, NASTT,Arlington, Virginia.
Rahman, S., Vanier, D.J., Newton, L., 2005. MIIP Report: Social Cost Considerationsfor Municipal Infrastructure Management. National Research Council Canada.
Rehan, R., Knight, M., 2007. Do Trenchless Pipeline Construction Methods ReduceGreenhouse Gas Emissions? Centre for Advancement of TrenchlessTechnologies (CATT). 21pp.
Riera, P., Pasqual, J., 1992. The importance of urban underground land value inproject evaluation: a case study of Barcelona’s utility tunnel. Tunnelling andUnderground Space Technology 7 (3), 243–250.
Rogers, C.D.F., Hunt, D.V.L., 2006. Sustainable utility infrastructure via multi-utilitytunnels. In: Proceedings of the 1st International Construction SpecialtyConference, Calgary.
Stein, D., Drewniok, P., 1998. Solving inner-city infrastructure problems throughthe use of accessible service tunnels. In: Proc. of the 15th Int. No-Dig, Paper10–3.
Sterling, R.L., 2000. Utility Locating Technologies: A Summary of Responses to aStatement of Need Distributed by the Federal Laboratory Consortium forTechnology Transfer. Federal Laboratory Consortium Special Reports, Series 9.
Sterling, R.L, Admiraal, H., Bobylev, N., Parker, H., Godard, J-P., Vähäaho, I., Rogers,C.D.F., Shi, X., Hanamura, T., 2012. Sustainability issues for underground spacein urban areas. urban design and planning. In: Proceedings of the Institution ofCivil Engineers, Special Issue on Urban Development and Sustainability.
Thomas, A.M., Rogers, C.D.F., Chapman, D.N., Metje, N., Castle, J., 2008. Stakeholderneeds for ground penetrating radar utility location. Journal of AppliedGeophysics 67, 345–351.
Tighe, S., Lee, T., McKim, R., Haas, R., 1999. Traffic delay cost savings associated withtrenchless technology. Journal of Infrastructure Systems, 45–51.
Tighe, S., Knight, M., Papoutsis, D., Rodriguez, D., Walker, C., 2002. User cost savingsin eliminating pavement excavations through employing trenchlesstechnologies. Canadian Journal of Civil Engineering 29, 751–761.
Watkins, L.H., 1980. In: Some Research into the Environmental Impact of Roads andTraffic, Transport Research for Social and Economic Progress. Paper presented atthe World Conference on Transport Research.
Wohlwend, E., Regazzoni, M., Odier, M., 1998. In: The Development andConstruction of a Network of Service Galleries for the Industrial Services ofGeneva. International No-Dig 1998 Conference. Lausanne.
Woodroffe, N.J.A., Ariaratnam, S.T., 2008. Cost and risk evaluation for horizontaldirectional drilling versus open-cut in urban environment. ASCE, PracticePeriodical on Structural Design and Construction 13 (2), 85–92.
Zhang, A., Boardman, A.E., Gillen, D., Water II, W.G., 2004. Towards Estimating theSocial and Environmental Costs of Transportation in Canada. Master ofEngineering Thesis, Transport Canada, Centre for Transportation Studies,Sauder School of British Columbia, Vancouver, Canada. 141pp.