sustainable water consumption in distilleries, breweries
TRANSCRIPT

Sustainable Water Consumption in Distilleries, Breweries, & Wineries
Mapping water use and identifying reduction opportunities for sustainable operations
April 23, 2020
KY Sustainable Spirits & Brewing Initiative

Sustainable Water Consumption in Distilleries, Breweries, & Wineries
Mapping water use and identifying reduction opportunities for sustainable operations
April 23, 2020
Lissa McCracken
Executive Director, KPPC
KY Sustainable Spirits & Brewing Initiative

Before We Start . . .
Today’s session is being recorded and will be available on the KPPC website (kppc.org).
The conference line is muted.
Questions will be addressed after each section as time allows.
Please submit questions through the question window of your control panel.

KPPC is based at the
University of
Louisville J.B. Speed
School of
Engineering
Help KY businesses and
industries develop
environmentally
sustainable, cost-saving
solutions for improved
efficiency
Free • Confidential • Non-regulatory

Kentucky Sustainable Spirits
Agenda Topics
Water Bills
Water Baselining and Benchmarking
Adding Water to Sustainable Value Stream Map
Management and Technologies
Q&A
Wrap-up and Adjourn
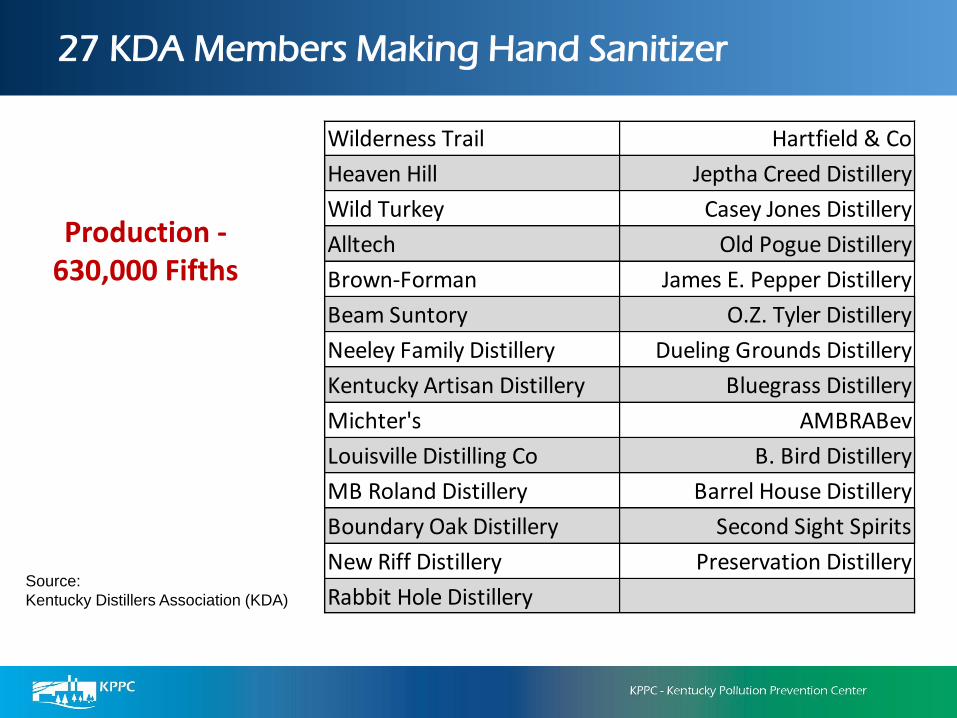
27 KDA Members Making Hand Sanitizer
Production -630,000 Fifths
Wilderness Trail Hartfield & Co
Heaven Hill Jeptha Creed Distillery
Wild Turkey Casey Jones Distillery
Alltech Old Pogue Distillery
Brown-Forman James E. Pepper Distillery
Beam Suntory O.Z. Tyler Distillery
Neeley Family Distillery Dueling Grounds Distillery
Kentucky Artisan Distillery Bluegrass Distillery
Michter's AMBRABev
Louisville Distilling Co B. Bird Distillery
MB Roland Distillery Barrel House Distillery
Boundary Oak Distillery Second Sight Spirits
New Riff Distillery Preservation Distillery
Rabbit Hole DistillerySource:
Kentucky Distillers Association (KDA)

Water Bills, Baselining,
and Benchmarking
Samantha Gordon,
CEMSenior Engineer, KPPC

Water Bills
• Good place to start at any point in your journey
• Understand what you are consuming
• Look at your water bills regularly
– Consumption
– Charge per gallon
– Wastewater or sewer
– Miscellaneous fees
– Total costs


Baselining
• Track the data
– Spreadsheets
– ENERGY STAR Portfolio Manager
– Online platform
• Look at trends
• Understand what a “typical” month looks like to identify and investigate anomalies
• Use for goal setting purposes

Benchmarking
• Compare your facility energy and water use to one or more other facilities
• Use as a guide and not ranking
• “When performance is measured, performance improves”– Beverage Industry Environmental Roundtable (BIER)
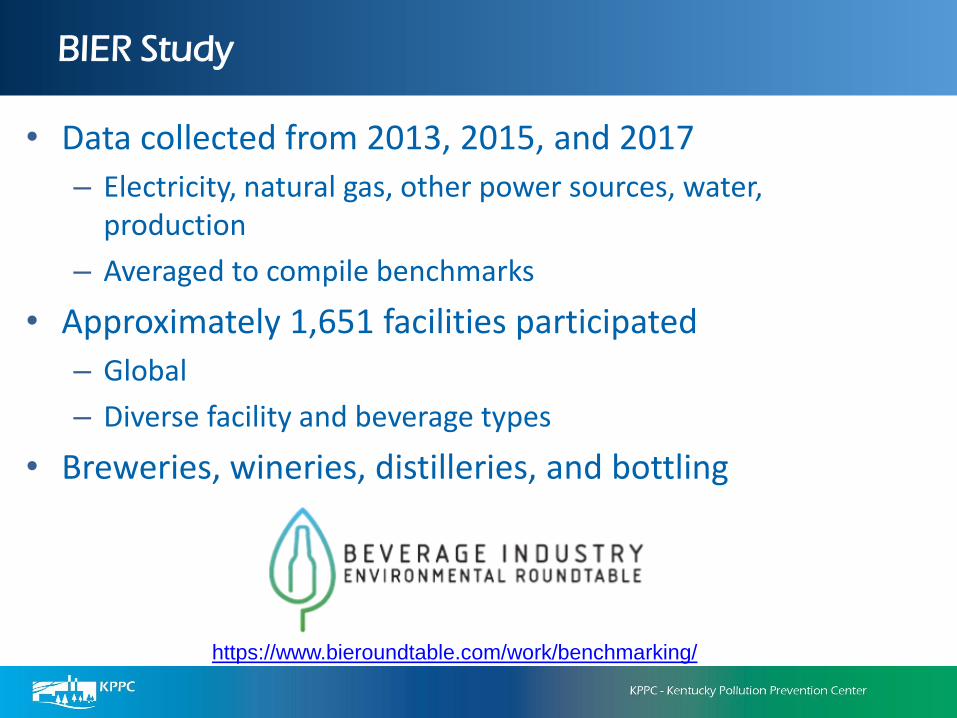
BIER Study
• Data collected from 2013, 2015, and 2017
– Electricity, natural gas, other power sources, water, production
– Averaged to compile benchmarks
• Approximately 1,651 facilities participated
– Global
– Diverse facility and beverage types
• Breweries, wineries, distilleries, and bottling
https://www.bieroundtable.com/work/benchmarking/
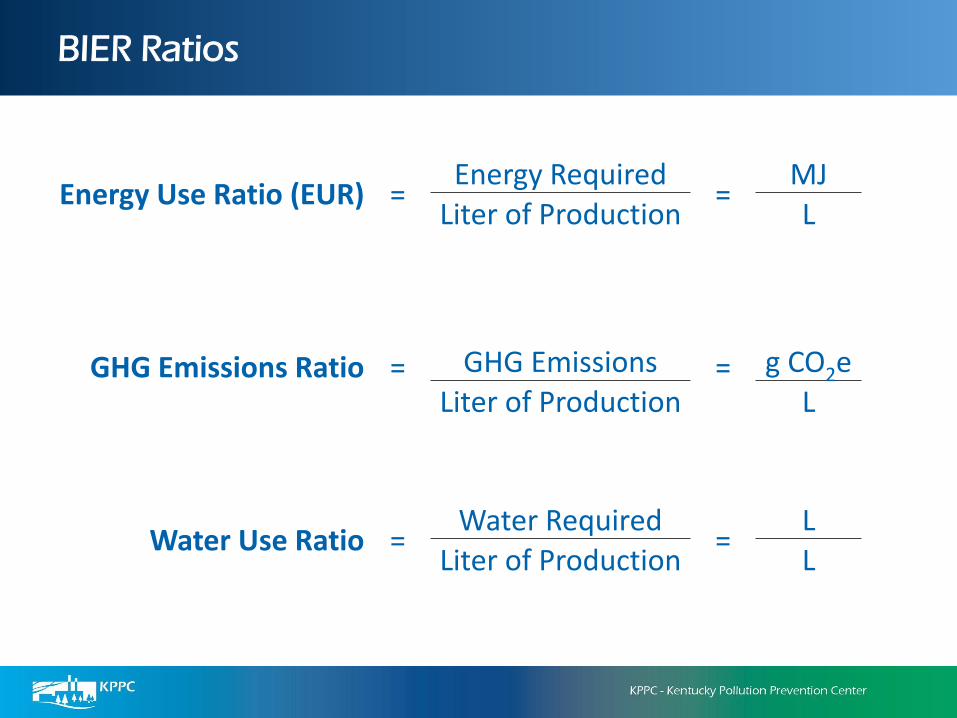
BIER Ratios
Energy Use Ratio (EUR) =Energy Required
=MJ
Liter of Production L
GHG Emissions Ratio = GHG Emissions = g CO2e
Liter of Production L
Water Use Ratio =Water Required
=L
Liter of Production L

BIER Study Results
Beverage Industry Environmental Roundtable (BIER) Benchmarks
Averaged from 2013, 2015, 2017 energy, water, and emissions surveys
Energy Use Ratio (MJ/L)
GHG Emissions Ratio(g CO2e/L)
Water Use Ratio (Lwater/Lproduction)
Brewery 1.17 97.63 3.49
Distillery 13.32 738.40 36.81
Winery 1.71 118.31 3.92
Bottling (All) 0.41 37.12 1.93
• Ratios have decreased over the 3 year period
– Efficiency plays a large role
• Correlation between larger production facilities and lower ratios

BIER Study Results in Kentucky Distilleries
https://kybourbon.com/wp-content/uploads/2019/05/2018-KDA-External-Summary.pdf

KPPC SSBI Calculator
• Find it on the KPPC website
• Improvements:
– Added water benchmarking
– Updated figures
• Demo http://kppc.org/ssb

Questions
Samantha Gordon
502-852-3485
Mark Toda
502-852-1987

Sustainable Value
Stream Mapping - Water
Mark Toda, CEMSenior Engineer, KPPC

BIER Process Boundary
Beverage Production Operations
Agriculture Distribution
Glass Supply
Process Boundary
Significantly more water is used in agriculture and glass-making than in beverage production operations

Water Efficiency and WUR
• Distillery WUR range – 9 to 63 L/L in 2010 (KY average 31 L/L).
• Water use decreased 4% from 2013-2017. Increased production led to an 8% decrease in WUR.
• Diageo improved water efficiency by 19% from 2007 to 2013.
• Bacardi improved WUR by 40% from 2006 to 2012.
• Brown Forman’s goal to reduce WUR by 30% by 2023.

Assessing Facility Water Use
• Gather information
• Establish water use baseline
• Inventory water using equipment & map processes
• Create a facility water balance

Water Use Inventory
Item LocationFlow
(Gal per minute)
Operating Time
(Minutes/day)
Flow per Day
(Gal per day)Comments
Calculated
Calculated
Calculated
Calculated
Calculated
Calculated
Water Use Inventory
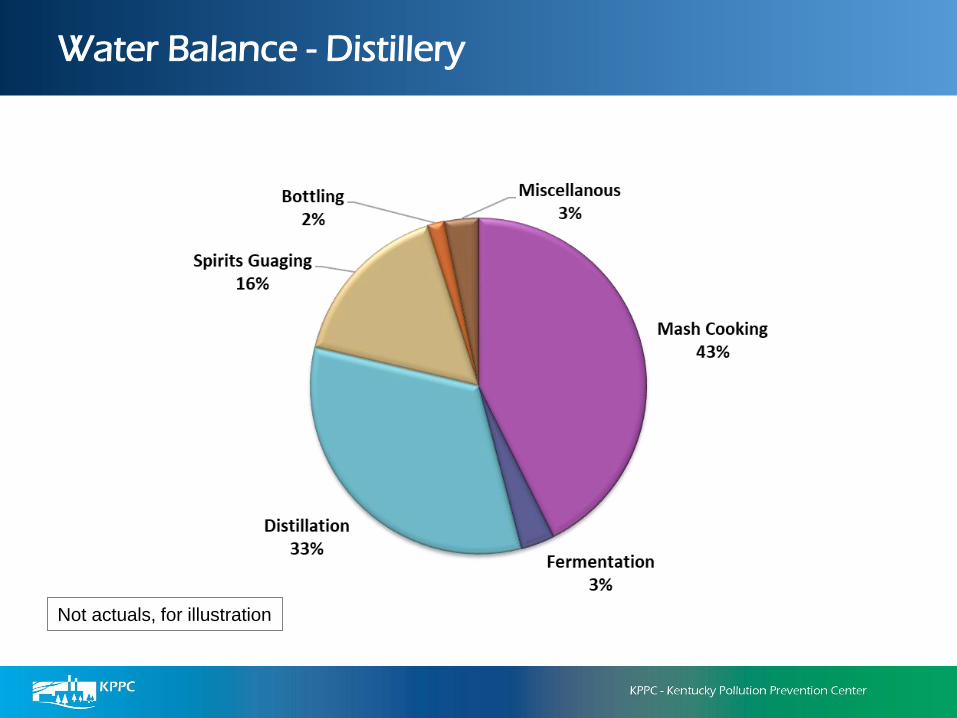
Water Balance - Distillery
Not actuals, for illustration
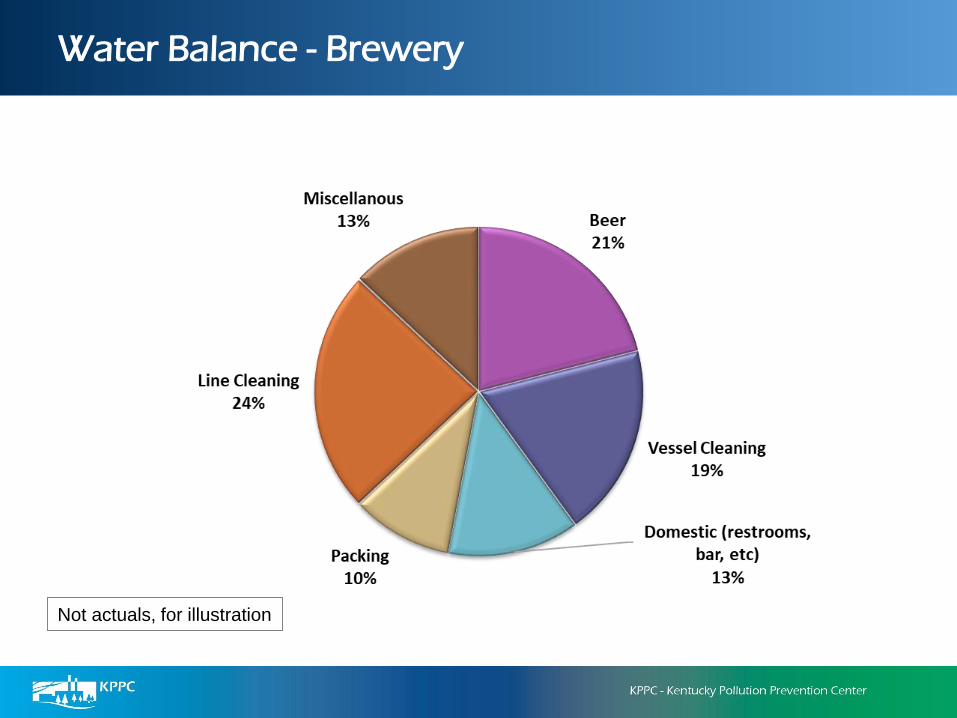
Water Balance - Brewery
Not actuals, for illustration

Lean and Water
• Water Gemba Walks
• Water Balance
• Value Stream Mapping
• Waste Elimination Culture
• Total Productive Maintenance
Lean and Water Toolkit, U.S. Environmental Protection Agency
https://www.epa.gov/sites/production/files/2013-10/documents/lean-water-toolkit.pdf

Water Waste
• Water waste – water used beyond the point of adding value to the customer (non-value added water use)
• Water waste leads to increased wastewater
• Water, energy, chemical and labor costs
• Exacerbates water scarcity concerns
Water Efficiency
• Reduction in the amount of water used per unit of production
• Minimum amount of water needed to perform a task
• Product water use, process water use
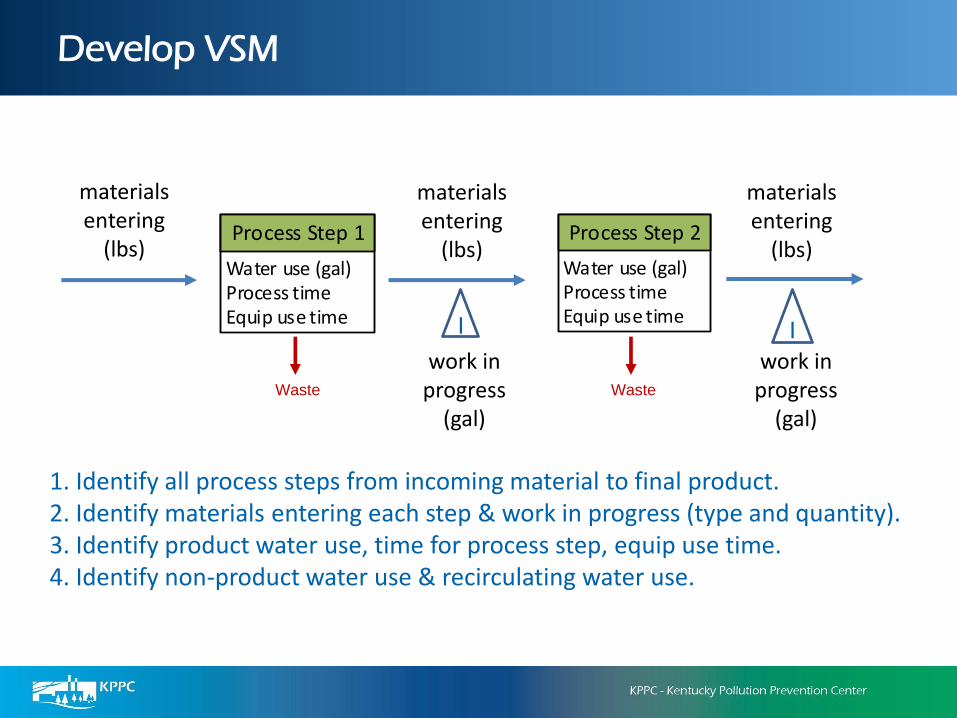
Develop VSM
1. Identify all process steps from incoming material to final product.2. Identify materials entering each step & work in progress (type and quantity).3. Identify product water use, time for process step, equip use time.4. Identify non-product water use & recirculating water use.
materialsentering
(lbs)
work in progress
(gal)
work in progress
(gal)
I I
materialsentering
(lbs)
materialsentering
(lbs)Water use (gal) Process timeEquip use time
Process Step 1
Water use (gal) Process timeEquip use time
Process Step 2
Waste Waste
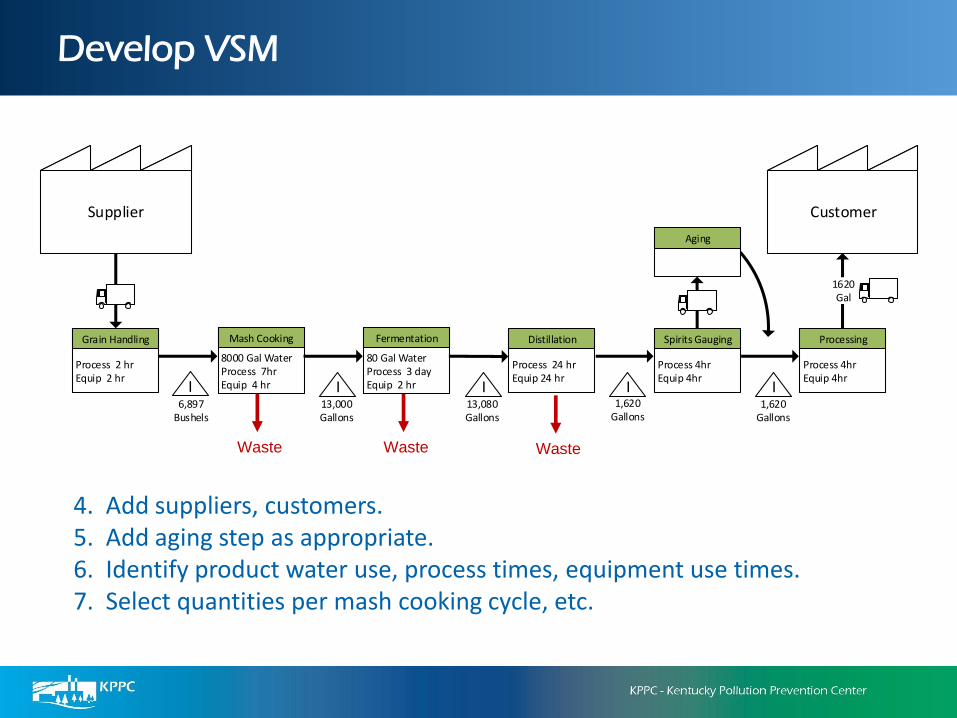
Develop VSM
Supplier Customer
1620Gal
Process 2 hrEquip 2 hr
Grain Handling
8000 Gal WaterProcess 7hrEquip 4 hr
Mash Cooking
80 Gal Water Process 3 dayEquip 2 hr
Fermentation
Process 24 hrEquip 24 hr
Distillation
Process 4hrEquip 4hr
Spirits Gauging
Process 4hrEquip 4hr
Processing
Aging
I I I I I6,897
Bushels13,000Gallons
13,080Gallons
1,620Gallons
1,620Gallons
4. Add suppliers, customers.5. Add aging step as appropriate.6. Identify product water use, process times, equipment use times.7. Select quantities per mash cooking cycle, etc.
Waste Waste Waste

Distillery Sus-VSM

Brewery Sus-VSM
Water
ElectricDemand
ElectricUsage
0 0 0 0 0 0 0 0 0 0 0 0 0 0 0 0 0 0
Supplier Customer
Steam
Milling Mash/Lauter Boiling/Whirlpool Fermenting Aging Packaging
I I I I I

Benefits of Adding Water to VSM
• Gain understanding of where water waste occurs
• Identify areas to reduce excess water use
• Develop efficiency implementation plans
• Quantify expected savings from improvements
• Create a culture of efficiency

Management &
Technologies
Mark Toda, CEMSenior Engineer, KPPC
Water Management Planning
• Water management team
• Water management policy
• Water efficiency performance objectives
• Goal tracking
• Incorporate in environmental management system

Water Saving Strategies
• Adjust water flow
• Modify existing equipment or install water saving devices
• More efficient equipment
• Reuse or recycle water
• Low water or waterless process

Water Best Management Practices - Breweries
• Utilize submetering
• Clean in place systems for brewery tanks
• Landscape design for reduced/proper watering
• Retrofit flush valve toilets with dual flush handles
• Replace pre-rinse spray valves
Brewers Association Water and Wastewater Treatment/Volume Reduction Manualhttps://www.brewersassociation.org/attachments/0001/1517/Sustainability_-_Water_Wastewater.pdf

Marbel Distilling, Carbondale, Colorado
• Recapture 100% of process water
• Water Energy Thermal System
– Hot water is captured and stored for use
– Used for process heat, domestic hot water, space heat
– Cool water used for process and space cooling

Solar Hot Water (Thermal)
• Preheat to boiler
• Cleaning
• Other processes

Action Items
Baseline water use
Complete WUR calculator (kppc.org/ssb)
Develop water balance (utilize equipment inventory, Sus-VSM)
Contact KPPC for assistance


Wrap-up Lissa McCracken
Executive Director
KPPC

Reminders
• Please complete post-webinar survey.
• Today’s session was recorded and will be available on the KPPC website (www.kppc.org/ssb).
• The sustainability calculator spreadsheet is available for download.
• Today’s presentation is available upon request.
[email protected] [email protected]
502-852-3485 502-852-1987

Sustainable Water Consumption in Distilleries, Breweries & Wineries
Mapping water use and identifying reduction opportunities for sustainable operations
April 23, 2020
KY Sustainable Spirits & Brewing Initiative
Thank you!