svlg report
TRANSCRIPT

7/27/2019 SVLG Report
http://slidepdf.com/reader/full/svlg-report 1/27
Data Center Energy Forecast
Final Report
July 29, 2008

7/27/2019 SVLG Report
http://slidepdf.com/reader/full/svlg-report 2/27
In 2007 the Environmental Protection
Agency (EPA) published its Report
to Congress on Server Data Center
Energy Efciency (EPA Report)1.
In response many companies
implemented data center energy
saving initiatives. This report
recounts a number of these efforts
and their results, particularly howmuch energy they were able to save
and what it took to implement the
initiatives. This report:
• Re-computes energy projections
from the EPA Report (this report
bases analysis on measured results
when available instead of relying
only on estimates)
• Presents a side-by-side comparison
of energy savings achieved by the
case studies
• Defines and analyzes a scenario
consisting of the combined
initiatives documented in this
report.
These ndings may help accelerate
the adoption of energy saving
technology in data centers;
specically they should help:
Data center operators make better•
informed decisions on the effec-
tiveness of energy saving initiatives
Guide policymakers on potential•
regulation and certification by
demonstrating achievable results
Educate the public on the impact of •
data centers on energy use and on
how data centers can save energy
by implementing technology and
applying leading practices.
1 Introduction
1.1About theEPA report
In response to Public Law 109-431,
the United States EPA Energy Star
program published a report assessing
the energy used by government and
commercial servers and data centersin the US. The EPA Report projects
the near-term growth of energy
use based on current trends and
evaluates potential savings related
to improving energy efficiency. The
findings are based on historical data
and expert estimates of the impact
from energy efficient initiatives.
These initiatives include both those
promoting technology in terms of
research, development, and imple-
mentation, and those promoting
social responsibility via incentive pro-
grams, regulation, and certification.
The EPA Report suggests a series of
recommendations that focus on the
need for public and private sector
collaboration in providing “objective,
credible information about the effect
of energy-efficient technologies and
practices on data center availability
and performance.” Such information
may help to define standards andbenchmarks, promote the adop-
tion of energy efficient technology,
and encourage vendors to develop
energy efficient products. This
report documents the 2008 Data
Center Demonstration Project; its
findings are meant as a companion
and a response to the EPA Report.
As a companion, these findings are
based on actual measurements that
can be compared against those from
the EPA Report, which are based on
estimates. As a response, this project
answers the EPA’s call for the public
and private sectors to take a role in
implementing and benchmarking
energy saving initiatives.
1.2 About the DataCenter DemonstrationProjectThe Data Center Demonstration
project responds to the EPA’s call-to-
action: “Objective, credible informa-
tion is needed about the performance
of new technologies and about best
practices as well as the effect of both
on data center availability” (EPA 113).
This project is the first of its kind to
present a collection of proof of con-
cepts hosted in commercial data cen-
ters rather than vendor evaluations or
research results. End user operators
demonstrate the EPA’s energy effi-
cient initiatives via implementations
within their production data centers.
The initiatives encompass opera-tions, equipment, and site facilities
improvements covered in the EPA
Report. Operators document in case
studies the measured energy savings
and the applicability of the solution
within a commercial data center. This
report compiles the findings from the
individual case studies and uses them
2
1EPA, Environmental Protection Agency, Report to Congress on Server and Data Energy Efficiency, 2007.

7/27/2019 SVLG Report
http://slidepdf.com/reader/full/svlg-report 3/27
to re-compute the energy saving
scenarios defined by the EPA.
The inaugural Data Center
Demonstration Project 2008 cov-
ers 11 technology initiatives with
17 case studies. Results are com-
puted in terms of energy savings
and its impact on the reduction of
Greenhouse gas emissions and costs.Additionally the case studies elabo-
rate on implementation realities that
must be considered. This 2008 effort
is the first of an ongoing series to
show quantifiable results from adopt-
ing new technology. This project
will continue with future iterations
based on the commitment of many
of the contributing organizations and
through continued outreach to host
data center operators and green IT
and site infrastructure technology
providers.
1.3 Participants
Data Center Demonstration
participants comprise an informal
group of technology, policy and
implementation experts and partners
who are engaged in creating a series
of demonstration projects that show
emerging and best available energyefciency technologies and practices
associated with operating, equipping
and constructing data centers.
The project was launched by the
Silicon Valley Leadership Group (the
Leadership Group) and Lawrence
Berkeley National Laboratory
(LBNL). The Leadership Group’s
member companies cooperate with
national and regional government
to address major public policyissues affecting economic health
and quality of life in Silicon Valley.
The Leadership Group solicited
participation from its member
organizations to demonstrate energy
efciency techniques within their
data centers. The members either
implemented new initiatives or
documented recently completed
retrot initiatives within their data
centers, and then shared measured
results and implementation details.
LBNL collaborated with the EPA to
help author and create the estimation
model used in the EPA Report. For
this project LBNL made available their
model behind the EPA report and
provided the technical expertise in
identifying, implementing, measuring,
and analyzing many of the initiatives
studied.
Project contributors and their roles
are set out below. Host data centers
housed the projects and wrote
case studies. Technology partners
supported data center operators by
providing equipment and expertise
to implement the solutions. Sponsors
helped offset the implementationcosts. Sun Microsystems hosted
the rst Data Center Energy Summit
event June 26, 2008 during which
ndings from the individual case
studies and this consolidated report
were presented.
1.4 Accenture’s RoleAs a non-biased independent
participant Accenture provided
certain project managementassistance, helped aggregate the
results, and assisted the Leadership
Group with the consolidated analysis.
For this role Accenture provided:
A vendor agnostic position in•
industry
Extensive Green IT industry•
experience and knowledge
capital (Accenture is recognized
as a leader in Green IT by
Forrester2)
Deep technical background from•
its Data Center Technology and
Operations practice.
Accenture is honored to be given
the responsibility by the Leadership
Group and LBNL to write this
consolidated report.
3
Participants of Data
Center Demonstration
Project
Organizers• Silicon Valley Leadership
Group (SVLG)• Accenture
• Lawrence Berkeley NationalLabs (LBNL)
• California EnergyCommission (CEC)
• Department of Energy(DOE)
• Event hosted by SunMicrosystems
Host Data Center• Digital Realty Trust
• LBNL
• NetApp
• Oracle
• Sun Microsystems
• Symantec
• Synopsys
• US Postal Service
• Yahoo!
Technology Partner• APC
• Cassatt
• IBM
• Liebert
• Modius
• Power Assure
• Powersmiths
• Rittal• SprayCool
• SynapSense
Case Study Sponsor• CEC
• LBNL
• PG&E
• Silicon Valley Power2Forrester, “The Dawn of Green IT Services,” Feb 2007.

7/27/2019 SVLG Report
http://slidepdf.com/reader/full/svlg-report 4/27
2.1 DocumentedGrowth in Energy Useby U.S. Data Centers
Data centers consume a significant
amount of the nation’s total sup-
ply of electricity. As of 2006, theelectricity use attributable to the
nation’s servers and data centers was
estimated at about 61 billion kilowatt-
hours (kWh), or 1.5 percent of total
U.S. electricity consumption. Since
2000 this electricity use has more
than doubled, amounting to about
$4.5 billion in electricity costs ( EPA
25). It is more than the electricity
consumed by color televisions in the
U.S. It is equivalent to the electricity
consumed by 5.8 million average U.S.households (which represent 5% of
the U.S. housing stock). It is similar
to the amount of electricity used by
the entire U.S. transportation manu-
facturing industry (which includes the
manufacture of automobiles, aircraft,
trucks, and ships) (EPA 25).
The energy used by data centers is
growing and impacts the nation’s
power supply with effects on enter-
prises, energy providers and theenvironment. When data centers
use energy efficiently, enterprises
can save on energy costs. Power
providers face less energy demands,
resulting in increased supply for its
other consumers and possibly fewer
blackouts. Less power generation
also results in lower greenhouse gas
emissions and fewer power plants.
For these reasons, data center energy
efficiency has become a public policy
concern and it is imperative that data
centers implement efficient methods
to minimize their energy use.
2.1.1 A GrowingNeed for ComputingCapacity
Business demands drive the growth
of data center and server energy use.
As businesses increase their offer-
ings of digital services, the demand
for compute and storage capability
increases. Some examples of growing
digital services are online banking,
e-filing of taxes, music and video
downloads, and online shipment
tracking. The need for faster, more
complex data processing is becoming
widespread; for instance, consider
how financial services moved to
digital transactions, the research
community to scientific computing,
and retailers to real-time inven-
tory and supply chain management.
Additional demand for compute capa-
bility can only be met by increasing
the processing capacity of compute
servers within data centers.
Along with greater computing
capability, businesses have increased
demand for storing digital data, both
in terms of amount and duration
due to new and existing applications
and to regulation. New applications,
like healthcare’s use of electronic
medical records, require electronic
storage, and existing applications
like the growing needs of insurance
databases, require more capacity.
Disaster recovery also accelerates
the need for increased storage (e.g.,
duplicate data sets) and redundant
data center equipment and facilities.
In addition, regulations mandate the
retention of business records. The
Sarbanes-Oxley Act, for example,
requires long-term storage of finan-
cial information, including electronic
records such as email (EPA 28). As
a result, it is estimated that in some
industries the number of records
that must be retained is growing at a
CAGR of 50 percent or greater (EPA
28). Data centers must meet the
exploding demand for both compute
and storage capacity.
2.1.2 Energy Neededfor Hardware, Serversand Infrastructure toMeet Demand
Data centers have grown in terms
of total energy draw. Until recently,
businesses commonly bought IT to
keep up with their demands. From
2000- 2006, the number of servers
installed in the US grew from 5.5
million to 10.9 million (EPA 35). And
those servers are typically smallerwhich means that more fit within
the data center. Shipments of higher
computing power server technolo-
gies, such as blade server shipments
were increasing at a 20-30 percent
CAGR, which is significantly higher
than the shipment rate for the overall
server market (EPA 30).
4
2 Summary of theEPA Report

7/27/2019 SVLG Report
http://slidepdf.com/reader/full/svlg-report 5/27
These practices led to data centers
consuming more power, both indi-
vidually and as a whole. Energy was
not a concern. Typically data center
operators were unaware of the
energy use since someone else paid
the electric bill. The consequence
was increased energy use from the
IT equipment exacerbated by facility
overhead. The data center became a
large draw for power.
Typically only about half the power
entering the data center is used by
the IT equipment. The rest is expend-
ed for power conversions, backup
power, and cooling. Peak power
usage for data centers can range from
tens of kilowatts (kWs) for a small
facility, to tens of megawatts (MWs)
for the largest data centers (EPA 21).
Indeed, server hardware is no longer
the primary cost component of a data
center. The purchase price of a new
(1U) server has been exceeded by
the capital cost of power and cooling
infrastructure to support that server
and will soon be exceeded by the
lifetime energy costs alone for that
server (EPA 30).
2.2 How Data CentersCan Cut ConsumptionData centers use energy to powerand support the IT equipment housedinside; how that energy is typicallyconsumed is described here.
Data centers draw power eitherfrom the main supply electricalgrid or a backup generator. Switchgear distributes the power forlighting, cooling, and powering. The
electricity consumed by lightingmay be improved by more efcientlights and lights-out operation(lights are on only when data centeroperators are present). Howeverpowering the lights accounts for onlya small percentage of the electricityconsumed; the large majority isused for powering and cooling the ITequipment.
Data centers require specialpower handling to smooth out andtransform the inputted power intosomething that the IT equipment cansafely consume. Power drawn fromthe switch gear passes through anUninterruptible Power Supply (UPS)that acts as a large battery. Thesmoothed power travels through a
Power Distribution Unit (PDU) thattransforms the inputted power tothe right phase and voltage, andthen delivers it to the IT equipment.Within the IT equipment, internalpower supplies transform the powerdown to those used at the electroniccomponent level. As power istreated and transformed, some of it is wasted due to inefciencies.The IT equipment includes servers,storage, and network drives, whichcompute, store, and communicate to
ll business needs. If IT equipmentitself is more efcient, it can producebetter performance per Watt.
As power is delivered to andconsumed by IT equipment, onebyproduct is heat. To ensure proper
operations and prevent systemfailures, this heat must be removedby the same amount of cooling, whichconsumes even more energy. Coolingequipment typically involves fans,pumps, and chillers. Most systemstoday produce and deliver the coolair to the IT and power deliveryequipment by lowering the air
temperature and then using fans topush the air to the equipment. Othertechnologies, such as direct wateror refrigerant cooling, should delivermore efcient results.
2.2.1 ClassifyingInitiatives by IT andSite InfrastructureThe EPA initiatives include operations
and technology that can improvethe efficiency of energy consumerswithin the data center. These energyconsumers are classified as IT infra-structure or site infrastructure.
IT infrastructure refers to servers,storage, and network. The EPA
5
Typical Electrical Components in the Data Center
Transformer
PDU
Servers
Lighting
Power d elivery
UPS
IT Equipment
Chillers
Cooling Systems
Pumps
Fans
Network
Storage

7/27/2019 SVLG Report
http://slidepdf.com/reader/full/svlg-report 6/27
Report identified server trends thatimprove the performance per Wattratio for both the individual units andthe installed server base. Multi-coreand power management technologyimproved the efficiency of individualunits, resulting in better performanceper Watt ratio. The server basecan improve its efficiency through
consolidation, virtualization, efficientresource utilization, and improvedcapability of individual units. Thus,data centers can meet performancedemands with fewer machines.
Storage and network were alsoanalyzed, but they had lesser impact.The EPA Report identified storagetrends that have manufacturers mov-ing towards energy efficient storagedevices. Enterprises are shiftingfrom hard disk drive storage devices
to smaller form factor disk drivesand increasingly are using serialadvanced technology attachment(SATA) drives. They are also improv-ing their management strategies byfocusing on storage virtualization,data de-duplication, storage tiering,and moving archival data to storagedevices that can be powered downwhen not in use.
Site infrastructure refers to thelighting, power delivery, and coolingsystems of data center facilities. TheEPA Report recommends improvingthe efficiency of site infrastructurethat may account for 50% or more of the total energy consumed by datacenters. Lighting improvements, suchas more efficient lights and lights-off operations, are noted. Power deliv-ery improvements include upgradesto more efficient transformers andUninterruptible Power Supplies(UPS). Cooling systems improve-ments call for improved airflow,
optimization of temperature andhumidity set points, and upgradesto water cooled chillers with variablespeed fans and pumps.
2.3 EPA EnergyScenarios by Maturityof TechnologyThe EPA dened scenarios andmeasured electricity use and costassociated. Each scenario has a setof inputs that specify the maturity
of IT and site infrastructure. Forhistorical and current trends, the EPAdetermined the inputs based on thedata available at the time. Trendswere projected to 2011. For improvedoperations, best practice, andstate-of-the-art scenarios, the EPArelied on industry experts to estimatethe impact of the level of technologymaturity dened for that scenario.
The EPA energy scenarios are denedbelow with examples of technologymaturity for IT and site infrastructurein red. Each scenario represents alevel of maturity characterized byefciency rather than an exact set of technology.
6
2.4 EPA EnergyProjections Can BeAchievedIIn the state-of-the-art scenario
electricity use is reduced by up to
55 percent compared to current
efciency trends. This represents
the maximum technical potential. Inthe best practice scenario electricity
use is reduced by up to 45 percent
compared with current trends, with
efciency gains that could be realized
using today’s technologies. The
improved operational management
scenario offers potential electricity
savings of more than 20 percent
relative to current trends,
representing low-cost energy
efciency opportunities (EPA 10).
Scenario Denition
Historical Trends Extrapolates observed 2000 to 2006 energy-use trendswithout consideration of current trendsIn 2006, energy use of servers & data centers more thandoubled from 2000Site infrastructure accounts for 50% of data center energyconsumption
Current Trends(2007)
Projects the energy use based on recently observedefciency trends
ImprovedOperations
Represents “low-hanging fruit” from operating existingcapital efciently with little or no capital investment Eliminate unused servers, turn on power managementImproved air ow management
Best Practice Represents the increased adoption of the practices andtechnologies used in the most energy-efcient facilities inoperation todayModerate consolidation of servers and storageImproved efciency for power and cooling delivery and freecooling
State-of-the-Art Identies the maximum energy savings using only themost efcient technologies and management practicesavailable todayAggressive consolidation of servers and storageDirect liquid cooling
Summary of EPA Energy Scenarios

7/27/2019 SVLG Report
http://slidepdf.com/reader/full/svlg-report 7/27

7/27/2019 SVLG Report
http://slidepdf.com/reader/full/svlg-report 8/27
The Data Center Demonstration
Project expands on the EPA Report
and strives to cover all technol-
ogy areas and scenarios. Using the
project’s demonstrated results, this
report presents its findings as com-
pared to the EPA energy projections.
In this inaugural year the case studies
provide good coverage of the initia-
tives, but they are limited in depth.
The case studies cover a broad range
of site technology, including many
state-of-the-art solutions. Studies
on IT infrastructure cover consolida-
tion, technology refresh, resource
optimization, and modest levels of
virtualization. Initiatives are assessed
by one to five case studies. As thisproject continues, the number of case
studies and technologies assessed
will continue to grow to provide addi-
tional certainty and coverage.
Participants in this project are self-
selecting; they do not represent
typical level of data center efficiency.
Even before adopting new initiatives,
most of the host data centers were
likely more efficient than industry
standards. Their commitment toenergy efficiency prompted them to
participate, to implement high-effi-
ciency solutions and share those out-
comes. Their demonstrated results
show what can be achieved and the
detailed case studies show how. In
some cases similar results may not be
attainable due to considerations like
cost, climate, and operating condi-
tions. The results instead indicate
the current level of technology matu-
rity and the amount of efficiency
that may be attained with technology
available for commercial data centers.
Although the data set is limited to 17
case studies, some conclusions can
still be made. The 17 studies cover
all equipment areas used by the
EPA model. When not validated by
measured results, this report uses the
same assumptions used in the EPA
Report. This report does not:
Make predictions on technology•
uptake
Predict the actual energy use by•
data centers, which would require
knowledge of uptake.
This report, however, does:
Demonstrate real-world findings of •
achievable energy savings in com-
mercial data centers
Compare the achieved savings of •
the initiatives side-by-side and with
the EPA estimates from industry
experts
Calibrate the current level of tech-•
nology maturity
Project the impact on energy use,•
cost, and carbon dioxide emissions,
using the reported measurements
as inputs in the EPA model
Compare the projections using•
demonstrated performance with
EPA predictions.
For data center operators, this report
helps compare the energy saving
potential of the various initiatives.
For policy makers, this report reveals
the current technology maturity and
the results that can be achieved if the
initiatives are adopted. For the gen-eral public, this project shows that
data centers are making strides to
address their responsibility as a large
energy consumer.
Note that these results show the sav-
ings in terms of energy use and the
associated costs. In most cases the
participants elected not to publish
implementation costs. In many cases
the implementation costs and ROI
were shared with the Leadershipgroup, and the reason these com-
panies chose to implement these
initiatives was because the business
case justified ROI within 18 months,
and typically within less than 1 year
when available utility incentives were
included.
8
3 ComparingDemonstration
Results with EPAEstimates

7/27/2019 SVLG Report
http://slidepdf.com/reader/full/svlg-report 9/27
9
Case Studies Covered in the 2008 Data Center Demonstration
Case Study Initiatives and Participants
Initiative Improved Operations Best Practice State of the Art
Data Center Site Infrastructure Projects
Data Center Cooling
Data Center Airow Management X X
Free Cooling in Large Scale Data Centers X X X
Data Center Cooling Optimization X
High Efciency Chilled Water Systems X
Modular Cooling Systems X X X X X
Wireless Sensor Network Adaptive Cooling X
Data Center Power Distribution
High Efciency Power Transformation X X
High Voltage AC Power X
High Efciency Stand-by Power Systems X X
IT Infrastructure Projects
Consolidation and Optimization
IT Computing Resource Optimization X X
IT Consolidation and Virtualization X X
Server Power Characterization & Modeling X
Initiative Host Data Center Technology Partner Sponsor
Data Center Site Infrastructure Projects
Data Center Cooling
Data Center Airow Management LBNL
Oracle
Free Cooling in Large Scale Data Centers Digital Realty TrustNetApp
Yahoo!
PG&E
High Efciency Chilled Water Systems Sun Microsystems LBNL
Modular Cooling Systems Efciency Performance Testing Sun Microsystems APC, IBM, Liebert,
Rittal, Power Assure,
Modius
LBNL, CEC
Wireless Sensor Network Adaptive Cooling Yahoo! SynapSense Silicon Valley Power
Data Center Power Distribution
High Efciency Power Transformation USPS
Yahoo!
Powersmiths
Powersmiths
High Voltage AC Power Yahoo!High Efciency Stand-by Power NetApp
Yahoo!
IT Infrastructure Projects
Consolidation and Optimization
IT Computing Resource Optimization NetApp
Synopsys
Cassatt
IT Consolidation Sun Microsystems
Symantec
Server Power Characterization & Modeling Sun Microsystems Power Assure

7/27/2019 SVLG Report
http://slidepdf.com/reader/full/svlg-report 10/27
3.1MeasuredResults Verify theAssumptions of theEPA ReportThis report only suggests adjust-
ments to EPA inputs in cases where
the Data Center DemonstrationProject provides measured results.
The EPA model (see Appendix 4 of
the EPA Report) takes into account
two types of input: those that speci-
fy the amount of adoption and those
that specify the efficiency of various
technologies. The case studies cover
all equipment areas. This report
uses the same adoption assumptions
as the EPA.
For historical trends and current
trends, the EPA used inputs based
on extrapolated data for their com-
putations. The EPA Report defines
scenarios based on infrastructure
maturity: improved operations, best-
practices, and state-of-the-art. For
these scenarios the EPA used expert
estimates based on the level of
technology maturity as inputs. This
report presents a side-by-side evalua-
tion comparing the measured results
and shows that EPA estimates can be
achieved.
3.2 IT InfrastructureThis year’s IT studies include server
initiatives only and do not cover
network or storage. Server efficiency
is characterized by the energy draw
per unit, the percentage of the
server base with power management
enabled, the percentage of the server
base consisting of energy efficient
servers, the fraction of virtualized
servers and those permanently
retired, and the Physical Server
Reduction Ratio (PSRR) ratio.
PSRR is the ratio of installed serverbase from historical trends to the
installed server base in the post-vir-
tualization scenarios (current trends,
improved operations, best practice,
and state-of-the-art). A PSRR of 2:1
means that server growth trends
are halved compared with the his-
torical case. For historical trends the
installed server base is derived from
IDC data for 2006 to 2010 that the
EPA extended to 2011. More details
of the EPA analysis for IT infrastruc-ture are outlined in the Appendix.
10
IT Maturity Assumptions per Scenario defined by the EPA Report
Scenario Assumptions
Historical
Trends
Energy use growth trends for IT equipment extrapolated from 2000 to 2006 to 2011. These trends indicate that U.S.
installed base of volume servers will grow by nearly 50% by 2011, but high end and mid-range will decline by 30%
and 12% respectively.
Current
Efficiency
Trends
• By 2011 volume server virtualization will lead to a physical server reduction ratio of 1.04 to 1 (for server closets)
and 1.08 to 1 (for all other space types)
• “Energy efficient” servers represent 5% of volume server shipments in 2007 and will represent 15% of shipments in
2011• Power management is enabled on 10% of applicable servers
• By 2011 average energy use per enterprise storage device will drop 7%
Improved
Operations
Scenario
• By 2011 volume server virtualization will lead to a physical server reduction ratio of 1.04 to 1 (for server closets)
and 1.08 to 1 (for all other space types)
• 5% of servers will be eliminated through virtualization (e.g., legacy applications)
• “Energy efficient” servers represent 5% of volume server shipments in 2007 and will represent 15% of shipmentsin 2011
• Power management is enabled on 100% of applicable servers
• By 2011 average energy use per enterprise storage device will drop 7%
Best
Practice
Scenario
• By 2011 moderate volume server virtualization will lead to a physical server reduction ratio of 1.33 to 1 (for server
closets) and 2 to 1 (for all other space types)
• 5% of servers will be eliminated through virtualization (e.g., legacy applications)
• “Energy efficient” servers represent 100% of volume server shipments from 2007 to 2011• Power management is enabled on 100% of applicable servers
• By 2011 average energy use per enterprise storage device drops 7%
• By 2011 data centers moderately reduceuse of applicable storage devices (1.5 to 1)
State-of-
the-art
Scenario
• By 2011 aggressive volume server virtualization will lead to a physical server reduction ratio of 1.66 to 1 (for server
closets) and 5 to 1 (for all other space types)• 5% of servers will be eliminated through virtualization (e.g., legacy applications)
• “Energy efficient” servers represent 100% of volume server shipments from 2007 to 2011
• Power management is enabled on 100% of applicable servers
• By 2011 Average energy use per enterprise storage device drops 7%
• By 2011 data centers will dramatically reduce use of applicable storage devices (~2.4 to 1)
7/27/2019 SVLG Report
http://slidepdf.com/reader/full/svlg-report 11/27
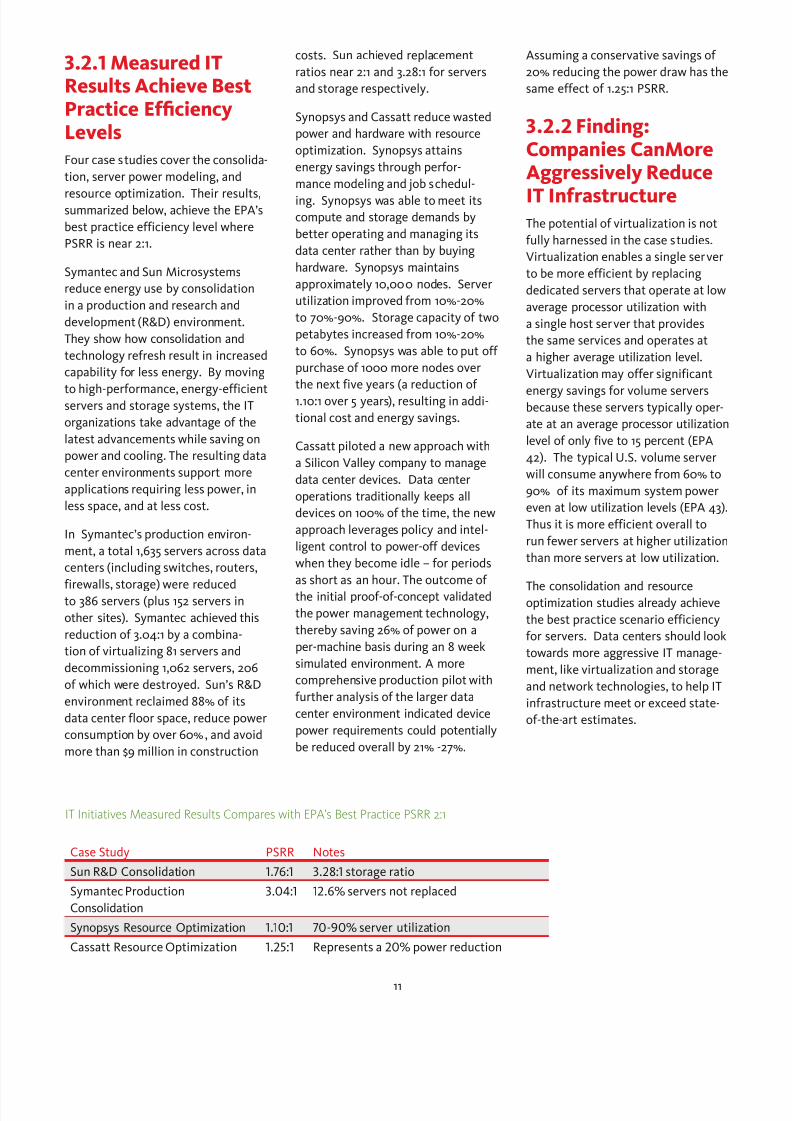
3.2.1 Measured ITResults Achieve BestPractice EfciencyLevelsFour case studies cover the consolida-
tion, server power modeling, and
resource optimization. Their results,summarized below, achieve the EPA’s
best practice efficiency level where
PSRR is near 2:1.
Symantec and Sun Microsystems
reduce energy use by consolidation
in a production and research and
development (R&D) environment.
They show how consolidation and
technology refresh result in increased
capability for less energy. By moving
to high-performance, energy-efficientservers and storage systems, the IT
organizations take advantage of the
latest advancements while saving on
power and cooling. The resulting data
center environments support more
applications requiring less power, in
less space, and at less cost.
In Symantec’s production environ-
ment, a total 1,635 servers across data
centers (including switches, routers,
firewalls, storage) were reducedto 386 servers (plus 152 servers in
other sites). Symantec achieved this
reduction of 3.04:1 by a combina-
tion of virtualizing 81 servers and
decommissioning 1,062 servers, 206
of which were destroyed. Sun’s R&D
environment reclaimed 88% of its
data center floor space, reduce power
consumption by over 60%, and avoid
more than $9 million in construction
costs. Sun achieved replacement
ratios near 2:1 and 3.28:1 for servers
and storage respectively.
Synopsys and Cassatt reduce wasted
power and hardware with resource
optimization. Synopsys attains
energy savings through perfor-
mance modeling and job schedul-
ing. Synopsys was able to meet itscompute and storage demands by
better operating and managing its
data center rather than by buying
hardware. Synopsys maintains
approximately 10,000 nodes. Server
utilization improved from 10%-20%
to 70%-90%. Storage capacity of two
petabytes increased from 10%-20%
to 60%. Synopsys was able to put off
purchase of 1000 more nodes over
the next five years (a reduction of
1.10:1 over 5 years), resulting in addi-
tional cost and energy savings.
Cassatt piloted a new approach with
a Silicon Valley company to manage
data center devices. Data center
operations traditionally keeps all
devices on 100% of the time, the new
approach leverages policy and intel-
ligent control to power-off devices
when they become idle – for periods
as short as an hour. The outcome of
the initial proof-of-concept validated
the power management technology,
thereby saving 26% of power on a
per-machine basis during an 8 week
simulated environment. A more
comprehensive production pilot with
further analysis of the larger data
center environment indicated device
power requirements could potentially
be reduced overall by 21% -27%.
Assuming a conservative savings of
20% reducing the power draw has the
same effect of 1.25:1 PSRR.
3.2.2 Finding:Companies CanMoreAggressively Reduce
IT InfrastructureThe potential of virtualization is not
fully harnessed in the case studies.
Virtualization enables a single server
to be more efficient by replacing
dedicated servers that operate at low
average processor utilization with
a single host server that provides
the same services and operates at
a higher average utilization level.
Virtualization may offer significant
energy savings for volume serversbecause these servers typically oper-
ate at an average processor utilization
level of only five to 15 percent (EPA
42). The typical U.S. volume server
will consume anywhere from 60% to
90% of its maximum system power
even at low utilization levels (EPA 43).
Thus it is more efficient overall to
run fewer servers at higher utilization
than more servers at low utilization.
The consolidation and resourceoptimization studies already achieve
the best practice scenario efficiency
for servers. Data centers should look
towards more aggressive IT manage-
ment, like virtualization and storage
and network technologies, to help IT
infrastructure meet or exceed state-
of-the-art estimates.
11
IT Initiatives Measured Results Compares with EPA’s Best Practice PSRR 2:1
Case Study PSRR Notes
Sun R&D Consolidation 1.76:1 3.28:1 storage ratio
Symantec Production
Consolidation
3.04:1 12.6% servers not replaced
Synopsys Resource Optimization 1.10:1 70-90% server utilization
Cassatt Resource Optimization 1.25:1 Represents a 20% power reduction

7/27/2019 SVLG Report
http://slidepdf.com/reader/full/svlg-report 12/27
3.3 Site InfrastructureSite Infrastructure is evaluated using
the Power Usage Effectiveness (PUE)
defined as the ratio of data center
power to IT power draw. For example
a PUE of 2, means that the data
center must draw 2 Watts for every
1 Watt of power consumed by the IT
equipment. The ideal PUE is 1 where
all power drawn by the data center
goes to the IT infrastructure.
The EPA model breaks the PUE into
its component-wise contribution
from IT and site equipment. Site
equipment is broken down into
lighting, power delivery, and cooling
systems. Power delivery is further
broken down into transformer and
UPS losses. The cooling system is
separated into the chilled water sys-
tem and the fans. The chilled water
system includes both the chillers and
the pumps. Thus the total PUE con-
sists of adding the contribution from
IT equipment, lighting, transformer
losses, UPS losses, chilled water sys-
tem, and fans. For instance the PUE
contribution from lighting is the ratio
of power used by the lighting to the
power drawn by the IT load.
The case studies report measured
results for all site equipment areas:
lighting, transformers, UPS, chilled
water systems, and fans.
12
Site Maturity Assumptions per Scenario as Defined in the EPA Report
Scenario Name Assumptions
Historical Trends Site infrastructure consumes 50% of all data center energy,which corresponds to a PUE of 2.0.
Current Efficiency
Trends
A 1% drop in improvement per year resulting in a PUE of 1.90 at the end of 5 years (a 5% reduction).
Improved Operation
Scenario
Essentially the same site infrastructure systems as in the
current efficiency trends scenario. Equipment typically includes:• 95% efficient transformers• 80% efficient UPS• Air cooled direct exchange system chiller• Constant speed fans• Humidification control• Redundant air handling units.
Best Practice Scenario Facility performs as well as the most energy efficientfacilities identified in recent benchmarking studies of 22data centers performed by Lawrence Berkeley NationalLaboratory (Tschudi et al. 2004; Greenberg et al. 2006).The best PUE ratios identified in these benchmarking stud-ies were around 1.3. Infrastructure systems in such facilities
use proven energy eff icient technologies that commonlyinclude:• 98% efficient transformers
• 90% efficient UPS• Variable-speed drive chiller with economizer or water
side free cooling• Variable-speed fans and pumps• Redundant air handling units.
State-of-the-art
Scenario
Representative infrastructure equipment for a state-of-the-art facility includes emerging energy efficient technologiessuch as liquid cooling (instead of air), DC power distribu-tion to reduce UPS losses, and distributed generation usingcombined heat and power (CHP). A cooling tower with
variable speed pumps to rack coils would reduce coolingsystem power to roughly 0.15 kW/ton. Typical equipment ina state-of-the-art facility includes:• 98% efficient transformers• 95% efficient UPS• Liquid cooling to the racks• Cooling tower• Variable-speed drive pumps• CHP
Estimate of PUE Contribution by Equipment per Scenario Used in the EPA Report
Site Infrastructure
ITEquipment
TransformerLosses
UPSLosses
ChilledWater Fans Lighting Total
RoundedValue
Historical 1.00 0.05 0.17 0.54 0.16 0.08 2.00 2.00
Current Trends 1.00 1.90 1.90
Improved Operations 1.00 0.05 0.20 0.30 0.13 0.02 1.70 1.70
Best Practice 1.00 0.03 0.10 0.10 0.03 0.02 1.28 1.30
State of Art 1.00 0.03 0.05 0.04 0.02 1.14 1.20

7/27/2019 SVLG Report
http://slidepdf.com/reader/full/svlg-report 13/27
3.3.1Lightingconsumes only asmall fraction of energy usedNetApp’s Building 11 data center
reports a PUE contribution of 0.011
which is well under the 0.02 contribu-tion estimated for the state-of-the-art
scenario. Lighting is a small percent-
age of data center energy consump-
tion.
3.3.2 Power deliveryimproves with bet-ter technology andmanagement
The efficiency of power deliveryitems is defined as the fraction of
output power over the input power.
The difference from 100% of this
efficiency is the loss; for a 98% effi-
cient system, the loss is 2%. The EPA
uses this difference as an estimate
for the component-wise PUE. This
estimate is inaccurate when used for
both transformers and UPS since the
power delivery equipment runs in
series. Recall that the component-
wise PUE is defined as the ratio of
power lost by that component to the
power drawn by the IT equipment.
Typically IT power draw is estimated
by the output of the transformers.
So the loss estimate is inaccurate as
the PUE contribution for the UPS. To
be consistent, however, this report
uses the same estimate given in the
EPA Report and the difference is
small.
UPS
Typically manufacturers provide effi-
ciency data for power equipment thatis expressed as a percent of power
output to full-power input. The result
of using the manufacturer’s published
efficiency ratings at full load is that
the electrical losses of real data
centers are significantly higher than
most users or designers anticipated.
The efficiency curve of static UPS
systems at light loads falls near zero.
For this reason the efficiency of the
UPS system at partial load must be
considered for an accurate reading.
UPS systems vary significantly by
both the technology and the activepower load. This difference is
because the actual efficiency of the
UPS varies as a function of the IT
load running on the UPS. In most
data centers, which are designed with
fully redundant (2N) UPS, each UPS
system is typically carrying 40% of
the IT load. In a (2N+1) scenario, each
UPS is loaded to a maximum of 33%
of full load.
The case studies compare the electri-cal losses of the most commonly
used UPS technology, that is Double-
Conversion, with Flywheel UPS,
which the EPA rates best-in-class
technology. To accomplish this task,
13
Historical Trends
Improved Operations
Best Practice
State of the Art
0.00
0.05
0.10
0.15
0.20
0.25
0.00
0.05
0.10
0.15
0.20
0.25
Yahoo! Space Park Yahoo! Wenatchee Yahoo! Quincy NetApp Building 11
EPA S cenarioPUE
UPS Loss
Effect on Total PUE—UPS

7/27/2019 SVLG Report
http://slidepdf.com/reader/full/svlg-report 14/27
this study compares actual UPS elec-
trical losses in four large-scale pro-
duction data centers with comparable
load factors (approximately 45% load-
ed except for Yahoo! Space Park run-
ning at approximately 60%). Yahoo!
Space Park and Yahoo! Wenatchee
data centers were designed with fully
redundant static UPS systems with
battery storage. Yahoo! Quincy and
NetApp Building 11 data centers use
diesel engine-generator based UPS
systems with flywheel energy stor-
age. The best case efficiency rating:
flywheel technology and right-sizing
UPS so they run at higher loads.
Transformers
Another opportunity to reduce power
loss is within the transformers that
convert the power into a form con-sumable by the IT equipment. Yahoo!
Space Park, Yahoo! Wenatchee, and
USPS Before provided baseline values
of PDU loss. USPS After shows the
impact of upgrading to high-efficien-
cy PDUs. Yahoo! Qunicy shows the
savings from eliminating the 480-208
medium voltage transformation.
Even the baseline cases show good
performance with almost all data
centers exceeding the EPA estimates
for state-of-the-art.
3.3.3 Data centers canmake great strides incooling deliveryThe case studies cover a wide range
of cooling improvements. Some, like
optimized air flow management,
are applicable for all data centers;
others, like variable frequency drives
or water-side economizers, may be
appropriate for many existing data
centers; and the rest, like air-side
free-cooling or high-efficiency chilled
water plants, may be suitable for
installation at select or new data
centers.
Cooling Delivery via Fans and
Modular Cooling Units
Fans or modular cooling units deliver
cooling to IT equipment. Oracle,
LBNL, and NetApp implement
optimized air flow management that
maintains a greater temperature
differential and reduces the power
required by the fans to circulate air.NetApp Building 11 implements physi-
cal barriers between hot and cold
aisles whenever possible; Oracle uses
hot aisle containments, and LBNL
uses cold aisle containments. Sun
Santa Clara uses a modular cooling
unit and also hosts a comparison
of units from multiple vendors. In
all cases, the results fall within the
best-case scenarios from the EPA,
and the best implementations of
each solution achieve state-of-the-artefficiency levels.
14
Historical TrendsImproved Operations
Best PracticeState of the Art
0.00
0.01
0.02
0.03
0.04
0.05
0.06
0.00
0.01
0.02
0.03
0.04
0.05
0.06
Yahoo!
Space Park
Yahoo!
Wenatchee
Yahoo! Quincy USPS Before USPS After
EPA ScenarioPUE
Effect on Total PUE—Transformers

7/27/2019 SVLG Report
http://slidepdf.com/reader/full/svlg-report 15/27
Chilled Water System
For data centers that use water as
part of their cooling solution, several
studies may apply. After optimizing
air flow, LBNL raised the temperature
of the chilled water supply (CHWS)
and then implemented a water-side
economizer. Sun Santa Clara data
center installed a high efficiencychilled water plant. And NetApp
Building 11 implements air-side free
cooling. The air-side economizer
achieved the greatest efficiency. Its
effectiveness is due to data centers
being located in cool, dry climates.
Other solutions are more widely
applicable to data centers regardless
of location. Note that LBNL’s combi-
nation of raising supply temperature
and water-side economization is as
efficient as Sun’s implementation of a
high-efficiency chilled water plant in
its new data center.
For data centers that can take
advantage of cool, dry climates, free
cooling offers great savings. Yahoo
Wenatchee used both air-side and
water-side free-cooling. Digital
Realty Trust is 65% economized for
outside air, and NetApp Building 11
uses air-side economization. Note
that NetApp’s Building 11 achieves an
annual PUE of 1.10, the best in this
study.
15
Historical Trends
ImprovedOperations
Best PracticeState of the Art
0.00
0.02
0.04
0.06
0.08
0.10
0.12
0.14
0.16
0.18
0.20
0.00
0.02
0.04
0.06
0.08
0.10
0.12
0.14
0.16
0.18
0.20
NetApp
Building 11
Oracle LBNL Sun Santa
Clara CHW
Sun In Row Sun Liquid
Cooled Rack
Sun
Passive
Sun
Overhead
Cooling
EPA ScenarioPUE
Before After Low High
Effect on Total PUE—Cooling Delivery (Fans and Modular Units)
Effect on Total PUE—Chilled Water System

7/27/2019 SVLG Report
http://slidepdf.com/reader/full/svlg-report 16/27
3.3.4 Finding: SiteInitiatives offer HighEfciency Today
Measured results show that site
initiatives achieve state-of-the-art
efficiency levels across all equip-
ment types. There is opportunity to
achieve high efficiency in all catego-
ries. Even for categories, like lighting
and transformers, which contribute
the least to the overall PUE, a few
points add up. As a result, the poten-
tial kWh electricity savings for a large
scale production data center are on
the order of 25,000,000 kWh or
greater over a typical 10-year life of
the facility.
The case studies demonstrate the
effectiveness of technology avail-
able today. Technology maturity is
on track to meeting the efficiency
predictions of the EPA report. What
remains is for companies and govern-
ment to encourage adoption of these
initiatives so that data centers can
meet or exceed EPA assumptions.
This report aims to encourage adop-
tion of the initiatives by identifying
and educating the public of their
benefits.
16
Historical TrendsCurrent TrendsImproved Operation
Best Practice
State of the Art
0.00
0.25
0.50
0.75
1.00
1.25
1.50
1.75
2.00
0.00
0.25
0.50
0.75
1.00
1.25
1.50
1.75
2.00
Yahoo!
Space Park
Yahoo
Wenatchee
Yahoo!
Quincy
NetApp
Building 11
Digital Realty
Trusty 1500
Sun Santa
Clara
EPA ScenarioPUE
Total PUE Annual Free-cooling
Total PUE

7/27/2019 SVLG Report
http://slidepdf.com/reader/full/svlg-report 17/27
Like the EPA Report, this report
presents consolidated analysis of the
impact of IT and site improvements
on energy use. For the analysis first
the energy used by IT infrastructure
was computed. Added to that was
the amount energy needed by site
infrastructure to support the IT load
(by multiplying the IT energy use by
the PUE).
To compare results, we classified case
studies into four scenarios based
on the differences in data center
types that affect the applicability
and effectiveness of the initiatives.
Applicability of site initiatives varies
across legacy data centers and new
commissions, and effectiveness of
IT initiatives across production and
research and development (R&D)
data centers. Production data
centers require high performance and
availability guarantees met via highly
tuned, dedicated resources. As such,
dynamic resource optimization is less
applicable until technology matures
enough for operators to become
comfortable with a highly variable
environment. Workload, however,
is typically well characterized, which
may make it easier to provide andconsolidate IT resources for jobs.
In an R&D setting the compute
resources serve the test and devel-
opment functions, which must be
flexible. These systems handle a
wide variety of compute demands
and typically require more capacity
than production environments. The
tradeoff is less stringent guarantees
on performance and availability.
The R&D environment is a good
candidate for starting virtualization
and resource optimization to improve
energy utilization.
Applying site infrastructure solutions
depends on whether installation
occurs as part of a new facility com-
mission or as part of a retrofit of anexisting legacy data center. In new
data centers energy cost savings
create the incentive to buy more
expensive solutions that are highly
energy efficient. While technically
feasible in all data centers, retrofits
of legacy centers may not always
make sense. The typical lifespan for
site infrastructure is at least 10 years.
For some items, the cost savings from
energy consumption may not justify
purchasing upgraded, more efficient
equipment. For other items, installa-
tion requires down time that cannot
be accommodated. For the purpose
of analysis, this report assumes that
power delivery units, modular cool-
ing, air side economizers, and chilled
water plant are not candidates for
retrofit situations.
This report depicts four scenarios:
Legacy Production, Legacy R&D,
New Production, and New R&D. The
Legacy scenarios replace estimates
of measured site and IT inputs within
the EPA’s Best Practice scenario. The
New scenarios measured results are
in the State-of-the-Art scenario.
Each input for these scenarios is
measured data from a case study.
There are other solutions that
promise energy savings, but they
are not included in this year’s report
since they cannot be represented
by measured results. Each scenario
includes the technology that dem-
onstrates the best achievable results
that can be applied to a large set of
data centers. For instance, the newly
commissioned scenario includes the
high efficiency chilled water plant in
combination with modular cooling
in lieu of the free cooling air side
economizer where results may vary
by climate.
Thus some data centers will do bet-
ter if they are located in a cool-dry
climate and use free-cooling. Others
may not be able to implement the
cooling systems upgrades sug-
gested (e.g., data centers that use
refrigerant-based cooling instead of
water-based, or data centers that can-
not raise data center temperatures
due to operating agreements). While
these scenarios do not apply to all
data centers, they do apply to many.
On the basis of these scenarios, our
findings are set out below.
17
4 DemonstrationResults Verify EPA’s
Best-Case Scenarios

7/27/2019 SVLG Report
http://slidepdf.com/reader/full/svlg-report 18/27
4.1 Finding: FurtherEfciency Canbe Achieved withMore Aggressive ITInitiatives
Production data center scenario
applied Symantec’s consolidation
results of 3:1 PSRR. R&D data center
scenario applied Sun’s consolidation
and Cassatt’s resource optimization
results and achieved a combined
PSRR of 2.1:1. These values are mod-
est and match the EPA’s best practice
efficiency levels 2:1 PSRR. These
assumptions define the IT growth in
the combined analysis. Next year’s
report will take into account more
aggressive virtualization as well asstorage and networking solutions.
4.2 Finding: LegacyUpgrades Can BeNearly as Efcient asNew Commissions
While legacy retrofits may not
optimize power delivery for cost
reasons, they can optimize cooling
via a unique set of technologies.Legacy data centers can implement a
combination of air management, vari-
able frequency drives, and water-side
economizers as appropriate.
All data centers should optimize air
flow, but this step is especially effec-
tive in legacy data centers where air
flow management was not consid-
ered at build-out or where current
implementation is conventional
hot-aisle cold-aisle set-up. In thesearrangements there is poor separa-
tion between the cold supply and hot
return airstreams. The optimized air
management case studies involve
creating a physical barrier separating
hot and cold airstreams to provide
the highest degree of separation.
Any of three approaches—cold aisle
containment, hot aisle containment,
and rack containment could provide
the physical separation with each
one offering its own advantages and
limitations. NetApp added blank-
ing panels where appropriate and
hot aisle containment, LBNL tested
cold aisle containment, and Oracle
implemented hot-aisle rack level
enclosures.
Once air management is in place, it
prevents the mixing of hot and cold
air, making it possible to raise the
supply air temperature and reduce
the volume of air provided to the
data center. Variable frequency
drives on fans and pumps scales the
amount of cooling delivered to match
the amount of heat required to be
removed from the IT equipment.
Raising the supply temperature
enables the central cooling system to
operate at higher efficiency and use
less power. For many data centers
that use chilled water in their cooling
systems either direct or indirectly,
water-side economizers are a form of
free-cooling that can be implemented
in retrofit situations to deliver sav-
ings in a wide range of climates.
Combined with raising supply chilled
water temperature, water-side
economization is even more efficient
as it widens the number of operating
hours that outside air can be used for
free-cooling.
The equipment efficiency assump-
tions and the case studies from which
they are based are as set out below.
First describe the composition of
measurements used to generate the
PUE for the Legacy scenario. The
Legacy scenario uses measurements
for baseline power delivery units and
18
Demonstration Scenarios Cover Combinations of IT and Site Data Center Types
Demonstration Scenarios Combine IT and Site InitiativesApplied IT
Initiatives for:
Production Consolidation
Legacy Production New Production
R&D ResourceOptimization
Legacy R&D New R&D
Applied Site Initiatives for:
Legacy Retrot Variable Fan DrivesAir ManagementWater-side economizer Right-sizing power, cooling
Newly Commissioned Air side economizer High efciency chilled waterplant + Modular coolingHigh efciency standby power High efciency PDU

7/27/2019 SVLG Report
http://slidepdf.com/reader/full/svlg-report 19/27
Equipment PUE Data Center Initiative
IT Equipment 1.00
Transformer 0.04 Yahoo! Space Park
UPS 0.09 Yahoo! Space Park
Lighting 0.01 NetApp Building 11
Chilled Water System 0.16 LBNL’s Air Flow Management and Water-
side Economizer
Fans 0.07 Oracle’s Air Flow Management and VFDs
Total 1.36
only considers cooling upgrades. The
LBNL study notes the general rule
of thumb is 1% energy reduction for
every degree F supply water tem-
perature raised; this rule was verified
with measurements. This analysis
assumes that chilled water system
starts with a PUE contribution of 0.2
(note that all measured data centers
reported PUE contributions of less
than 0.18) and that data centers have
already raised water supply tempera-
ture. Then applying water-side econ-
omization results in further savings.
Using the water-side economizer
savings for 50o F chilled water supply
in Oakland, CA, the PUE contribution
is reduced by an additional 20%. The
resulting PUE contribution by the
chilled water system is 0.16.
Next is the composition of measure-
ments used to generate the PUE for
the New scenario. The New scenario
consists of high efficiency equipment
across the data center. The USPS and
NetApp data provided the highest
efficiency levels for transformers
and UPS. This report identifies the
combination of high efficiency chilled
water plant and modular cooling as
an efficient cooling technology appli-
cable in new data centers regardless
of climate. We assumed a 0.05
contribution based on the efficiency
of the permanent installation at Sun
that is tuned to its high-efficiency
chiller plant (with 0.16 PUE contribu-
tion).
Combining measurements in a legacy
retrofit results in a 0.23 contribution
of cooling to PUE. The combination
for new data centers results in a 0.21
contribution to PUE. So, by combin-
ing the technologies studied both
legacy and new data centers can
achieve comparable cooling efficien-
cies.
The PUEs 1.36 and 1.27 for Legacy and
New data centers were used to esti-
mate site efficiency in the analyses
presented below.
19
Assumptions for the Legacy Data Centers
Assumptions for the New Data Centers
Equipment PUE Data Center Initiative
IT Equipment 1.00
Transformer 0.02 USPS High Efficiency Transformer
UPS 0.04 NetApp Flywheel UPS
Lighting 0.01 NetApp Building 11
Chilled Water System 0.16 Sun’s High Efficiency Chilled Water
Fans 0.05 Sun’s Modular Cooling Unit (Assume 0.05)
Total 1.27

7/27/2019 SVLG Report
http://slidepdf.com/reader/full/svlg-report 20/27
4.3 Finding: DataCenters are on Trackto Meet the Best-caseScenariosDemonstration Projects results show
that given the maturity of technol-
ogy, data centers can achieve EPAestimates. The demonstration sce-
narios perform at the EPA’s best case
scenarios, between the Best Practice
and State-of-the-Art projections.
Legacy retrofits improve upon exist-
ing data centers and are similar to the
EPA’s Improved Operations scenario.
Our measured results exceed the
efficiency projected by the EPA. New
data center scenarios take advantage
of the most efficient of all technolo-
gies studied; their projections trackthe EPA’s State-of-the-Art.
By 2011, trajectories using the mea-
sured results offer significant savings
over 2007 trends. With legacy retro-
fits data centers can:
• Save between 59.9 billion and 64.6billion kWh/year annually
• Save up to $4.5 billion annually
• Cut 40.9 MMTCO2 (more than 7
million cars) annually.With new commissions and legacy
retrofits they can:
• Save between 64.2 billion and 68.9billion kWh/year saved annually
• Save up to $4.8 billion annually
• Cut 43.6 MMTCO2 (almost 8million cars) annually.
But even with this reduction, data
centers will still be large consumers
of energy since they must keep up
with business demands. In 2011,
under the measurement based sce-
narios, data centers will:
• Consume between 38 billion to 47billion kWh annually
• Cost between $2.6 billion to $3.3billion annually (computed for the2007 average cost of electricity8 cents/kWh used in the EPA
Report—imagine if this doubles)• Produce between 24.3 to 30.1
MMTCO2 annually (between 4.3million to 5.3 million cars).
Using the EPA assumptions of
adoption, these projections show
the impact on data centers with
increased energy use. These figures
should motivate companies to adopt
available technology so that their
data centers can achieve or exceed
these results.
20
Energy use by scenario
0.0
20.0
40.0
60.0
80.0
100.0
120.0
1999 2001 2003 2005 2007 2009 2011 2013
k W h / y e a r
Year
Legacy R&D
Legacy Production
New R&D
New Production
EPA Historical Trends
EPA Current Trends
EPA ImprovedOperations
EPA Best Practice
EPA State of the Art

7/27/2019 SVLG Report
http://slidepdf.com/reader/full/svlg-report 21/27
4.4 Finding: IT initia-tives deliver greaterimpact than siteimprovementsThe case studies verify that holistic
IT transformation initiatives produce
larger impacts than site improve-ments. For studies that reported
energy savings, those savings are
summarized below (some studies
reported only efficiency metrics,
energy difference of specific equip-
ment, or total energy use when there
was no “before condition” to baseline
for comparison).
Although results are influenced by
the different data center types (e.g.,
sizes, locations, purpose), this find-ing holds true because site power
use depends on the amount of IT
load supported. Data center energy
consumption consists of IT power
and site overhead. To estimate site
overhead, site efficiency is multiplied
by the energy draw of the IT load.
So, reducing the energy of IT also
reduces the energy needed by the
site infrastructure to support the IT
load.
These findings confirm the EPA’s
observation that “data centers may
realize greater energy-efficiency
gains by optimizing their operation
and efficiency as a holistic system
(e.g., through real-time, facility-level
energy monitoring and management
systems) (EPA 113).”
21
Summary of Reported Energy Savings (kWh)
Data Center Initiative Annual
IT Initiatives
Sun Consolidation
Symantec Consolidation
8,844,734
3,607,980
Site Initiatives
LBNL Air Management + Water-side Economizer
NetApp Air-side economizer USPS High-efficiency PDU
Yahoo! Free-cooling
Yahoo! High-efficiency UPS Santa Clara
Yahoo! High-efficiency UPS Wenatchee
1,140,000
1,159,065787,400
2,250,000
1,253,124
829,196

7/27/2019 SVLG Report
http://slidepdf.com/reader/full/svlg-report 22/27

7/27/2019 SVLG Report
http://slidepdf.com/reader/full/svlg-report 23/27
Next year’s Demonstration Projects
will focus on green IT and cover more
IT projects and advanced cooling and
power distribution concepts. Future
studies by the EPA will baseline
229 data centers across Tier 1-4
and across the U.S. The baseline
study will help answer questions on
technology adoption. Together the
maturity and adoption data will allow
us to build an even fuller picture of
energy use in data centers.
23
Site Results Exceed Best Practice
IT Results Achieve Best Practice
EPA Scenario
PUE
Historical Trends 2.0
Current Trends 1.9
Improved Operations 1.7
Best Practice 1.3
Measured Legacy PUE 1.355 Measured New PUE 1.265State-of-the-Art 1.2
EPA Scenario
PSRR
Historical Trends N/A
Current Trends 1.08:1
Improved Operations 1.08:1
Best Practice 2:1
Measured R&D PSRR 2.1:1
Measured Production PSRR 3:1State-of-the-Art 5:1

7/27/2019 SVLG Report
http://slidepdf.com/reader/full/svlg-report 24/27
Individual case study summaries may
be accessed at http://microsite.
accenture.com/SVLGREPORT/
Pages/CaseStudies.aspx
A1 Classication of Data Center Size usedin EPA Report
For IT technologies, the EPA bases
trend assumptions on the data cen-
ters size classified into categories as
defined by IDC. The following defini-
tions are used in the EPA Report.
A Server Room (Entry Level Data•
Center) typically contains one to a
dozen servers, has no external stor-
age, and may use the same HVAC
system of building or be with a splitsystem for more cooling capacity.
A Small Data Center (Localized•
Data Center) houses dozens or
hundreds of servers and moderate
external storage, has a separate
centralized HVAC system, and
minimal operational staff.
A Medium Data Center•
(Departmental/Mid-tier) holds
hundreds of servers and extensiveexternal storage, uses a centralized
chilled water plants and central
air handling units, and maintains
a staff to manage airflow manage-
ment.
A Large Data Center (Enterprise•
Class Data Center) contains hun-
dreds to thousands of servers and
extensive external storage. These
data centers maintain maximum
redundancy and require expert
management staff.
The Table below shows the distribu-
tion and is derived from EPA Report.
Under this classification of data cen-
ters, the EPA Report makes analysis
and assumptions on the growth of IT
equipment.
A2 EPA UptakeAssumptions
A2.1 Servers Assumptions
EPA Historical Server Growth
Assumption: The table and Chart
below shows a brief overview of theelectricity growth from servers from
2000 to 2006.
The EPA Report assumes that servers
achieve 10% utilization pre-virtualiza-
tion. As their numbers are reduced
24
Estimated Distribution of Data centers by according to size, derived from the
EPA report
Year 2000 2001 2002 2003 2004 2005 2006
Server room 33% 34% 35% 35% 36% 36% 36%
Small 17% 17% 17% 17% 17% 17% 17%
Medium 15% 15% 15% 15% 15% 15% 15%
Large 34% 34% 33% 33% 32% 32% 32%
Appendix

7/27/2019 SVLG Report
http://slidepdf.com/reader/full/svlg-report 25/27
those servers replaced by virtual
machines increase the server utiliza-
tion on the remaining machines.
EPA Current Trends of Energy
Efficient Server Assumption: The
EPA uses an estimate of 25% energy
savings for energy efficient server
models to account for the current
trends in server technology (EPA 44).
EPA Current Trends of Energy
Efficient Server Penetration
Assumption: The EPA estimated
that “energy-efficient” volume serv-
ers, would represent approximately
five percent of all U.S. volume server
shipments in 2007 and that this
percentage would increase linearly to
15 percent of all U.S. volume server
shipments by 2011 (EPA 44-45).
At the time of the EPA Report, server
manufacturers were already moving
towards energy efficiency to reduce
the performance per watt ratio. The
definition of “energy efficient” design
includes multi-core and power usage.
Multiple-core microprocessors con-
tain two or more processing cores on
a single die, which run at slower clock
speeds and lower voltages than the
cores in single-core chips but handle
more work in parallel (with proper
software support) than a single-core
chip. Cores share architectural com-
ponents like memory elements and
management saves additional energy.
Improved power usage encompasses
the adoption of high efficiency power
supplies, internal variable speed fans,
and power management described
below.
EPA Current Trends of Power
Management Adoption
Assumption: The EPA assumes
that power management (dynamic
frequency and voltage scaling) isonly enabled on around 10 percent
of applicable volume and mid-range
servers. This assumption is based on
an industry expert’s recent estimate
of the current utilization rate of
microprocessor power-management
features (EPA 45).
Power management refers to dynam-
ic frequency and voltage scaling that
ramp up or down energy as needed
to deliver performance. Frequency
and voltage scaling constantly adjusts
to changes in computational demand,
continuously optimizing processorenergy consumption by reducing the
microprocessor’s clock speed when
the utilization is low.
EPA Current Trends of
Virtualization Impact Assumption:
Based on data from IDC, where
worldwide x86 volume server ship-
ments, which were once projected
to increase 61 percent by 2010, are
expected to grow just 39 percent
during that same period because of increasing server virtualization (EPA
45).
Virtualization enables more efficient
use of a single server. Virtualization
replaces several dedicated servers
that operate at low average processor
utilization with a single ‘host” server
that provides the same services
and operates at a higher average
utilization level. Virtualization may
offer significant energy savings forvolume servers because these serv-
ers typically operate at an average
processor utilization level of only five
to 15 percent (EPA 42). The typical
U.S. volume server will consume
anywhere from 60 to 90 percent of
its maximum system power even at
low utilization levels (EPA 43), thus it
is more eff icient overall to run fewer
servers at higher utilization than
more servers at low utilization.
25
Estimated Total Electricity Use of U.S. Servers (in billion kWh/year) by Space Type,
2000 to 2006, from EPA Report (EPA 36)
Space type 2000 2001 2002 2003 2004 2005 2006
Server room 3.1 3.8 4.6 5.3 6.1 7.2 7.8
Small 1.9 2.3 2.6 2.9 3.3 3.8 4.2
Medium 1.7 2.1 2.3 2.6 3.0 3.4 3.7
Large 4.8 5.6 6.1 6.6 7.3 8.2 8.8
Total 11.6 13.9 15.6 17.4 19.8 22.6 24.5

7/27/2019 SVLG Report
http://slidepdf.com/reader/full/svlg-report 26/27
A2.2 StorageAssumptions
The EPA Report also considers energy
consumed by storage within the data
center.
EPA Historical Storage Growth
Assumption: The EPA estimates of the energy use of enterprise storage
devices summarized in the Table
below.
EPA Current Trends Storage
Growth Assumption: As a result
of storage trends, the EPA estimates
that the average power use per drive
will decrease by approximately 7%
between 2007 and 2010 (EPA 45).
The EPA Report identifies storage
trends that have manufacturers mov-
ing towards energy efficient storage
devices. Enterprise hard disk drive
(HDD) storage devices is shifted to
smaller form factor disk drives and
increasing use of serial advanced
technology attachment (SATA) drives.
Additionally improved management
strategies focus on storage virtualiza-
tion, data de-duplication, storage
tiering, and movement of archival
data to storage devices that can be
powered down when not in use.
A3 AcknowledgementsTeresa Tung, Accenture Technology
Labs authored the majority and
oversaw the development of this
report. Other Accenture staff that
contributed includes Matthew Chow,
Brian Leong, Mohanan Nair, Sandra
Najem, and Karen Swanson withsponsorship by Rockwell Bonecutter,
Lyle Ginsberg, and Jorg Heinemann.
Ray Pfeifer, Silicon Valley Leadership
Group, founded and organized the
Data Center Demonstration Project.
In addition to Ray’s herculean efforts
with the project itself, Ray provided
invaluable support with authoring,
advising, and analyzing results con-
tained herein.
Essential support was provided
by Lawrence Berkeley National
Laboratory in sharing the model
used in the EPA Report, authoring
case studies, and providing feed-
back. Support was provided by Rich
Brown, Eric Masanet, Dale Sartor, Bill
Tschudi, and Tim Xu.
We thank Victoria Barbero and Renée
LaFlamme for their patience and effi-
ciency with editing and formatting
the report.
We would like to thank all par-
ticipants of the Data Center
Demonstration Project and especially
identify the following authors of the
individual case studies.
Pamela Courtot, Powersmiths
Donnie Foster, Power Assure
Mark Hydeman, Taylor Engineering
Mukesh Khattar, Oracle
KC Mares, Megawatt Consulting Dean Nelson, Sun Microsystems
Kenneth Oestreich, Cassatt
Clemens Pfeiffer, Power Assure
Mike Ryan, Sun Microsystems
Earl Sacerdoti, Modius
David Shroyer, NetApp
Sriram Sitarman, Synopsys
26
Space type 2000 2001 2002 2003 2004 2005 2006
Server closet 0 0 0 0 0 0 0
Server room 0 0 0 0 0 0 0
Localized
data center
0.28 0.37 0.46 0.56 0.66 0.73 0.86
Mid-tier data
center
0.25 0.33 0.42 0.50 0.59 0.66 0.78
Enterprise-
class data
center
0.57 0.74 0.90 1.07 1.23 1.35 1.58
Total 1.10 1.44 1.79 2.13 2.49 2.74 3.22
Estimated Energy Use (billion kWh/year) of Enterprise Storage Devices, by Space
Type, 2000 to 2006 from the EPA Report

7/27/2019 SVLG Report
http://slidepdf.com/reader/full/svlg-report 27/27
About the EnergyEfficient Data CenterDemonstration ProjectThe project’s goal is to identify key
technology, policy and implementation
experts and partners to engage in creating
a series of demonstration projects thatshow emerging technologies and best
available energy efciency technologies
and practices associated with operating,
equipping and constructing data
centers. The project aimed to identify
demonstrations for each of the three main
categories that impact data center energy
utilization:
• operation & capital efficiency
• equipment (server, storage & networking
equipment)
• data center design & construction
(power distribution & transformation,
cooling systems, configuration, and
energy sources, etc.).
The project also identied member
organizations that have retrotted existing
data centers and/or built new ones
where some or all of these practices and
technologies are being incorporated into
their designs, construction and operations.
About The Silicon ValleyLeadership Group (SVLG)
The SVLG comprises principal ofcers and
senior managers of member companies
who work with local, regional, state, and
federal government ofcials to address
major public policy issues affecting the
economic health and quality of life in
Silicon Valley. The Leadership Group’s
vision is to ensure the economic healthand a high quality of life in Silicon Valley
for its entire community by advocating
for adequate affordable housing,
comprehensive regional transportation,
reliable energy, a quality K-12 and higher
education system, a prepared workforce,
a sustainable environment, affordable and
available health care, and business and tax
policies that keep California and Silicon
About AccentureTechnology Labs
Accenture Technology Labs, the dedicated
technology research and development
(R&D) organization within Accenture,
has been turning technology innovation
into business results for 20 years. TheLabs create a vision of how technology
will shape the future and invent the next
wave of cutting-edge business solutions.
Working closely with Accenture’s global
network of specialists, Accenture
Technology Labs helps clients innovate to
achieve high business performance. The
Labs are located in San Jose, California;
Chicago, Illinois; Sophia Antipolis,
France; and Bangalore, India. For more
information, please visit our website at
www.accenture.com/accenturetechlabs.
Accenture Technology Labs compiled the
nal report supporting with analytics,
background research, and project
management.
About AccentureAccenture is a global management
consulting, technology services and
outsourcing company. Combining
unparalleled experience, comprehensive
capabilities across all industries and
business functions, and extensive research
on the world’s most successful companies,
Accenture collaborates with clients to
help them become high-performance
businesses and governments. With more
than 180,000 people in 49 countries,
the company generated net revenues of
US$19.70 billion for the scal year ended
Aug. 31, 2007. Its home page is
www.accenture.com
For permission to reproduce this contentcontact the Leadership Group athttp://svlg.net
© 2008 Silicon Valley Leadership Group
© 2008 Accenture
Accenture its logo and