sw-846 method 8085: compound-independent … - 1 revision 0 february 2007 method 8085...
TRANSCRIPT

8085 - 1 Revision 0February 2007
METHOD 8085
COMPOUND-INDEPENDENT ELEMENTAL QUANTITATION OF PESTICIDESBY GAS CHROMATOGRAPHY WITH ATOMIC EMISSION DETECTION (GC/AED)
SW-846 is not intended to be an analytical training manual. Therefore, methodprocedures are written based on the assumption that they will be performed by analysts who areformally trained in at least the basic principles of chemical analysis and in the use of the subjecttechnology.
In addition, SW-846 methods, with the exception of required method use for the analysisof method-defined parameters, are intended to be guidance methods which contain generalinformation on how to perform an analytical procedure or technique which a laboratory can useas a basic starting point for generating its own detailed Standard Operating Procedure (SOP),either for its own general use or for a specific project application. The performance dataincluded in this method are for guidance purposes only, and are not intended to be and mustnot be used as absolute QC acceptance criteria for purposes of laboratory accreditation.
1.0 SCOPE AND APPLICATION
1.1 This method is applicable to the quantitation of semivolatile organohalide,organophosphorus, organonitrogen, and organosulfur pesticides that are amenable to gaschromatography (see Refs. 1 and 2). The following RCRA compounds have been determinedby this method (this method may be useful for the analysis of other compounds):
Analyte CAS No.1
Abate (Temephos) 3383-96-13Acifluorfen 62476-59-9Alachlor 15972-60-8Aldrin 309-00-2Ametryn 834-12-8Atraton 1610-17-9Atrazine 1912-24-9Azinphos ethyl (Ethyl guthion) 642-71-9Azinphos methyl (Guthion) 86-50-0Benfluralin 1861-40-1α-BHC 319-84-6β-BHC 319-85-7δ-BHC 319-86-8γ-BHC (Lindane) 58-89-9Bromacil 314-40-9Bromoxynil (Brominal) 1689-84-5Butachlor 23184-66-9Butylate 2008-41-5Captafol 2425-06-1Captan 133-06-2Carbophenothion 786-19-6Carboxin 5234-68-5
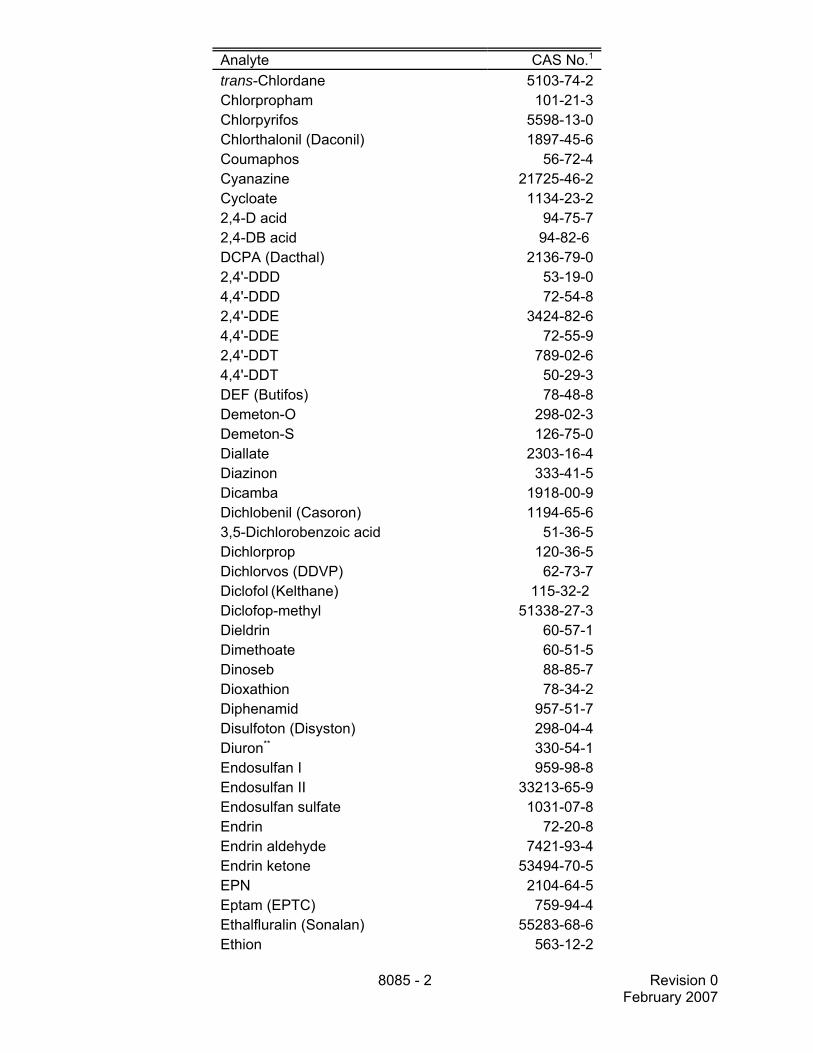
Analyte CAS No.1
8085 - 2 Revision 0February 2007
trans-Chlordane 5103-74-2Chlorpropham 101-21-3Chlorpyrifos 5598-13-0Chlorthalonil (Daconil) 1897-45-6Coumaphos 56-72-4Cyanazine 21725-46-2Cycloate 1134-23-22,4-D acid 94-75-72,4-DB acid 94-82-6 DCPA (Dacthal) 2136-79-02,4'-DDD 53-19-04,4'-DDD 72-54-82,4'-DDE 3424-82-64,4'-DDE 72-55-92,4'-DDT 789-02-64,4'-DDT 50-29-3DEF (Butifos) 78-48-8Demeton-O 298-02-3Demeton-S 126-75-0Diallate 2303-16-4Diazinon 333-41-5Dicamba 1918-00-9Dichlobenil (Casoron) 1194-65-63,5-Dichlorobenzoic acid 51-36-5Dichlorprop 120-36-5Dichlorvos (DDVP) 62-73-7Diclofol (Kelthane) 115-32-2 Diclofop-methyl 51338-27-3Dieldrin 60-57-1Dimethoate 60-51-5Dinoseb 88-85-7Dioxathion 78-34-2Diphenamid 957-51-7Disulfoton (Disyston) 298-04-4Diuron** 330-54-1Endosulfan I 959-98-8Endosulfan II 33213-65-9Endosulfan sulfate 1031-07-8Endrin 72-20-8Endrin aldehyde 7421-93-4Endrin ketone 53494-70-5EPN 2104-64-5Eptam (EPTC) 759-94-4Ethalfluralin (Sonalan) 55283-68-6Ethion 563-12-2
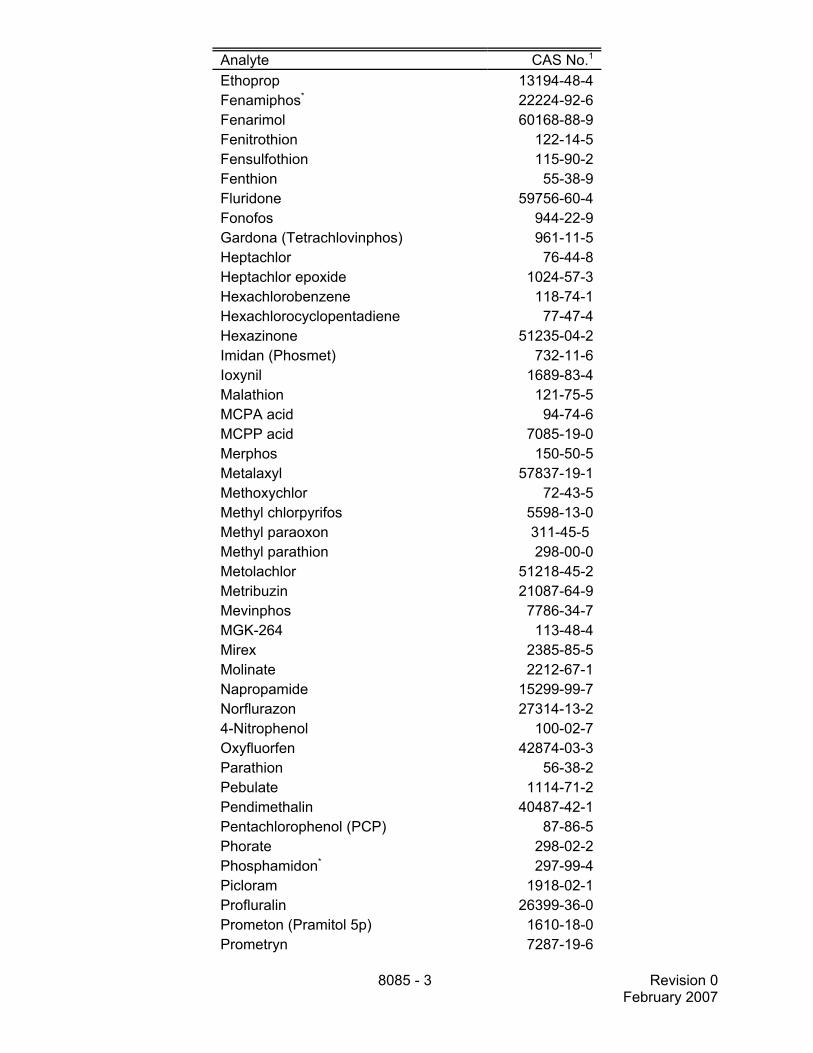
Analyte CAS No.1
8085 - 3 Revision 0February 2007
Ethoprop 13194-48-4Fenamiphos* 22224-92-6Fenarimol 60168-88-9Fenitrothion 122-14-5Fensulfothion 115-90-2Fenthion 55-38-9Fluridone 59756-60-4Fonofos 944-22-9Gardona (Tetrachlovinphos) 961-11-5Heptachlor 76-44-8Heptachlor epoxide 1024-57-3Hexachlorobenzene 118-74-1Hexachlorocyclopentadiene 77-47-4Hexazinone 51235-04-2Imidan (Phosmet) 732-11-6Ioxynil 1689-83-4Malathion 121-75-5MCPA acid 94-74-6MCPP acid 7085-19-0Merphos 150-50-5Metalaxyl 57837-19-1Methoxychlor 72-43-5Methyl chlorpyrifos 5598-13-0Methyl paraoxon 311-45-5 Methyl parathion 298-00-0Metolachlor 51218-45-2Metribuzin 21087-64-9Mevinphos 7786-34-7MGK-264 113-48-4Mirex 2385-85-5Molinate 2212-67-1Napropamide 15299-99-7Norflurazon 27314-13-24-Nitrophenol 100-02-7Oxyfluorfen 42874-03-3Parathion 56-38-2Pebulate 1114-71-2Pendimethalin 40487-42-1Pentachlorophenol (PCP) 87-86-5Phorate 298-02-2Phosphamidon* 297-99-4Picloram 1918-02-1Profluralin 26399-36-0Prometon (Pramitol 5p) 1610-18-0Prometryn 7287-19-6

Analyte CAS No.1
8085 - 4 Revision 0February 2007
Pronamide (Kerb) 23950-58-5Propachlor (Ramrod) 1918-16-7Propargite (S-181) 2312-35-8Propazine 139-40-2Propetamidophos 31218-83-4Ronnel 299-84-3Silvex (2,4,5-TP) 93-76-5Simazine 122-34-9Sulfotepp 3689-24-5Sulprofos (Bolstar) 35400-43-22,4,5-T acid 94-82-62,4,5-TB 93-80-1Tebuthiuron** 34014-18-1Terbacil 5902-51-2Terbutryn (Igran) 886-50-02,3,4,5-Tetrachlorophenol 4901-51-32,3,4,6-Tetrachlorophenol 58-90-2Triademefon 43121-43-3Triallate 2303-17-5Triclopyr (Garlon) 55335-06-32,4,5-Trichlorophenol 95-95-42,4,6-Trichlorophenol 88-06-2Trifluralin (Treflan) 1582-09-8Vernolate 1929-77-7
1 Chemical Abstract Service Registry Number* These analytes were not recovered from water during low-level detectionstudies.** These analytes were quantitated from their breakdown products.
1.2 This method employs an atomic emission detector (AED) which is used for thedetection of organic compounds containing heteroatoms. Heteroatoms, in this case, aredefined as those elements other than carbon, hydrogen, and oxygen.
1.3 Quantitations are made from a compound-independent calibration (CIC) utilizing anAED elemental response that is not compound specific. A calibration and response checkstandard is used to validate the quantitation of a target analyte by CIC and to generate itsquantitation limit.
1.4 Analytes that are detected in a sample must have their identifications confirmed byevidence that the ratios of their component elements agree with the empirical formulae of theanalytes, based on their retention times on a dissimilar column, or by gas chromatography/massspectrometry (GC/MS). The techniques of confirmation by element ratios are addressed in thisprocedure. Other confirmation techniques are described in Method 8000.
1.5 This method may be used for screening samples for the presence of organiccompounds containing heteroatoms. Unknown elemental responses should be investigatedfurther. Elemental ratios, relative retention time matching, and GC/MS spectral information

8085 - 5 Revision 0February 2007
provide tentative identification. Element responses and element fractions from tentativeidentifications are used to estimate the concentration of the analyte in the sample.
1.6 This method also may be used for screening samples to determine that targetanalytes are not present. When the response criteria have been met using the calibration andresponse check standards, then the target analytes can be reported as non-detects at thecalculated quantitation limits.
1.7 Prior to employing this method, analysts are advised to consult the base methodfor each type of procedure that may be employed in the overall analysis (e.g., Methods 3500,3600, 5000, and 8000) for additional information on quality control procedures, development ofQC acceptance criteria, calculations, and general guidance. Analysts also should consult thedisclaimer statement at the front of the manual and the information in Chapter Two for guidanceon the intended flexibility in the choice of methods, apparatus, materials, reagents, andsupplies, and on the responsibilities of the analyst for demonstrating that the techniquesemployed are appropriate for the analytes of interest, in the matrix of interest, and at the levelsof concern.
In addition, analysts and data users are advised that, except where explicitly specified in aregulation, the use of SW-846 methods is not mandatory in response to Federal testingrequirements. The information contained in this method is provided by EPA as guidance to beused by the analyst and the regulated community in making judgments necessary to generateresults that meet the data quality objectives for the intended application.
1.8 Use of this method is restricted to use by, or under the supervision of, personnelappropriately experienced and trained in the use of GC/AED and the interpretation of theresulting data. Each analyst must demonstrate the ability to generate acceptable results withthis method.
2.0 SUMMARY OF METHOD
2.1 A measured volume or weight of sample (liquid, solid, or other) is extracted usingthe appropriate matrix-specific sample extraction technique.
2.2 Liquid samples may be extracted at neutral pH with methylene chloride using eitherMethod 3510 (separatory funnel), Method 3520 (continuous liquid-liquid extractor), or otherappropriate technique. Acid herbicides should be extracted and processed by Method 8151 orother appropriate technique.
2.3 Solid samples to be analyzed for neutral compounds may be extracted withhexane-acetone (1:1) or methylene chloride-acetone (1:1) using Method 3540 (Soxhlet), Method3541 (automated Soxhlet), Method 3545 (pressurized fluid extraction), Method 3546 (microwaveextraction), Method 3550 (ultrasonic extraction), or other appropriate technique. Acid herbicidesshould be extracted and processed by Method 8151 or other appropriate technique.
2.4 If the sample is to be screened for both neutral pesticides and herbicide acids, theextracts may be combined following methyl ester/ether derivatization and solvent exchange ofthe herbicide fraction.
NOTE: Combining the acid herbicide and neutral pesticide fractions is not generallyrecommended.
8085 - 6 Revision 0February 2007
2.5 The extract is analyzed by injecting a measured aliquot into a gas chromatographequipped with a fused-silica capillary column and an atomic emission detector (GC/AED). TheAED uses a microwave-induced helium plasma to generate temperatures in the detector thatare high enough to break the molecular bonds of the compounds that elute from the GC. Theresulting free atoms undergo electron excitation, followed by relaxation and photo emission. These atomic emissions occur at frequencies that are characteristic of the element. Theintensity of the atomic emission is proportional to the concentration of the element in thedetector. In this method, the emission frequencies and intensities are monitored for sevenelements. The results are used for detecting and quantitating the eluting pesticides. If multipleheteroatoms are present, the ratio of the heteroatoms of the eluting pesticides can bedetermined as an aid to identification.
2.6 Two types of instrumental calibration are available with this method.
2.6.1 Compound-independent calibration (CIC) -- The AED response to eachelement is independent of compound structure, thus compound-independent calibration,or elemental calibration, is possible. The heteroatoms sulfur, nitrogen, chlorine, bromine,iodine, phosphorous, and fluorine (if needed) are calibrated using a compound-independent calibration mixture (CIC mix). The elemental response factors obtained fromthe CIC are used to quantitate individual heteroatoms contained in any or all compoundseluting from the column. The results of the heteroatom quantitation are then translatedinto the concentrations of the target compounds and/or to tentatively identified unknowncompounds (TICs).
2.6.2 Compound-dependent calibration -- If the presence of a target analyte isconfirmed in the sample, but the calibration and response check criteria fail for thatanalyte, then a compound-dependent multi-level calibration for that analyte must beperformed. See Method 8000 or other appropriate 8000 series methods for details oncompound-dependent multi-level calibration and the associated quality assurance andcontrol.
3.0 DEFINITIONS
3.1 Refer to Chapter One and the manufacturer's instructions for definitions that maybe relevant to this procedure. Method 8000 also contains detailed descriptions for some termsused in this method.
3.2 Heteroatoms -- This method considers all elements other than carbon, hydrogenand oxygen to be heteroatoms. In this method, bromine, chlorine, fluorine, iodine, nitrogen,phosphorous, and sulfur are heteroatoms of interest.
3.3 Compound-dependent calibration -- An instrument calibration model that relatesthe response of the detector to a standard of the actual target compound, such that standardsfor each analyte of interest are necessary. This approach historically has been used in methodsfor organic compounds.
3.4 Compound-independent calibration (CIC) -- An instrument calibration model wherethe compound used to calibrate the instrument is not necessarily the analyte of interest. For the atomic emission detector described in this method, the intensity of the spectral emission line ofan element is calibrated to the concentration of that element. The analyte of interest mustcontain the element for which the instrument is to be calibrated, but it need not be thecompound with which the instrument is calibrated. The source of the element for calibration isthus independent of the analyte of interest.
8085 - 7 Revision 0February 2007
4.0 INTERFERENCES
4.1 Method interferences may be caused by contaminants in solvents, reagents,glassware, and other sample processing apparatus that lead to discrete artifacts or elevatedbaselines in gas chromatograms. Due to the unique selectivity of AED, if these interferences donot contain the heteroatom(s) of interest, they will not likely pose a problem for the analysis. Allreagents and equipment routinely must be demonstrated to be free from problem interferencesunder the conditions of the analysis by running laboratory reagent blanks as described. Referto Method 8000 and each method to be used for specific guidance on quality control proceduresand to Chapter Four for general guidance on the cleaning of glassware.
4.1.1 Glassware must be scrupulously cleaned. Clean all glassware as soonas possible after use by thoroughly rinsing with the last solvent used. Follow by washingwith hot water and detergent and thorough rinsing with tap and reagent water. Drain dry,and heat in a muffle furnace at from 420 EC to 430 EC for a minimum of one-half hour. Thorough rinsing with acetone may be substituted for the heating process. After dryingand cooling, seal and store glassware in a clean environment to prevent accumulation ofdust or other contaminants.
CAUTION: Thermally stable compounds such as PCBs may need longer heating times.However, oven-drying of glassware used for PCB analysis can increasecontamination because PCBs are readily volatilized in the oven and spread toother glassware. Therefore, exercise caution, and do not dry glassware fromsamples containing high concentrations of PCBs with glassware that may beused for trace analyses of other compounds.
4.1.2 The use of high purity reagents and solvents helps to minimizeinterferences. Purification of solvents by distillation in all-glass systems may benecessary.
CAUTION: Solvents may contain stabilizers that have been added by the manufacturerbut that may be removed by redistillation, thus potentially reducing the shelf-life and safety of the solvents.
4.2 Although phthalate esters do not contain heteroatoms within their molecularstructure and thus will not be seen on the heteroatom channels, these compounds can still posea problem in the analysis. These compounds generally appear as large peaks on the carbonchannel chromatogram. Common flexible plastics contain varying amounts of phthalates thatare easily extracted or leached during laboratory operations. Cross-contamination of glasswareroutinely occurs when plastics are handled during extraction steps, especially when solvent-wetted surfaces are handled. Interferences from phthalates can best be minimized by avoidingthe use of plastics in the laboratory. Exhaustive cleanup of the reagents (especially sodiumsulfate, sodium chloride, cellulose thimbles and glass wool, which usually come packed inplastic) and glassware may be necessary to eliminate background phthalate contamination.
4.3 Cross-contamination may occur when a sample containing low concentrations ofanalytes is analyzed immediately following a sample containing relatively high concentrations ofanalytes. Between-sample rinsing of the syringe and associated equipment with an appropriatesolvent(s) can minimize sample cross-contamination. After analysis of a sample containing highconcentrations of analytes, one or more injections of solvent should be made to ensure thataccurate values are obtained for the next sample.
8085 - 8 Revision 0February 2007
4.4 Matrix interferences may be caused by contaminants that are co-extracted from thesample. Also, note that all the analytes listed may not be totally resolved from each other onany column, i.e., one analyte of interest may interfere with another. The extent of matrixinterferences will vary considerably from source to source, and is dependent on the matrix type(i.e., soil/sediment and water matrices with high percent solids are more likely to have higherinterferences than a well water matrix, etc.). Sulfur is a common matrix contaminant, especiallyin marine sediments, and may render the sulfur channel partially, or totally, useless. Cleanupof sample extracts may be necessary for some target compounds. See the 3600 series ofmethods for different cleanups.
CAUTION: This method may be used for screening samples for any compound containingnitrogen, sulfur, iodine, bromine, chlorine, or phosphorus that can bechromatographed by GC. However, it has been observed that cleanup of any sortmay remove certain compounds, thereby preventing them from being detected bythis method. Therefore, when this method is used in a screening mode, extractcleanup should be avoided until all samples have been screened. Alternatively,standards containing the analytes of interest should be processed through allcleanup steps to determine the losses during cleanup.
4.5 A dirty septum or the GC inlet can be a potential source of contamination,especially if high analyte concentrations were present in a previous sample. If several blank orsolvent injections display a contaminant present at about the same concentration, then theseptum should be changed. In addition, dirty injector liners may cause degradation of someanalytes or a loss of late-eluting compounds.
4.6 Iodine will respond on the sulfur 181 nm channel as a negative deflection. Inaddition, iodine and very large amounts of sulfur will respond as a positive deflection on thephosphorous 178 nm channel. It is recommended that the phosphorous 186 nm channel, whichdoes not respond to these elements, be simultaneously monitored with the phosphorous 178nm channel.
4.7 Analytical difficulties encountered for target analytes include, but are not limited to:
4.7.1 Demeton (Systox) is a mixture of two compounds; O,O-diethyl-O-[2-(ethylthio)ethyl]phosphorothioate (demeton-O) and O,O-diethyl-S-[2-(ethylthio)ethyl]phosphorothioate (demeton-S). Two peaks are observed in thechromatograms corresponding to these isomers. Thus, any new standard of demetonmay need to have an elemental calibration performed to assess the concentrations of theindividual isomers. These compounds have also exhibited poor method performance.
4.7.2 Merphos (tributyl phosphorotrithioite) is a single-component pesticide thatis readily oxidized to phosphorotrithioate (merphos oxone) under aqueous conditions. This oxidation product happens to be the organophosphorous pesticide tribufos (DEF). Iftribufos is detected in a sample, further investigation would be needed to determine whichof the two pesticides was initially present.
4.7.3 Chlorpyrifos and parathion co-elute on the DB-5 column and both containthe elements sulfur, nitrogen and phosphorous. Furthermore, the elemental ratios ofthese heteroatoms for both pesticides are very similar. However, chlorpyrifos containschlorine, whereas parathion does not. Especially in this situation, it is recommended thata sample be analyzed for all of the heteroatoms in the target compound (in this case,sulfur, phosphorus, nitrogen and chlorine). This is also the case when dealing with themethyl analogues of these compounds, i.e., methyl chlorpyrifos and methyl parathion.
8085 - 9 Revision 0February 2007
4.7.4 The retention times of some analytes, particularly terbacil and bromacil,may increase with increasing concentrations injected. Analysts should check for retentiontime shifts in highly contaminated samples.
4.7.5 Tebuthiuron shown in the tables and figures is actually a breakdownproduct of this pesticide. Tebuthiuron quantitatively degrades in the hot split/splitlessinjector liberating methyl-isocyanate which elutes with the solvent.
4.7.6 MGK-264 and diallate each produce two peaks.
4.7.7 The benzonitrile compounds such as dichlobenil have a tendency tohydrolyze under alkaline conditions. Therefore it may be desirable to monitor for thebenzamide and benzoic acid derivatives as well as the benzonitrile. Under certainconditions, the compound chlorthalonil may be hydrolyzed to its di-acid derivative, thusbeing detected as dacthal. Bromoxynil and ioxynil are easily hydrolyzed, therefore,because the herbicide extraction procedure entails a hydrolysis step, the derivativesshould be the target analytes.
4.7.8 Some compounds, such as 4,4'-DDE and dieldrin, may co-elute on bothof the suggested columns using the gas chromatographic programs described. Toachieve compound confirmation, an altered gas chromatographic program may benecessary. Alternatively, GC/MS may be used for compound identification/ confirmation.
4.7.9 Cleanliness of the inlet liner and column have various affects on theanalytes. Some analytes are affected by active sites found in clean systems and someare affected by actives site created by injecting dirty samples. Often the matrix of thesample may influence the activity of the GC system, causing enhancement of someanalytes and degradation of others. Experience of the analyst with the various conditionsof a GC system is invaluable.
5.0 SAFETY
This method does not address all safety issues associated with its use. The laboratory isresponsible for maintaining a safe work environment and a current awareness file of OSHAregulations regarding the safe handling of the chemicals listed in this method. A reference fileof material safety data sheets (MSDSs) should be available to all personnel involved in theseanalyses.
6.0 EQUIPMENT AND SUPPLIES
The mention of trade names or commercial products in this manual is for illustrativepurposes only, and does not constitute an EPA endorsement or exclusive recommendation foruse. The products and instrument settings cited in SW-846 methods represent those productsand settings used during method development or subsequently evaluated by the Agency. Glassware, reagents, supplies, equipment, and settings other than those listed in this manualmay be employed provided that method performance appropriate for the intended applicationhas been demonstrated and documented.
This section does not list common laboratory glassware (e.g., beakers and flasks).
8085 - 10 Revision 0February 2007
6.1 Gas chromatograph -- An analytical system complete with gas chromatographsuitable for on-column and/or split-splitless injection and all necessary accessories includingsyringes, analytical columns, gases, and recorder/integrator or data system.
6.2 GC columns -- The columns listed in this section were the columns used todevelop the method. The listing of these columns in this method is not intended to exclude theuse of other columns that are available or that may be developed. Laboratories may use thesecolumns or other capillary columns provided that the laboratories document methodperformance data (e.g., chromatographic resolution, analyte breakdown, and sensitivity) that areappropriate for the intended application.
6.2.1 Column 1 -- 30 m x 0.32-mm ID, DB-5 bonded fused-silica column, 0.25-mm film thickness (J&W Scientific) or equivalent.
6.2.2 Column 2 -- 30 m x 0.32-mm ID, DB-17 bonded fused-silica column, 0.25-mm film thickness (J&W Scientific) or equivalent.
6.3 Detector -- Atomic emission detector (AED) capable of monitoring the followingelements:
1st injection 2nd injection 3rd injection
193 - Carbon 478 - Bromine 186 - Phosphorous
181 - Sulfur 479 - Chlorine 178 - Phosphorous
174 - Nitrogen
206 - Iodine
The elemental emission wavelengths (in nm) and injection groups shown above are onlyrecommendations. Other wavelengths for these elements and other injection groups may beutilized, provided that the analyst can document acceptable performance for the intendedapplication. It may also be useful to be able to monitor the emission wavelength for fluorine.
6.4 Autosampler vials -- 2-mL, crimp-top type (micro-volume inserts recommended).
6.5 Volumetric syringes -- 10.0-µL to 2.5-mL.
6.6 Borosilicate or Pyrex® vials -- 10-mL to 100-mL.
6.7 Graduated concentrator tubes -- various sizes.
6.8 Graduated centrifuge tubes.
7.0 REAGENTS AND STANDARDS
7.1 Reagent-grade or pesticide-grade chemicals must be used in all tests. Unlessotherwise indicated, it is intended that all reagents conform to specifications of the Committeeon Analytical Reagents of the American Chemical Society, where such specifications areavailable. Other grades may be used, provided it is first ascertained that the reagent is ofsufficiently high purity to permit its use without lessening the accuracy of the determination. Reagents should be stored in glass to prevent the leaching of contaminants from plasticcontainers.
8085 - 11 Revision 0February 2007
NOTE: Store the standard solutions (stock, composite, calibration, internal, and surrogate) at #6 EC in polytetrafluoroethylene (PTFE)-sealed containers in the dark. When
standards are prepared, it is recommended that aliquots of each lot be stored inindividual small vials. All stock standard solutions must be replaced if routine QC testsindicate a problem (see Sec. 11.5.12).
7.2 Solvents used in the extraction and cleanup procedures (appropriate 3500 and3600 series methods) include n-hexane, diethyl ether, methylene chloride, acetone, ethylacetate, and isooctane (2,2,4-trimethylpentane) and should be exchanged to isooctane prior toanalysis.
Isooctane is suggested for standards and samples in this procedure. Acetone, methylenechloride, methanol and/or MTBE may be necessary for the preparation of some stock standardsolutions due to better analyte solubility (see Sec. 7.4).
Samples should be extracted using a solvent system that gives optimum, reproduciblerecovery of the analytes of interest from the sample matrix, at the concentrations of interest. The choice of extraction solvent will depend on the analytes of interest and no single solvent isuniversally applicable to all analyte groups. Whatever solvent system is employed, includingthose specifically listed in this method, the analyst must demonstrate adequate performance forthe analytes of interest, at the levels of interest. At a minimum, such a demonstration willencompass the initial demonstration of proficiency described in Method 3500, using a cleanreference matrix. Method 8000 describes procedures that may be used to develop performancecriteria for such demonstrations as well as for matrix spike and laboratory control sampleresults.
All solvents should be pesticide quality or equivalent, and each lot of solvent should bedetermined to be interference free. Solvents may be degassed prior to use.
7.3 Organic-free reagent water -- All references to water in this method refer toorganic-free reagent water as defined in Chapter One.
7.4 Compound-independent calibration (CIC) standard solution
Tables 17 and 18 describe a suggested CIC mixture, but alternative CIC mixtures may beused. Isooctane is commonly used as the solvent system, but solvent choice is dependent onthe final solvent system used by the extraction and cleanup methods employed, as well as thesolubility of the analytes. When producing a CIC mixture, consideration should be given to thestability of the compounds used, their retention times, the number of elements calibrated, andthe range of elemental response. The CIC mixture described in this method containscompounds that are relatively stable in solution and less sensitive to chromatographicconditions. Furthermore, consideration is given to retention times, ensuring that compoundswith the same elements do not co-elute, all the major elements of concern are included, andmuch of the linear range of each element is applied.
7.5 Calibration and response check standard solutions
Since the number of analytes calibrated in this method exceeds that which can bepractically diluted into a single working standard, multiple working standard mixtures should beprepared. Tables 6 through 9 present a list of suggested mixtures of standards showing theanalytes contained and their appropriate concentrations. Each mixture is designed to yield thequantitation limits of the compounds contained when diluted by a factor of 10.
8085 - 12 Revision 0February 2007
7.6 Surrogate standards
The following are suggested surrogate compounds for use in this method: 1,3-dimethyl-2-nitrobenzene, dibromo-octafluorobiphenyl (DBOB), tetrachloro-m-xylene, decachlorobiphenyl,and triphenylphosphate. The surrogate compounds are prepared in acetone and theappropriate relative final concentrations can be found in Tables 12 and 13. Surrogatecompounds used in other pesticide methods may also be employed in this method, providedthat they contain a heteroatom and the analyst can demonstrate appropriate performance.
7.7 Matrix spike and laboratory control sample (LCS) standard solutions
These standard solutions should be made up of those analytes that are of concern at thetime of analysis. They can be prepared in acetone and their final concentrations should be in arange between two and four times the quantitation limit as established by the calibration andresponse check analyses (see Sec. 11.6).
7.8 Gas-oil spiking mixture
For this method application, a gas-oil mixture is considered to be an oil formed throughdistillation of petroleum of intermediate boiling range and viscosity. More specifically it is a lightfuel oil consisting of a type 2 classification that is used mostly for the production of heat indomestic and small commercial liquid-fuel burning equipment. It is light in color and has onaverage a specific gravity in the range of 0.82 to 0.86 and should be available from most homeheating oil vendors. An appropriate portion of this material can be added to both the sampleextracts and calibration standards in order to enhance the linearity of the phosphorus response. See Sec. 11.5.8 for further details.
8.0 SAMPLE COLLECTION, PRESERVATION, AND STORAGE
8.1 See the introductory material to Chapter Four, "Organic Analytes."
8.2 Extracts should be stored under refrigeration in the dark and analyzed within 40days after they are extracted.
9.0 QUALITY CONTROL
9.1 Refer to Chapter One for guidance on quality assurance (QA) and quality control(QC) protocols. When inconsistencies exist between QC guidelines, method-specific QCcriteria take precedence over both technique-specific criteria and those criteria given in ChapterOne, and technique-specific QC criteria take precedence over the criteria in Chapter One. Anyeffort involving the collection of analytical data should include development of a structured andsystematic planning document, such as a Quality Assurance Project Plan (QAPP) or a Samplingand Analysis Plan (SAP), which translates project objectives and specifications into directionsfor those that will implement the project and assess the results. Each laboratory shouldmaintain a formal quality assurance program. The laboratory should also maintain records todocument the quality of the data generated. All data sheets and quality control data should bemaintained for reference or inspection.
9.2 Refer to Method 8000 for specific determinative method QC procedures. Refer toMethod 3500 for QC procedures to ensure the proper operation of the various samplepreparation techniques. If an extract cleanup procedure is performed, refer to Method 3600 for
8085 - 13 Revision 0February 2007
the appropriate QC procedures. Any more specific QC procedures provided in this method willsupersede those noted in Methods 8000, 3500, or 3600.
9.3 Quality control procedures necessary to evaluate the GC system operation arefound in Method 8000 and include evaluation of retention time windows, calibration verificationand chromatographic analysis of samples. In addition, information on retention time checks, GCsystem degradation monitoring, CIC calibration, and calibration and response checking can befound in Sec. 11.0 of this method.
9.4 Initial demonstration of proficiency
Each laboratory must demonstrate initial proficiency with each sample preparation anddeterminative method combination it utilizes by generating data of acceptable accuracy andprecision for target analytes in a clean matrix. If an autosampler is used to perform sampledilutions, before using the autosampler to dilute samples, the laboratory should satisfy itself thatthose dilutions are of equivalent or better accuracy than is achieved by an experienced analystperforming manual dilutions. The laboratory must also repeat the demonstration of proficiencywhenever new staff members are trained or significant changes in instrumentation are made. See Method 8000 for information on how to accomplish a demonstration of proficiency.
NOTE: Given the large number of compounds that may be analyzed using this procedure, it ishighly unlikely that all of the compounds could be included in a single spiking solution,or successfully spiked into a single set of four reagent water aliquots. As a result,successful completion of the initial demonstration of proficiency may need the analystto consider one of the following approaches: preparing mixtures of target compoundsand spiking the mixtures into different sets of reagent water aliquots, identifying theactual target compounds of interest for a given project and demonstrating theperformance for only those compounds, or demonstrating the performance for somesubset of all the analytes and only using the method as a screening tool for any otheranalytes. Other approaches may also be developed by the analyst.
9.5 Initially, before processing any samples, the analyst should demonstrate that allparts of the equipment in contact with the sample and reagents are interference-free. This isaccomplished through the analysis of a method blank. As a continuing check, each timesamples are extracted, cleaned up, and analyzed, and when there is a change in reagents, amethod blank should be prepared and analyzed for the compounds of interest as a safeguardagainst chronic laboratory contamination. If a peak is observed within the retention time windowof any analyte that would prevent the determination of that analyte, determine the source andeliminate it, if possible, before processing the samples. The blanks should be carried throughall stages of sample preparation and analysis. When new reagents or chemicals are received,the laboratory should monitor the preparation and/or analysis blanks associated with samplesfor any signs of contamination. It is not necessary to test every new batch of reagents orchemicals prior to sample preparation if the source shows no prior problems. However, ifreagents are changed during a preparation batch, separate blanks need to be prepared for eachset of reagents.
9.6 Sample quality control for preparation and analysis
The laboratory must also have procedures for documenting the effect of the matrix onmethod performance (precision, accuracy, method sensitivity). At a minimum, this shouldinclude the analysis of QC samples including a method blank, a matrix spike, a duplicate, and alaboratory control sample (LCS) in each analytical batch and the addition of surrogates to eachfield sample and QC sample when surrogates are used. Any method blanks, matrix spike

8085 - 14 Revision 0February 2007
samples, and replicate samples should be subjected to the same analytical procedures (Sec.11.0) as those used on actual samples.
9.6.1 Documenting the effect of the matrix should include the analysis of atleast one matrix spike and one duplicate unspiked sample or one matrix spike/matrix spikeduplicate pair. The decision on whether to prepare and analyze duplicate samples or amatrix spike/matrix spike duplicate must be based on a knowledge of the samples in thesample batch. If samples are expected to contain target analytes, laboratories may use amatrix spike and a duplicate analysis of an unspiked field sample. If samples are notexpected to contain target analytes, the laboratories should use a matrix spike and matrixspike duplicate pair. Consult Method 8000 for information on developing acceptancecriteria for the MS/MSD
9.6.2 A laboratory control sample (LCS) should be included with each analyticalbatch. The LCS consists of an aliquot of a clean (control) matrix similar to the samplematrix and of the same weight or volume. The LCS is spiked with the same analytes atthe same concentrations as the matrix spike, when appropriate. When the results of thematrix spike analysis indicate a potential problem due to the sample matrix itself, the LCSresults are used to verify that the laboratory can perform the analysis in a clean matrix. Consult Method 8000 for information on developing acceptance criteria for the LCS.
9.6.3 Also see Method 8000 for the details on carrying out sample qualitycontrol procedures for preparation and analysis. In-house method performance criteria forevaluating method performance should be developed using the guidance found in Method8000.
9.7 Surrogate recoveries
The laboratory should evaluate surrogate recovery data from individual samples versusthe surrogate control limits developed by the laboratory. See Method 8000 for information onevaluating surrogate data and developing and updating surrogate limits. Procedures forevaluating the recoveries of multiple surrogates and the associated corrective actions should bedefined in an approved project plan.
9.8 It is recommended that the laboratory adopt additional quality assurance practicesfor use with this method. The specific practices that are most productive depend upon theneeds of the laboratory and the nature of the samples. Whenever possible, the laboratoryshould analyze standard reference materials and participate in relevant performance evaluationstudies.
10.0 CALIBRATION AND STANDARDIZATION
See Secs. 11.5 through 11.8 for information on calibration and standardization.
11.0 PROCEDURE
11.1 Sample extraction
Refer to Chapter Two and Method 3500 for guidance in choosing the appropriateextraction procedure. In general, water samples for neutral compounds may be extracted at aneutral pH with methylene chloride using a separatory funnel (Method 3510) a continuous liquid-

8085 - 15 Revision 0February 2007
liquid extractor (Method 3520), solid-phase extraction (Method 3535), or other appropriatetechnique. Solid samples for neutral compounds may be extracted with hexane-acetone (1:1)or methylene chloride-acetone (1:1) using one of the Soxhlet extraction (Method 3540 or 3541),pressurized fluid extraction (Method 3545), microwave extraction (Method 3546), ultrasonicextraction (Method 3550) procedures, or other appropriate technique. Acid herbicides shouldbe extracted and processed according to Method 8151, or other appropriate technique.
Spiked samples are used to verify the applicability of the chosen extraction technique toeach new sample type. Each sample type should be spiked with the analytes of interest todetermine the percent recovery. See Method 8000 for guidance on demonstration of initialmethod proficiency as well as guidance on matrix spikes for routine sample analysis.
11.2 Extract cleanup
Cleanup procedures may not be necessary for a relatively clean sample matrix, but mostextracts from environmental and waste samples will require additional preparation beforeanalysis. A cleanup procedure that works for one pesticide may be removing another pesticideof concern. If extract cleanup is desired, then the specific cleanup procedure used will dependon the target compounds, the nature of the sample to be analyzed, and the data qualityobjectives for the measurements. General guidance for sample extract cleanup is provided inthis section, and in Methods 3600 and 8151.
CAUTION: Cleanup procedures should be avoided if this method is used for general screeningof samples.
11.2.1 If a sample is of biological origin, or contains high molecular weightmaterials, the use of Method 3640 (GPC cleanup -- pesticide option) is recommended. Frequently, one of the adsorption chromatographic cleanups (alumina, silica gel, orFlorisil®) may also be necessary following the GPC cleanup.
11.2.2 Method 3610 (alumina) may be used to remove phthalate esters.
11.2.3 Method 3620 (Florisil®) may be used to separate organochlorinepesticides from aliphatic compounds, aromatics, and nitrogen-containing compounds.
11.2.4 Method 3630 (silica gel) may be used to separate single componentorganochlorine pesticides from some interferants.
11.2.5 Elemental sulfur, present in certain sediments and industrial wastes,interferes with the sulfur channel response. Sulfur should be removed by the techniquedescribed in Method 3660.
11.3 Suggested GC operating conditions
The following operating conditions were used for the generation of the data foundin Tables 1 and 2. These GC conditions serve as guidance.
11.3.1 GC oven program for Column 1 (Sec. 6.2.1)
Initial temperature 75 EC for 0.67 min, Ramp 1 10 EC/min to 140 ECRamp 2 5 EC/min to 250 EC, hold for 1.0 min,Ramp 3 20 EC/min to 320 EC, hold for 5.0 min.
8085 - 16 Revision 0February 2007
Injector settings for Column 1
Temperature 250 ECSplitless injection 15 PSI helium with 3-µL injection volumes, vent
closed for 0.67 min
11.3.2 GC oven program for Column 2 (Sec. 6.2.2)
Initial temperature 75 EC hold for 0.67 min,Ramp 1 10 EC/min to 140 ECRamp 2 5 EC/min to 250 EC, hold for 1.0 min,Ramp 3 20 EC/min to 300 EC, hold for 10.0 min.
Injector settings for Column 2
Temperature 250 EC Splitless injection 3-µL injection volumes, vent closed for 0.67 min.
Programmable pressure control with the following conditions
40 psi initial for 0.2 min, then 99 psi/min to 15 psi, followed by the constant-flow mode.
11.4 Suggested AED operating conditions
11.4.1 Establish the detector operating conditions using the manufacturer'sspecifications for reagent gas types along with pressure and flow settings for all reagentand make-up gases. Temperatures of the transfer line and cavity should be at 280 EC and300 EC, respectively, if the analytical columns listed in Secs. 6.2.1 or 6.2.2 are used. Detector solvent vent should be on from 0 - 3.5 mins.
11.4.2 Background correction -- Element background settings need calibrationprior to analysis. Follow manufacturer’s instructions regarding background corrections.
NOTE: The injection of a 50 ng/µL diethyl phthalate (retention time about 10 - 15 mins)solution may be helpful in determining background suppression settings.
11.5 Compound-independent calibration (CIC)
The AED responds to the various elements, such as carbon, nitrogen and chlorine, withina given compound. The AED’s response is independent of the compound’s structure and isproportional to the concentration of the elements contained in the compound (see Refs. 1 and2). Since the elemental response is independent of the compound, any compound that can bechromatographed by GC and contains the desired element may be used to calibrate theinstrument for that element. The resulting elemental calibration can be used to quantitate othercompounds.
11.5.1 Bracket all sample analyses by analyses of a CIC mixture. It isrecommended that the CIC mixture be analyzed at least after every 10 samples or less. Amore frequent rate may be necessary if the samples affect the stability of the GC system. Tables 17 and 18 describe a suggested CIC mix, but alternative CIC mixtures may beused. The average elemental response factors (AERFs) for the elements to be scannedare determined with this mixture.
8085 - 17 Revision 0February 2007
ERFk 'Ack
(Cc)(efk)(Vinj)
AERFk '
jn
c'1(ERFk)c
nk
SDk '
jn
c'1[(ERFk)c & AERFk]
2
nk & 1
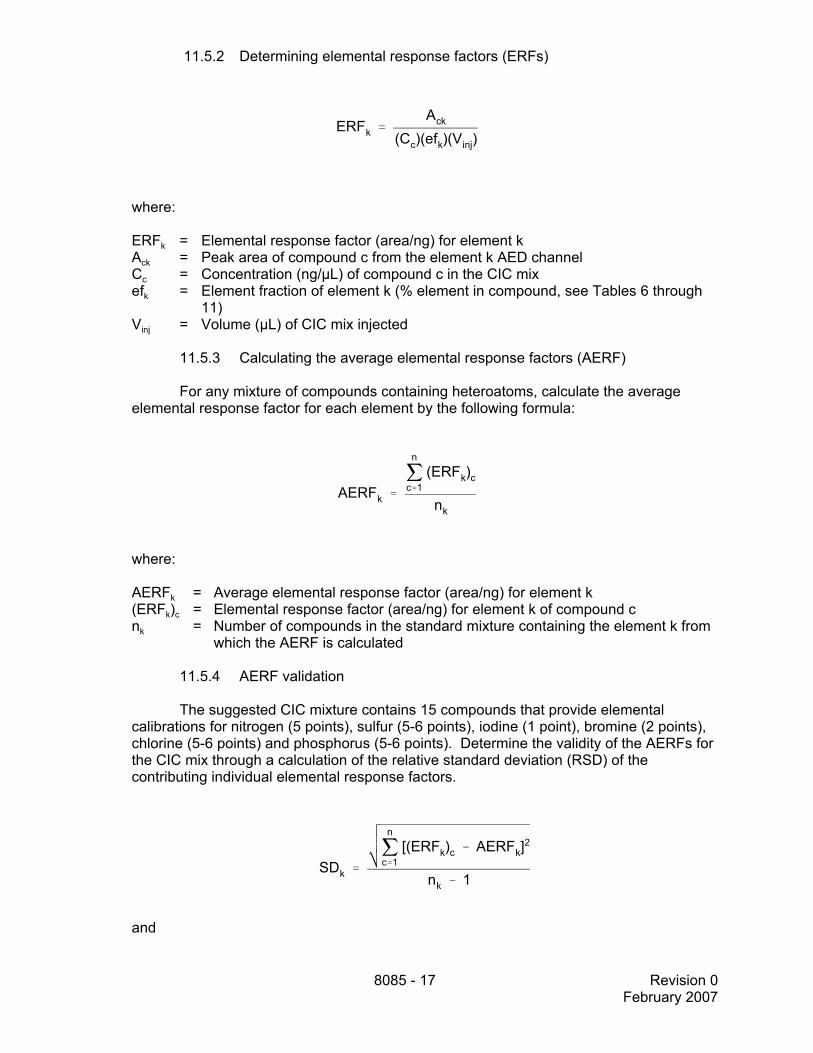
11.5.2 Determining elemental response factors (ERFs)
where:
ERFk = Elemental response factor (area/ng) for element kAck = Peak area of compound c from the element k AED channelCc = Concentration (ng/µL) of compound c in the CIC mixefk = Element fraction of element k (% element in compound, see Tables 6 through
11) Vinj = Volume (µL) of CIC mix injected
11.5.3 Calculating the average elemental response factors (AERF)
For any mixture of compounds containing heteroatoms, calculate the averageelemental response factor for each element by the following formula:
where:
AERFk = Average elemental response factor (area/ng) for element k(ERFk)c = Elemental response factor (area/ng) for element k of compound cnk = Number of compounds in the standard mixture containing the element k from
which the AERF is calculated
11.5.4 AERF validation
The suggested CIC mixture contains 15 compounds that provide elementalcalibrations for nitrogen (5 points), sulfur (5-6 points), iodine (1 point), bromine (2 points),chlorine (5-6 points) and phosphorus (5-6 points). Determine the validity of the AERFs forthe CIC mix through a calculation of the relative standard deviation (RSD) of thecontributing individual elemental response factors.
and
8085 - 18 Revision 0February 2007
RSDk 'SDk
AERFk
x 100
RPDk ' / AERFk1 & AERFk2 /AERFk1 % AERFk2
2
× 100
where:
SDk = Standard deviation of the AERF for element k(ERFk)c = Elemental response factor (area/ng) for element k of compound cAERFk = Average elemental response factor (area/ng) for element knk = Number of compounds in the standard mixture containing the element k from
which the AERF is calculatedRSDk = Relative standard deviation for the response factors of element k
The RSDs of the AERFs for all elements except phosphorous should be less thanor equal to 10%. RSDs for the AERF for phosphorous should be less than or equal to20%. If the standard is spiked to yield a 0.1% gas oil mixture (See Sec. 7.8) to enhancethe response of low phosphorous concentrations (see Sec. 11.5.8), then the RSD of theAERF for phosphorous should also be less than or equal to 10%. Bromine and iodineERFs are calculated using a two-point and single-point calibration, respectively, so theRSDs cannot be calculated for these elements. At times, chromatographic conditions maycause a compound to become an outlier. It is up to the experienced analyst to determinewhen and why a compound is designated as an outlier and thus is not included in theAERF calculation.
11.5.5 CIC mixture validation
After the CIC mix has been analyzed, compare the AERFs to a known standardthat contains stable compounds with the desired elements, such as a certified standard orstandard reference material, to minimize bias. Ongoing checks of the CIC mix againstknown standards may be necessary to ensure continued minimum bias. Therecommended precision for the check standard analysis is 25% RPD.
11.5.6 Use of the AERF for target analyte quantitation
If the compound in question demonstrates adequate chromatographic performanceand does not degrade in the GC inlet, then calibration via AERFs should produce thesame results as a compound-dependent calibration. When a target analyte is confirmedto be present in the sample, then AERFs are used for quantitation when all of the followingcriteria are met:
11.5.6.1 The AERFs meet the criteria outlined in Sec. 11.5.4.
11.5.6.2 The AERFs before and after sample analyses have a relativepercent difference (RPD) of less than or equal to 20%. The following equation isused to calculate RPD:
8085 - 19 Revision 0February 2007
where:
RPDk = Relative percent difference for element kAERFk1 = Average elemental response factor for k before sample
analysesAERFk2 = Average elemental response for k after sample analyses
11.5.6.3 The calibration check produces an elemental response factor(ERF) within 20% of the AERF both before and after the injection of samples (seeSec. 11.6).
11.5.6.4 A minimum of five points is used for the calculation of theAERF.
11.5.6.5 The quantitated target analyte elemental concentration mustfall within the elemental calibration range.
11.5.7 AERF for tentatively identified compound (TIC) quantitation
The AED's unique selectivity reduces the effort needed for detection of non-targetcompounds that contain heteroatoms. However, identification needs additional efforts, themost common of which is GC/MS. After the tentative identity is established, quantitationby AERF follows as described in Sec. 11.11. TIC results calculated using AERFquantitation are considered estimates.
NOTE: GC/MS analysis is usually necessary to provide better identification of TICs. TheGC/AED screening of TICs can facilitate GC/MS analysis. The extent of background matrix interference can be assessed by examining the carbonchannel. Estimations of retention times, types of heteroatoms present, and theratios of heteroatoms if more than one is present, also help in the GC/MSanalysis. Often standards for TICs may not be readily accessible. In thoseinstances, AERF quantitation may be the least biased method of quantitationavailable.
11.5.8 Calibration of phosphorus-containing compounds
Interaction of phosphorus in the discharge tube (Ref. 1) may affect the quantitationaccuracy. This effect is quenched when a high level of organic material co-elutes with theanalytes. This may occur with highly contaminated samples. Therefore, some additionalsteps may be necessary for proper quantitation of a compound containing phosphorus.
NOTE: There are at least three different methods that could facilitate phosphorusquantitation. One method is to spike a gas-oil mixture (See Sec. 7.8), to yield aconcentration of approximately 0.1%, into both the sample extracts andstandards to insure relative homogeneity of matrix. This addition of the gas-oilmixture will also enhance the linearity of the phosphorus response. A secondmethod is to use a phosphorus-containing internal standard that will compensatefor the different matrices. The third method is to use a heteroatom other thanphosphorus to quantitate the compound. Most organophosphorus pesticidescontain a heteroatom in addition to phosphorus. None of these methods isnecessary for screening pesticides, since the matrix generally tends to increasethe sensitivity for phosphorus. Thus, though biased high, phosphorous
8085 - 20 Revision 0February 2007
compounds, if present, can still be detected at or above their QLs in a highbackground matrix.
11.5.9 Use of the AERF for dilution factor determination
If a target compound is detected during the AED scan, then the AERF may beused to determine what dilution of the extract is needed to bring the detected compoundinto the calibration range prior to running the quantitative analysis.
11.5.10 Use of the AERF for the demonstration of detector linearity
The AERF calculation needs validation through the calculation of RSDs. The CICutilizes multi-level elemental calibrations for the determination of AERFs. If the RSD for anelement shows linearity, then it follows that the detector will also show linearity for a givencompound utilizing that same element, provided that the conditions in Sec. 11.5.6 are met.
11.5.11 Use of the AERF for the demonstration of system stability
The AERFs calculated prior to the screening or quantitative analysis of samplesshould not substantially differ from the AERFs calculated following the analyses. If theAERFs differ by more than 20% for all elements, then explore and correct the cause of thedeviation.
11.5.12 Use of the AERF for validation of a standard
If a standard's accuracy or integrity is in question, it can be compared to the CICmix. If the compounds in question do not degrade on-column or in the inlet, then theconcentration calculated via the AERF should agree with the stated concentration of thestandard within ± 15%.
CAUTION: A compound having negative ERF deviations from CIC-generated AERFs maybe displaying degradation or be a result of an improperly prepared standard. Positive deviations of compound ERFs from CIC-generated AERFs can onlyresult from an improperly prepared standard (unless the compound is adegradation product of another compound in a standard mixture). If allcompounds in a standard mixture display deviations from the AERFs, then adilution error is probably the cause.
11.5.13 Use of the AERF for compound confirmation -- See Sec. 11.10.
11.6 Calibration and response check
Analyze a calibration and response check standard(s) before and after the injectionof samples. This is done at the same frequency as the CIC mixture (see Sec 11.5). Thecheck standard should contain all the analytes of interest for the analysis. Multiplestandards may be necessary when analytes have overlapping retention times. Theconcentration of the analytes in the check standard should correspond to the level neededto calculate their respective minimum quantitation limits (QL). In general thisconcentration reflects the lowest concentration from a multi-level compound-dependentcalibration. Only one heteroatom needs to be monitored for each analyte for this checkstandard.
The purpose of the calibration and response check is to show that all reported compoundscan be detected at or above their minimum quantitation limits, and that the compounds can be

8085 - 21 Revision 0February 2007
%Dc 'ERFck&AERFk
AERFk
(100
successfully chromatographed. It is a check to validate the use of CIC quantitation when atarget analyte is present in the sample and it serves as a justification for reporting a QL when atarget analyte is considered not detected.
NOTE: By utilizing a low-level standard mix, the time needed for determining that targetcompounds are not present is reduced without diminishing the validity of the reportinglimits.
11.6.1 The calibration and response check for CIC validation
The calibration and response check is a comparison between the elementalresponse (ERF) for each analyte from the calibration and response check standard andthe average elemental response (AERF) from the CIC. This comparison is expressed as apercent difference (%D) from the AERF, as determined from the CIC. If the %D is lessthan or equal to 20% both before and after the injection of samples, then the compound-independent calibration is considered valid for that analyte for quantitation. Use thefollowing equation to calculate %D:
where:
%Dc = Percent difference for compound cERFck = Elemental response factor (area/ng) for compound c using element k from the
calibration and response check standardAERFk = Average elemental response factor (area/ng) for element k derived from the
CIC
11.6.2 If a target compound is detected above the QL and the use of CIC hasbeen determined to be invalid for this target compound (see Sec. 11.5.6), then the sampleshould be reanalyzed using an alternative determinative method for the target compound. This may entail a multi-level calibration for the analyte detected with the associated qualitycontrol procedures described in Method 8000. The reanalysis may utilize the GC/AED oranother instrument, if appropriate. The concentrations of the target compounds detectedbelow their respective QLs can only be considered estimated values.
11.6.3 The calibration and response check for reporting minimum quantitationlimits
The QL is dependent on the sample size and extract dilution. Its calculation canbe found in Sec. 11.12. A valid response check that is used as the basis for reporting aQL for a target analyte must satisfy the following conditions:
11.6.3.1 The calibration and response check standard must beanalyzed before and after the analyses of samples.
11.6.3.2 The same element used to calculate the ERF for the checkstandard is used to monitor the target analyte in the sample.

8085 - 22 Revision 0February 2007
11.6.3.3 An elemental response for a target analyte in the checkstandard that is at least five times above the mean chromatographic noise level isconsidered a valid response. (Conventional instrument detection is determined ata 2.5:1 signal-to-noise ratio (S/N) in a single channel system. Ref. 1 uses 3:1 S/N,based on peak-to-peak noise or 6σ for 99% confidence for detection.)
11.7 Retention times
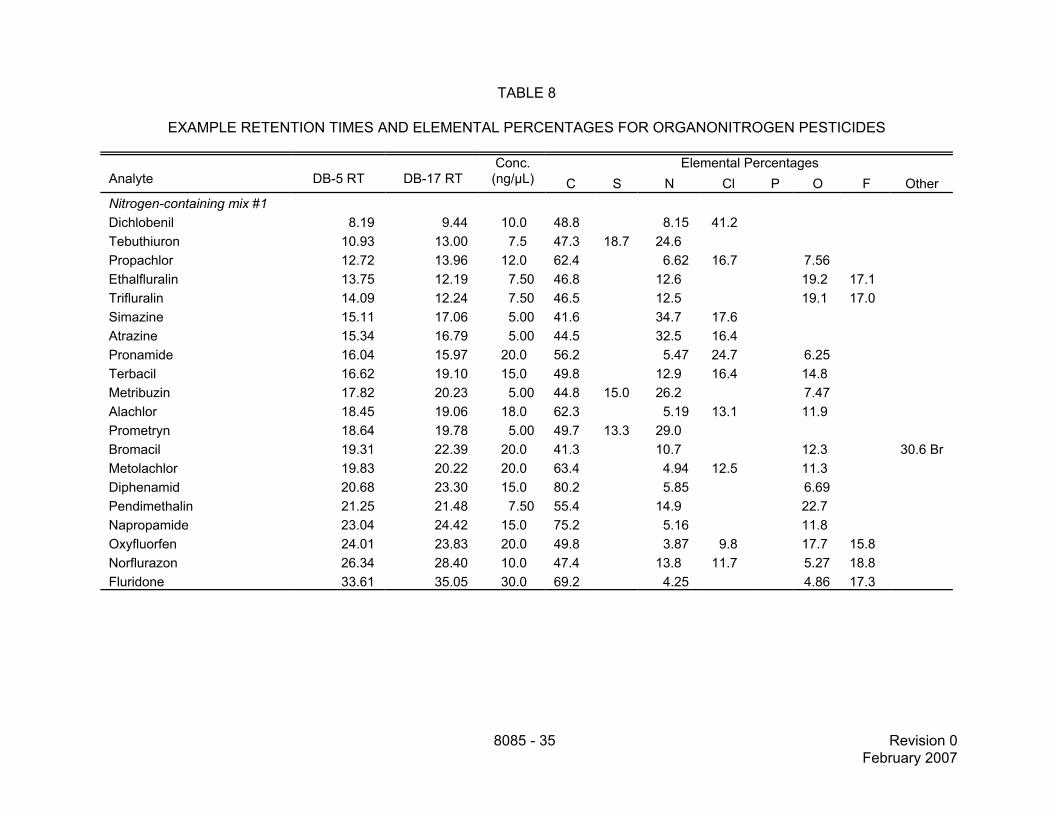
The retention times of target analytes should be determined from calibration and responsecheck standard mix before and confirmed after samples are injected. The professionaljudgment of the experienced analyst should be used to determine the appropriate windows fortarget compound identifications. See Tables 8 through 11 and Table 13 for example retentiontimes on the DB-5 and DB-17 columns. These retention times are provided for illustrativepurposes only. Each laboratory must determine retention times and retention time windows fortheir specific application of the method.
11.8 Degradation checks
Endrin and 4,4'-DDT are used to determine the degradation potential of the GC system. Both compounds should have a percent difference (%D), as determined in Sec. 11.6, of lessthan or equal to 20%. If these values are exceeded, GC maintenance is needed beforecontinuing. Other compounds, such as dimethoate or captan, which display columndegradation/absorption properties that are different from DDT and endrin, may also be helpful indetermining the condition of the system.
11.9 Sample extract injection
Inject an aliquot of the concentrated sample extract into the GC/AED. The injectionvolume and operating conditions should be the same as those used for the calibrationstandards, unless the analyst can demonstrate acceptable performance using different volumesor conditions. (The use of different injection volumes for samples versus standards needspecial attention paid to the equations in Secs. 11.5 and 11.11). Record the AED response foreach GC peak, for all the elements that are monitored.
11.10 Qualitative analysis
11.10.1 Appropriate elemental ratios may be used to confirm the identification ofpesticides. In addition, identification may be confirmed by GC with a dissimilar column,specific element detector, or mass spectrometer, as described in Method 8000.
11.10.2 Appropriate elemental ratios -- If an analyte contains two or moreheteroatoms, its identification can be confirmed by elemental ratios. This is done bycalculating the analyte concentration (see Sec. 11.11) in the extract using each of theheteroatoms and comparing them. All concentrations must be calculated from theAERFs. If the relative percent difference (RPD) of the concentration ratio is less than orequal to 20% and there is an acceptable primary column retention time match, then theidentification of the compound is considered confirmed.
8085 - 23 Revision 0February 2007
RPDc ' / Concck & Conccm /Concck % Conccm
2
× 100
Concentrationc (µg/L) '(Ac)(Vf)(DF)
(AERFk)(Vs)(efck)(Vinj)
where:
RPDc = Relative percent difference for compound c,Concck = Concentration of compound c in the extract using element k,Conccm = Concentration of compound c in the extract using element m,
NOTE: An equivalent technique is to calculate the elemental molar amounts andcompare the results to the empirical formula of the compound. Equivalentacceptance criteria should be applied to the molar ratios.
11.10.3 If a compound contains three or more heteroatoms, then detection of atleast three heteroatoms along with an acceptable primary column retention time match isconsidered acceptable for compound confirmation, although elemental ratios of allelements present should still be examined.
11.11 Quantitative analysis
The quality control conditions found in Secs. 11.5 and 11.6 need to be met in order toreduce bias when quantitating compounds using AERFs from the CIC mix. If no standard of theanalyte is available, then the estimations made from the CIC AERFs should be consideredminimum concentrations.
11.11.1 Concentration calculations for water samples
where:
Ac = Area of compound c on the k element AED channelVf = Final volume (mL) of the sample extractDF = Dilution factorAERFk = Average elemental response factor (area/ng) for element kVs = Volume (L) of sample extractedefck = Elemental fraction of element k (% of element in compound c)Vinj = Volume (µL) of extract injected

8085 - 24 Revision 0February 2007
Concentrationc (µg/kg) '(Ac)(Vf)(DF)
(AERFk)(Ms)(efck)(S)(Vinj)
Quantiation limitc (µg/L) '(Concc)(VSTDinj)(Vf)(DF)
(Vs)(Vinj)
11.11.2 Concentration calculations for soil/sediment samples
where:
Ac = Area of compound c on the k element AED channelVf = Final volume (mL) of the sample extractDF = Dilution factorAERFk = Average elemental response factor (area/ng) for element kMs = Mass (kg) of sample extractedefck = Elemental fraction of element k (% of element in compound c)S = Percent solids expressed as a decimal fractionVinj = Volume (µL) of extract injected
NOTE: Quantitative results derived from AERFs should be equal to or less than thosederived from compound-dependent calibrations. Compound-dependentcalibrations tend to compensate for losses that occur during gas chromatography. If a compound behaves well chromatographically, nearly one hundred percent ofthe injected compound reaches the detector. If there are losses due tocompound degradation or absorption in the GC system, the quantity of theanalyte reaching the detector is reduced and the concentrations of thosecompounds calculated from AERFs will be less than concentrations calculatedfrom a compound-dependent calibration.
11.12 Quantitation limits
The minimum quantitation limits (QLs) may only be used if the response check is valid forthe target analyte of concern (see Sec. 11.6.2) and the compound is considered not detected. Itis dependent upon sample size and extract dilution.
11.12.1 Quantitation limit calculations for liquid samples
where:
Concc = Concentration (µg/mL) of compound c in the calibration and response checkstandard mix
VSTDinj = Volume (µL) of standard mix injectedVf = Final volume (mL) of the sample extractDF = Dilution factorVs = Volume (L) of sample extractedVinj = Volume (µL) of sample extract injected
8085 - 25 Revision 0February 2007
Quantitation limitc (µg/kg) '(Concc)(VSTDinj)(Vf)(DF)
(Ms)(S)(Vinj)
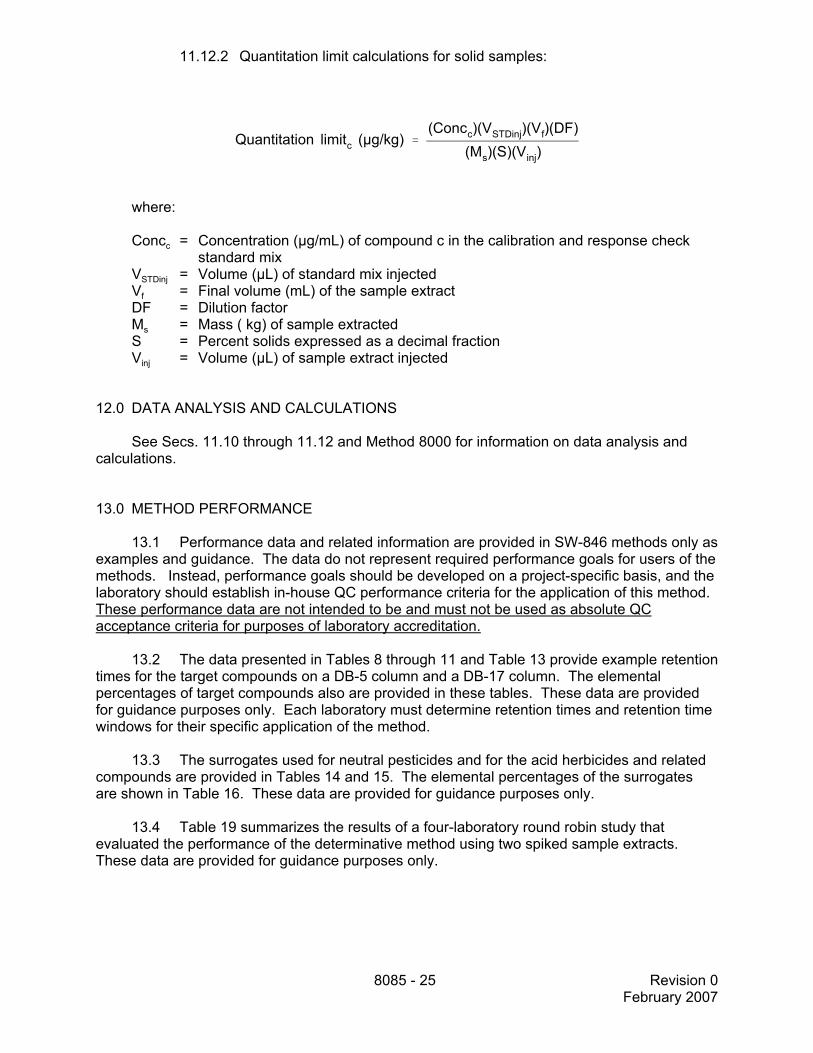
11.12.2 Quantitation limit calculations for solid samples:
where:
Concc = Concentration (µg/mL) of compound c in the calibration and response checkstandard mix
VSTDinj = Volume (µL) of standard mix injectedVf = Final volume (mL) of the sample extractDF = Dilution factorMs = Mass ( kg) of sample extractedS = Percent solids expressed as a decimal fractionVinj = Volume (µL) of sample extract injected
12.0 DATA ANALYSIS AND CALCULATIONS
See Secs. 11.10 through 11.12 and Method 8000 for information on data analysis andcalculations.
13.0 METHOD PERFORMANCE
13.1 Performance data and related information are provided in SW-846 methods only asexamples and guidance. The data do not represent required performance goals for users of themethods. Instead, performance goals should be developed on a project-specific basis, and thelaboratory should establish in-house QC performance criteria for the application of this method. These performance data are not intended to be and must not be used as absolute QCacceptance criteria for purposes of laboratory accreditation.
13.2 The data presented in Tables 8 through 11 and Table 13 provide example retentiontimes for the target compounds on a DB-5 column and a DB-17 column. The elementalpercentages of target compounds also are provided in these tables. These data are providedfor guidance purposes only. Each laboratory must determine retention times and retention timewindows for their specific application of the method.
13.3 The surrogates used for neutral pesticides and for the acid herbicides and relatedcompounds are provided in Tables 14 and 15. The elemental percentages of the surrogatesare shown in Table 16. These data are provided for guidance purposes only.
13.4 Table 19 summarizes the results of a four-laboratory round robin study thatevaluated the performance of the determinative method using two spiked sample extracts. These data are provided for guidance purposes only.
8085 - 26 Revision 0February 2007
14.0 POLLUTION PREVENTION
14.1 Pollution prevention encompasses any technique that reduces or eliminates thequantity and/or toxicity of waste at the point of generation. Numerous opportunities for pollutionprevention exist in laboratory operations. The EPA has established a preferred hierarchy ofenvironmental management techniques that places pollution prevention as the managementoption of first choice. Whenever feasible, laboratory personnel should use pollution preventiontechniques to address their waste generation. When wastes cannot be feasibly reduced at thesource, the Agency recommends recycling as the next best option.
14.2 For information about pollution prevention that may be applicable to laboratoriesand research institutions consult Less is Better: Laboratory Chemical Management for WasteReduction available from the American Chemical Society's Department of GovernmentRelations and Science Policy, 1155 16th St., N.W. Washington, D.C. 20036, http://www.acs.org.
15.0 WASTE MANAGEMENT
The Environmental Protection Agency requires that laboratory waste managementpractices be conducted consistent with all applicable rules and regulations. The Agency urgeslaboratories to protect the air, water, and land by minimizing and controlling all releases fromhoods and bench operations, complying with the letter and spirit of any sewer discharge permitsand regulations, and by complying with all solid and hazardous waste regulations, particularlythe hazardous waste identification rules and land disposal restrictions. For further informationon waste management, consult The Waste Management Manual for Laboratory Personnelavailable from the American Chemical Society at the address listed in Sec. 14.2.
16.0 REFERENCES
1. N. Olson, R. Carrell, R. Cummings and R. Rieck, "Gas Chromatography/Atomic EmissionDetection For Pesticide Screening and Confirmation," LC-GC 12, 142, 1994.
2. N. L. Olson, R. L. Carrell, R. K. Cummings, and R. H. Rieck, and S. Reimer, "AtomicEmission Detection for Gas Chromatographic Analysis of Nitrogen-Containing Herbicidesin Water," J. Assoc. Off. Anal. Chem. 78, No. 6, 1464-1473, 1995.
3. N. Olson, R. Cummings, and R. Araki, "SW-846 Method 8085 Pesticide Screening andCompound Independent Quantification by Gas Chromatography with Atomic EmissionDetection (A Round Robin Study)," USEPA Manchester Environmental Laboratory, PortOrchard, WA, September 18, 1997.
17.0 TABLES, DIAGRAMS, FLOWCHARTS AND VALIDATION DATA
The following pages contain the tables referenced by this method.
8085 - 27 Revision 0February 2007
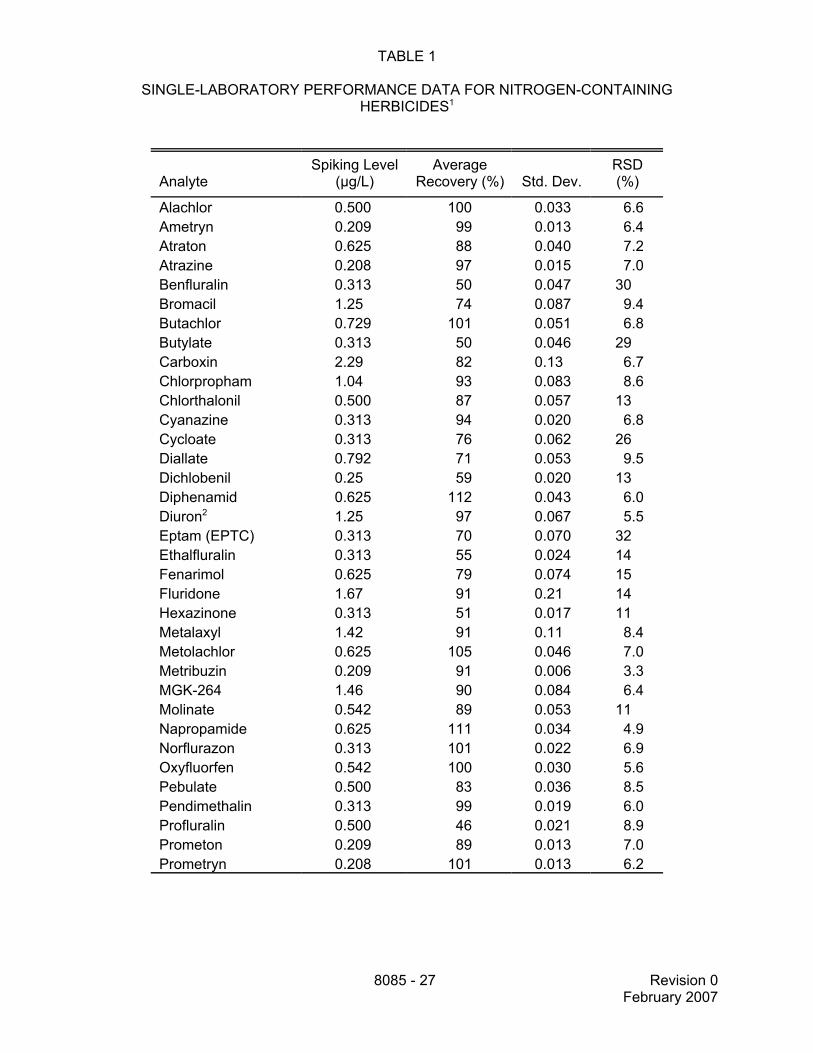
TABLE 1
SINGLE-LABORATORY PERFORMANCE DATA FOR NITROGEN-CONTAININGHERBICIDES1
AnalyteSpiking Level
(µg/L)Average
Recovery (%) Std. Dev.RSD(%)
Alachlor 0.500 100 0.033 6.6Ametryn 0.209 99 0.013 6.4Atraton 0.625 88 0.040 7.2Atrazine 0.208 97 0.015 7.0Benfluralin 0.313 50 0.047 30Bromacil 1.25 74 0.087 9.4Butachlor 0.729 101 0.051 6.8Butylate 0.313 50 0.046 29Carboxin 2.29 82 0.13 6.7Chlorpropham 1.04 93 0.083 8.6Chlorthalonil 0.500 87 0.057 13Cyanazine 0.313 94 0.020 6.8Cycloate 0.313 76 0.062 26Diallate 0.792 71 0.053 9.5Dichlobenil 0.25 59 0.020 13Diphenamid 0.625 112 0.043 6.0Diuron2 1.25 97 0.067 5.5Eptam (EPTC) 0.313 70 0.070 32Ethalfluralin 0.313 55 0.024 14Fenarimol 0.625 79 0.074 15Fluridone 1.67 91 0.21 14Hexazinone 0.313 51 0.017 11Metalaxyl 1.42 91 0.11 8.4Metolachlor 0.625 105 0.046 7.0Metribuzin 0.209 91 0.006 3.3MGK-264 1.46 90 0.084 6.4Molinate 0.542 89 0.053 11Napropamide 0.625 111 0.034 4.9Norflurazon 0.313 101 0.022 6.9Oxyfluorfen 0.542 100 0.030 5.6Pebulate 0.500 83 0.036 8.5Pendimethalin 0.313 99 0.019 6.0Profluralin 0.500 46 0.021 8.9Prometon 0.209 89 0.013 7.0Prometryn 0.208 101 0.013 6.2
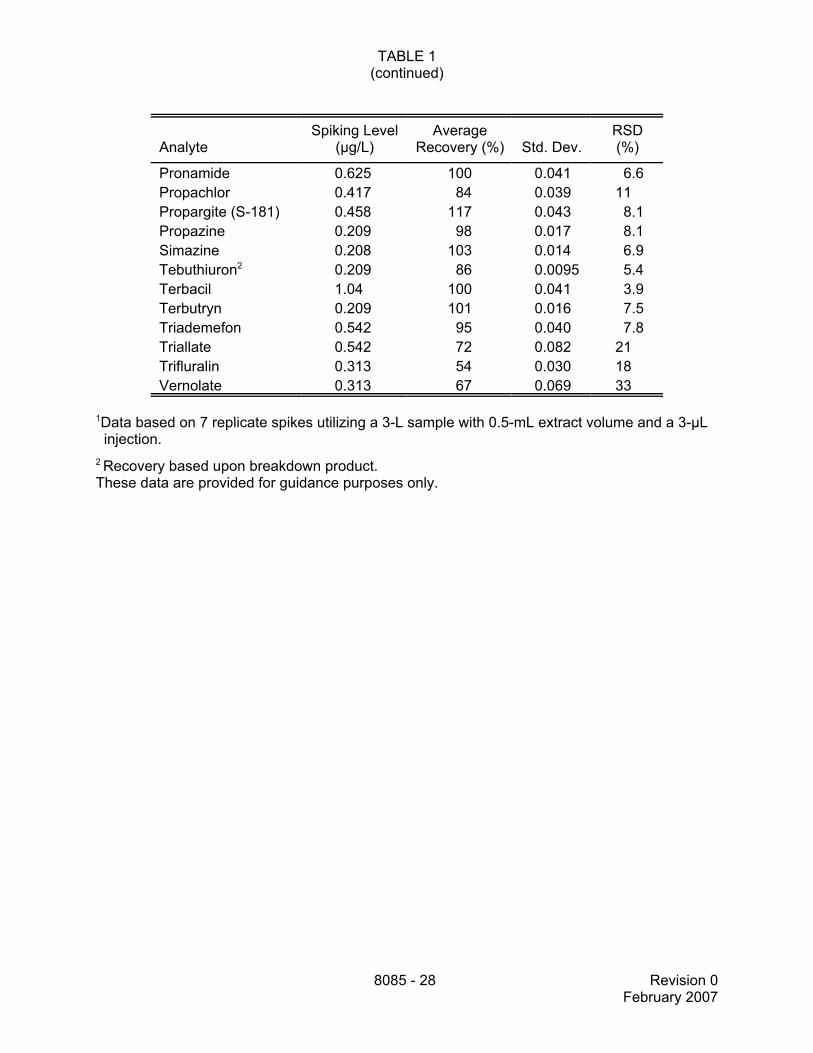
TABLE 1(continued)
AnalyteSpiking Level
(µg/L)Average
Recovery (%) Std. Dev.RSD(%)
8085 - 28 Revision 0February 2007
Pronamide 0.625 100 0.041 6.6Propachlor 0.417 84 0.039 11Propargite (S-181) 0.458 117 0.043 8.1Propazine 0.209 98 0.017 8.1Simazine 0.208 103 0.014 6.9Tebuthiuron2 0.209 86 0.0095 5.4Terbacil 1.04 100 0.041 3.9Terbutryn 0.209 101 0.016 7.5Triademefon 0.542 95 0.040 7.8Triallate 0.542 72 0.082 21Trifluralin 0.313 54 0.030 18Vernolate 0.313 67 0.069 33
1Data based on 7 replicate spikes utilizing a 3-L sample with 0.5-mL extract volume and a 3-µL injection.2 Recovery based upon breakdown product.These data are provided for guidance purposes only.
8085 - 29 Revision 0February 2007
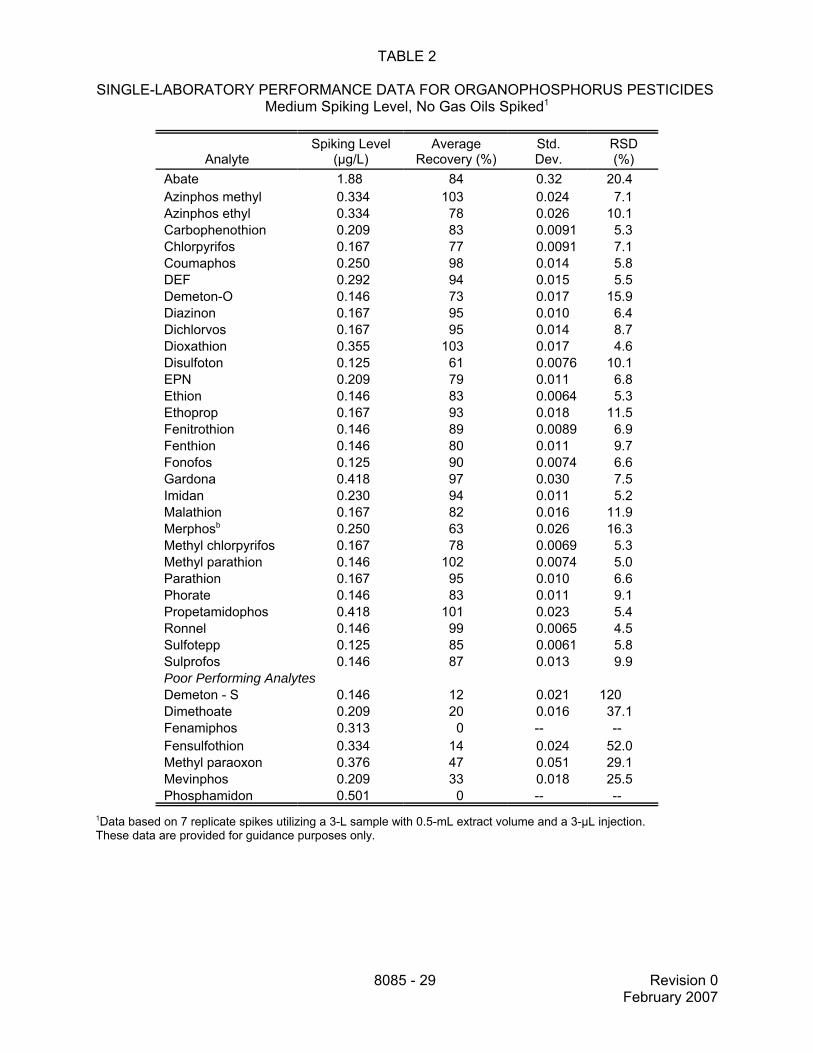
TABLE 2
SINGLE-LABORATORY PERFORMANCE DATA FOR ORGANOPHOSPHORUS PESTICIDES Medium Spiking Level, No Gas Oils Spiked1
AnalyteSpiking Level
(µg/L)Average
Recovery (%)Std.Dev.
RSD(%)
Abate 1.88 84 0.32 20.4Azinphos methyl 0.334 103 0.024 7.1Azinphos ethyl 0.334 78 0.026 10.1Carbophenothion 0.209 83 0.0091 5.3Chlorpyrifos 0.167 77 0.0091 7.1Coumaphos 0.250 98 0.014 5.8DEF 0.292 94 0.015 5.5Demeton-O 0.146 73 0.017 15.9Diazinon 0.167 95 0.010 6.4Dichlorvos 0.167 95 0.014 8.7Dioxathion 0.355 103 0.017 4.6Disulfoton 0.125 61 0.0076 10.1EPN 0.209 79 0.011 6.8Ethion 0.146 83 0.0064 5.3Ethoprop 0.167 93 0.018 11.5Fenitrothion 0.146 89 0.0089 6.9Fenthion 0.146 80 0.011 9.7Fonofos 0.125 90 0.0074 6.6Gardona 0.418 97 0.030 7.5Imidan 0.230 94 0.011 5.2Malathion 0.167 82 0.016 11.9Merphosb 0.250 63 0.026 16.3Methyl chlorpyrifos 0.167 78 0.0069 5.3Methyl parathion 0.146 102 0.0074 5.0Parathion 0.167 95 0.010 6.6Phorate 0.146 83 0.011 9.1Propetamidophos 0.418 101 0.023 5.4Ronnel 0.146 99 0.0065 4.5Sulfotepp 0.125 85 0.0061 5.8Sulprofos 0.146 87 0.013 9.9Poor Performing AnalytesDemeton - S 0.146 12 0.021 120Dimethoate 0.209 20 0.016 37.1Fenamiphos 0.313 0 -- --Fensulfothion 0.334 14 0.024 52.0Methyl paraoxon 0.376 47 0.051 29.1Mevinphos 0.209 33 0.018 25.5Phosphamidon 0.501 0 -- --
1Data based on 7 replicate spikes utilizing a 3-L sample with 0.5-mL extract volume and a 3-µL injection. These data are provided for guidance purposes only.
8085 - 30 Revision 0February 2007
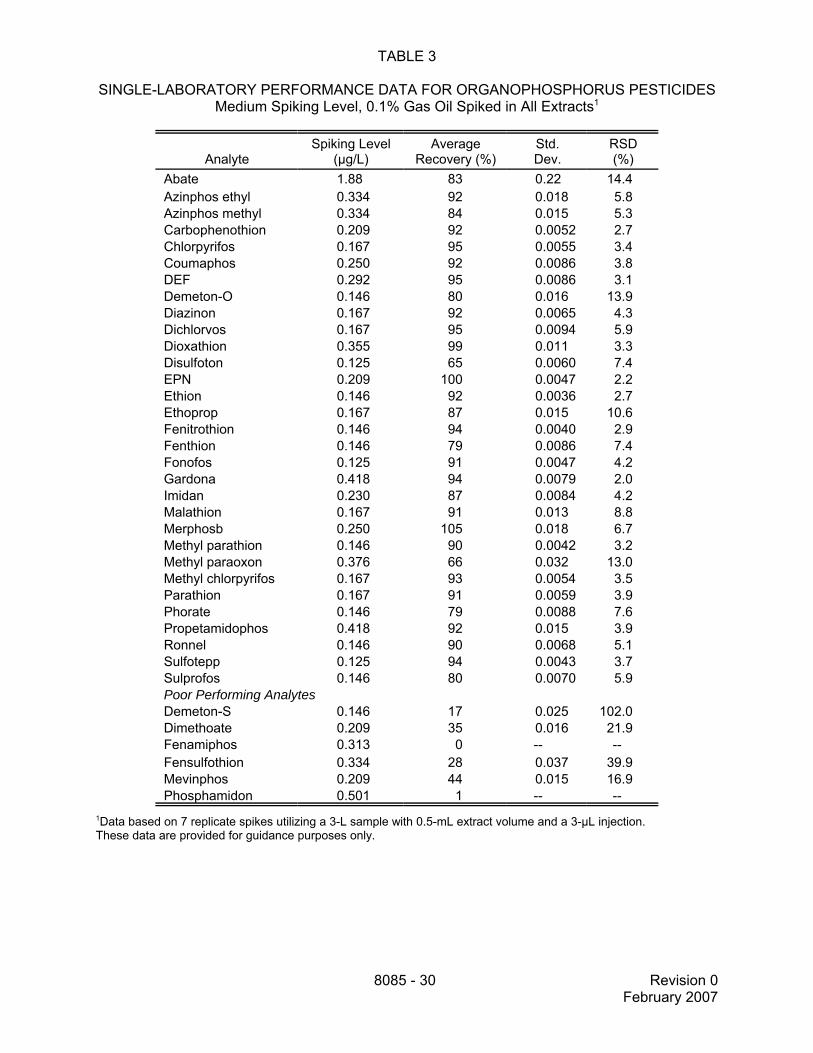
TABLE 3
SINGLE-LABORATORY PERFORMANCE DATA FOR ORGANOPHOSPHORUS PESTICIDESMedium Spiking Level, 0.1% Gas Oil Spiked in All Extracts1
AnalyteSpiking Level
(µg/L)Average
Recovery (%)Std.Dev.
RSD(%)
Abate 1.88 83 0.22 14.4Azinphos ethyl 0.334 92 0.018 5.8Azinphos methyl 0.334 84 0.015 5.3Carbophenothion 0.209 92 0.0052 2.7Chlorpyrifos 0.167 95 0.0055 3.4Coumaphos 0.250 92 0.0086 3.8DEF 0.292 95 0.0086 3.1Demeton-O 0.146 80 0.016 13.9Diazinon 0.167 92 0.0065 4.3Dichlorvos 0.167 95 0.0094 5.9Dioxathion 0.355 99 0.011 3.3Disulfoton 0.125 65 0.0060 7.4EPN 0.209 100 0.0047 2.2Ethion 0.146 92 0.0036 2.7Ethoprop 0.167 87 0.015 10.6Fenitrothion 0.146 94 0.0040 2.9Fenthion 0.146 79 0.0086 7.4Fonofos 0.125 91 0.0047 4.2Gardona 0.418 94 0.0079 2.0Imidan 0.230 87 0.0084 4.2Malathion 0.167 91 0.013 8.8Merphosb 0.250 105 0.018 6.7Methyl parathion 0.146 90 0.0042 3.2Methyl paraoxon 0.376 66 0.032 13.0Methyl chlorpyrifos 0.167 93 0.0054 3.5Parathion 0.167 91 0.0059 3.9Phorate 0.146 79 0.0088 7.6Propetamidophos 0.418 92 0.015 3.9Ronnel 0.146 90 0.0068 5.1Sulfotepp 0.125 94 0.0043 3.7Sulprofos 0.146 80 0.0070 5.9Poor Performing AnalytesDemeton-S 0.146 17 0.025 102.0Dimethoate 0.209 35 0.016 21.9Fenamiphos 0.313 0 -- --Fensulfothion 0.334 28 0.037 39.9Mevinphos 0.209 44 0.015 16.9Phosphamidon 0.501 1 -- --
1Data based on 7 replicate spikes utilizing a 3-L sample with 0.5-mL extract volume and a 3-µL injection. These data are provided for guidance purposes only.
8085 - 31 Revision 0February 2007
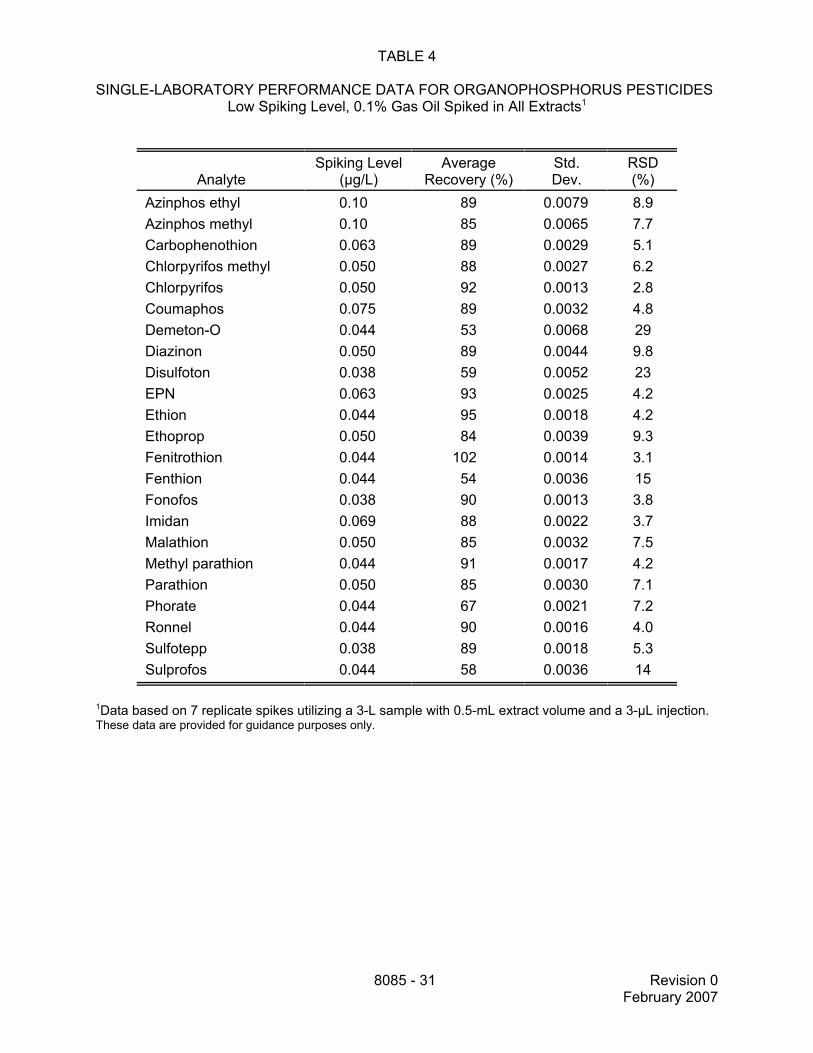
TABLE 4
SINGLE-LABORATORY PERFORMANCE DATA FOR ORGANOPHOSPHORUS PESTICIDESLow Spiking Level, 0.1% Gas Oil Spiked in All Extracts1
AnalyteSpiking Level
(µg/L)Average
Recovery (%)Std.Dev.
RSD(%)
Azinphos ethyl 0.10 89 0.0079 8.9Azinphos methyl 0.10 85 0.0065 7.7Carbophenothion 0.063 89 0.0029 5.1Chlorpyrifos methyl 0.050 88 0.0027 6.2Chlorpyrifos 0.050 92 0.0013 2.8Coumaphos 0.075 89 0.0032 4.8Demeton-O 0.044 53 0.0068 29Diazinon 0.050 89 0.0044 9.8Disulfoton 0.038 59 0.0052 23EPN 0.063 93 0.0025 4.2Ethion 0.044 95 0.0018 4.2Ethoprop 0.050 84 0.0039 9.3Fenitrothion 0.044 102 0.0014 3.1Fenthion 0.044 54 0.0036 15Fonofos 0.038 90 0.0013 3.8Imidan 0.069 88 0.0022 3.7Malathion 0.050 85 0.0032 7.5Methyl parathion 0.044 91 0.0017 4.2Parathion 0.050 85 0.0030 7.1Phorate 0.044 67 0.0021 7.2Ronnel 0.044 90 0.0016 4.0Sulfotepp 0.038 89 0.0018 5.3Sulprofos 0.044 58 0.0036 14
1Data based on 7 replicate spikes utilizing a 3-L sample with 0.5-mL extract volume and a 3-µL injection. These data are provided for guidance purposes only.

8085 - 32 Revision 0February 2007
TABLE 5
SINGLE-LABORATORY PERFORMANCE DATA FOR CHLORINATED PESTICIDES1
AnalyteSpiking Level
(µg/L)Average
Recovery (%)Std.Dev.
RSD(%)
Aldrin 0.17 32 0.0020 3.6α-BHC 0.17 102 0.0089 5.1β-BHC 0.17 104 0.0093 5.2δ-BHC 0.17 104 0.0093 5.2γ-BHC (lindane) 0.17 104 0.0098 5.5Captafol4 0.84 139 0.11 6.9Captan, captafol breakdown2&3 NA 98 0.034 7.3Captan4 0.50 140 0.081 8.2trans-Chlordane 0.17 82 0.0090 6.5Diclofol4 0.67 124 0.012 13Dicofol breakdown4 NA 100 5.1Dieldrin3 0.17 94 0.0055 3.42,4'-DDD 0.17 91 0.0070 4.54,4'-DDD 0.17 101 0.0072 4.22,4'-DDE 0.17 49 0.0069 4.84,4'-DDE2 0.17 94 0.0055 3.42,4'-DDT 0.17 78 0.088 5.34,4'-DDT 0.17 116 0.0046 5.2Endosulfan I 0.17 100 0.0000 0Endosulfan II 0.17 110 0.0000 0Endosulfan sulfate 0.17 114 0.010 5.2Endrin 0.17 103 0.0083 4.8Endrin aldehyde 0.17 111 0.0070 3.7Endrin ketone 0.085 113 0.011 4.8Heptachlor 0.17 47 0.0032 4.0Heptachlor epoxide 0.17 99 0.0026 1.5Hexachlorbenzene (HCB)3 0.25 55 0.024 8.9Methoxychlor 0.17 124 0.012 5.2Mirex 0.17 77 0.0040 9.4Pentachlorocyclopentadiene3 1.00 37 0.057 6.7
1Data based on 7 replicate spikes utilizing a 3-L sample with 0.5-mL extract volume and a 3-µL injection. 2Quantitated together from one peak.3Data based on 1-L sample size with 0.5-mL extract volume.4Subject to GC breakdown, breakdown products where monitored; recoveries were captan 50%, captafol 40%,diclofol 3% when compared to ClC; 55% recovery of dicofol breakdown product, captan breakdown monitored on thecarbon channel.These data are provided for guidance purposes only.
8085 - 33 Revision 0February 2007
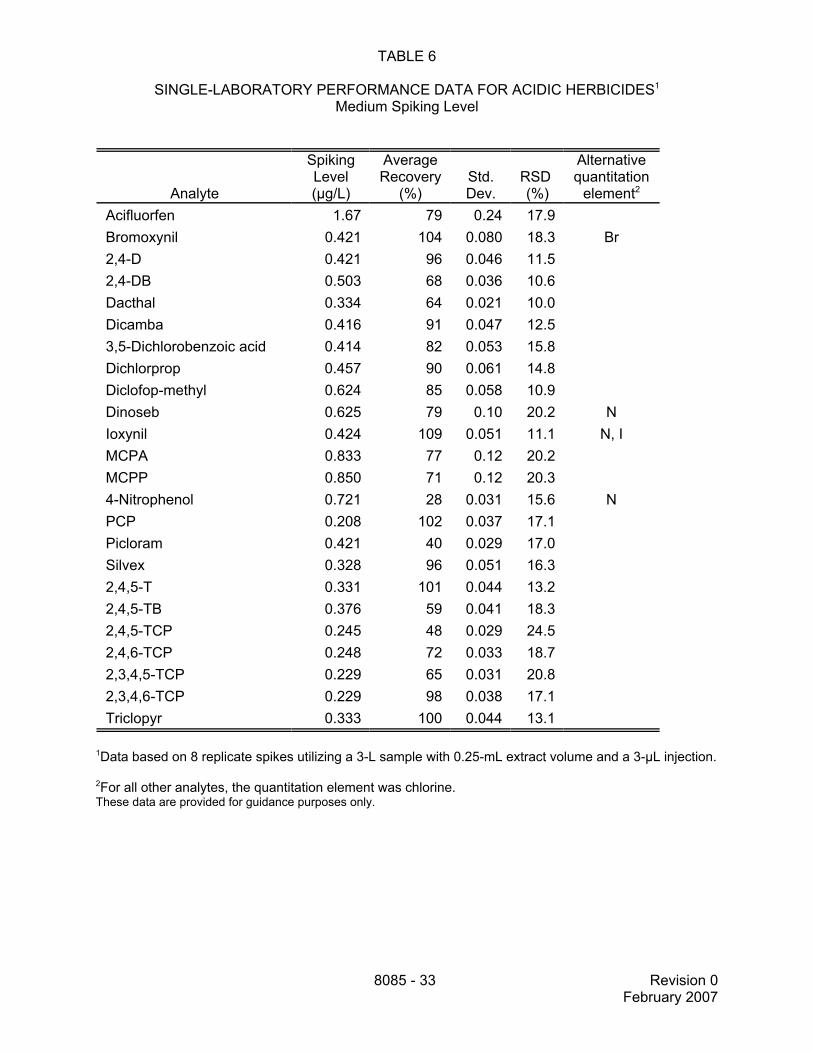
TABLE 6
SINGLE-LABORATORY PERFORMANCE DATA FOR ACIDIC HERBICIDES1
Medium Spiking Level
Analyte
SpikingLevel(µg/L)
AverageRecovery
(%)Std.Dev.
RSD (%)
Alternativequantitation
element2
Acifluorfen 1.67 79 0.24 17.9Bromoxynil 0.421 104 0.080 18.3 Br2,4-D 0.421 96 0.046 11.52,4-DB 0.503 68 0.036 10.6Dacthal 0.334 64 0.021 10.0Dicamba 0.416 91 0.047 12.53,5-Dichlorobenzoic acid 0.414 82 0.053 15.8Dichlorprop 0.457 90 0.061 14.8Diclofop-methyl 0.624 85 0.058 10.9Dinoseb 0.625 79 0.10 20.2 NIoxynil 0.424 109 0.051 11.1 N, IMCPA 0.833 77 0.12 20.2MCPP 0.850 71 0.12 20.34-Nitrophenol 0.721 28 0.031 15.6 NPCP 0.208 102 0.037 17.1Picloram 0.421 40 0.029 17.0Silvex 0.328 96 0.051 16.32,4,5-T 0.331 101 0.044 13.22,4,5-TB 0.376 59 0.041 18.32,4,5-TCP 0.245 48 0.029 24.52,4,6-TCP 0.248 72 0.033 18.72,3,4,5-TCP 0.229 65 0.031 20.82,3,4,6-TCP 0.229 98 0.038 17.1Triclopyr 0.333 100 0.044 13.1
1Data based on 8 replicate spikes utilizing a 3-L sample with 0.25-mL extract volume and a 3-µL injection.
2For all other analytes, the quantitation element was chlorine.These data are provided for guidance purposes only.
8085 - 34 Revision 0February 2007
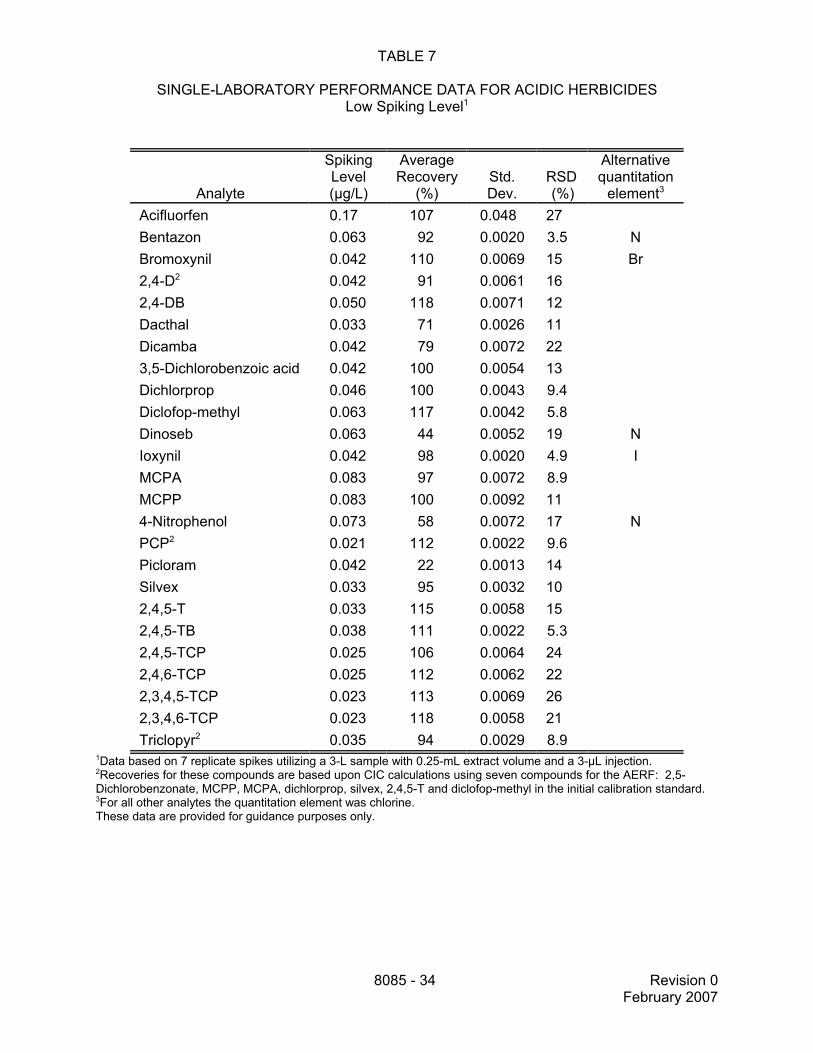
TABLE 7
SINGLE-LABORATORY PERFORMANCE DATA FOR ACIDIC HERBICIDESLow Spiking Level1
Analyte
SpikingLevel(µg/L)
AverageRecovery
(%)Std.Dev.
RSD (%)
Alternativequantitation
element3
Acifluorfen 0.17 107 0.048 27Bentazon 0.063 92 0.0020 3.5 NBromoxynil 0.042 110 0.0069 15 Br2,4-D2 0.042 91 0.0061 162,4-DB 0.050 118 0.0071 12Dacthal 0.033 71 0.0026 11Dicamba 0.042 79 0.0072 223,5-Dichlorobenzoic acid 0.042 100 0.0054 13Dichlorprop 0.046 100 0.0043 9.4Diclofop-methyl 0.063 117 0.0042 5.8Dinoseb 0.063 44 0.0052 19 NIoxynil 0.042 98 0.0020 4.9 IMCPA 0.083 97 0.0072 8.9MCPP 0.083 100 0.0092 114-Nitrophenol 0.073 58 0.0072 17 NPCP2 0.021 112 0.0022 9.6Picloram 0.042 22 0.0013 14Silvex 0.033 95 0.0032 102,4,5-T 0.033 115 0.0058 152,4,5-TB 0.038 111 0.0022 5.32,4,5-TCP 0.025 106 0.0064 242,4,6-TCP 0.025 112 0.0062 222,3,4,5-TCP 0.023 113 0.0069 262,3,4,6-TCP 0.023 118 0.0058 21Triclopyr2 0.035 94 0.0029 8.9
1Data based on 7 replicate spikes utilizing a 3-L sample with 0.25-mL extract volume and a 3-µL injection.2Recoveries for these compounds are based upon CIC calculations using seven compounds for the AERF: 2,5-Dichlorobenzonate, MCPP, MCPA, dichlorprop, silvex, 2,4,5-T and diclofop-methyl in the initial calibration standard.3For all other analytes the quantitation element was chlorine.These data are provided for guidance purposes only.
8085 - 35 Revision 0February 2007
TABLE 8
EXAMPLE RETENTION TIMES AND ELEMENTAL PERCENTAGES FOR ORGANONITROGEN PESTICIDES
Analyte DB-5 RT DB-17 RTConc.
(ng/µL)Elemental Percentages
C S N Cl P O F OtherNitrogen-containing mix #1Dichlobenil 8.19 9.44 10.0 48.8 8.15 41.2Tebuthiuron 10.93 13.00 7.5 47.3 18.7 24.6Propachlor 12.72 13.96 12.0 62.4 6.62 16.7 7.56Ethalfluralin 13.75 12.19 7.50 46.8 12.6 19.2 17.1Trifluralin 14.09 12.24 7.50 46.5 12.5 19.1 17.0Simazine 15.11 17.06 5.00 41.6 34.7 17.6Atrazine 15.34 16.79 5.00 44.5 32.5 16.4Pronamide 16.04 15.97 20.0 56.2 5.47 24.7 6.25Terbacil 16.62 19.10 15.0 49.8 12.9 16.4 14.8Metribuzin 17.82 20.23 5.00 44.8 15.0 26.2 7.47Alachlor 18.45 19.06 18.0 62.3 5.19 13.1 11.9Prometryn 18.64 19.78 5.00 49.7 13.3 29.0Bromacil 19.31 22.39 20.0 41.3 10.7 12.3 30.6 BrMetolachlor 19.83 20.22 20.0 63.4 4.94 12.5 11.3Diphenamid 20.68 23.30 15.0 80.2 5.85 6.69Pendimethalin 21.25 21.48 7.50 55.4 14.9 22.7Napropamide 23.04 24.42 15.0 75.2 5.16 11.8Oxyfluorfen 24.01 23.83 20.0 49.8 3.87 9.8 17.7 15.8Norflurazon 26.34 28.40 10.0 47.4 13.8 11.7 5.27 18.8Fluridone 33.61 35.05 30.0 69.2 4.25 4.86 17.3
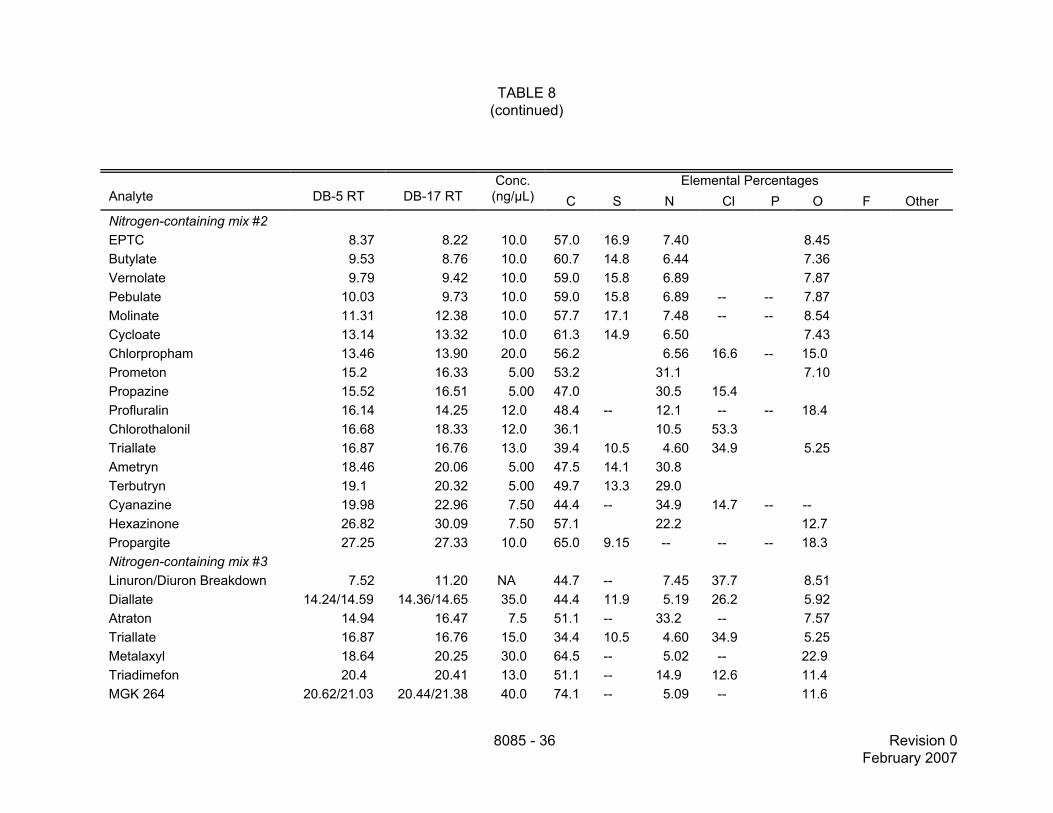
TABLE 8(continued)
Analyte DB-5 RT DB-17 RTConc.
(ng/µL)Elemental Percentages
C S N Cl P O F Other
8085 - 36 Revision 0February 2007
Nitrogen-containing mix #2EPTC 8.37 8.22 10.0 57.0 16.9 7.40 8.45Butylate 9.53 8.76 10.0 60.7 14.8 6.44 7.36Vernolate 9.79 9.42 10.0 59.0 15.8 6.89 7.87Pebulate 10.03 9.73 10.0 59.0 15.8 6.89 -- -- 7.87Molinate 11.31 12.38 10.0 57.7 17.1 7.48 -- -- 8.54Cycloate 13.14 13.32 10.0 61.3 14.9 6.50 7.43Chlorpropham 13.46 13.90 20.0 56.2 6.56 16.6 -- 15.0Prometon 15.2 16.33 5.00 53.2 31.1 7.10Propazine 15.52 16.51 5.00 47.0 30.5 15.4Profluralin 16.14 14.25 12.0 48.4 -- 12.1 -- -- 18.4Chlorothalonil 16.68 18.33 12.0 36.1 10.5 53.3Triallate 16.87 16.76 13.0 39.4 10.5 4.60 34.9 5.25Ametryn 18.46 20.06 5.00 47.5 14.1 30.8Terbutryn 19.1 20.32 5.00 49.7 13.3 29.0Cyanazine 19.98 22.96 7.50 44.4 -- 34.9 14.7 -- --Hexazinone 26.82 30.09 7.50 57.1 22.2 12.7Propargite 27.25 27.33 10.0 65.0 9.15 -- -- -- 18.3Nitrogen-containing mix #3Linuron/Diuron Breakdown 7.52 11.20 NA 44.7 -- 7.45 37.7 8.51Diallate 14.24/14.59 14.36/14.65 35.0 44.4 11.9 5.19 26.2 5.92Atraton 14.94 16.47 7.5 51.1 -- 33.2 -- 7.57Triallate 16.87 16.76 15.0 34.4 10.5 4.60 34.9 5.25Metalaxyl 18.64 20.25 30.0 64.5 -- 5.02 -- 22.9Triadimefon 20.4 20.41 13.0 51.1 -- 14.9 12.6 11.4MGK 264 20.62/21.03 20.44/21.38 40.0 74.1 -- 5.09 -- 11.6

TABLE 8(continued)
Analyte DB-5 RT DB-17 RTConc.
(ng/µL)Elemental Percentages
C S N Cl P O F Other
8085 - 37 Revision 0February 2007
Diuron 21.45 16.63 30.0 46.6 -- 12.1 30.6 6.90Butachlor 22.82 22.39 30.0 65.4 -- 4.49 11.4 10.3Carboxin 23.76 26.39 30.0 61.2 13.6 5.95 -- 13.6Hexazinone 26.82 30.09 7.50 57.1 -- 22.2 -- 12.7Fenarimol 30.74 31.76 15.0 61.6 -- 8.47 21.4 4.83Carbon quantitated analytesResmethrin 27.55 27.49 10.0 78.0 -- -- -- 14.2Phenothrin 29.57 29.45 10.0 76.9 -- -- -- 15.4cis-Permethrin 31.82 31.89 10.0 64.4 -- -- 18.1 12.3Fenvalerate* (cis-trans) 33.82/34.09 33.82/34.07 20.0 71.4 -- 3.33 8.44 11.4
*The analyst may want to include these isomers in Chlorinated mix #3 (see Table 9).
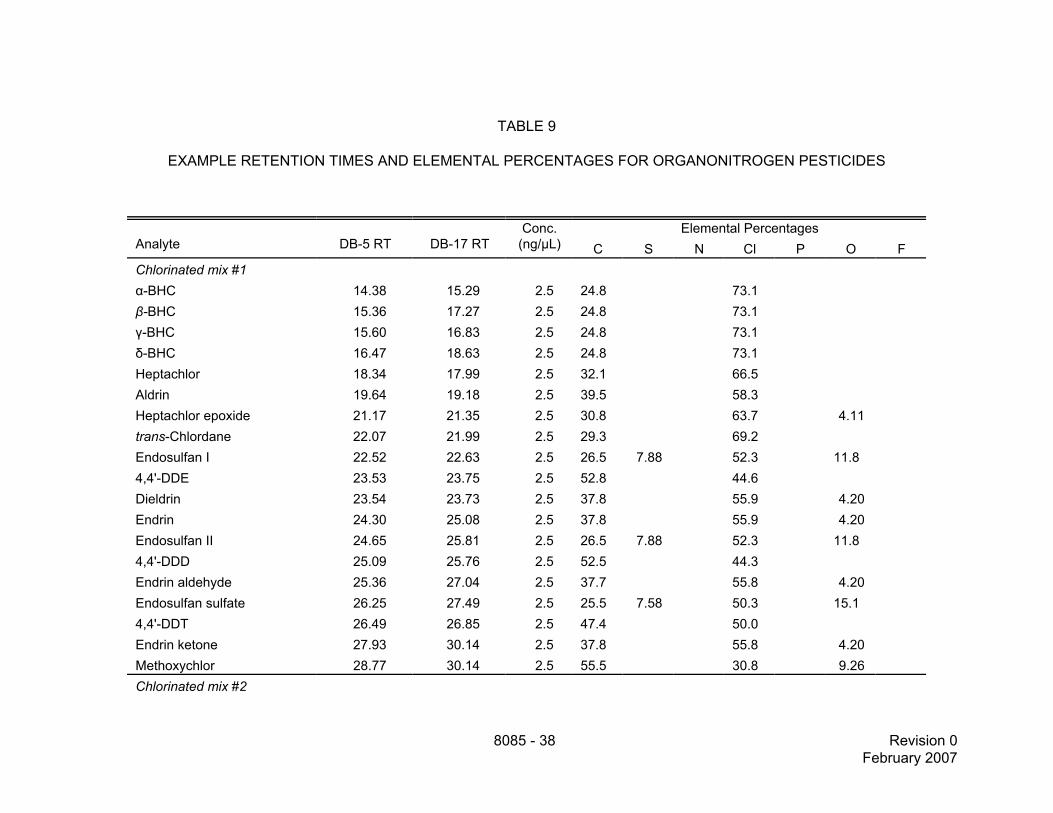
8085 - 38 Revision 0February 2007
TABLE 9
EXAMPLE RETENTION TIMES AND ELEMENTAL PERCENTAGES FOR ORGANONITROGEN PESTICIDES
Analyte DB-5 RT DB-17 RTConc.
(ng/µL)Elemental Percentages
C S N Cl P O FChlorinated mix #1α-BHC 14.38 15.29 2.5 24.8 73.1β-BHC 15.36 17.27 2.5 24.8 73.1γ-BHC 15.60 16.83 2.5 24.8 73.1δ-BHC 16.47 18.63 2.5 24.8 73.1Heptachlor 18.34 17.99 2.5 32.1 66.5Aldrin 19.64 19.18 2.5 39.5 58.3Heptachlor epoxide 21.17 21.35 2.5 30.8 63.7 4.11trans-Chlordane 22.07 21.99 2.5 29.3 69.2Endosulfan I 22.52 22.63 2.5 26.5 7.88 52.3 11.84,4'-DDE 23.53 23.75 2.5 52.8 44.6Dieldrin 23.54 23.73 2.5 37.8 55.9 4.20Endrin 24.30 25.08 2.5 37.8 55.9 4.20Endosulfan II 24.65 25.81 2.5 26.5 7.88 52.3 11.84,4'-DDD 25.09 25.76 2.5 52.5 44.3Endrin aldehyde 25.36 27.04 2.5 37.7 55.8 4.20Endosulfan sulfate 26.25 27.49 2.5 25.5 7.58 50.3 15.14,4'-DDT 26.49 26.85 2.5 47.4 50.0Endrin ketone 27.93 30.14 2.5 37.8 55.8 4.20Methoxychlor 28.77 30.14 2.5 55.5 30.8 9.26Chlorinated mix #2

TABLE 9(continued)
Analyte DB-5 RT DB-17 RTConc.
(ng/µL)Elemental Percentages
C S N Cl P O F
8085 - 39 Revision 0February 2007
Pentachloroanisole 14.80 14.85 2.5 30.0 63.2 5.71α-Chlordene 18.59 18.51 2.5 35.4 62.8γ-Chlordene 18.69 20.09 2.5 35.4 62.84,4'-DDMU 22.17 22.48 2.5 59.2 37.5cis-Chlordane 22.66 22.60 2.5 29.3 69.2cis-Nonachlor 25.20 25.21 2.5 27.0 71.8Chlorinated mix #3Hexachlorobenzene 14.68 14.45 2.5 25.3 74.7Dicofol breakdown 20.03 21.01 NA 62.1 28.2 6.37Captan 21.42 24.25 6.75 35.9 10.7 4.66 35.4 10.62,4'-DDE 22.33 22.85 2.5 52.8 44.6trans-Nonachlor 22.86 22.09 2.5 27.0 71.82,4'-DDD 23.84 24.67 2.5 52.5 44.32,4'’-DDT 25.21 25.71 2.5 47.4 50.0Captafol 27.17 29.69 12.5 34.4 9.18 4.01 40.6 9.17Dicofol 28.62 29.34 10 45.3 47.8 4.32Mirex 30.05 29.76 2.5 22.0 78.0
Retention times are for illustrative purposes only.
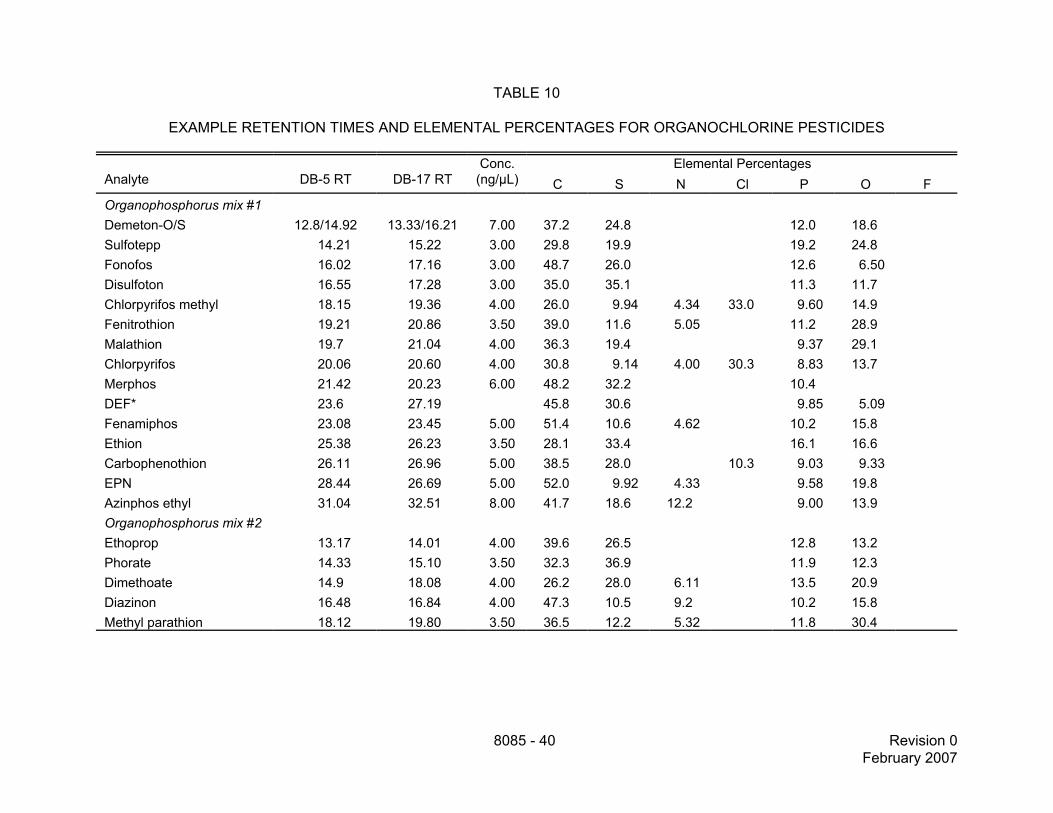
8085 - 40 Revision 0February 2007
TABLE 10
EXAMPLE RETENTION TIMES AND ELEMENTAL PERCENTAGES FOR ORGANOCHLORINE PESTICIDES
Analyte DB-5 RT DB-17 RTConc.
(ng/µL)Elemental Percentages
C S N Cl P O FOrganophosphorus mix #1Demeton-O/S 12.8/14.92 13.33/16.21 7.00 37.2 24.8 12.0 18.6Sulfotepp 14.21 15.22 3.00 29.8 19.9 19.2 24.8Fonofos 16.02 17.16 3.00 48.7 26.0 12.6 6.50Disulfoton 16.55 17.28 3.00 35.0 35.1 11.3 11.7Chlorpyrifos methyl 18.15 19.36 4.00 26.0 9.94 4.34 33.0 9.60 14.9Fenitrothion 19.21 20.86 3.50 39.0 11.6 5.05 11.2 28.9Malathion 19.7 21.04 4.00 36.3 19.4 9.37 29.1Chlorpyrifos 20.06 20.60 4.00 30.8 9.14 4.00 30.3 8.83 13.7Merphos 21.42 20.23 6.00 48.2 32.2 10.4DEF* 23.6 27.19 45.8 30.6 9.85 5.09Fenamiphos 23.08 23.45 5.00 51.4 10.6 4.62 10.2 15.8Ethion 25.38 26.23 3.50 28.1 33.4 16.1 16.6Carbophenothion 26.11 26.96 5.00 38.5 28.0 10.3 9.03 9.33EPN 28.44 26.69 5.00 52.0 9.92 4.33 9.58 19.8Azinphos ethyl 31.04 32.51 8.00 41.7 18.6 12.2 9.00 13.9Organophosphorus mix #2Ethoprop 13.17 14.01 4.00 39.6 26.5 12.8 13.2Phorate 14.33 15.10 3.50 32.3 36.9 11.9 12.3Dimethoate 14.9 18.08 4.00 26.2 28.0 6.11 13.5 20.9Diazinon 16.48 16.84 4.00 47.3 10.5 9.2 10.2 15.8Methyl parathion 18.12 19.80 3.50 36.5 12.2 5.32 11.8 30.4
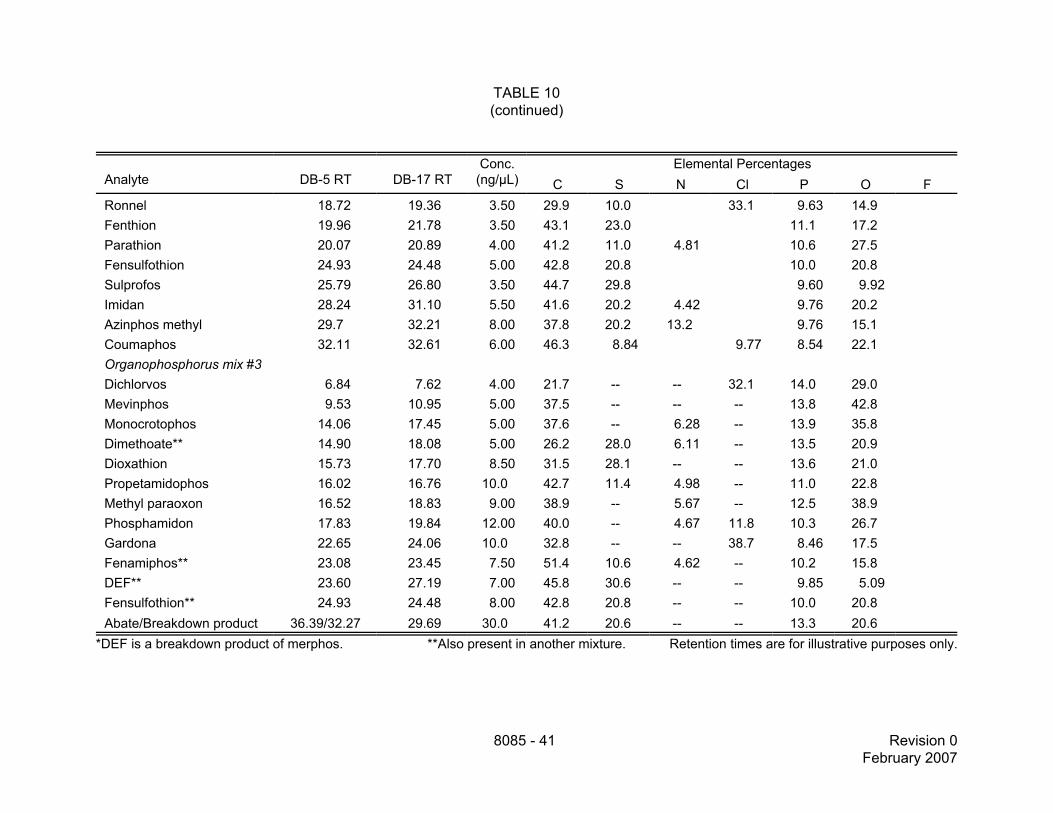
TABLE 10(continued)
Analyte DB-5 RT DB-17 RTConc.
(ng/µL)Elemental Percentages
C S N Cl P O F
8085 - 41 Revision 0February 2007
Ronnel 18.72 19.36 3.50 29.9 10.0 33.1 9.63 14.9Fenthion 19.96 21.78 3.50 43.1 23.0 11.1 17.2Parathion 20.07 20.89 4.00 41.2 11.0 4.81 10.6 27.5Fensulfothion 24.93 24.48 5.00 42.8 20.8 10.0 20.8Sulprofos 25.79 26.80 3.50 44.7 29.8 9.60 9.92Imidan 28.24 31.10 5.50 41.6 20.2 4.42 9.76 20.2Azinphos methyl 29.7 32.21 8.00 37.8 20.2 13.2 9.76 15.1Coumaphos 32.11 32.61 6.00 46.3 8.84 9.77 8.54 22.1Organophosphorus mix #3Dichlorvos 6.84 7.62 4.00 21.7 -- -- 32.1 14.0 29.0Mevinphos 9.53 10.95 5.00 37.5 -- -- -- 13.8 42.8Monocrotophos 14.06 17.45 5.00 37.6 -- 6.28 -- 13.9 35.8Dimethoate** 14.90 18.08 5.00 26.2 28.0 6.11 -- 13.5 20.9Dioxathion 15.73 17.70 8.50 31.5 28.1 -- -- 13.6 21.0Propetamidophos 16.02 16.76 10.0 42.7 11.4 4.98 -- 11.0 22.8Methyl paraoxon 16.52 18.83 9.00 38.9 -- 5.67 -- 12.5 38.9Phosphamidon 17.83 19.84 12.00 40.0 -- 4.67 11.8 10.3 26.7Gardona 22.65 24.06 10.0 32.8 -- -- 38.7 8.46 17.5Fenamiphos** 23.08 23.45 7.50 51.4 10.6 4.62 -- 10.2 15.8DEF** 23.60 27.19 7.00 45.8 30.6 -- -- 9.85 5.09Fensulfothion** 24.93 24.48 8.00 42.8 20.8 -- -- 10.0 20.8Abate/Breakdown product 36.39/32.27 29.69 30.0 41.2 20.6 -- -- 13.3 20.6
*DEF is a breakdown product of merphos. **Also present in another mixture. Retention times are for illustrative purposes only.
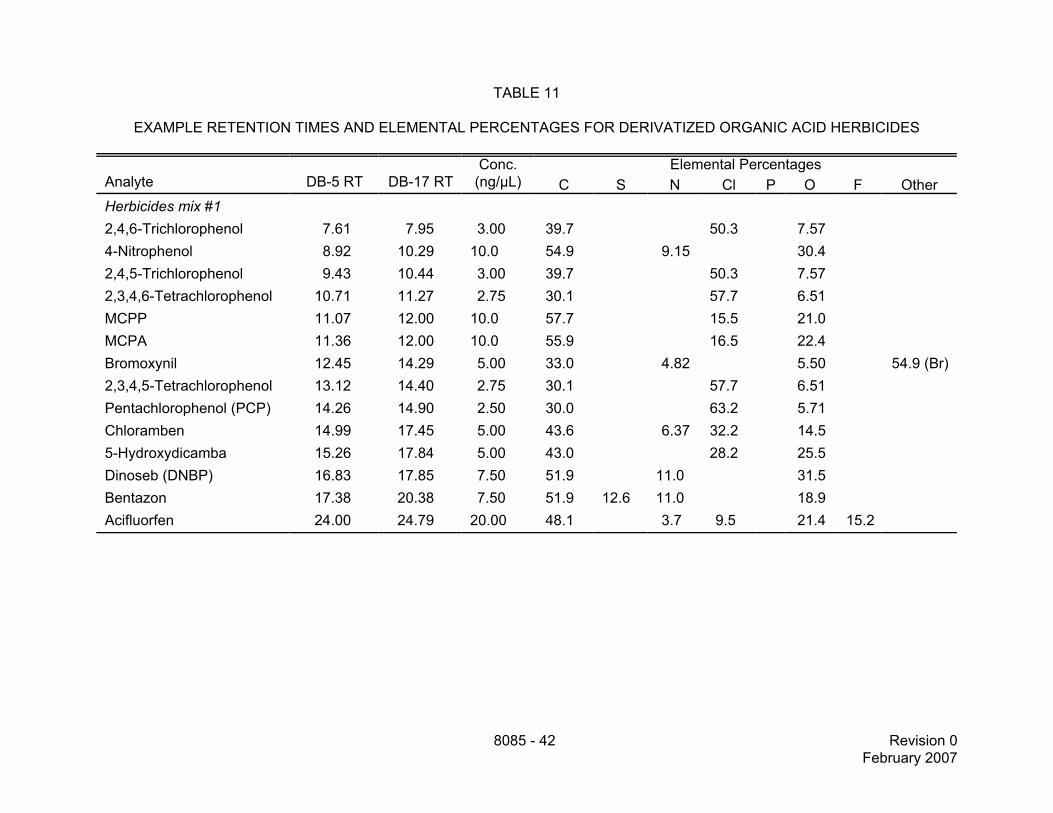
8085 - 42 Revision 0February 2007
TABLE 11
EXAMPLE RETENTION TIMES AND ELEMENTAL PERCENTAGES FOR DERIVATIZED ORGANIC ACID HERBICIDES
Analyte DB-5 RT DB-17 RTConc.
(ng/µL)Elemental Percentages
C S N Cl P O F OtherHerbicides mix #12,4,6-Trichlorophenol 7.61 7.95 3.00 39.7 50.3 7.574-Nitrophenol 8.92 10.29 10.0 54.9 9.15 30.42,4,5-Trichlorophenol 9.43 10.44 3.00 39.7 50.3 7.572,3,4,6-Tetrachlorophenol 10.71 11.27 2.75 30.1 57.7 6.51MCPP 11.07 12.00 10.0 57.7 15.5 21.0MCPA 11.36 12.00 10.0 55.9 16.5 22.4Bromoxynil 12.45 14.29 5.00 33.0 4.82 5.50 54.9 (Br)2,3,4,5-Tetrachlorophenol 13.12 14.40 2.75 30.1 57.7 6.51Pentachlorophenol (PCP) 14.26 14.90 2.50 30.0 63.2 5.71Chloramben 14.99 17.45 5.00 43.6 6.37 32.2 14.55-Hydroxydicamba 15.26 17.84 5.00 43.0 28.2 25.5Dinoseb (DNBP) 16.83 17.85 7.50 51.9 11.0 31.5Bentazon 17.38 20.38 7.50 51.9 12.6 11.0 18.9Acifluorfen 24.00 24.79 20.00 48.1 3.7 9.5 21.4 15.2
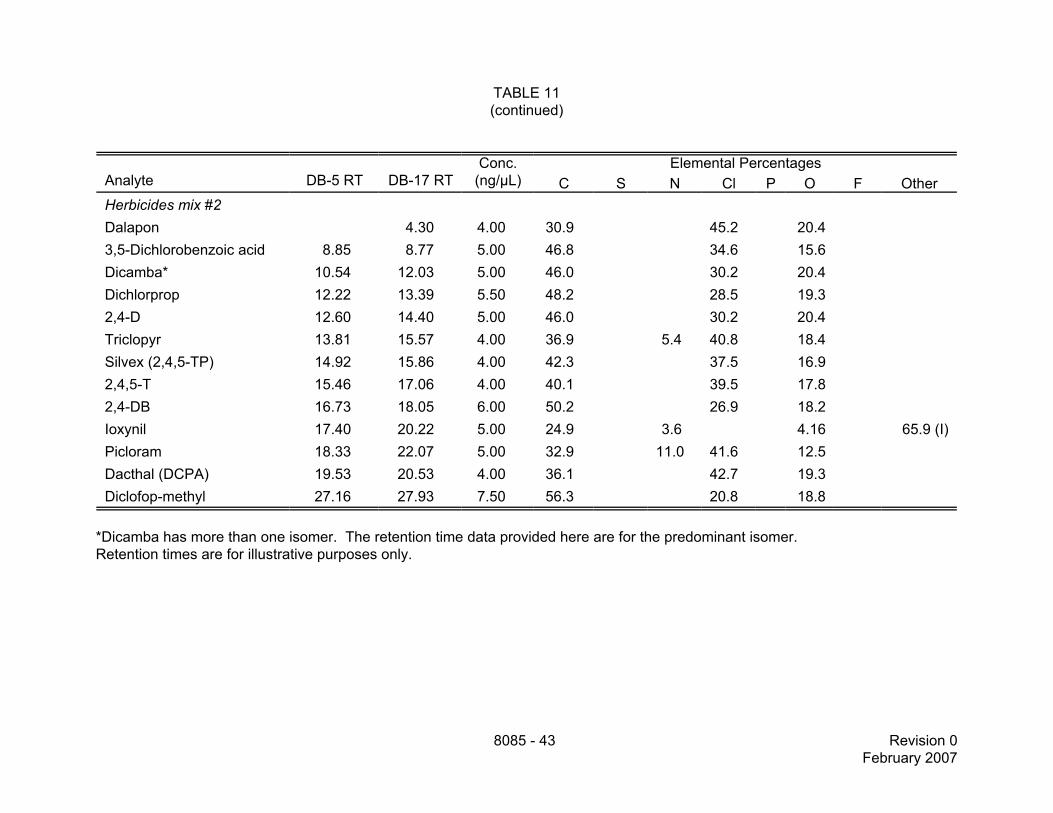
TABLE 11(continued)
Analyte DB-5 RT DB-17 RTConc.
(ng/µL)Elemental Percentages
C S N Cl P O F Other
8085 - 43 Revision 0February 2007
Herbicides mix #2Dalapon 4.30 4.00 30.9 45.2 20.43,5-Dichlorobenzoic acid 8.85 8.77 5.00 46.8 34.6 15.6Dicamba* 10.54 12.03 5.00 46.0 30.2 20.4Dichlorprop 12.22 13.39 5.50 48.2 28.5 19.32,4-D 12.60 14.40 5.00 46.0 30.2 20.4Triclopyr 13.81 15.57 4.00 36.9 5.4 40.8 18.4Silvex (2,4,5-TP) 14.92 15.86 4.00 42.3 37.5 16.92,4,5-T 15.46 17.06 4.00 40.1 39.5 17.82,4-DB 16.73 18.05 6.00 50.2 26.9 18.2Ioxynil 17.40 20.22 5.00 24.9 3.6 4.16 65.9 (I)Picloram 18.33 22.07 5.00 32.9 11.0 41.6 12.5Dacthal (DCPA) 19.53 20.53 4.00 36.1 42.7 19.3Diclofop-methyl 27.16 27.93 7.50 56.3 20.8 18.8
*Dicamba has more than one isomer. The retention time data provided here are for the predominant isomer.Retention times are for illustrative purposes only.
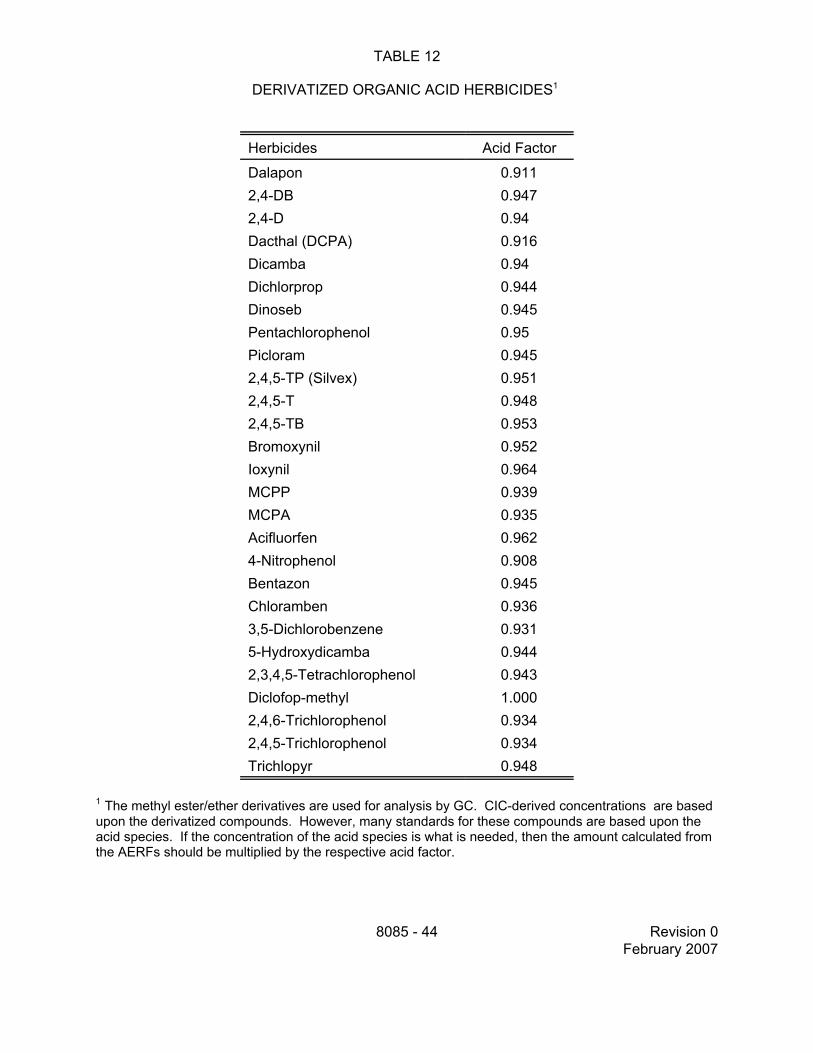
8085 - 44 Revision 0February 2007
TABLE 12
DERIVATIZED ORGANIC ACID HERBICIDES1
Herbicides Acid Factor
Dalapon 0.9112,4-DB 0.9472,4-D 0.94Dacthal (DCPA) 0.916Dicamba 0.94Dichlorprop 0.944Dinoseb 0.945Pentachlorophenol 0.95Picloram 0.9452,4,5-TP (Silvex) 0.9512,4,5-T 0.9482,4,5-TB 0.953Bromoxynil 0.952Ioxynil 0.964MCPP 0.939MCPA 0.935Acifluorfen 0.9624-Nitrophenol 0.908Bentazon 0.945Chloramben 0.9363,5-Dichlorobenzene 0.9315-Hydroxydicamba 0.9442,3,4,5-Tetrachlorophenol 0.943Diclofop-methyl 1.0002,4,6-Trichlorophenol 0.9342,4,5-Trichlorophenol 0.934Trichlopyr 0.948
1 The methyl ester/ether derivatives are used for analysis by GC. CIC-derived concentrations are basedupon the derivatized compounds. However, many standards for these compounds are based upon theacid species. If the concentration of the acid species is what is needed, then the amount calculated fromthe AERFs should be multiplied by the respective acid factor.
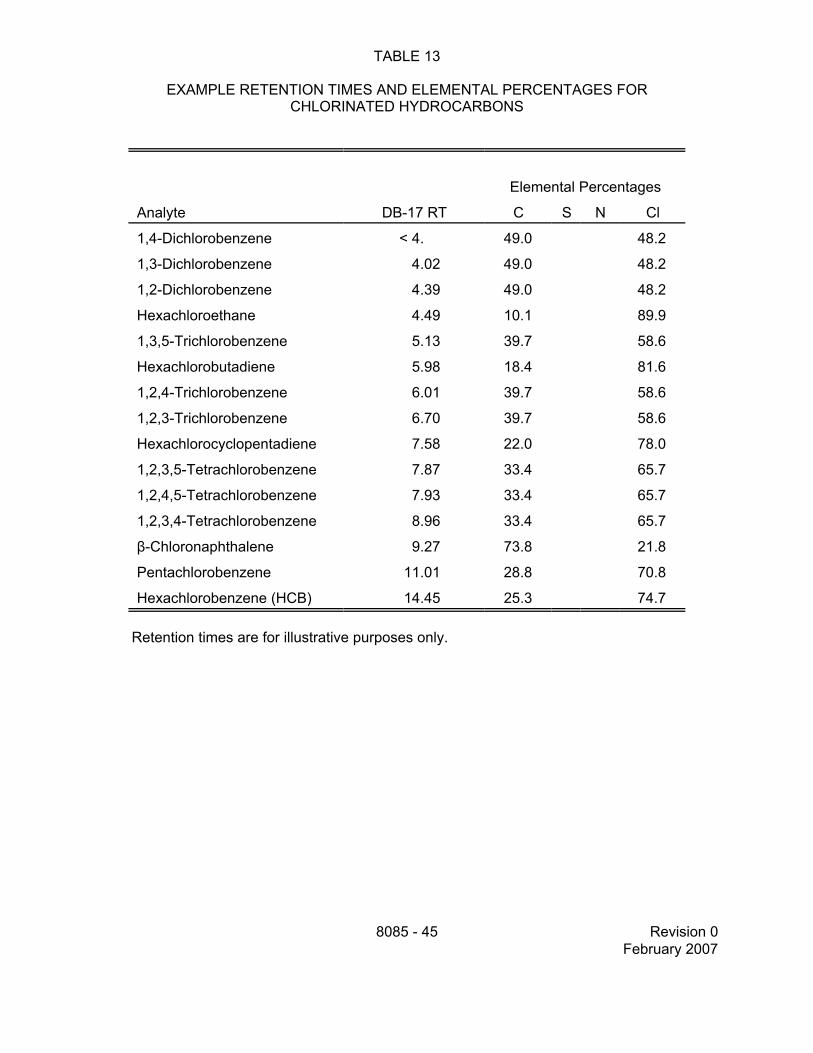
8085 - 45 Revision 0February 2007
TABLE 13
EXAMPLE RETENTION TIMES AND ELEMENTAL PERCENTAGES FORCHLORINATED HYDROCARBONS
Analyte DB-17 RT
Elemental Percentages
C S N Cl
1,4-Dichlorobenzene < 4. 49.0 48.2
1,3-Dichlorobenzene 4.02 49.0 48.2
1,2-Dichlorobenzene 4.39 49.0 48.2
Hexachloroethane 4.49 10.1 89.9
1,3,5-Trichlorobenzene 5.13 39.7 58.6
Hexachlorobutadiene 5.98 18.4 81.6
1,2,4-Trichlorobenzene 6.01 39.7 58.6
1,2,3-Trichlorobenzene 6.70 39.7 58.6
Hexachlorocyclopentadiene 7.58 22.0 78.0
1,2,3,5-Tetrachlorobenzene 7.87 33.4 65.7
1,2,4,5-Tetrachlorobenzene 7.93 33.4 65.7
1,2,3,4-Tetrachlorobenzene 8.96 33.4 65.7
β-Chloronaphthalene 9.27 73.8 21.8
Pentachlorobenzene 11.01 28.8 70.8
Hexachlorobenzene (HCB) 14.45 25.3 74.7
Retention times are for illustrative purposes only.
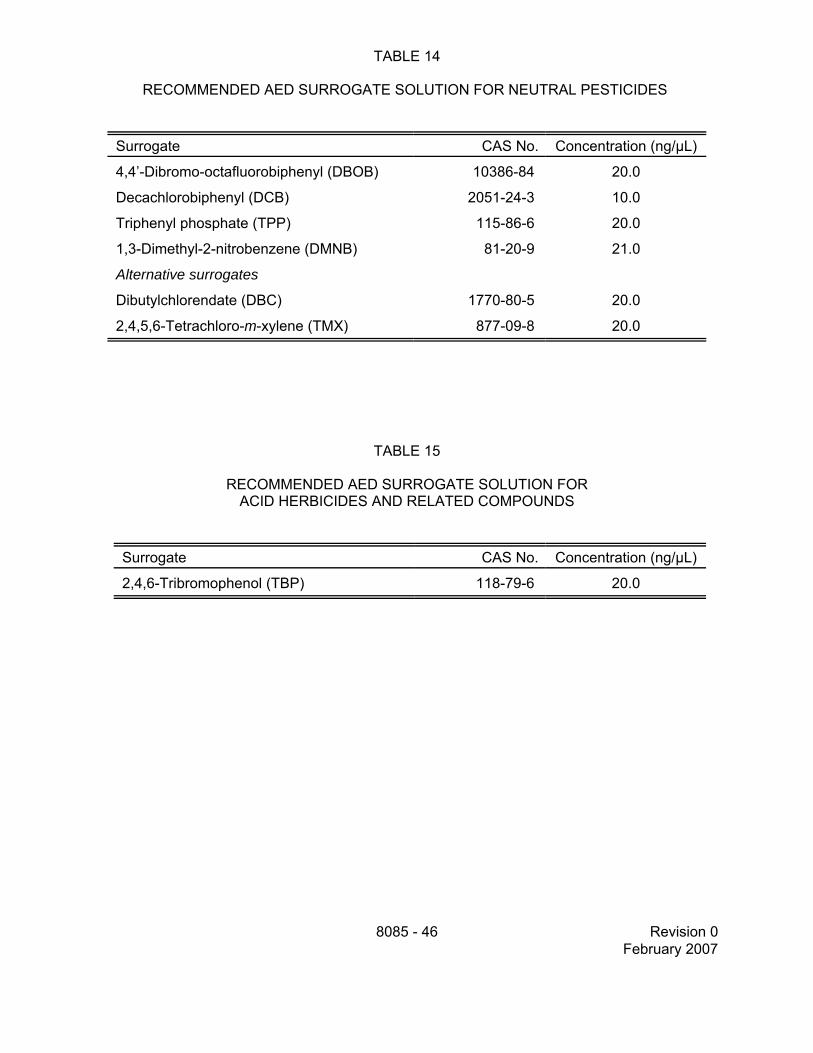
8085 - 46 Revision 0February 2007
TABLE 14
RECOMMENDED AED SURROGATE SOLUTION FOR NEUTRAL PESTICIDES
Surrogate CAS No. Concentration (ng/µL)
4,4’-Dibromo-octafluorobiphenyl (DBOB) 10386-84 20.0
Decachlorobiphenyl (DCB) 2051-24-3 10.0
Triphenyl phosphate (TPP) 115-86-6 20.0
1,3-Dimethyl-2-nitrobenzene (DMNB) 81-20-9 21.0
Alternative surrogates
Dibutylchlorendate (DBC) 1770-80-5 20.0
2,4,5,6-Tetrachloro-m-xylene (TMX) 877-09-8 20.0
TABLE 15
RECOMMENDED AED SURROGATE SOLUTION FORACID HERBICIDES AND RELATED COMPOUNDS
Surrogate CAS No. Concentration (ng/µL)
2,4,6-Tribromophenol (TBP) 118-79-6 20.0
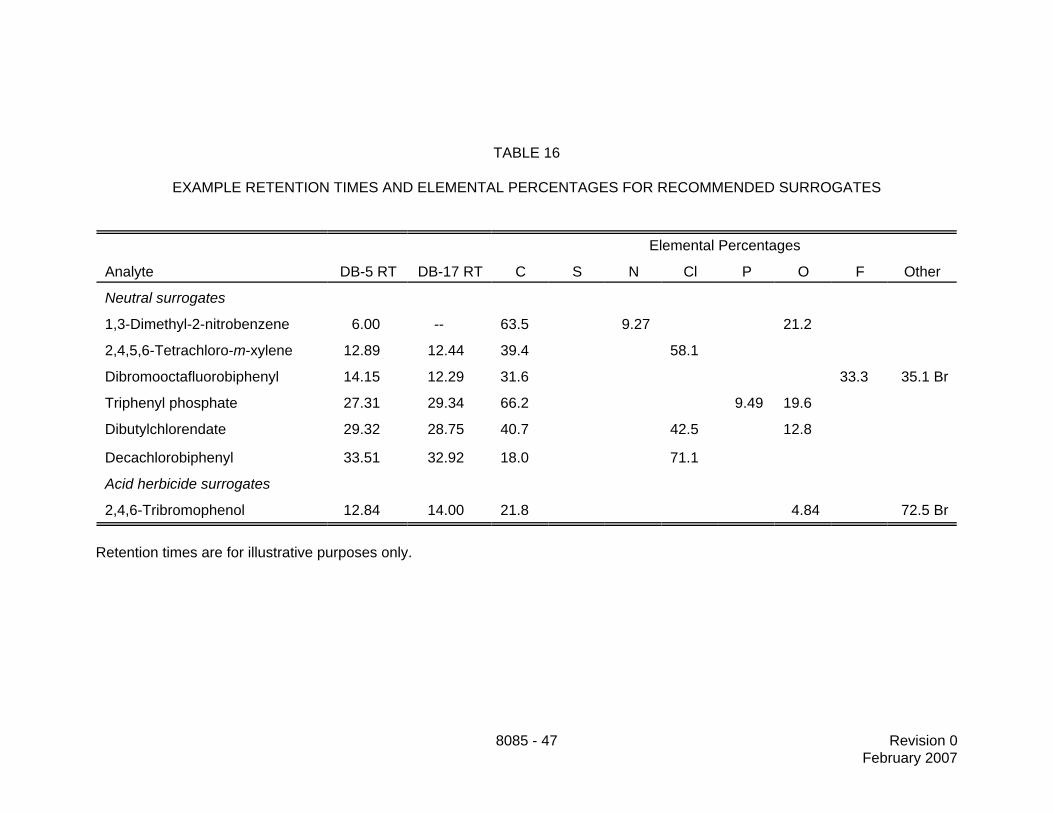
8085 - 47 Revision 0February 2007
TABLE 16
EXAMPLE RETENTION TIMES AND ELEMENTAL PERCENTAGES FOR RECOMMENDED SURROGATES
Analyte DB-5 RT DB-17 RT
Elemental Percentages
C S N Cl P O F Other
Neutral surrogates
1,3-Dimethyl-2-nitrobenzene 6.00 -- 63.5 9.27 21.2
2,4,5,6-Tetrachloro-m-xylene 12.89 12.44 39.4 58.1
Dibromooctafluorobiphenyl 14.15 12.29 31.6 33.3 35.1 Br
Triphenyl phosphate 27.31 29.34 66.2 9.49 19.6
Dibutylchlorendate 29.32 28.75 40.7 42.5 12.8
Decachlorobiphenyl 33.51 32.92 18.0 71.1
Acid herbicide surrogates
2,4,6-Tribromophenol 12.84 14.00 21.8 4.84 72.5 Br
Retention times are for illustrative purposes only.

8085 - 48 Revision 0February 2007
TABLE 17
RECOMMENDED COMPOUND-lNDEPENDENT CALIBRATION MIXTURES
AnalyteConc.*(pg/µL)
Elemental Percentages
Cl P S N Br I F
Chlorpyrifos 5680 30.3 8.82 9.15 3.99
Decachlorobiphenyl 492 71.1
Diazinon 9800 10.2 10.5 9.21
Dibromooctafluorobiphenyl 1000 35.1 33.3
Dichlobenil 6140 41.3 8.14
Ethoprop 391 12.8 26.4
Ioxynil (methyl ether) 500 66.0
Malathion 1070 9.37 19.4
Pentachloronitrobenzene 1690 60.1 4.74
Phorate 2100 11.9 36.9
Silvex (methyl ester) 400 37.6
Terbufos 7600 10.8 33.3
2,4,6-Tribromoanisole 2870 72.5
1,2,3-Trichlorobenzene 6810 58.7
Trifluralin 16000 12.5 17.0
*The concentration listed in this column is the total concentration of the analyte. Table 18contains the concentrations of each element in the analyte.
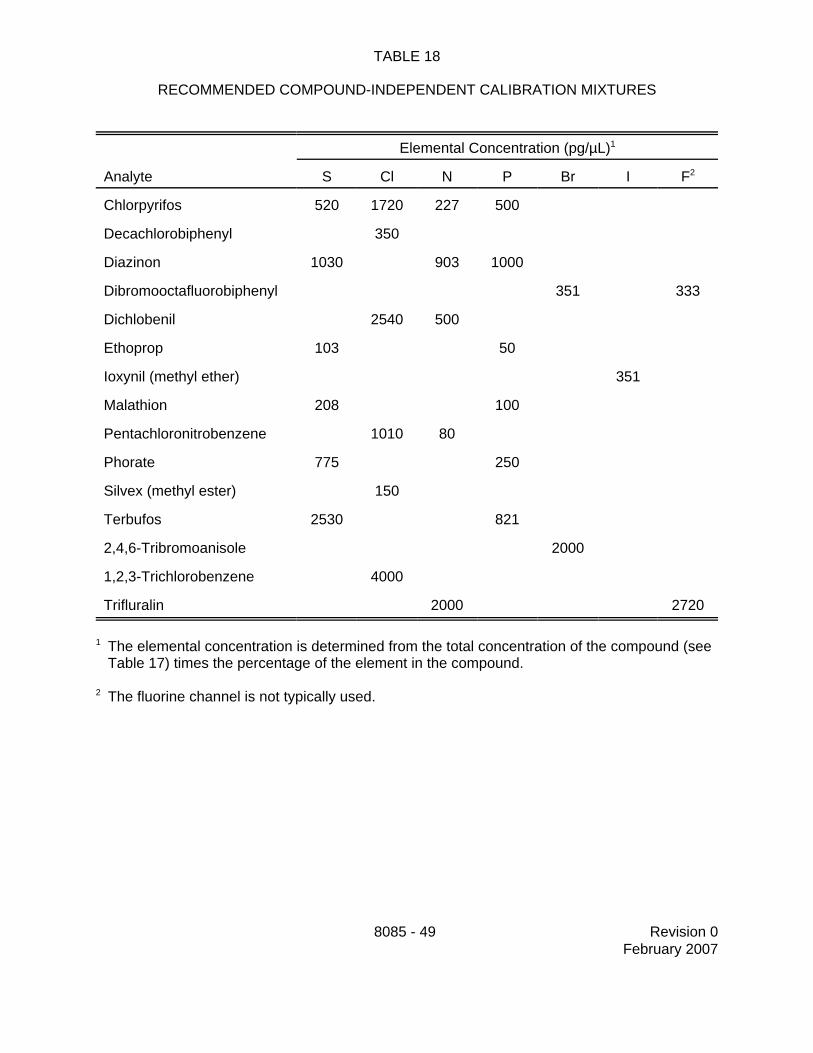
8085 - 49 Revision 0February 2007
TABLE 18
RECOMMENDED COMPOUND-INDEPENDENT CALIBRATION MIXTURES
Analyte
Elemental Concentration (pg/µL)1
S Cl N P Br I F2
Chlorpyrifos 520 1720 227 500
Decachlorobiphenyl 350
Diazinon 1030 903 1000
Dibromooctafluorobiphenyl 351 333
Dichlobenil 2540 500
Ethoprop 103 50
Ioxynil (methyl ether) 351
Malathion 208 100
Pentachloronitrobenzene 1010 80
Phorate 775 250
Silvex (methyl ester) 150
Terbufos 2530 821
2,4,6-Tribromoanisole 2000
1,2,3-Trichlorobenzene 4000
Trifluralin 2000 2720
1 The elemental concentration is determined from the total concentration of the compound (seeTable 17) times the percentage of the element in the compound.
2 The fluorine channel is not typically used.
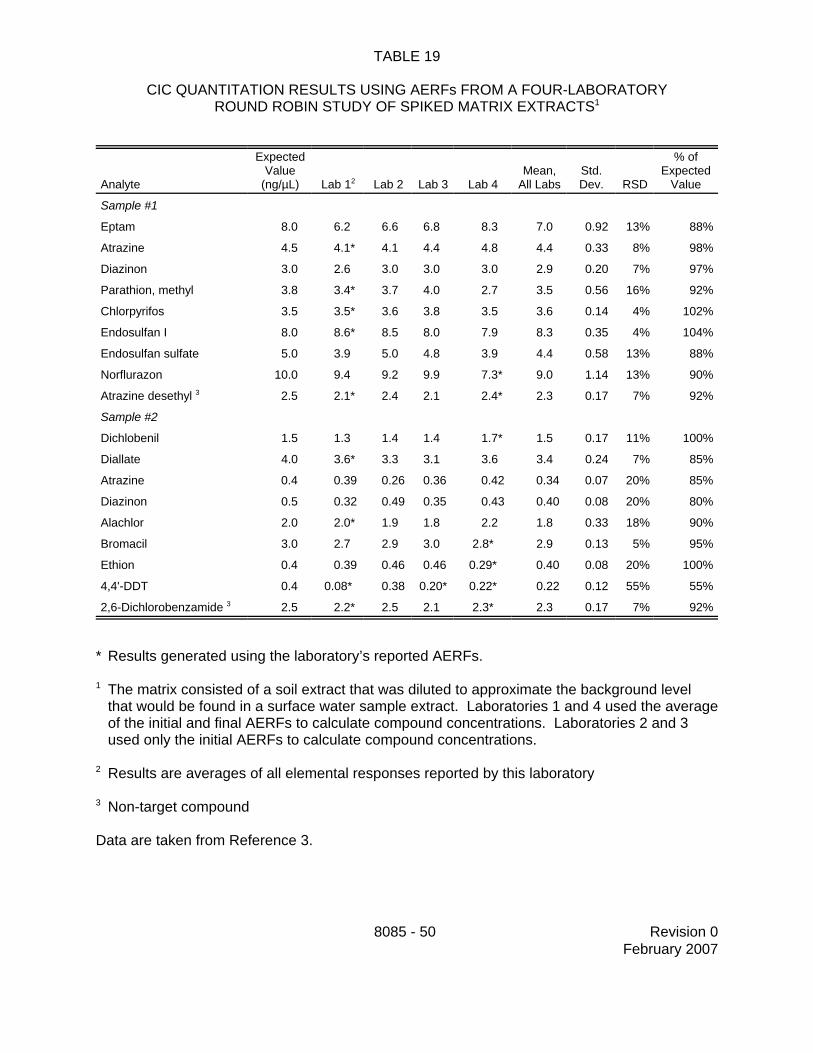
8085 - 50 Revision 0February 2007
TABLE 19
CIC QUANTITATION RESULTS USING AERFs FROM A FOUR-LABORATORYROUND ROBIN STUDY OF SPIKED MATRIX EXTRACTS1
Analyte
ExpectedValue
(ng/µL) Lab 12 Lab 2 Lab 3 Lab 4Mean,
All LabsStd.Dev. RSD
% ofExpected
Value
Sample #1
Eptam 8.0 6.2 6.6 6.8 8.3 7.0 0.92 13% 88%
Atrazine 4.5 4.1* 4.1 4.4 4.8 4.4 0.33 8% 98%
Diazinon 3.0 2.6 3.0 3.0 3.0 2.9 0.20 7% 97%
Parathion, methyl 3.8 3.4* 3.7 4.0 2.7 3.5 0.56 16% 92%
Chlorpyrifos 3.5 3.5* 3.6 3.8 3.5 3.6 0.14 4% 102%
Endosulfan I 8.0 8.6* 8.5 8.0 7.9 8.3 0.35 4% 104%
Endosulfan sulfate 5.0 3.9 5.0 4.8 3.9 4.4 0.58 13% 88%
Norflurazon 10.0 9.4 9.2 9.9 7.3* 9.0 1.14 13% 90%
Atrazine desethyl 3 2.5 2.1* 2.4 2.1 2.4* 2.3 0.17 7% 92%
Sample #2
Dichlobenil 1.5 1.3 1.4 1.4 1.7* 1.5 0.17 11% 100%
Diallate 4.0 3.6* 3.3 3.1 3.6 3.4 0.24 7% 85%
Atrazine 0.4 0.39 0.26 0.36 0.42 0.34 0.07 20% 85%
Diazinon 0.5 0.32 0.49 0.35 0.43 0.40 0.08 20% 80%
Alachlor 2.0 2.0* 1.9 1.8 2.2 1.8 0.33 18% 90%
Bromacil 3.0 2.7 2.9 3.0 2.8* 2.9 0.13 5% 95%
Ethion 0.4 0.39 0.46 0.46 0.29* 0.40 0.08 20% 100%
4,4'-DDT 0.4 0.08* 0.38 0.20* 0.22* 0.22 0.12 55% 55%
2,6-Dichlorobenzamide 3 2.5 2.2* 2.5 2.1 2.3* 2.3 0.17 7% 92%
* Results generated using the laboratory’s reported AERFs.
1 The matrix consisted of a soil extract that was diluted to approximate the background levelthat would be found in a surface water sample extract. Laboratories 1 and 4 used the averageof the initial and final AERFs to calculate compound concentrations. Laboratories 2 and 3used only the initial AERFs to calculate compound concentrations.
2 Results are averages of all elemental responses reported by this laboratory
3 Non-target compound
Data are taken from Reference 3.