swash mapping consolidated national...
TRANSCRIPT

School Water, Sanitation and Hygiene Mapping in Tanzania
Consolidated National Report
November 2010

SWASH Mapping Consolidated National Report
SWASH Mapping Consolidated National Report Page 2
Cover photo: Geodata

SWASH Mapping Consolidated National Report
SWASH Mapping Consolidated National Report Page 3
Acknowledgements
This consolidated report has been based on the 16 district reports and data collection supported by SNV (14 districts) and WaterAid (2 districts). The data collection including Mapping and Validations have been undertaken by Geodata, the Local Government Authorities, KADETFU, WEDECO, SNV and WaterAid. WaterAid undertook the data analysis and prepared the first drafts of the reports. The overall management of the process has been undertaken by SNV with the support of WaterAid and UNICEF. Sincere thanks to the Officers of the 16 District Councils of Bagamoyo, Chamwino, Hai, Kahama, Kasulu, Kibondo, Kigoma, Magu, Makete, Maswa, Morogoro Rural, Mtwara, Ngara, Siha, Singida Urban, Temeke for accepting the piloting exercise to be conducted. Their positive collaboration and support during the Mapping Exercise and Validation and Inquiry Exercise together with their front line position in the preparation of the stakeholders’ feedback meeting were both highly valued. Particular thanks are also given to the Teachers, School Committees and school children who collaborated fully and provided valuable inputs during both the Mapping and the Validation and Inquiry Process. Acknowledgement and appreciation is given to the Ministry of Education and Vocational Training (MOEVT), Ministry of Health and Social Welfare (MOHSW), Prime Minister’s Office - Regional Administration and Local Government (PMO – RALG), and the Ministry of Water and Irrigation (MOWI), for their cooperation, positive contributions and support during the School WASH mapping of 16 Districts, and in particular for their involvement in the District Feedback Meetings. Sincere appreciation goes to GeoData for their valuable technical competencies in carrying out the School WaSH Mapping in all private and government pre-primary schools, primary schools, and secondary schools in the District. Appreciation also goes to the local capacity building organizations, KADETFU and WEDECO who also conducted some of the Validation and Inquiry exercises. It is hoped that the results from the School WASH Mapping, which has provided a detailed picture of the School, Water, Sanitation and Hygiene situation in Tanzania, will provide a valuable tool for District Officials and the Government of Tanzania as well as other sector actors, to be able to better advocate for increased resources for the sector and to plan for improved child and girl friendly, accessible and sustainable school WASH across Tanzania.

SWASH Mapping Consolidated National Report
SWASH Mapping Consolidated National Report Page 4

SWASH Mapping Consolidated National Report
SWASH Mapping Consolidated National Report Page 5
The benefits of water, sanitation and hygiene (WASH) in schools
Increased cognitive function and attention—due to reduced health problems, hydration and nutrition; increased wellbeing for girls, in particular, who may be concerned over where to go to the toilet or how to manage menstruation.
Reduced days missed from school—due to a reduction in WASH related diseases and infections such as diarrhoea, worms, schistosomiasis, or urinary tract infections. Emerging evidence suggests a correlation between girls’ attendance at school and adequate facilities to deal with girls’ hygiene needs, in particular during menstruation.
More time on the learning task—due to access to safe water and sanitation on site. Schools which lack access to water result in children carrying water long distances to school, thereby reducing actual class teaching time and /or fatiguing the children with a resulting negative impact on learning.
Increased dignity and safety particularly for girls and for people with disabilities—Accessible design and construction of facilities, appropriately sited latrines, segregated by sex, result in increased privacy and reduced risk of sexual harassment.
More effective school feeding programmes—Better hygiene and access to clean drinking water can result in increased nutritional benefit.
Keeping teachers in more remote schools – Through adequate water and sanitation facilities at the school.
Transformed society that has adopted good hygiene behaviours – As children who learn good practices at school become the adults of tomorrow
SWASH Mapping Consolidated National Report
SWASH Mapping Consolidated National Report Page 6

SWASH Mapping Consolidated National Report
SWASH Mapping Consolidated National Report Page 7
Executive Summary
Context In Tanzania, more children than ever before are attending school. This is the result of a number of successful policy initiatives, most notably the abolition of school fees in 2002 and the Primary and Secondary Education Programmes. The number of primary schools increased from 11,873 in 2001 to 14,700 in 2006. The rapid increase in enrolment has put pressure on overstretched educational infrastructure – including water supply and sanitation - and human resource capacity. Despite the success in increasing enrolment, drop-out rates remain high and completion rates remain low. There is an urgent need to focus on providing quality education and retaining pupils, especially girls. The drop-out rate in Tanzania is high, standing at about 33 percent, with significantly higher rates of drop out for girls1. The reasons for poor retention are many but international research suggests that inadequate water supply, sanitation and hygiene facilities play a role. A recent report estimates that in Sub-Saharan Africa half of all girls who drop out of school do so because of lack of adequate water and sanitation facilities (Tearfund, 2008). A further 10% of school-age girls do not attend school during menstruation (Tearfund, 2008). School water supply, sanitation and hygiene contribute to the quality of children's learning and school experiences in many ways: improving cognitive function and attention; reducing days missed from school; providing more time on the learning task; and increasing dignity and safety. The School WASH Mapping Exercise This report presents the findings of an exercise to map water supply, sanitation and hygiene (WASH) in every school in 16 districts in Tanzania (Bagamoyo, Chamwino, Hai, Kahama, Kasulu, Kibondo, Kigoma, Magu, Makete, Maswa, Morogoro Rural, Mtwara, Ngara, Siha, Singida Urban, Temeke). Data on the current status of school WASH (available through the Basic Education Statistics for Tanzania) is limited and does not provide any picture of the variations between schools or the condition of the school WASH facilities. SNV identified the poor situation of WASH in schools and proposed this mapping research. They started working with WaterAid and UNICEF in order to better understand the extent of the problem do that it might inform policy making and resource allocation. In the sixteen survey districts, a total of 2,697 schools were mapped, of which 22 (less than 1%) are pre-schools, 2,164 (80%) are primary schools (some including a pre-school class) and 511 (19%) are secondary schools. The results of the mapping exercise are summarised in the following tables.
1 More girls drop out in proportion to boys as they progress up the academic years (i.e. more girls have
dropped out in standard VII than in standard V).

SWASH Mapping Consolidated National Report
SWASH Mapping Consolidated National Report Page 8
Overview of the current situation of SWASH in Schools in 16 districts in Tanzania
Latrine numbers and types
Categorisation number of schools percentage
Latrine numbers
Meeting "minimum standards" 299 11%
Halfway to "minimum standards" 673 25%
less than 100 pupils per DH 989 37%
101-200 pupils per DH 470 17%
over 200 pupils per DH 92 3%
no latrines 174 6%
Type of latrine
Dry compost 10 0.4%
VIP 613 23%
Pit latrine with slab 1,488 57%
Pour flush 237 9%
Traditional pit latrine 259 10%
Others 19 0.7%
Construction material for the superstructure
Burnt bricks 891 34%
Cement 1,349 52%
Concrete blocks 174 7%
Mud 59 2%
Thatch / grass 82 3%
Other 47 2%
Quality of latrine facilities
Categorisation number of schools percentage
Disposal of hygiene pads available? Yes 833 37%
No 1,412 63%
Suitable for disabled? Suitable 95 4%
Not suitable 2,577 96%
Doors available (girls) Yes 1,069 48%
No 1,160 52%
Doors available (boys) Yes 1,004 45%
No 1,221 55%
Latrine status
Clean 183 9%
Smelly 1,804 88%
Soiled 72 3%
Hand-washing facilities
Categorisation number of schools percentage
Type of facility
Wash basin 57 2%
Stand pipe 175 7%
Fixed container 185 7%
None 2,268 84%
Water for hand-washing
Enough 209 8%
Insufficient 166 6%
None 2,322 86%
Soap available? Yes 36 1%
No 2,661 99%

SWASH Mapping Consolidated National Report
SWASH Mapping Consolidated National Report Page 9
Water supply
Categorisation number of schools percentage
Type of source
Piped 821 30%
Hand-drilled tube well 249 9%
Shallow well 128 5%
Rainwater harvesting 469 17%
Other / none 1,030 38%
Location On school premises 1,308 68%
Outside school premises 616 32%
Functionality Functional 1,132 54%
Non-functional 975 46%
Operation and maintenance and school clubs
Toilet Cleaners Cleaning schedule? School Health / Environment Club
Hired Labour Pupils Yes No Yes No No data
Pre-school 71% 29% 68% 32% 36% 59% 5%
Primary 2% 98% 97% 3% 49% 45% 6%
Secondary 3% 97% 98% 2% 45% 46% 9%
Private 37% 63% 89% 11% 48% 48% 4%
Public 0% 100% 98% 2% 49% 45% 7%
Total 2% 98% 97% 3% 48% 45% 6%
Hygiene education
Teaching of WASH at school Teacher trained in hygiene
education? Teaching materials available
Yes No No data Yes No No data Yes No No data
Pre-school only
95% 5% 0% 36% 64% 0% 68% 32% 0%
Primary 82% 1% 17% 26% 57% 17% 76% 6% 17%
Secondary 76% 7% 17% 14% 69% 17% 66% 17% 17%
Private 84% 5% 11% 31% 58% 11% 76% 13% 11%
Public 81% 2% 17% 23% 60% 17% 74% 8% 17%
Total 81% 2% 17% 23% 60% 17% 74% 9% 17%
WASH governance
School WASH discussed in
public meeting Master Plan in place? Master plan followed?
Strategy for WASH Improvement?
Yes No Yes No no data Yes No no data Yes No no data
Total 82% 18% 13% 70% 17% 13% 70% 17% 59% 24% 17%

SWASH Mapping Consolidated National Report
SWASH Mapping Consolidated National Report Page 10
Key findings
The provision of water, sanitation and hygiene in primary and secondary schools in Tanzania is lamentable. Facilities are scarce and often in poor repair. The overall situation is better in private schools compared to public schools, and better in secondary compared to primary schools. However, on average only 3% of pupils go to private schools and only 14% of all pupils are at secondary schools.
There is a wide variation in the numbers of pupils per drop hole. WHO guidelines recommend the provision of one toilet per 25 girls and one toilet plus one urinal per 50 boys (WHO, 2006). In reality, it is not uncommon to find hundreds of children sharing one decrepit latrine. Only 11% of schools surveyed meet the national “minimum” standards of 20 girls and 25 boys per drop hole. Twenty percent of schools have more than 100 pupils per drop hole and 6 % of schools have no latrines at all.
Many of the facilities that exit are of poor quality. This is likely to have a negative impact on attendance of those children most in need of an education, including children with disabilities and girls. 96% of schools do not have facilities that are suitable or accessible to children with disabilities. Only 40% of latrines have doors, providing dignity and privacy, especially for girls. Only 31% of secondary schools have a safe hygiene pad disposal system in place.
Latrine hygiene is very poor in almost all schools. Only 9% of all school is rated as having “clean” latrines. WASH facilities in all public schools are cleaned by pupils (including primary school children) but these activities are frequently unsupervised.
The vast majority of schools do not have functional hand-washing facilities or provide soap. Only 1% of schools provide soap and only 8% have sufficient water for hand-washing. 62% of schools in the districts reported having access to piped, or another protected water supply, although this isn’t always regular or sufficient in quantity.
The majority of teachers have not been trained to teach hygiene education. Almost all schools reported having access to hygiene education materials; however, discussions revealed that many teachers have poor knowledge and have received no training about basic health or hygiene. As a result, many children are not benefiting from quality hygiene education which would help them to lead healthy and productive lives.
Developments at the policy level MKUKUTA II recognises that quality education requires improvements in physical infrastructure, teaching and learning materials, human resources and school governance. Rehabilitating and expanding school infrastructure – water supply, latrine and hand-washing facilities – should be priority interventions for the new Government of Tanzania if secure universal access to quality education and a healthier and more productive nation is to be achieved. So far, efforts to improve water supply, sanitation and hygiene in schools have been piecemeal and on a small scale. For the Government to be able to reach targets relating to the quality of education and retention of girls in school, it is essential to scale up efforts to improve school WASH across Tanzania.
SWASH Mapping Consolidated National Report
SWASH Mapping Consolidated National Report Page 11
Some progress towards clarifying roles and responsibilities has been made with the signing of a Memorandum of Understanding between 4 key ministries - the Ministry of Education and Vocational Training (MoEVT), the Prime Minister’s Office for Regional and Local Government (PMO-RALG), the Ministry of Health and Social Welfare (MoHSW) and the Ministry of Water and Irrigation (MoWI). A national coordinating mechanism for School WASH (SWASH-TWG) has been established which will is chaired by MOEVT and MOHSW. There is a draft school WASH strategy and together the four key Ministries of the Government of Tanzania has developed and is currently piloting guidelines for school water supply sanitation and hygiene, with technical support from a wide range of organisations2.
2 The SWASH Partnership supporting the four Ministries (MOEVT, MOHSW, MOWI and PMO-RALG) includes ARU, MUHAS,
EEPCO, CCBRT, SEMA, SHIPO, HAPA, TWESA, CARE, Concern Worldwide, supported by SNV, WaterAid and UNICEF.

SWASH Mapping Consolidated National Report
SWASH Mapping Consolidated National Report Page 12
Recommendations to improve school water supply, sanitation and hygiene Building on these positive efforts, the following recommendations are made to address the chronic problem of School WASH in Tanzania, ensuring a quality education and helping to keep girls and children with disabilities in school:
1 Focus more on quality and not just quantity: to avoid overwhelming pedagogic capacities and to create conducive learning environments, including School WASH facilities. Increasing enrolment is a significant achievement, it is however equally important to make sure that school is a safe and enjoyable place where children can develop to their full potential; a place where they do not only acquire knowledge but also adopt good habits and positive behaviour changes
2 Ensure all new schools to be built with adequate WASH facilities: as required under the Government’s regulations.
3 Establish standard WASH requirements for schools (both private and government): to be phased from a basic but safe minimum to a more ideal provision
4 Support capacity building: of school management and local government authorities to manage and maintain facilities for sustainable access to School WASH.
5 Strengthen School WASH monitoring and inspection: to make sure that minimum School WASH conditions are maintained all year round.
6 Identify high level political champions: to support the efforts for ensuring that School WASH is given the priority it deserves in every school.
7 Initiate a national campaign for ensuring hand-washing with soap and to add doors back to all school latrines: both can be achieved with little cost but have a large potential benefit for school children, particularly girls.
8 Establish the national fund or programme, strengthen management and coordination structures for School WASH to ensure concerted efforts of all key stakeholders and to maximise the use of available resources. The national fund or programme should provide a focal point for investments as well as motivation for Development Partners to further invest in School WASH facilities.
9 Provide financial incentives: by rewarding well performing schools to encourage the effective use and maintenance of the provided facilities with tangible benefits.
10 Provide additional meaningful resources: to smaller resource poor schools in remote areas that will allow them to provide proper School WASH facilities.
11 Ensure financial transparency: by publicising information on capitation fund transfer from central to local government and from local government to schools (date and amount transferred) so that schools, teachers and parents are fully aware of the resources made available in order for them to be able to make informed decisions when planning and budgeting for School WASH improvements.
12 Maximise the leverage of government funds for School WASH: through co-funding modalities using funds raised by parents and the school. This would also have the effect of improving the overall sustainability of investments since this would create a sense of ownership amongst parents, the school and the community.
SWASH Mapping Consolidated National Report
SWASH Mapping Consolidated National Report Page 13
SWASH Mapping Consolidated National Report
SWASH Mapping Consolidated National Report Page 14
Contents
EXECUTIVE SUMMARY ................................................................................................................... 7
CONTENTS ........................................................................................................................................ 14
LIST OF TABLES .............................................................................................................................. 16
LIST OF FIGURES ............................................................................................................................ 16
LIST OF ACRONYMS AND ABBREVIATIONS .......................................................................... 18
1 INTRODUCTION ...................................................................................................................... 19
1.1 School Water Supply, Sanitation and Hygiene ................................................................................... 19
1.2 Background to the School WASH Mapping ........................................................................................ 20
1.3 Methodology..................................................................................................................................... 21 1.3.1 Mapping Survey .................................................................................................................................. 21 1.3.2 Governance and Validation Exercise ................................................................................................... 23
1.4 Limitations ........................................................................................................................................ 23 1.4.1 Limitations of the Mapping Survey ..................................................................................................... 23 1.4.2 Limitations of the Governance and Validation Exercise ..................................................................... 24
1.5 Structure of the Report ..................................................................................................................... 24
2 FINDINGS OF THE MAPPING SURVEY ............................................................................. 25
2.1 Summary of Schools and School WASH ............................................................................................. 25 2.1.1 Number of schools and pupils ............................................................................................................. 25 2.1.2 Key school WASH indicators ............................................................................................................... 28 2.1.3 School WASH ratings by district .......................................................................................................... 30 2.1.4 School WASH ratings by type and ownership of school ...................................................................... 33
2.2 Latrine Numbers, Ratios and Shortages ............................................................................................. 35 2.2.1 Latrine numbers by district ................................................................................................................. 35 2.2.2 Latrine numbers by type and ownership of school ............................................................................. 36 2.2.3 Schools meeting MOEVT targets for pupil-latrine ratios .................................................................... 36
2.3 Latrine Standards .............................................................................................................................. 39 2.3.1 Latrine types and construction materials............................................................................................ 39 2.3.2 Latrine suitability for the disabled ...................................................................................................... 41 2.3.3 Latrines emptied? ............................................................................................................................... 43 2.3.4 Privacy ................................................................................................................................................. 44
2.4 Latrine Hygiene ................................................................................................................................. 45 2.4.1 Anal cleansing and hygienic pad disposal ........................................................................................... 45 2.4.2 Hand-washing facilities ....................................................................................................................... 47 2.4.3 Latrine cleanliness ............................................................................................................................... 50
SWASH Mapping Consolidated National Report
SWASH Mapping Consolidated National Report Page 15
2.5 Water Supply .................................................................................................................................... 52 2.5.1 Schools’ water supply by district ......................................................................................................... 53 2.5.2 School water supply, by type and ownership of school ...................................................................... 54
2.6 Hygiene Education ............................................................................................................................ 56 2.6.1 Hygiene education by district.............................................................................................................. 56 2.6.2 Hygiene education, by type and ownership of school ........................................................................ 58
2.7 Latrine Operations and Maintenance ................................................................................................ 59
2.8 Governance and Accountability......................................................................................................... 60
3 GOVERNANCE AND VALIDATION FINDINGS ................................................................. 62
4 CONCLUSIONS AND THE WAY FORWARD ..................................................................... 67
ANNEX 1 – DATA TABLES FOR CHARTS IN SECTION 2 ...................................................... 71 Data tables for Section 2.1 – Summary ............................................................................................................ 71 Data tables for Section 2.2 – Latrine Numbers and Ratios............................................................................... 72 Data tables for Section 2.3 – Latrine Standards ............................................................................................... 73 Data tables for Section 2.4 – Latrine Hygiene .................................................................................................. 75 Data tables for Section 2.5 –Water Supply ...................................................................................................... 76 Data tables for Section 2.6 –Hygiene Education .............................................................................................. 77
ANNEX 2: A SUMMARY OF THE SCHOOL WASH FINDINGS FOR EACH OF THE SURVEY’S 16 DISTRICTS, INCLUDING A MAP OF EACH DISTRICT ................................. 78
Annex 2.1 - Overview data – Bagamoyo District .............................................................................................. 79 Annex 2.2 - Overview data – Chamwino District .............................................................................................. 81 Annex 2.3 - Overview data – Hai District .......................................................................................................... 83 Annex 2.4 - Overview data – Kahama District .................................................................................................. 85 Annex 2.5 - Overview data – Kasulu District .................................................................................................... 87 Annex 2.6 - Overview data – Kibondo District ................................................................................................. 89 Annex 2.7 - Overview data – Kigoma District ................................................................................................... 91 Annex 2.8 - Overview data – Magu District ...................................................................................................... 93 Annex 2.9 - Overview data – Makete District .................................................................................................. 95 Annex 2.10 - Overview data – Maswa District ................................................................................................. 97 Annex 2.11 - Overview data – Morogoro Rural District ................................................................................... 99 Annex 2.12 - Overview data – Mtwara District .............................................................................................. 101 Annex 2.13 - Overview data – Ngara District ................................................................................................. 103 Annex 2.15 - Overview data – Singida Urban District .................................................................................... 107 Annex 2.16 - Overview data – Temeke District .............................................................................................. 109
ANNEX 3: MAPPING SURVEY TOOL ....................................................................................... 111
ANNEX 4: GOVERNANCE AND VALIDATION EXERCISE FRAMEWORK QUESTIONNAIRE ......................................................................................................................... 114
ANNEX 5: REFERENCES ............................................................................................................. 115

SWASH Mapping Consolidated National Report
SWASH Mapping Consolidated National Report Page 16
List of Tables
Table 1 Number of schools and pupils by type of school and district .......................................................... 25 Table 2 Percentage of girls and boys by type of school and district ............................................................ 26 Table 3 Number of schools and pupils by school ownership and district ..................................................... 26 Table 4 Number of schools and pupils by type, ownership and district. ...................................................... 27 Table 5 Summary of the number and type of latrines.................................................................................. 28 Table 6 Summary of latrine facilities ........................................................................................................... 29 Table 7 Summary of hand-washing facilities ............................................................................................... 29 Table 8 Summary of water sources .............................................................................................................. 29 Table 9 Latrine numbers, ratios and shortages by district ........................................................................... 35 Table 10 Latrine numbers, ratios and shortages by type and ownership of schools ..................................... 36 Table 11 Latrine operations and maintenance by district ............................................................................. 59 Table 12 Latrine operations and maintenance by type and ownership of school ......................................... 59 Table 13 Governance and accountability by district - % of schools in the district ......................................... 60 Table 14 Governance and accountability by type and ownership of school .................................................. 61 Table 15 Overview data - Bagamoyo ............................................................................................................ 79 Table 16 Overall data - Chamwino ................................................................................................................ 81 Table 17 Overall data – Hai ........................................................................................................................... 83 Table 18 Overall data – Kahama ................................................................................................................... 85 Table 19 Overall data – Kasulu ...................................................................................................................... 87 Table 20 Overall data - Kibondo .................................................................................................................... 89 Table 21 Overall data - Kigoma ..................................................................................................................... 91 Table 22 Overall data - Magu ........................................................................................................................ 93 Table 23 Overall data - Makete ..................................................................................................................... 95 Table 24 Overall data - Maswa ..................................................................................................................... 97 Table 25 Overall data – Morogoro ................................................................................................................ 99 Table 26 Overall data - Mtwara .................................................................................................................. 101 Table 27 Overall data - Ngara ..................................................................................................................... 103 Table 28 Overall data - Siha......................................................................................................................... 105 Table 29 Overall data – Singida Urban ........................................................................................................ 107 Table 30 Overall data - Temeke ................................................................................................................... 109
List of Figures
Figure 1 Map of districts where SWASH Mapping was undertaken.................................................................. 20 Figure 2 Overall school WASH scores by district ............................................................................................... 30 Figure 3 Scores for latrine numbers by district .................................................................................................. 30 Figure 4 Scores for latrine standards by district ................................................................................................ 31 Figure 5 Scores for latrine hygiene by district ................................................................................................... 31 Figure 6 Scores for school water supply by district ........................................................................................... 32 Figure 7 Scores for hygiene education by district .............................................................................................. 32 Figure 8 Overall School WASH scores by type and ownership of school ........................................................... 33 Figure 9 Scores for latrine numbers by type and ownership of school .............................................................. 33 Figure 10 Scores for latrine standards by type and ownership of school ........................................................ 34 Figure 11 Scores for latrine hygiene by type and ownership of school ........................................................... 34 Figure 12 Scores for school water supply by type and ownership of school ................................................... 34 Figure 13 Scores for hygiene education by type and ownership of school ..................................................... 34 Figure 14 Number of schools meeting target for latrine numbers by district ................................................. 37 Figure 15 Number of schools meeting target for latrine numbers by type and ownership of school ............. 38 Figure 16 Number of schools with each latrine type, by district ..................................................................... 39 Figure 17 Number of schools with each latrine type, by type and ownership of school ................................. 40

SWASH Mapping Consolidated National Report
SWASH Mapping Consolidated National Report Page 17
Figure 18 Number of schools with each type of latrine construction materials, by district ............................ 40 Figure 19 Number of schools with each type of latrine construction materials, by type and ownership of school 41 Figure 20 Latrine suitability for use by disabled pupils, by district ................................................................. 42 Figure 21 Latrine suitability for use by disabled pupils, by type and ownership of school ............................. 42 Figure 22 School latrine emptying history by district ...................................................................................... 43 Figure 23 School latrine emptying history by district ...................................................................................... 44 Figure 24 Latrine privacy, by district ............................................................................................................... 45 Figure 25 Availability of anal cleansing materials, by district ........................................................................ 46 Figure 26 Type of anal cleansing materials available, by district ................................................................... 46 Figure 27 Availability of hygienic pad disposal facilities, by district ............................................................... 46 Figure 28 Availability of anal cleansing materials, by type and ownership of school ..................................... 47 Figure 29 Type of anal cleansing materials available, by type and ownership of school ............................... 47 Figure 30 Availability of hygienic pad disposal facilities, by type and ownership of school ........................... 47 Figure 31 Availability of handwashing facilities, by district ............................................................................ 48 Figure 32 Type of handwashing facilities available, by district ...................................................................... 48 Figure 33 Availability of water for handwashing, by district .......................................................................... 49 Figure 34 Availability of soap for handwashing, by district ............................................................................ 49 Figure 35 Availability of handwashing facilities, by type and ownership of school ........................................ 50 Figure 36 Type of handwashing facility, by type and ownership of school ..................................................... 50 Figure 37 Availability of water for handwashing, by type and ownership of school ...................................... 50 Figure 38 Availability of soap for handwashing, by type and ownership of school ........................................ 50 Figure 39 Latrine status (smell, soiled, etc), by district ................................................................................... 51 Figure 40 Latrine cleanliness, by district ......................................................................................................... 51 Figure 41 Latrine status (smell, soiled, etc), by type and ownership of school ............................................... 52 Figure 42 Latrine cleanliness, by type and ownership of school ..................................................................... 52 Figure 43 Type of water supply, by district ..................................................................................................... 53 Figure 44 Location of water supply, by district ............................................................................................... 53 Figure 45 Water supply functionality, by district ............................................................................................ 54 Figure 46 Type of water supply by type and ownership of school .................................................................. 55 Figure 47 Water supply location, by type and ownership of school ............................................................... 55 Figure 48 Water supply functionality, by type and ownership of school ........................................................ 55 Figure 49 Schools in which hygiene education taking place, by district ......................................................... 56 Figure 50 Schools with a teacher trained in hygiene education, by district .................................................... 57 Figure 51 Schools with teaching materials for hygiene education available, by district ................................ 57 Figure 52 Schools in which hygiene education taking place, by type and ownership of school...................... 58 Figure 53 Schools with a teacher trained in hygiene education, by type and ownership of school ................ 58 Figure 54 Schools with teaching materials for hygiene education available, by type and ownership of school 58 Figure 55 Overall school WASH status ............................................................................................................ 80 Figure 56 Map - overall WASH scores - Bagamoyo ......................................................................................... 80 Figure 57 Overall school WASH status - Chamwino ........................................................................................ 82 Figure 58 Map – overall WASH scores - Chamwino ........................................................................................ 82 Figure 59 Overall school WASH status- Hai .................................................................................................... 84 Figure 60 Map – overall WASH scores - Hai .................................................................................................... 84 Figure 61 Overall school WASH status - Kahama ........................................................................................... 86 Figure 62 Map – overall WASH scores - Kahama ............................................................................................ 86 Figure 63 Overall school WASH status - Kasulu .............................................................................................. 88 Figure 64 Map – overall WASH scores - Kasulu .............................................................................................. 88 Figure 65 Overall school WASH status - Kibondo ............................................................................................ 90 Figure 66 Map – overall WASH scores – Kibondo ........................................................................................... 90 Figure 67 Overall school WASH status - Kigoma ............................................................................................. 92 Figure 68 Map – overall WASH scores - Kigoma ............................................................................................. 92 Figure 69 Overall school WASH status - Magu ............................................................................................... 94 Figure 70 Map – overall WASH scores - Magu................................................................................................ 94 Figure 71 Overall school WASH status - Makete ............................................................................................ 96

SWASH Mapping Consolidated National Report
SWASH Mapping Consolidated National Report Page 18
Figure 72 Map – overall WASH scores - Makete ............................................................................................. 96 Figure 73 Overall school WASH status - Maswa ............................................................................................. 98 Figure 74 Map – overall WASH scores - Maswa ............................................................................................. 98 Figure 75 Overall school WASH status – Morogoro Rural ............................................................................ 100 Figure 76 Map – overall WASH scores – Morogoro Rural ............................................................................. 100 Figure 77 Overall school WASH status - Mtwara .......................................................................................... 102 Figure 78 Map – overall WASH scores - Mtwara .......................................................................................... 102 Figure 79 Overall school WASH status - Ngara ............................................................................................. 104 Figure 80 Map – overall WASH scores - Ngara ............................................................................................. 104 Figure 81 Overall school WASH status – Siha ............................................................................................... 106 Figure 82 Map – overall WASH scores - Siha ................................................................................................ 106 Figure 83 Overall School WASH Ratings – Singida Urban ............................................................................. 108 Figure 84 Map – overall WASH scores – Singida Urban ................................................................................ 108 Figure 85 Overall school WASH status - Temeke .......................................................................................... 110 Figure 86 Map – overall WASH scores – Temeke .......................................................................................... 110
List of Acronyms and Abbreviations
CBO Community based organisation CSO Civil society organisation DH Drop hole GIS Geographic Information System GPS Geographic Positioning System LGA Local Government Authority MKUKUTA Mpango wa Kupunguza Umaskini na Kukuza Uchimi Tanzania MoEVT Ministry of Education and Vocational Training MoHSW Ministry of Health and Social Welfare MoWI Ministry of Water and Irrigation O&M Operation and Maintenance PEDP Primary Education Development Program PMO-RALG Prime Minister’s Office for Regional and Local Government SNV The Netherlands Development Agency SWASH School water supply, sanitation and hygiene UNICEF United Nations Children’s Fund VIP Ventilated Improved Pit WASH Water, Sanitation and Hygiene WHO World Health Organisation WPM Water Point Mapping WSDP Water Sector Development Programme
SWASH Mapping Consolidated National Report
SWASH Mapping Consolidated National Report Page 19
1 Introduction
1.1 School Water Supply, Sanitation and Hygiene
The provision of water supply, sanitation and hygiene education in schools has an impact on the school environment and the quality of learning. Schools with inadequate water, sanitation and hygiene education (WASH) present a number of risks to pupils, including the risk of contracting diseases associated with poor sanitation, lost school days due to illness or for menstruating girls. Schools also have a key role to play in providing hygiene education which can have wider influence on families and communities and a long term impact on future generations – helping Tanzanians to live healthier and more productive lives. The benefits of improved water, sanitation and hygiene include:
Increased cognitive function and attention—due to reduced health problems, hydration and nutrition; increased wellbeing for girls, in particular, who may be concerned over where to go to the toilet or how to manage menstruation.
Reduced days missed from school—due to a reduction in WASH related diseases and infections such as diarrhoea, worms, schistosomiasis, or urinary tract infections. Emerging evidence suggests a correlation between girls’ attendance at school and adequate facilities to deal with girls’ hygiene needs, in particular during menstruation.
More time on the learning task—due to access to safe water and sanitation on site. Schools which lack access to water result in children carrying water long distances to school, thereby reducing actual class teaching time and /or fatiguing the children with a resulting negative impact on learning.
Increased dignity and safety particularly for girls and for people with disabilities—Accessible design and construction of facilities, appropriately sited latrines, segregated by sex, result in increased privacy and reduced risk of sexual harassment.
More effective school feeding programmes—Better hygiene and access to clean drinking water can result in increased nutritional benefit.
This importance of school WASH has been recognised in national policy debates. The new MKUKUTA II, for example, includes a specific target that 100% of schools should have adequate sanitation. The Ministries of Education and Vocation Training (MoEVT), Health and Social Welfare (MoHSW), Water and Irrigation (MoWI) and the Prime Minister’s Office for Regional and Local Government (PMO-RALG) have all emphasised the importance of school WASH and have committed to raising standards in schools. The signing of the Memorandum of Understanding for Sanitation and Hygiene (2010) between these ministries, the development of draft national school WASH guidelines for use at district and school level, the drafting of a national school WASH strategy and the establishment of a national technical working group for school WASH all represent significant steps forward.

SWASH Mapping Consolidated National Report
SWASH Mapping Consolidated National Report Page 20
Existing data on the current state of WASH services in Tanzanian schools is limited. The best source of information - routine monitoring in the education sector - provides only very basic information on school WASH, limited to the number of drop holes per school.
1.2 Background to the School WASH Mapping
Over the past 5 years, WaterAid, SNV and other partners, have mapped the number and functionality of every water point in over 50 districts in Tanzania. Whilst involved in the Water Point Mapping, SNV also undertook some mapping of the WASH situation in a number of schools. The results they found were shocking. SNV therefore proposed to WaterAid and UNICEF to undertake School WASH mapping in a number of districts to get a better understanding of the realities of the School WASH situation in Tanzania. This exercise it was hoped would provide evidence to be used to raise awareness of the condition of WASH in schools and to inform policy making and resource allocation.
Figure 1 Map of districts where SWASH Mapping was undertaken
km 96 192 288 384 480
Songea Rural
Mbinga
Songea Urban
Namtumbo
Tunduru
Musoma Urban
Tarime
Bunda
Musoma Rural
Serengeti
Magu
Geita
IlemelaSengerema
KwimbaMisungwi
Ukerewe
Nyamagana
Muleba
BiharamuloNgara
Karagwe
Bukoba Urban
Bukoba Rural
Bukombe
Kahama
Bariadi
Kishapu
Shinyanga Urban Meatu
Shinyanga Rural
Maswa
Kasulu
Kigoma Rural
Kigoma-Urban
Kibondo
Sumbawanga Urban
Mpanda
Sumbawanga Rural
Nkasi
Tabora Urban
Igunga
UyuiUrambo
Sikonge
NzegaIramba
Singida Rural
Manyoni
Singida Urban
Simanjiro
Mbulu
Hanang
Babati
Kiteto
Ludewa
Iringa Rural
Iringa Urban
Mufindi
Kilolo
Makete Njombe
Dodoma Rural & Chamwino
Kongwa
Mpwapwa
Kondoa
Dodoma Urban
MasasiNewala
Mtwara Rural
Mtwara Urban
Tandahimba
Lindi Rural
Lindi Urban
Kilwa
Ruangwa
Liwale
Nachingwea
Kinondoni
TemekeIlala
Kisarawe
Kibaha
Mafia
Bagamoyo
Rufiji
Mkuranga
KilosaMorogoro Urban
Ulanga
Kilombero
Morogoro Rural
Mvomero
Muheza
Kilindi
Korogwe
Handeni
Lushoto
Pangani
Tanga
Hai & Siha
Moshi Rural
Same
Mwanga
Moshi UrbanRombo
Arusha
Arumeru
Monduli
Ngorongoro
Karatu
Chunya
Mbeya Urban
Kyela
RungweIleje
Mbozi
Mbarali
Mbeya Rural
WASH districts
Sixteen districts across Tanzania were identified for the purpose of mapping the WASH situation in every pre-, primary and secondary school. The districts were all districts where SNV, WaterAid or

SWASH Mapping Consolidated National Report
SWASH Mapping Consolidated National Report Page 21
UNICEF were currently working - Bagamoyo, Chamwino, Hai, Kahama, Kasulu, Kibondo, Kigoma, Magu, Makete, Masawa, Morogoro Rural, Mtwara, Ngara, Siha, Singida Urban, Temeke. A total of 2,697 pre-, primary and secondary schools were mapped. This report is therefore part of a joint SNV-WaterAid-UNICEF project to address this data gap and to get a better sense of the true state of school facilities.
1.3 Methodology
This study was conducted in two parts: 1) Comprehensive mapping of facilities of all schools within each district, and 2) validation of the results of the mapping exercise and further qualitative research to understand the governance challenges.
1.3.1 Mapping Survey
The school WASH mapping employed a detailed questionnaire to collect data on all schools in the district, including pre-Primary, combined Pre- and Primary, Primary and Secondary schools, covering both public and private schools. Data was collected on school size, ownership (whether a school is public or private), location (administrative and GIS-referenced), teaching facilities, the number and condition of school WASH facilities and hygiene education. The survey questionnaire was uploaded into a GPS device. The full questionnaire is attached as Annex 3 of this report. Data analysis was conducted in Excel. Some indicators are presented in raw form, while others are composite indicators calculated on the basis of raw data. These composite indicators were used to calculate scores, and provide a rating (good, ok, poor or very poor according to the score). Details of the composite indicators and the method of calculation are given in Box 1 below.
Box 1 – Definitions of composite indicators
Category Indicator Calculation Grading
Latr
ine
nu
mb
ers
Latrine numbers score (girls) Max 5
Less than 20 girls per DH = 5 20-40 girls per DH = 4 40-100 girls per DH = 3 100-200 girls per DH = 2 Over 200 girls per DH = 1 No latrine for girls = 0
Latrine numbers score (boys) Max 5
Less than 25 boys per DH = 5 25-50 boys per DH = 4 50-100 boys per DH = 3 100-200 boys per DH = 2 Over 200 boys per DH = 1 No latrine for boys = 0
Latrine numbers score (all) Max 10
Sum of latrine numbers score for girls and for boys
10 = good (A); 8-9 = ok (B); 4-7 = poor (C); 0-3 = very poor (D)

SWASH Mapping Consolidated National Report
SWASH Mapping Consolidated National Report Page 22
Category Indicator Calculation Grading La
trin
e s
tan
dar
ds
Latrine type score Max 2
VIP / pour flush / composting = 2 Pit latrine with slab = 1 Traditional pit latrine = 0
Latrine materials score Max 1
Cement/concrete/burnt bricks = 1 Other = 0
Suitable for disabled? Max 1
Yes = 1 No = 0
Privacy for girls Max 2
Yes, and door available = 2 Yes, but no door = 1 Door, but no privacy = 1 Neither = 0
Privacy for boys Max 2
Yes, and door available = 2 Yes, but no door / door but no privacy = 1 Neither = 0
Latrine emptied? Max 1
Yes = 1 No = 0
Latrine standards score Max 9
Sum of all scores for latrine standards 8-9 = good (A); 6-7 = ok (B); 3-5 = poor (C); 0-2 = very poor (D)
Category Indicator Calculation Grading
Latr
ine
hyg
ien
e &
han
d-w
ash
ing
Cleansing materials Max 1
Materials present = 1 No materials present = 0
Water for handwashing Max 2
Sufficient water = 2 Insufficient water = 1 No water = 0
Soap available? Max 2
Yes = 2 No = 1
Disposal of hygienic pads? Max 1
Yes = 1 No = 0
Cleanliness Max 2
1 if neither “smelly” nor “soiled” Plus 1 if “dirty” not listed as a problem
Latrine hygiene score Max 8
Sum of all scores for latrine hygiene 7-8 = good (A); 5-6 = ok (B); 3-4 = poor (C); 0-2 = very poor (D)
Category Indicator Calculation Grading
Wat
er
Sup
ply
Water supply type Max 2
Piped = 2 Other protected = 1 Unprotected / none = 0
Water supply location Max 1
On school premises = 1 Off premises = 0
Water supply functionality Max 1
Functional = 1 Non-functional = 0
Water supply score Max 4
Sum of all scores for water supply 4 = good (A); 3 = ok (B); 1-2 = poor (C); 0 = very poor (D)
Category Indicator Calculation Grading
Hy
gie
ne
ed uc
ati
on
Hygiene teaching Max 1
Taught = 1 Not taught = 0

SWASH Mapping Consolidated National Report
SWASH Mapping Consolidated National Report Page 23
Teacher trained in hygiene education Max 1
Yes = 1 No = 0
Teaching materials available Max 1
Yes = 1 No = 0
Hygiene education score Max 3
Sum of all scores for hygiene education 3 = good (A); 2 = ok (B); 1 = poor (C); 0 = very poor (D)
Category Indicator Calculation Grading
Overall school score
Overall score Max 34
Sum of scores for latrine numbers, latrine standards, latrine hygiene, water supply and hygiene education
30-34 = good (A); 20-29 = ok (B); 10-19 = poor (C); 0-9 = very poor (D)
1.3.2 Governance and Validation Exercise
The governance and validation exercise involved visiting a selection of schools within each district in order to validate the survey data and elucidate the qualitative story behind the numbers, focusing on questions of governance. The team included representatives from the district council, SNV, WaterAid, WEDECO and KADETFU (partner organisations of SNV). Interviews were carried out using a governance framework questionnaire (see Annex 4) as an interview guide. Interviewees included:
Head Teachers,
Teachers for Health and Environment
Representatives of pupils/students for each visited school.
School committee/board members
Local influential people
Representatives of parents
Village government representatives
Ward and district level leaders
Relevant NGOs / CBOs where present The selection of schools for the exercise was purposive, in order to ensure a cross-section of schools. Specific criteria used included the WASH status of the school, the size of the school, ownership and management, day and boarding schools, single-sex and co-educational schools, urban and rural locations, and distance from the district headquarters.
1.4 Limitations
1.4.1 Limitations of the Mapping Survey
The WASH situation of every school is different, and the quantitative survey methodology lacks the flexibility to accurately reflect such differences. This forced the survey team to make on-the-spot judgements to categorise a latrine, a school, etc. This is an inherent problem with any quantitative survey, and is part of the rationale for including a qualitative exercise alongside the survey.
SWASH Mapping Consolidated National Report
SWASH Mapping Consolidated National Report Page 24
While every effort was made to ensure the accuracy of the dataset, there are inevitably some inaccuracies due to human errors in data collection, data entry, data cleaning and analysis. Again, this is a normal weakness of any quantitative survey.
1.4.2 Limitations of the Governance and Validation Exercise
The qualitative aspect of the study also had limitations:
1. The community, school committee and village government representatives were interviewed at their respective schools. However it was difficult to validate responses.
2. The mixed survey team at times found it difficult to grasp the validation and inquiry approach.
3. Leading questions can lead to reactive answers from respondents
1.5 Structure of the Report
Section 2 of this report presents the findings of the mapping survey under eight headings:
Overview of schools and school WASH
Latrine numbers
Latrine standards
Latrine hygiene and hand-washing
Water supply
Hygiene education
Latrine operations and maintenance
Governance and accountability Some data tables relating to section 2 have been attached as annexes rather than in the main body of the report:
Annex 1: Full data tables for charts included in the main body of the report
Annex 2: A summary of the school WASH findings for each of the survey’s 16 districts, including a map of each district
Annex 3: Mapping survey tool
Annex 4: Governance and validation exercise framework questionnaire Section 3 presents the findings of the governance and validation exercise, which focuses on common themes emerging from the district reports, relating to prioritisation, financing, operation and maintenance, roles and responsibilities, monitoring and inspection, communication and relationships, participation and involvement and access to information.

SWASH Mapping Consolidated National Report
SWASH Mapping Consolidated National Report Page 25
2 Findings of the Mapping Survey
2.1 Summary of Schools and School WASH
This section provides an overview of the main findings from the mapping survey, including
A summary of the number of schools (and pupils) in each district, type of school (pre-school, primary or secondary) and ownership (public or private)
A summary of key school WASH indicators for each district, type of school and ownership
A summary of schools’ performance in each of six areas: 1) overall school WASH, 2) latrine numbers, 3) latrine standards,4) latrine hygiene, 5) water supply and 6) hygiene education.
2.1.1 Number of schools and pupils
Table 1 Number of schools and pupils by type of school and district
No. of schools No. of girl pupils No. of boy pupils Total no. of pupils
District Pre- Pri Sec Total Pre- Pri Sec Total Pre- Pri Sec Total Pre- Pri Sec Total
Bagamoyo 4 128 30 162 81 27,723 6,740 34,544 66 27,897 7,208 35,171 147 55,620 13,948 69,715
Chamwino 0 111 25 136 0 30,138 2,143 32,281 0 29,954 2,760 32,714 0 60,092 4,903 64,995
Hai 1 109 42 152 8 19,425 7,565 26,998 4 20,418 6,592 27,014 12 39,843 14,157 54,012
Kahama 0 251 49 300 0 75,936 6,172 82,108 0 77,743 10,047 87,790 0 153,679 16,219 169,898
Kasulu 0 223 46 269 0 66,713 7,080 73,793 0 66,611 11,372 77,983 0 133,324 18,452 151,776
Kibondo 0 126 31 157 0 37,397 4,310 41,707 0 36,144 5,641 41,785 0 73,541 9,951 83,492
Kigoma Rural
0 217 31 248 0 57,743 4,344 62,087 0 58,992 8,344 67,336 0 116,735 12,688 129,423
Magu 0 195 37 232 0 67,459 6,401 73,860 0 66,256 11,716 77,972 0 133,715 18,117 151,832
Makete 0 96 16 112 0 11,884 3,379 15,263 0 11,885 3,049 14,934 0 23,769 6,428 30,197
Maswa 0 120 38 158 0 38,660 5,105 43,765 0 37,430 7,311 44,741 0 76,090 12,416 88,506
Morogoro Rural
0 149 25 174 0 29,359 3,392 32,751 0 31,725 4,483 36,208 0 61,084 7,875 68,959
Mtwara Rural
0 112 20 132 0 22,702 2,166 24,868 0 22,760 3,722 26,482 0 45,462 5,888 51,350
Ngara 0 112 24 136 0 33,214 4,358 37,572 0 32,712 5,044 37,756 0 65,926 9,402 75,328
Siha 0 54 15 69 0 10,092 2,434 12,526 0 10,172 1,855 12,027 0 20,264 4,289 24,553
Singida Urban
9 47 18 74 354 13,481 3,484 17,319 317 12,999 4,262 17,578 671 26,480 7,746 34,897
Temeke 8 114 64 186 305 85,253 20,179 105,737 261 82,171 22,500 104,932 566 167,424 42,679 210,669
Totals 22 2,164 511 2,697 748 627,179 89,252 717,179 648 625,869 115,906 742,423 1,396 1,253,048 205,158 1,459,602
Percentage 0.8% 80% 19% 100% 0.1% 87% 12% 100% 0.1% 84% 16% 100% 0.1% 86% 14% 100%
The sixteen survey districts have a total of 2,697 schools, of which 22 (less than 1%) are pre-schools, 2,164 (80%) are primary schools (some including a pre-school class) and 511 (19%) are secondary schools.

SWASH Mapping Consolidated National Report
SWASH Mapping Consolidated National Report Page 26
In these schools there are a total of 1,456,602 pupils, of which 86% are in primary schools, 14% in secondary, and less than 1% in pre-schools. In primary schools, the proportion of boys and girls is very even (50% each), but in secondary schools, 56% of the pupils are male and only 44% are female, as shown in table 2 below. And in five of the 16 districts (Kahama, Kasulu, Kigoma Rural, Magu, Mtwara Rural) male pupils make up more than sixty percent of secondary school pupils. In these districts there are almost twice as many male secondary school students as female.
Table 2 Percentage of girls and boys by type of school and district
Primary schools Secondary schools All schools
District girls boys girls boys girls boys
Bagamoyo 50% 50% 48% 52% 50% 50%
Chamwino 50% 50% 44% 56% 50% 50%
Hai 49% 51% 53% 47% 50% 50%
Kahama 49% 51% 38% 62% 48% 52%
Kasulu 50% 50% 38% 62% 49% 51%
Kibondo 51% 49% 43% 57% 50% 50%
Kigoma R 49% 51% 34% 66% 48% 52%
Magu 50% 50% 35% 65% 49% 51%
Makete 50% 50% 53% 47% 51% 49%
Maswa 51% 49% 41% 59% 49% 51%
Morogoro R 48% 52% 43% 57% 47% 53%
Mtwara R 50% 50% 37% 63% 48% 52%
Ngara 50% 50% 46% 54% 50% 50%
Siha 50% 50% 57% 43% 51% 49%
Singida U 51% 49% 45% 55% 50% 50%
Temeke 51% 49% 47% 53% 50% 50%
Total 50% 50% 44% 56% 49% 51%
The vast majority (94%) of schools in the sixteen districts are publicly owned government schools – see table 3 – and an even higher number (97%) of pupils attend these publicly owned schools.
Table 3 Number of schools and pupils by school ownership and district
No. of schools No. of girl pupils No. of boy pupils Total no. of pupils
District Private Public Total Private Public Total Private Public Total Private Public Total
Bagamoyo 18 144 162 3,047 31,497 34,544 2,307 32,864 35,171 5,354 64,361 69,715
Chamwino 3 133 136 361 31,920 32,281 396 32,318 32,714 757 64,238 64,995
Hai 22 130 152 2,795 24,203 26,998 2,569 24,445 27,014 5,364 48,648 54,012
Kahama 13 287 300 2,771 79,337 82,108 2,906 84,884 87,790 5,677 164,221 169,898
Kasulu 8 261 269 1,553 72,240 73,793 1,868 76,115 77,983 3,421 148,355 151,776
Kibondo 7 150 157 1,220 40,487 41,707 918 40,867 41,785 2,138 81,354 83,492
Kigoma R 4 244 248 342 61,745 62,087 775 66,561 67,336 1,117 128,306 129,423
Magu 11 221 232 1,833 72,027 73,860 2,021 75,951 77,972 3,854 147,978 151,832
Makete 3 109 112 441 14,822 15,263 476 14,458 14,934 917 29,280 30,197
Maswa 4 154 158 385 43,380 43,765 528 44,213 44,741 913 87,593 88,506
Morogoro R 0 174 174 0 32,751 32,751 0 36,208 36,208 0 68,959 68,959
Mtwara R 0 132 132 0 24,868 24,868 0 26,482 26,482 0 51,350 51,350

SWASH Mapping Consolidated National Report
SWASH Mapping Consolidated National Report Page 27
Ngara 5 131 136 735 36,837 37,572 806 36,950 37,756 1,541 73,787 75,328
Siha 4 65 69 611 11,915 12,526 199 11,828 12,027 810 23,743 24,553
Singida U 13 61 74 745 16,574 17,319 671 16,907 17,578 1,416 33,481 34,897
Temeke 42 144 186 6,359 99,378 105,737 6,651 98,281 104,932 13,010 197,659 210,669
Total 157 2,540 2,697 23,198 693,981 717,179 23,091 719,332 742,423 46,289 1,413,313 1,459,602
Percentage 6% 94% 100% 3% 97% 100% 3% 97% 100% 3% 97% 100%
Pre-schools are an exception, with 91% privately owned, and a greater proportion of secondary schools (16%) than primary schools (3%) privately owned – see table 4. However, the private secondary schools are unevenly distributed: in three districts (Bagamoyo, Hai, Temeke) almost a third of all secondary schools are privately owned, whereas in Mtwara Rural and Morogoro Rural there are reportedly no private secondary schools at all.
Table 4 Number of schools and pupils by type, ownership and district.
Pre-school only Primary Secondary Total
District Private Public Private Public Private Public
Bagamoyo 4 0 4 124 10 20 162
Chamwino 0 0 1 110 2 23 136
Hai 1 0 8 101 13 29 152
Kahama 0 0 5 246 8 41 300
Kasulu 0 0 2 221 6 40 269
Kibondo 0 0 1 125 6 25 157
Kigoma R 0 0 0 217 4 27 248
Magu 0 0 7 188 4 33 232
Makete 0 0 1 95 2 14 112
Maswa 0 0 2 118 2 36 158
Morogoro R 0 0 0 149 0 25 174
Mtwara R 0 0 0 112 0 20 132
Ngara 0 0 3 109 2 22 136
Siha 0 0 2 52 2 13 69
Singida U 7 2 3 44 3 15 74
Temeke 8 0 16 98 18 46 186
Total 20 2 55 2,109 82 429 2,697
Percentage 91% 9% 3% 97% 16% 84%
SWASH Mapping Consolidated National Report
SWASH Mapping Consolidated National Report Page 28
2.1.2 Key school WASH indicators
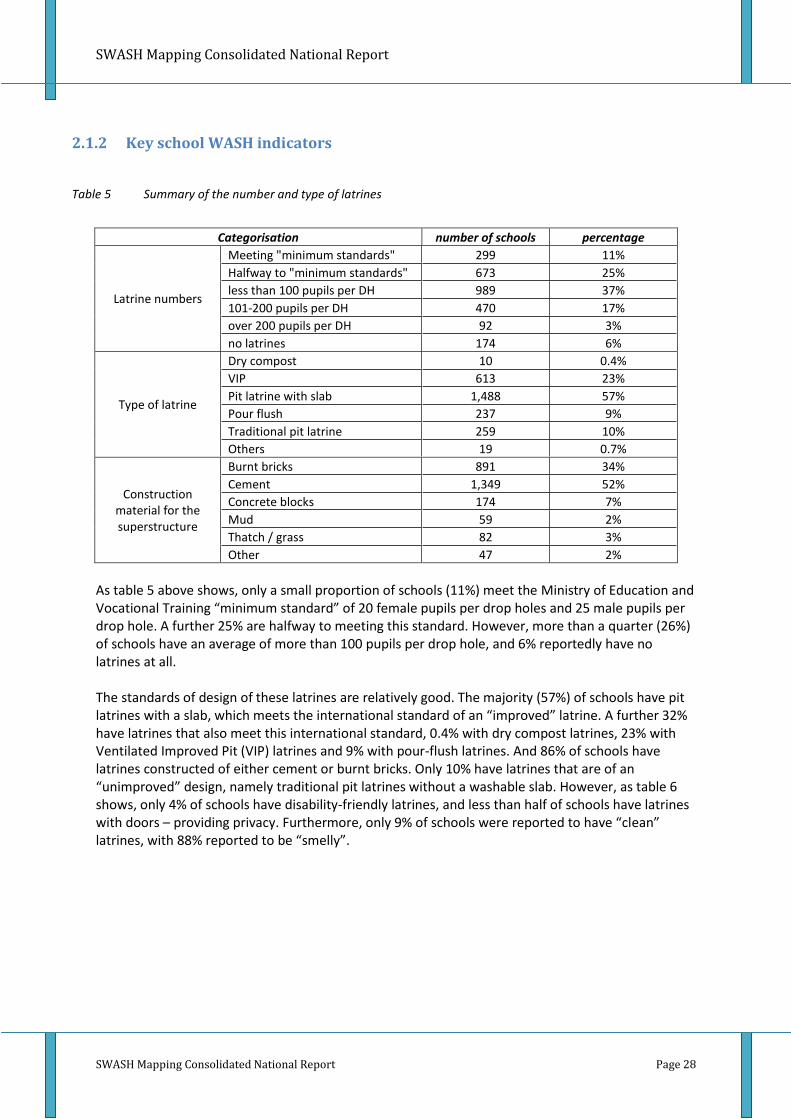
Table 5 Summary of the number and type of latrines
Categorisation number of schools percentage
Latrine numbers
Meeting "minimum standards" 299 11%
Halfway to "minimum standards" 673 25%
less than 100 pupils per DH 989 37%
101-200 pupils per DH 470 17%
over 200 pupils per DH 92 3%
no latrines 174 6%
Type of latrine
Dry compost 10 0.4%
VIP 613 23%
Pit latrine with slab 1,488 57%
Pour flush 237 9%
Traditional pit latrine 259 10%
Others 19 0.7%
Construction material for the superstructure
Burnt bricks 891 34%
Cement 1,349 52%
Concrete blocks 174 7%
Mud 59 2%
Thatch / grass 82 3%
Other 47 2%
As table 5 above shows, only a small proportion of schools (11%) meet the Ministry of Education and Vocational Training “minimum standard” of 20 female pupils per drop holes and 25 male pupils per drop hole. A further 25% are halfway to meeting this standard. However, more than a quarter (26%) of schools have an average of more than 100 pupils per drop hole, and 6% reportedly have no latrines at all. The standards of design of these latrines are relatively good. The majority (57%) of schools have pit latrines with a slab, which meets the international standard of an “improved” latrine. A further 32% have latrines that also meet this international standard, 0.4% with dry compost latrines, 23% with Ventilated Improved Pit (VIP) latrines and 9% with pour-flush latrines. And 86% of schools have latrines constructed of either cement or burnt bricks. Only 10% have latrines that are of an “unimproved” design, namely traditional pit latrines without a washable slab. However, as table 6 shows, only 4% of schools have disability-friendly latrines, and less than half of schools have latrines with doors – providing privacy. Furthermore, only 9% of schools were reported to have “clean” latrines, with 88% reported to be “smelly”.

SWASH Mapping Consolidated National Report
SWASH Mapping Consolidated National Report Page 29
Table 6 Summary of latrine facilities
Categorisation number of schools percentage
Disposal of hygiene pads available?
Yes 833 37%
No 1,412 63%
Suitable for disabled? Suitable 95 4%
Not suitable 2,577 96%
Doors available (girls) Yes 1,069 48%
No 1,160 52%
Doors available (boys) Yes 1,004 45%
No 1,221 55%
Latrine status
Clean 183 9%
Smelly 1,804 88%
Soiled 72 3%
Table 7 shows that 84% of schools have no hand-washing facility, 86% have no water for hand-washing, and 6% have insufficient water (meaning that 92% do not have functioning hand-washing facilities) and only 1% of schools have soap available.
Table 7 Summary of hand-washing facilities
Categorisation number of schools percentage
Type of facility
Wash basin 57 2%
Stand pipe 175 7%
Fixed container 185 7%
None 2,268 84%
Water for hand-washing
Enough 209 8%
Insufficient 166 6%
None 2,322 86%
Soap available? Yes 36 1%
No 2,661 99%
Only 30% of schools in these districts have a piped supply, and 38% have no water supply at all. Almost half (46%) of schools reported that their water supply was not functional at the time of the survey.
Table 8 Summary of water sources
Categorisation number of schools percentage
Type of source
Piped 821 30%
Hand-drilled tube well 249 9%
Shallow well 128 5%
Rainwater harvesting 469 17%
Other / none 1,030 38%
Location On school premises 1,308 68%
Outside school premises 616 32%
Functionality Functional 1,132 54%
Non-functional 975 46%

SWASH Mapping Consolidated National Report
SWASH Mapping Consolidated National Report Page 30
2.1.3 School WASH ratings by district3
Combining the data into ratings for each school produces a picture of the school WASH status for each district – see figure 2 below. In all districts, with the exception of Makete and Temeke, most schools were ranked as “poor”. In Makete and Temeke, the majority of schools were ranked as “ok”, and in Hai, Siha and Singida Urban a significant minority of schools were ranked as “ok”.
Figure 2 Overall school WASH scores by district
Figure 3 indicates scores for each school for the number of latrines. Again, the majority of schools in the majority of districts are ranked as “poor”, though there are significant numbers of schools in Hai, Makete, Morogoro Rural, Mtwara Rural, Siha and Singida Urban that score either “ok” or “good” for the number of latrines.
Figure 3 Scores for latrine numbers by district
3 The scoring system used in these charts is explained in box 1 in section 1.3 of this report.

SWASH Mapping Consolidated National Report
SWASH Mapping Consolidated National Report Page 31
In terms of latrine standards (design, construction materials, privacy and suitability for the disabled), the variation between districts is greater – see figure 4. Hai, Kibondo, Kahama, Makete, Mtwara Rural, Ngara, Siha and Singida Urban all have significant numbers of schools scoring “ok”, while the vast majority of schools in Temeke score either “ok” or “good” for latrine standards. However, several districts also include significant numbers of poorly performing schools, in particular Bagamoyo, Hai, Kasulu, Magu, and Morogoro Rural.
Figure 4 Scores for latrine standards by district
Figure 5 shows scores for latrine hygiene (facilities for hand-washing, hygienic pad disposal, anal cleansing and general state of cleanliness). The results show clearly that latrine hygiene is a weak point for school WASH. In all but one district (Temeke), schools score “very poor”, with only small numbers of schools scoring “ok” or “good”. Even in the more positive case of Temeke, the majority of schools score “poor”, followed by “very poor”.
Figure 5 Scores for latrine hygiene by district

SWASH Mapping Consolidated National Report
SWASH Mapping Consolidated National Report Page 32
Figure 6 shows schools’ scores for water supply (type, location, functionality), which presents a mixed picture, both within and between districts. Bagamoyo, Magu and Morogoro Rural are very weak in this area, while Hai, Makete and Siha are outstanding. The remaining districts include a balance of schools that score well and poorly for water supply. Maswa and Kahama were not included in this part of the survey.
Figure 6 Scores for school water supply by district
The scores for hygiene education appear to be very positive – figure 7 below– though it should be understood that the survey only looked at whether hygiene education was taking place; whether teaching materials and a specifically trained teacher were available. It did not look at either the quantity or quality of hygiene education taking place. Again, Kahama and Maswa were not included in this part of the survey.
Figure 7 Scores for hygiene education by district

SWASH Mapping Consolidated National Report
SWASH Mapping Consolidated National Report Page 33
2.1.4 School WASH ratings by type and ownership of school4
Figures 8-13 cover the same school type scores, but this time grouped by type of school and by school ownership. In all cases, secondary schools rate higher than primary schools and private schools rate higher than public schools. The differences are consistent across all categories, with just two exceptions. First, there is little difference between primary and secondary schools in terms of latrine hygiene. Although secondary schools have more and better latrines than primary schools, they do not have better hand-washing facilities. Second, the scores for hygiene education do not vary much between types and ownership of school. This is probably due the weaknesses in the survey tool that does not look at either the quality or quantity of hygiene education taking place, rather than an accurate reflection of similar standards between different types and ownerships of schools.
Figure 8 Overall School WASH scores by type and ownership of school
Figure 9 Scores for latrine numbers by type and ownership of school
4 The scoring system used in these charts is explained in box 1 in section 1.2 of this report.

SWASH Mapping Consolidated National Report
SWASH Mapping Consolidated National Report Page 34
Figure 10 Scores for latrine standards by type and ownership of school
Figure 11 Scores for latrine hygiene by type and ownership of school
Figure 12 Scores for school water supply by type and ownership of school
Figure 13 Scores for hygiene education by type and ownership of school

SWASH Mapping Consolidated National Report
SWASH Mapping Consolidated National Report Page 35
2.2 Latrine Numbers, Ratios and Shortages
This section looks in more detail at the number of latrines and the ratio of pupils per drop hole. It assesses the shortage of latrines compared to the number required according to the MOEVT minimum standards of 20 girls per drop hole and 25 boys per drop hole.
2.2.1 Latrine numbers by district
Table 9 presents district by district analysis of the number of pupils and drop holes, the shortage of drop holes as an absolute number and the sufficiency of the existing drop holes (as a percentage of the required number), for girls, boys and all pupils. Table 10 presents the same data broken down by type and ownership of school rather than by district. The overall conclusion from both tables is that the overall number of actual drop holes falls a long way short of the number required to meet minimum standards of the MOEVT. There is an overall shortage of 41,544 drop holes in the 16 districts, compared to a required number of 65,556. In other words, the actual number of drop holes in these 16 districts is only 37% of the required number. On average, 61 pupils use one drop hole, 58 girls and 64 boys respectively.
Table 9 Latrine numbers, ratios and shortages by district
girls Boys all pupils
District
# p
up
ils
actu
al #
DH
s
pu
pils
pe
r D
H
req
uir
ed
# D
Hs
sho
rtag
e
suff
icie
ncy
(%
)
# p
up
ils
actu
al #
DH
s
pu
pils
pe
r D
H
req
uir
ed
# D
Hs
Sho
rtag
e
suff
icie
ncy
(%
)
# p
up
ils
actu
al #
DH
s
pu
pils
pe
r D
H
req
uir
ed
# D
Hs
sho
rtag
e
suff
icie
ncy
(%
)
Bagamoyo 34,544 763 45 1,727 964 44% 35,171 667 53 1,407 740 47% 69,715 1,430 49 3,134 1,704 46%
Chamwino 32,281 565 57 1,614 1,049 35% 32,714 523 63 1,309 786 40% 64,995 1,088 60 2,923 1,835 37%
Hai 26,998 1,037 26 1,350 313 77% 27,014 946 29 1,081 135 88% 54,012 1,983 27 2,430 447 82%
Kahama 82,108 1,257 65 4,105 2,848 31% 87,790 1,177 75 3,512 2,335 34% 169,898 2,434 70 7,617 5,183 32%
Kasulu 73,793 1,218 61 3,690 2,472 33% 77,983 1,192 65 3,119 1,927 38% 151,776 2,410 63 6,809 4,399 35%
Kibondo 41,707 809 52 2,085 1,276 39% 41,785 723 58 1,671 948 43% 83,492 1,532 54 3,757 2,225 41%
Kigoma R 62,087 1,109 56 3,104 1,995 36% 67,336 1,055 64 2,693 1,638 39% 129,423 2,164 60 5,798 3,634 37%
Magu 73,860 998 74 3,693 2,695 27% 77,972 967 81 3,119 2,152 31% 151,832 1,965 77 6,812 4,847 29%
Makete 15,263 431 35 763 332 56% 14,934 408 37 597 189 68% 30,197 839 36 1,361 522 62%
Maswa 43,765 652 67 2,188 1,536 30% 44,741 582 77 1,790 1,208 33% 88,506 1,234 72 3,978 2,744 31%
Morogoro R 32,751 609 54 1,638 1,029 37% 36,208 600 60 1,448 848 41% 68,959 1,209 57 3,086 1,877 39%
Mtwara R 24,868 485 51 1,243 758 39% 26,482 488 54 1,059 571 46% 51,350 973 53 2,303 1,330 42%
Ngara 37,572 559 67 1,879 1,320 30% 37,756 505 75 1,510 1,005 33% 75,328 1,064 71 3,389 2,325 31%
Siha 12,526 416 30 626 210 66% 12,027 388 31 481 93 81% 24,553 804 31 1,107 303 73%
Singida U 17,319 438 40 866 428 51% 17,578 430 41 703 273 61% 34,897 868 40 1,569 701 55%
Temeke 105,737 1,065 99 5,287 4,222 20% 104,932 950 110 4,197 3,247 23% 210,669 2,015 105 9,484 7,469 21%
Total 717,179 12,411 58 35,859 23,448 35% 742,423 11,601 64 29,697 18,096 39% 1,459,602 24,012 61 65,556 41,544 37%
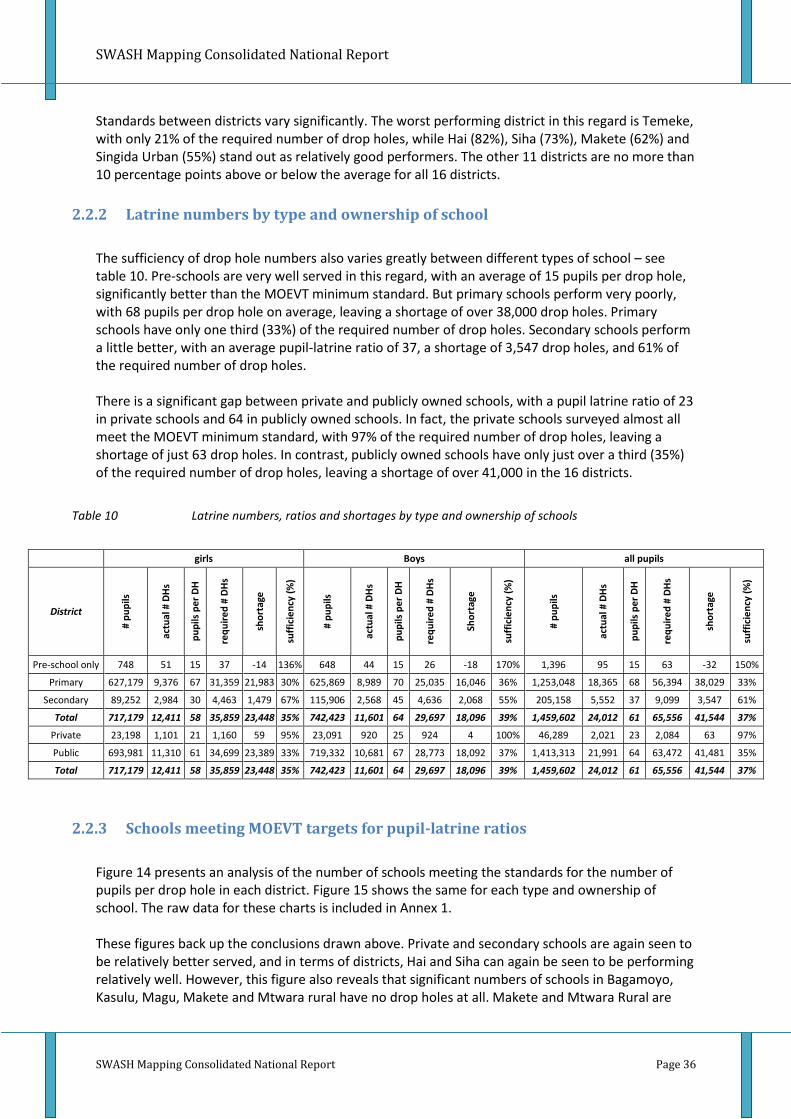
SWASH Mapping Consolidated National Report
SWASH Mapping Consolidated National Report Page 36
Standards between districts vary significantly. The worst performing district in this regard is Temeke, with only 21% of the required number of drop holes, while Hai (82%), Siha (73%), Makete (62%) and Singida Urban (55%) stand out as relatively good performers. The other 11 districts are no more than 10 percentage points above or below the average for all 16 districts.
2.2.2 Latrine numbers by type and ownership of school
The sufficiency of drop hole numbers also varies greatly between different types of school – see table 10. Pre-schools are very well served in this regard, with an average of 15 pupils per drop hole, significantly better than the MOEVT minimum standard. But primary schools perform very poorly, with 68 pupils per drop hole on average, leaving a shortage of over 38,000 drop holes. Primary schools have only one third (33%) of the required number of drop holes. Secondary schools perform a little better, with an average pupil-latrine ratio of 37, a shortage of 3,547 drop holes, and 61% of the required number of drop holes. There is a significant gap between private and publicly owned schools, with a pupil latrine ratio of 23 in private schools and 64 in publicly owned schools. In fact, the private schools surveyed almost all meet the MOEVT minimum standard, with 97% of the required number of drop holes, leaving a shortage of just 63 drop holes. In contrast, publicly owned schools have only just over a third (35%) of the required number of drop holes, leaving a shortage of over 41,000 in the 16 districts.
Table 10 Latrine numbers, ratios and shortages by type and ownership of schools
girls Boys all pupils
District
# p
up
ils
actu
al #
DH
s
pu
pils
pe
r D
H
req
uir
ed
# D
Hs
sho
rtag
e
suff
icie
ncy
(%
)
# p
up
ils
actu
al #
DH
s
pu
pils
pe
r D
H
req
uir
ed
# D
Hs
Sho
rtag
e
suff
icie
ncy
(%
)
# p
up
ils
actu
al #
DH
s
pu
pils
pe
r D
H
req
uir
ed
# D
Hs
sho
rtag
e
suff
icie
ncy
(%
)
Pre-school only 748 51 15 37 -14 136% 648 44 15 26 -18 170% 1,396 95 15 63 -32 150%
Primary 627,179 9,376 67 31,359 21,983 30% 625,869 8,989 70 25,035 16,046 36% 1,253,048 18,365 68 56,394 38,029 33%
Secondary 89,252 2,984 30 4,463 1,479 67% 115,906 2,568 45 4,636 2,068 55% 205,158 5,552 37 9,099 3,547 61%
Total 717,179 12,411 58 35,859 23,448 35% 742,423 11,601 64 29,697 18,096 39% 1,459,602 24,012 61 65,556 41,544 37%
Private 23,198 1,101 21 1,160 59 95% 23,091 920 25 924 4 100% 46,289 2,021 23 2,084 63 97%
Public 693,981 11,310 61 34,699 23,389 33% 719,332 10,681 67 28,773 18,092 37% 1,413,313 21,991 64 63,472 41,481 35%
Total 717,179 12,411 58 35,859 23,448 35% 742,423 11,601 64 29,697 18,096 39% 1,459,602 24,012 61 65,556 41,544 37%
2.2.3 Schools meeting MOEVT targets for pupil-latrine ratios
Figure 14 presents an analysis of the number of schools meeting the standards for the number of pupils per drop hole in each district. Figure 15 shows the same for each type and ownership of school. The raw data for these charts is included in Annex 1. These figures back up the conclusions drawn above. Private and secondary schools are again seen to be relatively better served, and in terms of districts, Hai and Siha can again be seen to be performing relatively well. However, this figure also reveals that significant numbers of schools in Bagamoyo, Kasulu, Magu, Makete and Mtwara rural have no drop holes at all. Makete and Mtwara Rural are

SWASH Mapping Consolidated National Report
SWASH Mapping Consolidated National Report Page 37
odd cases, since they have both a large number of schools with relatively good pupil-latrine ratios and a large number with no latrines at all.
Figure 14 Number of schools meeting target for latrine numbers by district

SWASH Mapping Consolidated National Report
SWASH Mapping Consolidated National Report Page 38
Figure 15 Number of schools meeting target for latrine numbers by type and ownership of school

SWASH Mapping Consolidated National Report
SWASH Mapping Consolidated National Report Page 39
2.3 Latrine Standards
This section looks at the standards of school latrines in the survey districts. Specifically, this includes data on the type of latrine, the main construction materials used, whether the latrine has suitable access for disabled users, whether it can be emptied and finally whether it offers suitable privacy, including whether a door is present. In line with the WHO/UNICEF Joint Monitoring Programme definitions and those set out in the draft Government of Tanzania National Hygiene and Sanitation Policy, dry compost latrines, Ventilated Improved Pit (VIP) latrines, pour flush latrines and pit latrines with slabs are considered “improved” whereas traditional pit latrines and other types of latrine are “unimproved”.
2.3.1 Latrine types and construction materials
Figure 16 shows the total number of schools and type of latrine in each district, and reveals some interesting differences in common types of latrines constructed between districts. In particular, in Kahama, Maswa and Ngara (and to some extent Magu), VIP latrines are predominant, while pit latrines with slabs are most common in all other districts. Temeke is the only district with a significant proportion of pour-flush latrines.
Figure 16 Number of schools with each latrine type, by district
Figure 17 shows the same data broken down by type and ownership of school. This doesn’t reveal any major differences in the design of latrines between different types of school. In all cases, pit latrines with slabs are the most prevalent, with VIP latrines in second place.
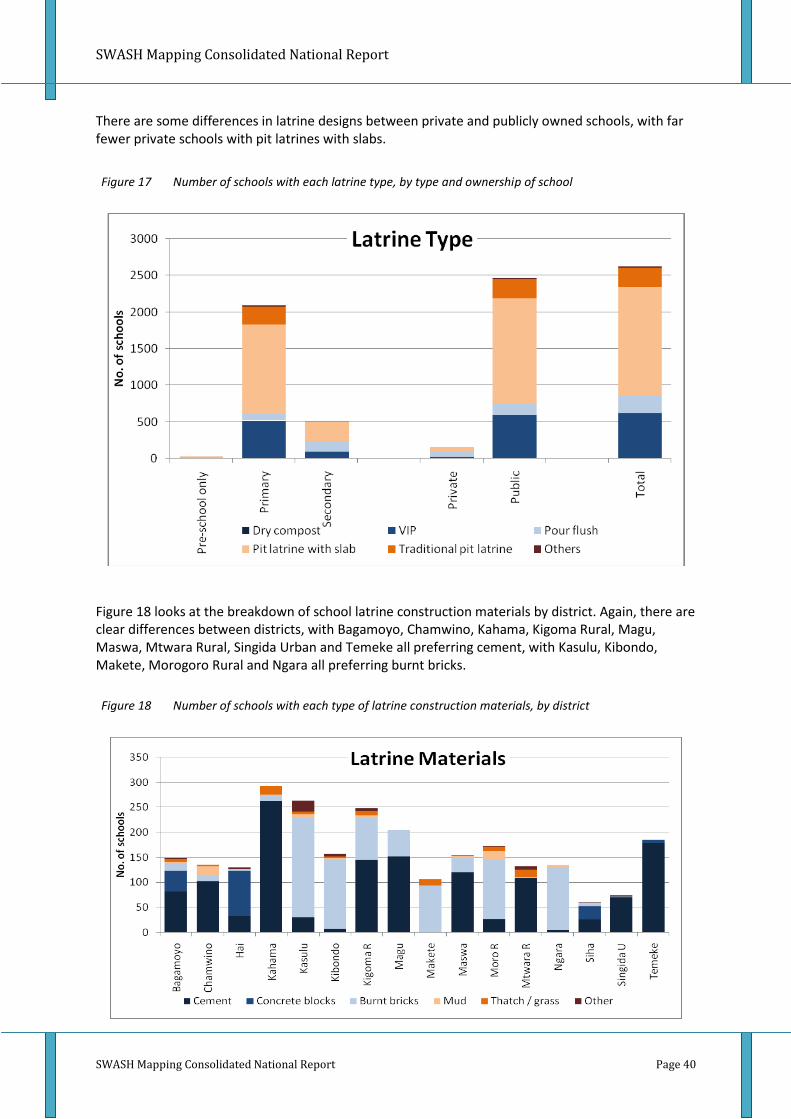
SWASH Mapping Consolidated National Report
SWASH Mapping Consolidated National Report Page 40
There are some differences in latrine designs between private and publicly owned schools, with far fewer private schools with pit latrines with slabs.
Figure 17 Number of schools with each latrine type, by type and ownership of school
Figure 18 looks at the breakdown of school latrine construction materials by district. Again, there are clear differences between districts, with Bagamoyo, Chamwino, Kahama, Kigoma Rural, Magu, Maswa, Mtwara Rural, Singida Urban and Temeke all preferring cement, with Kasulu, Kibondo, Makete, Morogoro Rural and Ngara all preferring burnt bricks.
Figure 18 Number of schools with each type of latrine construction materials, by district

SWASH Mapping Consolidated National Report
SWASH Mapping Consolidated National Report Page 41
The same data broken down by type and ownership of school – see figure 19 – shows little difference in latrine construction materials. The only significant difference in that private schools have a greater proportion of schools with latrines constructed of cement.
Figure 19 Number of schools with each type of latrine construction materials, by type and ownership of school
2.3.2 Latrine suitability for the disabled
Designs of latrines for adults and children with disabilities should take into account the safety and convenience of users. If accessible designs are taken into account during the conception phase additional costs represent only around 1% of the total cost of a building. This is a small sum for enabling some of the children most in need of an education to access school sanitary facilities with dignity and safety.
Figures 20 and 21 show the number of schools with latrines that are suitable for use by disabled pupils, first broken down by district, and then by type and ownership of school. When assessing if the schools were accessible for children with disabilities, the access path, door size and other features were considered, to assess whether a child in a wheelchair would be able to utilise the latrine. In only one case – Temeke – are there a significant number of schools with disability-friendly latrine designs. Other than this example, there is no substantial variation between districts or between type and ownership of school.

SWASH Mapping Consolidated National Report
SWASH Mapping Consolidated National Report Page 42
Figure 20 Latrine suitability for use by disabled pupils, by district
Figure 21 Latrine suitability for use by disabled pupils, by type and ownership of school
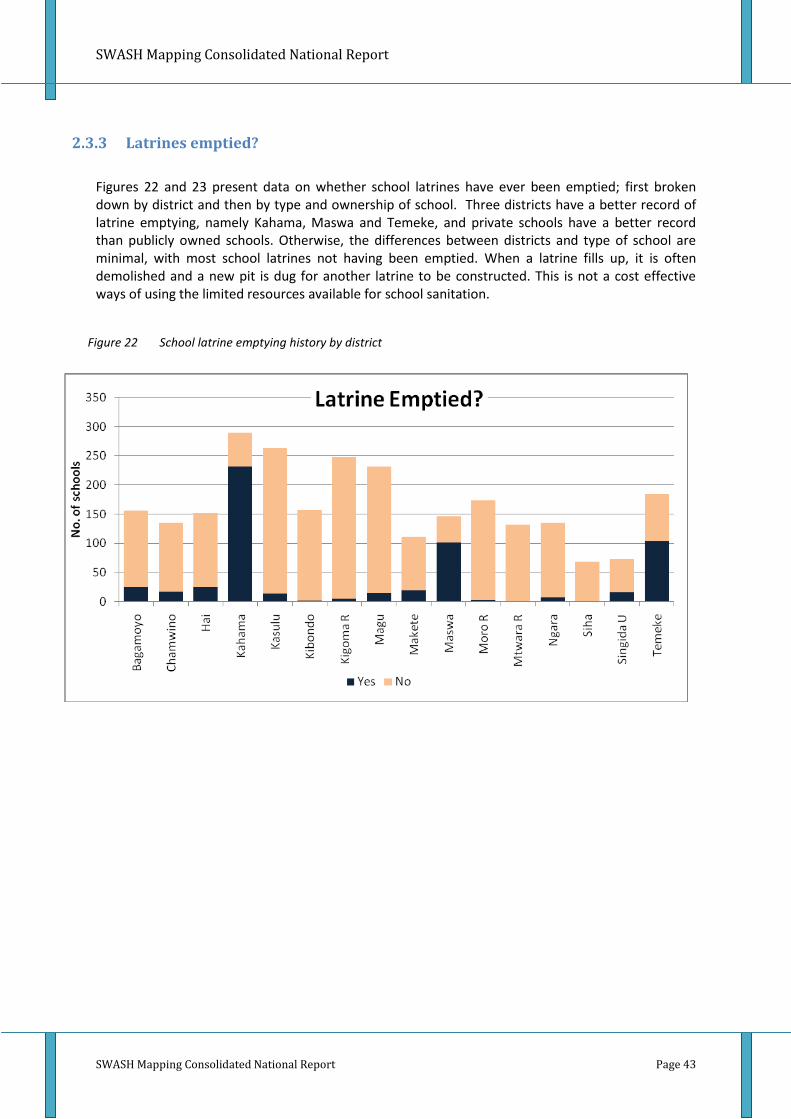
SWASH Mapping Consolidated National Report
SWASH Mapping Consolidated National Report Page 43
2.3.3 Latrines emptied?
Figures 22 and 23 present data on whether school latrines have ever been emptied; first broken down by district and then by type and ownership of school. Three districts have a better record of latrine emptying, namely Kahama, Maswa and Temeke, and private schools have a better record than publicly owned schools. Otherwise, the differences between districts and type of school are minimal, with most school latrines not having been emptied. When a latrine fills up, it is often demolished and a new pit is dug for another latrine to be constructed. This is not a cost effective ways of using the limited resources available for school sanitation.
Figure 22 School latrine emptying history by district
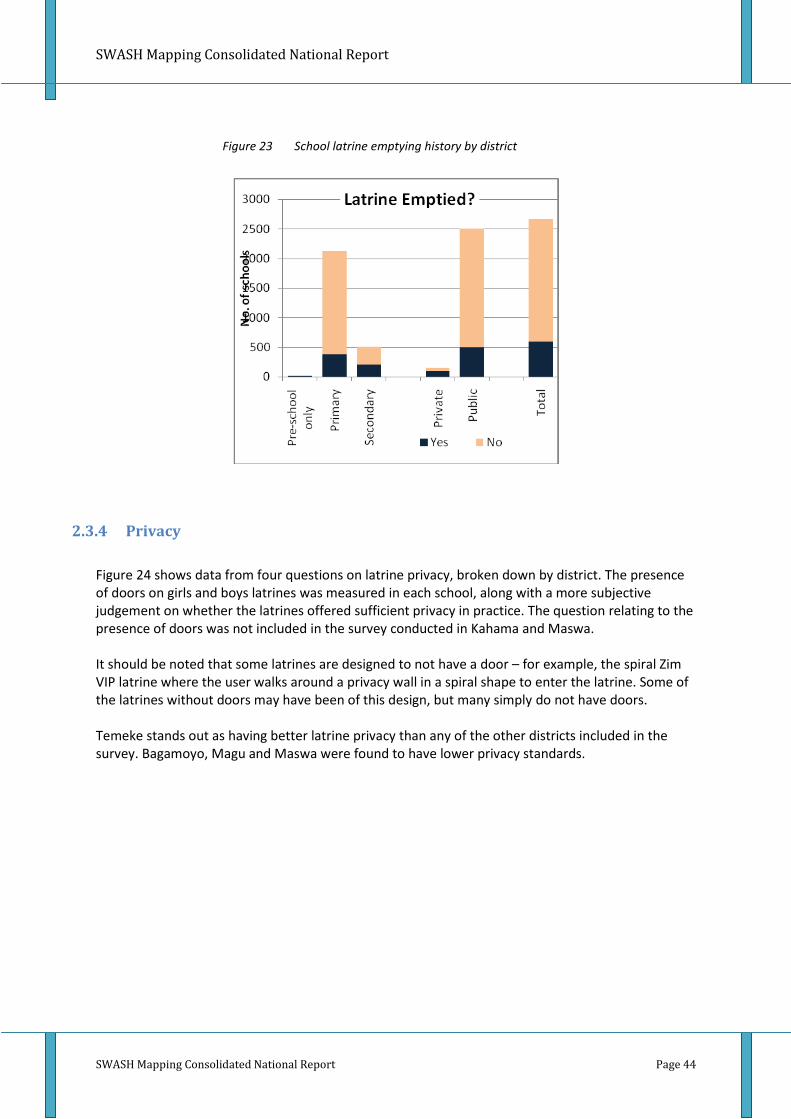
SWASH Mapping Consolidated National Report
SWASH Mapping Consolidated National Report Page 44
Figure 23 School latrine emptying history by district
2.3.4 Privacy
Figure 24 shows data from four questions on latrine privacy, broken down by district. The presence of doors on girls and boys latrines was measured in each school, along with a more subjective judgement on whether the latrines offered sufficient privacy in practice. The question relating to the presence of doors was not included in the survey conducted in Kahama and Maswa. It should be noted that some latrines are designed to not have a door – for example, the spiral Zim VIP latrine where the user walks around a privacy wall in a spiral shape to enter the latrine. Some of the latrines without doors may have been of this design, but many simply do not have doors. Temeke stands out as having better latrine privacy than any of the other districts included in the survey. Bagamoyo, Magu and Maswa were found to have lower privacy standards.

SWASH Mapping Consolidated National Report
SWASH Mapping Consolidated National Report Page 45
Figure 24 Latrine privacy, by district
2.4 Latrine Hygiene
This section looks at the hygiene facilities and latrine cleanliness. This includes the facilities that are available for anal cleansing, disposal of hygienic menstrual pads and hand-washing facilities with water and soap. It also includes some data on the hygiene standards as observed by the survey team assessment of whether the latrines were clean, smelly or soiled, or considered to be dirty.
2.4.1 Anal cleansing and hygienic pad disposal
Figures 25-27 and 28-30 present data on the availability and type of anal cleansing materials and presence of hygienic pad disposal facilities, by district and then by type and ownership of school. Schools in Chamwino, Kasulu, Kigoma Rural and Temeke have relatively good availability of anal cleansing materials, with paper the predominant material in the first three cases and water in Temeke. However, the majority of schools do not have anal cleansing materials available. Both secondary and private schools have greater availability of anal cleansing materials, with water dominating in both cases. Availability of hygienic pad disposal facilities – critical for the retention of girls in school - differs greatly between districts, with the vast majority of schools in Magu, Makete, Morogoro Rural, Mtwara Rural, Ngara and Singida Urban all having such facilities, compared to almost no schools in other districts. A school was considered to have adequate disposal facilities if they have an
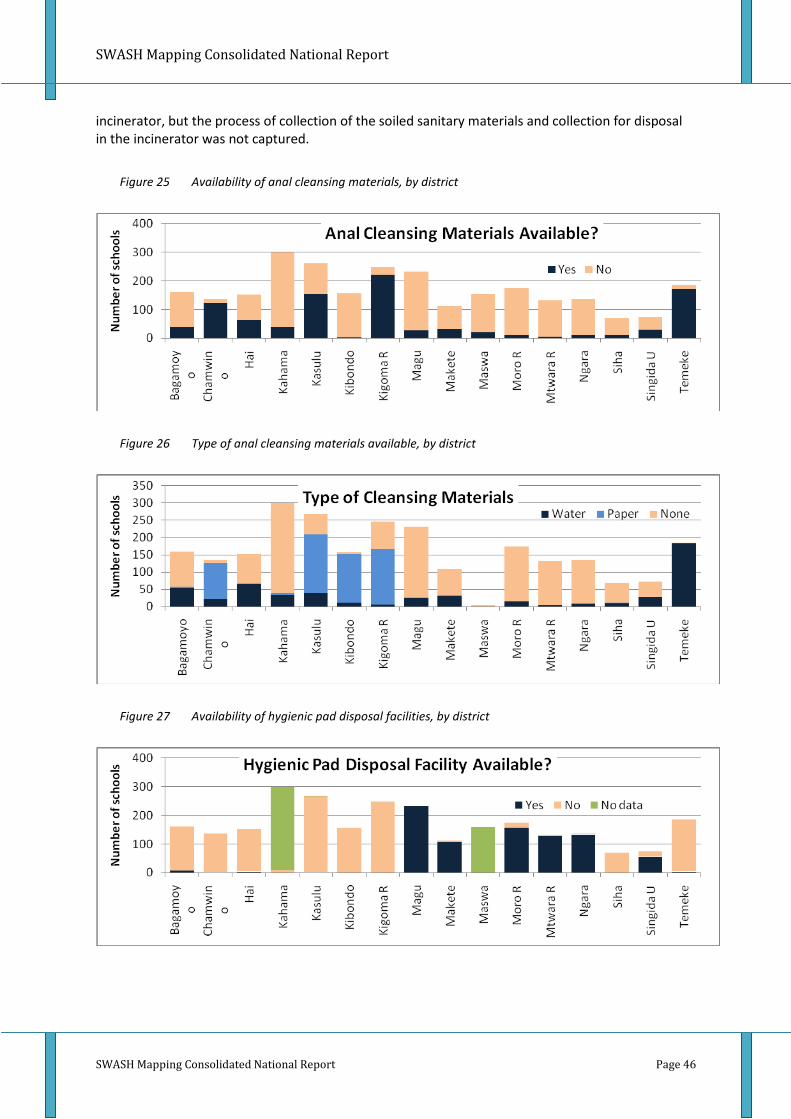
SWASH Mapping Consolidated National Report
SWASH Mapping Consolidated National Report Page 46
incinerator, but the process of collection of the soiled sanitary materials and collection for disposal in the incinerator was not captured.
Figure 25 Availability of anal cleansing materials, by district
Figure 26 Type of anal cleansing materials available, by district
Figure 27 Availability of hygienic pad disposal facilities, by district

SWASH Mapping Consolidated National Report
SWASH Mapping Consolidated National Report Page 47
Figure 28 Availability of anal cleansing materials, by type and ownership of school
Figure 29 Type of anal cleansing materials available, by type and ownership of school
Figure 30 Availability of hygienic pad disposal facilities, by type and ownership of school
2.4.2 Hand-washing facilities
All schools should have at least one functional hand-washing facility in a convenient location near to the latrines with adequate clean water and soap or ash.
Figures 31-38 present data on school hand-washing facilities, including whether such a facility exists, what type of facility it is, and whether water and soap are available at the facility. This is broken down first by district and then by type and ownership of school. Most schools do not have a hand-washing facility, though some districts do perform better than others in this regard. Schools in Magu, Makete and Temeke are more likely to have hand-washing facilities available, with stand-pipes predominating in Makete and Temeke, and fixed containers in Magu.

SWASH Mapping Consolidated National Report
SWASH Mapping Consolidated National Report Page 48
Availability of functioning hand-washing facilities has linkages to the availability of water. Only the same three districts – Makete, Temeke and Magu – have significant numbers of schools with water is available for hand-washing, and even in these cases this is the minority of schools. Some districts such as Siha have a high number of schools with piped water supply, but still very low numbers of functioning hand-washing facilities. This indicates a lack of priority given to hand-washing. In total 92% of schools do not have functional hand-washing facilities (either availability of facilities or insufficient water supply for handwashing) which potentially means that more than 92% of children across Tanzania go to the toilet and then return to the classroom without washing their hands. Availability of soap is even worse, with almost no schools having soap available for hand-washing in any district.
Figure 31 Availability of handwashing facilities, by district
Figure 32 Type of handwashing facilities available, by district

SWASH Mapping Consolidated National Report
SWASH Mapping Consolidated National Report Page 49
Figure 33 Availability of water for handwashing, by district
Figure 34 Availability of soap for handwashing, by district
There are no major differences between primary and secondary schools in terms of the availability of hand-washing facilities, in the type of facility available, or in the availability of water and soap. Private schools perform slightly better than public schools on all four measures.

SWASH Mapping Consolidated National Report
SWASH Mapping Consolidated National Report Page 50
Figure 35 Availability of handwashing facilities, by type and ownership of school
Figure 36 Type of handwashing facility, by type and ownership of school
Figure 37 Availability of water for handwashing, by type and ownership of school
Figure 38 Availability of soap for handwashing, by type and ownership of school
2.4.3 Latrine cleanliness
The only districts in which a significant number of schools were reported as having latrines that were neither smelly nor soiled were Kahama and Magu – see figure 39. However, there are a large proportion of schools in some districts for which no data on this question is available, and therefore no clear conclusions can be drawn in these cases.
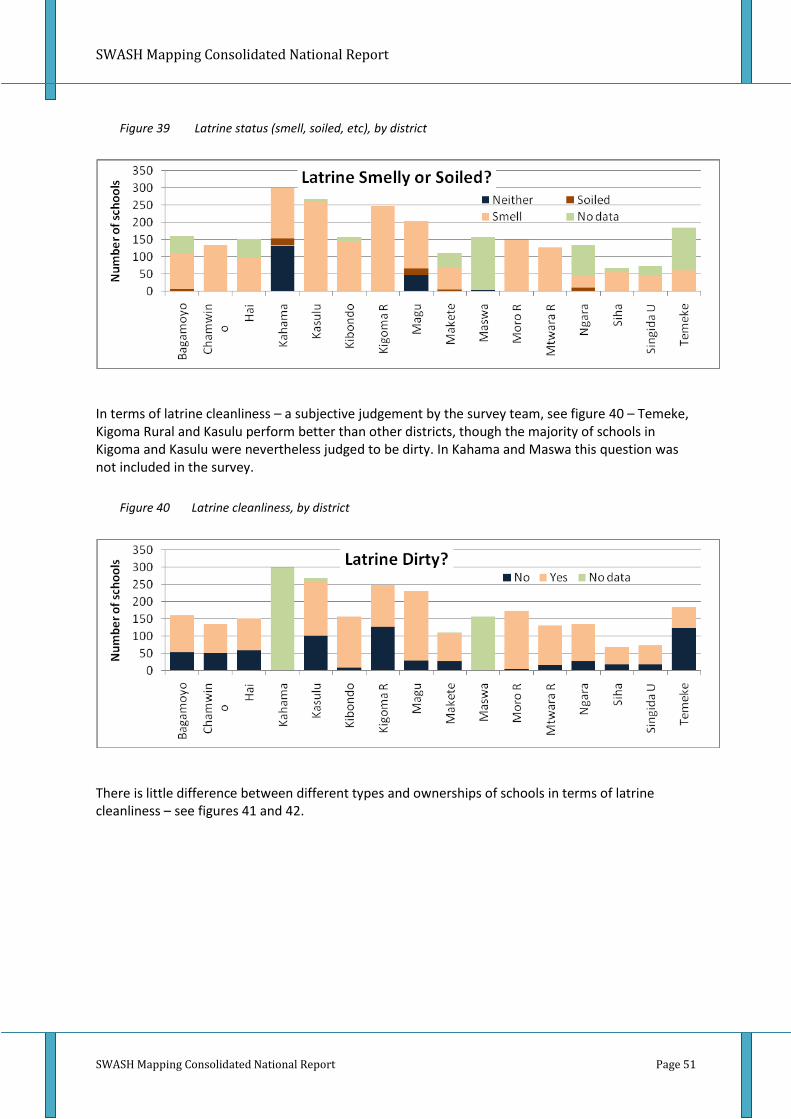
SWASH Mapping Consolidated National Report
SWASH Mapping Consolidated National Report Page 51
Figure 39 Latrine status (smell, soiled, etc), by district
In terms of latrine cleanliness – a subjective judgement by the survey team, see figure 40 – Temeke, Kigoma Rural and Kasulu perform better than other districts, though the majority of schools in Kigoma and Kasulu were nevertheless judged to be dirty. In Kahama and Maswa this question was not included in the survey.
Figure 40 Latrine cleanliness, by district
There is little difference between different types and ownerships of schools in terms of latrine cleanliness – see figures 41 and 42.

SWASH Mapping Consolidated National Report
SWASH Mapping Consolidated National Report Page 52
Figure 41 Latrine status (smell, soiled, etc), by type and ownership of school
Figure 42 Latrine cleanliness, by type and ownership of school
2.5 Water Supply
This section looks at schools’ water supply. Water supply is required in schools both for drinking and for hygiene. The survey considered first at the type of water supply: whether is it a piped supply, a hand-drilled well, a shallow well or rainwater harvesting (all considered “improved” by WHO/UNICEF Joint Monitoring Programme standards) or another type of source (considered “unimproved” by WHO/UNICEF Joint Monitoring Programme standards). Second, it looked at where the source is located – on the schools premises or elsewhere (requiring time for pupils to fetch water). And finally, it looked at whether the source was functional at the time of the survey.
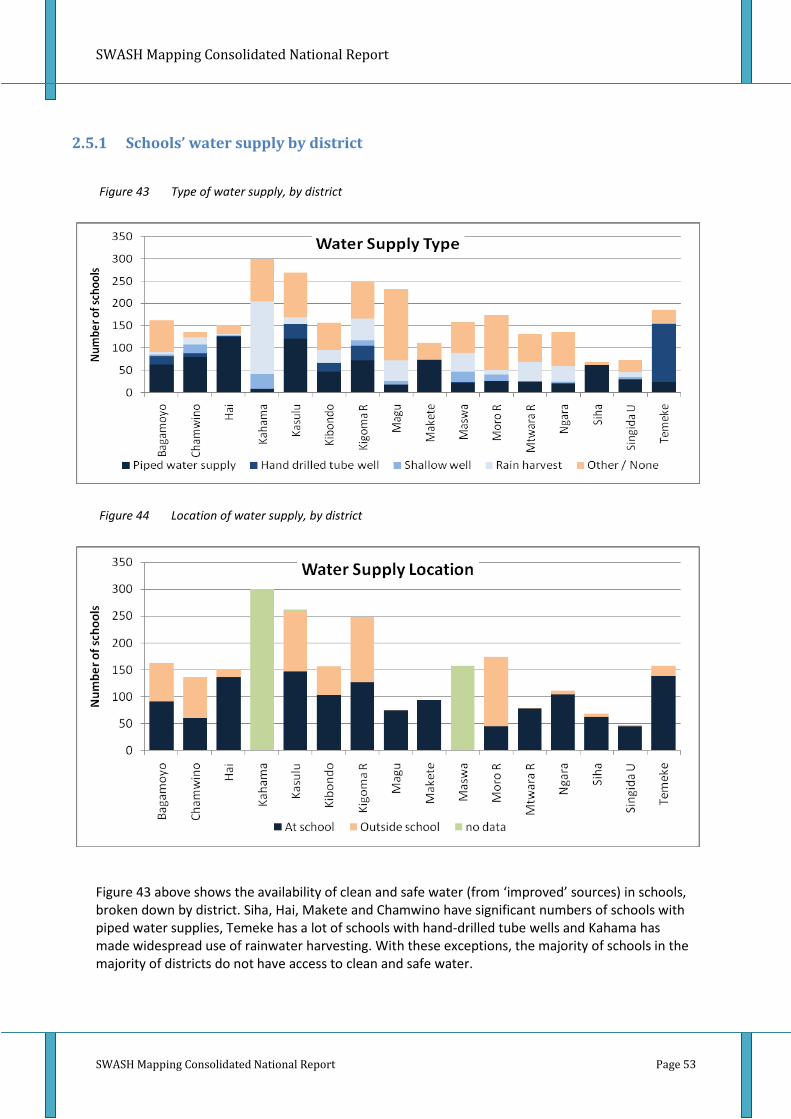
SWASH Mapping Consolidated National Report
SWASH Mapping Consolidated National Report Page 53
2.5.1 Schools’ water supply by district
Figure 43 Type of water supply, by district
Figure 44 Location of water supply, by district
Figure 43 above shows the availability of clean and safe water (from ‘improved’ sources) in schools, broken down by district. Siha, Hai, Makete and Chamwino have significant numbers of schools with piped water supplies, Temeke has a lot of schools with hand-drilled tube wells and Kahama has made widespread use of rainwater harvesting. With these exceptions, the majority of schools in the majority of districts do not have access to clean and safe water.

SWASH Mapping Consolidated National Report
SWASH Mapping Consolidated National Report Page 54
In most of the survey districts, almost all school water supplies are found on the school premises, with the exceptions being Bagamoyo, Chamwino, Kasulu, Kigoma Rural and Morogoro Rural – see figure 44 above. There is no data available for Kahama and Maswa districts on water supply location. This is a positive finding since it means that in most cases pupils are not required to walk distances to fetch water. The functionality rate of water supplies varies greatly by district – see figure45. In Siha, Hai, Makete, Chamwino and Temeke, the majority of schools have functioning water supplies, compared to Magu, Morogoro Rural, Bagamoyo and Kigoma Rural, where the majority of cases water supply to the schools was not functional at the time of the survey.
Figure 45 Water supply functionality, by district
2.5.2 School water supply, by type and ownership of school
Looking at the same data broken down by type and ownership of school – see figures 2.44-2.46 – both secondary and private schools perform significantly better than primary and publicly owned schools. This is the case in all three measures – type of supply, location and functionality.

SWASH Mapping Consolidated National Report
SWASH Mapping Consolidated National Report Page 55
Figure 46 Type of water supply by type and ownership of school
Figure 47 Water supply location, by type and ownership of school
Figure 48 Water supply functionality, by type and ownership of school

SWASH Mapping Consolidated National Report
SWASH Mapping Consolidated National Report Page 56
2.6 Hygiene Education
This section looks at whether hygiene education is being taught in the schools surveyed. It looks first at whether any such teaching takes place, second at whether any teacher is specifically trained to provide hygiene education, and finally at whether any hygiene education teaching materials are available. Please note that the survey did not look at the type or quality of hygiene education.
2.6.1 Hygiene education by district
Figure 49 Schools in which hygiene education taking place, by district
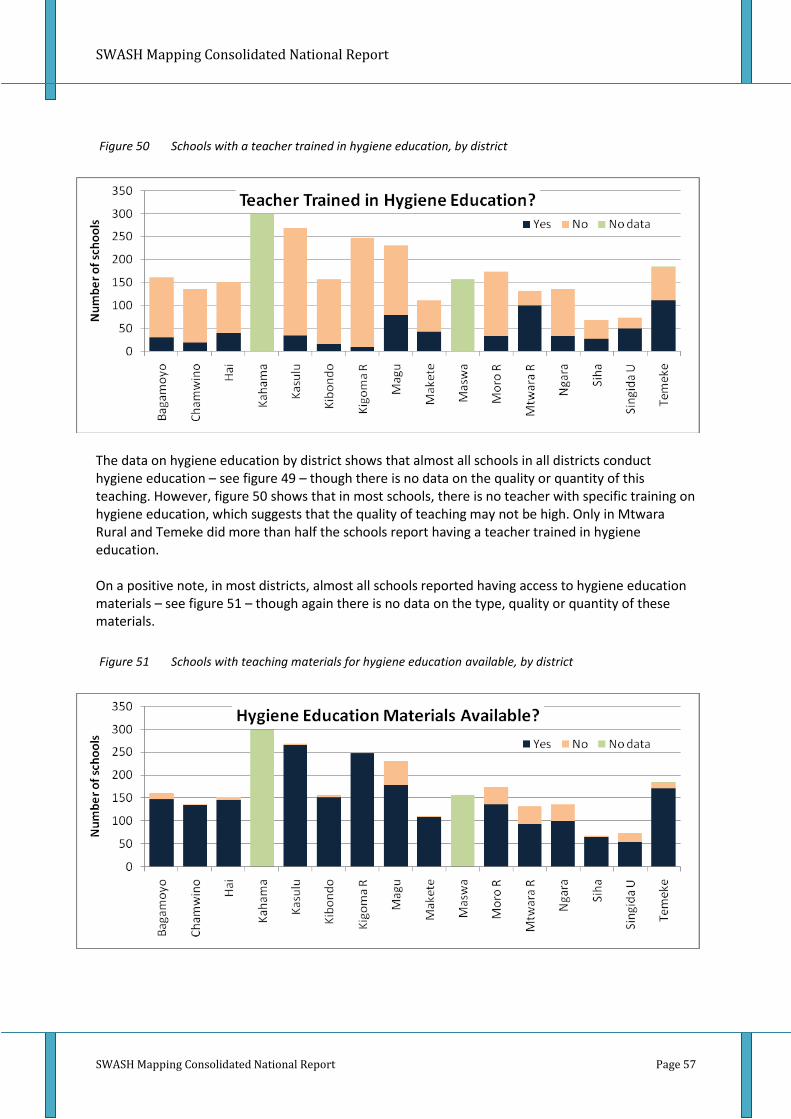
SWASH Mapping Consolidated National Report
SWASH Mapping Consolidated National Report Page 57
Figure 50 Schools with a teacher trained in hygiene education, by district
The data on hygiene education by district shows that almost all schools in all districts conduct hygiene education – see figure 49 – though there is no data on the quality or quantity of this teaching. However, figure 50 shows that in most schools, there is no teacher with specific training on hygiene education, which suggests that the quality of teaching may not be high. Only in Mtwara Rural and Temeke did more than half the schools report having a teacher trained in hygiene education. On a positive note, in most districts, almost all schools reported having access to hygiene education materials – see figure 51 – though again there is no data on the type, quality or quantity of these materials.
Figure 51 Schools with teaching materials for hygiene education available, by district

SWASH Mapping Consolidated National Report
SWASH Mapping Consolidated National Report Page 58
2.6.2 Hygiene education, by type and ownership of school
Figures 52-54 below find very little difference in hygiene education between different types of schools or between public and private schools. However, since the data does not report on quality or quantity of hygiene education, it may hide significant differences between different types of schools.
Figure 52 Schools in which hygiene education taking place, by type and ownership of school
Figure 53 Schools with a teacher trained in hygiene education, by type and ownership of school
Figure 54 Schools with teaching materials for hygiene education available, by type and ownership of school
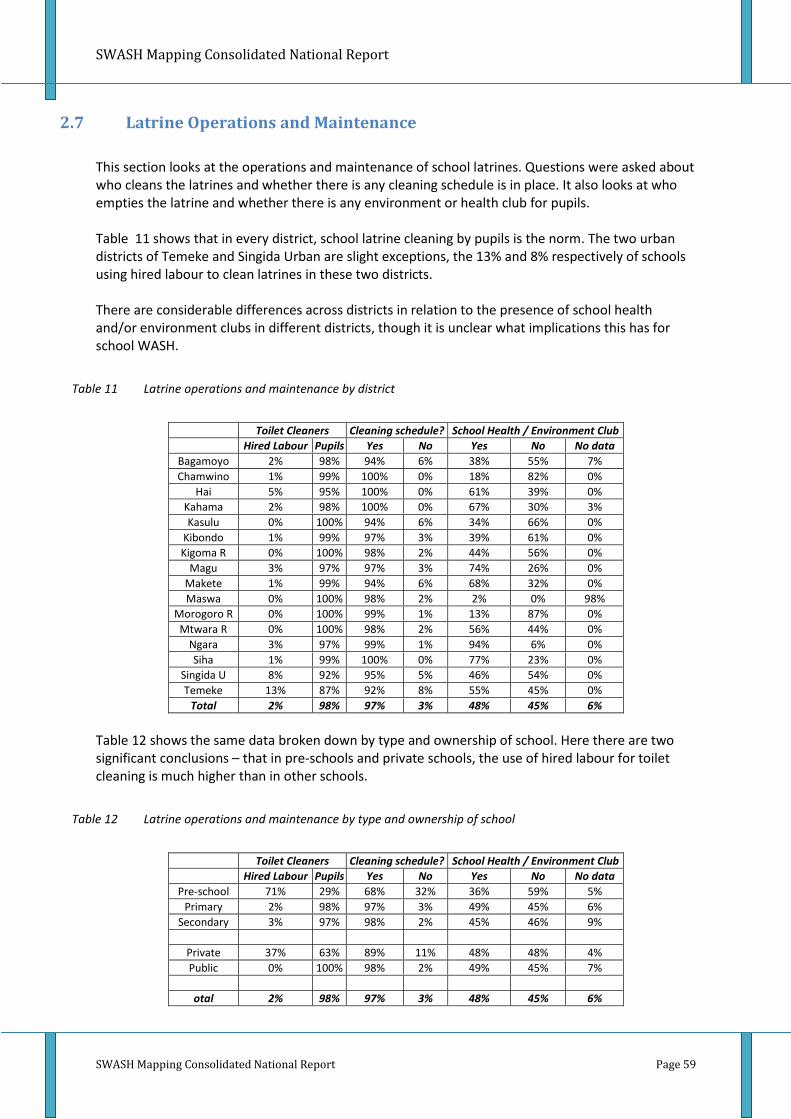
SWASH Mapping Consolidated National Report
SWASH Mapping Consolidated National Report Page 59
2.7 Latrine Operations and Maintenance
This section looks at the operations and maintenance of school latrines. Questions were asked about who cleans the latrines and whether there is any cleaning schedule is in place. It also looks at who empties the latrine and whether there is any environment or health club for pupils. Table 11 shows that in every district, school latrine cleaning by pupils is the norm. The two urban districts of Temeke and Singida Urban are slight exceptions, the 13% and 8% respectively of schools using hired labour to clean latrines in these two districts. There are considerable differences across districts in relation to the presence of school health and/or environment clubs in different districts, though it is unclear what implications this has for school WASH.
Table 11 Latrine operations and maintenance by district
Toilet Cleaners Cleaning schedule? School Health / Environment Club
Hired Labour Pupils Yes No Yes No No data
Bagamoyo 2% 98% 94% 6% 38% 55% 7%
Chamwino 1% 99% 100% 0% 18% 82% 0%
Hai 5% 95% 100% 0% 61% 39% 0%
Kahama 2% 98% 100% 0% 67% 30% 3%
Kasulu 0% 100% 94% 6% 34% 66% 0%
Kibondo 1% 99% 97% 3% 39% 61% 0%
Kigoma R 0% 100% 98% 2% 44% 56% 0%
Magu 3% 97% 97% 3% 74% 26% 0%
Makete 1% 99% 94% 6% 68% 32% 0%
Maswa 0% 100% 98% 2% 2% 0% 98%
Morogoro R 0% 100% 99% 1% 13% 87% 0%
Mtwara R 0% 100% 98% 2% 56% 44% 0%
Ngara 3% 97% 99% 1% 94% 6% 0%
Siha 1% 99% 100% 0% 77% 23% 0%
Singida U 8% 92% 95% 5% 46% 54% 0%
Temeke 13% 87% 92% 8% 55% 45% 0%
Total 2% 98% 97% 3% 48% 45% 6%
Table 12 shows the same data broken down by type and ownership of school. Here there are two significant conclusions – that in pre-schools and private schools, the use of hired labour for toilet cleaning is much higher than in other schools.
Table 12 Latrine operations and maintenance by type and ownership of school
Toilet Cleaners Cleaning schedule? School Health / Environment Club
Hired Labour Pupils Yes No Yes No No data
Pre-school 71% 29% 68% 32% 36% 59% 5%
Primary 2% 98% 97% 3% 49% 45% 6%
Secondary 3% 97% 98% 2% 45% 46% 9%
Private 37% 63% 89% 11% 48% 48% 4%
Public 0% 100% 98% 2% 49% 45% 7%
otal 2% 98% 97% 3% 48% 45% 6%

SWASH Mapping Consolidated National Report
SWASH Mapping Consolidated National Report Page 60
2.8 Governance and Accountability
This final section of the report on the mapping survey looks at data on governance and accountability, including whether any monitoring by district or village government takes place, and if so, how regularly. It also looks at whether the school has any WASH guidelines and / or master plan in place and in use, whether school WASH is discussed in public meetings, and whether the school has a strategy for WASH improvement.
Table 13 Governance and accountability by district - % of schools in the district
Monitoring by district Monitoring by village WASH guidelines in place WASH guidelines in use
once per
term Twice per
term Never
once per term
Twice per term
Never Yes No no data Yes No
Bagamoyo 9% 17% 73% 59% 7% 35% 96% 4% 0% 78% 22%
Chamwino 100% 0% 0% 100% 0% 0% 100% 0% 0% 99% 1%
Hai 18% 21% 61% 97% 0% 3% 99% 1% 0% 86% 14%
Kahama 4% 55% 41% 0% 0% 100% 0% 0% 100% 94% 6%
Kasulu 46% 46% 8% 99% 0% 1% 100% 0% 0% 91% 9%
Kibondo 17% 67% 17% 100% 0% 0% 97% 3% 0% 71% 29%
Kigoma R 0% 0% 0% 100% 0% 0% 100% 0% 0% 96% 4%
Magu 39% 4% 57% 47% 2% 51% 99% 1% 0% 68% 32%
Makete 63% 34% 3% 98% 1% 1% 100% 0% 0% 40% 60%
Maswa 3% 49% 49% 0% 0% 100% 96% 2% 2% 98% 2%
Morogoro R 10% 90% 0% 60% 40% 0% 49% 51% 0% 18% 82%
Mtwara R 91% 6% 3% 98% 0% 2% 100% 0% 0% 59% 41%
Ngara 57% 1% 42% 60% 0% 40% 99% 1% 0% 67% 33%
Siha 10% 23% 67% 97% 3% 0% 97% 3% 0% 70% 30%
Singida U 98% 2% 0% 95% 0% 5% 100% 0% 0% 99% 1%
Temeke 82% 1% 17% 12% 0% 88% 98% 2% 0% 93% 7%
Total 32% 25% 43% 64% 2% 34% 85% 4% 11% 79% 21%
School WASH discussed in
public meeting Master Plan in place? Master plan followed?
Strategy for WASH Improvement?
Yes No Yes No no data Yes No no data Yes No no data
Bagamoyo 87% 13% 42% 58% 0% 33% 67% 0% 31% 69% 0%
Chamwino 100% 0% 26% 74% 0% 21% 79% 0% 88% 12% 0%
Hai 89% 11% 28% 72% 0% 29% 71% 0% 38% 62% 0%
Kahama 64% 36% 0% 0% 100% 0% 0% 100% 0% 0% 100%
Kasulu 90% 10% 19% 81% 0% 18% 82% 0% 65% 35% 0%
Kibondo 75% 25% 10% 90% 0% 11% 89% 0% 52% 48% 0%
Kigoma R 96% 4% 9% 91% 0% 9% 91% 0% 97% 3% 0%
Magu 71% 29% 9% 91% 0% 30% 70% 0% 87% 13% 0%
Makete 79% 21% 1% 99% 0% 0% 100% 0% 100% 0% 0%
Maswa 65% 35% 0% 0% 100% 0% 0% 100% 0% 0% 100%
Morogoro R 68% 32% 2% 98% 0% 1% 99% 0% 99% 1% 0%
Mtwara R 99% 1% 0% 100% 0% 0% 100% 0% 98% 2% 0%
Ngara 71% 29% 21% 79% 0% 10% 90% 0% 100% 0% 0%
Siha 74% 26% 16% 84% 0% 16% 84% 0% 13% 87% 0%
Singida U 95% 5% 4% 96% 0% 5% 95% 0% 92% 8% 0%
Temeke 93% 7% 27% 73% 0% 24% 76% 0% 22% 78% 0%
Total 82% 18% 13% 70% 17% 13% 70% 17% 59% 24% 17%
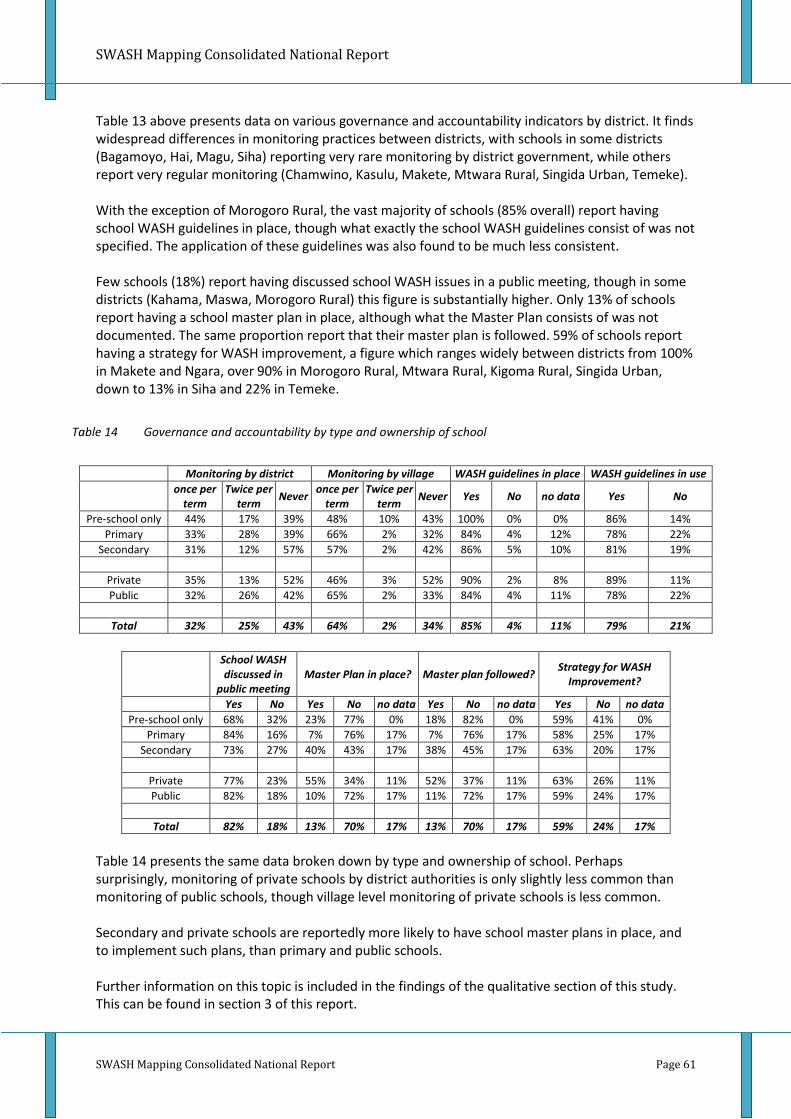
SWASH Mapping Consolidated National Report
SWASH Mapping Consolidated National Report Page 61
Table 13 above presents data on various governance and accountability indicators by district. It finds widespread differences in monitoring practices between districts, with schools in some districts (Bagamoyo, Hai, Magu, Siha) reporting very rare monitoring by district government, while others report very regular monitoring (Chamwino, Kasulu, Makete, Mtwara Rural, Singida Urban, Temeke). With the exception of Morogoro Rural, the vast majority of schools (85% overall) report having school WASH guidelines in place, though what exactly the school WASH guidelines consist of was not specified. The application of these guidelines was also found to be much less consistent. Few schools (18%) report having discussed school WASH issues in a public meeting, though in some districts (Kahama, Maswa, Morogoro Rural) this figure is substantially higher. Only 13% of schools report having a school master plan in place, although what the Master Plan consists of was not documented. The same proportion report that their master plan is followed. 59% of schools report having a strategy for WASH improvement, a figure which ranges widely between districts from 100% in Makete and Ngara, over 90% in Morogoro Rural, Mtwara Rural, Kigoma Rural, Singida Urban, down to 13% in Siha and 22% in Temeke.
Table 14 Governance and accountability by type and ownership of school
Monitoring by district Monitoring by village WASH guidelines in place WASH guidelines in use
once per
term Twice per
term Never
once per term
Twice per term
Never Yes No no data Yes No
Pre-school only 44% 17% 39% 48% 10% 43% 100% 0% 0% 86% 14%
Primary 33% 28% 39% 66% 2% 32% 84% 4% 12% 78% 22%
Secondary 31% 12% 57% 57% 2% 42% 86% 5% 10% 81% 19%
Private 35% 13% 52% 46% 3% 52% 90% 2% 8% 89% 11%
Public 32% 26% 42% 65% 2% 33% 84% 4% 11% 78% 22%
Total 32% 25% 43% 64% 2% 34% 85% 4% 11% 79% 21%
School WASH discussed in
public meeting Master Plan in place? Master plan followed?
Strategy for WASH Improvement?
Yes No Yes No no data Yes No no data Yes No no data
Pre-school only 68% 32% 23% 77% 0% 18% 82% 0% 59% 41% 0%
Primary 84% 16% 7% 76% 17% 7% 76% 17% 58% 25% 17%
Secondary 73% 27% 40% 43% 17% 38% 45% 17% 63% 20% 17%
Private 77% 23% 55% 34% 11% 52% 37% 11% 63% 26% 11%
Public 82% 18% 10% 72% 17% 11% 72% 17% 59% 24% 17%
Total 82% 18% 13% 70% 17% 13% 70% 17% 59% 24% 17%
Table 14 presents the same data broken down by type and ownership of school. Perhaps surprisingly, monitoring of private schools by district authorities is only slightly less common than monitoring of public schools, though village level monitoring of private schools is less common. Secondary and private schools are reportedly more likely to have school master plans in place, and to implement such plans, than primary and public schools. Further information on this topic is included in the findings of the qualitative section of this study. This can be found in section 3 of this report.

SWASH Mapping Consolidated National Report
SWASH Mapping Consolidated National Report Page 62
3 Governance and Validation Findings
General findings
There has been a lack of effective planning to ensure that there are adequate school WaSH facilities which cater for the increased enrolment of school children which has taken place since the abolition of school fees in 2002. Increased numbers of children in school put pressure on already scarce facilities, raising the costs of operation and maintenance and curtailing the life span of facilities.
Lack of teaching staff is felt to contribute to low quality hygiene education and supervision of sanitation and hygiene practices within school. The lack of teachers was felt to be more acute in rural and remote areas where housing is scarce.
Schools are not considered as environments where children can learn to lead a healthier, clean and civilized life. Health education is currently provided in primary school as an integral part of science subjects. The results are patchy and do not fully cover important elements of behavioural development and associated practices such as hand washing, proper use of sanitation and hygiene facilities. This is a major area where education policy and school curricula need further development.
There are factors beyond the governance challenges which affect the quality of school water supply, sanitation and hygiene. These include availability of water and the geographical remoteness of schools, which appears to affect the school’s ability to attract teaching staff, the frequency of monitoring and supervision and the ability to attract resources from NGOs and other development partners.
Lack of priority given to school WASH
The lamentable state of school WASH is the result of a lack of political pressure and support from higher echelons of government. Developing infrastructure in schools has not been considered a priority by those developing and implementing education, health or child development programmes. Both phases of the Primary Education Development Program (PEDP) have focused on enrolment expansion. The PEDP II has targets for resources to be allocated for both latrines and water supply, but the actual allocation is believed to be minimal.
The priority given to the quality of the learning environment is closely linked to whether communities consider education to be a priority. In Maswa, the majority of the communities are cattle keepers who do not consider education to be important. There are examples of parents telling pupils to answer wrongly during the exams so that he will fail and be free to graze the cattle.
School committees and head teachers have low awareness of the importance of WASH to child health. As a result, they have not prioritised WASH in school development. The priority in many of the schools visited was found to be the construction of classrooms, followed by the acquisition of desks and construction of teachers’ houses. A school like Binza primary located in Maswa town had a sufficient number of classrooms but only 1 block of 6 drop holes for 1116 pupils.
There is a need for a holistic approach to sanitation and hygiene promotion. Provision and availability of safe water, sanitation facilities and good hygienic practices in schools depends on practices in the surrounding community. Parents who are aware of the positive health impacts from safe water and good sanitation and hygiene are likely to give higher priority for sanitation improvement in schools.

SWASH Mapping Consolidated National Report
SWASH Mapping Consolidated National Report Page 63
Financing5
There are two main grants transferred to schools from the councils; the Capitation Grant and the Local Government Capital Development Grant. Both Capitation and Development Grants to schools represent small shares of total education expenditures. The former is to support non-wage inputs to schools, the latter for school infrastructure improvements, including construction and rehabilitation of classrooms, teacher houses, libraries, school laboratories, administration buildings, latrines, etc.
In 2008, Capitation Grant and Development Grant transferred to primary schools accounted for 6,436 TSh per student (5.1 USD). This is clearly inadequate given the development costs associated with providing water supply, sanitation and hygiene promotion (WaterAid estimates the unit cost of an integrated intervention in schools (water, sanitation and hygiene plus overheads) to be 112 USD/per pupil and UNICEF estimates that the cost for bringing an average school in Tanzania to a reasonable minimum WASH standard as costing between USD 60 - 115 / pupil, excluding implementing organisational overhead costs, depending on the number of pupils and what the facilities were like to begin with). The Capitation Grant is not designed to cover the costs of operation and maintenance of WASH infrastructure (for example, water fees, cleaning, pit emptying and minor repairs).
Schools receive capitation funds from the government on a quarterly basis. However, funds received under the capitation grant are often less than what was budgeted. Funds are also frequently received late complicating utilisation of the grants. The grant is made in instalments which makes it difficult to manage procurement of large scale infrastructure.
There is little discretion for LGAs to use the capitation grant according to specific needs. Teachers have no say over how this grant is used (Siha)
A major source of income for government secondary schools is school fees. All secondary schools charge an annual fee of twenty thousand Tanzanian shillings per student which covers 50% of the official set fees. The remaining 50% is supposed to be topped up by the government. Interviews in Mtwara revealed that in many circumstances these top up funds not paid to the schools.
Cash and in kind contributions from parents are managed by head teachers and school management committees and sometimes by parents themselves. However, many schools do not keep full records of such contributions, and in particular for contributions managed by the parents themselves. In addition, schools also receive contributions from NGOs and other private sector organisations and entities, which are not always fully accounted for.
In some districts like Ngara, finance also comes from school farms and other productive activities. However, it seems that most schools do not other sources of income besides that from the government.
For public schools, government funds are managed by the Head teacher/ Headmaster, with utilisation of funds authorised by the school committee whose members comprise of representatives of parents, teachers and community members. For the private schools the funds are managed by school managers. Utilization of school funds is normally authorized by the school committees while the funds from the community members are managed by the village government.
In Magu, it was reported that procurement for school WASH was being done informally due to limited funds and the bureaucracy involved in formal procurement. This practice was not felt to be transparent and was leading to lack of trust between different parties.
5 Additional information taken from Jens Claussen and Mussa J. Assad (2010), Public Expenditure Tracking
Survey for Primary and Secondary Education in Mainland Tanzania

SWASH Mapping Consolidated National Report
SWASH Mapping Consolidated National Report Page 64
Confusion of roles and responsibilities
The Education and Training Policy (1995) and the Education Sector Development Programme (2001) established schools as the initial planning unit. However, in practice most schools do not seem to be independent from the village government. Discussions revealed confusion about decision making powers of village government and school committees.
Operation and maintenance (O & M) is felt to be the responsibility of the school management, with more complex issues are being referred to the village governments as owners of the schools. However, the district is supposed to play a supervisory role which was found not to be done except in emergency situations.
The principles of subsidiarity (ie some things are better done locally / at lower levels rather than by cenral government) within Education policy documents have led to confusion about roles and responsibilities. Those interviewed felt that the community is overburdened, and particularly in the case of WASH, and does not have enough capacity to supervise construction (examples from Magu and Temeke).
Local governments are expected to supervise and provide guidance regarding construction of facilities such as toilets and water points. However, many schools claimed that they are not getting this kind of support. Generally, there are no designs for WASH facilities accessible to schools; each school management uses its own initiatives to put the facilities in place with the result that facilities at schools are frequently substandard.
Operation and maintenance (O&M)
Repair and maintenance of WASH facilities is a major challenge, such that even minor repairs can take considerable time to fix. There was found to be a problem of lack of technicians and spare parts for the water points. Maintenance of WASH facilities may require repairs which are beyond the capacity of communities
There have been some positive experiences where O&M has been delegated to a third party (for example a school manager) as is the case in private schools in Morogoro.
Costs of O&M are unknown. O&M is not incorporated in project design or planning. Nor are routine O&M activities budgeted for. Nor are there plans for expansion or replacement of infrastructure.
Toilet cleaning and water fetching is left to students/ pupils in most cases (with the burden of cleaning falling on girls – Maswa). However, most schools, particularly government schools, have no schedule or checklist for regular maintenance of water, sanitation and hygiene facilities. There was found to be minimum follow up from the teachers and as such hygiene in most of the schools, especially for the latrines was poor (Maswa). Those interviewed in Temeke suggested that the poor conditions of latrines are perpetuating the practice of open defecation.
Some pupils interviewed said that the major problem was lack of water for cleaning but also the poor design of latrine floors which cannot be easily cleaned.
Emptying of latrines is not done in most of the schools visited because of the costs involved, especially for remote and rural areas, where these services are not easily available.
There was found to be a problem of lack of security in many schools leading to some of the infrastructure being vandalised. Most schools don’t have doors and so the latrines cannot be locked when unsupervised.

SWASH Mapping Consolidated National Report
SWASH Mapping Consolidated National Report Page 65
Participation/involvement
Willingness to pay has been negatively affected by a number of factors. First, communities are suffering from ‘contribution fatigue’. They feel overburdened by requests – for example, to participate in the costs of construction and furnishing of schools, dispensaries and other development infrastructure (secondary/primary schools classrooms, laboratories, staff houses, latrines; dispensaries). Interviewees noted that taken together these contributions constitute a considerable financial burden for poor communities. Community willingness to contribute to the construction of the school facilities is further undermined by lack of transparency and accountability relating to the use of funds. In some cases (for example, in Magu) communities have made their contribution and the donor/ government has then failed to do their part, with the result that there are incomplete structures at the schools. Communities also complained about the different approaches to community contributions requested by different donors. If one village is expected to contribute and the next village is not expected to contribute, as for example in Maswa, this becomes difficult to comprehend.
Finally, there is confusion and limited understanding of the government policy of free education and how this sits with the requirement to contribute for school development. Most of the citizens see the contribution for the construction of water and sanitation facilities as a burden because they do not feel that the schools are their responsibility.
There is a perceived lack of commitment/ resources on the part of the local government to raise awareness about the importance of school WASH and guide the involvement and participation of the community.
Monitoring and inspection
School inspectors are not monitoring school WASH nor the enforcement of the school rules, government policies or guidelines (Magu, Temeke). This may be contributing to poor maintenance of facilities. The quantitative survey found that there are widespread differences in monitoring practices between districts, with schools in some districts (Bagamoyo, Hai, Magu, Siha) reporting very rare monitoring by district government, while others report very regular monitoring (Chamwino, Kasulu, Makete, Mtwara Rural, Singida Urban, Temeke).
Poor accessibility to some schools as well as lack of reliable transport at the district level hinders regular visits, supervision, monitoring and inspections of WASH facilities in schools.
Communication and relationships
The effective delivery of school WASH depends on a number of functioning vertical and horizontal relationships. The research revealed a lack of clarity relating to roles and responsibilities, poor coordination and a lack of trust.
In several districts, the school committees were found not to be on good terms with the village governments which own the schools (for example, in Temeke, Magu, Maswa). School boards/ committees do not meet regularly or give feedback from their meetings to village government. Some interviewees felt that the Boards do not have the capacity to carry out their functions effectively (Kigoma).
The village leaders interviewed said there was no feedback from the LGA to the village governments concerning school budgets submitted to the LGA. Often the officials make promises to the school leaders but then do not fulfil them.
SWASH Mapping Consolidated National Report
SWASH Mapping Consolidated National Report Page 66
Several people affirmed that there is a good relationship between school, Ward Education Coordinator, and District Education Officer. But the relationship is based on a chain of command mechanism/ upward reporting for finance. The linkage between the school management, school boards and the Ward Development Committees, which are deemed to be the owners of ward secondary schools, is not clear (Mtwara).
Cross-departmental (water, education, health and engineering) coordination is also weak at the district and village level (Maswa). The District Water and Sanitation Team (DWST) is not known by most people even within the Local Government Authority (LGA).
School committees/ boards, parents meetings and school baraza6 are in place. The attendance of parents at school meetings is very poor hence their contributions to school development is also very little. For example, the head teacher at Mukigo Primary School told the team that they once called the parents meeting, but only one parent attended and therefore they had to postpone the meeting.
Political leaders exploit ambiguities and lack of understanding of the roles and responsibilities of government both to win political support and to discourage community contributions. Some community members hesitate to contribute locally available materials for construction of school facilities because the school is located in the area where leaders are coming from opposition parties (Kigoma)
For the schools that are far away from the district headquarters communication is very difficult
Access to information
The village and committee meetings are not regularly called for and when called; the attendance is always very poor. Under such circumstances, the flow of information to the communities on school matters including SWASH status is limited (Kigoma).
Feedback mechanisms are weak. Few head teachers and headmasters give reports both to the village councils and the school committee concerning school funds. Also very few village leaders give account to the community of the funds collected and how they were used. Such communities were found willing to contribute whenever asked to do so. However most leaders were found not to be giving account to the community and the communities were found disappointed (Maswa).
Unclear governance structures lead to a lack of unclear channels for flow of information (Magu).
Outdated information or no information on the notice boards (Ngara).
Many communities did not ask for information about school WASH since they don’t view the facilities as their responsibility.
6 A school baraza is a meeting where pupils can discuss their concerns
SWASH Mapping Consolidated National Report
SWASH Mapping Consolidated National Report Page 67
4 Conclusions and the way forward
There has been a lack of prioritisation, planning and allocation of resources to ensure that children have access to water, sanitation and hygiene in schools. This situation has been exacerbated by the positive increased enrolment of school children which has taken place since the abolition of school fees in 2002. Increased numbers of children in school put pressure on already scarce facilities, raising the costs of operation and maintenance and curtailing the life span of facilities. School water supply, sanitation and hygiene have not been a priority for the Government of Tanzania despite the positive impact that investment in these services would bring. As a result, in all districts, with the exception of Makete and Temeke, there is insufficient infrastructure which does not meet national standards. Most schools surveyed in the 16 districts were ranked as “poor”. The key findings from the mapping exercise are as follows:
1) Latrine numbers
Only 11% of schools meet the minimum standard of the Ministry of Education and Vocational Training relating to the number of pupil per drop hole (20 girls and 25 boys per drop hole). The overall number of actual drop holes falls a long way short of the number required to meet the MOEVT minimum standards. The actual number of drop holes in these 16 districts is only 37% of the required number. On average, 61 pupils use one drop hole, 58 girls and 64 boys respectively. However, some schools have as many as 400 - 600 pupils per drop hole. In all districts there are schools without latrines, although some of these are schools which have been split into two schools due to the schools becoming too large. Except for Makete, Hai and Siha; all other districts have schools with more than 200 pupils per drop hole. Temeke has 14% of school with more than 200 pupils/ drop hole. This is placing a significant burden on existing facilities, making maintenance challenging and discouraging usage by pupils
2) Latrine standards and hygiene In terms of latrine standards (design, construction materials, privacy and suitability for the disabled), there is considerable variation between districts. Pit latrines with slabs are most common in the districts surveyed. Temeke is the only district with a significant proportion of pour-flush latrines. In only one case – Temeke – are there a significant number of schools with disability-friendly latrines. Only 4% of schools have facilities that are suitable for children with disabilities.
In general, latrines are not adapted to the needs of children, in particular girls: many schools latrines are unsafe and do not provide adequate privacy, especially for girls. Only 40% of latrines for girls have doors.
Latrine hygiene is very poor in almost all schools: Only 9% of schools were rated as having “clean” latrines. This is due to a number of factors, most notably the lack of clear plan or budget for operations and maintenance. In most districts, school latrine cleaning by pupils is the norm, though this activity appears to be largely unsupervised. In 37% of private schools there is hired labour for cleaning of WASH facilities. Latrines have never been emptied in most school in almost all districts. When a latrine fills up, it is often demolished and a new pit is dug for another latrine to be constructed. This provides an
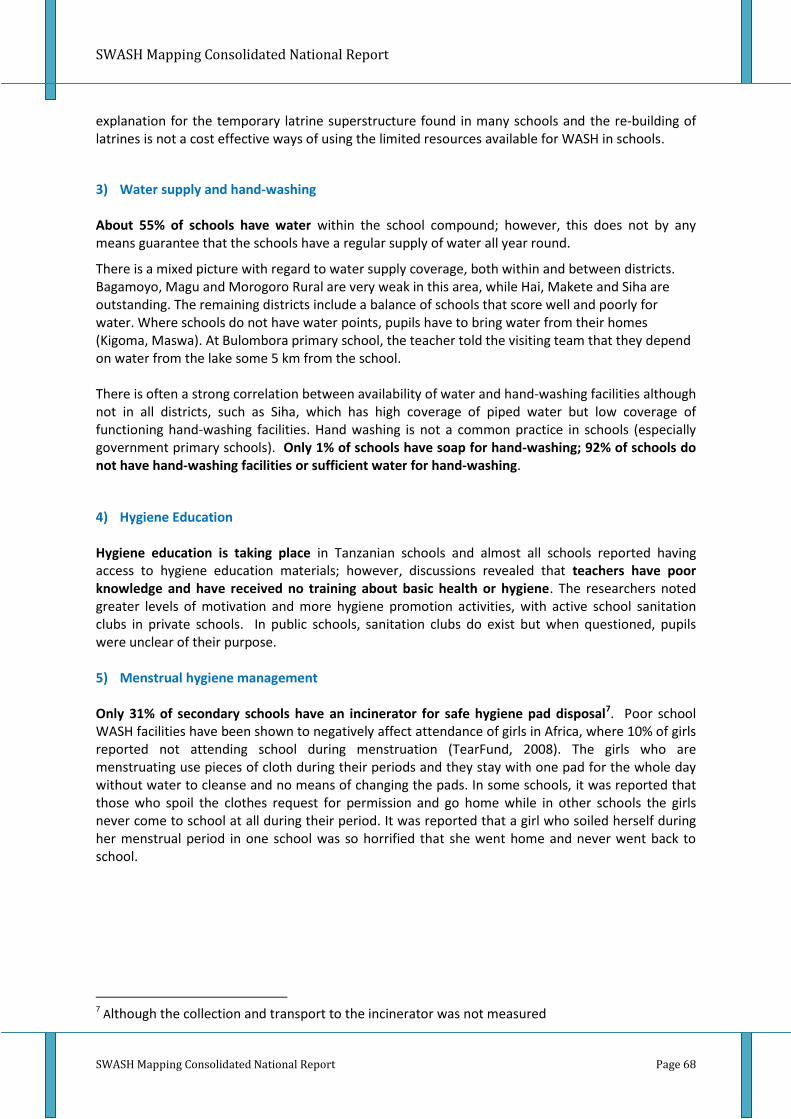
SWASH Mapping Consolidated National Report
SWASH Mapping Consolidated National Report Page 68
explanation for the temporary latrine superstructure found in many schools and the re-building of latrines is not a cost effective ways of using the limited resources available for WASH in schools.
3) Water supply and hand-washing About 55% of schools have water within the school compound; however, this does not by any means guarantee that the schools have a regular supply of water all year round.
There is a mixed picture with regard to water supply coverage, both within and between districts. Bagamoyo, Magu and Morogoro Rural are very weak in this area, while Hai, Makete and Siha are outstanding. The remaining districts include a balance of schools that score well and poorly for water. Where schools do not have water points, pupils have to bring water from their homes (Kigoma, Maswa). At Bulombora primary school, the teacher told the visiting team that they depend on water from the lake some 5 km from the school. There is often a strong correlation between availability of water and hand-washing facilities although not in all districts, such as Siha, which has high coverage of piped water but low coverage of functioning hand-washing facilities. Hand washing is not a common practice in schools (especially government primary schools). Only 1% of schools have soap for hand-washing; 92% of schools do not have hand-washing facilities or sufficient water for hand-washing.
4) Hygiene Education Hygiene education is taking place in Tanzanian schools and almost all schools reported having access to hygiene education materials; however, discussions revealed that teachers have poor knowledge and have received no training about basic health or hygiene. The researchers noted greater levels of motivation and more hygiene promotion activities, with active school sanitation clubs in private schools. In public schools, sanitation clubs do exist but when questioned, pupils were unclear of their purpose. 5) Menstrual hygiene management Only 31% of secondary schools have an incinerator for safe hygiene pad disposal7. Poor school WASH facilities have been shown to negatively affect attendance of girls in Africa, where 10% of girls reported not attending school during menstruation (TearFund, 2008). The girls who are menstruating use pieces of cloth during their periods and they stay with one pad for the whole day without water to cleanse and no means of changing the pads. In some schools, it was reported that those who spoil the clothes request for permission and go home while in other schools the girls never come to school at all during their period. It was reported that a girl who soiled herself during her menstrual period in one school was so horrified that she went home and never went back to school.
7 Although the collection and transport to the incinerator was not measured

SWASH Mapping Consolidated National Report
SWASH Mapping Consolidated National Report Page 69
Next steps – Scaling up school WASH There is growing momentum and understanding of the need to improve school WASH. At the national level, a Memorandum of Understanding on Sanitation and Hygiene has been signed between 4 key ministries - the Ministry of Education and Vocational Training (MoEVT), the Prime Minister’s Office for Regional and Local Government (PMO-RALG), the Ministry of Health and Social Welfare (MoHSW) and the Ministry of Water and Irrigation (MoWI). A national coordinating mechanism for School WASH (SWASH-TWG) has been established which is being chaired by MOEVT & MOHSW. Together the four key Ministries have also developed and are currently piloting national guidelines for school water supply sanitation and hygiene with technical support from from SNV, WaterAid and UNICEF, two Universities, ARU and MUHAS and a wide range of other Civil Society partners8.
Given the poor state of school WASH and the negative impact that this has on the health and education of Tanzanian children, the next steps are critical for ensuring progress. Recommendations for the way forward:
1 Focus more on quality and not just quantity: to avoid overwhelming pedagogic capacities and to create conducive learning environments, including School WASH facilities. Increasing enrolment is a significant achievement, it is however equally important to make sure that school is a safe and enjoyable place where children can develop to their full potential; a place where they do not only acquire knowledge but also adopt good habits and positive behaviour changes
2 Ensure all new schools to be built with adequate WASH facilities: as required under the Government’s regulations.
3 Establish standard WASH requirements for schools (both private and government): to be phased from a basic but safe minimum to a more ideal provision
4 Support capacity building: of school management and local government authorities to manage and maintain facilities for sustainable access to School WASH.
5 Strengthen School WASH monitoring and inspection: to make sure that minimum School WASH conditions are maintained all year round.
6 Identify high level political champions: to support the efforts for ensuring that School WASH is given the priority it deserves in every school.
7 Initiate a national campaign for ensuring hand-washing with soap and to add doors back to all school latrines: both can be achieved with little cost but have a large potential benefit for school children, particularly girls.
8 Establish the national fund or programme, strengthen management and coordination structures for School WASH to ensure concerted efforts of all key stakeholders and to maximise the use of available resources. The national fund or programme should provide a focal point for investments as well as motivation for Development Partners to further invest in School WASH facilities.
8 The SWASH Partnership supporting the four Ministries, MOEVT, MOHSW, MOWI and PMO-RALG, includes
ARU, MUHAS, EEPCO, CCBRT, SEMA, SHIPO, HAPA, TWESA, CARE, Concern Worldwide, supported by SNV, WaterAid and UNICEF

SWASH Mapping Consolidated National Report
SWASH Mapping Consolidated National Report Page 70
9 Provide financial incentives: by rewarding well performing schools to encourage the effective use and maintenance of the provided facilities with tangible benefits.
10 Provide additional meaningful resources: to smaller resource poor schools in remote areas that will allow them to provide proper School WASH facilities.
11 Ensure financial transparency: by publicising information on capitation fund transfer from central to local government and from local government to schools (date and amount transferred) so that schools, teachers and parents are fully aware of the resources made available in order for them to be able to make informed decisions when planning and budgeting for School WASH improvements.
12 Maximise the leverage of government funds for School WASH: through co-funding modalities using funds raised by parents and the school. This would also have the effect of improving the overall sustainability of investments since this would create a sense of ownership amongst parents, the school and the community.

SWASH Mapping Consolidated National Report
SWASH Mapping Consolidated National Report Page 71
Annex 1 – Data tables for charts in Section 2
Data tables for Section 2.1 – Summary
For figures 1 to 7
Overall Latrine Numbers Latrine Standards
Very Poor
Poor OK Good Total Very Poor
Poor OK Good Total Very Poor
Poor OK Good Total
Bagamoyo 16% 65% 17% 2% 100% 11% 54% 22% 13% 100% 59% 17% 15% 9% 100%
Chamwino 7% 74% 20% 0% 100% 5% 74% 13% 8% 100% 23% 41% 27% 9% 100%
Hai 0% 51% 48% 1% 100% 0% 20% 59% 22% 100% 39% 10% 40% 11% 100%
Kahama 23% 75% 1% 0% 100% 14% 66% 14% 7% 100% 10% 52% 38% 0% 100%
Kasulu 16% 68% 16% 0% 100% 13% 63% 20% 4% 100% 51% 17% 28% 4% 100%
Kibondo 16% 74% 10% 0% 100% 12% 59% 23% 6% 100% 41% 8% 51% 0% 100%
Kigoma R 9% 76% 15% 0% 100% 10% 69% 17% 5% 100% 17% 55% 27% 1% 100%
Magu 17% 73% 9% 0% 100% 15% 73% 12% 1% 100% 36% 47% 15% 3% 100%
Makete 16% 29% 54% 1% 100% 25% 13% 47% 15% 100% 34% 10% 42% 14% 100%
Maswa 15% 85% 0% 0% 100% 5% 80% 11% 3% 100% 6% 90% 4% 0% 100%
Moro R 22% 70% 8% 0% 100% 13% 57% 25% 5% 100% 58% 13% 28% 1% 100%
Mtwara R 19% 58% 23% 0% 100% 20% 44% 30% 5% 100% 31% 4% 65% 0% 100%
Ngara 4% 71% 25% 0% 100% 9% 75% 12% 4% 100% 13% 35% 48% 4% 100%
Siha 4% 55% 41% 0% 100% 4% 30% 41% 25% 100% 49% 6% 45% 0% 100%
Singida U 5% 51% 42% 1% 100% 7% 42% 32% 19% 100% 41% 19% 31% 9% 100%
Temeke 1% 48% 49% 2% 100% 19% 55% 17% 8% 100% 5% 4% 51% 41% 100%
13% 66% 20% 0% 100% 12% 58% 22% 8% 100% 31% 30% 33% 6% 100%
Latrines Hygiene Water Supply Hygiene Education
Very Poor
Poor OK Good Total Very Poor
Poor OK Good Total Very Poor
Poor OK Good Total
Bagamoyo 84% 7% 5% 4% 100% 40% 20% 19% 22% 100% 3% 7% 71% 19% 100%
Chamwino 93% 6% 1% 0% 100% 8% 24% 48% 21% 100% 0% 1% 85% 14% 100%
Hai 66% 16% 14% 3% 100% 10% 7% 4% 79% 100% 4% 3% 66% 26% 100%
Kahama 97% 2% 1% 0% 100% 0% 0% 0% 0% 100% 0% 0% 0% 0% 100%
Kasulu 97% 3% 0% 0% 100% 34% 17% 15% 34% 100% 0% 0% 86% 13% 100%
Kibondo 99% 0% 1% 0% 100% 30% 29% 17% 24% 100% 2% 2% 85% 11% 100%
Kigoma R 99% 1% 0% 0% 100% 31% 23% 30% 16% 100% 0% 0% 96% 4% 100%
Magu 84% 10% 3% 2% 100% 66% 13% 19% 3% 100% 0% 19% 50% 31% 100%
Makete 54% 29% 17% 0% 100% 15% 19% 6% 60% 100% 0% 2% 61% 38% 100%
Maswa 94% 6% 0% 0% 100% 0% 0% 0% 0% 100% 0% 0% 0% 0% 100%
Moro R 95% 4% 1% 0% 100% 65% 16% 11% 8% 100% 10% 11% 63% 17% 100%
Mtwara R 90% 9% 1% 0% 100% 36% 21% 33% 10% 100% 1% 10% 32% 58% 100%
Ngara 68% 28% 4% 1% 100% 21% 39% 26% 14% 100% 1% 21% 59% 20% 100%
Siha 91% 3% 4% 1% 100% 9% 1% 4% 86% 100% 6% 0% 54% 41% 100%
Singida U 61% 16% 18% 5% 100% 35% 8% 22% 35% 100% 0% 20% 18% 62% 100%
Temeke 33% 47% 18% 2% 100% 15% 72% 4% 10% 100% 4% 3% 34% 59% 100%
84% 11% 4% 1% 100% 27% 19% 15% 21% 100% 2% 6% 54% 21% 100%

SWASH Mapping Consolidated National Report
SWASH Mapping Consolidated National Report Page 72
For figures 8 - 13
Overall Latrine Numbers Latrine Standards
Very Poor
Poor OK Good Total Very Poor
Poor OK Good Total Very Poor
Poor OK Good Total
Pre-school 5% 18% 73% 5% 100% 5% 14% 23% 59% 100% 14% 23% 23% 41% 100%
Primary 16% 70% 14% 0% 100% 14% 62% 19% 5% 100% 36% 31% 30% 3% 100%
Secondary 2% 52% 45% 1% 100% 3% 44% 36% 18% 100% 9% 25% 48% 18% 100%
Private 1% 18% 75% 6% 100% 2% 24% 35% 39% 100% 6% 12% 43% 39% 100%
Public 14% 69% 17% 0% 100% 13% 60% 21% 6% 100% 32% 31% 33% 4% 100%
13% 66% 20% 0% 100% 12% 58% 22% 8% 100% 31% 30% 33% 6% 100%
Latrines Hygiene Water Supply Hygiene Education
Very Poor
Poor OK Good Total Very Poor
Poor OK Good Total Very Poor
Poor OK Good Total
Pre-school 27% 18% 36% 18% 100% 18% 23% 27% 32% 100% 5% 27% 32% 36% 100%
Primary 88% 8% 3% 1% 100% 35% 29% 16% 20% 100% 18% 4% 54% 24% 100%
Secondary 68% 20% 10% 2% 100% 24% 34% 14% 28% 100% 23% 11% 55% 12% 100%
Private 30% 22% 34% 13% 100% 8% 37% 11% 44% 100% 15% 8% 49% 29% 100%
Public 87% 10% 3% 0% 100% 35% 30% 16% 20% 100% 19% 5% 55% 21% 100%
84% 11% 4% 1% 100% 33% 30% 15% 21% 100% 19% 6% 54% 21% 100%
Data tables for Section 2.2 – Latrine Numbers and Ratios
For figures 14 & 15
# schools Meeting
minimum standard
Halfway to minimum standard
less than 100 pupils per drop hole
100-200 pupils per drop hole
over 200 pupils per drop hole
no drop holes
Bagamoyo 17% 27% 32% 14% 2% 9%
Chamwino 11% 18% 49% 18% 4% 1%
Hai 32% 53% 14% 0% 0% 0%
Kahama 9% 15% 37% 29% 7% 3%
Kasulu 8% 21% 43% 16% 3% 9%
Kibondo 10% 28% 37% 15% 1% 10%
Kigoma R 6% 24% 39% 25% 4% 2%
Magu 1% 15% 51% 20% 2% 11%
Makete 21% 46% 8% 2% 0% 23%
Maswa 5% 15% 51% 25% 3% 2%
Moro R 6% 32% 37% 14% 3% 7%
Mtwara R 11% 33% 29% 8% 1% 19%
Ngara 5% 18% 46% 27% 1% 4%
Siha 35% 43% 16% 1% 0% 4%
Singida U 23% 35% 30% 7% 1% 4%
Temeke 12% 16% 33% 25% 14% 1%
Total 11% 25% 37% 17% 3% 6%

SWASH Mapping Consolidated National Report
SWASH Mapping Consolidated National Report Page 73
# schools Meeting
minimum standard
Halfway to minimum standard
less than 100 pupils per drop hole
100-200 pupils per drop hole
over 200 pupils per drop hole
no drop holes
Pre-school only 73% 9% 14% 0% 0% 5%
Primary 7% 23% 38% 20% 4% 8%
Secondary 27% 35% 30% 5% 0% 1%
Private 48% 36% 14% 1% 0% 1%
Public 9% 24% 38% 18% 4% 7%
Total 11% 25% 37% 17% 3% 6%
Data tables for Section 2.3 – Latrine Standards
For figures 16-24
Latrine type Materials for the superstructure Suitable for disabled?
Emptied?
Dry
compost VIP
Pour flush
Pit latrine with slab
Traditional pit latrine
Others Cement Concrete
blocks Burnt bricks
Mud Thatch / grass
Other Suitable Not
suitable Yes No
Bagamoyo 1% 9% 10% 68% 12% 0% 55% 28% 10% 1% 4% 1% 8% 92% 16% 84%
Chamwino 3% 1% 14% 61% 21% 0% 75% 1% 9% 13% 3% 0% 8% 92% 13% 88%
Hai 1% 0% 23% 69% 7% 0% 25% 70% 2% 1% 0% 2% 2% 98% 16% 84%
Kahama 0% 78% 3% 18% 3% 0% 89% 0% 4% 0% 6% 0% 1% 99% 80% 20%
Kasulu 0% 0% 9% 65% 27% 0% 11% 0% 75% 2% 2% 8% 0% 100% 5% 95%
Kibondo 0% 1% 0% 93% 7% 0% 5% 0% 87% 3% 2% 3% 1% 99% 1% 99%
Kigoma R 0% 0% 2% 87% 12% 0% 58% 0% 34% 2% 4% 2% 0% 100% 2% 98%
Magu 0% 46% 5% 38% 11% 0% 74% 0% 26% 0% 0% 0% 0% 100% 6% 94%
Makete 0% 10% 16% 53% 21% 0% 0% 1% 88% 0% 10% 1% 0% 100% 18% 82%
Maswa 0% 94% 0% 0% 6% 0% 77% 0% 19% 2% 1% 0% 0% 100% 69% 31%
Moro R 2% 2% 8% 77% 10% 1% 15% 1% 69% 9% 5% 1% 0% 100% 2% 98%
Mtwara R 0% 2% 0% 85% 0% 13% 83% 0% 1% 0% 11% 5% 0% 100% 1% 99%
Ngara 0% 68% 4% 27% 1% 0% 4% 0% 94% 2% 0% 0% 0% 100% 6% 94%
Siha 0% 1% 1% 88% 9% 0% 43% 45% 8% 2% 0% 2% 3% 97% 1% 99%
Singida U 0% 21% 14% 60% 5% 0% 93% 4% 0% 1% 0% 1% 0% 100% 22% 78%
Temeke 0% 1% 41% 56% 2% 0% 96% 3% 1% 0% 0% 0% 32% 68% 56% 44%
Pre-school 0% 9% 59% 27% 5% 0% 64% 32% 0% 5% 0% 0% 19% 81% 41% 59%
Primary 0% 25% 4% 58% 12% 1% 51% 5% 35% 3% 4% 2% 2% 98% 18% 82%
Secondary 1% 19% 27% 51% 2% 0% 55% 13% 31% 0% 0% 1% 9% 91% 39% 61%
Private 0% 21% 46% 33% 0% 0% 58% 26% 17% 0% 0% 0% 19% 81% 59% 41%
Public 0% 24% 7% 58% 10% 1% 51% 5% 35% 2% 3% 2% 3% 97% 20% 80%
Total 0% 23% 9% 57% 10% 1% 52% 7% 34% 2% 3% 2% 4% 96% 22% 78%
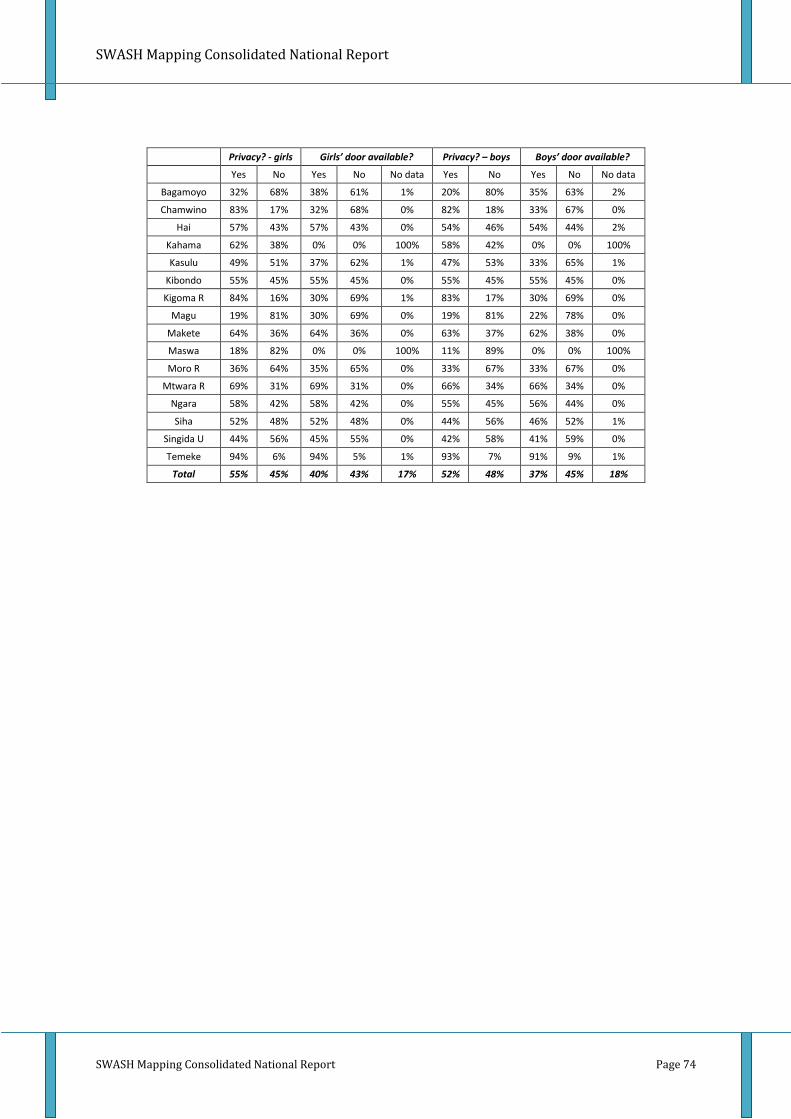
SWASH Mapping Consolidated National Report
SWASH Mapping Consolidated National Report Page 74
Privacy? - girls Girls’ door available? Privacy? – boys Boys’ door available?
Yes No Yes No No data Yes No Yes No No data
Bagamoyo 32% 68% 38% 61% 1% 20% 80% 35% 63% 2%
Chamwino 83% 17% 32% 68% 0% 82% 18% 33% 67% 0%
Hai 57% 43% 57% 43% 0% 54% 46% 54% 44% 2%
Kahama 62% 38% 0% 0% 100% 58% 42% 0% 0% 100%
Kasulu 49% 51% 37% 62% 1% 47% 53% 33% 65% 1%
Kibondo 55% 45% 55% 45% 0% 55% 45% 55% 45% 0%
Kigoma R 84% 16% 30% 69% 1% 83% 17% 30% 69% 0%
Magu 19% 81% 30% 69% 0% 19% 81% 22% 78% 0%
Makete 64% 36% 64% 36% 0% 63% 37% 62% 38% 0%
Maswa 18% 82% 0% 0% 100% 11% 89% 0% 0% 100%
Moro R 36% 64% 35% 65% 0% 33% 67% 33% 67% 0%
Mtwara R 69% 31% 69% 31% 0% 66% 34% 66% 34% 0%
Ngara 58% 42% 58% 42% 0% 55% 45% 56% 44% 0%
Siha 52% 48% 52% 48% 0% 44% 56% 46% 52% 1%
Singida U 44% 56% 45% 55% 0% 42% 58% 41% 59% 0%
Temeke 94% 6% 94% 5% 1% 93% 7% 91% 9% 1%
Total 55% 45% 40% 43% 17% 52% 48% 37% 45% 18%

SWASH Mapping Consolidated National Report
SWASH Mapping Consolidated National Report Page 75
Data tables for Section 2.4 – Latrine Hygiene
For figures 25 - 42
Anal
Cleansing Materials
Type of Materials
Hygiene Pad disposal?
Handwashing? Type of
Handwashing
Water quantity for
handwashing
Soap available?
Latrine smelly / soiled?
Latrine Dirty
Yes
No
Wa
ter
Pa
per
No
ne
Yes
No
No
da
ta
Yes
No
No
da
ta
Wa
sh b
asi
n
Sta
nd
pip
e
Fixe
d g
allo
n
con
tain
er
No
ne
Eno
ug
h
Insu
ffic
ien
t
No
t a
vaila
ble
Yes
No
Soile
d
Smel
l
Nei
ther
No
da
ta
Yes
No
No
da
ta
Bagamoyo 23% 77% 34% 2% 64% 4% 96% 0% 13% 86% 1% 8% 4% 3% 86% 12% 1% 86% 4% 96% 4% 64% 0% 32% 67% 33% 0%
Chamwino 90% 10% 16% 76% 7% 1% 99% 0% 9% 91% 0% 0% 3% 3% 94% 4% 2% 94% 0% 100% 0% 100% 0% 0% 62% 38% 0%
Hai 41% 59% 43% 1% 56% 3% 97% 0% 28% 72% 0% 9% 12% 8% 71% 27% 3% 70% 4% 96% 1% 64% 0% 35% 61% 39% 0%
Kahama 13% 87% 11% 1% 87% 0% 3% 97% 4% 96% 0% 0% 1% 2% 97% 2% 2% 96% 1% 99% 7% 49% 44% 0% 0% 0% 100%
Kasulu 59% 41% 14% 64% 22% 1% 98% 1% 5% 95% 0% 0% 3% 2% 95% 1% 3% 95% 0% 100% 0% 96% 0% 4% 58% 38% 4%
Kibondo 2% 98% 8% 89% 4% 1% 99% 0% 3% 97% 0% 1% 1% 1% 97% 1% 1% 98% 1% 99% 1% 92% 0% 7% 94% 6% 0%
Kigoma R 90% 10% 2% 65% 33% 0% 100% 0% 1% 99% 0% 0% 0% 1% 99% 1% 0% 99% 0% 100% 0% 100% 0% 0% 49% 51% 0%
Magu 12% 88% 11% 0% 89% 100% 0% 0% 31% 69% 0% 1% 1% 30% 68% 3% 5% 92% 3% 97% 9% 68% 24% 0% 87% 13% 0%
Makete 29% 71% 29% 0% 71% 96% 4% 0% 55% 45% 0% 2% 47% 4% 47% 29% 27% 44% 0% 100% 4% 58% 0% 38% 73% 25% 2%
Maswa 13% 87% 0% 0% 100% 0% 0% 100% 0% 2% 98% 0% 1% 11% 87% 3% 6% 91% 0% 100% 0% 0% 2% 98% 0% 0% 100%
Moro R 7% 93% 8% 0% 92% 90% 10% 0% 1% 99% 0% 0% 0% 0% 100% 2% 5% 93% 0% 100% 1% 99% 0% 0% 97% 3% 0%
Mtwara R 3% 97% 3% 0% 97% 97% 3% 0% 10% 90% 0% 0% 5% 4% 91% 5% 4% 91% 0% 100% 0% 100% 0% 0% 88% 12% 0%
Ngara 9% 91% 7% 1% 93% 98% 2% 0% 20% 80% 0% 1% 3% 19% 77% 12% 10% 79% 1% 99% 9% 26% 0% 65% 80% 20% 0%
Siha 16% 84% 14% 1% 84% 1% 99% 0% 6% 94% 0% 1% 6% 0% 93% 6% 0% 94% 1% 99% 1% 78% 0% 20% 72% 28% 0%
Singida U 38% 62% 37% 0% 63% 74% 26% 0% 28% 72% 0% 14% 0% 16% 70% 19% 14% 68% 12% 88% 1% 58% 0% 41% 76% 24% 0%
Temeke 94% 6% 98% 0% 2% 2% 98% 0% 47% 53% 0% 8% 32% 9% 52% 23% 27% 50% 2% 98% 0% 33% 0% 67% 33% 67% 0%
Pre-school 82% 18% 77% 5% 18% 5% 95% 0% 55% 45% 0% 23% 23% 18% 36% 55% 9% 36% 32% 68% 0% 23% 0% 77% 36% 64% 0%
Primary 31% 69% 13% 25% 62% 31% 52% 17% 12% 83% 6% 1% 5% 7% 87% 5% 5% 90% 1% 99% 3% 72% 6% 19% 61% 21% 18%
Secondary 54% 46% 53% 16% 31% 31% 52% 17% 25% 67% 9% 7% 13% 5% 75% 16% 11% 73% 2% 98% 1% 54% 11% 34% 44% 38% 17%
Private 79% 21% 79% 9% 13% 27% 62% 11% 60% 37% 5% 22% 32% 7% 39% 57% 9% 34% 18% 82% 1% 31% 12% 56% 29% 60% 11%
Public 33% 67% 17% 24% 58% 31% 52% 17% 12% 82% 7% 1% 5% 7% 87% 5% 6% 89% 0% 100% 3% 71% 7% 20% 59% 23% 18%
Total 36% 64% 21% 23% 56% 31% 52% 17% 15% 80% 7% 2% 7% 7% 84% 8% 6% 86% 1% 99% 3% 68% 7% 22% 58% 25% 17%

SWASH Mapping Consolidated National Report
SWASH Mapping Consolidated National Report Page 76
Data tables for Section 2.5 –Water Supply
For figures 43 - 48
Water Supply Type Water Supply Location Water Supply Functionality
Piped water supply
Hand drilled tube well
Shallow well
Rain harvest
Other /
None
At school
Outside school
no data
Functional Not
functional no
data
Bagamoyo 39% 12% 2% 3% 44% 56% 44% 0% 35% 54% 12%
Chamwino 59% 6% 15% 12% 9% 44% 56% 0% 67% 32% 1%
Hai 83% 1% 0% 3% 13% 89% 11% 0% 80% 20% 0%
Kahama 3% 0% 11% 54% 32% 0% 0% 100% 0% 0% 100%
Kasulu 45% 12% 0% 6% 37% 56% 43% 1% 54% 42% 4%
Kibondo 31% 12% 0% 18% 39% 66% 34% 0% 46% 54% 0%
Kigoma R 29% 13% 5% 20% 33% 51% 49% 0% 52% 48% 0%
Magu 8% 0% 4% 19% 69% 99% 1% 0% 18% 82% 0%
Makete 66% 0% 1% 0% 33% 100% 0% 0% 63% 16% 21%
Maswa 14% 1% 15% 27% 43% 0% 0% 100% 0% 0% 100%
Moro R 16% 0% 8% 6% 70% 26% 74% 0% 23% 77% 0%
Mtwara R 19% 0% 1% 33% 48% 99% 1% 0% 39% 23% 38%
Ngara 15% 0% 3% 26% 56% 93% 7% 0% 54% 46% 0%
Siha 90% 0% 0% 0% 10% 91% 9% 0% 86% 14% 0%
Singida U 41% 1% 7% 14% 38% 94% 2% 4% 57% 7% 36%
Temeke 13% 70% 1% 1% 16% 88% 12% 0% 75% 25% 0%
Pre-school 41% 18% 5% 14% 23% 95% 5% 0% 73% 9% 18%
Primary 29% 8% 4% 18% 41% 52% 28% 20% 39% 39% 22%
Secondary 37% 14% 7% 14% 28% 64% 17% 19% 52% 26% 22%
Private 52% 27% 6% 6% 10% 85% 4% 11% 78% 6% 16%
Public 29% 8% 5% 18% 40% 53% 27% 20% 40% 38% 22%
Total 30% 9% 5% 17% 38% 55% 26% 19% 42% 36% 22%

SWASH Mapping Consolidated National Report
SWASH Mapping Consolidated National Report Page 77
Data tables for Section 2.6 –Hygiene Education
For figures 49 - 54
Teaching of WASH at school Teacher trained in hygiene education? Teaching materials available
Yes No No data Yes No No data Yes No No data
Bagamoyo 95% 5% 0% 19% 81% 0% 91% 9% 0%
Chamwino 100% 0% 0% 14% 86% 0% 99% 1% 0%
Hai 93% 7% 0% 26% 74% 0% 96% 4% 0%
Kahama 0% 0% 100% 0% 0% 100% 0% 0% 100%
Kasulu 100% 0% 0% 13% 87% 0% 99% 1% 0%
Kibondo 97% 3% 0% 11% 89% 0% 97% 3% 0%
Kigoma R 100% 0% 0% 4% 96% 0% 100% 0% 0%
Magu 99% 1% 0% 34% 66% 0% 77% 23% 0%
Makete 100% 0% 0% 38% 62% 0% 97% 3% 0%
Maswa 0% 0% 100% 0% 0% 100% 0% 0% 100%
Moro R 89% 11% 0% 19% 81% 0% 79% 21% 0%
Mtwara R 100% 0% 0% 77% 23% 0% 70% 30% 0%
Ngara 99% 1% 0% 25% 75% 0% 74% 26% 0%
Siha 94% 6% 0% 41% 59% 0% 94% 6% 0%
Singida U 100% 0% 0% 68% 32% 0% 74% 26% 0%
Temeke 96% 4% 1% 60% 39% 1% 92% 8% 1%
Pre-school only 95% 5% 0% 36% 64% 0% 68% 32% 0%
Primary 82% 1% 17% 26% 57% 17% 76% 6% 17%
Secondary 76% 7% 17% 14% 69% 17% 66% 17% 17%
Private 84% 5% 11% 31% 58% 11% 76% 13% 11%
Public 81% 2% 17% 23% 60% 17% 74% 8% 17%
Total 81% 2% 17% 23% 60% 17% 74% 9% 17%

SWASH Mapping Consolidated National Report
SWASH Mapping Consolidated National Report Page 78
Annex 2: A summary of the school WASH findings for each of the survey’s 16 districts, including a map of each district
The following pages provide a summary overview of the SWASH mapping data by district with tabulated results, an overview graph and a map for each district.
Note for the maps: A single mark represents each school, with the type of mark indicating the type of school and the overall WASH score of the school. Primary schools (including those combined with pre-primary) are in bold (filled shapes), while secondary schools are in outlines only. In each case, schools achieving a “good” score are represented by dark green stars, while those achieving “ok”, “poor”, or “very poor” are represented by light green squares, orange triangles and red circles respectively(note this will change depending on how the designer changes the maps) Note - This will need to be changed when the designer revises / improves the maps

SWASH Mapping Consolidated National Report
SWASH Mapping Consolidated National Report Page 79
Annex 2.1 - Overview data – Bagamoyo District
Table 15 Overview data - Bagamoyo
Number of schools and pupils in the study district No. of schools No. of pupils
Private Public Total Girls Boys Total
A – Pre-school 4 0 4 81 66 147
B – Pre- and Primary
4 82 86 22,143 22,478 44,621
C – Primary 0 42 42 5,580 5,419 10,999
D – Secondary 10 20 30 6,740 7,208 13,948
Total 18 144 162 34,544 35,171 69,715
Latrine numbers, ratios and shortages # Pupils Actual # DHs Pupils per DH Required # DHs Shortage
Girls 34,544 763 45.3 1,727 964
Boys 35,171 667 52.7 1,407 740
Total 69,715 1,430 48.8 3,134 1,704
Latrine status summary Hand-washing status summary
Categorisation Number of schools
Categorisation Number of schools
Latrine numbers
Meeting "minimum standards" 27
Type of facility
Wash basin 12
Halfway to "minimum standards" 44 Stand pipe 7
less than 100 pupils per DH 52 Fixed container 4
101-200 pupils per DH 22 None 134
over 200 pupils per DH 3 Water for hand-
washing
Enough 20
no latrines 14 Insufficient 2
Type of latrine
Dry compost 2 None 140
VIP 14
Soap available?
Yes 6 Pit latrine with slab 104
Pour flush 15
No 156
Traditional pit latrine 18
Others 7
Water supply status summary
Categorisation Number of schools
Type of source
Piped 63
Hand-drilled tube well 19
Shallow well 4
Rainwater harvesting 5
Other / none 71
Location On school premises 91
Outside school premises 71
Functionality Functional 56
Non-functional 87

SWASH Mapping Consolidated National Report
SWASH Mapping Consolidated National Report Page 80
Figure 55 Overall school WASH status
Overall School WASH
0
13 12
25
1 1
25 26
0
64
29
93
12
1
104 105
38
19
16 13 15
28
1 1 0 1 1 3 0 3
0
20
40
60
80
100
120
Pre-school Pre- and
Primary
Primary
only
All Primary Secondary Private Public Grand Total
School type . Management . Grand Total
no
. o
f sch
oo
ls Very Poor
Poor
OK
Good
Figure 56 Map - overall WASH scores - Bagamoyo
(Note - this does not look like the map for Bagamoyo – it needs replacing)
Good
OK
Poor
Very poor
Pri
mar
y
sch
oo
ls
Good
OK
Very poor
Poor Seco
nd
ary
sch
oo
ls

SWASH Mapping Consolidated National Report
SWASH Mapping Consolidated National Report Page 81
Annex 2.2 - Overview data – Chamwino District
Table 16 Overall data - Chamwino
Number of schools and pupils in the study district No. of schools No. of pupils
Private Public Total Girls Boys Total
A – Pre-school 0 0 0 0 0 0
B – Pre- and Primary 1 109 110 30,071 29,876 59,947
C – Primary 0 1 1 67 78 145
D – Secondary 2 23 25 2,143 2,760 4,903
Total 3 133 136 32,281 32,714 64,995
Latrine numbers, ratios and shortages # Pupils Actual # DHs Pupils per DH Required # DHs Shortage
Girls 32,281 565 57.1 1,614 1,049
Boys 32,714 523 62.6 1,309 786
Total 64,995 1,088 59.7 2,923 1,835
Latrine status summary Hand-washing status summary
Categorisation Number of schools
Categorisation Number of schools
Latrine numbers
Meeting "minimum standards" 15
Type of facility
Wash basin 0
Halfway to "minimum standards" 24 Stand pipe 4
less than 100 pupils per DH 67 Fixed container 0 101-200 pupils per DH 24 None 128 over 200 pupils per DH 5 Water for
hand-washing
Enough 5
no latrines 1 Insufficient 3
Type of latrine
Dry compost 4 None 128 VIP 1
Soap available?
Yes 0 Pit latrine with slab 82
Pour flush 19
No 136 Traditional pit latrine 29
Others 0 Water supply status summary
Categorisation Number of schools
Type of source
Piped 80
Hand-drilled tube well 8 Shallow well 20
Rainwater harvesting 16 Other / none 9
Location On school premises 60
Outside school premises 76
Functionality Functional 91
Non-functional 44

SWASH Mapping Consolidated National Report
SWASH Mapping Consolidated National Report Page 82
Figure 57 Overall school WASH status - Chamwino
Figure 58 Map – overall WASH scores - Chamwino
#
#
#
#
#
#
#
$#
#
# $
####
#
$
$#
##
#
$$
$
#
$
$#
#
$
#
#$$#
##
#
#
#
##
#
#
#
##
#
#
#
##
#$
#
#
# #$
#
##
#
#
##
##
#
#
$$
#
#
#
##$#
###
#
#
###
##
#
#
#
#
#
#
##
#
$$ #
##
#
#
#
# #
#
#
#
#$$
#
#
#
$$#
## $##
$#
###
Fufu
Han eti
Man da
Huzi
Se gala
Dab alo
Itiso
Chinu gulu
Ngh am baku
Man za se
Mpw ayung u
gan du
Mem be
Idifu
Bu ig iri
Mlowa Bwa nan i
Msam alo
Maka ng'wa
Majeleko
Msan ga
Ikowa
Muu nga no
CHAMWINO
MAP 1
#
#
#
$
$
Prima ry scho ols Se co nd ary sch ools
Go od
Po or
Ve ry p oor Po or
Go od
20 0 20 40 Kilom eters
N
*

SWASH Mapping Consolidated National Report
SWASH Mapping Consolidated National Report Page 83
Annex 2.3 - Overview data – Hai District
Table 17 Overall data – Hai
Number of schools and pupils in the study district No. of schools No. of pupils
Private Public Total Girls Boys Total
A – Pre-school 1 0 1 8 4 12 B – Pre- and Primary 7 86 93 16,540 17,392 33,932
C – Primary 1 15 16 2,885 3,026 5,911
D – Secondary 13 29 42 7,565 6,592 14,157
Total 22 130 152 26,998 27,014 54,012
Latrine numbers, ratios and shortages # Pupils Actual # DHs Pupils per DH Required # DHs Shortage
Girls 26,998 1037 26.0 1,350 313 Boys 27,014 946 28.6 1,081 135 Total 54,012 1,983 27.2 2,430 447
Latrine status summary Hand-washing status summary
Categorisation Number of schools
Categorisation Number of schools
Latrine numbers
Meeting "minimum standards" 49
Type of facility
Wash basin 13 Halfway to "minimum
standards" 81 Stand pipe 18
less than 100 pupils per DH 22 Fixed container 12
101-200 pupils per DH 0 None 105
over 200 pupils per DH 0 Water for hand-
washing
Enough 41
no latrines 0 Insufficient 5
Type of latrine
Dry compost 1 None 106
VIP 0
Soap available?
Yes 6 Pit latrine with slab 105
Pour flush 35
No 146
Traditional pit latrine 11
Others 0
Water supply status summary
Categorisation Number of schools
Type of source
Piped 126
Hand-drilled tube well 2
Shallow well 0
Rainwater harvesting 4
Other / none 3
Location On school premises 136
Outside school premises 16
Functionality Functional 121
Non-functional 31
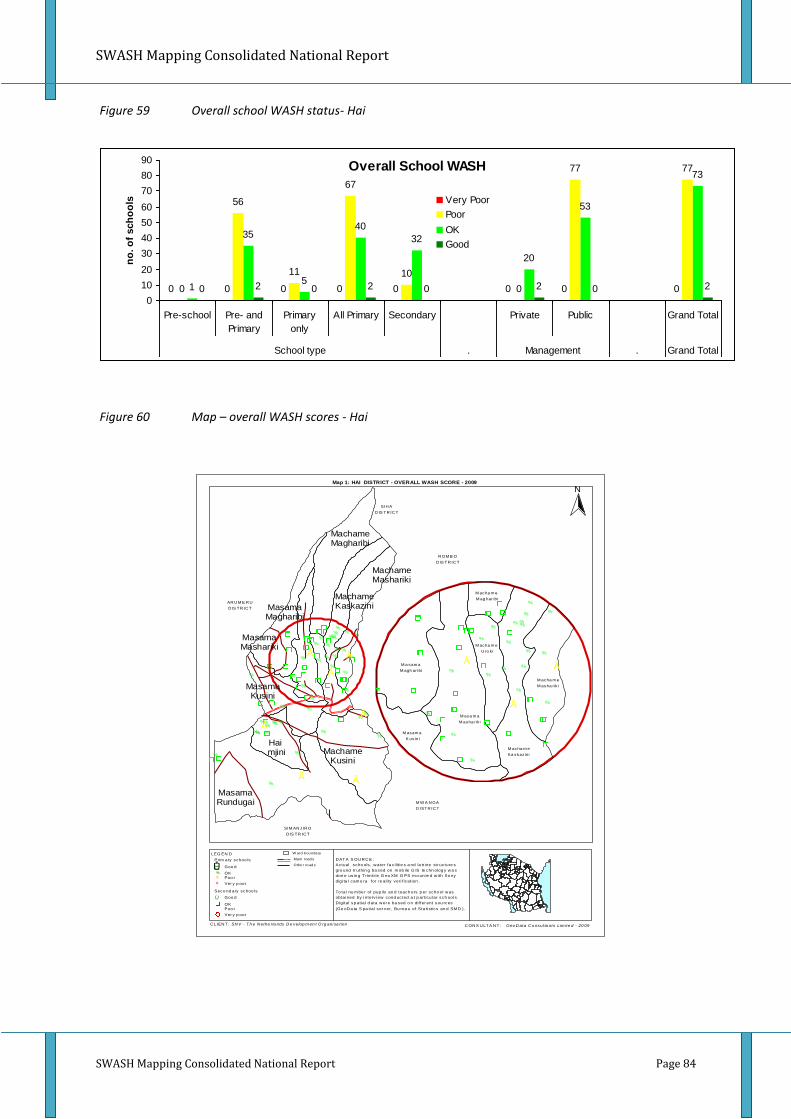
SWASH Mapping Consolidated National Report
SWASH Mapping Consolidated National Report Page 84
Figure 59 Overall school WASH status- Hai
Overall School WASH
0 0 0 0 0 0 0 00
56
11
67
10
0
77 77
1
35
5
40
32
20
53
73
0 2 0 2 0 2 0 2
0
10
20
30
40
50
60
70
80
90
Pre-school Pre- and
Primary
Primary
only
All Primary Secondary Private Public Grand Total
School type . Management . Grand Total
no
. o
f sch
oo
ls Very Poor
Poor
OK
Good
Figure 60 Map – overall WASH scores - Hai
LEG EN D
D AT A S OU R C E :
Ac tual scho ols , w ater fa c ilit ie s a nd la tr ine str uc ture s
gro und tr uthin g ba sed on m ob ile G IS te chn olog y w a s
don e us in g T rim b le G eo XM G PS m o un te d w ith So ny
digi ta l cam e ra for re ali ty veri f icat ion .
To tal nu m be r of pup ils an d teach ers p er scho ol w as
obtai ned by i nterv i ew cond uc ted a t p art icu lar sch ool s .
D igital sp at ial d ata w er e ba sed o n dif fer ent sou rces
(Ge oD a ta S pa tial ser ver, Bu rea u of Sta ti st ics an d SM D ).
C LIEN T : C ON S U LT A N T :SN V - T h e N ethe rla nds D e velop m en t O rg ani sa t ion Geo D ata C o nsul ta nts Lim ite d - 20 09
Map 1: HAI DISTRICT - OVERALL WASH SCORE - 2009
N
AR U M E R U
D IS T R IC T
ÊÚ Goo d
W ard b ou nda ry
OK%$ Poo r
Ver y p oor#
Prim ary schoo ls
Seco nd ary schoo ls
Ver y p oor
Poo rOK
Goo dÚ
Main road s
Othe r ro ad s
M W A N GA
D ISTR IC T
Ã%
%
%
%
%
%
%
Ã%
%
%
%%
%
Ã
%
%%Ã
%
%
%
%
%Ã
%
Ã
%
%
%
%%%%%
%
%
%
%%%
%% %
à %%%
%
MasamaRundugai
MachameKusini
Hai mjini
MachameMagharibi
MasamaKusini
MachameKaskaziniMasama
Magharibi
MasamaMashariki
MachameMashariki
Ã%
%
%
%
Ã
%
%
%
%
%
%
%
%
Ã
%
%
%
% %%
%
%
%
M asa m a
M asha rik i
M acha m e
Ka skaz ini
M a sam a
M agh ari bi
M acha m e
M asha rik i
M asam a
K us in i
M acha m e
U ro ki
M acha m e
M ag har ibi
SIH A
D IS T R IC T
R OM B O
D IS T R IC T
SIM AN JIR O
D IS T R IC T

SWASH Mapping Consolidated National Report
SWASH Mapping Consolidated National Report Page 85
Annex 2.4 - Overview data – Kahama District
Table 18 Overall data – Kahama
Number of schools and pupils in the study district No. of schools No. of pupils
Private Public Total Girls Boys Total
A – Pre-school
B – Pre- and Primary
C – Primary 5 249 254 76,770 78,613 155,383
D – Secondary
Total 5 249 254 76,770 78,613 155,383
Latrine numbers, ratios and shortages # Pupils Actual # DHs Pupils per DH Required # DHs Shortage
Girls 76,770 931 82.5 3,839 2,908
Boys 78,613 860 91.4 3,145 2,285
Total 155,383 1,791 86.8 6,983 5,192
Latrine status summary Hand-washing status summary
Categorisation Number of schools
Categorisation Number of schools
Latrine numbers
Meeting "minimum standards" 2
Type of facility
Wash basin 0
Halfway to "minimum standards" 31 Stand pipe 2
less than 100 pupils per DH 99 Fixed container 3
101-200 pupils per DH 82 None 249
over 200 pupils per DH 15 Water for hand-
washing
Enough 2
no latrines 25 Insufficient 2
Type of latrine
Dry compost 0 None 250
VIP 214
Soap available?
Yes 2 Pit latrine with slab 16
Pour flush 0
No 252
Traditional pit latrine 24
Others 0
Water supply status summary
Categorisation Number of schools
Type of source
Piped 1
Hand-drilled tube well 1
Shallow well 12
Rainwater harvesting 146
Other / none 0
Location On school premises No data
Outside school premises No data
Functionality Functional No data
Non-functional No data
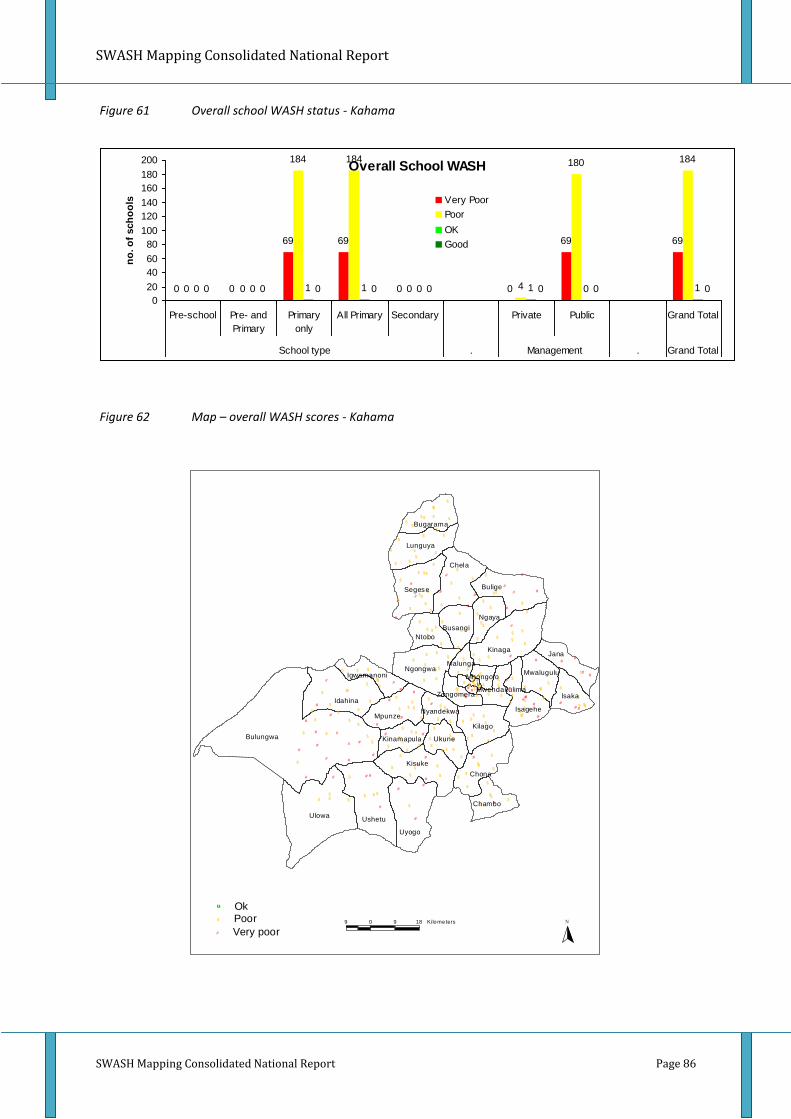
SWASH Mapping Consolidated National Report
SWASH Mapping Consolidated National Report Page 86
Figure 61 Overall school WASH status - Kahama
Overall School WASH
0 0
69 69
0 0
69 69
0 0
184 184
0 4
180 184
0 0 1 1 0 1 0 10 0 0 0 0 0 0 0
0
20
40
60
80
100
120
140
160
180
200
Pre-school Pre- and
Primary
Primary
only
All Primary Secondary Private Public Grand Total
School type . Management . Grand Total
no
. o
f sch
oo
ls Very Poor
Poor
OK
Good
Figure 62 Map – overall WASH scores - Kahama
$$
$
$
$
$$
$$
$
$
$#
$
$ #
$
$
$
#
$
$# $
#
$
$
$$
$
$$
$$
$$
$
$
$
#$
$
$
$
$
$
$
$$$
$
$$
#
$
$
$
$$ $
$
$
$
$
$
$
#
$
$ #$
$$
$$
$ $
$
$
$
$$$
$#
#$%U
$$##
$
#
$
###$
$$$ #
#
$
$
#
$#
#
$
$$
$
$
$
$
$
#
$
$
$
#$
#
$
$$
$#
$
$
$
$
$
#
$
#
#
#
$
#
#
$
$
##
$$
$
$
#
$
# $$ $
$
$
#
$$
$
##
#
#
$
#
#
#
#
$ #
$#
$
#
#$
##
#$
$$
$$$
$
$
$
$$
$ $
$
$
$
$
#$
#$
$$
#
##
$
$$$
$$
$
$
$$
#$
$$
$
$
$ #
$$
#$
$
$
$ $ #
$$
#
$
#
$
$$
#
$ # #
#
$
#
#
$
$
$$
$
#
$
#
$
#
$
$
$
$
$
$
$
$
$
$
#
$ $
$
$
$
$
$
$
Bulungwa
UlowaUshetu
Kinaga
Uyogo
Idahina
Chela
Kisuke
BuligeSegese
Chona
Kilago
Jana
Ngongwa
Mpunze
Lunguya
lsaka
Isagehe
Ukune
Ntobo
Ngaya
Busangi
Chambo
Bugarama
Mwalugulu
Kinamapula
Igwamanoni
Nyandekwa
Malunga
ZongomeraMwendakulima
Mhongolo
%U
# Very poor
$ PoorOk
9 0 9 18 Kilo me ters N

SWASH Mapping Consolidated National Report
SWASH Mapping Consolidated National Report Page 87
Annex 2.5 - Overview data – Kasulu District
Table 19 Overall data – Kasulu
Number of schools and pupils in the study district No. of schools No. of pupils
Private Public Total Girls Boys Total
A – Pre-school 0 0 0 0 0 0
B – Pre- and Primary 2 142 144 45,498 45,280 90,778
C – Primary 0 79 79 21,215 21,331 42,546
D – Secondary 6 40 46 7,080 11,372 18,452
Total 8 261 269 73,793 77,983 151,776
Latrine numbers, ratios and shortages # Pupils Actual # DHs Pupils per DH Required # DHs Shortage
Girls 73,793 1218 60.6 3,690 2,472
Boys 77,983 1192 65.4 3,119 1,927
Total 151,776 2,410 63.0 6,809 4,399
Latrine status summary Hand-washing status summary
Categorisation Number of schools
Categorisation Number of schools
Latrine numbers
Meeting "minimum standards" 22
Type of facility
Wash basin 1
Halfway to "minimum standards" 56 Stand pipe 7
less than 100 pupils per DH 117 Fixed container 6
101-200 pupils per DH 42 None 255
over 200 pupils per DH 8 Water for hand-
washing
Enough 4
no latrines 24 Insufficient 9
Type of latrine
Dry compost 0 None 256
VIP 0
Soap available?
Yes 0 Pit latrine with slab 160
Pour flush 21
No 269
Traditional pit latrine 66
Others 0
Water supply status summary
Categorisation Number of schools
Type of source
Piped 121
Hand-drilled tube well 33
Shallow well 0
Rainwater harvesting 15
Other / none 15
Location On school premises 147
Outside school premises 113
Functionality Functional 146
Non-functional 112
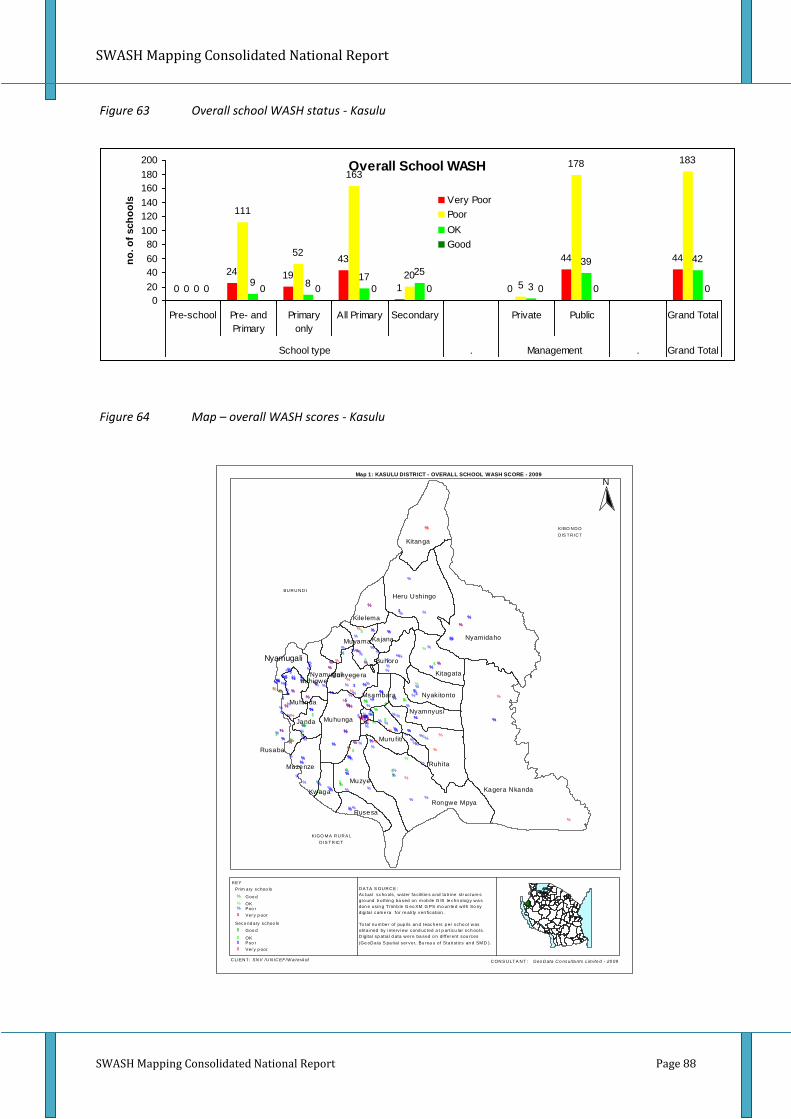
SWASH Mapping Consolidated National Report
SWASH Mapping Consolidated National Report Page 88
Figure 63 Overall school WASH status - Kasulu
Overall School WASH
0
24 19
43
1 0
44 44
0
111
52
163
205
178 183
09 8
1725
3
39 42
0 0 0 0 0 0 0 0
0
20
40
60
80
100
120
140
160
180
200
Pre-school Pre- and
Primary
Primary
only
All Primary Secondary Private Public Grand Total
School type . Management . Grand Total
no
. o
f sch
oo
ls Very Poor
Poor
OK
Good
Figure 64 Map – overall WASH scores - Kasulu
KEY
D AT A S OU R C E :
Ac tual scho ols , w ater fa c ilit ie s a nd la tr ine str uc ture s
gro und tr uthin g ba sed on m ob ile G IS te chn olog y w a s
don e us in g T rim b le G eo XM G PS m o un te d w ith So ny
digi ta l cam e ra for re ali ty veri f icat ion .
To tal nu m be r of pup ils an d teach ers p er scho ol w as
obtai ned by i nterv i ew cond uc ted a t p art icu lar sch ool s .
D igital sp at ial d ata w er e ba sed o n dif fer ent sou rces
(Ge oD a ta S pa tial ser ver, Bu rea u of Sta ti st ics an d SM D ).
C LIEN T : C ON S U LT A N T :SN V /U N IC EF /W a terA id Geo D ata C o nsul ta nts Lim ite d - 20 09
Map 1: KASULU DISTRICT - OVERALL SCHOOL WASH SCORE - 2009
N
% Goo d
OK%% Poo r
Ver y p oor$
Prim ary schoo ls
Seco nd ary schoo ls
Ver y p oor
Poo r$$ OK
Goo d$
$
KIBO N D O
D IS T R IC T
BU R U N D I
KIGO M A R U R A L
D IS TR IC T
$$%$ %
$
%%
%%%
%%%%%
%$
%%
$%$%
% %
%%$%%
%%
$%%
%%$%
%
% %%%
%%
%%
%%%
%%
%%$%%%%%%%%
$$%
$$
%
%%
%
%
$% %
%%
%%%
%
%%%
%
$$%
$%%%
%% %%
%
%%$
%%
%$%%$
%%%
%
%%
%
$
%
%
%%$%
%%
%%
%% %
%
%
%%%$
%%%%
$$%
%% %
%%$
%%%%%
%%%
%
%
%
% %%%
$
%%%%
%%%
%%%
$%%%%%
%%
%
%
%
%%%$
%%
%%%% %%%%%
$%%%
%
$%%$
%%%
$$%
%%
%
$%%%
%%%
$%%%
%%$
%%
%
%
$
%%
%%
%%
%%
%%%
%%%
$
$
%$%%
%%% %
%%
%%%
$
Kagera Nkanda
Nyamidaho
Muzye
Ruhita
Rongwe Mpya
Kitanga
Heru Ushingo
Muhunga
Kitagata
Buhoro
Nyamnyusi
Nyakitonto
Buhigwe
Kajana
Kile lema
Janda
Muzenze
Munyegera
Muyama
Rusesa
Murufiti
Muhinda
Kwaga
Nyamugali
Msambara
Rusaba
Nyamugali

SWASH Mapping Consolidated National Report
SWASH Mapping Consolidated National Report Page 89
Annex 2.6 - Overview data – Kibondo District
Table 20 Overall data - Kibondo
Number of schools and pupils in the study district No. of schools No. of pupils
Private Public Total Girls Boys Total
A – Pre-school 0 0 0 0 0 0
B – Pre- and Primary 0 30 30 10,585 9,849 20,434
C – Primary 1 95 96 26,812 26,295 53,107
D – Secondary 6 25 31 4,310 5,641 9,951
Total 7 150 157 41,707 41,785 83,492
Latrine numbers, ratios and shortages # Pupils Actual # DHs Pupils per DH Required # DHs Shortage
Girls 41,707 809 51.6 2,085 1,276
Boys 41,785 723 57.8 1,671 948
Total 83,492 1,532 54.5 3,757 2,225
Latrine status summary Hand-washing status summary
Categorisation Number of schools
Categorisation Number of schools
Latrine numbers
Meeting "minimum standards" 16
Type of facility
Wash basin 1
Halfway to "minimum standards" 44 Stand pipe 2
less than 100 pupils per DH 58 Fixed container 1 101-200 pupils per DH 23 None 153 over 200 pupils per DH 1 Water for
hand-washing
Enough 2
no latrines 15 Insufficient 1
Type of latrine
Dry compost 0 None 154 VIP 1
Soap available?
Yes 1 Pit latrine with slab 140
Pour flush 0
No 156 Traditional pit latrine 10
Others 0 Water supply status summary
Categorisation Number of schools
Type of source
Piped 48
Hand-drilled tube well 19 Shallow well 0
Rainwater harvesting 29 Other / none 30
Location On school premises 103
Outside school premises 54
Functionality Functional 73
Non-functional 84

SWASH Mapping Consolidated National Report
SWASH Mapping Consolidated National Report Page 90
Figure 65 Overall school WASH status - Kibondo
Overall School WASH
07
1623
2 0
25 25
0
21
76
97
19
1
115 116
0 2 4 6 10 6 1016
0 0 0 0 0 0 0 0
0
20
40
60
80
100
120
140
Pre-school Pre- and
Primary
Primary
only
All Primary Secondary Private Public Grand Total
School type . Management . Grand Total
no
. o
f sch
oo
ls Very Poor
Poor
OK
Good
Figure 66 Map – overall WASH scores – Kibondo
KIBO N D O S C H OO L W AS H M AP PIN G
D AT A S OU R C E :
Ac tual scho ols , w ater fa c ilit ie s a nd la tr ine str uc ture s
gro und tr uthin g ba sed on m ob ile G IS te chn olog y w a s
don e us in g T rim b le G eo XM G PS m o un te d w ith So ny
digi ta l cam e ra for re ali ty veri f icat ion .
To tal nu m be r of pup ils an d teach ers p er scho ol w as
obtai ned by i nterv i ew cond uc ted a t p art icu lar sch ool s .
D igital sp at ial d ata w er e ba sed o n dif fer ent sou rces
(Ge oD a ta S pa tial ser ver, Bu rea u of Sta ti st ics an d SM D ).
C LIEN T : C ON S U LT A N T :SN V /U N IC EF /W a terA id Geo D ata C o nsul ta nts Lim ite d - 20 09
Map 1: KIBONDO DISTRICT - OVERALL WASH SCORE
NN GA R A
D IS T R IC T
% Goo d
W ard b ou nda ry
OK%% Poo r
Ver y p oor$
Prim ary schoo ls
Seco nd ary schoo ls
Ver y p oor
Poo r$$ OK
Goo d$
$
Main road s
Othe r ro ad s
%$$%%
$%$
%%%
$%%
%%%
$%%%%
%%
%%$%%
%
%%
%
%
$
%%
%
%%$
%%
%$
$
%
%
%%%
%
$%%%
$
$
$ $$%%%%%%%
%%%%%%$
%%$%
%%
%
%$%%%
%$%%%
%
%%%%
%%%$
%
$%%
%
%%$
%
% %
%
%
%%%
$%
$
$$ %%%
%
%%
%%$
%%
%
%$%%
%% %%
%%%
%%%
%%
%%$
$
%%%
Busagara
Kakonko
Muhange
Rugongwe
Kasanda
Misezero
Nyamtukuza
KizaziItaba
Kitahana
Murungu
Kumsenga
Kasuga
Rugenge
Mugunzu
Nyabibuye BIH AR A M U LO
D IST R IC T
BU K OM B E
D IS T R IC T
U R AM B O
D IS T R IC T
BU R U N D I
KA SU LU
D IS T R IC T

SWASH Mapping Consolidated National Report
SWASH Mapping Consolidated National Report Page 91
Annex 2.7 - Overview data – Kigoma District
Table 21 Overall data - Kigoma
Number of schools and pupils in the study district No. of schools No. of pupils
Private Public Total Girls Boys Total
A – Pre-school 0 0 0 0 0 0
B – Pre- and Primary 0 92 92 26,917 27,748 54,665
C – Primary 0 125 125 30,826 31,244 62,070
D – Secondary 4 27 31 4,344 8,344 12,688
Total 4 244 248 62,087 67,336 129,423
Latrine numbers, ratios and shortages # Pupils Actual # DHs Pupils per DH Required # DHs Shortage
Girls 62,087 1109 56.0 3,104 1,995
Boys 67,336 1055 63.8 2,693 1,638
Total 129,423 2,164 59.8 5,798 3,634
Latrine status summary Hand-washing status summary
Categorisation Number of schools
Categorisation Number of schools
Latrine numbers
Meeting "minimum standards" 16
Type of facility
Wash basin 0
Halfway to "minimum standards" 59 Stand pipe 1
less than 100 pupils per DH 96 Fixed container 2
101-200 pupils per DH 62 None 245
over 200 pupils per DH 9 Water for hand-
washing
Enough 3
no latrines 6 Insufficient 0
Type of latrine
Dry compost 0 None 245
VIP 0
Soap available?
Yes 0 Pit latrine with slab 213
Pour flush 4
No 248
Traditional pit latrine 29
Others 0
Water supply status summary
Categorisation Number of schools
Type of source
Piped 72
Hand-drilled tube well 33
Shallow well 13
Rainwater harvesting 49
Other / none 0
Location On school premises 127
Outside school premises 121
Functionality Functional 128
Non-functional 120

SWASH Mapping Consolidated National Report
SWASH Mapping Consolidated National Report Page 92
Figure 67 Overall school WASH status - Kigoma
Overall School WASH
0 616 22
1 0
23 23
0
75
93
168
21
2
187 189
011 16
27
9 2
34 36
0 0 0 0 0 0 0 0
0
20
40
60
80
100
120
140
160
180
200
Pre-school Pre- and
Primary
Primary
only
All Primary Secondary Private Public Grand Total
School type . Management . Grand Total
no
. o
f sch
oo
ls Very Poor
Poor
OK
Good
Figure 68 Map – overall WASH scores - Kigoma
LEG EN D
D AT A S OU R C E :
Ac tual scho ols , w ater fa c ilit ie s a nd la tr ine str uc ture s
gro und tr uthin g ba sed on m ob ile G IS te chn olog y w a s
don e us in g T rim b le G eo XM G PS m o un te d w ith So ny
digi ta l cam e ra for re ali ty veri f icat ion .
To tal nu m be r of pup ils an d teach ers p er scho ol w as
obtai ned by i nterv i ew cond uc ted a t p art icu lar sch ool s .
D igital sp at ial d ata w er e ba sed o n dif fer ent sou rces
(Ge oD a ta S pa tial ser ver, Bu rea u of Sta ti st ics an d SM D ).
C LIEN T : C ON S U LT A N T :SN V /U N IC EF /W a terA id Geo D ata C o nsul ta nts Lim ite d - 20 09
Map 1: KIGOMA RURAL DISTRICT - OVERALL SCHOOL WASH SCORE - 2009
N
KA SU LU
D IS T R IC T
% Goo d
W ard b ou nda ry
OK%% Poo r
Ver y p oor$
Prim ary schoo ls
Seco nd ary schoo ls
Ver y p oor
Poo r$$ OK
Goo d$
$
KIBO N D O
D IS T R IC T
U R AM B O
D IS T R IC T
M P AN D A
D IS T R IC T
%
%%%%
%$%%$%%%
$
%
%
%
%
%%
$%$%%
%% %
%%
%
%
%
$%%
$%%
%%%$%
%%
%
%%
%
%%%%%%%%%
%%
%
%%%%%%
%%
$%%%%%
%
%%
%%%%%%
%
$%
%%
$%%%%
$
%%$%%%
$
%$$%
%$%
%%%$%%
$%%$ %%
%%%
$%
%
%%%%$
%%%%
%
%%
%%%%%%
$%%$%%
%%%%
%%%
%%%%
%%
%%%%
$%%%%%%%%
%%%%%%%
%%
%
%%%%
%$$
%
%
%%%%%
%%
%%%
%%
%
%%%%
%%%
%%
%
%
%
%% %
%%%
%
%%%% %%%%%
%%%%$%%
%%%
Uvinza
Kalya
Sunuka
Sigunga
Igalula
Nguruka
Buhingu
IlagalaMganza
Kandaga
Simbo
Bitale
Mtego wa noti
Mahembe
Mwamgongo
Mkigo
Lake
Tanganyika
%%%$
%
%
%
$%%%
%%
%
%%
%%%
%%%
$
%%%%
$
%%$%
%%
$
%
$$%
$%%
$%%
%%%
$%
%
%%%%
$%
%%%
%%%
%%
%%%%
$%%%%
%
%%%
%%%
%%
%%
%%
%
%%%%
%$$
%
%%%% %
%%
%%
%
%%%$%%
%%%
Bitale
Mahembe
Matendo
Mwamgongo
Kandaga
Mkigo
Kalinzi
Simbo
Kagongo
Kagunga
Mngonya
Mwandiga
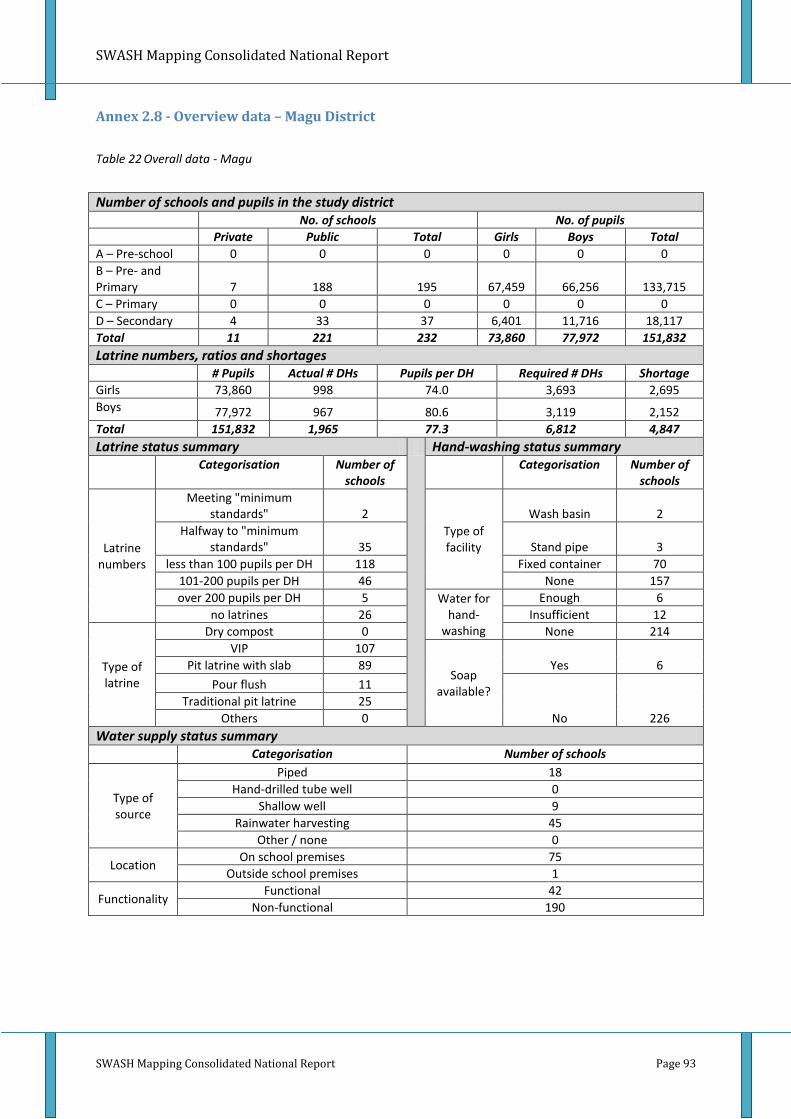
SWASH Mapping Consolidated National Report
SWASH Mapping Consolidated National Report Page 93
Annex 2.8 - Overview data – Magu District
Table 22 Overall data - Magu
Number of schools and pupils in the study district No. of schools No. of pupils
Private Public Total Girls Boys Total
A – Pre-school 0 0 0 0 0 0
B – Pre- and Primary 7 188 195 67,459 66,256 133,715
C – Primary 0 0 0 0 0 0
D – Secondary 4 33 37 6,401 11,716 18,117
Total 11 221 232 73,860 77,972 151,832
Latrine numbers, ratios and shortages # Pupils Actual # DHs Pupils per DH Required # DHs Shortage
Girls 73,860 998 74.0 3,693 2,695
Boys 77,972 967 80.6 3,119 2,152
Total 151,832 1,965 77.3 6,812 4,847
Latrine status summary Hand-washing status summary
Categorisation Number of schools
Categorisation Number of schools
Latrine numbers
Meeting "minimum standards" 2
Type of facility
Wash basin 2
Halfway to "minimum standards" 35 Stand pipe 3
less than 100 pupils per DH 118 Fixed container 70
101-200 pupils per DH 46 None 157
over 200 pupils per DH 5 Water for hand-
washing
Enough 6
no latrines 26 Insufficient 12
Type of latrine
Dry compost 0 None 214
VIP 107
Soap available?
Yes 6 Pit latrine with slab 89
Pour flush 11
No 226
Traditional pit latrine 25
Others 0
Water supply status summary
Categorisation Number of schools
Type of source
Piped 18
Hand-drilled tube well 0
Shallow well 9
Rainwater harvesting 45
Other / none 0
Location On school premises 75
Outside school premises 1
Functionality Functional 42
Non-functional 190

SWASH Mapping Consolidated National Report
SWASH Mapping Consolidated National Report Page 94
Figure 69 Overall school WASH status - Magu
Overall School WASH
0
40
0
40
0 0
40 40
0
141
0
141
29
1
169 170
013
013 8 9 12
21
0 1 0 1 0 1 0 1
0
20
40
60
80
100
120
140
160
180
Pre-school Pre- and
Primary
Primary
only
All Primary Secondary Private Public Grand Total
School type . Management . Grand Total
no
. o
f sch
oo
ls Very Poor
Poor
OK
Good
Figure 70 Map – overall WASH scores - Magu
'
'
''
'
'
'
''
''
'
''
''
'
'
'
$
$$ %
$
$
#
$$
$
$ #$
$
$
$
$
$# $
$
$
$
$$
$$
$
$
$#
$$$
$
$
#
$
$
##
%
$
$
$
$
$
$#
%% $
#
$ $#
$
$
$
$$
$#$
$
$
$
$
#
%
$$#
$
$
$
$
$$
$
$
$# #$
$
$$
$
$$
%
%$
$
$
$
$$
$
%$
$
#$
$#
$
$$
$
$
ÊÚ% %
$
$
##
$
#
$
$# $
$
#$
$$ $
#
$
$$
$
#$
#
$
$$
$ $
$
$#
$
$#
$
$$
$#
#$$
$
$
$$$
$
$$
##$
$$
$$
#
$$
$#
#
$
#
% #$
$$
#$
$$
$
Mk ula
Kalem ela
Shishani
Mal ili
Kabi ta
Ngasam o
Ng'haya
Kises a
Nk ungulu
Lubugu
Kilo le liBadugu
Igalukilo
Shigala
Kahangara
Suk um a
Bujashi
Mw am anga
Nyigogo
Mw am any ili
Kongolo
KitongoNyaluhande
Luta le
Nyanguge
Magu M jin i
Ng 'w amabanza
Secondary schools
$T Ok
&V Very poor
' Poor
ÊÚ Good
% Ok
# Very poor
$ Poor
Primary schools
10 0 10 20 Kilo me ters
N
Lake Victoria

SWASH Mapping Consolidated National Report
SWASH Mapping Consolidated National Report Page 95
Annex 2.9 - Overview data – Makete District
Table 23 Overall data - Makete
Number of schools and pupils in the study district No. of schools No. of pupils
Private Public Total Girls Boys Total
A – Pre-school 0 0 0 0 0 0 B – Pre- and Primary 1 81 82 10,510 10,491 21,001
C – Primary 0 14 14 1,374 1,394 2,768
D – Secondary 2 14 16 3,379 3,049 6,428
Total 3 109 112 15,263 14,934 30,197
Latrine numbers, ratios and shortages # Pupils Actual # DHs Pupils per DH Required # DHs Shortage
Girls 15,263 431 35.4 763 332 Boys 14,934 408 36.6 597 189 Total 30,197 839 36.0 1,361 522
Latrine status summary Hand-washing status summary
Categorisation Number of schools
Categorisation Number of schools
Latrine numbers
Meeting "minimum standards" 23
Type of facility
Wash basin 2 Halfway to "minimum
standards" 52 Stand pipe 53
less than 100 pupils per DH 9 Fixed container 4
101-200 pupils per DH 2 None 53
over 200 pupils per DH 0 Water for hand-
washing
Enough 33
no latrines 26 Insufficient 30
Type of latrine
Dry compost 0 None 49
VIP 10
Soap available?
Yes 0 Pit latrine with slab 56
Pour flush 17
No 112
Traditional pit latrine 22
Others 0
Water supply status summary
Categorisation Number of schools
Type of source
Piped 74
Hand-drilled tube well 0
Shallow well 1
Rainwater harvesting 0
Other / none 36
Location On school premises 94
Outside school premises 0
Functionality Functional 70
Non-functional 18

SWASH Mapping Consolidated National Report
SWASH Mapping Consolidated National Report Page 96
Figure 71 Overall school WASH status - Makete
Overall School WASH
0
14
4
18
0 0
18 18
0
23
6
29
30
32 32
0
44
4
48
13
3
5861
0 1 0 1 0 0 1 1
0
10
20
30
40
50
60
70
Pre-school Pre- and
Primary
Primary
only
All Primary Secondary Private Public Grand Total
School type . Management . Grand Total
no
. o
f sch
oo
ls Very Poor
Poor
OK
Good
Figure 72 Map – overall WASH scores - Makete
MAKETE_MAP 1
#
#
#
#
$
$ Po or
OK
Prima ry sch ools Se co nd ary schoo ls
Go od
OK
Po or
Ve ry poo r
#
#
#
#$
#
#
#
#$
#
$
#
#
$#
#
#
#
##
#
#
#
$$
#
##
#
$
##
#
#
##
#
##
#
#
#
#
#
#
#
#
#
#
##
#
#
#
##
$
#
#
#
#
#
#
#
$
#
#
#
$
#
#
#
#
#
#
#$
##
$
##
#
##
#
#
# $#
#
$
##
#
$
$
#
#
#
#
#
$
#
$ ##
#
#
#
Mfu mb i
Kitulo
Lup ila
Ikuwo
Ipep o
Lup alilo
Mba la tse
lpe le le
Mlond we
Kipa galo
Man g'o to
Matam ba
Ukwam a
Kigu lu
lwa wa
Bu lo ngwa
Iniho
N
5 0 5 10 Kilo me ters
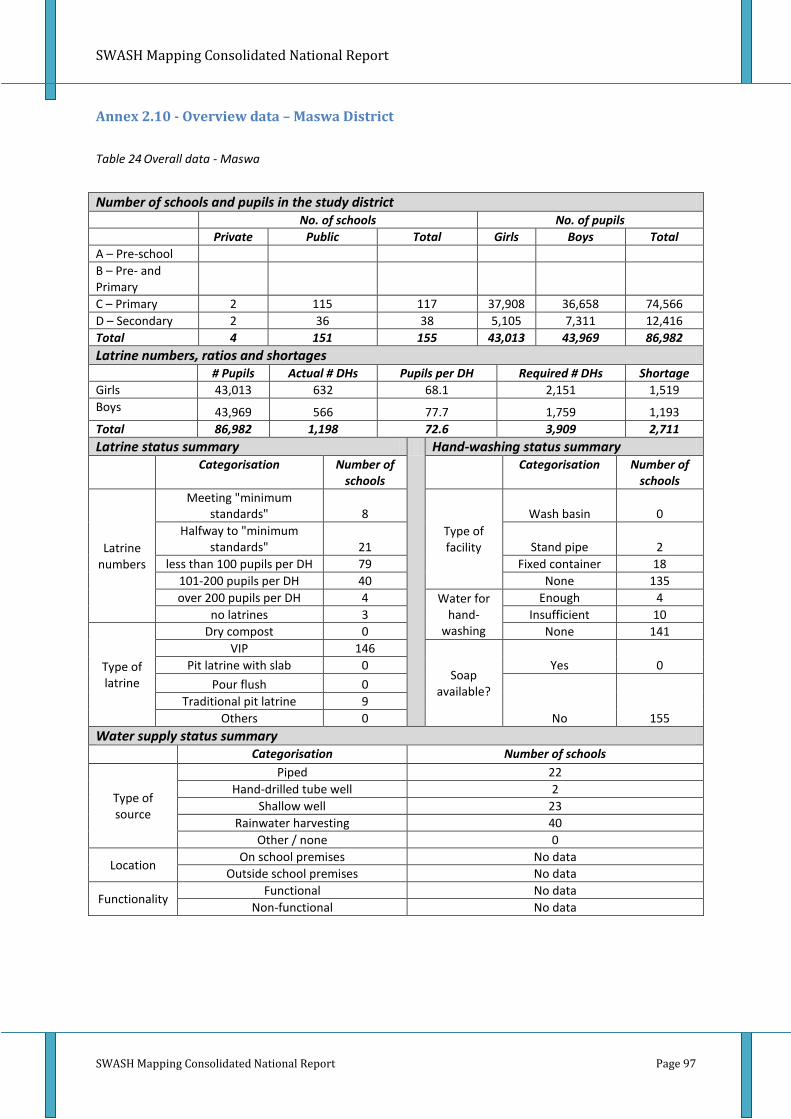
SWASH Mapping Consolidated National Report
SWASH Mapping Consolidated National Report Page 97
Annex 2.10 - Overview data – Maswa District
Table 24 Overall data - Maswa
Number of schools and pupils in the study district No. of schools No. of pupils
Private Public Total Girls Boys Total
A – Pre-school
B – Pre- and Primary
C – Primary 2 115 117 37,908 36,658 74,566
D – Secondary 2 36 38 5,105 7,311 12,416
Total 4 151 155 43,013 43,969 86,982
Latrine numbers, ratios and shortages # Pupils Actual # DHs Pupils per DH Required # DHs Shortage
Girls 43,013 632 68.1 2,151 1,519
Boys 43,969 566 77.7 1,759 1,193
Total 86,982 1,198 72.6 3,909 2,711
Latrine status summary Hand-washing status summary
Categorisation Number of schools
Categorisation Number of schools
Latrine numbers
Meeting "minimum standards" 8
Type of facility
Wash basin 0
Halfway to "minimum standards" 21 Stand pipe 2
less than 100 pupils per DH 79 Fixed container 18
101-200 pupils per DH 40 None 135
over 200 pupils per DH 4 Water for hand-
washing
Enough 4
no latrines 3 Insufficient 10
Type of latrine
Dry compost 0 None 141
VIP 146
Soap available?
Yes 0 Pit latrine with slab 0
Pour flush 0
No 155
Traditional pit latrine 9
Others 0
Water supply status summary
Categorisation Number of schools
Type of source
Piped 22
Hand-drilled tube well 2
Shallow well 23
Rainwater harvesting 40
Other / none 0
Location On school premises No data
Outside school premises No data
Functionality Functional No data
Non-functional No data

SWASH Mapping Consolidated National Report
SWASH Mapping Consolidated National Report Page 98
Figure 73 Overall school WASH status - Maswa
Overall School WASH
0 0
21 21
3 0
24 24
0 0
96 96
35
4
127 131
0 0 0 0 0 0 0 00 0 0 0 0 0 0 0
0
20
40
60
80
100
120
140
Pre-school Pre- and
Primary
Primary
only
All Primary Secondary Private Public Grand Total
School type . Management . Grand Total
no
. o
f sch
oo
ls Very Poor
Poor
OK
Good
Figure 74 Map – overall WASH scores - Maswa
$$
#
$
$
$
$$
#
$
$
!
$
$
#
$
$$
$
$
#
$
$
$
$
$
$ $
$
$
$
$$
$
$
$
$
$
$
$
!
$
#
$
$
$
$
$
$
$
$
#
##
$
$
$
$
$
#
$
$
#
#
#
$
$
#
$
$$
#
$
$
#
$
$$$
#
$
$
$
$
$$
$$$
$
$
#
$
$$
$
$
$
$
$
$
#
$
$
#
#
$
$
$
$
!
!$
# $
!
$
$
Mpindo
Sukuma
Badi
Masela
Lalango
Isanga
Busilili
Buchambi
Kulimi
Shish iyu
Budekwa
Ip ililo
Dakama
Nyabubinza
Kadoto
Nquligu li
Nyalikungu
Malampaka
MASWA_MAP1
Poor
Very poorVery poor
Poor
Secondary schoolsPrimary schools
$
# !

SWASH Mapping Consolidated National Report
SWASH Mapping Consolidated National Report Page 99
Annex 2.11 - Overview data – Morogoro Rural District
Table 25 Overall data – Morogoro
Number of schools and pupils in the study district No. of schools No. of pupils
Private Public Total Girls Boys Total
A – Pre-school 0 0 0 0 0 0
B – Pre- and Primary 0 62 62 15,876 16,658 32,534
C – Primary 0 87 87 13,483 15,067 28,550
D – Secondary 0 25 25 3,392 4,483 7,875
Total 0 174 174 32,751 36,208 68,959
Latrine numbers, ratios and shortages # Pupils Actual # DHs Pupils per DH Required # DHs Shortage
Girls 32,751 609 53.8 1,638 1,029
Boys 36,208 600 60.3 1,448 848
Total 68,959 1,209 57.0 3,086 1,877
Latrine status summary Hand-washing status summary
Categorisation Number of schools
Categorisation Number of schools
Latrine numbers
Meeting "minimum standards" 10
Type of facility
Wash basin 0
Halfway to "minimum standards" 56 Stand pipe 0
less than 100 pupils per DH 65 Fixed container 0
101-200 pupils per DH 24 None 174
over 200 pupils per DH 6 Water for hand-
washing
Enough 3
no latrines 13 Insufficient 9
Type of latrine
Dry compost 3 None 162
VIP 3
Soap available?
Yes 0 Pit latrine with slab 134
Pour flush 14
No 174
Traditional pit latrine 18
Others 2
Water supply status summary
Categorisation Number of schools
Type of source
Piped 27
Hand-drilled tube well 0
Shallow well 14
Rainwater harvesting 11
Other / none 122
Location On school premises 45
Outside school premises 129
Functionality Functional 40
Non-functional 134
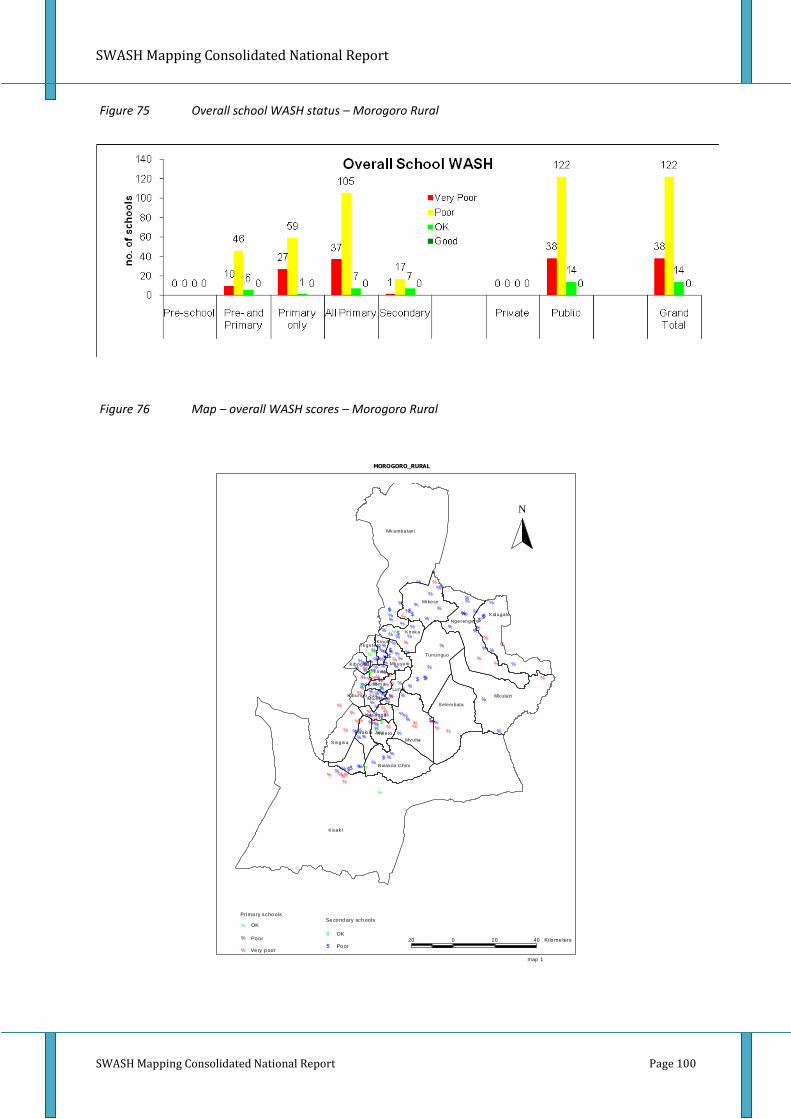
SWASH Mapping Consolidated National Report
SWASH Mapping Consolidated National Report Page 100
Figure 75 Overall school WASH status – Morogoro Rural
Figure 76 Map – overall WASH scores – Morogoro Rural
Prima ry scho olsSe co nd ary sch ools
OK
Po or
Po or
OK
Ve ry p oor
$
$
%
%
%
%%
%%%%
$$
%
%
%
%
%
%
%
%
%
%
%
%
%$$
%
$
%
%
%
%
%
%%
%$%
%
%
%
%%%
%%
%
%
%%
%
%%
%%$
%%%%$% $
%
%$
$%
%
%$%
%%
%
%$
$% %
%
%
%%
%
%%
%%
%$%
%
%
%
%
$%
% %
%
%$
%
%%%%%
%%%
%%
%
% %
%%%
%%
$%%
%%%
%%$$
%% %%%
%$
%
%%%
% %
%
%
%
%
%%%
%
%% %%%
%
%%
%%
% %%
%
%
%
%%
%
%%%
Kisak i
Mk ambalani
Mk ulazi
Selem bala
Mv uha
Tununguo
Kidugalo
Mikese
Ngerengere
Singis a
Bwaki la C hin i
Kirok a
Lundi
Kas anga
Tawa
Kibungo J uu
Kibogwa
TegeteroKinole
Mk uyuni
Kisem u
Mtom bozi
Bwaki la J uuKolero
20 0 20 40 Kilo me ters
N
MOROGORO_RURAL
map 1
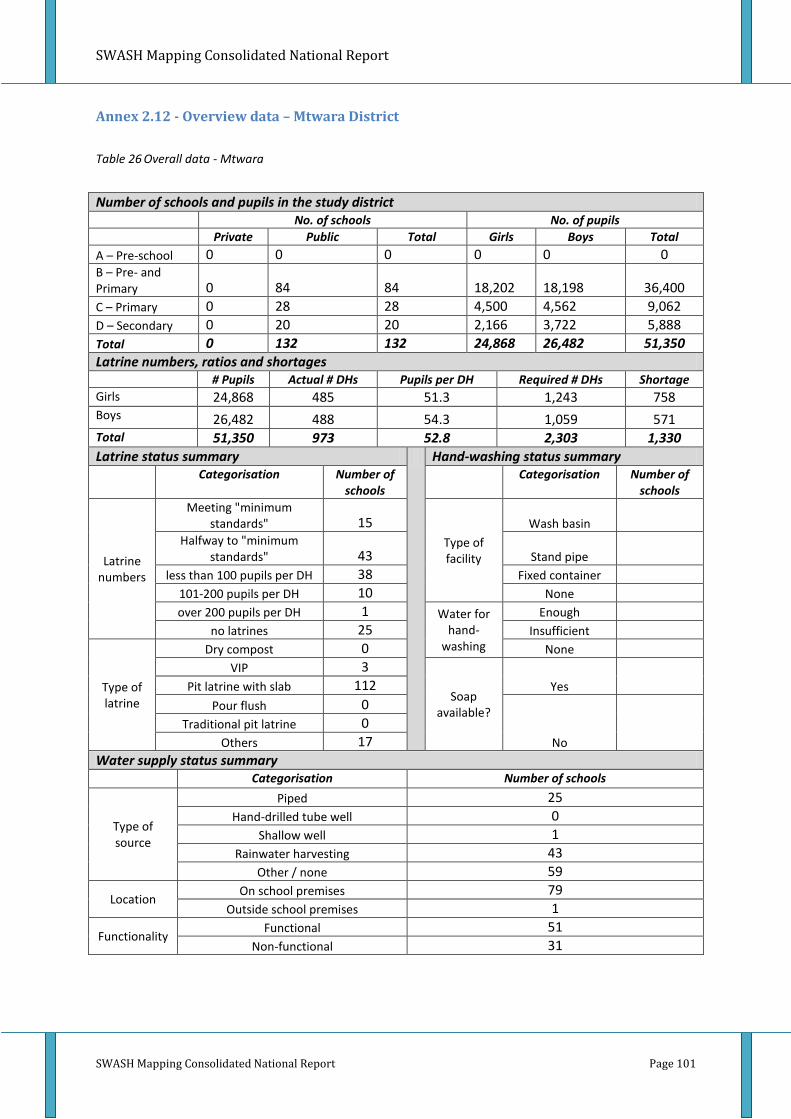
SWASH Mapping Consolidated National Report
SWASH Mapping Consolidated National Report Page 101
Annex 2.12 - Overview data – Mtwara District
Table 26 Overall data - Mtwara
Number of schools and pupils in the study district No. of schools No. of pupils
Private Public Total Girls Boys Total
A – Pre-school 0 0 0 0 0 0 B – Pre- and Primary 0 84 84 18,202 18,198 36,400
C – Primary 0 28 28 4,500 4,562 9,062
D – Secondary 0 20 20 2,166 3,722 5,888
Total 0 132 132 24,868 26,482 51,350
Latrine numbers, ratios and shortages # Pupils Actual # DHs Pupils per DH Required # DHs Shortage
Girls 24,868 485 51.3 1,243 758 Boys 26,482 488 54.3 1,059 571 Total 51,350 973 52.8 2,303 1,330
Latrine status summary Hand-washing status summary
Categorisation Number of schools
Categorisation Number of schools
Latrine numbers
Meeting "minimum standards" 15
Type of facility
Wash basin
Halfway to "minimum standards" 43 Stand pipe
less than 100 pupils per DH 38 Fixed container
101-200 pupils per DH 10 None
over 200 pupils per DH 1 Water for hand-
washing
Enough
no latrines 25 Insufficient
Type of latrine
Dry compost 0 None
VIP 3
Soap available?
Yes Pit latrine with slab 112
Pour flush 0
No Traditional pit latrine 0
Others 17
Water supply status summary
Categorisation Number of schools
Type of source
Piped 25
Hand-drilled tube well 0
Shallow well 1
Rainwater harvesting 43
Other / none 59
Location On school premises 79
Outside school premises 1
Functionality Functional 51
Non-functional 31
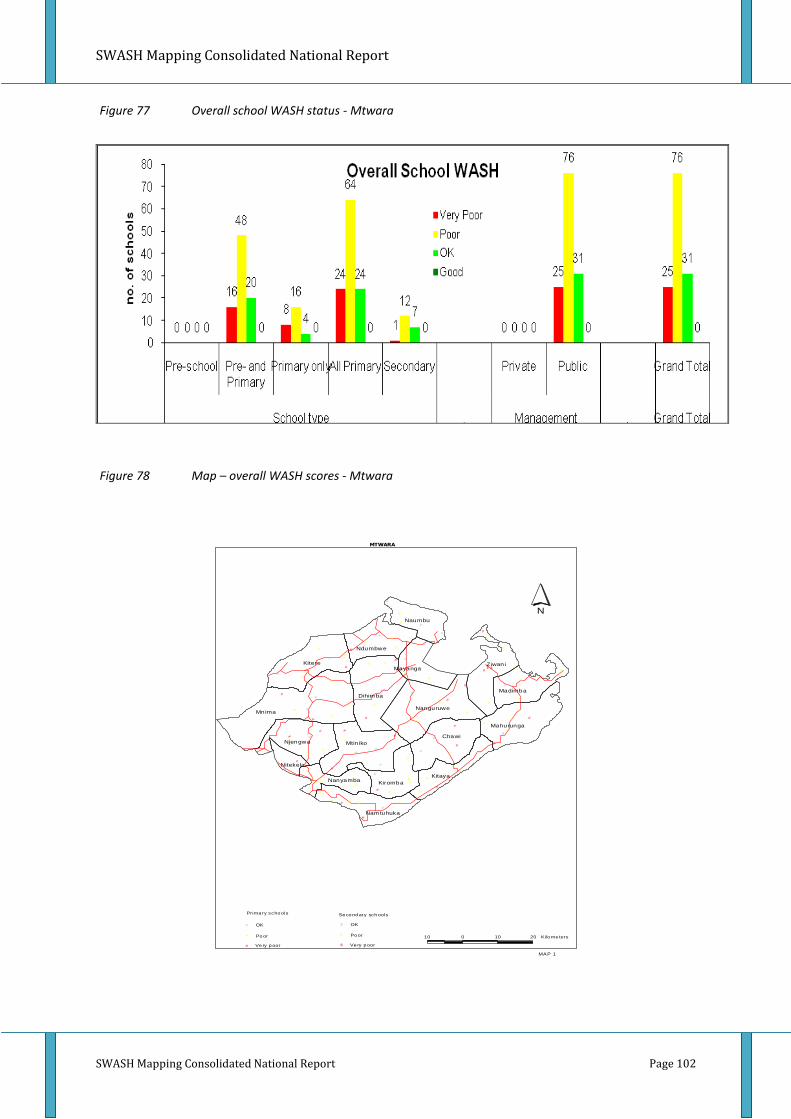
SWASH Mapping Consolidated National Report
SWASH Mapping Consolidated National Report Page 102
Figure 77 Overall school WASH status - Mtwara
Figure 78 Map – overall WASH scores - Mtwara
#
#
$
#
#
#
# ##
##
#
#
#
#
#
$
###
#
##
#
#
#
#
#
##
$$
#
#
#
#
#
$#$
##
$
$ $ #
#
#
#
# #
#
$$
#
#
#
#
#
##
#
#
#
#
#
#
#
#
#
# #
#
#
#$
#
#
#
$
#
#
##
$
#
#
#
##
#
#
#
#
$
$
#
##
#$
#
#
# ## ##
# # #
$#
$#
#
#
#
#$
#
#
#
#
#
#
##
#
#
Mnima
Kitere
Mtin iko
Chawi
Dihim ba
Nanguruwe
Ziwani
Njengwa
Kitaya
Mahurunga
Kiromba
Madimba
Ndumbwe
Naumbu
Nam tuhuka
Mayanga
Nanyamba
Nitekela
MTWARA
MAP 1
#
#
#
$
$
$
Prima ry scho ols Se co nd ary sch ools
OK
Po or
Ve ry p oor
OK
Po or
Ve ry p oor
10 0 10 20 Kilo me ters
N

SWASH Mapping Consolidated National Report
SWASH Mapping Consolidated National Report Page 103
Annex 2.13 - Overview data – Ngara District
Table 27 Overall data - Ngara
Number of schools and pupils in the study district No. of schools No. of pupils
Private Public Total Girls Boys Total
A – Pre-school 0 0 0 0 0 0
B – Pre- and Primary 3 109 112 33,214 32,712 65,926
C – Primary 0 0 0 0 0 0
D – Secondary 2 22 24 4,358 5,044 9,402
Total 5 131 136 37,572 37,756 75,328
Latrine numbers, ratios and shortages # Pupils Actual # DHs Pupils per DH Required # DHs Shortage
Girls 37,572 559 67.2 1,879 1,320
Boys 37,756 505 74.8 1,510 1,005
Total 75,328 1,064 70.8 3,389 2,325
Latrine status summary Hand-washing status summary
Categorisation Number of schools
Categorisation Number of schools
Latrine numbers
Meeting "minimum standards" 7
Type of facility
Wash basin 1
Halfway to "minimum standards" 24 Stand pipe 4
less than 100 pupils per DH 62 Fixed container 26
101-200 pupils per DH 37 None 103
over 200 pupils per DH 1 Water for hand-
washing
Enough 16
no latrines 5 Insufficient 13
Type of latrine
Dry compost 0 None 107
VIP 91
Soap available?
Yes 1 Pit latrine with slab 36
Pour flush 6
No 135
Traditional pit latrine 1
Others 2
Water supply status summary
Categorisation Number of schools
Type of source
Piped 21
Hand-drilled tube well 0
Shallow well 4
Rainwater harvesting 35
Other / none 50
Location On school premises 104
Outside school premises 8
Functionality Functional 74
Non-functional 62

SWASH Mapping Consolidated National Report
SWASH Mapping Consolidated National Report Page 104
Figure 79 Overall school WASH status - Ngara
Overall School WASH
05
05
0 05 5
0
90
0
90
70
97 97
0
17
0
17 17
5
2934
0 0 0 0 0 0 0 0
0
20
40
60
80
100
120
Pre-school Pre- and
Primary
Primary
only
All Primary Secondary Private Public Grand Total
School type . Management . Grand Total
no
. o
f sch
oo
ls Very Poor
Poor
OK
Good
Figure 80 Map – overall WASH scores - Ngara
OK
Poor
Very poor
Primary schools
%
#
$OK
Very por
Secondary schools
g
¥
Legend
NGARA_MAP 1
%$ $
$
%$
%$
$
$
¥$
$
$
$
$$
$
$$
$$
$
%
$ %
$
$
$
$$¥
$
$
$
$
$$
$$$$
#
$
$$
$$
$#%
$$
$
$
%
$
$$
$
$%
%
%
%$
$
$
$$
$
¥
$
$
$
$
%
$
$
$
%
$$$
$
$
$
$
$
$
$
%
$
$
$
$
$$
#
#
$ $
$
$
#
%
$$
$
$$$
$$
$$$
$
%
Rusum o
Keza
Muganza
Rulenge
Bugaram a
Bukiriro
Murusagamba
Kanazi
Nyak isasa
Kabanga
Ntobeye Nyamiyaga
Kibim ba
Kirushya
Mabawe
Mugoma
Ngara
Mjini

SWASH Mapping Consolidated National Report
SWASH Mapping Consolidated National Report Page 105
Annex 2.14 - Overview data – Siha District
Table 28 Overall data - Siha
Number of schools and pupils in the study district No. of schools No. of pupils
Private Public Total Girls Boys Total
A – Pre-school 0 0 0 0 0 0 B – Pre- and Primary 0 30 30 5,625 5,719 11,344
C – Primary 2 22 24 4,467 4,453 8,920
D – Secondary 2 13 15 2,434 1,855 4,289
Total 4 65 69 12,526 12,027 24,553
Latrine numbers, ratios and shortages # Pupils Actual # DHs Pupils per DH Required # DHs Shortage
Girls 12,526 416 30.1 626 210 Boys 12,027 388 31.0 481 93 Total 24,553 804 30.5 1,107 303
Latrine status summary Hand-washing status summary
Categorisation Number of schools
Categorisation Number of schools
Latrine numbers
Meeting "minimum standards" 24
Type of facility
Wash basin 1 Halfway to "minimum
standards" 30 Stand pipe 4
less than 100 pupils per DH 11 Fixed container 0
101-200 pupils per DH 1 None 64
over 200 pupils per DH 0 Water for hand-
washing
Enough 4
no latrines 3 Insufficient 0
Type of latrine
Dry compost 0 None 65
VIP 1
Soap available?
Yes 1 Pit latrine with slab 61
Pour flush 1
No 68
Traditional pit latrine 6
Others 0
Water supply status summary
Categorisation Number of schools
Type of source
Piped 62
Hand-drilled tube well 0
Shallow well 0
Rainwater harvesting 0
Other / none 7
Location On school premises 63
Outside school premises 6
Functionality Functional 59
Non-functional 10

SWASH Mapping Consolidated National Report
SWASH Mapping Consolidated National Report Page 106
Figure 81 Overall school WASH status – Siha
Overall School WASH
0 02 2 1 0
3 30
20
14
34
41
37 38
0
108
18
10
3
2528
0 0 0 0 0 0 0 0
0
5
10
15
20
25
30
35
40
Pre-school Pre- and
Primary
Primary
only
All Primary Secondary Private Public Grand Total
School type . Management . Grand Total
no
. o
f sch
oo
ls Very Poor
Poor
OK
Good
Figure 82 Map – overall WASH scores - Siha
LEG EN D
D AT A S OU R C E :
Ac tual scho ols , w ater fa c ilit ie s a nd la tr ine str uc ture s
gro und tr uthin g ba sed on m ob ile G IS te chn olog y w a s
don e us in g T rim b le G eo XM G PS m o un te d w ith So ny
digi ta l cam e ra for re ali ty veri f icat ion .
To tal nu m be r of pup ils an d teach ers p er scho ol w as
obtai ned by i nterv i ew cond uc ted a t p art icu lar sch ool s .
D igital sp at ial d ata w er e ba sed o n dif fer ent sou rces
(Ge oD a ta S pa tial ser ver, Bu rea u of Sta ti st ics an d SM D ).
C LIEN T : C ON S U LT A N T :SN V - T h e N ethe rla nds D e velop m en t O rg ani sa t ion Geo D ata C o nsul ta nts Lim ite d - 20 09
Map 1: SIHA DISTRICT - OVERALL SCORE
N
AR U M E R U
D IS T R IC T
ÊÚ Goo d
W ard b ou nda ry
OK%$ Poo r
Ver y p oor#
Prim ary schoo ls
Seco nd ary schoo ls
Ver y p oor
Poo rOK
Goo dÚ
Main road s
Othe r ro ad s
#
##
#
##
# #
#
##
#
#
#
##
#
#
#
#
#
#
##
#
# ##
#
#
#
#
#
#
#
##
#
#
#
#
#
#
###
#
#
#
##
#
##
#
#
##
#
# #
###
# #
##
#
#
# ##
#
#
#
#
#
##
#
#
#
##
#
###
#
#
%
$%
%
%%
%%
%$
$
%
$
%
%
%
$
$
$
%
% %
$
$
$$
% $
$
$
$$
$
$
$
$
$
$ $
$ $
$$
$ %
$$
Siha Magharibi
Siha Kati
SihaKaskazini
SihaMashariki
M O SH I
D IS T R IC T
H AI
D IS T R IC T

SWASH Mapping Consolidated National Report
SWASH Mapping Consolidated National Report Page 107
Annex 2.15 - Overview data – Singida Urban District
Table 29 Overall data – Singida Urban
Number of schools and pupils in the study district No. of schools No. of pupils
Private Public Total Girls Boys Total
A – Pre-school 7 2 9 354 317 671
B – Pre- and Primary 3 40 43 12,669 12,230 24,899
C – Primary 0 4 4 812 769 1,581
D – Secondary 3 15 18 3,484 4,262 7,746
Total 13 61 74 17,319 17,578 34,897
Latrine numbers, ratios and shortages # Pupils Actual # DHs Pupils per DH Required # DHs Shortage
Girls 17,319 438 39.5 866 428
Boys 17,578 430 40.9 703 273
Total 34,897 868 40.2 1,569 701
Latrine status summary Hand-washing status summary
Categorisation Number of schools
Categorisation Number of schools
Latrine numbers
Meeting "minimum standards" 17
Type of facility
Wash basin 10
Halfway to "minimum standards" 26 Stand pipe 0
less than 100 pupils per DH 22 Fixed container 12 101-200 pupils per DH 5 None 52 over 200 pupils per DH 1 Water for
hand-washing
Enough 14
no latrines 3 Insufficient 10
Type of latrine
Dry compost 0 None 50 VIP 15
Soap available?
Yes 9 Pit latrine with slab 44
Pour flush 10
No 65 Traditional pit latrine 4
Others 0 Water supply status summary
Categorisation Number of schools
Type of source
Piped 30
Hand-drilled tube well 1 Shallow well 5
Rainwater harvesting 10 Other / none 11
Location On school premises 45
Outside school premises 1
Functionality Functional 42
Non-functional 5
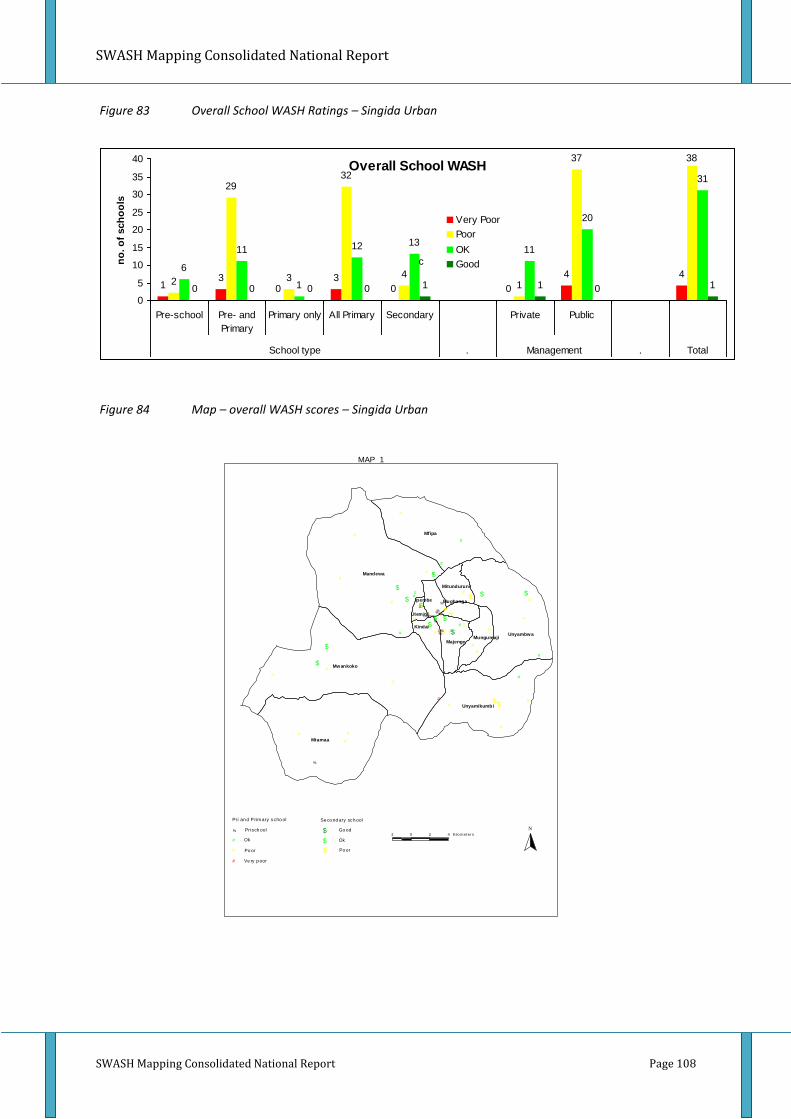
SWASH Mapping Consolidated National Report
SWASH Mapping Consolidated National Report Page 108
Figure 83 Overall School WASH Ratings – Singida Urban
Overall School WASH
13
03
0 0
4 42
29
3
32
41
37 38
6
11
1
12 1311
20
31
0 0 0 0 1 1 0 1
0
5
10
15
20
25
30
35
40
Pre-school Pre- and
Primary
Primary only All Primary Secondary Private Public
School type . Management . Total
no
. o
f sch
oo
ls
Very Poor
Poor
OK
Goodc
Figure 84 Map – overall WASH scores – Singida Urban
$###
#####
$
$
%
#
#$%%###
$#
##
$##
#
$
$
#
#
#
##
#
%
#
#$$
#
#
#
#
#
###
#
#
#
$$$#
#
#
$#
%
#
#
#
#
$
$##
#
%
%
%
Mandewa
Mwankoko
Mtamaa
Mfipa
Unyambwa
Unyamikumbi
Majengo
Kindai
Mungumaji
Mitunduruni
Ipembe Mughanga
UteminiUtemini
2 0 2 4 Kilo m eter s
Pri an d P rim ary scho ol
% Prisch ool
#
#
#
$
$
$
Ok
Ve ry p oor
Po or
Se co nd ary sch ool
Po or
Ok
Go od N
MAP 1

SWASH Mapping Consolidated National Report
SWASH Mapping Consolidated National Report Page 109
Annex 2.16 - Overview data – Temeke District
Table 30 Overall data - Temeke
Number of schools and pupils in the study district No. of schools No. of pupils
Private Public Total Girls Boys Total
A – Pre-school 8 0 8 305 261 566 B – Pre- and Primary 8 1 9 3,006 3,116 6,122
C – Primary 8 97 105 82,247 79,055 161,302
D – Secondary 18 46 64 20,179 22,500 42,679
Total 42 144 186 105,737 104,932 210,669
Latrine numbers, ratios and shortages # Pupils Actual # DHs Pupils per DH Required # DHs Shortage
Girls 105,737 1065 99.3 5,287 4,222 Boys 104,932 950 110.5 4,197 3,247 Total 210,669 2,015 104.6 9,484 7,469
Latrine status summary Hand-washing status summary
Categorisation Number of schools
Categorisation Number of schools
Latrine numbers
Meeting "minimum standards" 22
Type of facility
Wash basin 14 Halfway to "minimum
standards" 30 Stand pipe 60
less than 100 pupils per DH 61 Fixed container 16
101-200 pupils per DH 46 None 96
over 200 pupils per DH 26 Water for hand-
washing
Enough 42
no latrines 1 Insufficient 51
Type of latrine
Dry compost 0 None 93
VIP 1
Soap available?
Yes 3 Pit latrine with slab 104
Pour flush 77
No 183
Traditional pit latrine 4
Others 0
Water supply status summary
Categorisation Number of schools
Type of source
Piped 24
Hand-drilled tube well 131
Shallow well 1
Rainwater harvesting 1
Other / none 2
Location On school premises 139
Outside school premises 19
Functionality Functional 139
Non-functional 47

SWASH Mapping Consolidated National Report
SWASH Mapping Consolidated National Report Page 110
Figure 85 Overall school WASH status - Temeke
Overall School WASH
0 0 2 2 0 1 1 22 1
63 64
23
4
8589
6 7
3946
4035
57
92
0 1 1 2 1 2 1 3
0
10
20
30
40
50
60
70
80
90
100
Pre-school Pre- and
Primary
Primary
only
All Primary Secondary Private Public Grand Total
School type . Management . Grand Total
no
. o
f sch
oo
ls Very Poor
Poor
OK
Good
Figure 86 Map – overall WASH scores – Temeke
Vie w 1
D AT A S OU R C E :
Ac tual scho ols , w ater fa c ilit ie s a nd la tr ine str uc ture s
gro und tr uthin g ba sed on m ob ile G IS te chn olog y w a s
don e us in g T rim b le G eo XM G PS m o un te d w ith So ny
digi ta l cam e ra for re ali ty veri f icat ion .
To tal nu m be r of pup ils an d teach ers p er scho ol w as
obtai ned by i nterv i ew cond uc ted a t p art icu lar sch ool s .
D igital sp at ial d ata w er e ba sed o n dif fer ent sou rces
(Ge oD a ta S pa tial ser ver, Bu rea u of Sta ti st ics an d SM D ).
C LIEN T : C ON S U LT A N T :SN V - T h e N ethe rla nds D e velop m en t O rg ani sa t ion Geo D ata C o nsul ta nts Lim ite d - 20 09
TEMEKE DISTRICT - OVERALL WASH SCORE - 2009
N
IL AL A
D IS T R IC T
ÊÚ Goo d
W ard b ou nda ry
OK%$ Poo r
Ver y p oor#
Prim ary schoo ls
Seco nd ary schoo ls
Ver y p oor
Poo r¥U OK
Goo dÚ
â
Main road s
Othe r ro ad s
%
$
$
%
%
$
$
$
%
ÊÚ
$%
$%$%$$
$
%
%
%
$
#
$$$$
$$
$$
%$$
%$
$$
$$
%%
%%%$%$
%
ÊÚ$$$
%%%%
$%
%
%
%
$
$
%
$
$%%
$$$ %%
%
$$$
$$
%%%
$
%
$
$$%
%%
$$$$$%%
%
$# #
$$$
%
$
%
%$ $$%
Pe mb a M nazi
Kisarawe II
So ma ngira
Cha ma zi
Toan gom a
Kiba da
Mji M wem a
Cha ra mb e
Mba gala Ku u
Vijibw eni
Mba gala
Kiga mb oni
Ku ra sin i
Maka nga rawe
Yom bo V ituka Mto ni
Mibura ni
Sa nda li
Ke ko
M KU R A N GA
D IST R IC T
In dia n
Ocea n
#
%
%
$$
$
%%
%%
$
%
%
%%
$$$ %
%
%
$$$
$$
%%
$
$$
%
%%%
#
%
%
$$
$
%%
%%
$
%
%
%%
$$$ %
%
%
$$$
$$
%%
$
$$
%
%%%
Kurasini
Mtoni
MiburaniSandali
Temeke
Keko
Azimio
Chang'ombe
TandikaYombo Vituka
Makangarawe

SWASH Mapping Consolidated National Report
SWASH Mapping Consolidated National Report Page 111
Annex 3: Mapping survey tool
Data Entry Form: Date of entry ______________________Recording Organisation ______________________
General information
School name …………………………… pre-school primary school combination pre/primary secondary school
Construction year ……………….
School ownership
District Council ………………
Church organization ………………
Private …………
Other ……………………..
Name of interviewee School Latitude
Position of interviewee Elevation
Recording date Number of class rooms
Region Number of girl pupils
District No. drop holes/ latrines (girls)
Ward No. separate washing facilities (girls)
Village/Hamlet/Mtaa Number of boy pupils
Sub village No. drop holes/ latrines (boys)
Village registration no Urinals (boys)
School photo ID (6 photographs) 1) School environment 2) Water point 3,4) In/out school 5,6) In/out latrine
Number of female teachers
Number of male teachers
GPS school number No. drop holes/ latrines (female teachers)
School Longitude No. drop holes/latrines (male teachers)

SWASH Mapping Consolidated National Report
SWASH Mapping Consolidated National Report Page 112
Latrine type Latrine construction Hygiene practices Water source type
o Traditional pit latrines o Pit latrine with san-plate o VIP o Pour flush o Dry compost o Double vault latrine o ECOSAN o Other
Pit: o Lined – burned bricks o Lined – concrete blocks o Lined - other materials o Not lined o Who funded/constructed? …………………………………. Construction year ………… Super structure: o Wood o Mud blocks o Burned bricks o Concrete blocks o Other……………………….
Cleansing material available? yes no
Which: ……………………………. Hygiene pads disposal system?
yes no Solid waste disposal system?
yes no
Hand wash facility? yes no
Kind of facility? o Running water o Container Sufficient water available?
yes no Soap available?
yes no
o Protected spring o Shallow well o Borehole o Rain water harvest o Pipe water supply o Other …………………………………. Who funded/constructed? …………………………………. Construction year ………. Location water source o At school premise o Outside school premise
Main problems with toilets Access and privacy of toilet/latrine School WaSH education provision Registered sick pupils per month
Girls Boys
o Year the toilet collapsed …………….. o Poor construction materials o Not repaired o Lack of water o Filled up o Inappropriate location o Inappropriate design o Flood prone o Smell o Dirty o Possibility to empty? yes no o How many are locked…………….. o Who holds the keys……………….
Adequate access? yes no
Suitable for disabled? yes no
Adequate privacy (girls)? yes no
Adequate privacy (boys)? yes no
Doors? yes no
State of the doors? good condition damaged lockable from inside
In school curriculum? yes no
Is it taught? yes no
Teachers trained in hygiene? yes no Which classes receive hygiene education and how many hours? ………………….. Learning materials available? yes no Which materials? books posters Other visual aids
o <10 o 11 to 25 o 25 - 50 o >50 Common diseases 1. 2. 3.
o <10 o 11 to 25 o 25 - 50 o >50 Common diseases 1. 2. 3.
Who is noted to own the facility Planning Maintenance Maintenance costs Public awareness
o Water supply …………………………………… o Toilet ……………………………………
Is there a school master plan? yes no
Is it followed? yes no
Strategy for WaSH improvement in place? yes no
Who cleans? Pupils girls boys Hired labour
Type of cleaning materials? ………………………………….. Cleaning schedule
yes no Who supervises ………………
Who pays for maintenance? o School income o Village government o Community contribution o District Council o Other
………………………………
Do people discuss School Wash in public meetings? o Yes o No o Don’t know
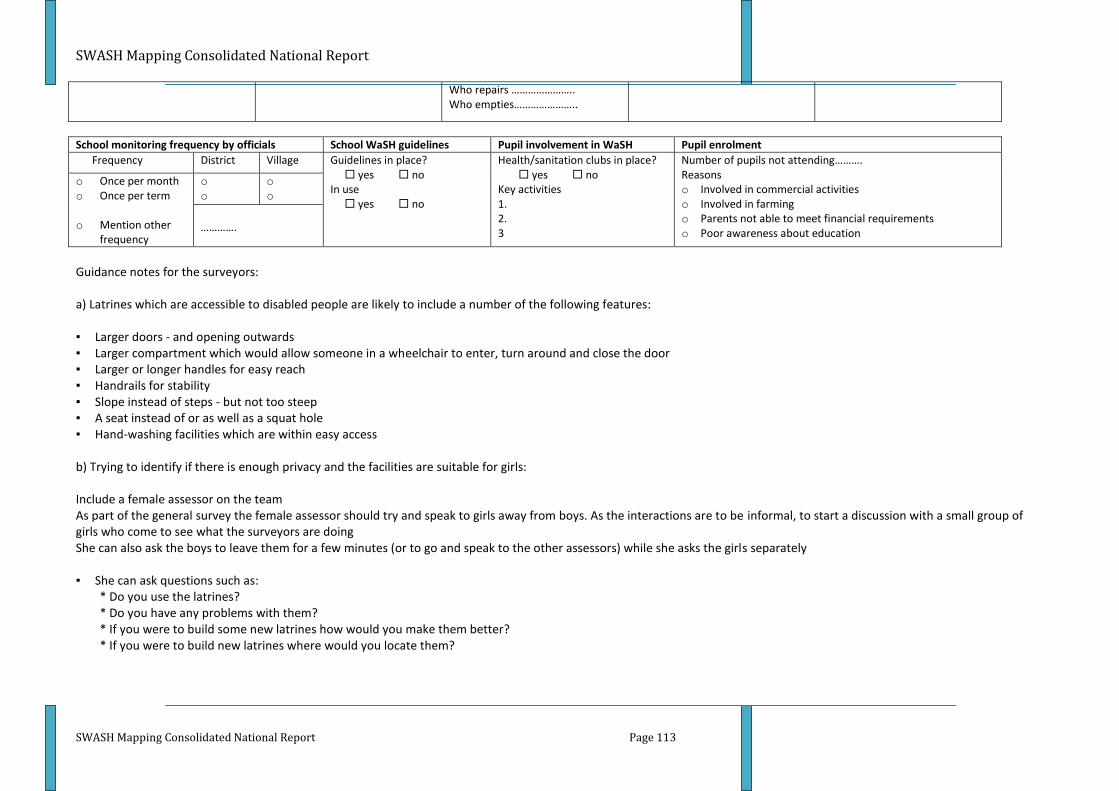
SWASH Mapping Consolidated National Report
SWASH Mapping Consolidated National Report Page 113
Who repairs ………………….. Who empties…………………..
School monitoring frequency by officials School WaSH guidelines Pupil involvement in WaSH Pupil enrolment
Frequency District Village Guidelines in place? yes no
In use yes no
Health/sanitation clubs in place? yes no
Key activities 1. 2. 3
Number of pupils not attending………. Reasons o Involved in commercial activities o Involved in farming o Parents not able to meet financial requirements o Poor awareness about education
o Once per month o Once per term o Mention other
frequency
o N o N
o N o
o ………….
Guidance notes for the surveyors: a) Latrines which are accessible to disabled people are likely to include a number of the following features: ▪ Larger doors - and opening outwards ▪ Larger compartment which would allow someone in a wheelchair to enter, turn around and close the door ▪ Larger or longer handles for easy reach ▪ Handrails for stability ▪ Slope instead of steps - but not too steep ▪ A seat instead of or as well as a squat hole ▪ Hand-washing facilities which are within easy access b) Trying to identify if there is enough privacy and the facilities are suitable for girls: Include a female assessor on the team As part of the general survey the female assessor should try and speak to girls away from boys. As the interactions are to be informal, to start a discussion with a small group of girls who come to see what the surveyors are doing She can also ask the boys to leave them for a few minutes (or to go and speak to the other assessors) while she asks the girls separately ▪ She can ask questions such as:
* Do you use the latrines? * Do you have any problems with them? * If you were to build some new latrines how would you make them better? * If you were to build new latrines where would you locate them?
SWASH Mapping Consolidated National Report
SWASH Mapping Consolidated National Report
Annex 4: Governance and validation exercise framework questionnaire
1. Financial issues
• What kind of funds/funding sources are available? • Who is in charge of financial management? • Is there a formal financial management system in place and shared?
2. Operation and maintenance of facilities
• Who designed the sanitation facilities? • Who is responsible for O&M, including cleaning, repair, emptying, rehabilitation and
replacement? • Who reports on O&M? • What are the major bottlenecks and how are these being addressed?
3. Participation/involvement
• What mechanism is in place and used to ensure participation/involvement of parents and students in School WASH issues?
• What does this participation entails? • How relevant is it?
4. Communication and relationship • What kind of communication structure and relationship has been established between the
school management and committee and the district? • How do they communicate, what is the effect of communication? • How responsive are the district authorities, e.g. is there a District back up support
mechanism in place? If so how does it functions and what is the kind of support offered?
5. Access to information • What kind of information is sought by communities (men and women, boys and girls)? • Do they have access to information on
o WASH aspects, o School budget allocation and actual use
• What kind of means do communities have to ensure the school children rights of access to WASH services and resources are upheld?
6. Open question
• What do the school management and community propose to improve the WASH situation? (Important to get an idea about what they think they can do themselves)

SWASH Mapping Consolidated National Report
SWASH Mapping Consolidated National Report
Annex 5: References
Tearfund (2008) Gender and sanitation: breaking taboos, improving lives The Republic of Tanzania (2006) Education & Training Sector Development Programme (ESDP), Primary Education Development Programme II (2007-2011)