swinburne university of technology faculty of … · swinburne university of technology faculty of...
TRANSCRIPT

Swinburne University of Technology
Faculty of Business and Enterprise
Doctor of Philosophy
An exploratory case study of internal service quality in a telecommunications organisation: a frontline employee perspective.
Kon Krios
Year of Submission: 2005

i
Abstract The following dissertation is an exploratory case study of a telecommunications organisation’s call
centres. Specifically, it was focused on investigating internal service quality issues that related to
the frontline employee role, a clearly underdeveloped area of study in services marketing literature.
The study involved firstly identifying the internal services delivered to frontline employees, and
then gaining their perceptions of the service quality dimensions most important to them within each
workplace situation. This in turn provided an indication of how internal services could be
customised and classified to best meet frontline employees’ work requirements and therefore
increase their job effectiveness. In addition, the case study explored frontline employees’ overall
perceptions of the quality of delivery of each internal service, which helped provide further insights
into their work needs. Frontline employees’ perceptions were also sought regarding the importance
of each internal service to them, in terms of increasing their ability to generate revenue for the
organisation. This provided an indication of how different internal services impacted upon their
exchanges with external customers.
Twelve internal services and seven internal service quality dimensions were identified through
conducting extensive observation and undertaking interviews with frontline employees at one of the
call centres. The information obtained helped inform a web-based online survey that was
implemented to address the three focal research questions. The online survey was successfully
completed by 301 frontline employees.
The results showed that while all twelve internal services shared some similarities in their demand
characteristics, some groups of internal services were distinctly different to others. As a result of
these similarities and differences, the internal services were classified into four categories: training-
intensive internal services; communication-based internal services; real-time-based internal
services; and, performance-related internal services.
While the four classification categories can provide a solid guide for internal suppliers about how to
approach groups of internal services, it was apparent that frontline employees had unique needs in
each of the twelve internal services. This emphasised the need for the classification scheme to be
used only as a guide, whereby internal suppliers should methodically identify all the quality
attributes most important to frontline employees in each individual internal service situation.
ii
The results also showed that frontline employees perceived some internal services as more
important than others, in terms of increasing their ability to generate revenue for the organisation.
As a result, it was suggested that internal services could also be classified according to their
“importance” levels, as this could help managers in their allocation of organisational resources.
The case study provided a valuable insight into frontline employees’ needs, and other internal
service quality issues related to their roles. Because the results and conclusions were specific to a
particular case, it is essential that this area of research be extended further in future.

iii
Acknowledgements The author would like to thank all people who have contributed to this thesis. In particular, he
would like to thank Professor Val Clulow for her invaluable support and guidance over the past
three years. He would also like to thank his family and friends for providing encouragement and
support when it was most needed. A special thank you must also go to Lori, who was always there
as a source of strength and love at the most difficult of times.

iv
Declaration This thesis contains no material which has been accepted for the award of any other degree or
diploma, except where due reference is made in the text of the thesis. To the best of my knowledge,
this thesis contains no material previously published or written by another person except where due
reference is made in the text of the thesis.
Kon Krios January 2005

v
Table of Contents Abstract……………………………………………………………………………………………i Acknowledgements…………………………………………………………………………….iii Declaration……………………………………………………………………………………….iv Table of Contents………………………………………………………………………………..v List of Figures and Tables……………………………………………………………….…viii Chapter 1 1.0 Introduction……………………………………………………………………………...1
1.1 Background to the Research……………………………………………………….1 1.1.1 The Australian Service Sector……………………………………………………..1 1.1.2 The Fastest Growing Service Industry – Communications.......………….…….3
1.1.3 The Focus on Frontline Employees……………………………………………….4
1.2 Aim of the Study…………………………………………..…………………….......5
1.3 Scope of the Study…………………………………………………………………..6
1.4 Rationale for the Study……………………………………………………………...6
1.5 Outline of Chapters………………………………………………………………….8
1.6 Summary……………………………………………………………………………...9
Chapter 2 2.0 Literature Review – Part A…………………………………………………………...10
2.1 The Service Revolution………………………………………………………........10
2.2 Services Marketing and Service Management……………………………….....11
2.3 Internal Marketing – The Early Years…………………………………………….15
2.4 Applying Marketing Techniques Internally……………………………………….16
2.5 Integrating Multiple Functions……………………………………………………..17
2.6 Change Management and Strategy Implementation……………………………18
2.7 Internal Marketing – A Multi-Faceted Concept…………………………………..21

vi
2.8 From Internal Marketing to Internal Service Quality…………………………....22
Chapter 3 3.0 Literature Review – Part B…………………………………………………………...24
3.1 The Importance of Frontline Employees…………………………………………24
3.2 Backstage Support……………………………………………………………….....27
3.3 External Service Quality……………………………………………………………30
3.4 Internal Service Quality…………………………………………………………….36
3.5 Summary and Research Questions………………………………………………42 Chapter 4 4.0 Methodology……………………………………………………………………………45
4.1 Research Plan………………………………………………………………………45 4.1.1 Why this Research Plan and Approach?.……………………………………....46
4.2 Justification of Methodology………………………………………………………48
4.2.1 The Case Study Strategy…………………………………………………………48
4.2.2 A Single-Case Design…………………………………………………………….49
4.2.3 Why a Telco Call Centre?..............................................................................49
4.3 The Sampling Process…………………………………………………………….50
4.3.1 Phase 1 – Identification of Internal Services & Service Quality Dimensions..51
4.3.2 Phase 2 – The Online Survey……………………………………………………52
4.4 Data Collection Methods…………………………………………………………..52
4.4.1 A Multi-Method Approach………………………………………………………...52
4.4.2 Phase 1 – Observation……………………………………………………………53
4.4.3 Phase 1 – Pre-Survey Interviews………………………………………………..55
4.4.4 Phase 2 – Developing the Survey……………………………………………….56
4.5 Phase 3 – Data Analysis…………………………………………………………..64
4.5.1 Observational Notes and Interview Transcripts………………........................64 4.5.2 Online Survey Data………………………………………………………….........66

vii
4.6 Ethical Considerations…………………………………………………………….67
4.7 Summary……………………………………………………………………………67
Chapter 5 5.0 Presentation of Results……………………………………………………………...69
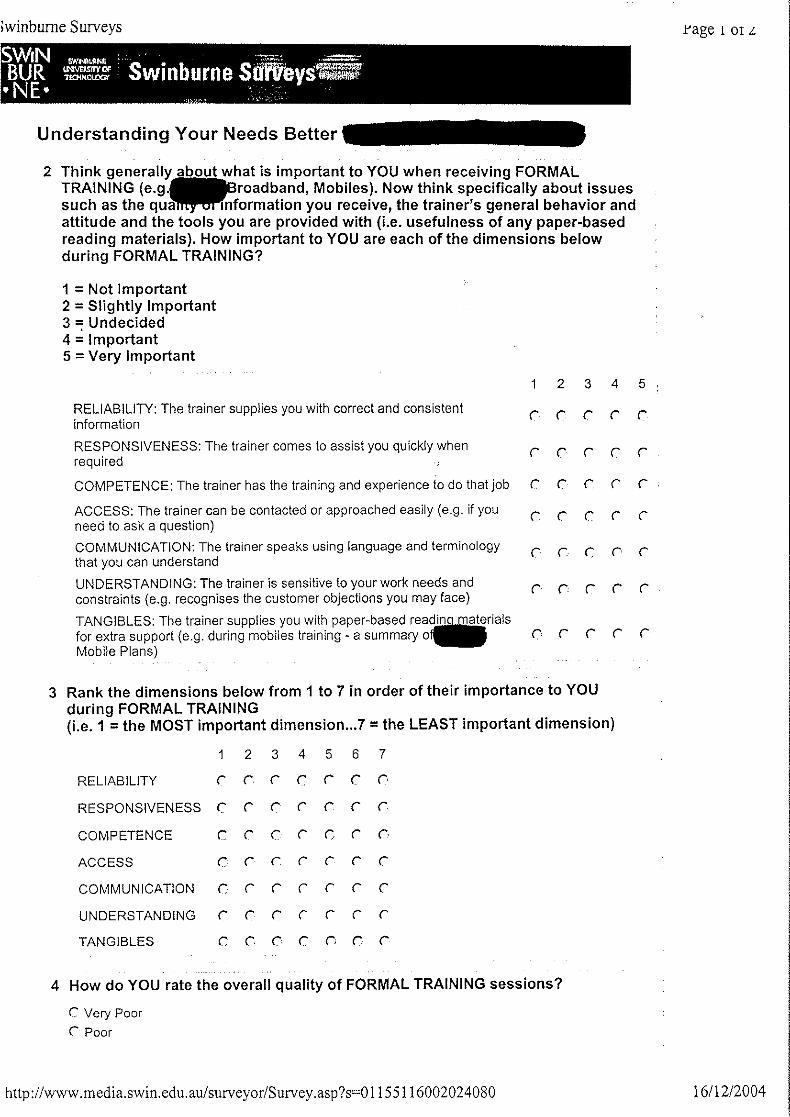
5.1 Formal Training…………………………………………………………………….72
5.2 Online Training…………………………………………………………………….84
5.3 Customer On Hold…………………………………………………………………96
5.4 Team Briefs……………………………………………………………………….108
5.5 Emails……………………………………………………………………………...119
5.6 Management Presentations……………………………………………………..132
5.7 Intranet……………………………………………………………………….........144
5.8 Systems Support………………………………………………………………….156
5.9 Computer Programs………………………………………………………….......167
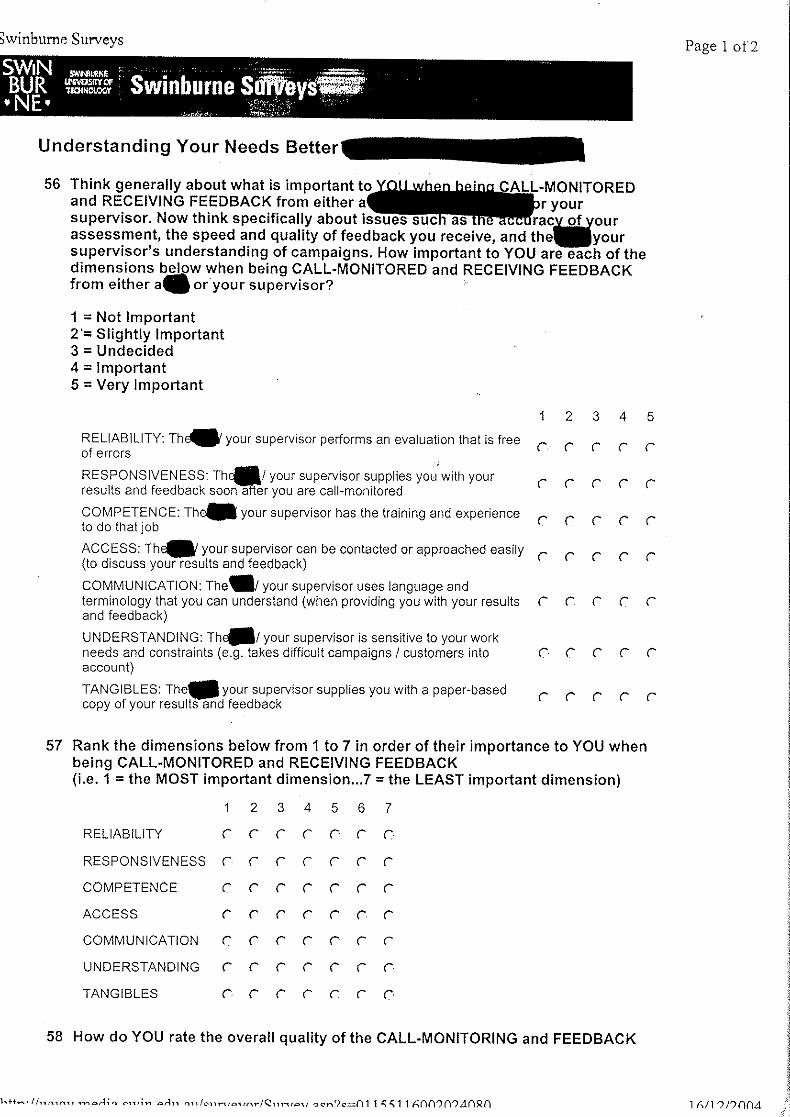
5.10 Call Monitoring and Feedback…………………………………………………..179
5.11 Rewards……………………………………………………………………………190
5.12 Performance Feedback…………………………………………………………..202
5.13 Internal Service Summaries…………………………………………………......213
5.14 Chapter Summary…………………………………………………………………218 Chapter 6 6.0 Discussion of Results……………………………………………………………….225
6.1 Classifying and Adapting Internal Services…………………………………….227
6.2 Internal Services and the Bottom Line………………………………………….232
6.3 Researching the Internal Environment………………………………………….234
6.4 Managerial Implications…………………………………………………………..235
6.5 Key Contributions to Theory……………………………………………………..240
6.6 Further Research…………………………………………………………………243

viii
Chapter 7 7.0 Conclusions and Limitations……………………………………………………....245
7.1 Conclusion…………………………………………………………………………245
7.2 Limitations………………………………………………………………………….248 References……………………………………………………………………………………..250 Appendix 1: Sample Survey
Figure 2.2.1 The Service Management Trinity………………………………………………...14 Figure 3.1.1 The Upside-Down Pyramid………………………………………………………..25 Figure 3.2.1 The Front and Backstage of Services……………………………………………28 Figure 3.3.1 Model of Perceived Service Quality………………………………………………31 Table 3.3.1 The Five Dimensions of Service Quality…………………………………………33 Figure 3.4.1 Process Management at IBM……………………………………………………..36 Table 3.4.1 Gaps within the Internal Environment………………………………....………...38 Table 3.4.2 Comparison of Internal/External Quality Dimensions……………………….....39 Figure 4.1.1 Research Plan……………………………………………………………………...47 Figure 4.5.1 Study Framework – Methodology Stage………………………………………...67 Figure 5.0.1 Study Framework – Presentation of Results Stage…………………………....71 Figure 5.1.1 Formal Training – Importance of Individual Service Quality Dimensions…….72 Figure 5.1.2 Formal Training – Ranked Dimensions (1st, 2nd)………………………………..73 Figure 5.1.3 Formal Training – Participants’ Ratings and Rankings of Service Quality
Dimensions (Means)……………………………………………………………….74 Figure 5.1.4 Formal Training – Service Quality Ratings………………………………………76 Figure 5.1.5 Formal Training and Revenue…………………………………………………….82
List of Figures and Tables
ix
Table 5.1.1 Internal Service Summary – Formal Training……………………………………82 Figure 5.2.1 Online Training – Importance of Individual Service Quality Dimensions……..84 Figure 5.2.2 Online Training – Ranked Dimensions (1st, 2nd)………………………………...85 Figure 5.2.3 Online Training – Participants’ Ratings and Rankings of Service Quality
Dimensions (Means)………………………………………………………………..86 Figure 5.2.4 Online Training – Service Quality Ratings……………………………………….88 Figure 5.2.5 Online Training and Revenue……………………………………………………..94 Table 5.2.1 Internal Service Summary – Online Training……………………………………95 Figure 5.3.1 Customer on Hold – Importance of Individual Service Quality Dimensions….96 Figure 5.3.2 Customer on Hold – Ranked Dimensions (1st, 2nd)……………………………..97 Figure 5.3.3 Customer on Hold – Participants’ Ratings and Rankings of Service Quality
Dimensions (Means)………………………………………………………………..98 Figure 5.3.4 Customer on Hold – Service Quality Ratings…………………………………..100 Figure 5.3.5 Customer on Hold and Revenue…………………………………………………106 Table 5.3.1 Internal Service Summary – Customer on Hold………………………….........107 Figure 5.4.1 Team Briefs – Importance of Individual Service Quality Dimensions………..108 Figure 5.4.2 Team Briefs – Ranked Dimensions (1st, 2nd)……………………………………109 Figure 5.4.3 Team Briefs – Participants’ Ratings and Rankings of Service Quality
Dimensions (Means)………………………………………………………………110 Figure 5.4.4 Team Briefs – Service Quality Ratings………………………………………….112 Figure 5.4.5 Team Briefs and Revenue………………………………………………………..117 Table 5.4.1 Internal Service Summary – Team Briefs………………………………………118 Figure 5.5.1 Emails – Importance of Individual Service Quality Dimensions………………119 Figure 5.5.2 Emails – Ranked Dimensions (1st, 2nd)………………………………………….120 Figure 5.5.3 Emails – Participants’ Ratings and Rankings of Service Quality Dimensions
(Means)……………………………………………………………………………..121 Figure 5.5.4 Emails – Service Quality Ratings…………………………………………..........123 Figure 5.5.5 Emails and Revenue………………………………………………………………130

x
Table 5.5.1 Internal Service Summary – Emails……………………………………………...131 Figure 5.6.1 Management Presentations – Importance of Individual Service Quality
Dimensions………………………………………………………………………….132 Figure 5.6.2 Management Presentations – Ranked Dimensions (1st, 2nd)………………….133 Figure 5.6.3 Management Presentations – Participants’ Ratings and Rankings of Service
Quality Dimensions (Means)……………………………………………………...134 Figure 5.6.4 Management Presentations – Service Quality Ratings………………………..136 Figure 5.6.5 Management Presentations and Revenue……………………………………...142 Table 5.6.1 Internal Service Summary – Management Presentations……………………..143 Figure 5.7.1 Intranet – Importance of Individual Service Quality Dimensions……………...144 Figure 5.7.2 Intranet – Ranked Dimensions (1st, 2nd)…………………………………………145 Figure 5.7.3 Intranet – Participants’ Ratings and Rankings of Service Quality Dimensions
(Means)……………………………………………………………………………...146 Figure 5.7.4 Intranet – Service Quality Ratings………………………………………………..148 Figure 5.7.5 The Intranet and Revenue………………………………………………………...154 Table 5.7.1 Internal Service Summary – The Intranet……………………………………….155 Figure 5.8.1 Systems Support – Importance of Individual Service Quality Dimensions…..156 Figure 5.8.2 Systems Support – Ranked Dimensions (1st, 2nd)………………………………157 Figure 5.8.3 Systems Support – Participants’ Ratings and Rankings of Service Quality
Dimensions (Means)……………………………………………………………….158 Figure 5.8.4 Systems Support – Service Quality Ratings…………………………………….160 Figure 5.8.5 Systems Support and Revenue…………………………………………………..165 Table 5.8.1 Internal Service Summary – Systems Support………………………………….166 Figure 5.9.1 Computer Programs – Importance of Individual Service Quality Dimensions.167 Figure 5.9.2 Computer Programs – Ranked Dimensions (1st, 2nd)…………………………..168 Figure 5.9.3 Computer Programs – Participants’ Ratings and Rankings of Service Quality
Dimensions (Means)……………………………………………………………….169 Figure 5.9.4 Computer Programs – Service Quality Ratings…………………………………171 Figure 5.9.5 Computer Programs and Revenue……………………………………………….177

xi
Table 5.9.1 Internal Service Summary – Computer Programs……………………………...178 Figure 5.10.1 Call Monitoring and Feedback – Importance of Individual Service Quality
Dimensions………………………………………………………………………….179 Figure 5.10.2 Call Monitoring and Feedback – Ranked Dimensions (1st, 2nd)……………….180 Figure 5.10.3 Call Monitoring and Feedback – Participants’ Ratings and Rankings of Service
Quality Dimensions (Means)………………………………………………………181 Figure 5.10.4 Call Monitoring and Feedback – Service Quality Ratings……………………..183 Figure 5.10.5 Call Monitoring and Feedback and Revenue……………………………………189 Table 5.10.1 Internal Service Summary – Call Monitoring and Feedback…………………..189 Figure 5.11.1 Rewards – Importance of Individual Service Quality Dimensions…………….190 Figure 5.11.2 Rewards – Ranked Dimensions (1st, 2nd)………………………………………..191 Figure 5.11.3 Rewards – Participants’ Ratings and Rankings of Service Quality Dimensions
(Means)……………………………………………………………………………...192 Figure 5.11.4 Rewards – Service Quality Ratings………………………………………………194 Figure 5.11.5 Rewards and Revenue…………………………………………………………….200 Table 5.11.1 Internal Service Summary – Rewards…………………………………………...201 Figure 5.12.1 Performance Feedback – Importance of Individual Service Quality
Dimensions.....................................................................................................202 Figure 5.12.2 Performance Feedback – Ranked Dimensions (1st, 2nd)………………………203 Figure 5.12.3 Performance Feedback – Participants’ Ratings and Rankings of Service Quality
Dimensions (Means)……………………………………………………………….204 Figure 5.12.4 Performance Feedback – Service Quality Ratings……………………………..206 Figure 5.12.5 Performance Feedback and Revenue…………………………………………...211 Table 5.12.1 Internal Service Summary – Performance Feedback………………………….212 Table 5.13.1 Formal Training Summary………………………………………………………...213 Table 5.13.2 Online Training Summary…………………………………………………………213 Table 5.13.3 Customer on Hold Summary……………………………………………………...214 Table 5.13.4 Team Briefs Summary……………………………………………………………..214 Table 5.13.5 Emails Summary……………………………………………………………………214

xii
Table 5.13.6 Management Presentations Summary…………………………………………..215 Table 5.13.7 The Intranet Summary……………………………………………………………..215 Table 5.13.8 Systems Support Summary……………………………………………………….215 Table 5.13.9 Computer Programs Summary……………………………………………………216 Table 5.13.10 Call Monitoring and Feedback Summary………………………………………..216 Table 5.13.11 Rewards Summary…………………………………………………………………216 Table 5.13.12 Performance Feedback Summary………………………………………………..217 Figure 6.0.1 Study Framework – Discussion of Results Stage………………………………226 Figure 6.1.1 Internal Service Categories and Additional Themes…………………………...231 Table 6.5.1 Internal Service Quality and Frontline Employees……………………………...242

Chapter
1
1
1.0 Introduction In recent years there has been a shift in emphasis in the study of service provision, from the external
customer of the organisation towards the internal customer. This study builds on that research and is
focused on the quality of internal services provided to frontline employees. This underdeveloped
area of study represents a new opportunity for service organisations operating in highly competitive
and often technologically sophisticated markets to gain an understanding of further ways to extract
any potential advantage over their rivals.
For the purposes of this study the following definition of “frontline employees” will be used
throughout:
“[Frontline employees are] the individuals employed by a service business who are in direct contact
with the client; for example, the personnel at the reception desk of a hotel, bank tellers, air flight
hostesses, etc.” (Eiglier, Langeard, Lovelock, Bateson and Young, 1977, p. 91)
Before this is discussed in more detail, an overview of the Australian service sector is provided to
establish the context in which the study has been undertaken, and to situate the contribution of the
new research.
1.1 Background to the Research 1.1.1 The Australian Service Sector Over the past four decades the service sector has become an increasingly important element in the
Australian economy. During this period, the portion of GDP accounted for by services has risen by
17%, from 59% to 76% in 2001 (www.abs.gov.au). In that time, the service sector has increased its
share of employment by 20%, meaning that the service sector now employs about 82%, or over four
out of every five Australian workers (www.pc.gov.au). The Australian Service Sector Review 2000
– conducted by the Department of Industry, Science and Resources and the Australian Service
Network – reported that the relative importance of the service sector is set to increase as Australia
becomes more reliant upon knowledge-based industry, rather than manufacturing-based industry.

2
Much of this change is due to the rapid uptake of technologies such as the internet and e-commerce,
which has changed the way modern day businesses deal with their customers and operate in general.
The emergence of the internet and e-commerce has driven Australian service organisations across a
wide range of industries to re-engineer their services. Increased competition has forced them to
pursue the most efficient and cost effective method of service delivery, which in the majority of
cases is through electronic means. The banking industry is a prime example of this, where the costs
of electronic and internet transactions represent a fraction of those associated with traditional
branch banking. Electronic service delivery has also allowed service organisations in general to
more easily expand their markets and achieve greater economies of scale, as practices such as
online ordering reduce the need for physical marketing and distribution services in foreign markets.
Many Australian service organisations have already capitalized on the opportunity to make inroads
in overseas markets, which has had a considerable impact on the country’s service exports, with
growth between 1985 and 2001 reported to be 8.3% per annum (McLachlan, Clark and Monday,
2002).
The past ten to fifteen years has therefore seen Australia experience strong growth in the export of
services. In fact, growth statistics show that Australia’s pattern of exports has somewhat shifted
away from agriculture and mining, and towards manufacturing and in particular services. This is
exemplified by the fact that Australia had a surplus on services trade for the first time in 1996-97
(Department of Industry, Science and Resources and the Australian Service Network, 2000). In
2000-01 the Australian service sector’s largest portion of export income came from travel services,
which included business, education and tourism-related travel services, representing approximately
10% of total service exports (McLachlan, Clark and Monday, 2002).
A research paper conducted by the Australian Productivity Commission (2002) revealed a number
of key findings about the Australian services sector. Firstly, it showed that the largest service
industry, in terms of output, is property and business services, while the smallest is cultural and
recreational services. In 2000-01, the former accounted for about 14% of the economy’s output,
while the latter only accounted for about 2% (McLachlan, Clark and Monday, 2002).
The paper also explained that the largest service employer, which is also the economy’s biggest
employer, is retail trade. In 2000-01 retail traders accounted for 1.3 million or 15% of all jobs in
the economy. Other prominent employers within the service sector in Australia include property
and business services (12%), health and community services (10%) and construction services (8%).

3
At the other end of the scale, electricity, gas and water represented the smallest service employer,
providing jobs for less than 1% of Australian workers.
In addition, the Australian Productivity Commission (2002) noted that the fastest growing service
industry, in terms of output, was communications. Since the mid-1970’s the communications
industry has grown about 8% per annum on average. In contrast, the construction industry has
experienced the slowest growth within the Australian service sector, of 2.2% per annum. The
communications industry in Australia is the category reported by the Australian Bureau of Statistics
to include industries such as telecommunications, postal and courier services.
1.1.2 The Fastest Growing Service Industry - Communications The rapid growth within the Australian communications industry can be attributed to a number of
factors. While postal and courier services have both continued to expand steadily, deregulation
within telecommunications has seen that market grow significantly in recent years. Since the 1st of
July 1997 – the date on which ground-breaking telecommunications legislation entered into
operation – Australian has had a fully open and highly competitive telecommunications market,
where the number and range of players has increased dramatically. In fact, by the 30th of June 2002
there were 100 licenses issued in Australia for carriers of telecommunications services
(www.abs.gov.au). In 2003 the telecommunications industry grew by over 6%, and in 2004 a
similar trend has been predicted (www.mindbranch.com). This means that the total
telecommunications market in Australia is set to grow from AUD$38,090 million in 2003 to around
AUD$40,040 million in 2004 (www.mindbranch.com).
Telecommunications deregulation has not only been successful in increasing competition and
enhancing growth within the communications industry, but it has also helped provide consumers
with greater product choice. Consumers can freely choose their preferred carrier for basic telephony
services, mobile phone services, internet services, and more recently entertainment services such as
pay TV. The intense battle for customers has seen many telecommunications organisations devise
marketing strategies that encourage consumers to adopt multiple products with them by offering
discounts for doing so. For example, in October 2004 a prominent market player announced that it
would give three months of free broadband internet to any customer that had either a mobile or
fixed phone with them (www.aap.com.au).
With such a competitive environment, the products offered by many telecommunications
organisations are therefore heavily focused on maintaining customer loyalty and acquiring new

4
customers, as opposed to generating large profit margins. Organisations have been slow to
acknowledge that keeping existing customers loyal and promoting positive word of mouth to attract
new customers needs to be based on strategies that are sustainable, and that strong performance
cannot be achieved with short-term product offerings alone. The people responsible for directly
promoting and selling these product offerings to customers – frontline employees – have begun to
receive greater attention and to be recognised for their value in building customer relationships as
well as for making sales. Telecommunications organisations have come to realize that they all
supply similar products at similar prices, and their ability to differentiate themselves from their
rivals largely lies in the quality of service they deliver to customers through their frontline
employees. The acknowledgement of frontline employees as vital competitive tools means that it is
more important than ever for telecommunications organisations to thoroughly understand and meet
their job needs, something that may not have been such a high priority before deregulation.
1.1.3 The Focus on Frontline Employees Appreciation of the importance of the frontline employee role represents a considerable shift in
focus for service organisations. Previously, their primary concern was for the customer, where the
prevailing wisdom was that competitive advantage would be achieved by allocating resources
towards external service quality. Now service organisations are conscious of the need to also
allocate resources internally to improve service quality capability needed to satisfy customers and
surpass competitor offerings. Such strategies require evaluative approaches to services and
investment in internal service provision aimed at better equipping the staff that most directly serve
customers – frontline employees.
The need to support frontline employees through a series of needs-satisfying internal services was
the major thrust behind much of the internal marketing studies that emerged throughout the late
1980s and beyond. Much of the theoretical foundation on which this area of study was developed
was derived from the conceptual frameworks previously applied in external service quality studies.
In particular, many recent studies on internal service quality were centred on adaptations of the
external service quality dimensions and gap model originally developed by Parasuraman, Zeithaml
and Berry (1985). Frost and Kumar’s (2001) “INTSERVQUAL” model is a prime example of this.
Their study further reinforced the parallels that exist between the needs of internal and external
customers, and highlighted the importance of first satisfying the requirements of frontline
employees to maximize the potential for achieving the same results for external customers.

5
1.2 Aim of the Study The overall importance of the service sector to the Australian economy, coupled with the rapid
growth within the telecommunications industry specifically, were strong contributing factors in
formulating the aims of this study. A review of services marketing literature reaffirmed the critical
importance of frontline employees in highly competitive markets, with many authors emphasizing
the need to better understand the complex dynamics associated with their roles. A case study
approach to investigate a range of issues related to internal services and frontline employees was
developed with the following broad aims:
1. Identify the different internal services delivered to frontline employees in an Australian
telecommunications organisation.
2. Identify the attributes frontline employees perceive as most important in being delivered
different internal services.
3. Explore frontline employees’ perceptions of the importance of different internal services, in
terms of increasing their ability to generate revenue for the organisation.
4. Explore frontline employees’ overall perceptions of the quality of delivery of different
internal services.
In order to pursue these aims, three focal research questions were developed and explored:
Research Question 1: How do frontline employees perceive the importance of internal service
quality dimensions within each of the internal services identified?
Research Question 2: How do frontline employees perceive the overall quality of delivery of each
of the internal services identified?
Research Question 3: How do frontline employees perceive the importance of each of the internal
services identified, in terms of increasing their ability to generate revenue for the organisation?

6
1.3 Scope of the Study The scope of the study is case-based within a large telecommunications organisation, and is focused
on internal service provision to frontline employees. It provides an in-depth perspective of the key
internal service quality issues relevant to the provision of a range of internal services to frontline
employees, exclusively from their point of view. In addition, the case study offers frontline
employees’ perceptions of how internal service provision impacts upon their job effectiveness in
dealing with external customers. Through these extensive insights, implications for the
organisation’s overall operations emerge, and in particular how managers and internal suppliers
should approach internal service delivery issues that relate to the frontline employee role.
This case study was designed to be reported exclusively from a frontline employee perspective for
two main reasons. Firstly, the researcher intended to generate comparisons between frontline
employees’ responses about different internal services, rather than a study in which comparisons
could be made between frontline employees and say management perceptions, which has been a
more common approach in the past. Secondly, by focusing solely on gaining frontline employees’
insights, the researcher was able to ensure all key matters of enquiry were explored thoroughly so
that the aims of the study would be achieved in full.
The study’s research questions were developed and subsequently discussed from a services
marketing perspective. Specifically, the concepts and themes explored came from the internal
marketing arm of the literature that particularly focused on internal service quality issues.
1.4 Rationale for the Study While a considerable body of literature has evolved in the area of external service quality
(Grönroos, 1983, 1988; Parasuraman, Zeithaml and Berry, 1985, 1988; Brogowicz, Delene and
Blyth, 1990) the rate of research into internal service quality literature, especially with a focus on
the frontline employee role, has been relatively sparse. With the Australian service sector growing
at a rapid rate, it is imperative that service organisations uncover new ways to maximize the quality
of service delivered to external customers in order to gain a competitive advantage. By thoroughly
understanding frontline employees’ work needs, service organisations can better ensure that those
employees that directly service customers have the necessary tools to capitalize on sales and service
opportunities. In addition, by being aware of the importance of specific internal services vis-à-vis
helping frontline employees to generate revenue, managers can prioritise action and allocate
organisational resources in a more prudent manner.

7
Authors such as Albrecht (1988) and Schlesinger and Heskett (1991) vigorously promoted the
importance of the frontline employee role, however very few studies to date have focused on
exploring their needs and overall perceptions of key internal service quality issues. This is despite a
growing body of internal marketing literature, which has become increasingly more sophisticated
and bolder in its position endorsing the inherent relationship between a service organisation’s
internal and external environments. Frost and Kumar (2001) were among the authors that provided
an example of the benefits of examining internal service quality in the context of the frontline
employee role. Their study provided a snapshot into the service quality gaps that existed for
frontline employees working for an international airline, and highlighted the dimensions that
influenced their overall perceptions of internal service quality the most.
While Frost and Kumar’s study generated some much needed insights into frontline employees’
generic needs, Reynoso and Moores (1995) recommended that researchers go a step further. They
suggested that researchers investigate sets of internal service quality dimensions that are not only
generically important, but also peculiar to particular situations. This was in light of an emerging
strand of thought that indicated that some internal services needed to be adapted and tailored to fit
particular internal customer needs (Davis, 1993). Stauss (1995) was of a similar belief, stating that it
was essential to identify different internal services, as each one varied with respect to its supply and
demand characteristics. No studies were found that defined the different internal services delivered
to frontline employees, or that explored how their needs with respect to different internal services
varied. To date, most authors have defined the internal services delivered to frontline employees in
a very broad manner, generally referring to them as “backstage support” (e.g. Grönroos and
Gummesson, 1986), with no notable attempts to create a detailed classification scheme.
It is clear that literature based on studies that relate internal service quality and frontline employees,
is virtually non-existent. Research is not only lacking regarding their work needs in general, but
also concerning the degree to which these needs vary between different workplace situations. Even
the different internal services they typically encounter are not sufficiently well documented. Studies
regarding frontline employees’ perceptions on other issues, such as the relationship between
internal service provision and their effectiveness in dealing with customers and generating revenue
are also scarce. Such insights are invaluable in further legitimizing the internal marketing
philosophy in general, but also encouraging service organisations to practice internal marketing
with greater care, something that they have been reluctant to do in the past (Sargeant and Asif,

8
1998). Above all, research in this area is essential if service organisations operating in highly
competitive markets are to find new ways to compete with their rivals.
1.5 Outline of Chapters The thesis comprises of seven chapters, which have been outlined and briefly described below.
Chapter one provides a context for the study and details the type of research that was undertaken.
Chapter two provides a comprehensive review of the relevant literature, discussing the evolution of
services marketing and the emergence of branches of learning such as service management. This is
followed by an analysis of early internal marketing literature. The chapter concludes by delineating
the multifaceted nature of the internal marketing concept.
Chapter three continues the review of internal marketing literature, with a specific focus on the
importance of frontline employees. It then proceeds to discuss the importance of them receiving
backstage support from internal suppliers, before providing a background into external service
quality literature. This was necessary before reviewing internal service quality literature, as much of
the theory in that area stemmed from external service quality studies. Research questions were then
presented to reflect the key internal service quality issues that related to the frontline employee role.
Chapter four provides an in-depth description of the research methods undertaken to answer the
study’s research questions. It also provides justification for pursuing a case study strategy, a profile
of the respondents, and discusses some of the ethical considerations that emerged.
Chapter five presents the major findings of the study. The results are presented using the study’s
research questions as a framework, and are then summarised at the conclusion of the chapter.
Chapter six discusses the key results of the study by relating the results back to the literature review.
It outlines the theoretical contributions to academic knowledge as well as providing a number of
managerial implications. It concludes with recommendations for further research.
Chapter seven outlines the major conclusions of the study. It summarizes the theoretical context of
the research, the major findings and the key contributions to academic knowledge. The chapter
concludes with a description of the limitations encountered while completing the study.

9
1.6 Summary This chapter provided an overview of the study by detailing the background to the research, the
aims and research questions, as well as the scope of the study. It also outlined the rationale for the
study and the structure of the thesis. The next chapter provides a review of the literature, showing
how services marketing evolved and then tracing the development of internal marketing theory.
Chapter
2
10
2.0 Literature Review – Part A The literature review will be discussed over two chapters. This chapter traces the evolution of
services marketing and service management literature, showing how internal marketing came to
emerge and develop into a multifaceted concept. Chapter 3 (Part B) reviews the internal marketing
literature focused on the frontline employee role, before investigating the specific area of internal
service quality. This then leads onto a summary of key themes and the development of research
questions.
2.1 The Service Revolution Bartels has written texts (1962, 1988) focusing on the rich history of the marketing discipline. He
has made specific note of the fact that early marketing literature neglected the marketing of
services, and rather emphasised the importance of marketing physical goods. The following quote
by Converse (1921) clearly corroborates that point:
“Still the main function of business is to market goods. Accounting, banking, insurance, and
transportation are only aids, very important aids it is true, to the production and marketing of
goods” (p. vi).
Such an approach towards marketing thinking was pervasive and seemed to undermine the
relevance of services to market economies. Through an extensive review of general services
marketing literature, Fisk, Brown and Bitner (1993) found that even up until the 1950’s and 1960’s
services marketing was mostly studied only through dissertation research. At this point there was
not only little acknowledgement of services marketing, but more surprisingly no understanding of
the distinction between physical goods and services. Johnson (1969) was the author of a dissertation
titled “Are goods and services different?” His study was largely responsible for sparking the goods
verus services debate that followed (Fisk, Brown and Bitner, 1993).
Only after the American Marketing Association (1960) offered a definition of services did services
articles begin to appear in mainstream marketing journals. These articles sought to challenge the
Association’s service definition, which delineated services as:
“Activities, benefits or satisfactions which are offered for sale, or are provided in connection
with the sale of goods. Examples are amusements, hotel service, electric service, transportation,

11
the services of barber shops and beauty shops, repair and maintenance service, the work of
credit rating bureaus. This list is merely illustrative and no attempt has been made to make it
complete. The term also applies to various activities such as credit extension, advice and help of
sales people, delivery, by which the seller serves the convenience of his customers.” (p. 21).
Regan (1963) advocated this definition, although his main concern was not to debate the definition,
but to highlight the proliferation of services that was occurring in the United States. Judd (1964)
was one of the first authors to make a case for redefining services. He was critical of the services
definition that had been offered due to it being merely illustrative, incomplete and too dependent on
listed examples. As a result, Rathmell (1966) comprehensively detailed the marketing
characteristics of services, a task he saw as crucial in light of the United State’s rapidly growing
services sector. The characteristics he described are still used today throughout many services
marketing journals and textbooks (Fisk, Brown and Bitner, 1993). Authors have generally agreed
upon the fact that a service consists of the following characteristics: intangibility, inseparability,
perishability and heterogeneity. These early articles went a long way towards helping people
understand the multifaceted nature of marketing, and thus helped eradicate the “marketing myopia”
described by Levitt (1960).
2.2 Services Marketing and Service Management Blois (1974) released a pioneering article that addressed two main services issues. First, it offered
an amended American Marketing Association (1960) service definition, followed by an approach
towards the marketing of services. Buyer behaviour theory was the driving force behind Blois’
services marketing approach. He also acknowledged that services marketing literature was vastly
out numbered by studies concerned with products. The argument for using alternative approaches to
market services was bolstered by Donnelly (1976), who claimed that the marketing channels used
for goods varied considerably from the distribution channels for services. George (1977) followed
suit by claiming that services marketing was made unique by the intangibility characteristic of a
service.
Shostack’s (1977) provocative article called for services marketing to separate itself from the
marketing of goods. In doing so, she labelled services marketing an “uncharted frontier” and hence
posed the question, “could marketing itself be myopic in having failed to create relevant paradigms
for the service sector?” (p. 73). The American Marketing Association’s conference on marketing
theory in 1979 provided a platform for Lovelock (1979) to elevate such a stance. He argued that
marketing theory needed to increase its scope to account for services marketing. Similarly, Bateson
12
(1979) strongly encouraged the introduction of new services marketing concepts. This call was
answered when Berry (1980) wrote a seminal article describing how services marketing differed
fundamentally from goods marketing in terms of intangibility. He stated that effective services
marketing was largely dependent upon the performance of customer service employees, who can
customise service to best serve the individual needs of customers.
Levitt (1981) subtly implied that very few pure goods or services existed when he asserted that all
goods and services contained a degree of intangibility. He argued that in order for organisations to
design sound marketing strategies they must seek to understand the degree of intangibility in their
goods and services. Lovelock (1983) also addressed services marketing strategy when he proposed
five schemes for classifying services into like categories. Lovelock was able to demonstrate how the
nature of a service might affect the way it is marketed. Hunt (1976) was of the belief that service
identification and classification were prerequisites to marketing analysis.
By this time no clear attempt had been made to define services marketing, whereas the major
difference between goods and services was becoming assumed (Fisk, Brown and Bitner, 1993).
Even today there “is [still] no general agreement regarding what services marketing encompasses”
(Stanton, Miller and Layton, 1994, p. 7). Consequently, only one services marketing definition
could be found and cited in this review. Palmer (1998) defined services marketing as:
“Marketing activity which is focused on providing an identifiable service, rather than the
generality of marketing decisions for tangible products of which service is just an element” (p.
3).
Services marketing’s rapid evolution throughout the 1980’s was accompanied by the growth of a
branch of learning known as Service Management. Service management literature recognised and
endorsed the essential concepts of services marketing while exhibiting one distinct difference.
Services marketing literature tended to perceive a marketing department as a unilateral force within
an organisation, whereas service management strongly promoted the notion of departmental
interdependence and cooperation within a service organisation. Gummesson (1994) succinctly
articulated this point when he stated that service management had achieved reconceptulisation by
“services marketing being embedded in the whole management process” (p. 93). Early works by
Norman (1984) and Carlzon (1987) strongly advocated that approach. This service management
philosophy was especially well encapsulated within the following definition:

13
“Service management is a total organisational approach that makes quality of service, as
perceived by the customer, the number one driving force for the operations of the business”
(Albrecht, 1988, p. 20).
The promotion of a “total organisational approach” as a way of fulfilling the needs and wants of
customers is clearly the centrepiece of Albrecht’s definition. The service management definition
offered by Grönroos (1990) adopts a similar stance, appearing to expand upon the key issues
(customers, service quality, the organisation and operations) previously outlined by Albrecht.
Grönroos emphasised the need for service organisations to provide ongoing benefits or “utility” to
customers, while recognising that this was only possible when a cohesive, well-structured internal
organisational environment existed. He wrote, “Service management is:
1. To understand the utility customers receive by consuming or using the offerings of the
organisation and how services alone or together with physical goods or other kinds of
tangibles contribute to this utility, that is, to understand how total quality is perceived in
customer relationships, and how it changes over time;
2. To understand how the organisation (personnel, technology and physical resources, systems
and customers) will be able to produce and deliver this utility and quality;
3. To understand how the organisation should be developed and managed so that the intended
utility or quality is achieved; and
4. To make the organisation function so that this utility or quality is achieved and the
objectives or the parties involved (the organisation, the customers, other parties, the society
etc.) are met” (Grönroos, 1990, p. 117).
This definition encompasses the concept of services as a total organisational concern, services as
interactions between people, services as variable and therefore capable of being a differentiating
factor, and services as a strategic weapon. While such definitions provide a literary insight into
what constitutes service management, one could argue that Lovelock’s (1992a) Service
Management Trinity diagram represents the elements and their interrelationship most clearly:

14
Figure 2.2.1 The Service Management Trinity Adapted from: Lovelock C. H., (1992a), ‘A basic toolkit for service managers’, in Lovelock, C. H.,
(ed.), Managing Services- Marketing, Operations and Human Resources, New Jersey, Prentice-
Hall, p. 18.
It is evident that Lovelock (1992a) saw the activities of three departments – Operations, Human
Resources and Marketing – as most important to an organisation’s overall success. His diagram
shows that the three functions must operate in conjunction and consideration of one another in order
to best serve needs and wants of customers, while simultaneously allowing for marketing strategies
to be effectively planned and implemented. Lovelock (1992a) concedes that other organisational
departments such as accounting and finance are also important, but claims that the three depicted
are especially significant because they directly address customer contact on a daily basis. Lovelock
(1992b) felt that it was crucial for organisations to take a legitimate interest in the customer because
globalisation and technological advancement had brought intense competition to the service sector.
Lovelock’s (1992a) intention to draw attention to the internal organisational structure before
looking outward is clearly in line with Albrecht’s (1988) view, and is supported by Grönroos’
(1990) conceptualisation of service management.
In 1994 Grönroos set out to clarify the major aspects and main thrust of service management theory.
He assessed the content of his earlier definition (Grönroos, 1990), as well as that offered by
Albrecht (1988). As a result, he was able to isolate five key facets of the service management
perspective:
1. “It is an overall management perspective, which should guide decisions in all areas of
management (not only provide management principles for a separate function such as
customer service);
Marketing Management
Human Resource
Management
Operations Management
Customers

15
2. It is customer driven or market driven (not driven by internal efficiency criteria);
3. It is a holistic perspective, which emphasises the importance of intraorganisational,
cross-functional collaboration (not specialisation and division of labour);
4. Managing quality is an integral part of service management (not a sperate issue); and
5. Internal development of the personnel and reinforcement of its commitment to
company goals and strategies are strategic prerequisites for success (not only
administrative tasks)” (p. 7).
Although Grönroos (1994) only considered his (1990) and Albrecht’s (1988) service management
definitions in developing these facets, one can draw clear parallels between his concept of
intraorganisational, cross-functional collaboration and Lovelock’s (1992a) Service Management
Trinity model. His construction of service management issues also continued to maintain that the
internal make-up of an organisation was vitally important. In discussing the internal development
facet, Grönroos specifically addressed the concept of “internal marketing”. He stated, “without
active and continuous internal marketing efforts the interactive marketing impact on customers will
deteriorate, service quality will suffer and customers will defect with negative effects on
profitability as a result” (p. 14). The leading service management authors mentioned thus far shared
this point of view, as did the majority of authors of services marketing literature. The discussion to
follow will demonstrate this, while showing how the internal marketing concept has been developed
and repositioned over recent decades.
2.3 Internal Marketing – The Early Years Employee motivation and satisfaction were the main themes discussed throughout early internal
marketing literature. Berry, Hensel and Burke (1976) were among the pioneers of internal
marketing thought, being the first to label employees internal customers. They stated that an
organisation’s capacity to satisfy and motivate these internal customers would in large part
determine the satisfaction of their external customers. Employees were therefore seen as part of an
internal market, whereby their jobs represented the organisation’s internal products (p. 8).
Thompson, Berry and Davidson (1978) explained the logic behind referring to employees’ jobs as
internal products, stating that just as with marketing external products, organisations can endeavour
to design and refine employees’ jobs in a manner that produces benefits for both parties. George
(1977) stressed that the most important internal products were those of the customer-contact
personnel, stating, “they are the firm’s most critical productive resource and its vital link in the
service delivery system” (p. 90).

16
Sasser and Arbeit (1976) declared that organisations need to “first sell the job to its [customer-
contact] employees before [they] can sell its service to customers” (p. 64). In other words, an
organisation needs its employees to first accept or buy its services before it can expect them to
willingly sell these services to customers. Norman (1984) echoed an identical message when he
stated, “what you can’t sell to your own staff you can’t sell to the customers either” (p. 78). Murray
(1979) suggested that a marketing programme’s effectiveness would be compromised if employees
were not sold on a concept. Various authors believed that attracting the most talented employees,
then ensuring they are adequately motivated and satisfied would minimise the threat of them not
adhering to marketing strategies (Sasser and Arbeit, 1976; Thompson, Berry and Davidson, 1978).
The next section will show how this idea evolved further.
2.4 Applying Marketing Techniques Internally The idea of “selling the job” acted as a stepping-stone for internal marketing to advance to a more
sophisticated level. To this end, Berry (1981) believed that employees would be most satisfied and
motivated when traditional external marketing practices were implemented within an organisation’s
internal environment. He thought advertising would “sell the job” to employees by influencing
them to think and behave favourably towards the organisation and its customers. He stated that
marketing research would help assess employees’ needs, wants and attitudes towards job-related
matters and thus isolate the areas adversely affecting both internal and external customer
satisfaction. Furthermore, Berry suggested that the individual needs and wants of employees would
be best served when segmentation existed within the internal market. He stated that the
heterogeneous nature of the internal market made it necessary for organisations to provide
employees with flexible working hours and other fringe benefits such as “vacation days”.
Grönroos (1981) contended that internal marketing needed to be executed on two levels: a strategic
level and a tactical level. From a strategic standpoint, he saw it as being concerned with creating an
internal environment that supported customer-consciousness and sales-mindedness. From a tactical
perspective, he encouraged service organisations to adopt internal marketing practices such as
personal selling. Grönroos felt this would persuade employees to accept the services and other
activities of the organisation. Synergy between the ideas of both authors was most apparent
however in 1985. The following quote shows that Grönroos (1985) fully endorsed Berry’s (1981)
theory of using marketing-like activities internally:

17
“The internal marketing concept – as a complement to the traditional marketing concept – holds
that an organisation’s internal market of employees can be influenced most effectively and
hence motivated to customer-consciousness, market-orientation and sales-mindedness by a
marketing-like internal approach and by applying marketing-like activities internally” (p. 42).
Gummesson (1987) indicated that he agreed with the principles outlined in Grönroos’ (1985) quote
when he discussed his study of a large European telecommunications organisation. He recognised
that all employees had an internal customer to serve and asserted that the best way for each
employee to satisfy his/her internal customers was to practise traditional external marketing
concepts internally. Crompton, George, Grönroos and Karvinen (1987) and George (1990)
conveyed an identical message in their articles, while Crompton (1987) solely emphasised the
importance of customer-consciousness. He suggested that an organisation could create a customer-
conscious environment by ensuring it first served the needs of its employees. Almost two decades
on, this approach continues to be advocated, with authors such as Lings (2004) exploring the
relationship between internal and external marketing orientation. Lings and Greenly (2005)
advanced this further through the development of a multidimensional construct (Internal Marketing
Orientation). Their research indicated that internal marketing orientation positively impacted
customer satisfaction, relative competitive position, staff attitudes, staff retention and staff
compliance.
Mudie (2003) represents a uniquely opposing view on the notion of employee as customer, and
posits that employees and external customers are too dissimilar to be viewed in a similar light. To
demonstrate this, he states that the “desire, wish fulfilment, happiness and delight of the [external]
marketplace stand in stark contrast with the anxiety, frustration and dehumanisation of work” (p.
12). He also contends that this issue has been devoid of the rigorous debate needed, adding that the
“challenge for internal marketing is unnerving” (p. 14). One of these challenges relates to how
internal marketing can work towards integrating an organisation’s multiple functions.
2.5 Integrating Multiple Functions While Grönroos (1985) encouraged organisations to create customer-consciousness, market-
orientation and sales-mindedness, authors such as Winter (1985) suggested that internal marketing
could also be used to align, educate and motivate employee resources towards the achievement of
specific organisational objectives. He stated that employees needed to “understand and recognise
not only the value of the program but their place in it” (p. 69). For this approach towards internal
marketing to work, the multiple functions of the organisation needed to be tightly integrated (Flipo,

18
1986). The notion of integrating functional departments was also alluded to by Grönroos (1981),
when he suggested that integrating the multiple functions was vital to an organisation’s customer
relations. Moreover, along with strongly endorsing the ideas of Grönroos (1985), George (1990)
added that internal marketing was a “management process to integrate the multiple functions” (p.
64). It is worthwhile to reiterate here that the functional integration process lies at the heart of
service management theory. This suggests that this approach towards internal marketing was
strongly influenced by the emergence of service management theory during the mid 1980’s.
The service management philosophy seemed most boldly represented in articles by Glassman and
McAfee (1992) and Heskett (1987). Glassman and McAfee recommended that internal marketing
be used to integrate the marketing and personnel functions, also known as Human Resource
Management (Figure 2.2.1), while Heskett highlighted the importance of integrating marketing and
operations. Glassman and McAfee (1992) felt that if marketing employees coordinated with
personnel employees on issues such as recruitment and training this would help the more successful
execution of marketing strategies. Heskett (1987) argued that because services are produced and
consumed simultaneously close coordination between marketing and operations was essential.
Shipley (1994) adopted a similar position by encouraging marketing managers to coordinate with
non-marketing personnel so that organisational goals and objectives would be better met. In
considering these points of view, one can reflect the same position advocated by Lovelock (1992a)
(Figure 2.2.1). Internal marketing in this context could therefore work towards minimising
departmental isolation (Martin, 1992) and fostering integrating between functions.
2.6 Change Management and Strategy Implementation By the early 1990’s it was obvious that internal marketing had developed into a relatively
multifaceted concept. Notwithstanding this, additional strands of thought emerged from authors
such as Piercy and Morgan (1991). They believed that internal marketing was also useful in
overcoming employee resistance to change throughout the strategy implementation process. Piercy
and Morgan’s list of important internal marketing issues linked closely with a definition of internal
marketing put forth by Rafiq and Ahmed (1993):
“Internal marketing involves a planned effort to overcome organisational resistance to change
and to align, motivate and integrate employees towards the effective implementation of
corporate and functional strategies” (p. 222).

19
This definition ties together the two issues of internal change management and effective strategy
implementation. These authors did not stand alone in their delineation of internal marketing. For
example, Varey (1995) discussed internal marketing in the context of managers enacting changes
during strategy implementation. To this he added, “internal marketing can [also] ensure that the
marketing concept and practice are not the sole property of a marketing department and that
functional specialists interact with marketers to form internal customer service-focused alliances”
(p.54). These authors therefore saw internal marketing as being equally concerned with three key
issues – change management, strategy implementation and functional integration. While Ballantyne,
Christopher and Payne (1995) also acknowledged that these issues were important, they clearly
placed the heaviest emphasis on change management. This is demonstrated by their definition of
internal marketing shown below:
“[Internal marketing] is any form of marketing within an organisation which focuses staff
attention on the internal activities that need to be changed in order to enhance external
marketplace performance” (p. 15).
This definition also confirms the fact that some authors sought to legitimise internal marketing by
its purpose rather than by its methods (Wilson, 1995; Ballantyne, 2000). In other words, some of the
more recent authors appeared more comfortable defining what internal marketing was rather than
how to practise it. Piercy and Morgan (1991) were among a select few, however, who discussed
their views on how internal marketing goals should be pursued. The authors considered that an
internal marketing programme required activities “that parallel and match the marketing programme
of the external marketplace of customers and competitors” (p.84). By observing Piercy and
Morgan’s stance, one can draw linkages between the earlier conceptualisations of internal
marketing (Berry, 1981; Grönroos 1981, 1985) and the more recent approaches discussed (Rafiq
and Ahmed, 1993). Expressed plainly, internal marketing’s how’s seemed to withstand a period in
which its what’s experienced a considerable shift in focus. This is not to say that all authors agreed
with this shift. Berry and Parasuraman’s (1991) definition provides evidence of that, as they defined
internal marketing using the terminology and language commonly associated with the definitions
provided during the 1980’s (see George, 1977; Berry, 1981):
“Internal marketing is attracting, developing, motivating and retaining qualified employees
through job-products that satisfy their needs. Internal marketing is the philosophy of treating
employees as customers…and it is the strategy of shaping job-products to fit human needs” (p.
151).

20
This definition reaffirms that even by the mid 1990’s there was still no uniform agreement
regarding what constituted internal marketing. It is for this reason that authors such as Sargeant and
Asif (1998) have suggested that very few organisations understand or practise internal marketing.
This uncertainty did not seem to deter authors from contributing further to certain segments of the
literature, however. For example, Greene, Walls and Schrest (1994) strongly endorsed the fact that
internal marketing was the key to achieving external marketing success. McLeod, Iverson and
Bittigieg (1995) explored internal marketing in the context of it being an effective means of
generating organisational commitment. Furthermore, Foreman and Money (1995) attempted to
develop a model that would allow for the practical application of an internal marketing programme.
Their model was primarily based upon the internal marketing perspectives and definition put forth
by Berry and Parasuraman (1991). Naudé, Desai and Murphy (2003) utilised the scale developed by
Foreman and Money (1995) and reported on the extent to which it correlated with a range of
“person”, “situation” and “person x situation” variables. Among their results was that age, location
and length of tenure all affected levels of internal marketing orientation.
Authors such as Ballantyne (2000, 2003) explored internal marketing from a relationally oriented
perspective, and specifically as a strategy for knowledge renewal. This has emerged as an important
strand of literature, as rather than conceptualising internal marketing as a means for employees to
extract value from transactions (one-way), internal relationship marketing acknowledges the
establishment of two-way internal relationships that create mutual value for participants. The
underlying principles of internal relationship marketing were also adapted from external
relationship marketing literature, building on Berry’s (1983) pioneering work.
Bell, Mengüc and Stefani (2004) conducted a study that explored internal marketing relationships
and their influence on sales person attitudes and behaviours within retail store environments. The
organisation-employee relationship, together with the supervisor-employee relationships were the
focus of the study, in terms of their connection to job motivation and commitment to customer
service. Among their results was the finding that as customer complaints increase, the effectiveness
of the employee-organisation relationship becomes limited. Herington, Scott and Johnson (2005)
also explored the organisation-employee relationship, with their findings indicating that
cooperation, empowerment, communication, attachment, shared goals and values, trust and respect
were all key components. Keller (2002) conducted research that examined internal relationships
between supply chain members, in terms of their ability to create healthier, more successful external

21
partnerships. Ahmed and Rafiq (2003) acknowledged the need for this relationally-oriented
perspective in internal marketing, as an alternative to the transactional approach that has
underpinned much of internal marketing literature to date, a view also shared by Voima (2000).
2.7 Internal Marketing – A Multi-Faceted Concept As we continue exploring the positions held by authors such as Foreman and Money (1995), it
becomes increasingly evident that the majority of authors attached themselves to a particular
perspective of internal marketing. Going against this trend, Rafiq and Ahmed (2000) adopted a
standpoint in which they asserted that all mainstream conceptualisations and philosophies were
relevant and thus could be placed under the same internal marketing umbrella. To this end, they
defined internal marketing by using a range of well-known principles and beliefs from the literature,
which had been developed by a number of authors independently and in isolation from one another.
Their definition therefore reads as follows:
“Internal marketing is a planned effort using a marketing-like approach to overcome
organisational resistance to change and to align, motivate and inter-functionally co-ordinate and
integrate employees towards the effective implementation of corporate and functional strategies
in order to deliver customer satisfaction through a process of creating motivated and customer-
orientated employees” (p. 454).
This definition serves the useful purpose of identifying, interrelating and summarising the key
internal marketing themes discussed thus far. Bearing this in mind, a number of studies over the
years have been designed to test whether some of these themes were actually legitimate or merely
conceptual. For example, Atkins, Marshall and Javalgi (1996) utilised a hospital setting to test
whether a relationship existed between nurse job satisfaction and patient perceptions of service
quality. Their results uncovered a strong relationship between the two variables- findings that would
later be contradicted by Herrington and Lomax (1999). Herrington and Lomax tested the same
relationship but found that employee job satisfaction did not affect customer perceptions of service
quality. These authors did, however, uncover a relationship between employee job satisfaction and
customer intention to repurchase. A recent exploratory case study by Barnes, Fox and Morris (2004)
investigated the impact of internal marketing on external service quality, from the employees’
perspective. Their findings suggested that internal practises such as rewards programmes had an
impact on employees’ ability to deliver external service quality.

22
2.8 From Internal Marketing to Internal Service Quality It is the lack of parity between authors’ views that has helped to keep debate in the areas of services
marketing, service management and more specifically internal marketing so active. As seen
throughout this review, marketing thought has been challenged vigorously over many years. It is for
this reason that a service was eventually defined, which of course paved the way for services
marketing to emerge and ultimately flourish into a discipline of relative independence. The
emergence of services marketing not only confirmed that a unique a set of tools were required to
market services, but also encouraged augmented thought in related areas. The subsequent evolution
of service management is a prime example of this. Authors of service management literature ably
embraced fundamental services marketing principles while at the same time building upon them to
show that a customer focus could not be confined to just a marketing department, but rather needed
to exist throughout an entire organisation. This broader view of services marketing was therefore
largely responsible for drawing attention to the wider issue of functional collaboration.
As seen throughout this chapter, numerous authors believed that internal marketing was the key to
services marketing and service management success. The earlier literature proposed that employees
would most likely deliver customer satisfaction when motivated and satisfied with their jobs.
Authors subsequently encouraged organisations to treat their employees as customers and to view
employee jobs as internal products. The discipline then developed to a point where persuasion
techniques were encouraged to create a customer-conscious and sales-minded mentality among
employees. The use of marketing-like techniques not dissimilar to those used for external customers
were seen as the most effective way of achieving internal marketing goals. The internal marketing
concept became even more multifaceted when various authors recognised it as a vehicle for strategy
implementation and change management. It was at this point that the service management
philosophy began to make its mark, in that internal marketing was also perceived as a mechanism to
assist the functional integration process. The strong emergence of internal relationship marketing
literature is a clear indicator of this trend.
The exploration of the literature has also revealed that various authors actively supported only
certain perspectives of internal marketing, despite them being seemingly interrelated. Only Rafiq
and Ahmed (2000) were able to integrate them effectively to create a more complete and broader-
based definition. Their definition captured the universal view that marketing-like techniques were
appropriate within the internal environment, while also encompassing the multipurpose nature of
the internal marketing concept.

23
Other than endorsing the use of marketing-like techniques internally, most of the authors cited
discussed internal marketing in a largely descriptive manner. Ahmed, Rafiq and Saad (2003)
recently proposed a new internal marketing implementation model, demonstrating that their internal
marketing mix was a reliable measure and strongly related to business performance. Moreover,
Czaplewski, Ferguson and Milliman (2001) outlined the internal marketing strategies implemented
by Southwest Airlines, and attributed these strategies to success in three key areas - employees,
customers and profits. Interestingly, Kelemen and Papasolomou-Doukakis (2004) found that
internal marketing programmes implemented in a series of UK banks led to conflict as well as
ambiguous relationships between employees and the organisations.
The next chapter will explore the implementation of internal marketing in the specific context of
delivering quality service to employees. Thus, the belief that employees should be treated as
customers lies at the very core of internal service quality theory. Moreover, the author will
investigate how the quality of internal service potentially affects the successful implementation of
marketing strategies and thus the functional integration process. The body of literature on internal
services marketing and management has increasingly focused attention on frontline employees and
the quality of internal service they are delivered. The next chapter begins by reviewing how the
importance of frontline employees has been perceived by both authors and service organisations.
This will be followed with a review of the literature on the concept of “backstage support”, before
exploring the bodies of literature on external and internal service quality.
Chapter
3
24
3.0 Literature Review – Part B Part A of the literature review showed how the internal marketing concept developed and became a
multifaceted concept. Most authors agreed that applying marketing-like techniques internally was
an essential ingredient in satisfying the needs of employees and inturn ensuring external marketing
success. This chapter will focus attention towards one employee group in particular – frontline
employees, and review the literature regarding their importance to service organisations and the
need to provide them with adequate internal support. This will be followed by a review of external
and internal service quality literature, which will inturn facilitate the development of a number of
research questions related to the theoretical areas covered within the two chapters.
3.1 The Importance of Frontline Employees Discussions about the importance of frontline employees within service organisations date back
quite some time (see George, 1977). Before discussing these studies and the importance of their
role, it is imperative to first define what constitutes a frontline employee. Throughout the literature
investigated the term frontline employee (Larkin and Larkin, 1996; Frost and Kumar, 2001) was
used interchangeably with terms such as customer-contact personnel (Eiglier et al., 1977).
Evidently, both terms were represented in an identical context, and thus the following definition of
customer-contact personnel can be offered:
“The individuals employed by a service business who are in direct contact with the client; for
example, the personnel at the reception desk of a hotel, bank tellers, air flight hostesses, etc.”
(Eiglier et al., 1977, p. 91).
Note: For the purpose of maintaining consistency throughout this study, only the term frontline
employee will be used.
Jan Carlzon – the president of Scandinavian Airline System – is famous for being one of the first to
implement an internal marketing strategy (Carlzon, 1987). His strategy was centred on recognising
the importance of what he called “moments of truth” between frontline employees and customers.
He labelled frontline employee-customer interactions moments of truth because frontline employees
“are the ones who most directly influence the customer’s impression of the company” (p. 61). It is
for this reason he deployed a decentralised decision-making system, which gave frontline

25
employees the flexibility and authority to respond to diverse customer requests. This process
facilitated a flatter organisational structure, which compares directly to what many called “turning
the pyramid upside-down” (Albrecht, 1988, p. 105). The Upside-Down Pyramid (Figure 3.1.1)
suggests a shift in organisational focus towards supporting frontline employees during their
exchanges with customers. This is as opposed to the traditional hierarchical lines, which implied
that frontline employees were least influential in shaping customers’ overall impressions of the
organisation. It seems timely to study managers’ perceptions of frontline employees today.
Figure 3.1.1 The Upside-Down Pyramid
Customers
Frontline Employees
Support Units
Managers
Adapted from: Albrecht, K., (1988), At America’s Service, Homewood, Illinois, Dow Jones-Irwin,
p. 107.
Schlesinger and Heskett (1991) felt that many organisations did not understand the importance of
their frontline employees and were subsequently perpetuating what they termed the “cycle of
failure”. They described the cycle of failure as a situation where organisations tolerate high turnover
and expect dissatisfaction among their frontline employees. Customers consequently become
increasingly dissatisfied, as they receive lacklustre service from employees who have minimal
training, collect low wages and are poorly motivated and regarded within organisations. Schlesinger
and Heskett believed that organisations could reverse the cycle of failure by adopting an approach
similar to that depicted in Figure 3.1.1. To this end, they made the following statement:
“The basic premise is simple: the old model puts the people who deliver service to customers
last; the new model puts frontline workers first and designs the business system around them”
(p. 72).
Sears Roebuck – a prominent American retail outlet – reversed its cycle of failure after its top
executives implemented a business strategy in accordance with the philosophy proposed by
Schlesinger and Heskett (1991) (Rucci, Kirn and Quinn, 1998). Prior to the change in direction,

26
Sears had lost significant market share because it sacrificed good service and tried to compete on
price. Low prices meant reduced profit margins, which equated to less money being spent on hiring,
training, motivating and rewarding frontline employees. This prompted a high turnover of frontline
employees, thereby causing customer satisfaction levels to decline dramatically. A new business
model – the employee-customer-profit model – was developed to reverse this trend. It was centred
on the realisation that frontline employees were central to the organisation’s success. Sears’
management knew that the key to making the model work was to build strong relationships with its
frontline employees, as that would theoretically lead to increased customer satisfaction and then
higher sales revenues. This theory was proven to be correct, as a 5-point improvement in frontline
employee attitudes drove a 1.3-point improvement in customer satisfaction, which then drove a
0.5% improvement in revenue growth. It is relatively unknown whether Australian service
organisations use Sears’ approach when managing their frontline employees.
Wasmer and Bruner (1991) indicated that they strongly supported Sears’ strategy, suggesting that
service quality would be enhanced once organisations began to recognise the significance of their
frontline employees and managed their needs accordingly. Evidently, very few studies to date have
focused on exploring the work needs of frontline employees. Bitran and Hoech (1990) also
discussed the idea of the moment of truth in detail, suggesting that in order to create positive word
of mouth and external satisfaction organisations needed to pay particular attention to motivating and
training frontline employees to treat customers respectfully. Moreover, some studies have examined
the specific behaviours and characteristics frontline employees exhibit during service encounters
and how those characteristics then impact either very positively or very negatively upon customer
perceptions (Bitner, 1990; Bitner, Booms and Tetreault, 1990). The results of this research
suggested that frontline employees – through their split second actions and decision-making – hold
the power to either make or break a service organisation’s image.
Hartline and Jones (1996) conducted research to test the impact of employee performance cues on
perceived service quality, value and word-of-mouth intentions within a hotel service environment.
Their results largely corroborated the points of view held by others (eg. Carlzon, 1987), as they
discovered that front desk, housekeeping and parking employee performance had significant effects
on customers’ perceived service quality of hotel services. These results are in some ways related to
a study undertaken by Avkiran (1999). Avkiran analysed the impact of replacing frontline
employees with technology throughout the banking industry. He discovered, among other things,
that access to teller services had a direct positive effect on perceived staff conduct. In other words,
customers felt they were receiving better customer service when they had direct contact with bank

27
staff. Avkiran consequently warned, “those arguing in favour of replacing staff by various cost-
effective technologies may well be undermining the essence of successful customer service, which
invariably involves human contact” (p. 66).
3.2 Backstage Support The previous section outlined many strong arguments that advocated frontline employees and their
important position within service organisations. This section will further develop some of those
arguments, while also showing that frontline employees cannot act autonomously if their direct
interactions with customers are to be successful. Indeed, frontline employees are increasingly
dependent on what is known as “backstage” support (Grove and Fisk, 1983) or an organisation’s
“technical core” (Chase, 1978). The backstage essentially refers to parts of the organisation that are
invisible to customers but nonetheless impact upon the quality of service they receive. It involves
persons such as supervisors, systems support employees and training and development employees.
Bearing this in mind, frontline employees and customers have been categorised as part of the
services marketing system’s “front stage” (Grove and Fisk, 1983). We have already seen (Figure 3.1.1) the weight of importance given to the backstage by Albrecht
(1988). He saw backstage employees as the second most important section of the organisation,
which is why he strongly encouraged managers to embrace “the roles of supporter, helper and
enabler [to frontline employees]” (p. 108). Similarly, Larkin and Larkin (1996) recommended that
senior managers channel substantial resources towards those who support frontline employees.
Grönroos and Gummesson (1986) produced a diagram that depicted the relationship between the
back and front stages, calling the backstage the “supporting part” and the front stage the “interactive
part”. Despite their use of alternative terms, Grönroos and Gummesson clearly outlined the various
forms of backstage support and showed their decisive impact on a service organisation’s front stage
operations. An adaptation of their diagram is displayed in Figure 3.2.1, with the backstage
components highlighted in red:

28
Figure 3.2.1 The Front and Backstage of Services
Supporting Part
(Backstage) Interactive Part
(Front Stage) I N Technology and V Systems Know-how Systems I C S Systems Support U I S B Managers and Human Resources T L Supervisors (Salespersons and O E Contact persons) M
Management Support E P R A Supporting Functions Physical Environment S R and Persons (Physical/ Technical T Resources)
Material Support Adapted from: Grönroos, C. and Gummesson, E., (1986), “Service Orientation in Industrial
Marketing”, in Venkatesan, M., Schmalensee, D. M. and Marshall, C., (eds.), Creativity in Services
Marketing: What’s New, What Works, What’s Developing, Chicago, Illinois, American Marketing
Association, p. 23.
As shown by Figure 3.2.1, Grönroos and Gummesson (1986) believed that the backstage comprises
of three vital components: systems support, management support and material support. Effective
systems support suggests that the technology provided is adaptive to customer needs and that there
is sufficient (backstage) employee know-how to oversee the maintenance of such technology. Thus,
backstage employees are responsible for accessing the organisation’s technology and systems on
behalf of frontline employees; this then allows frontline employees to access the same systems and
technology on behalf of customers (Kingman-Brundage, George and Bowen, 1995). Frontline
employees also require management support in the form of knowledge, leadership and motivation.
Thirdly, material support may entail frontline employees being supplied with important new
product information by the marketing function. Evidently, little research has been done to identify
the specific internal services delivered to frontline employees in service organisations. The broad
“backstage support” label and three category headings shown in Figure 3.2.1 provide insufficient
insights into the many different internal service encounters experienced by frontline employees
within their roles.

29
Lovelock (1992a) saw the marketing function’s role extending beyond just backstage support. He
asserted that the marketing function also plays a pivotal role in helping to design front stage
activities and facilities so that they coincide with the organisation’s goals and strategies. Lovelock
also highlighted the need for marketing managers to liaise with both human resources and
operations management to ensure that the “chain of quality” (Albrecht, 1990, p. 6) between the
front and back stage remains strong. Kingman-Brundage (1995) constructed a model portraying the
complexity of support tasks undertaken by these functions before, during and after customers come
into contact with frontline employees. She broke the process down into 21 sequential steps, thereby
improving understanding of both the degree and nature of support frontline employees require
throughout the strategy implementation process.
Gummesson (1991) believed that backstage support would be most accommodating when
employees viewed one another as internal customers. Gummesson stressed that all employees must
become “internal part-time marketers”, a concept derived from his original “part-time marketer”
concept. The original part-time marketer concept implied that all employees influence external
customer relations and revenue irrespective of their job description, and thus have a responsibility
to practise marketing on a part-time basis; the internal part-time marketer concept suggested that
employees must also fulfil marketing responsibilities internally, in that they must supply other
employees with a series of need-satisfying services on a daily basis. To this end, Gummesson had
the following to say:
“All employees should see themselves as customers of other employees from whom they
receive products, decisions, messages, etc., and that they should see themselves as suppliers to
other internal customers. Only when the internal customers are satisfied…has a job been
properly executed” (p. 70).
The underlying theme of this view – to see employees as internal customers – is central to this
study. With this in mind, it is unclear whether managers and other backstage employees of
Australian service organisations actually view frontline employees as their internal customers. At
the same time, the notion of employees supplying one another with internal services is equally, if
not more relevant to this study. So far we have discussed the importance of backstage support and
the various forms of it that exist. While the importance of backstage support on a generic level is
clearly evident, a body of literature exists arguing that the quality of backstage support just as vital
as the support itself. In other words, when backstage employees supply services to their internal
customers – in this case, frontline employees – it is necessary for that service to be of a particular

30
quality, just as for external customers. This will be the crux of the discussion throughout the
remainder of this chapter. Before discussing service quality in an internal organisational context
though, it is both useful and necessary to analyse where much of the theory originated. This means
firstly exploring the literature concerned with external service quality.
3.3 External Service Quality The area of external service quality has accrued a significant body of literature. One of the earliest
and most influential service quality works was by Grönroos (1983). It was based on the principle
that perceived service quality was shaped by two interrelated dimensions: “technical” and
“functional” quality. He defined technical quality as what the customer receives; for example, a
meal at a restaurant or a hotel room with a bed to sleep in. Functional quality was defined as how
the customer receives the service; for example, the appearance and behaviour of waiters, travel
agency representatives or bus drivers. Thus, customers evaluate service quality by comparing their
expectations of these quality dimensions against their actual perceptions during service encounters.
Grönroos believed that while both quality dimensions are important functional quality has the most
impact on perceived service quality.
Grönroos (1983) believed that customer expectations of functional and technical quality were
affected by a service organisation’s corporate image. For example, a customer may develop higher
expectations than the average client after receiving very favourable word-of-mouth feedback from a
friend. Grönroos outlined two kinds of factors impacting upon corporate image: 1) External, such as
traditions, ideology and word-of-mouth, and 2) Traditional marketing activities, such as pricing,
advertising and public relations. Grönroos constructed a model showing how corporate image,
functional quality and technical quality ultimately shape perceived service quality. An adaptation of
it is displayed in Figure 3.3.1:

31
Figure 3.3.1 Model of Perceived Service Quality Adapted from: Grönroos, C., (1983), Strategic Management and Marketing in the Service Sector,
London, United Kingdom, Chartwell-Bratt, p. 28.
Grönroos later came together with Evert Gummesson to create a synthesised service quality model,
which they presented at the American Marketing Association’s sixth annual services marketing
conference (Gummesson and Grönroos, 1987). Grönroos combined his functional and technical
quality dimensions with Gummesson’s “4Q” model, which had the following dimensions: 1) design
quality, 2) production quality, 3) delivery quality and 4) relational quality. The authors also
outlined two conditions necessary for achieving high quality service. They called one the “specialist
condition”, which required that all employees fulfil the requirements of their jobs diligently. The
second was called the “integration condition”, which required that all employees work in
accordance with one another.
Grönroos (1988) went on and added further to his earlier work from 1983. This time he applied his
functional and technical quality dimensions, as well as corporate image to come up with a list of
criteria for achieving good perceived service quality. Grönroos contended that good perceived
service quality occurred when a customer’s expected service matched their perceived or
“experienced” service. His list of criteria for achieving this reads as follows:
1. Professionalism and Skills Technical Quality 2. Behaviour and Attitudes 3. Accessibility and Flexibility 4. Reliability and Trustworthiness 5. Recovery (corrective action)
Perceived Service Quality
CorporateImage
What? Technical Quality
How? Functional Quality
Expected Service
Perceived Service
Traditional marketing activities (advertising, personal selling, public relations, pricing) and
external influence by traditions, ideology and word-
of-mouth
Functional Quality
32
6. Reputation and Credibility Corporate Image As seen here, item 1 represented the technical quality dimension; items 2, 3, 4 and 5 represented the
functional quality dimension; and corporate image was characterised by item 6. Grönroos asserted
that the “six criteria…are based on existing knowledge of how service quality is perceived” (p. 12).
Evidently, Grönroos did not to stand alone in his delineation of service quality dimensions. In
discussing his eight dimensions of service quality, Garvin (1987) defined the term perceived quality
as the dimension representing an organisation’s reputation (i.e. corporate image). Lehtinen and
Lehtinen (1985) also promoted corporate image as one of their three dimensions of service quality
(calling it “corporate quality”). The two other quality dimensions they defined were known as
“interactive” quality and “physical” quality. Interactive quality was derived from the interactions
between frontline employees and customers or those between customers and customers (i.e. word-
of-mouth). Physical quality involved the physical aspects of the service, such as an organisation’s
building or physical equipment.
While Grönroos and others sought to further develop their service quality models, another stream of
theory emerged as a result of a landmark article by Parasuraman, Zeithaml and Berry (1985). They
proposed – after conducting a series of focus groups and executive interviews – that perceived
service quality was a function of four gaps, all of which were shown in their “Service Quality
Model” (p. 44). The authors labelled the four gaps as follows:
Gap 1: Consumer expectation – management perception gap
Gap 2: Management perception – service quality specification gap
Gap 3: Service quality specification – service delivery gap
Gap 4: Service delivery – external communications gap
It was also proposed that the size and direction of these four gaps combined would determine
customer perceived service quality, termed the expected service – perceived service gap (or Gap 5).
Moreover, Parasuraman, Zeithaml and Berry identified ten dimensions of service quality:
Reliability, Responsiveness, Competence, Access, Courtesy, Communication, Credibility, Security,
Understanding/knowing the customer and Tangibles. Similar to the six criteria Grönroos (1988) had
outlined, Parasuraman, Zeithaml and Berry (1985) felt their ten dimensions represented what
“consumers use in forming expectations about and perceptions of services” (p. 49). Likewise,
Parasuraman, Zeithaml and Berry (1985) recognised that overall quality evaluations involve

33
assessing processes as well as outcomes. Grönroos (1983) had earlier labelled this technical and
functional quality.
The ten dimensions of service quality became five when Parasuraman, Zeithaml and Berry (1988)
developed SERVQUAL – a multi-item testing scale for measuring consumer perceptions of service
quality. The authors presented evidence of the scale’s reliability, factor structure and validity, while
explaining the rationale behind downsizing their dimensions. To this end, the authors provided the
following labels and concise definitions of the final five dimensions:
Table 3.3.1 The Five Dimensions of Service Quality Dimension Definition
Tangibles: Physical facilities, equipment, and appearance of personnel Reliability: Ability to perform service dependably and accurately Responsiveness: Willingness to help customers and provide prompt service Assurance: Knowledge and courtesy of employees and their ability to
inspire trust and confidence Empathy: Caring, individualised attention the firm provides its
customers Adapted from: Parasuraman, Zeithaml and Berry, (1988), “SERVQUAL: A Multi-Item Scale for
Measuring Customer Perceptions of Service Quality”, Journal of Retailing, vol. 64, no. 1, p. 23.
Table 3.3.1 shows that of the original ten dimensions only Tangibles, Reliability and
Responsiveness remained. The five original dimensions of Communication, Credibility, Security,
Competence and Courtesy were combined and named Assurance, while Access and
Understanding/knowing the customer translated into the newly named Empathy dimension. This
refined set of dimensions led Zeithaml, Berry and Parasuraman (1988) towards further defining the
four gaps identified in 1985 and also extending their service quality model. Their extended model
outlined the substantial set of factors affecting the four gaps and ultimately the five service quality
dimensions. For example, the consumer expectation – management perception gap (Gap 1) was
shown to be affected by marketing research orientation, upward communication and the (number
of) levels of management.

34
The work done by Zeithaml and associates, as well as that by Grönroos was extremely influential
on the later work of Brogowicz, Delene and Blyth (1990) developing their synthesised service
quality model. Their model suggested that perceived service quality or “the overall service quality
gap” was caused by information and feedback-related gaps (ignoring or misinterpreting customer
needs, external influences, company image, expectations and perceptions); design-related gaps
(wrong or inadequate service quality specifications, wrong pricing, wrong marketing channels,
etc.); implementation-related gaps (the delivered service quality does not meet specifications, poor
franchise selection, the customer is charged the wrong price, etc.); and communication-related gaps
(promising more than can actually be delivered, failing to communicate clearly the benefits of what
is being offered, etc). The authors asserted that managers could minimise these gaps – and thus
better meet technical and functional quality requirements – by performing a series of planning,
implementation and controlling tasks. For example, internal marketing was proposed as an
implementation task for enhancing functional quality. Furthermore, Brogowicz, Delene and Blyth
concurred with Grönroos (1983) that functional and technical quality expectations were directly
influenced by corporate image, external influences and traditional marketing activities, and this was
depicted by their model.
In light of the intense discussion into service quality gaps, Parasuraman, Berry and Zeithaml (1991)
developed five propositions to test the actual practicality of their extended service quality model.
Their research method involved examining five service organisations, with three different samples
of respondents from each organisation: customers, frontline employees and managers. The results
indicated “at least partial support for the propositions” (p. 346) and therefore for the extended
model itself. Berry, Parasuraman and Zeithaml (1994) considered this and all of their service
quality research when listing the ten principal lessons they had learnt over the previous ten years.
They read as follows: 1. listening, 2. reliability, 3. basic service, 4. service design, 5. recovery, 6.
surprising customers, 7. fair play, 8. teamwork, 9. employee research and 10. servant leadership.
Research into service quality also carried over into the area of professional services. Brown and
Schwartz (1989) used gap analysis to explore the discrepancies between provider and client
evaluations of service quality in the field of medicine. They discovered there were inconsistencies
between patients’ expectations and experiences, which in turn adversely affected their evaluations
of physicians’ service performance. Of even greater significance was the fact that physicians were
unaware of their shortfalls, as their personal perceptions of service experiences were inconsistent
with those of patients.

35
Cronin and Taylor (1992) sought to examine service performance in detail after constructing a
performance-based scale of service quality (SERVPERF) that linked service quality to customer
satisfaction and purchase motives. They discovered that the SERVPERF scale was more efficient
than SERVQUAL, in that it reduced the number of measurable items by 50%. It was also found that
service quality was an antecedent of customer satisfaction, and that customer satisfaction had more
of an effect on purchase intentions than service quality. This lead the authors to recommend that
managers place more focus on entire customer satisfaction schemes than on narrow service quality-
focused schemes.
The SERVQUAL scale was scrutinised further in a study by Mels, Boshoff and Nel (1997). The
authors concluded that the empirical factor structure of the SERVQUAL scale consisted of two
factors rather than the five suggested by Parasuraman, Zeithaml and Berry (1988). They labelled the
two factors intrinsic and extrinsic quality, adding that the two-factor solution facilitated better
interpretation because they exhibited consistency across countries, scales, diverse service industries
and sampling procedures. Intrinsic quality encompassed the items relating to the direct
(Responsiveness, Assurance and Empathy) and/or indirect (Reliability) actions of frontline
employees. This was comparable to what Lehtinen and Lehtinen (1985) called interactive quality.
Similarly, extrinsic quality resembled Lehtinen and Lehtinen’s physical quality dimension, as it
involved the tangibles used for need satisfaction; the authors characterised it as a narrower
interpretation of Grönroos’ (1983) technical quality dimension, that is, what the customer ultimately
receives.
Cândido and Morris (2000) drew on many of the studies cited throughout this section in order to
present a more comprehensive service quality gap model. Their model delineated fourteen gaps in
total, ranging from newly introduced gaps relating to the financial function to the more traditional
gaps mentioned here. Thus, it was their objective to construct a model that encompassed the
relevant aspects of the literature that had not been exploited in previous gap models. Some of the
gaps outlined were directly relevant to this study, in that they addressed the variety of exchanges
between internal customers. For instance, they highlighted potential gaps between the various
organisational functions; between frontline employees; and that most closely aligned with this
study, the gap between frontline employees and support personnel/systems. The literature
concerning internal service quality will be explored in considerable detail throughout the next
section. This will then facilitate the process of identifying the main issues within the literature and
subsequently formulating a number of research questions for investigation.

36
3.4 Internal Service Quality The body of literature on internal service quality has grown quite rapidly since the mid 1980’s. Its
growth has not been sufficient in the eyes of some authors, however, as suggested by Stauss (1995),
“internal services have been a neglected area of research” (p. 65). Similarly, Davis (1993) spoke
from a more pragmatic perspective, stating, “internal services within organisations have frequently
been classified as back-room operations and given minor attention” (p. 302). Davis also mentioned
that most research and writing had focused on frontline employees and their impact on the quality
of service delivered to external customers, rather than on “improving the quality of service provided
to internal customers” (p. 302). Bowen and Greiner (1986) proposed that the problem stemmed
from many departments not viewing themselves as providing service to other functions or
departments.
Herman and Baker (1985) suggested that the delivery of high quality internal service would very
likely have a significant influence on the goods and services eventually delivered to external
customers. Johnson and Frohman (1989) contributed to the debate and stated that the gradual
addition of staff specialists made it imperative that consideration be given to how different
departments can work together in a more coordinated and productive manner. In a case study of
computer giant IBM, Kane (1986) explained how that organisation was able to streamline its
business processes after implementing a programme they called process management. IBM
identified and flowcharted each internal activity in terms of related inputs, activities and outputs,
and consequently illustrated how all employees were linked as suppliers and customers (Figure
3.4.1). Another principal aspect of IBM’s programme was for employees to define their relationship
expectations for each supplier-customer interface.
Figure 3.4.1 Process Management at IBM Heskett, Jones, Loveman, Sasser and Schlesinger (1994) believed employee job satisfaction is
influenced most positively when the level of internal service quality is high. They emphasised that
organisations would ensure their long-term profitability by conducting service-profit chain audits,
which in part involve answering a number of questions relating to the quality of internal service
Inputs (E.g. Information and
Documentation)
Activities (Subsequent actions by
internal customers)
Outputs (The result of actions on the next internal
customer)

37
employees receive. For instance, do employees know who their (internal and external) customers
are? Are employees satisfied with the technological and personal support they receive on the job?
Such methodologies allow organisations to observe and detail how internal services are performed,
and subsequently find opportunities to make them more effective and efficient (Davis, 1993). Davis
(1993) suggested that problems with internal services are perpetuated because internal suppliers
rarely receive feedback from their internal customers about the quality of their performance. Of
equal importance, internal customers cannot choose alternative internal suppliers when they are
dissatisfied due to the existence of internal market monopolies (Vandermerwe and Gilbert, 1989).
Nagel and Cilliers (1990) also discussed this issue, saying that internal customers are committed to
or “captive” of internal suppliers. Voss, Calantone and Keller (2005) conducted a study
demonstrating the importance of the internal supplier-internal customer relationship, showing how
high levels of internal service quality can have a significant effect on external service and supply
chain performance.
The measurement of internal service quality has been the focus of numerous studies in recent years.
Auty and Long (1999) hypothesised four internal gaps based on the external service quality model
developed by Parasuraman, Zeithaml and Berry (1985). Auty and Long modified the original gap
definitions to take account of internal organisational hierarchies and quality structures. After
conducting their research, Auty and Long conceded that the four modified gaps were applicable to
the internal environment, while also discovering that additional “b” gaps existed. The “b” gaps
reflected gaps in knowledge and power that were found between departments. Hence, the authors
recommended that Parasuraman, Zeithaml and Berry’s model only be used as a starting point when
developing models of internal service quality. Both sets of gaps are outlined in Table 3.4.1.

38
Table 3.4.1 Gaps within the Internal Environment Hypothesised Gaps Additional Gaps Gap 1a: Difference between consumer Gap 1b: Difference between consumer expectations and the consumers’ department’s knowledge of managers’ perceptions of those possible service and supply expectations department’s capabilities Gap 2a: Difference between management Gap 2b: Difference between consumer
perceptions of service quality and department’s expectations of service quality quality and quality standards
monitors set for forward and backward linkages in the supply chain strategic goals Gap 3a Difference between service quality Gap 3b: Difference between service monitors and the service actually provider’s priorities and the
delivered organisation’s strategic goals Gap 4a: Difference between service Gap 4b: Difference between service requirements and what is delivery promises and communicated to suppliers by resources/authority provided
consumers by organisation to fulfil those promises
Adapted from: Auty and Long, (1999), “Tribal Warfare and Gaps Affecting Internal Service
Quality”, International Journal of Service Industry Management, vol. 10, no. 1, p. 3.
Auty and Long also drew attention to the dimensions of quality they found most relevant to the
internal environment. The four dimensions they cited – Helpfulness, Timeliness, Reliability and
Consideration – originated from a list of nine developed by Reynoso and Moores (1997). Reynoso
and Moores revised the original dimensions developed by Parasuraman, Zeithaml and Berry (1985)
and adapted them to suit an internal organisational context. Their other five dimensions were:
Communication, Tangibles, Professionalism, Confidentiality and Preparedness.
The similarities between internal and external quality dimensions were further demonstrated
through the research conducted by Vandermerwe and Gilbert (1991). The authors discovered that
“the needs of internal service users…are highly consistent with what we know about the external
marketplace” (p. 51). For that reason, Vandermerwe and Gilbert constructed a table showing how
their internal dimensions compared to Zeithaml, Berry and Parasuraman’s (1988) original external
dimensions. This is shown in Table 3.4.2. The author has adapted the table to include the internal
quality dimensions uncovered by Reynoso and Moores (1997), as this further exemplifies the

39
likenesses between internal and external quality dimensions. The limited number of studies in this
area offers further potential to explore how employees use these and perhaps other quality
dimensions when evaluating the quality of internal services.
Table 3.4.2 Comparison of Internal/ External Quality Dimensions
Internal External Internal
(Vandermerwe and Gilbert) (Parasuraman, Zeithaml and Berry) (Reynoso and Moores)
Reliability Reliability Reliability
Responsiveness Responsiveness Timeliness
On Time Empathy Helpfulness
Cost Assurance Consideration
Within Budget Tangibles Professionalism
Relevance Tangibles Communication
Confidentiality
Preparedness Adapted from: Vandermerwe and Gilbert, (1991), “Internal Services: Gaps in Needs/ Performance
and Prescriptions for Effectiveness”, International Journal of Service Industry Management, vol. 2,
no. 1, p. 51.
Frost and Kumar (2001) appeared to overlook these adapted sets of dimensions when they
conducted their study of internal service quality in an international airline. They elected to assess
the level of service quality during exchanges between internal suppliers (support employees) and
internal customers (frontline employees) via a straight adaptation of the original gap model and its
related dimensions (they called this model “INTSERVQUAL”). Their results indicated that some
differences existed between what internal and external customers valued most when evaluating
overall service quality. Unlike Parasuraman, Berry and Zeithaml (1991), Frost and Kumar found
Responsiveness – and not Reliability – to influence overall perceptions of service quality the most.
Although Responsiveness may be important on a generic level, for some internal services
Responsiveness may be of limited significance, meaning it is perhaps necessary to explore whether
specific quality dimensions vary in importance depending on not only the service being delivered,

40
but more specifically the context in which that service is delivered. Further, although Frost and
Kumar (2001) differed to Auty and Long (1999) in their adaptation of the original gap model, it was
important to observe that on a general level both sets of authors saw the use of a gap model as an
appropriate means of exploring internal service quality.
Clulow and Lasky (2002) adapted Frost and Kumar’s INTSERVQUAL model to demonstrate how
possible gaps may exist between an organisation’s human resource employees and those employees
who receive internal services from them. The main purpose of the paper was operationalise the
model and to shed light on the fact that all organisational functions have internal customers to serve
and should aim to understand their needs and expectations. Kang, James and Alexandris (2002)
modified the original SERVQUAL instrument, and were able to test and confirm its appropriateness
for measuring internal service quality. They confirmed that all five dimensions – reliability,
responsiveness, assurance, tangibles and empathy – were valid and reliable in a service setting.
Kuei (1999) also found SERVQUAL to be a useful instrument, however found the “tangibles”
dimension to be of little relevance.
Well before the gap model came to prominence, Sayles (1964) undertook research that sought to
provide a classification scheme for internal services. Stauss (1995) stated that because internal
services are heterogeneous, it is necessary to classify them in order to identify different service
types. This then makes it possible “to examine the problems frequently encountered in distinctive
service types and to discuss alternative approaches that can be applied to mediate these problems”
(Stauss, 1995, p. 65). Through his use of extensive observational techniques, Sayles (1964)
identified two main types of internal relationships – workflow relationships and service
relationships. Workflow relationships closely resembled what IBM characterised as process
management (Figure 3.4.1), whereby the next stage in the chain can only begin successfully once
the former has been completed. Service relationships were defined as alliances that involve multiple
feeds from one group to other groups in the organisation, and therefore do not occur in multiple
stages. Since Sayles conducted his research, internal service classification research has been
relatively scarce (Stauss, 1995), despite the body of research into external service classification
continuing to grow (see Lovelock, 1983; Supernant and Solomon, 1987; Silvestro, Fitzgerald,
Johnston and Voss, 1992).
Further to workflow and service relationships, Sayles identified four administrative patterns in the
relationships between departments. He labelled them as follows: auditing relationships, advisory
relationships, stabilisation relationships and innovation relationships. Davis (1993) later established

41
that two in particular were most pertinent – auditing relationships and advisory relationships. Sayles
characterised auditing relationships as one function monitoring and evaluating the performance of
another function. Some organisations call this function quality control (Davis, 1993). Advisory
relationships were defined as the provision of specialist advice from one department to another
department. Further to this point, advisory relationships could also conceivably exist in an
intradepartmental context, as was demonstrated by the management support component in Figure
3.2.1. In other words, supervisors communicating information to their subordinates (Johlke and
Duhan, 2000) and/or providing them with coaching and development training (Bell and Zemke,
1989) also involves the provision of specialist advice, only it occurs within a department rather than
interdepartmentally.
After closely studying Sayles’ findings, Davis (1993) refined the concepts and created a more
streamlined classification scheme for internal services. Davis outlined three types of internal
services – routinised workflow; support service and advice; and audit/evaluative services. Davis
defined routinised workflows and audit/evaluative services exactly as Sayles defined workflow
relationships and auditing relationships respectively. He included support service and advice, which
was a combination of Sayles’ service relationship and advisory relationship components. Davis
highlighted that services within the support service and advice category need to be adapted and
tailored to fit internal customer needs. He did not specify which services within that category
needed adaptation or provide examples of how adaptation might occur.
While the classification of internal services into broad categories appears useful, Albrecht (1988)
implied that it was necessary for internal services to be classified more specifically. He stated, “for
each [internal] moment of truth, try to pinpoint a specific quality factor that you believe the
customer considers critical to the successful performance of the service involved” (p. 140).
Similarly, Cannon (2002) suggested that employers would be challenged to understand the needs
and expectations of their employees, then subsequently modify and adapt internal services to be
most accommodating. This was also advocated by Marshall, Baker and Finn (1998), who
recommended that internal departments customise their service offerings to the unique needs of
different user groups. To place this into some context with what was proposed by Sayles and Davis,
it is suggested that perhaps specific services need to be identified within each broad service
category, and then individually blueprinted to meet the demands and expectations of the internal
customers being served. The literature has evidently given this issue minimal attention, although
some authors have briefly touched on it.

42
Reynoso and Moores (1995) shed some light on the issue of classification when they recommended
that researchers search for a set of dimensions that are not only generic, but also peculiar to specific
situations. Bruhn (2003) appeared to acknowledge the importance of identifying specific internal
services, as he undertook this task in his study of evaluating the relationship between internal
service quality, internal customer satisfaction and internal customer retention. Further to this, Stauss
(1995) suggested that it is vital to identify different internal service types, as each internal service
differs with respect to its supply/demand characteristics. It is therefore possible that internal
customers consider particular quality dimensions as more important to them within some internal
services than in others. Perhaps even more significant, the importance of the quality dimensions
may vary in some cases according to the context in which an internal service is delivered. If
subsequent research demonstrates this, it would indicate that organisations need to consider the
importance of quality dimensions in relation to each specific internal service and its situational
component (eg. formal training), and not just for each generic internal service category (eg.
training).
3.5 Summary and Research Questions Many pertinent questions and issues emerged throughout this literature review. They related to the
strong link between an organisation’s internal and external environments; the importance of
frontline employees to service organisations; the nature of the support frontline employees receive;
the notion of all employees being internal customers; the service quality gaps that exist both in an
internal and external organisational context, and the parallels that exist between these gaps in both
contexts; the similarities between the criteria that both internal and external customers use to
evaluate service quality; the notion of adapting internal service delivery to meet the needs of
internal customers; and, the concept of classifying internal services with common traits – like
external services – into categories. While all of the topics mentioned above are worthy of further exploration, it is apparent that internal
service quality and the frontline employee role are two important areas in need of further research.
Other than Frost and Kumar’s (2001) study of internal service quality at an international airline,
such studies with a specific focus frontline employees have been virtually non-existent. Authors
have also been reluctant to define and properly classify the internal services typically delivered to
frontline employees, with most characterizing them broadly as “backstage support”. In addition,
little literature exists that has explored frontline employees’ work needs, and whether they differed
across workplace situations. Several authors have indicated however that some internal services

43
need to be adapted and tailored to fit internal customer needs (e.g. Davis, 1993). In consideration of
current research evaluated in this literature review, it is proposed that internal service delivery may
need to be customized in certain workplace situations in order to meet the job needs of frontline
employees. In other words, it is suggested that while frontline employees’ job needs might be
similar across some internal services, key differences may exist in others, and that these similarities
and differences could act as the basis for classifying internal services into categories, which could
provide guidelines for internal suppliers as to how internal service delivery should to be
approached. This subject area is extremely relevant in light of the rapid growth within the service sector in
Australia, which has led to the heightened status of frontline employees as vital competitive assets.
Service organisations have been challenged to understand the needs of frontline employees in order
to equip them with the tools needed to provide superior service to external customers, and inturn
gain a competitive advantage over their rivals. It is therefore fitting that further research into these
aspects of service organisations be extended in the manner proposed. It is proposed that an effective means of exploring the issue of internal service customization in the
context of the frontline employee role could involve the use of an adapted set of external service
quality dimensions (Parasuraman, Zeithaml and Berry, 1985, 1988). Note that Frost and Kumar
(2001) were successful in incorporating adapted external service quality dimensions into their study
on internal service quality. For the purposes of this study, the dimensions would be applied to gain
frontline employees’ perceptions of their relative importance to them in different workplace service
situations. It is proposed that insights resulting from such a study would provide the basis for
indicating how internal services need to be customized and classified in order to best meet frontline
employees’ overall job needs. The study’s first research question designed to focus on this issue is:
Research Question 1: How do frontline employees perceive the importance of internal service
quality dimensions within each of the internal services identified?
Authors such as Berry, Parasuraman and Zeithaml (1994) discussed the importance of internal
research within service organisations, suggesting that it is essential to measure internal service
quality, as it ultimately affects external service quality. Gaining frontline employees’ perceptions of
internal service quality in different workplace situations could not only provide an indication of the
extent to which their work needs are being met, but also offers an opportunity to obtain additional

44
insights into what is important to them when consuming each internal service. The second research
question was constructed to explore this issue as follows:
Research Question 2: How do frontline employees perceive the overall quality of delivery of each
of the internal services identified?
Authors that discussed the general internal marketing philosophy (e.g. Berry and Parasuraman,
1991; Rafiq and Ahmed, 2000) agreed that the key to external marketing success was through
meeting the needs of internal customers, and in particular frontline employees. While all internal
services seem to play a role in satisfying frontline employees work needs, it is proposed that some
are more important to them than others, in terms of increasing their ability to generate revenue for a
service organisation. If this is in fact true, it could provide another basis for internal service
classification, as distinguishing between those internal services of high and low importance to
frontline employees vis-a-vis revenue generation could help managers to make more prudent and
informed decisions with regard to allocating organisational resources. This could also facilitate a
greater understanding of the impact of internal marketing on a service organisation’s bottom line.
The third research question was designed to investigate this issue:
Research Question 3: How do frontline employees perceive the importance of each of the internal
services identified, in terms of increasing their ability to generate revenue for the organisation?
It is also important to acknowledge here that the intent of the study is to explore these research
questions in a very focused manner. The key area of concern is to identify and study the internal
services themselves that impact on frontline employees in undertaking their roles. Relational issues
with supervisors and other internal suppliers will be reported as they pertain to internal services, but
will not be an explicit line of enquiry in this study.
The next chapter provides a detailed description of the methodology undertaken to explore the
study’s three research questions. It also includes an outline of the research plan, a justification of
each methodological approach, a description of the sampling process, ethical considerations, and a
brief overview of the data analysis process.

Chapter
4
45
4.0 Methodology
This chapter will provide a discussion and justification of the methodological approach undertaken
to collect data related to the three research questions. An outline of the research plan has been
provided by way of giving an overview of the whole study. This is an important preliminary step, as
“a thorough description of the whole process, enabling conditional intersubjectivity, is what
indicates good quality when using a qualitative method” (Stenbacka, 2001, p. 552). The justification
for the qualitative approach follows thereafter.
4.1 Research Plan
The research plan developed included three distinct phases, with each one involving a series of
subcomponents (Figure 4.1.1). Adherence to the research plan was imperative, as it facilitated the
collection of information required to thoroughly answer the study’s three research questions as
follows:
Research Question 1: How do frontline employees perceive the importance of internal service
quality dimensions within each of the internal services identified?
Research Question 2: How do frontline employees perceive the overall quality of delivery of each
of the internal services identified?
Research Question 3: How do frontline employees perceive the importance of each of the internal
services identified, in terms of increasing their ability to generate revenue for the organisation?
Phase 1 was implemented to fulfil two clear objectives. Firstly, to uncover the internal services
delivered to frontline employees in the chosen research setting, and secondly, to determine which
internal service quality dimensions were most relevant to their overall job roles.

46
The data collected from Phase 1 was used to inform the design of the online survey in Phase 2. The
survey was then administered to collect information that provided comprehensive insights into the
study’s three research questions. Phase 3 involved investigating the descriptive data collected from the online survey according to the
study’s three research questions. The program used to design and administer the online survey
generated automatic data reports, which effectively streamlined the information collected about
each identified internal service, thereby making the analysis of data less time consuming.
4.1.1 Why this Research Plan and Approach? The issues of concern in this study are necessarily context based. That is, they relate to workplaces.
Generalisability is therefore not an objective, rather the purpose is to deeply explore the experience
of people in situ and from their input to secure greater insight into the issues at hand. To establish a baseline or foundation study of this kind a large scale case study was therefore
considered appropriate (Yin, 1994). Taking data of this kind from multiple organisations, where the
internal services active in each setting would vary would be inappropriate. Further, while accessing
data from multiple like organisations from the same industry might appear potentially appropriate,
in telecommunications the competitive nature of the business environment made this difficult to
contemplate. The variability of organisational structures and workplace cultures of different
companies further limits the value of accessing multiple site for such a study.
Statistical design approaches such as structural equation modelling and statistical analyses of survey
data are considered inappropriate tools and techniques for exploration of perceptions and ratings of
the kind proposed. The survey approach is considered suitable for collecting the volume of
responses desired, but the aim is not to seek causal relationships from the data. Rather, what is
relevant to the three research questions is descriptive data that can indicate the weight of importance
that staff collectively place on internal service quality dimensions, relative to the key internal
services operating in their workplace, coupled with their perceptions of the importance of internal
services in terms of revenue.
A tool for ascertaining the major internal services in the setting chosen, from the perspective of the
operational view of the company, was a key research design issue. Rather than asking management
for their list of internal services, it was considered important to observe the frontline in action, note
the key pieces of information, then to affirm the observational data and generate fresh insights
through a number of interviews.

47
Figure 4.1.1 Research Plan
PHASE 1
PHASE 2
PHASE 3
PHASE 4 PHASE
Observer-as-ParticipantTechnique
Pre-Survey Interviews
Develop Online Survey
Pre-test Online Survey
Revise Online Survey
Administer Online Survey
Data Analysis & Interpretation
Data Presentation & Discussion

48
4.2 Justification of Methodology A case study research strategy was adopted to explore the three research questions, using call
centres within a telecommunications organisation as the service environment location. This section
will provide a description of the case study approach; justify the research within call centres of a
telecommunications organisation, and discuss the rationale behind selecting a single-case design.
4.2.1 The Case Study Strategy The case study is one of several ways that research is conducted in the area of social science (Yin,
1994). Robson (1993) defined a case study as the “development of detailed intensive knowledge
about a single case, or of a small number of related cases” (p. 40). A case study strategy was
preferred in this instance because of the number of “how” and “why” questions being posed
(Robson, 1993; Yin, 1994). Also, there was a focus on a “contemporary phenomenon within some
real-life context” (Yin, 1994, p. 1). Eisenhardt (1989) suggested that case studies are particularly
well suited in areas where existing theory appears inadequate. The literature review in chapters two
and three demonstrated that internal service quality and frontline employees were areas lacking
sufficient theory. Further, Saunders, Lewis and Thornhill (2000) argued that a simple well-
constructed case study enables a researcher to challenge existing theory through a close
examination of the research issues.
A common misconception about case studies is that they are only useful as an exploratory tool and
that they can not be used to describe or test propositions (Platt, 1992). This standpoint is incorrect,
as case studies are much more than merely an exploratory strategy (Yin, 1994). Yin (1994) asserts,
by providing evidence, that case studies have traditionally been both descriptive and explanatory.
That point is particularly relevant to this case study, as its purpose was to not only provide an
exploratory insight, but also a descriptive insight into the specific internal services delivered to
frontline employees within a call centre setting, with implications for theory that serves to better
explain services marketing and management.
This case study involved both inductive and deductive processes. Perry (1998) stated that it is
difficult for any researcher to separate the two approaches, as one works in tandem with the other.
Thus, “both (prior theory and theory emerging from the data) are always involved, often
simultaneously…it is impossible to go theory free into any study” (Richards, 1993, p. 40). Miles
and Huberman (1994) also submitted that the two approaches are interdependent. The process of
building upon existing theory (inductive) and generating new theory (deductive) was demonstrated

49
during the development of the study’s three research questions (see Section 3.5) and will become
more apparent throughout the course of this chapter.
4.2.2 A Single-Case Design As stated by Romano (1989), “the literature recommending the use of case studies rarely specifies
how many cases should be developed” (p. 36). He goes on to state that this decision is left up to the
researcher to make. Similarly, Patton (1990) asserted that “there are no rules” for sample size in
qualitative research (p. 181). Yin (1994) was more specific with his assertions, in that he provided
guidelines as to when a single-case design is more appropriate than a multiple-case design. He
stated that single-case designs are suitable for an “unusual or rare case, the critical case and the
revelatory case” (p. 45). He added that “a multiple-case study can require extensive resources and
time beyond the means of a single student or independent research investigator” (p. 45).
Yin’s latter statement is of particular relevance to this study, as the choice to adopt a single-case
design was in large part due to constraints on time and resources. It is also argued that this study
represents a critical case, as the single case chosen can confirm, challenge and extend existing
theory, while also helping to refocus future investigations in the academic field (Yin, 1994). It is
also revelatory, in that it exposes insights into internal services previously unexplored.
4.2.3 Why a Telco Call Centre? A call centre was seen as an appropriate research setting for a number of reasons. For instance,
Dobbins (1996) argued that call centres are now an important source of competitive advantage for
service organisations. She added that an increasing number of organisations are now using call
centres as a means of integrating their services and sales functions, which in turn allows customers
to make contact in real-time irrespective of their geographic remoteness. In addition, Frenkel, Tam,
Korczynski and Shire (1998) stated that little research has been undertaken on the human resource
aspects of call centres.
The call centres selected as the location for this research, function within the Australian
telecommunications industry. Evidently, that industry had been the focus of very little research,
which is surprising considering that the fastest growing service industry in Australia, in terms of
output, was communications (McLachlan, Clark and Monday, 2002). Krios (2001) was among the
few researchers that completed an exploratory study in a call centre in a telecommunications
organisation, which provided an insight into the factors affecting frontline employees’ ability to
deliver service to customers. Similarly, Sergeant and Frenkel (2000) undertook part of their

50
research in a telecommunications call centre to investigate issues relating to the capacity of frontline
employees to satisfy external customers. It was important that research focusing on frontline
employees be extended further within the rapidly growing and highly competitive
telecommunications industry, as better understanding frontline employees’ needs would provide an
opportunity for service organisations to gain a competitive advantage over their rivals. Pettigrew
(1988) touched on the issue of case selection by stating that cases should be chosen where the
process of interest is “transparently observable”. The call centre environment was therefore
considered ideal for this study.
4.3 The Sampling Process As described by Robson (1993, p. 155), the sampling process for a case study involves making
decisions about the following, all of which were addressed for this case study:
Who: Which persons are observed, interviewed, etc.?
Where: In (or about) which setting/s are data collected?
When: At what times?
What: Which events, activities or processes are to be observed, etc.?
This section will deal specifically with the who element, detailing the subjects involved in the
observation process, pre-survey interviews and survey distribution as per phases 1 and 2 of the
research plan (Figure 4.1.1). Yin (1994) stated that it is important that those included in the sample
are distinguished from those outside it. It is for this reason that the sample will be defined first in
general terms.
A subpopulation of 503 frontline employees was selected as the sample for this case study. The
subjects worked during evenings (5-9pm) at two different call centres, which were located in
different states (Melbourne and Adelaide). Despite the different geographical locations, both
portions of the sample fulfilled identical job roles. Selecting two locations created the potential for
comparisons post data collection. A useable sample of 301 resulted.
A subpopulation of frontline employees was sampled for one distinct reason. Casual observations
(Yin, 1994) by the researcher revealed that “night” sales teams and “day” sales teams operated and
functioned identically to one another; they underwent the same training, used the same systems and
processes and had identical job descriptions. It was therefore reasonable to assume that a
representative insight into the organisation and specifically the call centres would emerge as a result

51
of studying a subpopulation as opposed to the total population. Coincidently, this approach also
suited the call centre’s management, who for business-related purposes preferred the research to
occur at night.
Before the sampling process is discussed further, it is important to clarify that this study is based on
theoretical sampling (Glasser and Strauss, 1967). In other words, the case was selected for
theoretical, not statistical reasons, thereby rendering this research exclusive to the location studied
and not generalisable to the population. Yin and Heald (1975) reflected on this issue by stating,
“each case study may provide rich insights into a specific situation, it is difficult to generalise about
the studies as a whole” (p. 371). The purpose in this study was therefore “not to represent the world,
but to represent the case [authentically]” (Stake, 2000, p. 448).
4.3.1 Phase 1 – Identification of Internal Services and Service Quality Dimensions As demonstrated by Figure 4.1.1, Phase 1 consisted of two methodological approaches –
observation and interviews.
Observation This phase of the research plan involved observing frontline employees performing their normal
day-to-day work functions. The observation process was aimed at identifying the internal services
frontline employees encountered, coupled with uncovering the service quality dimensions most
relevant to their overall job roles. This information was then used to inform the survey design as per
Phase 2 of the research plan. The observation process continued with a mix of day and night shifts,
to the point where it became clearly repetitious and lacking of any new insights. It played a vital
role in helping to identify twelve internal services in total. Furthermore, using the ten external
service quality dimensions identified by Parasuraman, Zeithaml and Berry (1985) as the basis, the
observation period uncovered that seven in particular were most relevant to the internal call centre
environment.
Pre-Survey Interviews The pre-survey interviews involved 11 frontline employees that worked at the Melbourne call
centre. This step was undertaken to help strengthen the construction of the survey (Phase 2). The
researcher verified the internal services identified throughout the observation process, and
uncovered additional internal services that had not been observed. In addition, the researcher
discussed the service quality dimensions he felt were of most relevance to the frontline employee

52
role in general, and searched for additional insights. A deliberate effort was made to recruit
informants that had worked at the call centre for at least two years, as the researcher believed
longer-serving employees would be better equipped with the type of knowledge being sought. Yin
(1994) argued that “key informants are often critical to the success of a case study” (p. 84).
Informants were recruited through the assistance of the call centre’s management, who sent an
email to all frontline employees from the subpopulation that worked at the Melbourne call centre. A
response was requested from those interested in taking part in the interviews. The researcher
therefore allowed self-selection sampling (Saunders, Lewis and Thornhill, 2000) to occur here, in
that the frontline employees who responded favourably to the email were accepted as informants
provided they fulfilled the prerequisite work experience.
4.3.2 Phase 2 – The Online Survey The total subpopulation of 503 frontline employees was sent an email, which contained a URL that
directed them to the webpage that housed the online survey. It was sufficient that the sample
consisted exclusively of frontline employees that worked during evenings, as it facilitated the
amount of data necessary to provide comprehensive insights into the case and the three research
questions. A total of 334 surveys were completed, with 301 of them useable. The rationale behind
choosing to sample a subpopulation as opposed to the total population was addressed earlier in
Section 4.3.
4.4 Data Collection Methods This section will provide a more detailed description of the various data collection methods adopted
for the case study. They included observation, interviews, and an online survey. Before reviewing
and justifying the use of these methods individually, some advantages of using a multi-method
approach will be discussed.
4.4.1 A Multi-Method Approach Yin (1994) suggests that a major strength of case study research is the opportunity to access various
sources of evidence. This view is reinforced by Robson (1993) who noted that “there is no rule that
says that only one method must be used in an investigation” (p. 290).
This case study employed a number of data collection methods by necessity, but also due to the
clear benefits a multi-method approach offered. Saunders, Lewis and Thornhill (2000) described

53
two major advantages to employing multiple methods in the same study. First, one method may act
as an enabler to another. Robson (1993) referred to this as the complementary purposes model. For
example, in this study observation techniques were used to identify the internal services and service
quality dimensions to be included for investigation within the online survey. The observations gave
the researcher confidence that the most important issues were being addressed (Saunders, Lewis and
Thornhill, 2000).
Saunders, Lewis and Thornhill (2000) stated that the second major advantage of using a multi-
method approach is that it makes it possible for triangulation to occur. In other words, using various
methods ensured that the data collected was interpreted correctly. For example, in this study
interviews with frontline employees followed the observation process to ensure that the researcher’s
observations were accurate. Robson (1993) referred to this process as the reduction of inappropriate
uncertainty. As suggested by Smith (1975), each of the methods selected will have their own unique
strengths and weaknesses, thereby allowing the researcher to collect data from a variety of angles.
Each data collection method was selected for its ability to generate considerable amounts of
descriptive information. This was needed to capture the key aspects of the frontline employee role
and in turn comprehensively inform the study’s three research questions. The overall design of the
study was therefore centred on providing exploratory and descriptive insights into a specific case,
rather than generalisability, and to this extent it was not appropriate to apply any statistical
techniques or packages.
4.4.2 Phase 1 – Observation As mentioned earlier, observation techniques were implemented to gain insights into two specific
areas; firstly, the various internal services delivered to frontline employees from day-to-day, and
secondly, the service quality dimensions of most relevance to their overall job roles. Observation
was seen as the ideal tool for uncovering this descriptive information, and to subsequently inform
the survey questions for Phase 2 of the research plan. The primary justifications for choosing to
employ observation techniques are discussed below.
Observation techniques are closely associated with a case study methodology (Yin, 1994). Adler
and Adler (1994) stated that observation is “the fundamental base of all research methods” and
regarded it as becoming “the most powerful source of validation” (p. 389). The observer-as-
participant technique was used here, in that the researcher acted as a ‘spectator’ (Saunders, Lewis
and Thornhill, 2000) to the various exchanges and interactions had by frontline employees on a

54
daily basis. Robson (1993) described the observation of key participants and their activities as
descriptive observation, as opposed to a narrative account. Angrosino and Mays de Pérez (2000)
described the observer-as-participant approach as being an acceptable compromise against using
other observation techniques such as the complete participant technique. Adler and Adler (1994)
advocated the observer-as-participant approach by stating that it allows the researcher to interact
“casually and nondirectively” with subjects, whereby a researcher remains a researcher and does not
cross the line by becoming friends with the subjects.
An integral component in successfully implementing the observer-as-participant technique relates to
the researcher divulging his/her role to all subjects. This can in many cases (see Barley, 1989)
create problems if some subjects do not trust the researcher. Fortunately in this instance, the
researcher’s previous links to numerous members of the group was quite advantageous, as it
appeared to provide what Loftland (1971) referred to as “pre-existing relations of trust”.
Conducting the Observations - When, Where and How? The observation process was undertaken at the Melbourne call centre during the subpopulations’
normal work hours (5-9pm). The researcher allocated extensive periods of time towards observing
all of the sales teams that operated there. The researcher took detailed notes of what he observed,
which included what happened and what was said. Keeping a diary was seen as a “good way of
doing this” (Saunders, Lewis and Thornhill, 2000, p. 225). Diary keeping allowed the researcher to
access recorded notes post-observation for the purpose of identifying internal services and isolating
the service quality dimensions most relevant to the frontline employee role. For example, a diary
note that described a supervisor answering a question for a frontline employee while a telephone
customer was placed ‘on hold’ was easily interpreted post-observation, and ultimately became
characterized as the internal service “Customer on Hold”.
When necessary the researcher also engaged in informal discussions with frontline employees and
supervisors in order to clarify what was observed (Robson, 1993). “Informant verification” was an
important step towards rendering the observations reliable and acted as a form of triangulation
(Saunders, Lewis and Thornhill, 2000). Reliability and triangulation was further enhanced through
the pre-survey interviews that followed the observation process. This will now be discussed.

55
4.4.3 Phase 1 – Pre-Survey Interviews Semi-structured interviews with frontline employees were held at the conclusion of the observation
process. They were informal, but important and conducted for the purpose of not only verifying the
earlier observed internal services, but also to uncover any additional internal services, and to discuss
the service quality dimensions most relevant to the frontline employee role.
The interviews were “focused” (Merton, Fiske and Kendall, 1990) as opposed to “open ended”.
Focused interviews are similar to open-ended interviews in the sense that they assume a
conversational manner; the main distinction lies with the tendency for a focused interview to follow
a set of questions derived from a case study protocol (Yin, 1994).
“Interviews carried out for research or enquiry purposes are a very commonly used approach”
(Robson, 1993, p. 228). Yin (1994) argued that interviews are an essential source of evidence
because case studies deal so extensively with human affairs. Janes (2001) submitted that “most
authors agree that the face-to-face interview method can get you the best, highest quality data” (p.
421). Yin (1994) characterised the major purpose of a focused interview as, “simply to corroborate
certain facts that you already think have been established” (p. 85). Hence, the fundamental purpose
of conducting focused interviews in this case study was to do exactly as Yin described – corroborate
certain facts, thereby promoting reliability and triangulation. It was important for the researcher to
ensure that questions were casually worded, as acting naïve about the topics helped the respondent
to provide fresh insights as opposed to being led (Yin, 1994). This meant avoiding the use of long
questions, double-barrelled questions, questions involving jargon, leading questions and biased
questions (Robson, 1993). Using interviews also facilitated the essential process of probing
respondents when certain facts were not entirely clear, something not possible when using emailed
and other self-administered questionnaires (Robson, 1993).
Conducting the Interviews - When, Where and How? The interviews with frontline employees were conducted at the Melbourne call centre during their
normal work hours (5-9pm). All interviews occurred in a conference room commonly used by the
call centre’s management to conduct business meetings. Each interview took approximately 30
minutes to complete. The duration of interviews was carefully considered, as an interview greater
than about 45 minutes “gets tedious and people can become restive” (Janes, 2001, p. 421).
Interviewees were briefed on the subject matter prior to interviews, thereby helping to promote
validity and reliability through enabling them to gain an understanding of the information being

56
requested (Saunders, Lewis and Thornhill, 2000). To ensure the interview process was successful,
the researcher took measures such as practising the interviews, ensuring dress and level of formality
were appropriate and confirming dates, times and places with interviewees (Lincoln and Guba,
1985). All interviews were recorded on audio tape to help with the accuracy of the interpretation
and analysis of the information gained.
4.4.4 Phase 2 – Developing the Survey The development of a survey was seen as the most critical component of the research plan, as the
results emerging from it would fundamentally inform the case study’s three research questions. The
survey was therefore designed to present data in relation to three key areas:
1. Frontline employees’ perceptions of the importance of internal service quality
dimensions within each of the internal services identified.
2. Frontline employees’ perceptions of the overall quality of delivery of each of the
internal services identified.
3. Frontline employees’ perceptions of the importance of each of the internal services
identified, in terms of increasing their ability to generate revenue for the organisation.
The internal service quality dimensions that emerged from conducting the observations and pre-
survey interviews were most closely aligned with Parasuraman, Zeithaml and Berry’s (1985)
original ten external service quality dimensions. Seven in particular were deemed to be most
relevant and were subsequently adapted for use in the survey:
1. Reliability
2. Responsiveness
3. Competence
4. Access
5. Communication
6. Understanding (the customer)
7. Tangibles
The observation process and pre-survey interviews suggested that the remaining three dimensions –
Courtesy, Credibility and Security – were not at the core of those internal services being
investigated, although their significance to other situations outside of this study is acknowledged.

57
This is somewhat different to the approach undertaken by Frost and Kumar (2001), who adapted
Parasuraman, Zeithaml and Berry’s (1988) five external service quality dimensions in their study of
internal service quality. The observation process and pre-survey interviews indicated that the range
and diversity of internal services being investigated demanded a more specific and all-
encompassing set of dimensions. Jevons and Pidgeon (2001) undertook a similar strategy in their
study after seeking the advice of Dr. Parasuraman, who stated in a personal communication to them,
“the original definitions are more detailed and specific and as such may be easier to articulate to the
survey respondents” (p. 89).
In addition, the observations and interviews uncovered twelve internal services that related to the
frontline employee role. They were subsequently characterized as follows:
1. Formal Training
2. Online Training
3. Customer on Hold
4. Team Briefs
5. Emails
6. Management Presentations
7. The Intranet
8. Systems Support
9. Computer Programs
10. Call Monitoring and Feedback
11. Rewards
12. Performance Feedback
A detailed description of these internal services and the internal service quality dimensions has been
provided in chapter five (Presentation of Results). The process of analysis of the observational notes
and interview transcripts is discussed in Section 4.5.
Survey Type A number of factors influenced the decision to apply a web-based online survey method (see
Appendix 1 for sample survey). As noted by Ilieva, Baron and Healey (2002), academics and
practitioners from mainstream disciplines such as marketing have become particularly interested in
the implementation of online data collection methods. This is largely due to online surveys being
much cheaper to administer than paper-based surveys; they generate much faster response rates;

58
they are considerably easier to deliver to participants, especially when participants are located in
different geographical locations; they allow data to be processed and interpreted faster and easier,
since they can be downloaded to a spreadsheet, data analysis package or database; they facilitate
straightforward error checking; and, they allow the use of pop-up instructions and drop-down boxes
if required (Mehta and Sivadas, 1995; Schaefer and Dillman, 1998; Schaefer, 2001; Zanutto, 2001).
While all of the advantages noted above were pertinent to this case study, two in particular were
most salient. The first related to the ability of online surveys to reach a wide audience, irrespective
of their geographical location. This was extremely relevant in this instance due to participants being
located at two different call centres in two different states. An online survey method eliminated the
need for the researcher to be present at both locations to distribute the surveys. Rather, the
researcher was able to send both sets of participants an email with a URL that redirected them to the
webpage that contained the survey, thereby not disadvantaging any group.
The second key benefit of an online survey method most important to this case study related to the
amount of time saved on data entry and analysis. Because the program used to create and administer
the online survey generated automatic data reports, this meant that valuable time was not consumed
entering data into spreadsheets etc. Rather, the automatically generated data tables could be easily
copied and pasted into both Microsoft Excel and Word for immediate analysis.
A web-based online survey method was preferred over an email survey method for a number of
reasons. As discussed by Dommeyer and Moriarty (2000), email surveys have the potential to
infringe personal privacy and security, as responses can easily be traced back to their senders. On
the other hand, web-based survey responses cannot be linked back to individual participants, and
therefore create complete anonymity. Emails surveys also allow for little flexibility in terms of font,
layout and colour, which can discourage prospective participants (Schuldt and Totten, 1994), while
web-based surveys have the potential to generate more interest through being more vibrant and
animated.
General Survey Design Gaddis (1998) asserted that online surveys were effective when researchers applied the same
principles used in the design of traditional surveys. These included thoroughly pre-testing questions
before administering the survey; preparing an introduction for the survey that generated interest and
cooperation from participants; using filtered questions where appropriate; dividing long surveys
into sections; using open-ended questions sparingly; and, offering incentives for people to respond.

59
These recommendations were followed closely in the designing the online survey for this case
study.
Authors such as Dillman, Tortora, and Bowker (1998) and Zanutto (2001) offered similar
suggestions to those of Gaddis (1998), while also providing some other useful advice. This included
giving participants an estimated time that it will take to complete the survey, limiting line length
and providing participants with instructions for necessary computer actions.
It was also important that the “language” used in the survey was carefully considered. Redline and
Dillman (1999) stated that web-based surveys were presented in several languages – textual,
graphic and numeric. Couper (2001) was more specific, and included features such as font size, font
type, colour, layout and symbols. He indicated that all aspects played an important role, although it
was most critical that visual language not be overused, as it could detract attention from text and
compromise the meaning of words. This suggestion was also applied in designing the online survey
for this case study.
Question Type
Following the advice of authors such as Gaddis (1998), open-ended questions were used relatively
sparingly in the online survey, whereas closed questions were principally used. While the use of
closed questions has its clear shortcomings (De Vaus, 1995), open-ended questions are renowned
for being far more challenging and problematic (Zikmund, 1997). They have been found to often
lack reliability and validity, yield irrelevant responses, often fail to produce responses that indicate
the intensity of an attitude, and it is much easier for researchers to make coding or interpretation
errors with open responses (De Vaus, 1995; Schuman and Presser, 1996; Neuman, 1997). It is for
these reasons that open-ended questions are rarely used in comparison to closed questions for this
type of data collection (Zimmer and Golden, 1988; Chowdhury, Reardon and Srivastava, 1998).
Some advantages of using closed questions over open-ended questions include:
They are quicker and easier for respondents to answer (De Vaus, 1995).
Respondents are known to answer questions more reliably when response alternatives
are provided (Fowler, 1993; Malhotra, Hall, Shaw and Crisp, 1996).
They are easier to compare against one another because of their predetermined nature
(Schuman and Presser, 1981; Saunders, Lewis and Thornhill, 2000).

60
A constrained number of categories increase the likelihood that there will be enough
respondents giving any particular answer to be analytically interesting (Fowler, 1993).
They do not discriminate against the less expressive and inarticulate respondents
(Fowler, 1993).
While closed questions appear to be clearly more advantageous than open-ended questions, open-
ended questions were incorporated into the online survey to help generate further insights into
participants’ closed question responses. They were also used as a means of generating fresh ideas
from participants, and to break-up the monotony of the survey, which had asked participants
identical closed questions about each of the twelve internal services.
Scale Type Likert scales were primarily used so that respondents could indicate the strength of their responses
to questions about their perceptions about internal services, in the three key areas delineated at the
beginning of this section. A ranking scale question and two open-ended questions were also used in
relation to each of the twelve internal services. Likert scales are the most widely used ordinal scale
among survey researchers (Orlich, 1978; Cooper and Emory, 1995). The main reason for this is that
Likert scales produce responses that exhibit sound reliability and validity (Spector, 1992). Likert
scales are also mutually beneficial for both researcher and respondent, as they are not only easy to
administer but also simple to complete (Foddy, 1993; Neuman, 1997; Zikmund, 1997).
Existing or Original Scales
The question of whether to use existing or original Likert scale labels (e.g. important/very
important) is a complex one. On the one hand, it is logical to assume that scales borrowed from
previous studies will produce higher reliability and validity. Research has proven, however, that this
can not always be assumed (Churchill and Peter, 1984). Perhaps the most distinct advantage of
using existing scales as compared to original scales relates to the time and effort they can save a
researcher (De Vaus, 1995).
Cooper and Emory (1995) advocated the use of existing scales with a degree of apprehension. They
felt that the tools of data collection need to be adapted to the problem, not vice versa. In essence,
they meant that existing scales should be used only when contextually applicable, and that an
original scale must be developed when an existing scale does not aptly fit the question being asked.

61
This advice became extremely valuable in evaluating various scales for this study. Fortunately –
after thoroughly researching a number of previous studies and questionnaire design texts (e.g.
Frazer and Lawley, 2000) – existing scales were found that could be appropriately incorporated into
the survey without at all compromising the overall survey design.
Number of Scale Points
Some researchers have argued that reliability and validity increases as the number scale points
increase (Nunnally, 1978; Andrews, 1984), with reliability reaching its optimum level at about the
seventh point (Nunnally, 1978). Similarly, Finn (1972) compared respondents’ use of three, five,
seven and nine-point scales and found seven-point scales to be best. Moreover, Matell and Jacoby
(1972) reported that the percentage of ‘uncertain’ responses decline as the number of scale points
increase. Specifically, with two to five categories, an average of 20 per cent of respondents selected
the midpoint ‘uncertain’ category. This percentage dropped down to a mere 7 per cent when seven
to nine scale points were presented to respondents.
On the other hand, numerous studies have found the ideal number of scale points to lie between five
and nine (Cox, 1980; Givon and Shapira, 1984). Elmore and Beggs (1975) determined that a five
point scale is as reliable as a nine point scale, while Albaum (1997) found that as few as three points
will deliver retest reliability, concurrent validity and predictive validity.
Based on the evidence presented, there are differing points of view regarding the number of scale
points needed when applying a Likert scale, to produce a robust survey design. Some experts were
adamant that seven point scales are best, while others claim the same reliability and validity can be
achieved with five scale points. As a result, the researcher decided to apply five-point scales in the
online survey.
Odd or Even Number of Points The use of a five-point scale implied the inclusion of a midpoint, which typically represents a
neutral or “no opinion” position on a Likert scale (Orlich, 1978). A considerable body of literature
endorsed the use of midpoints for a number of reasons. Midpoints not only allow subjects to feel
more comfortable when submitting responses, but also facilitate the measurement of neutral
reactions (Nunnally, 1978). Although research has shown no significant difference between results
when using an even or odd scale (Kinnear and Taylor, 1996), it is recommended that a midpoint
scale be used when the choice exists for a researcher (Malhotra, 1999). This will consequently help

62
minimise random or systematic error (Schuman and Presser, 1996), as respondents have been
known to express opinions on fictitious objects when forced to make a choice (Nunnally, 1978).
Ranking Questions The ranking questions were applied to gain further insights into participants’ perceptions of
importance of the seven service quality dimensions. They supplemented the Likert scale questions
that asked participants to rate the importance of each of the seven service quality dimensions.
Evidently, the ranking questions produced a small amount of responses errors, which were
identifiable through the program that generated the data reports. In viewing each individual survey
response, it was noted that approximately 7% of responses were completed incorrectly (see
Appendix 1 – survey questions 3, 9, 15, 21, 27, 33, 39, 45, 51, 57, 63 and 69). As a result, these
responses were removed from the data set in order to maintain the integrity of the data.
Question Sequence A considerable amount of time was spent planning the order and flow of questions. It was important
that questions followed a sequence that was logical for the respondents, as opposed to following an
order that primarily suited the researcher (Saunders, Lewis and Thornhill, 2000). The length of the
survey demanded that questions be grouped into separate sections (De Vaus, 1995; Gaddis, 1998),
whereby each section of questions explored participants’ perceptions about a different internal
service. The same set of six questions were asked in relation to each of the twelve internal services
in order to facilitate comparisons that would thoroughly inform the case study’s three research
questions.
Number of Items The number of items becomes a salient consideration when statistical generalisation is required.
That was of little consequence here though, as the survey and the study at large was designed for
theoretical reasons rather than statistical analysis purposes. The main consideration was to collect
data to address all three research questions, and keep the length of the survey reasonable, so as to
maintain respondent concentration and maximise completions.
Survey Length There has been much debate over the ideal length for a survey. Some authors have defined this in
terms of the time it takes respondents to complete (Cooper and Emory, 1995), whereas most have
advised researchers to use the number of pages as a guide (Dillman, 1978; Zikmund, 1997;

63
Neuman, 1997). Dillman (1978) reported twelve pages as being the optimal length, and that
anything longer would adversely affect response rates. Alternatively, Neuman asserted that as few
as four pages are ideal, while Zikmund (1997) saw a six page survey as being best.
De Vaus (1995) argued from a slightly unique perspective. He asserted that the more specialised the
population and the more relevant the topic, the longer the questionnaire can be and the less
important length becomes. The call centre subpopulation surveyed here was certainly specialised
and the topic was also extremely relevant to them. As a result, the researcher decided that it would
be acceptable to develop a survey that was slightly longer than advised by experts such as Dillman
(1978). The final tested version of the survey took respondents approximately 50 minutes to
complete.
Pre-testing
The pre-testing phase was designed to uncover evidence of ambiguous questions and respondent
misunderstanding. This enabled the researcher to gain an insight into the validity of the questions
and the likely reliability of the data that was to be collected (Saunders, Lewis and Thornhill, 2000).
Pre-testing is said to be most sound when the test sample and final sample are a close match (De
Vaus, 1995). Another view holds that surveys should also be screened with other research
professionals (Zikmund, 1997; Saunders, Lewis and Thornhill, 2000), as that group is usually
qualified to comment on the representativeness and suitability of questions. This not only works
towards establishing content validity (Mitchell, 1996), but also permits the researcher to make
amendments before screening the survey with subjects that fit a closer profile to the final sample.
Bell (1999) asserted that one must always make the time to conduct pre-testing, as there is no way
of knowing whether a survey will succeed otherwise. The amount of time available often dictates
the number of surveys that are pre-tested. Some experts recommend that between 75 and 100 test
surveys be distributed, whereas others suggested that anything above 10 is acceptable for smaller-
scale surveys (Fink, 1995). After considering that point in relation to the size of the subpopulation
in this case study, the researcher decided it was sufficient to distribute 12 test surveys. Research
professionals, coupled with frontline employees and supervisors from outside the subpopulation
took part in pre-testing the survey. Their feedback regarding aspects such as question wording and
survey length was carefully considered in preparing the final survey.

64
Distributing the Survey - When, Where and How?
Surveys were completed by participants during their normal work hours (5-9pm) on their personal
computers. The researcher understood that by administering the survey during employees’ normal
work hours, response rates as high as 98 per cent were potentially attainable (Saunders, Lewis and
Thornhill, 2000). All participants were briefed by either the researcher, or in the case of the
Adelaide call centre, by their supervisors prior to beginning the survey. They were provided with
information regarding the confidentiality of their survey responses and the likely time it would take
them to complete the survey. Furthermore, the researcher remained present for a short amount of
time to answer any questions participants had while undertaking the survey.
The online survey was delivered to participants via email, which contained a URL that redirected
them to a web-page that housed the survey. Each sales team received the email only minutes prior
to them being scheduled to begin the survey. This minimised the opportunity for participants to
view and discuss the survey beforehand, which may have compromised the authenticity of their
responses.
Once all surveys were completed, the data was downloaded into Microsoft Excel and Microsoft
Word for subsequent analysis and reporting.
4.5 Phase 3 – Data Analysis 4.5.1 Observational Notes and Interview Transcripts
It was critical that a sound process be undertaken to analyse the observational notes and interview
transcripts, as it would ultimately determine the robustness of the online survey in terms of its
relevance to the frontline employees that worked in the research setting chosen.
The analysis of observational data was initially conducted at a broad level, before seeking to
characterise and define the individual internal services delivered to frontline employees, coupled
with the internal service quality dimensions of most overall relevance to their role. The first level of
data analysis was therefore aimed at clustering or coding notes into broad themes (Miles and
Huberman, 1994). For example, initially a broad category was formed that included all notes
relating to interactions observed between frontline employees and their supervisors. Similarly,
another category created included observational notes that related to frontline employees use of
technology. These notes not only included what happened (e.g. “…frontline employee accessed
Intranet while talking with customer…”), but also interpretations of what appeared important and

65
relevant to the frontline employee at that moment, in terms of internal service quality (e.g.
“…frontline employee told customer he would double check the price of the product – relied on
Reliability of information on Intranet…”). This was done with an understanding that such
interpretations would be verified in subsequent interviews with frontline employees, that followed
the observation phase.
Following the formation of these broad categories, was the process of identifying individual internal
services within them, together with interpreting the service quality dimensions of underlying
relevance to the frontline employee role. Observational notes were itemized and collated into
smaller groups to enable differentiation between situations and encounters observed, which in turn
enabled the exposure of specific internal services relevant to the frontline employee role. This
process also facilitated the exposure of similarities and differences within each of the internal
services (or major themes) identified (Miles and Huberman, 1994; Yin, 1994).
A similar process was undertaken to determine the internal service quality dimensions of most
relevance to the frontline employee role in the setting chosen. While collating information on each
internal service, a concerted effort was made to highlight notes that could be linked to the services
quality dimensions used in previous studies (Parasuraman, Zeithaml and Berry, 1985, 1988; Frost
and Kumar, 2001). These previous studies therefore acted as a point of reference in helping to both
identify and label service quality dimensions within each internal service. While identifying
similarities and differences (Miles and Huberman, 1994; Yin, 1994) between internal services was
important in this context, the primary aim here was to validate a set of internal service quality
dimensions that were relevant across all identified internal services, whereby their individual
importance to frontline employees in each situation could be explored via the online survey.
A further key step in the analysis of observational data involved the researcher’s informal
discussions with frontline employees and supervisors to corroborate his interpretations of what was
recorded (Robson, 1993). This was important in terms of data reliability and triangulation
(Saunders, Lewis and Thornhill, 2000), which was further enhanced through the conducting of pre-
survey interviews. The analysis of pre-survey interview data was assisted through the transcription
of tape recordings of each interview. Rather than use electronic means, the data was sorted by the
researcher to enable better familiarization with the data and to facilitate the interpretation process
(Crabtree and Miller, 1992). The data was sorted into categories that corresponded to each internal
service identified during the observation data analysis, a process made easier by the fact that the
interview questions were structured in a way that addressed each internal service individually. It

66
was then a case of using the interview information to corroborate (or refute) the information
gathered and interpreted during the observation phase.
New categories were also created to accommodate internal services that had not been identified
during the observation process, but had emerged during the interviews (e.g. Management
Presentations; Formal Training). It was critical in these situations to probe respondents on specific
details of each internal service, including confirming the relevance of the already established
service quality dimensions to those situations. As new internal services emerged, the structures of
future interviews were amended accordingly. To ensure that the analysis of interview data related to
these newly identified internal services was valid and reliable, the researcher engaged in further
informal discussions with frontline employees and supervisors, for confirmation.
4.5.2 Online Survey Data As mentioned previously, descriptive data was sought for this study to provide a comprehensive
profile of the numerous internal services delivered to frontline employees in the research setting
chosen. Therefore, because neither statistical analysis nor generalisability was essential to answer
the study’s three research questions, the survey data was explored primarily through generating
descriptive statistics (percentages and means) and graphs of this data (Chapter 5). A study
framework has been offered that summarizes the theoretical basis for the case study, the structure of
the online survey and the subsequent stages that followed the data collection process. The
highlighted portions of Figure 4.5.1 show the topics of most relevance to this chapter.
It is also important here to describe the process that led to themes being drawn out from
participants’ qualitative comments. Understanding the complexity of qualitative data analysis
(Patton, 1990; Yin 1994; Stake, 2000), the researcher recognised the need for inter-rater reliability
to increase the validity of findings. To facilitate this, two academic colleagues were engaged to
independently interpret the online survey comments, which ensured that issues deemed by the
researcher to be raised consistently by respondents were either validated or invalidated through
other interpretive sources. All the themes subsequently reported in the study were agreed upon by
all three members of the group.

67
Figure 4.5.1 Study Framework – Methodology Stage
4.6 Ethical Considerations Prior to the commencement of data collection, the researcher was mandated to gain approval from
the Swinburne University ethics committee. This involved providing documentation that detailed all
of the data collection techniques that were to be deployed, along with any relevant dates and
protocols to be followed by the researcher. All guidelines and recommendations made by the
committee were carefully followed during the implementation of data collection techniques. This
helped to ensure that a high standard of ethical behaviour was being adhered to at all times. The
anonymity of respondents and the organisation studied was a salient issue that was guaranteed.
All responses and submissions made by participants were kept confidential by the researcher.
Participants’ identities were only requested during the study when necessary. For example,
informants’ identities were requested to enable the researcher to recontact them if required. They
were given prior notice in such instances, and granted the opportunity to decline. Management also
asked for the organisation’s identity to remain undisclosed.
4.7 Summary This chapter provided a comprehensive description of the methodologies undertaken to answer the
three research questions of the case study. The observations and interviews were critical in
Responsivenes
Access
Competence
Tangibles
Reliability
Communication
Understanding
Importance of 7 dimensions to FLE within each internal
service (Likert Scales)
FLE overall ratings of service quality within each
internal service (Likert Scales)
FLE rankings of 7 dimensions in order of importance within each
internal service
FLE comments on aspects of internal services
performed well/poorly (Text Boxes)
Importance of each internal service to FLE in terms of increasing their ability to
generate revenue (Likert Scales)
M A N A G E R I A L I M P L I C A T I O N S
Explore FLE perceptions of the importance of 7
dimensions within 12 internal services
Explore FLE ratings of service quality within 12 internal services
Couple FLE service quality
ratings with FLE comments
Explore FLE perceptions of the importance of 12 internal services
(impact on revenue)
Better understand the demand characteristics of
12 internal services
Online Training
Customer on Hold
Team Briefs
Emails
Management Presentations
Formal Training
Rewards
Computer
Programs
Call Monitoring and Feedback
Systems Support
Intranet
Performance Feedback
7 Internal Service Quality Dimensions Identified/Adapted
12 Call Centre Internal Services Identified
Understand which internal services were being delivered well/poorly
Infer possible reasons as to why FLE rated internal
services favourably/ unfavourably
Better understand how 12 internal services affect
FLE during their exchanges w/ customers
Explore FLE rankings of the 7 dimensions within
12 internal services
Online Survey Structure
T H E O R E T I C A L I M P L I C A T I O N S
FURTHER RESEARCH

68
informing the design and structure of the online survey. The online survey acted as the primary
source for informing the research questions, with 301 useable surveys resulting from both call
centres. Initially, two locations were selected to create the potential for comparisons; however,
because the differences in results were negligible, they were aggregated to create a more powerful
profile of the organisation studied. The large sample of frontline employees provided a thorough
insight into a range of issues related to internal service delivery, with their text comments in
particular offering numerous fresh themes and ideas. The next chapter will present the results from
the online survey, providing an in-depth profile of the twelve internal services in accordance with
the case study’s three research questions.

Chapter
5
69
5.0 Presentation of Results This chapter will present and discuss the descriptive data obtained from the online survey
completed by 301 frontline employees. The survey was comprised of 72 questions in total, in which
the same set of six questions were asked in connection to 12 unique internal services. A congruent
set of six questions were asked so that comparisons could be made more easily between the results
obtained on each internal service. Moreover, four of the survey questions produced descriptive
quantitative data, while the remaining two yielded qualitative data, obtained through participants
typing comments into text boxes. A description of all six survey questions has been provided below:
1. Using 5-point Likert scales, participants were asked to rate the importance (to them) of
seven internal service quality dimensions during the delivery of each of the 12 internal
services (Each dimension was defined to ensure greater consistency of interpretation).
2. Participants were asked to place the seven internal service quality dimensions in order of
their importance (to them) during the delivery of each internal service.
3. Using 5-point Likert scales, participants were asked to rate the overall quality of the
delivery of each internal service.
4. Using text boxes, participants were asked to comment on the aspects of each internal
service they felt were being performed well.
5. Using text boxes, participants were asked to comment on the aspects of each internal
service they felt required improvement.
6. Using 5-point Likert scales, participants were asked to rate the importance of each internal
service, in terms of increasing their ability to generate revenue for the organisation. Note: Respondents were asked to complete the survey questions relative to how they perceived that
their ability to perform their customer service/sales role was affected. The seven internal service quality dimensions included on the survey (Appendix 1) were described
for participants as follows, with minor adjustments to suit each service situation:

70
Reliability: The internal service provider supplies you with correct and consistent
information. Responsiveness: The internal service provider comes to assist you quickly when required. Competence: The internal service provider has the training and experience to do that job. Access: The internal service provider can be contacted or approached easily (if you
need to ask a question). Communication: The internal service provider speaks using language and terminology that
you can understand. Understanding: The internal service provider is sensitive to your work needs and
constraints. Tangibles: The internal service provider supplies you with paper-based reading
materials for extra support.
The results from these survey questions will be discussed throughout chapter five relative to the
study’s three research questions: Research Question 1: How do frontline employees perceive the importance of internal service
quality dimensions within each of the internal services identified? (e.g. Survey questions 2 and 3 –
Appendix 1) Research Question 2: How do frontline employees perceive the overall quality of delivery of each
of the internal services identified? (e.g. Survey questions 4, 5, and 6 – Appendix 1) Research Question 3: How do frontline employees perceive the importance of each of the internal
services identified, in terms of increasing their ability to generate revenue for the organisation? (e.g.
Survey question 7 – Appendix 1) The overall results will appear in 12 separate sections as they relate to each of the 12 internal
services identified, and will be presented under headings that correspond to these three research
questions. A description of each internal service has also been provided in accordance with the
information obtained from the observation and subsequent interviews with frontline employees,
which was undertaken prior to the survey’s construction.

71
The shaded boxes within Figure 5.0.1 illustrate how the content of this chapter contributes to the
overall study and its objectives. Figure 5.0.1 Study Framework – Presentation of Results Stage
Responsivenes
Access
Competence
Tangibles
Reliability
Communication
Understanding
Importance of 7 dimensions to FLE within each internal
service (Likert Scales)
FLE overall ratings of service quality within each
internal service (Likert Scales)
FLE rankings of 7 dimensions in order of importance within each
internal service
FLE comments on aspects of internal services
performed well/poorly (Text Boxes)
Importance of each internal service to FLE in terms of increasing their ability to
generate revenue (Likert Scales)
M A N A G E R I A L I M P L I C A T I O N S
Explore FLE perceptions of the importance of 7
dimensions within 12 internal services
Explore FLE ratings of service quality within 12 internal services
Couple FLE service quality
ratings with FLE comments
Explore FLE perceptions of the importance of 12 internal services
(impact on revenue)
Better understand the
demand characteristics of 12 internal services
Online Training
Customer on Hold
Team Briefs
Emails
Management Presentations
Formal Training
Rewards
Computer
Programs
Call Monitoring and Feedback
Systems Support
Intranet
Performance Feedback
Understand which internal services were being delivered well/poorly
Infer possible reasons as to why FLE rated internal
services favourably/ unfavourably
Better understand how 12 internal services affect
FLE during their exchanges w/ customers
Explore FLE rankings of the 7 dimensions within
12 internal services
T H E O R E T I C A L I M P L I C A T I O N S
FURTHER RESEARCH
12 Call Centre Internal Services Identified
7 Internal Service Quality Dimensions Identified/Adapted
Online Survey Structure
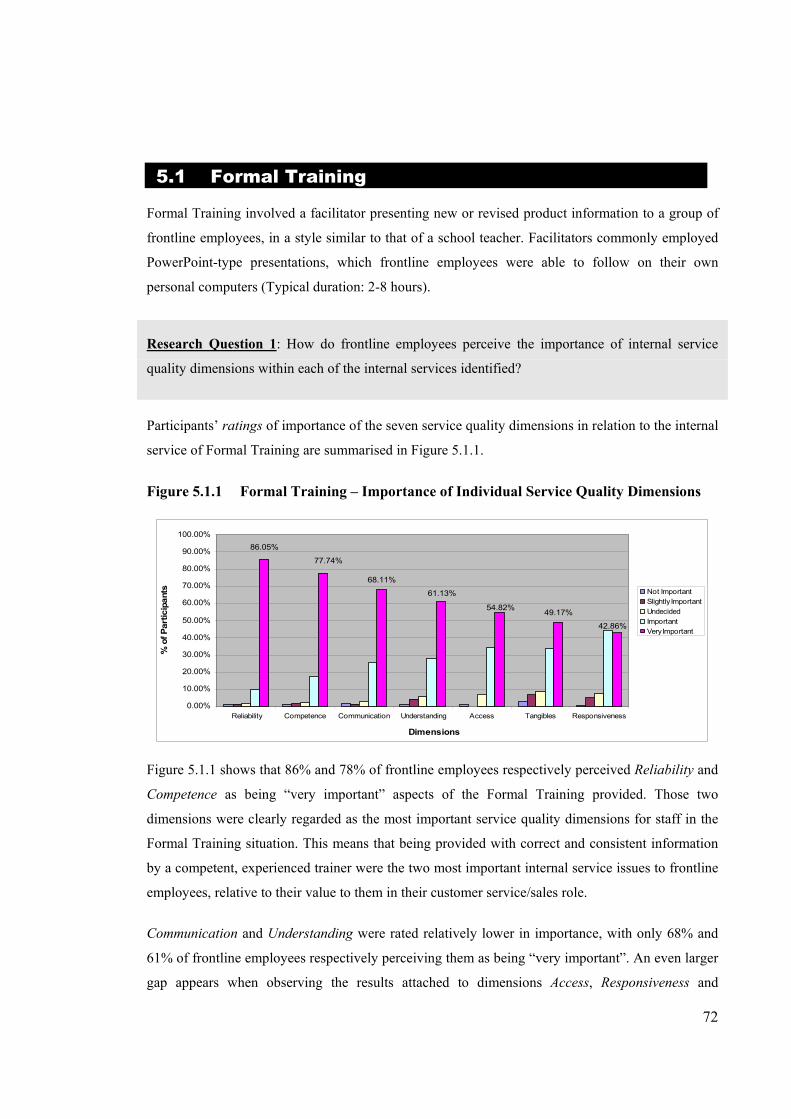
72
5.1 Formal Training Formal Training involved a facilitator presenting new or revised product information to a group of
frontline employees, in a style similar to that of a school teacher. Facilitators commonly employed
PowerPoint-type presentations, which frontline employees were able to follow on their own
personal computers (Typical duration: 2-8 hours).
Research Question 1: How do frontline employees perceive the importance of internal service
quality dimensions within each of the internal services identified?
Participants’ ratings of importance of the seven service quality dimensions in relation to the internal
service of Formal Training are summarised in Figure 5.1.1.
Figure 5.1.1 Formal Training – Importance of Individual Service Quality Dimensions
68.11%
49.17%54.82%
42.86%
61.13%
86.05%
77.74%
0.00%
10.00%
20.00%
30.00%
40.00%
50.00%
60.00%
70.00%
80.00%
90.00%
100.00%
Reliability Competence Communication Understanding Access Tangibles Responsiveness
Dimensions
% o
f Par
ticip
ants Not Important
Slightly ImportantUndecidedImportantVery Important
Figure 5.1.1 shows that 86% and 78% of frontline employees respectively perceived Reliability and
Competence as being “very important” aspects of the Formal Training provided. Those two
dimensions were clearly regarded as the most important service quality dimensions for staff in the
Formal Training situation. This means that being provided with correct and consistent information
by a competent, experienced trainer were the two most important internal service issues to frontline
employees, relative to their value to them in their customer service/sales role.
Communication and Understanding were rated relatively lower in importance, with only 68% and
61% of frontline employees respectively perceiving them as being “very important”. An even larger
gap appears when observing the results attached to dimensions Access, Responsiveness and

73
Tangibles, where 55%, 43% and 49% of participants respectively perceived them to be “very
important” during Formal Training sessions.
Figure 5.1.2 represents participants’ rankings of the seven dimensions in order of importance in the
context of receiving Formal Training (1st and 2nd rankings are shown1).
Figure 5.1.2 Formal Training – Ranked Dimensions (1st, 2nd)
50%
13.93%
44.28%
11.43%
36.78%
32.14%
11.42%
0.00%
5.00%
10.00%
15.00%
20.00%
25.00%
30.00%
35.00%
40.00%
45.00%
50.00%
% o
f Par
ticip
ants
Reliability Competence Communication Understanding Responsiveness Access Tangibles
Dimensions
2nd Most Important
Most Important
Figure 5.1.2 largely corroborates the results depicted by Figure 5.1.1, in that Reliability and
Competence were ranked as either the first or second most important dimension during Formal
Training by the highest percentage of frontline employees. 50% of frontline employees ranked
Reliability as being either the first or second most important dimension during Formal Training.
Similarly, 44% of respondents perceived Competence as either the first or second most important
dimension during Formal Training. Communication and Understanding had approximately a third
of respondents (37% and 32% respectively) rank them as either first or second in importance.
Responsiveness, Access and Tangibles were ranked either first or second by 14%, 11% and 11% of
respondents respectively, and were therefore regarded as the three least important dimensions
relative to the Formal Training internal service.
Participants’ Overall Ratings and Rankings (Means) Participants’ highest ratings of importance (Figure 5.1.1) and highest rankings of importance
(Figure 5.1.2) indicated that they were very decisive in determining how important each of the
seven dimensions was to them, in terms of their impact on their job effectiveness. In order to
1 Participants commented while completing the survey that they perceived some dimensions as being of equal importance, and thus found it difficult to rank them in order of importance. Their 2nd rankings were displayed for this reason, as many 2nd ranked dimensions were just as important to some participants as the dimensions they ranked as 1st important.

74
provide a more comprehensive indication of the dimensions frontline employees perceived as most
important to them when receiving Formal Training, their overall ratings and rankings were
incorporated into Figure 5.1.3. Participants’ mean importance ratings (1-5) were plotted against
their mean importance rankings (1-7) for each of the seven dimensions, using the average of the
seven mean importance ratings (4.47) and the average of the seven mean importance rankings (4)2
as the graph’s x-y intercept point.
Figure 5.1.3 Formal Training – Participants' Ratings and Rankings of Service Quality
Dimensions (Means)
C o mmunicat io nC o mpetence
R eliability
T angibles
A ccess
R espo nsiveness
Understanding
2
2.5
3
3.5
4
4.5
5
5.5
64.1 4.2 4.3 4.4 4.5 4.6 4.7 4.8 4.9
Participants' Perceptions of the Importance of Dimensions (M eans)
B. Highest ImportanceA. Moderate Importance
D. Moderate ImportanceC. Lowest Importance
The positioning of each dimension within one of four quadrants3 – A. Moderate Importance; B.
Highest Importance; C. Lowest Importance; D. Moderate Importance – reflects frontline
employees’ overall perceptions of their importance in the context of receiving Formal Training.
Figure 5.1.3 therefore indicated that Reliability, Competence and Communication were the service
quality dimensions of “highest importance” to frontline employees, in terms of their impact on their
job effectiveness, while Understanding seemed to be a dimension of “moderate importance”. In
practice, this means that frontline employees perceived being supplied correct and consistent
information (Reliability), having a trainer that has sufficient training and experience (Competence),
and being spoken to in language and terminology that is understandable (Communication), as most
important to them in receiving effective Formal Training. Moreover, frontline employees perceived
2 This is an adaptation of a descriptive method introduced by Martilla and James (1977). They plotted mean importance ratings against mean performance ratings in order to help managers prioritise marketing strategies. 3 The four quadrants are based on “Importance-Performance” graphs introduced by Martilla and James (1977) cited earlier.

75
having a trainer that was sensitive to their work needs and constraints (Understanding) as being of
“moderate importance” to them in receiving effective Formal Training.
The “highest importance” quadrant provided a clear view of the service quality dimensions most
critical to frontline employees in the delivery of effective Formal Training. These three elements
were also noted in participants’ comments as follows:
“Usually I’ve found formal training has been conducted by an adequate trainer - i.e. they
speak clearly, understand both the theory and practice aspects of our job, and how it [the
training] will relate to us once the training is completed”
“Clear information, relatively frequent and up to date training sessions provided”
“…the information given is explained in an understandable way with questions answered in
a clear and simple manner. The trainers generally illustrate their competence to do the
job…”
Research Question 2: How do frontline employees perceive the overall quality of delivery of each
of the internal services identified?
In submitting their service quality ratings for Formal Training, participants are likely to have
considered factors such as the reliability of information they received, trainers’ competence and
experience, and the degree of empathy displayed by trainers, as the previous section’s results
indicated that these issues were most important to them.
Participants’ overall service quality ratings for Formal Training were quite divided. Figure 5.1.4
indicates that the majority of frontline employees (55%) perceived Formal Training sessions to be
of “good” overall quality, while just 8% saw them as being “very good”. At the other end of the
scale, 20% of participants perceived Formal Training sessions as “poor”, with a further 3% viewing
them as “very poor”. This demonstrates that approximately 1 in 4 respondents perceived that
Formal Training was being performed either poorly or very poorly. 14% of respondent were
“undecided” on the issue.

76
Figure 5.1.4 Formal Training – Service Quality Ratings
3%
8%
55%
20%14%
Very Poor
Poor
Undecided
Good
Very Good
Participants supported their service quality ratings with comments, which outlined both the aspects
of Formal Training they felt were being performed well, and those they felt required improvement.
The aspects of Formal Training participants felt had been performed well are summarized follows:
Providing paper-based reading materials – Tangibles
Clear and understandable explanations – Communication
Relaxed atmosphere/fun learning environment (New theme)
Group Interaction (New theme)
Providing paper-based reading materials – Tangibles Many participants commented that they were satisfied with the paper-based reading materials
provided during Formal Training sessions. One participant’s comment encapsulated these
sentiments:
“There are good handouts that help to explain what the trainer has just done; they help me
to remember the process”
Another participant reinforced the notion that the paper-based reading materials are a useful
reference post training:
“We’re presently supplied with written information, which can be useful to keep and refer
to later”

77
Some participants also stated that paper-based reading materials were straightforward and easy to
read, as evidenced by following comments:
“All the information is placed on paper, easy to read”
“Support materials are well prepared and appropriate”
Clear and understandable explanations – Communication Several participants commented that trainers generally spoke using language and terminology they
could understand during Formal Training sessions. This is an important result considering that
participants perceived the Communication dimension as being of “highest importance” to them
during Formal Training sessions (Figure 5.1.3). Their comments on this issue read as follows:
“Trainers explain the information to you in English and not in technical terms”
The same sentiments were echoed by another participant:
“Trainers present all information in a clear and concise manner, which is easy to
understand and comprehend”
One participant commented that understandable explanations were always provided when
unfamiliar terminology was used by trainers:
“There was some [unfamiliar] terminology that was used and that was explained in great
detail for the understanding”
Relaxed atmosphere/Fun learning environment (New theme) A number of participants commented that a fun and friendly training environment was helpful in
fostering learning. They enjoyed the fact that trainers displayed relaxed body language and used
humour throughout sessions. This was clearly evidenced by these participants’ comments:
“The trainers usually are quite expressive and humorous, which is good because it makes
the training fun and interesting”
“Most trainers are easily approachable, have a sense of humour…This makes for a more
interesting and fruitful session”

78
Another participant stated that the relaxed atmosphere during Formal Training sessions helped in
reducing the stresses associated with change:
“Most trainers present in an easygoing manner so stress of change is not increased”
Group Interaction (New theme) Numerous participants commented that the high level of group engagement and interaction was a
positive aspect of the Formal Training provided. One participant stated that this was made possible
because training group sizes were not too large:
“The way formal training is conducted in small groups rather than the centre as a whole.
There is more interaction between SP’s and the trainers; therefore the training is more
successful”
Another participant felt that group interaction bolstered the learning process, as people were able to
help one another grasp new concepts:
“Group discussions…get the group involved to help each other”
This participant’s comments indicated that group interaction helped address the specific issue of
customer objection handling:
“We can talk about the issues customers might have with new plans and how we can
overcome them”
The comments highlighted so far demonstrate that participants felt positively about numerous
aspects of Formal Training. On the other hand, however, there were strong views put forth that
showed serious dissatisfaction with other areas of Formal Training. To this end, participants felt the
following specific aspects of Formal Training needed improvement:
More skilled and experienced trainers – Competence
Timing of Formal Training (New theme)
Practical exercises (New theme)
Pace and length of training sessions (New theme)

79
More skilled and experienced trainers – Competence The notion of having better qualified, more competent trainers was a consistent theme throughout
participants’ comments. This is a meaningful result, especially when one observes Figure 5.1.3,
which showed that the Competence dimension was of “highest importance” to frontline employees
during Formal Training sessions. Negative comments about trainers’ competence even arose when
participants were asked to comment on the aspects of Formal Training performed well, as
evidenced below:
“Not much at all [is done well]. The facilitators [supervisors] are not well trained and
cannot impart their knowledge for the benefit of the group.
“Since formal trainers left and supervisors started conducting formal training sessions I
don’t believe training time is beneficial and effective”
Various participants were clearly frustrated by the fact that supervisors were conducting Formal
Training sessions rather than specialist training personnel. This is reinforced further by the
following comments:
“…Training is conducted mainly by sales team managers, who often don’t have the skill
and qualification to be performing the training”
“Competence of trainers needs to be improved. I think that [company name] should hire
specialized trainers to teach consultants like they had before”
“The trainer should not be the STM [supervisor] or someone who has very little knowledge
about how to deliver training etc.”
Timing of Formal Training sessions (New theme) A considerable number of participants believed that in most cases Formal Training was delivered
too early. In other words, there was too great a gap between when the training occurred and when
the skills and knowledge needed to be applied. This consequently caused participants to forget
much of the information they had learnt during Formal Training sessions. This is illustrated by the
statements below:
“Timing sometimes too soon: too long before applied in real situation”

80
“…Sometimes training is too far away from the launch date, leading to details being
forgotten”
Different participants even complained that some training sessions were delivered too late, which in
turn compromised their knowledge when dealing with some customers:
“The lateness of training. Sometime we are trained 2 weeks after the change has affected
our work”
Practical exercises (New theme) Many participants felt that training sessions would be more effective if a greater emphasis was
placed on conducting practical exercises. As the following comment demonstrates, much of the
practical training sought related to learning how to provision orders for customers via the use of
computer systems:
“We need to be able to access the correct, working computer systems so we are able to run
through any new processes before we are on the phone with a customer”
One participant recommended that training sessions be conducted closer to a product’s launch date,
as this would likely mean that computer systems would be ready to practice on:
“…to apply the new products using the systems at the same time the training is being rolled
out, not several weeks later…”
Other participants felt that more role playing exercises were needed, as this would help them in
situations such as customer objection handling:
“We need more practical examples such as role plays…”
“More hands-on experience, rather than just theory (examples and test scenarios)”
Pace and length of training sessions (New theme) Most participants felt that training sessions were too rushed and were conducted at a pace that did
not facilitate effective learning. These participants’ comments illustrate this:
“Formal training needs to be longer. It’s hard to grasp some new ideas in half an hour or
even an hour…you’re expected to remember info that you have never even heard of in some
cases…”

81
“More time. Some of the training sessions are rushed because of the time factor… some
trainers say don’t worry if you don’t understand, you will learn it on the job (by actually
doing it), which can be overwhelming”
These comments indicated that time constraints occurred in training sessions because too much
irrelevant information was presented to frontline employees:
“Too much time is spent on… [discussing] benefits of the products, which is a waste of
time, as it is common sense, whilst not enough time is spent on actually discussing the
products, what they are and how they work”
“I believe that in training we can sometimes be overloaded with irrelevant information.
Training could be simplified to only contain what we actually need to know on the phones”
Participants were therefore supportive of Formal Training sessions in general, but frustrated by
superfluous content, not considered particularly relevant to their work roles.
Research Question 3: How do frontline employees perceive the importance of each of the internal
services identified, in terms of increasing their ability to generate revenue for the organisation?
A broad range of ideas and themes were presented in relation to the internal service Formal
Training. Participants’ comments indicated that there were many areas performed well, while many
areas seemed in need of urgent attention. Figure 5.1.5 places the urgency of action into perspective,
as it outlines participants’ ratings of the importance of Formal Training, in terms of it increasing
their ability to generate revenue for the organisation.

82
Figure 5.1.5 Formal Training and Revenue
2%3%4%26%
65%Not Important
Slightly Important
Undecided
Important
Very Important
Figure 5.1.5 indicates that a clear majority of participants (65%) perceived Formal Training as
being “very important”, in terms of it increasing their ability to generate revenue for the
organisation. Conversely, only 5% of participants perceived Formal Training as being either
“slightly important” or “not important”. Thus, mismanaged Formal Training sessions (i.e.
incompetent trainers) could negatively impact upon the organisation’s potential sales volumes, as
frontline employees seem dependent on Formal Training in terms of it helping them to acquire the
product knowledge and technical skills needed to effectively service and sell to customers.
Internal Service Summary – Formal Training Table 5.1.1 provides a summary of the key findings of this section as they relate to the study’s three
focal research questions:
Table 5.1.1 Internal Service Summary – Formal Training
Research Question 1 Research Question 2 Research Question 3
Dimensions of “highest
importance” (Figure 5.1.3)
Other internal services with the
same/similar set of dimensions of
“highest importance”
% "very good" service ratings (Figure 5.1.4)
New themes to emerge through
comments
% "very important" ratings for the service
(Figure 5.1.5)
Importance of delivering
optimal internal service quality
- Reliability Online Training 8% - Fun 65% High - Competence - Interaction - Communication - Timing - Practical - Pace/length

83
Note: For Research Question 3 in each summary table in Chapter 5, “High”, “Moderate” and
“Low” indicative ratings of importance were allocated by the researcher based on the percentage of
participants’ “very important” ratings vis-à-vis revenue, where “High” is greater than 60%,
“Moderate” is greater than 35% and “Low” is less than 20%.

84
5.2 Online Training Online Training involved frontline employees having new or revised product information presented
to them via their personal computer. Other topics were covered from time to time, such as
occupational health and safety. Online Training modules were completed by frontline employees
individually, with little to no group interaction (Typical duration: 1-3 hours).
Research Question 1: How do frontline employees perceive the importance of internal service
quality dimensions within each of the internal services identified?
Participants’ ratings of importance of the seven service quality dimensions in relation to the internal
service of Online Training are summarised in Figure 5.2.1.
Figure 5.2.1 Online Training – Importance of Individual Service Quality Dimensions
60.47%
38.54%
62.46%55.81%
65.12%
33.55% 33.55%
0.00%
10.00%
20.00%
30.00%
40.00%
50.00%
60.00%
70.00%
Reliability Competence Communication Understanding Access Responsiveness Tangibles
Dimensions
% o
f Par
ticip
ants
Not ImportantSlightly ImportantUndecidedImportantVery Important
Figure 5.2.1 shows that 65% of frontline employees perceived Reliability as being a “very
important” aspect of Online Training sessions. Competence and Communication also received
strong ratings, as 62% and 60% of frontline employees respectively perceived those service quality
dimensions as “very important”. These three dimensions were clearly seen as the most important
components of Online Training by frontline employees. Thus, having Online Training modules
designed and prepared by competent staff, who can supply correct, consistent and understandable
information were the most important internal service issues to frontline employees, relative to their
value to them in their customer service/sales role.
In terms of the remaining dimensions, Understanding was rated as “very important” by just over
half of respondents (55%). The final three dimensions of Responsiveness, Access and Tangibles
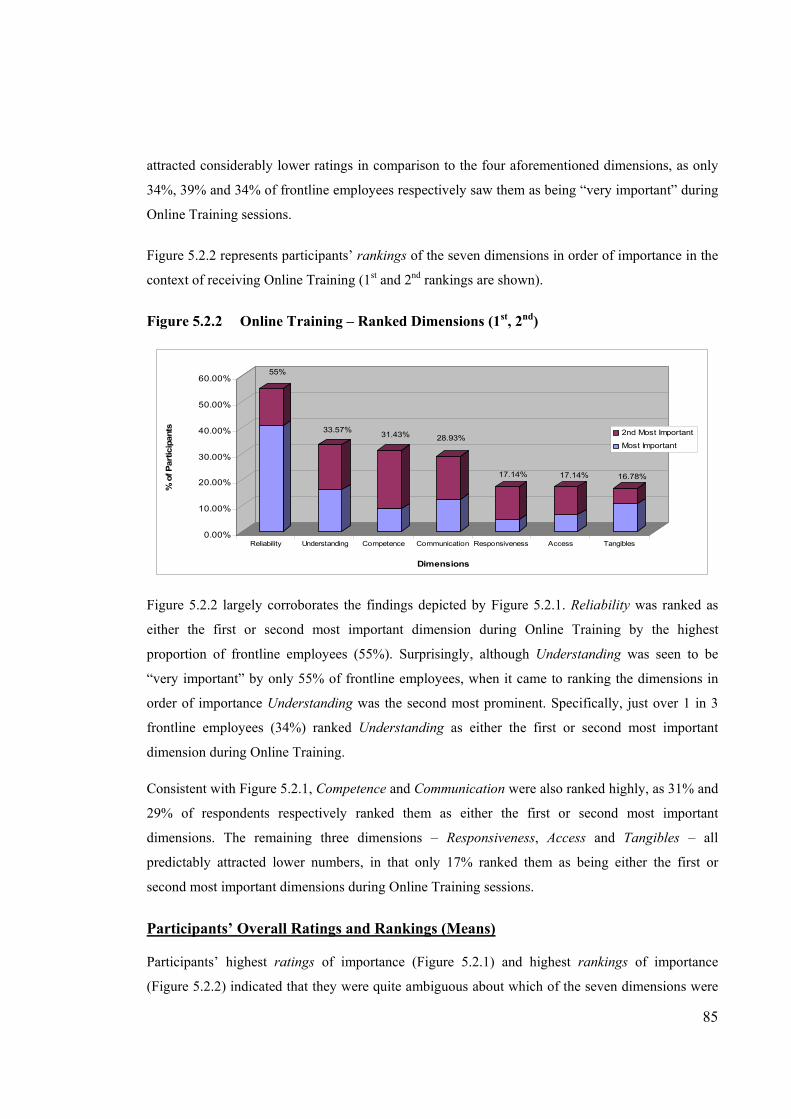
85
attracted considerably lower ratings in comparison to the four aforementioned dimensions, as only
34%, 39% and 34% of frontline employees respectively saw them as being “very important” during
Online Training sessions.
Figure 5.2.2 represents participants’ rankings of the seven dimensions in order of importance in the
context of receiving Online Training (1st and 2nd rankings are shown).
Figure 5.2.2 Online Training – Ranked Dimensions (1st, 2nd)
55%
17.14%
31.43%
17.14%
28.93%33.57%
16.78%
0.00%
10.00%
20.00%
30.00%
40.00%
50.00%
60.00%
% o
f Par
ticip
ants
Reliability Understanding Competence Communication Responsiveness Access Tangibles
Dimensions
2nd Most Important
Most Important
Figure 5.2.2 largely corroborates the findings depicted by Figure 5.2.1. Reliability was ranked as
either the first or second most important dimension during Online Training by the highest
proportion of frontline employees (55%). Surprisingly, although Understanding was seen to be
“very important” by only 55% of frontline employees, when it came to ranking the dimensions in
order of importance Understanding was the second most prominent. Specifically, just over 1 in 3
frontline employees (34%) ranked Understanding as either the first or second most important
dimension during Online Training. Consistent with Figure 5.2.1, Competence and Communication were also ranked highly, as 31% and
29% of respondents respectively ranked them as either the first or second most important
dimensions. The remaining three dimensions – Responsiveness, Access and Tangibles – all
predictably attracted lower numbers, in that only 17% ranked them as being either the first or
second most important dimensions during Online Training sessions.
Participants’ Overall Ratings and Rankings (Means) Participants’ highest ratings of importance (Figure 5.2.1) and highest rankings of importance
(Figure 5.2.2) indicated that they were quite ambiguous about which of the seven dimensions were

86
most important to them, in terms of impacting upon their effectiveness on the job. In order to
provide a more comprehensive indication of the dimensions frontline employees perceived as most
important to them when receiving Online Training, their overall ratings and rankings were
incorporated into Figure 5.2.3. Participants’ mean importance ratings (1-5) were plotted against
their mean importance rankings (1-7) for each of the seven dimensions, using the average of the
seven mean importance ratings (4.16) and the average of the seven mean importance rankings (4) as
the graphs x-y intercept point.
Figure 5.2.3 Online Training – Participants' Ratings and Rankings of Service Quality
Dimensions (Means)
C o mpetenceC o mmunicat io n
Understanding
R eliability
R espo snivenessA ccess
T angibles
2
2.5
3
3.5
4
4.5
5
5.5
63.5 3.6 3.7 3.8 3.9 4 4.1 4.2 4.3 4.4 4.5 4.6 4.7 4.8 4.9
Participants' Perceptions of the Importance of Dimensions (M eans)
B. Highest Importance
C. Lowest Importance D. Moderate Importance
A. Moderate Importance
The positioning of each dimension within one of four quadrants – A. Moderate Importance; B.
Highest Importance; C. Lowest Importance; D. Moderate Importance – reflects frontline
employees’ overall perceptions of their importance in the context of receiving Online Training.
Figure 5.2.3 therefore indicated that Reliability, Competence, Communication and Understanding
were the service quality dimensions of “highest importance” to frontline employees, in terms of
their impact on their job effectiveness. In practice, this means that frontline employees perceived
being supplied correct and consistent information (Reliability), having Online Training activities
prepared by people with sufficient training and experience (Competence), having web pages
prepared that contain language and terminology that is understandable (Communication), and
having Online Training activities designed by people sensitive to their work needs and constraints
(Understanding), as being most important to them in undergoing effective Online Training.

87
The “highest importance” quadrant for Online Training produced a remarkably similar result to that
shown for Formal Training. This is an interesting result considering the differences in the service
delivery mediums. Participants commented on the four key areas of quality Online Training as
follows:
“The information is usually correct and informative”
“Activities are not laid out as simple as they need to be…More difficult to find and load-up
than they need to be”
“Sometimes I find the terminology used is a bit hard to understand”
“Some material seems to be irrelevant or overloaded with information not directly
related…makes for a tedious study experience”
Research Question 2: How do frontline employees perceive the overall quality of delivery of each
of the internal services identified?
In assessing the overall service quality of Online Training, participants are likely to have considered
factors such as the reliability of information, the competence levels of those who prepared Online
Training modules, and the general readability of online learning activities, as the previous section’s
results indicated that these issues were most important to them.
Figure 5.2.4 indicates that participants’ views were polarized in relation to the overall service
quality of Online Training sessions. Only 6% of respondents perceived Online Training sessions to
be of “very good” overall service quality, while 47% saw them as just “good”. One in five
respondents were “undecided”, while 19% felt Online Training sessions were executed “poorly”.
The remaining 7% perceived Online Training sessions as “very poor”, which translates to mean that
just over a quarter (26%) of participants saw Online Training sessions as being of either “poor” or
“very poor” overall service quality.

88
Figure 5.2.4 Online Training – Service Quality Ratings
21%19%
7%
6%
47%
Very Poor
Poor
Undecided
Good
Very Good
The comments supplied by participants highlighted both the aspects of Online Training they felt had
been performed well, coupled with those they felt required improvement. The aspects of Online
Training participants felt had been performed well are summarized follows:
Well structured (New theme)
Learn at own pace (New theme)
Ability to test knowledge (New theme)
Ease of use (New theme)
Well structured (New theme) Several participants commented that Online Training modules were well structured and clearly set
out. The use of examples and diagrams supported the learning process, as the following comments
show:
“The study units are set in a logical order with the SP [frontline employee] and customer in
mind. They are easy to follow and display some diagrams, scenarios and examples. The
summary at the end of each unit is done well and the questions that follow are also good to
enhance the learning”
“When learning about technical details such as that in relation to broadband and
narrowband internet, seeing diagrams and pictures helps me understand the material”

89
Other participants commented that well-structured modules helped them to easily refer back to
important information when needed:
“The reading is divided into sections, which makes it easier to locate specific information
later”
“…The way the information is set out makes it easy to read and reference”
Learn at own pace (New theme) Numerous participants commented that Online Training sessions gave them the ability to learn and
absorb information at their own pace. This is as opposed to Formal Training, where a trainer
dictates the pace of the session. This participant’s comments reflect this:
“The way that each person can learn and read at their own pace without being slowed
down or sped up by others, which can happen in a group learning session”
Self-paced training sessions also allowed participants to spend more time on areas that they
perceived to be more difficult:
“…you can work at your own pace. If something is not understood you can go over it as
much as you like to understand it”
This participant felt that it was easier to absorb large amounts of information when working at
his/her own pace:
“The training you receive is at your own pace…which means you are able to absorb a large
amount of information better…”
Ability to test knowledge (New theme) Some participants appreciated the fact that Online Training sessions included tests both during and
at the conclusion of each module. This gave participants an opportunity to test their knowledge and
better understand the areas that required more attention, as the following examples indicate:
“…they have progress assessments to make sure you understand everything…”
“…throughout [Online Training sessions] questions pop up to test your knowledge before
beginning the next activity…”

90
Testing was also seen as a good way of reflecting on what had been covered within the module, as it
helped to refresh people’s memories:
“…the questions in the assessment part helps refresh your memory and it prompts you to
think about what you learnt”
Ease of use (New theme) Quite a few participants commented that Online Training modules were extremely user-friendly.
Most of their comments on this issue were very concise and to the point, as the following statements
demonstrate:
“…It’s very simple to use and learn”
“…easy to use and navigate
“The [Online Training modules] are excellent. The packages are easy to navigate and
use…”
This participant added that Online Training modules also included easy-to-follow instructions:
“[Online Training modules] are easy to use…easy to understand instructions”
Many participants commented positively on the aspects of Online Training performed well. There
were, however, many participants that had nothing positive to offer at all when faced with that
question, as the following comments demonstrate:
“I don’t like them. Bring back the trainers”
“I don’t think Online Training is acceptable as an option to understand new systems”
“Nothing much at all – very confusing”
“I prefer a tutor in person. We all learn differently”
These comments show that many participants were frustrated by being required to undertake Online
Training. The fact that they could not contain their criticisms until prompted clearly demonstrates

91
this. When participants were prompted to comment on the aspects of Online Training requiring
improvement, the following issues came up consistently:
Not interactive enough (New theme)
Too much detail/irrelevant information (New theme)
Locating modules and enrolling too time consuming – Access
Difficult to comprehend information – Communication
Not interactive enough (New theme) Various participants stated that Online Training was limited by the fact that it did not facilitate
interactive activities such as group discussions and role plays. As a consequence, many participants
often found themselves losing concentration and becoming bored quickly. This participant’s
comments reinforce this:
“…There is no opportunity for real life situations, nor to discuss aspects of the curricula
within a relaxed learning environment…It must be remembered that people learn by either
observing, doing, writing or a combination of these”
This participant specifically addressed how a lack of interactivity leads to a loss in concentration
and boredom:
“…you are just sitting there and reading…you begin to faze out and the information stops
getting in…perhaps there can be a little more human interaction or hands-on activities…to
keep the interest”
This participant commented that it was difficult to learn and remember information when a
computer was the sole learning device used:
“…very hard to learn by reading off a computer screen…most information is lost or
forgotten as there is no emphasis on real life examples…People learn in many different
ways; verbal communication with hands-on activity, as well as visual all combined
together…not by a computer”

92
Too much detail/irrelevant information (New theme) A considerable number of participants commented that Online Training modules were too detailed,
and presented too much irrelevant information. This in turn made it difficult to remember the
information that was most important, as the following comment shows:
“…a lot of information that is not really relevant as to when you are using the actual
product…it makes it seem complex and it doesn’t make you remember any info…”
This participant preferred for information to be consolidated and presented in dot point format:
“Information should be consolidated into dot points, which is easier to remember than
large chunks of information”
These participants felt that the solution was to eliminate most of the “nice to know” information
presented in Online Training modules:
“Too much information…needs to get straight to the point. Not too much nice to know
info…”
“[Online Training modules] have a tendency to beat around the bush. It would be helpful
if [Online Training modules] were more to the point and delivered better examples of
processes”
Locating modules and enrolling too time consuming – Access Different participants felt that Online Training modules were too difficult to locate and load-up. As
this participant’s comments demonstrate, the process of accessing Online Training modules was
often a confusing one:
“The load-up screen is very confusing, as sometimes I can try to enrol twice in a course as
there is no confirmation page, if you just had to put in a number and bring it up and enrol
instantly…it would make it easier for you to find it”

93
This participant also commented on the difficulty experienced when attempting to access an Online
Training module:
“For me personally, I have never had easy access to any [Online Training] activity,
sometimes it will say I can’t do it…I find loading the activities and locating them to be quite
difficult sometimes”
There were indications that excessive access times left frontline employees with insufficient time to
properly complete Online Training modules:
“The loading up needs improving. It takes too long, especially when you have a set time [to
complete the module]”
“Hard to access timeframes do not allow participants to complete projects properly”
Difficult to comprehend information – Communication A number of participants commented that information presented within Online Training modules
was often very difficult to understand. The use of technical terminology seemed to lead to
confusion, as demonstrated by the following comments:
“…[Online Training] activities do have a lot of technical terminology that I find a bit
confusing…it also doesn’t have anything to refer to, for example, a glossary…”
“They need to make [Online Training modules] easier to understand and not use jargon”
Many participants felt that the questions within the assessment area were the most difficult to
comprehend, as shown below:
“…some of the questions in the assessment area are worded poorly and therefore result in
incorrect answers not necessarily by fault of the learner”
“Sometimes the questions aren’t clear enough”
“Wording of some questions is confusing and contradictory”
The need for improvement in the area of Communication is a very meaningful result, as participants
perceived that dimension as being of “highest importance” to them when completing Online
Training modules (Figure 5.2.3).

94
Research Question 3: How do frontline employees perceive the importance of each of the internal
services identified, in terms of increasing their ability to generate revenue for the organisation?
While many participants expressed satisfaction with specific areas of Online Training, most
participants seemed frustrated and dissatisfied with it overall, especially as an alternative to Formal
Training. Many participant comments indicated strong emotive opposition to the use of Online
Training at all as a learning tool. This is perhaps due to the fact that a large proportion of them
perceived Online Training to be of limited importance, in terms of it increasing their ability to
generate revenue for the organisation. More specifically, Figure 5.2.5 shows that 26% of
participants perceived Online Training as either “not important” or “slightly important”, in terms of
increasing their ability to generate revenue for the organisation. Alternatively, only 19% of
participants perceived Online Training as being “very important”, while 40% perceived it to be
“important”. 15% of participants were “undecided” on the issue. Figure 5.2.5 Online Training and Revenue
11%
15%40%
19%15% Not Important
Slightly Important
Undecided
Important
Very Important
If we compare participants’ perceptions of the importance of Online Training and Formal Training
it is obvious that, overall, participants saw Formal Training as much more important. Thus, one
would have to ask the question of whether Online Training is an appropriate substitute to Formal
Training, and also whether it is worth allocating the resources into improving the quality of Online
Training when those same resources could be used to improve the quality of the Formal Training
provided – a service that would be more likely to produce revenue from frontline employees, as a
result of being more effective at providing them with the skills and knowledge needed to be highly
proficient during their exchanges with customers.

95
Internal Service Summary – Online Training Table 5.2.1 provides a summary of the key findings of this section as they relate to the study’s three
focal research questions: Table 5.2.1 Internal Service Summary – Online Training
Research Question 1 Research Question 2 Research Question 3
Dimensions of "highest
importance" (Figure 5.2.3)
Other internal services with the
same/similar set of dimensions of
“highest importance”
% "very good" service ratings (Figure 5.2.4)
New themes to emerge through
comments
% "very important" ratings for the service
(Figure 5.2.5)
Importance of delivering
optimal internal service quality
- Reliability Formal Training 6% - Structure 19% Low - Competence - Self-paced - Communication - Test learning - Understanding - Ease of use - Interaction - Relevance (information)
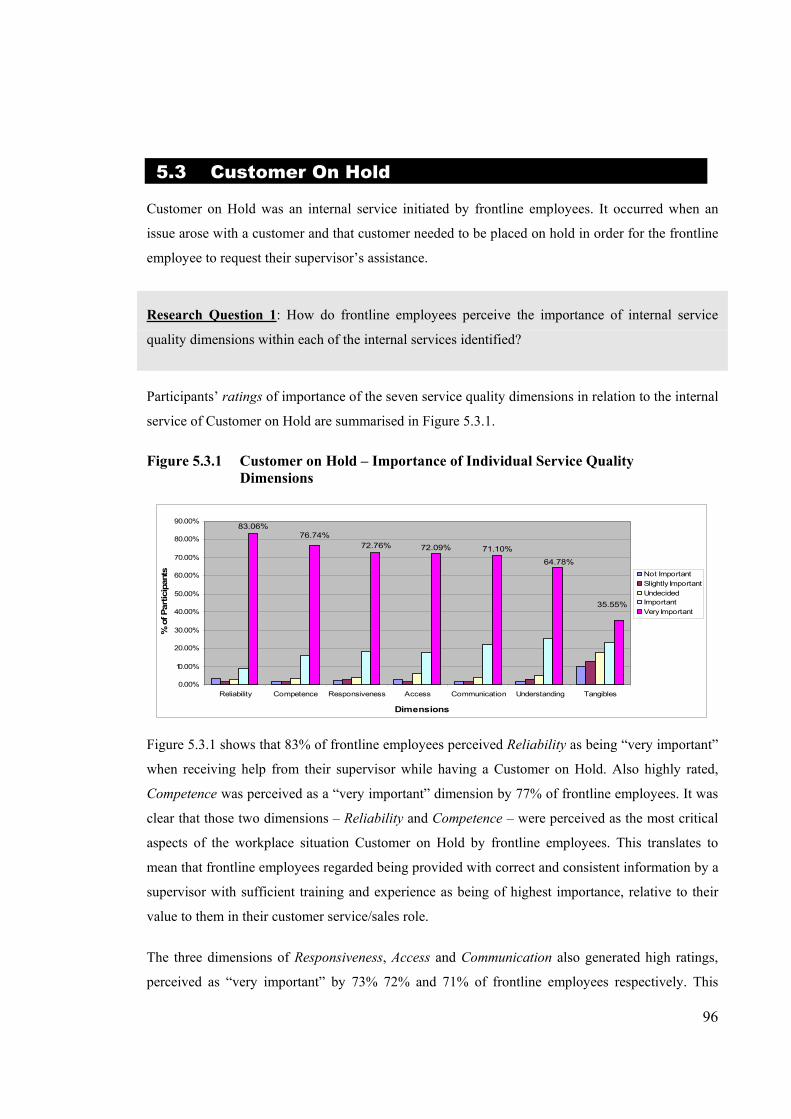
96
5.3 Customer On Hold Customer on Hold was an internal service initiated by frontline employees. It occurred when an
issue arose with a customer and that customer needed to be placed on hold in order for the frontline
employee to request their supervisor’s assistance.
Research Question 1: How do frontline employees perceive the importance of internal service
quality dimensions within each of the internal services identified?
Participants’ ratings of importance of the seven service quality dimensions in relation to the internal
service of Customer on Hold are summarised in Figure 5.3.1. Figure 5.3.1 Customer on Hold – Importance of Individual Service Quality
Dimensions
71.10%72.76%
83.06%76.74%
72.09%
64.78%
35.55%
0.00%
10.00%
20.00%
30.00%
40.00%
50.00%
60.00%
70.00%
80.00%
90.00%
Reliability Competence Responsiveness Access Communication Understanding Tangibles
Dimensions
% o
f Par
ticip
ants Not Important
Slightly ImportantUndecidedImportantVery Important
Figure 5.3.1 shows that 83% of frontline employees perceived Reliability as being “very important”
when receiving help from their supervisor while having a Customer on Hold. Also highly rated,
Competence was perceived as a “very important” dimension by 77% of frontline employees. It was
clear that those two dimensions – Reliability and Competence – were perceived as the most critical
aspects of the workplace situation Customer on Hold by frontline employees. This translates to
mean that frontline employees regarded being provided with correct and consistent information by a
supervisor with sufficient training and experience as being of highest importance, relative to their
value to them in their customer service/sales role.
The three dimensions of Responsiveness, Access and Communication also generated high ratings,
perceived as “very important” by 73% 72% and 71% of frontline employees respectively. This

97
means that having an easily approachable supervisor who provides quick, easy to understand
assistance were also important service issues to frontline employees. Understanding was rated
noticeably lower, with 65% of respondents selecting it as being a “very important” dimension.
Tangibles appeared to be clearly the least important dimension, with only 36% of frontline
employees perceiving it as “very important” when receiving help from their supervisor while
having a Customer on Hold. Figure 5.3.2 represents participants’ rankings of the seven dimensions in order of importance in the
context of the internal service Customer on Hold (1st and 2nd rankings are shown). Figure 5.3.2 Customer on Hold – Ranked Dimensions (1st, 2nd)
53.57% 53.21%
28.57%
24.64%
14.28% 13.21% 12.5%
0.00%
10.00%
20.00%
30.00%
40.00%
50.00%
60.00%
% o
f Par
ticip
ants
Reliability Responsiveness Competence Access Communication Understanding Tangibles
Dimensions
2nd Most Important
Most Important
While Figure 5.3.1 depicted quite an even trend across the seven dimensions, this was not the case
when respondents came to ranking the dimensions in order of importance. Figure 5.3.2 presents
Reliability and Responsiveness as the two outstanding dimensions, where 54% and 53% of frontline
employees respectively perceived them as being either the first or second most important dimension
when receiving help from their supervisor while having a Customer on Hold. Competence and
Access were considerably lower, with 29% and 25% of respondents respectively ranking them as
either the first or second most important dimension. Communication, Understanding and Tangibles
all received much less support in comparison to the leading four dimensions, as only 14%, 13% and
13% of frontline employees respectively ranked them as either the first or second most important
dimension when receiving help from their supervisor while having a Customer on Hold.
Participants’ Overall Ratings and Rankings (Means) Participants’ highest ratings of importance (Figure 5.3.1) and (to a lesser extent) highest rankings
of importance (Figure 5.3.2) depicted quite an even trend in relation to the dimensions they

98
perceived as being most important to them, relative to the impact they had on their job
effectiveness. In order to provide a more comprehensive indication of the dimensions frontline
employees perceived as most important to them when receiving help from their supervisor while
having a Customer on Hold, their overall ratings and rankings were incorporated into Figure 5.3.3.
Participants’ mean importance ratings (1-5) were plotted against their mean importance rankings
(1-7) for each of the seven dimensions, using the average of the seven mean importance ratings
(4.45) and the average of the seven mean importance rankings (4) as the graphs x-y intercept point.
Figure 5.3.3 Customer on Hold – Participants' Ratings and Rankings of Service Quality
Dimensions (Means)
R espo nsivenessR eliability
C o mpetence
A ccess
C o mmunicat io n
Understanding
T angibles
2
2.5
3
3.5
4
4.5
5
5.5
6
6.5
73.6 3.7 3.8 3.9 4 4.1 4.2 4.3 4.4 4.5 4.6 4.7 4.8 4.9
Participants' Perceptions of the Importance of Dimensions (M eans)
B. Highest Importance
C. Lowest Importance D. Moderate Importance
A. Moderate Importance
The positioning of each dimension within one of four quadrants – A. Moderate Importance; B.
Highest Importance; C. Lowest Importance; D. Moderate Importance – reflects frontline
employees’ overall perceptions of their importance in the context of receiving help from their
supervisor while having a Customer on Hold.
Figure 5.3.3 therefore indicated that Reliability, Responsiveness, Competence and Access were the
service quality dimensions of “highest importance” to frontline employees, in terms of their impact
on their job effectiveness, while Communication and Understanding seemed to be dimensions of
“moderate importance”. In practice, this means that frontline employees perceived being supplied
with correct and consistent information (Reliability), receiving quick assistance (Responsiveness),
receiving help from a supervisor with sufficient training and experience to do the job in that
situation (Competence), and being able to locate and approach a supervisor easily (Access), as being
most important to them in the context of the internal service Customer on Hold. Moreover, frontline

99
employees perceived their supervisor making a genuine effort to listen to them (Communication), as
well as their supervisor being sensitive to their work needs and constraints (Understanding) as
being of “moderate importance” to them in receiving effective assistance within that internal
service.
The “highest importance” quadrant for this internal service produced a very different result to those
shown for Online Training and Formal Training. The service quality dimensions Access and
Responsiveness qualified as being of “highest importance” in this instance, yet qualified as being of
“lowest importance” within both Online Training and Formal Training. This demonstrates that
frontline employees differentiated between their priorities in terms of what they expected from
internal suppliers in those two diverse types of workplace situations. Participants commented on the
key areas of internal service quality within Customer on Hold as follows:
“The promptness, the strong and genuine support and assistance”
“The info that is received from my team leader is correct and always done quickly”
“We are lucky to have an excellent supervisor who has experience and product knowledge”
“When required my supervisor is accessible all the time…”
Research Question 2: How do frontline employees perceive the overall quality of delivery of each
of the internal services identified?
Participants are likely to have considered a number of factors when submitting their ratings of the
overall service quality of the internal service Customer on Hold. These probably would have
included the reliability of information they received, the promptness of assistance received, as well
as the degree of competence displayed by their supervisor in such situations, as the previous
section’s results indicated that these issues were most important to them.
Figure 5.3.4 illustrates that, overall, participants were satisfied with the quality of service they
received from their supervisor in situations where they had a customer waiting on hold. This is
supported by the fact that 72% of participants perceived that the help they received from their
supervisor while having a Customer on Hold was of either “good” or “very good” overall service
quality. Specifically, 26% felt their supervisor’s help was “very good”, while 46% saw it as being

100
“good”. Only 2% of frontline employees perceived their supervisor’s help in this situation as “very
poor” although 10% did see it as being of “poor” overall service quality. 16% of frontline
employees were undecided on this question.
Figure 5.3.4 Customer on Hold – Service Quality Ratings
26%
2%
10%
16%
46%
Very Poor
Poor
Undecided
Good
Very Good
The comments submitted by participants outlined both the aspects of the internal service Customer
on Hold they felt had been performed well, together with those elements they felt required
improvement. The aspects performed well are summarised as follows:
Quick response times (Responsiveness) and efficient solutions
Easy to locate and approach supervisors – Access
Willingness to listen – Communication
Experienced with computer systems – Competence
Quick response times (Responsiveness) and efficient solutions Most participants appeared pleased by the speed of the initial response from their supervisor, as
well as by the efficiency displayed by them in solving any issues raised. This becomes an
increasingly important result when one considers that the Responsiveness dimension was perceived
to be of “highest importance” to frontline employees within this internal service (Figure 5.3.3).
Participants submitted the following comments on this issue:
“When help arrives the problem is handled efficiently”
“…He is prompt and always puts staff first, finds out our need and finds an appropriate
solution efficiently”

101
“I am able to receive help rapidly when required”
“The supervisor is able to deliver me with an answer to my problem or to the customer’s
question quickly”
Some participants also indicated that supervisors sometimes provided faster assistance when they
were reminded that a customer was waiting on hold:
“When you mention that the customer is on hold the supervisor does tend to help a lot
quicker”
“When the customer is on hold, I advise the supervisor that the customer is on hold and
that I need their undivided attention…then assistance is provided immediately”
Easy to locate and approach supervisors – Access Numerous participants commented that their supervisors were usually easy to locate and very
approachable in situations where a customer was on hold and they required assistance. This result
takes on added meaning when ones considers that the Access dimension was perceived by
participants as being of “highest importance” to them within this internal service (Figure 5.3.3).
Participants commented on this issue as follows:
“Generally the supervisor is easy to approach and find which is a good thing…”
“We know where our supervisor generally is…either at her desk or walking the floor,
therefore it is generally easy to locate her”
There were also indications that it was important for accessibility to be coupled with promptness in
such situations:
“It’s good that my supervisor is always available and quick to assist when a customer is on
hold”
“Usually there is someone easily accessible to come quickly and assist you”
Willingness to listen – Communication Most participants perceived their supervisors to be generally good listeners in situations where they
asked for assistance while having a Customer on Hold. It appeared important to them that their

102
supervisors show a willingness to help, and genuine concern for their circumstance, as the following
examples demonstrate:
“… a supervisor listens to what you are saying and genuinely wants to help you with the
problem…until it is all clear”
“Supervisors are generally willing to stop what they are doing to listen to the problem,
provide a solution, and if necessary speak to the customer…”
Different participants also indicated that, coupled with listening, it was important that their
supervisors were able to explain information in an understandable manner, as it could then be easily
relayed on to customers:
“…Supervisors are easy to understand and do make an effort to listen and give the best
advice”
“…quick to grasp what I am talking about, she always has an answer and explains it well
so I can relay it to the customer”
“How the answer is explained in terms that I can use to say back to the customer”
Experienced with computer systems – Competence Many participants indicated that their supervisors were very competent in the area of computer
navigation. This was extremely helpful in situations where customers were on hold, as it facilitated
quick, direct access to relevant customer information:
“…they come over to your workstation and look at the specific account to help you
understand exactly what is happening, whether it be about a systems error or an old plan
you’ve never seen before”
“Our sales team manager has good systems knowledge, especially native [older]
systems…”

103
Some participants also indicated that they were satisfied with the general level of training and
experience (i.e. Competence) possessed by their supervisors, as the following comments
demonstrate:
“Supervisor is well trained in many aspects of the job and is able to resolve issues in a
timely manner”
“We are very lucky to have an excellent supervisor who has the experience and product
knowledge”
“I believe that our supervisor does have the relevant experience and training to help us”
These positive comments regarding the Competence of supervisors take on an added importance in
light of the results of Figure 5.3.3, which shows that the Competence dimension was perceived to be
of “highest importance” to frontline employees within this internal service.
The comments so far illustrate that participants were satisfied with many aspects of the internal
service Customer on Hold. However, there were also a number of areas that participants felt
required improvement, which are summarised below:
Availability of supervisors (New theme)
Accuracy of information – Reliability
Knowledge of products – Competence
Availability of supervisors (New theme) While some participants commented that supervisors were easily accessible, others stated that this
was not always the case, not by fault of supervisors, but rather due to a lack of resources. In other
words, it was sometimes difficult to receive help from supervisors because they were either in
meetings, helping other frontline employees, or tied down with other tasks. This in turn also
compromised the responsiveness of supervisors in many situations. Thus, the problem seemed to be
more about unavailability than about inaccessibility in this instance. The following comments
provide an insight into this issue:
“Only one supervisor per 20 or so people, sometimes to get a simple answer takes time
because there’s a queue”

104
“Obviously sometimes there are other sales reps that the sales team manager has to help
first, and this of course means the time-on-hold for the customer is longer. Of course this
can not be helped”
These comments further address the issue of longer customer waiting times as a result of supervisor
responsiveness becoming compromised:
“Team managers are often away, leaving one or two supervisors for the whole floor. This
creates a long waiting time for the customers”
“When we have a customer that is in a hurry and does not want to wait…but the supervisor
is busy…the customer shouldn’t have to wait…there should be another standing supervisor
to help out”
These participants’ comments reflect the unavailability of supervisors due to them being in
meetings, which in turn leaves frontline employees with little alternative assistance:
“Sometimes our supervisor is not available…because of 1 on 1 and meetings etc, but
sometimes it’s hard to find someone else around to help…”
“Availability. Between cell meetings, one-on-ones, weekly report meetings…supervisors do
not have a lot of time to simply be available to help. There is nothing worse than having a
difficult customer on the line and not being able to find a supervisor anywhere”
Accuracy of information – Reliability Many participants expressed concerns about the reliability of information communicated by their
supervisors. The lack of correct and consistent information clearly created frustration among
frontline employees, as the following comments indicate:
“As a general rule for supervisors I find that few of them actually know all the correct
information…half the time they give the wrong information if they are questioned…at least
one sc [frontline employee] in every team knows 5 times what their supervisor knows”

105
The lack of accurate information becomes an increasingly important concern when one considers
that the Reliability dimension was perceived by participants as being of “highest importance” to
them within this internal service (Figure 5.3.3). This participant felt the problem could be rectified
if supervisors made more of an effort to update themselves with product changes:
“I think management in general should be more up-to-date with products…so when we go
to ask a question we can get the correct answer…”
As this comment shows, much of the information communicated by supervisors contradicted what
appeared on the organisation’s Intranet, what was presented in training sessions, and what appeared
on paper-based reading materials provided:
“Quite often, most of the time the information they provide you with is contradictory to
information provided on [the Intranet] or in training or on written handouts, and I find this
confusing as well as really frustrating for both myself as well as the customer…”
Knowledge of products – Competence While some participants indicated that they were generally satisfied with their supervisors’ systems
knowledge, others felt that their supervisors’ product knowledge was inadequate. This ultimately
lengthened customer waiting times, as the following comments show:
“The major issue is that the supervisor does not have the competence with products to
address the question being sought, resulting in having to find someone with greater
knowledge that can help”
“Supervisor generally does not know what to do themselves…therefore you are making the
customer wait even longer to find someone who does know what to do…”
This participant commented that supervisors’ knowledge bases were too narrow, and needed to be
more broad-based:
“To know more about products across the board, not just mobiles, but residential and
[internet] also…our team leaders don’t have this training”
This lack of broad-based knowledge on the part of supervisors takes on an added significance when
considering that the Competence dimension was perceived by frontline employees as being of
“highest importance” to them within this internal service (Figure 5.3.3).

106
Research Question 3: How do frontline employees perceive the importance of each of the internal
services identified, in terms of increasing their ability to generate revenue for the organisation?
Participants commented positively on many aspects of the internal service Customer on Hold. These
comments covered areas relating to supervisor responsiveness, competence, courtesy and
accessibility. Strong feedback also emerged regarding the aspects of the internal service requiring
improvement. For example, it appeared frontline employees required greater availability on the part
of their supervisors. The urgency of implementing such measures would appear great, as Figure
5.3.5 illustrates that participants overall perceived the internal service Customer on Hold as being
critical, in terms of increasing their ability to generate revenue for the organisation.
Figure 5.3.5 Customer on Hold and Revenue
2% 4%5%
29%60%
Not Important
Slightly Important
Undecided
Important
Very Important
Specifically, Figure 5.3.5 shows that 60% of participants perceived that the help they received from
their supervisor while they had a Customer on Hold was “very important” in terms of increasing
their ability to generate revenue for the organisation. A further 26% felt that the internal service was
“important”, while 5% of respondents were “undecided”. Only 4% of frontline employees saw the
help they received from their supervisor while a customer was on hold as “slightly important” in
terms of increasing their ability to generate revenue for the organisation, while an even smaller
proportion (2%) saw it as “not important”. It would therefore appear in the best interests of the
organisation to act upon the recommendations and comments submitted by their frontline staff, as
this could result in more sales, rather than missed opportunities.

107
Internal Service Summary – Customer on Hold Table 5.3.1 provides a summary of the key findings of this section as they relate to the study’s three
focal research questions:
Table 5.3.1 Internal Service Summary – Customer on Hold
Research Question 1 Research Question 2 Research Question 3
Dimensions of "highest
importance" (Figure 5.3.3)
Other internal services with the
same/similar set of dimensions of
“highest importance”
% "very good" service ratings (Figure 5.3.4)
New themes to emerge through
comments
% "very important" ratings for the service
(Figure 5.3.5)
Importance of delivering
optimal internal service quality
- Reliability - Systems Support 26% - Availability 60% High - Responsiveness - Computer Programs (supervisors) - Competence - Intranet - Access

108
5.4 Team Briefs Team Briefs involved sales teams of frontline employees being communicated to by their
supervisor. Typical topics covered included sales team performance and marketing campaigns
(Typical duration: 10-15 minutes).
Research Question 1: How do frontline employees perceive the importance of internal service
quality dimensions within each of the internal services identified?
Participants’ ratings of importance of the seven service quality dimensions in relation to the internal
service of Team Briefs are summarised in Figure 5.4.1. Figure 5.4.1 Team Briefs – Importance of Individual Service Quality Dimensions
56.48%62.79%
59.47%
76.08%
58.47%
37.87%
55.48%
0.00%
10.00%
20.00%
30.00%
40.00%
50.00%
60.00%
70.00%
80.00%
Reliability Competence Communication Responsiveness Access Understanding Tangibles
Dimensions
% o
f Par
ticip
ants
Not ImportantSlightly ImportantUndecidedImportantVery Important
Figure 5.4.1 shows that Reliability was perceived to be a particularly important aspect of Team
Briefs, with 76% of frontline employees rating it as “very important”. 13% fewer frontline
employees (63%) felt Competence was “very important”, while the dimensions Responsiveness,
Access, Communication and Understanding all attracted “very important” ratings from between 55-
59% of respondents. Tangibles exhibited the lowest percentage yet again, with 38% of frontline
employees perceiving it as “very important” during Team Briefs with their supervisor.
It is therefore clear that frontline employees placed the greatest importance upon receiving correct
and consistent information from their supervisor during Team Briefs, relative to its value to them in
their customer service/sales role. Supervisors’ training and experience was also a highly important
aspect of Team Briefs, while components such as the use of understandable language, prompt

109
response to questions, the ease of asking questions, and the sensitivity displayed by supervisors
seemed to be of less importance to frontline employees.
Figure 5.4.2 represents participants’ rankings of the seven dimensions in order of importance in the
context of receiving Team Briefs (1st and 2nd rankings are shown).
Figure 5.4.2 Team Briefs – Ranked Dimensions (1st, 2nd)
57.14%
33.57%
25.36%
14.64%
30.36%
24.29%
14.64%
0.00%
10.00%
20.00%
30.00%
40.00%
50.00%
60.00%
% o
f Par
ticip
ants
Reliability Responsiveness Communication Competence Understanding Access Tangibles
Dimensions
2nd Most Important
Most Important
Figure 5.4.2 reinforced the high rating for the Reliability dimension seen in Figure 5.4.1. As such,
57% of frontline employees perceived Reliability as being either the first or second most important
dimension during Team Briefs with their supervisor. 23% fewer frontline employees (34%) ranked
Responsiveness as either their first or second most important dimension, while Communication was
seen in that light by 30% of respondents. Competence and Understanding were a further grade
lower, with 25% and 24% of frontline employees respectively selecting them as either their first or
second most important dimension. Access and Tangibles attracted identical support, with a small
proportion of respondents (15%) perceiving them as either the first or second most important
dimension during Team Briefs with their supervisor.
Participants’ Overall Ratings and Rankings (Means) Participants’ highest ratings of importance (Figure 5.4.1) and highest rankings of importance
(Figure 5.4.2) suggested that they were extremely clear about the one dimension (Reliability) that
was most important to them, in terms of the impact it had on their job effectiveness. The remaining
dimensions appeared noticeably less important in comparison. In order to provide a more
comprehensive indication of all the dimensions frontline employees perceived as most important to
them when receiving Team Briefs, their overall ratings and rankings were incorporated into Figure

110
5.4.3. Participants’ mean importance ratings (1-5) were plotted against their mean importance
rankings (1-7) for each of the seven dimensions, using the average of the seven mean importance
ratings (4.33) and the average of the seven mean importance rankings (4) as the graph’s x-y
intercept point.
Figure 5.4.3 Team Briefs – Participants' Ratings and Rankings of Service Quality
Dimensions (Means)
C o mmunicat io n
C o mpetenceR espo nsiveness
A ccessUnderstanding
T angibles
R eliability
2
2.5
3
3.5
4
4.5
5
5.5
63.5 3.6 3.7 3.8 3.9 4 4.1 4.2 4.3 4.4 4.5 4.6 4.7 4.8 4.9
Participants' Perceptions of the Importance of Dimensions (M eans)
B. Highest Importance
C. Lowest Importance D. Moderate Importance
A. Moderate Importance
The positioning of each dimension within one of four quadrants – A. Moderate Importance; B.
Highest Importance; C. Lowest Importance; D. Moderate Importance – reflects frontline
employees’ overall perceptions of their importance in the context of receiving Team Briefs from
their supervisor.
Figure 5.4.3 therefore indicated that Reliability, Competence, Responsiveness and Communication
were the service quality dimensions of “highest importance” to frontline employees, in terms of
having the greatest impact upon their job effectiveness, while Understanding and Access seemed to
be of “moderate importance” to them. In practice, this means that frontline employees perceived
being supplied with correct and consistent information (Reliability), having a supervisor with the
training and experience to conduct the brief properly (Competence), having their important
questions answered during the brief (Responsiveness), and being spoken to in language and
terminology that is understandable (Communication), as being most important to them in being
delivered effective Team Briefs. Moreover, frontline employees perceived their supervisor being
sensitive to their work needs and constraints (Understanding), and allowing them to ask questions
and contribute to the discussion easily (Access) to be of “moderate importance” to them.

111
The “highest importance” quadrant for this internal service was quite similar to that depicted for the
internal service Customer on Hold. The Reliability dimension was particularly prominent in this
instance, as opposed to the other three dimensions within the quadrant, which were tightly clustered
together. This trend, of course, is reflective of how participants rated and ranked the importance of
the Reliability dimension relative to the other six dimensions within this internal service.
Participants commented on the four key dimensions as they related to Team Briefs as follows:
“…From an information perspective team briefs are excellent in providing us with the
correct information that we need for the night ahead”
“Well presented with excellent product knowledge”
“All info is reliable and questions are all answered well”
“Greg speaks in language that everyone can understand”
Research Question 2: How do frontline employees perceive the overall quality of delivery of each
of the internal services identified?
In deciding upon their service quality ratings for the internal service Team Briefs, participants are
likely to have considered a number of diverse features. The main one would have likely been the
reliability of information received, while the general level of competence displayed by their
supervisor would also have been a strongly considered factor, as the previous section’s results
indicated that such issues were most important to them.
Figure 5.4.4 demonstrates that participants were generally satisfied with the quality of service
delivered by their supervisors during Team Briefs. It shows that the just over three quarters of
frontline employees (77%) felt the Team Briefs conducted by their supervisor were of either “good”
or “very good” overall service quality. Specifically, 50% rated Team Briefs as “good”, while 27%
attached a “very good” rating to the internal service. 15% of respondents were undecided on the
issue, while only 7% and 1% respectively perceived Team Briefs from their supervisor to be of
“poor” and “very poor” overall service quality.

112
Figure 5.4.4 Team Briefs – Service Quality Ratings
15%
7%
1%
27%
50%
Very Poor
Poor
Undecided
Good
Very Good
The subsequent comments offered by participants highlighted both the aspects of Team Briefs they
perceived were performed well, coupled with those aspects they perceived required improvement.
The elements of the internal service perceived as performed well as summarised as follows:
Clear and understandable explanations – Communication
Easy to ask questions and contribute – Access
Interactive team bonding exercise (New theme)
Relaxed and fun atmosphere (New theme)
Clear and understandable explanations – Communication Participants appreciated that they were spoken to in clear and understandable language during Team
Briefs. This made the information presented much easier to comprehend and digest, which in turn
likely positively impacted upon their job effectiveness. This translates into an increasingly
meaningful result when considering that the Communication dimension was perceived by
participants as being of “highest importance” to them within this internal service (Figure 5.4.3). The
following comments touched on this issue:
“They provide information in a clear manner so that you can understand the campaign you
are going on to”
“Clear explanation of the product resulting in a much better understanding”
“Most campaigns are explained well and she makes sure we have an understanding of the
product”

113
This participant commented that an effective way to ensure information is conveyed clearly in
Team Briefs is to empower frontline employees to do the product research themselves and then
present it to their fellow team members:
“My supervisor will quite often allocate an SP [frontline employee] to research new
information for team briefs…it is then delivered in a way we all understand”
Easy to ask questions and contribute – Access Many participants commented that it was easy for them to ask questions and contribute to the
discussion during Team Briefs. This subsequently seemed to create a positive team atmosphere, as
demonstrated by the following example:
“…All members have the opportunity to speak. In fact, we go around the table and ensure
this, by asking each individual if they have any issues that need to be raised. Any topic is
welcomed. The environment is such that we are all allowed to feel comfortable to speak
whilst upholding democracy within the team”
The following comments reinforce the key themes outlined above, in that Team Briefs seemed to
provide ample opportunity for frontline employees to discuss and clarify topic areas:
“Allows team members to ask questions, allows team members to give their opinion on the
relevant topics, the supervisor does ask what questions we might have…”
“Team discussions and questioning…all questions and queries are taken into consideration
and are looked into”
Interactive team bonding exercise (New theme) Participants seemed to value the fact that Team Briefs facilitated interaction and team bonding.
Interaction among team members was useful in terms of sharing important information, which at
the same time helped create a genuine mateship and camaraderie within sales teams. This is
demonstrated by the following comments:
“Team briefs are informative and help consultants address issues that they have had within
the team environment…It is important to do this as it gives the team a chance to gather and
share information…and to help the team overcome problems that they may have…”

114
Team interaction also helped ensure that everyone was aligned with a common vision:
“Having information shared between everyone to see if we are all working for the same
team goals”
Many of the comments made on this issue were extremely concise and to the point, but nevertheless
clearly conveyed the same message, as shown below:
“Team bonding element – information sharing”
“Bringing the team together so we can discuss items that affect the team”
“I appreciate the fact that everyone gets a chance to contribute to the meeting. They are
interactive”
Relaxed and fun atmosphere (New theme) Several participants suggested that Team Briefs were most effective when they were fun and
conducted in a relaxed atmosphere. This helped to motivate staff, as the following comment
demonstrates:
“Briefs are carried out in an informal, casual and light-hearted manner, making everyone
feel relaxed. There is always a lot of praise given to the team, resulting in team players
being keen to achieve good results…”
This participant indicated that fun and energetic Team Briefs were important, as they not only
motivated staff, but also helped to break-up the monotony of the frontline employee role:
“We brief very often, which I think is important. Andy is very vibrant and lively, which
helps to motivate the team each day, which is also very important given the monotony of the
job…”
Team Briefs also seemed to be a motivating force because supervisors provided frontline employees
with positive reinforcement about their performance:
“They are a friendly way to celebrate a team’s success and the supervisor makes them
relaxing and fun”

115
Participants were clearly satisfied with a number of the aspects of the Team Briefs conducted by
their supervisors. At the same time, however, there were two main areas that they felt needed to be
improved. These areas are summarised as follows:
Too rushed (New theme)
Frequency (New theme)
Too rushed (New theme) Various participants commented that Team Briefs were often very rushed, which in turn affected
their capacity to take-in all the relevant information. This is reflected in the comments below:
“…Team briefs are always rushed within 10 minutes just to get us back on the phones.
Having a greater understanding about what the brief is about would help the SPs [frontline
employees]”
“Need more time in briefing to understand each new campaign and new systems that we
need to know about”
Rushed Team Briefs appeared to ultimately affect the quality of service provided to customers by
frontline employees:
“They at times seem rushed and not as thorough as I would like them to be in order for me
to understand the information, and then provide the correct information to my customers”
These participants not only commented that Team Briefs were too rushed, but also that many of the
issues “glossed over” during Team Briefs were more suited to a Formal Training setting due to their
high importance:
“Too much information is now being pushed through team briefs. New products, processes,
campaigns, etc. should be allocated separate time away from team briefs. Too many
important details are glossed over, resulting in too much variation in customer
experience.”
…From an information perspective, sometimes briefs are used for explaining
products/services/systems that should have been done more formally, with more time spent
for practicing”

116
Some participants blamed other areas of the organisation for the time constraints imposed on their
supervisors during Team Briefs, as exemplified by these comments:
“Time allowances – Supervisors have so much to get through…no extra downtime is
allowed…the meeting then becomes rushed to get through all necessary points. This is in no
way the fault of the supervisor”
Frequency (New theme) Most participants commented that Team Briefs were too infrequent. As mentioned earlier,
participants not only craved Team Briefs as a means of breaking-up the monotony of their jobs, but
also needed them regularly in order to keep updated with important information. The following
comments touch on the latter point:
“Our team briefs are so infrequent that many times I feel undirected. Furthermore, a team
brief at the beginning of the night not only gives direction but it also assists with
motivation, which is very important to the job role…”
“We need briefs more regularly, as there are many things that need to be explained in more
detail”
This participant appeared extremely frustrated by the lack of Team Briefs conducted within his
sales team:
“We never bloody have them!!! The amount of team briefs have dropped from 1 per night in
1999 to 5 since February…that’s 5 and a half months with only 5 briefs.
The same participant added that those who missed Team Briefs were never updated with the
information at a later date:
“If you miss an important brief it doesn’t get re-briefed ever again. If you weren’t there
consider it never took place”
A number of participants also commented that they preferred Team Briefs as a means of
communication, as opposed to being emailed information:
“More briefs would be good at the start of the shift instead of emailed information”
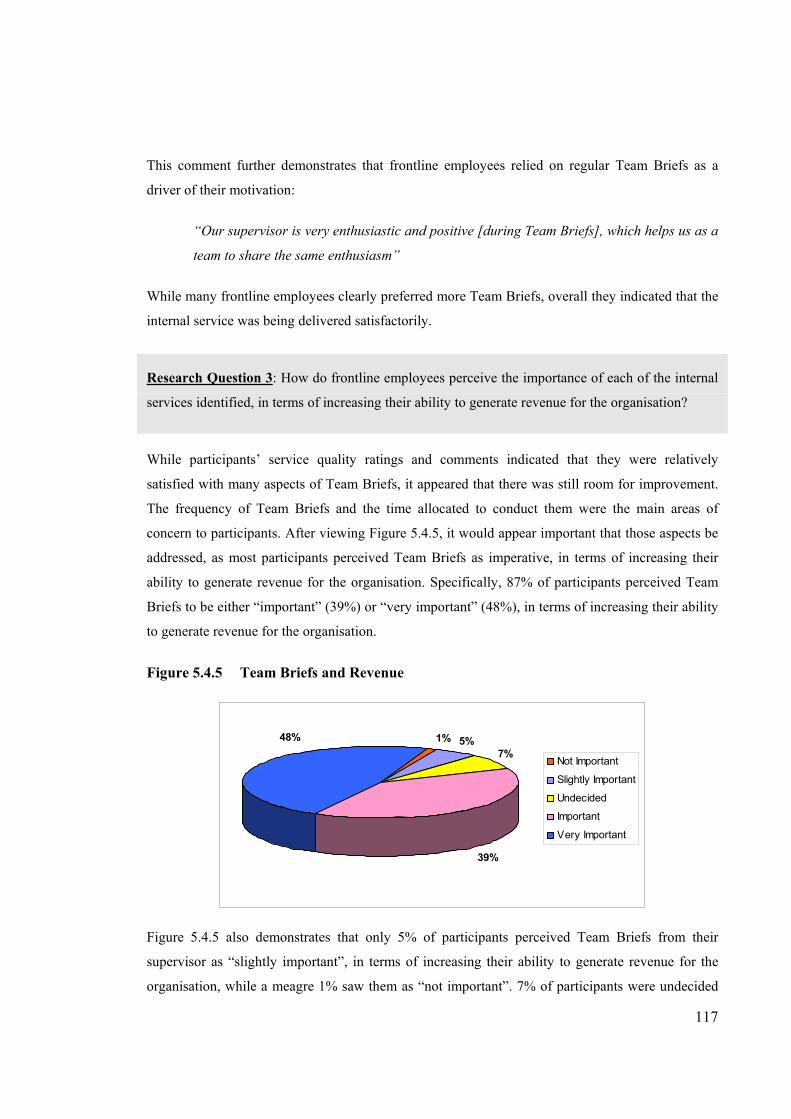
117
This comment further demonstrates that frontline employees relied on regular Team Briefs as a
driver of their motivation:
“Our supervisor is very enthusiastic and positive [during Team Briefs], which helps us as a
team to share the same enthusiasm”
While many frontline employees clearly preferred more Team Briefs, overall they indicated that the
internal service was being delivered satisfactorily.
Research Question 3: How do frontline employees perceive the importance of each of the internal
services identified, in terms of increasing their ability to generate revenue for the organisation?
While participants’ service quality ratings and comments indicated that they were relatively
satisfied with many aspects of Team Briefs, it appeared that there was still room for improvement.
The frequency of Team Briefs and the time allocated to conduct them were the main areas of
concern to participants. After viewing Figure 5.4.5, it would appear important that those aspects be
addressed, as most participants perceived Team Briefs as imperative, in terms of increasing their
ability to generate revenue for the organisation. Specifically, 87% of participants perceived Team
Briefs to be either “important” (39%) or “very important” (48%), in terms of increasing their ability
to generate revenue for the organisation.
Figure 5.4.5 Team Briefs and Revenue
1% 5%7%
39%
48%
Not Important
Slightly Important
Undecided
Important
Very Important
Figure 5.4.5 also demonstrates that only 5% of participants perceived Team Briefs from their
supervisor as “slightly important”, in terms of increasing their ability to generate revenue for the
organisation, while a meagre 1% saw them as “not important”. 7% of participants were undecided

118
on the issue. These figures indicate that much could be gained by conducting Team Briefs more
frequently and in a well-paced manner, as frontline employees appear to not only take away skills
and knowledge from them, but also motivation, which they have indicated helps them generate
more revenue during their exchanges with customers.
Internal Service Summary – Team Briefs Table 5.4.1 provides a summary of the key findings of this section as they relate to the study’s three
focal research questions:
Table 5.4.1 Internal Service Summary – Team Briefs
Research Question 1 Research Question 2 Research Question 3
Dimensions of "highest
importance" (Figure 5.4.3)
Other internal services with the
same/similar set of dimensions of
“highest importance”
% "very good" service ratings (Figure 5.4.4)
New themes to emerge through
comments
% "very important" ratings for the service
(Figure 5.4.5)
Importance of delivering
optimal internal service quality
- Reliability - Emails 27% - Interaction 48% Moderate - Responsiveness - Mgt. Presentations - Fun - Communication - Pace - Competence - Frequency

119
5.5 Emails Emails involved frontline employees receiving information from their supervisors relating to
marketing campaigns, product changes and performance-related issues.
Research Question 1: How do frontline employees perceive the importance of internal service
quality dimensions within each of the internal services identified?
Participants’ ratings of importance of the seven service quality dimensions in relation to the internal
service of Emails are summarised in Figure 5.5.1. Figure 5.5.1 Emails – Importance of Individual Service Quality Dimensions
79.40%
59.80%53.16%
35.22%
53.16%55.48%
62.13%
0.00%
10.00%
20.00%
30.00%
40.00%
50.00%
60.00%
70.00%
80.00%
90.00%
Reliability Communication Competence Responsiveness Access Understanding Tangibles
Dimensions
% o
f Par
ticip
ants
Not ImportantSlightly ImportantUndecidedImportantVery Important
Figure 5.5.1 shows that 79% of frontline employees perceived Reliability to be “very important”
when receiving Emails from their supervisor. Reliability was clearly the most strongly rated,
evidenced by the fact that the next strongest dimension – Communication – had only 62% of
respondents perceive it as “very important”. Similarly, Competence was seen as “very important”
by 60% of respondents, while 55% perceived Responsiveness to be “very important”. Access and
Understanding fared slightly lower, as both dimensions were perceived as “very important” by 53%
of frontline employees. Tangibles again seemed to be of least concern, as only just over a third
(35%) of frontline employees perceived it as “very important” when receiving Emails from their
supervisor.
Figure 5.5.1 therefore clearly demonstrates that the provision of correct and consistent information
was the most important component of Emails to frontline employees, relative to its value to them in

120
their customer service/sales role. The use of understandable language and terminology seemed to be
the next most important feature of Emails, closely followed by the level of competence displayed by
supervisors in answering any follow-up questions in relation to Emails sent. Other elements of the
internal service, such as the promptness of supervisors in forwarding Emails appeared to be less
important in comparison. Figure 5.5.2 represents participants’ rankings of the seven dimensions in order of importance in the
context of receiving Emails (1st and 2nd rankings are shown).
Figure 5.5.2 Emails – Ranked Dimensions (1st, 2nd)
61.78%
37.50%
20.71%
15.00%
23.57% 25.35%
16.07%
0.00%
10.00%
20.00%
30.00%
40.00%
50.00%
60.00%
70.00%
% o
f Par
ticip
ants
Reliability Responsiveness Understanding Communication Competence Tangibles Access
Dimensions
2nd Most Important
Most Important
Much like Figure 5.5.1, Figure 5.5.2 depicts Reliability as the standout dimension among
respondents, with 62% of frontline employees ranking it as either the most or second most
important dimension when receiving Emails from their supervisor. Respondents also acted quite
decisively when rating Responsiveness, as 38% ranked it as either the first or second most important
dimension. This was an outstanding statistic when one considers that in Figure 5.5.1 Responsiveness
was shown to be perceived as “very important” by only 55% of frontline employees, a similar score
to four other dimensions. The three dimensions Competence, Communication and Understanding
all attracted similar rankings, with 21% 24% and 25% of frontline employees respectively ranking
them as either the first or second most important dimension. Access and Tangibles appeared to be
least important, as they were perceived as either the first or second most important dimension by
15% and 16% of frontline employees respectively when receiving Emails from their supervisor.
Participants’ Overall Ratings and Rankings (Means) Participants’ highest ratings of importance (Figure 5.5.1) and highest rankings of importance
(Figure 5.5.2) indicated that they perceived the Reliability dimension as being particularly vital to

121
them, in terms of its impact on their job effectiveness. In order to provide a more comprehensive
indication of all the dimensions frontline employees perceived as most important to them when
receiving Emails, their overall ratings and rankings were incorporated into Figure 5.5.3.
Participants’ mean importance ratings (1-5) were plotted against their mean importance rankings
(1-7) for each of the seven dimensions, using the average of the seven mean importance ratings
(4.24) and the average of the seven mean importance rankings (4) as the graph’s x-y intercept point.
Figure 5.5.3 Emails – Participants' Ratings and Rankings of Service Quality Dimensions
(Means)
R eliability
R espo nsivenessC o mpetence
C o mmunicat io n
A ccessUnderstanding
T angibles
2
2.5
3
3.5
4
4.5
5
5.5
63.4 3.5 3.6 3.7 3.8 3.9 4 4.1 4.2 4.3 4.4 4.5 4.6 4.7 4.8 4.9
Participants' Perceptions of the Importance of Dimensions (M eans)
B. Highest Importance
C. Lowest Importance D. Moderate Importance
A. Moderate Importance
The positioning of each dimension within one of four quadrants – A. Moderate Importance; B.
Highest Importance; C. Lowest Importance; D. Moderate Importance – reflects frontline
employees’ overall perceptions of their importance in the context of receiving Emails from their
supervisors.
Figure 5.5.3 therefore indicated that Reliability, Responsiveness, Competence and Communication
were the service quality dimensions of “highest importance” to frontline employees, in terms of
having the most notable impact on their effectiveness on the job, while Access qualified as a
dimension of “moderate importance”. In practice, this means that frontline employees perceived
being supplied with correct and consistent information (Reliability), having Emails sent to them
soon after their supervisor receives them (Responsiveness), their supervisor having the training and
experience to be able to explain the Email further if needed (Competence), and having
understandable language and terminology used within the Emails (Communication), as being most
important to them when receiving Emails of high service quality. Furthermore, frontline employees

122
perceived having a supervisor that can be contacted or approached easily if Emails need to be
explained further (Access) as being of “moderate importance” to them.
The “highest importance” quadrant for this internal service portrays a similar trend to that shown
for the internal service Team Briefs. This is an interesting result considering the differences in the
two service delivery mediums. Thus, the “highest importance” quadrant in this instance also
portrays Reliability as the obvious standout dimension, with the remaining three dimensions in the
quadrant – Responsiveness, Competence and Communication – again closely clustered together,
thereby indicating that participants perceived those three dimensions, overall, to be of similar
importance to them. Participants commented on all four dimensions and their importance to this
internal service as follows:
“They are thorough and immediate and accurate”
“Generally they are passed on straight away”
“Supervisors need to be more aware of the products that are changing and be able to
answer any questions which may arise…”
“They are clear and easy to understand, which helps me save time”
Research Question 2: How do frontline employees perceive the overall quality of delivery of each
of the internal services identified?
Participants are likely to have considered factors such as the reliability of information they received,
the understandability of language and terminology, and the promptness of delivery when submitting
their service quality ratings for the internal service Emails, as the previous section’s results
indicated that these issues were most important to them.
Figure 5.5.4 indicates that participants rated the overall service quality of Emails similarly to how
they rated Team Briefs. To this end, 78% of participants perceived the Emails they received from
their supervisors to be of either “good” (59%) or “very good” (19%) overall service quality.
Participants therefore clearly favoured a rating of “good as opposed to “very good” in this instance.
Alternatively, only 7% of participants perceived the overall quality of the Emails they received

123
from their supervisors as “poor”, while almost none of the participants surveyed (1%) rated them as
“very poor”. 14% of participants remained undecided on the issue.
Figure 5.5.4 Emails – Service Quality Ratings
59%
14%
7%
1%
19%
Very Poor
Poor
Undecided
Good
Very Good
Participants’ follow-up comments provided insights into the aspects of Emails they felt were
performed well, together with those aspects they perceived needed improvement. The parts of the
internal service performed well are summarised as follows:
Direct and concise (New theme)
Easy to understand – Communication
Sent promptly – Responsiveness
Direct and concise (New theme) Most participants appeared satisfied with the length and detail of information contained in the
Emails they received. Direct and concise Emails made it easier for participants to understand
information, as the following comments demonstrate:
“Straight to the point, which makes them easier to understand”
“Short and to the point, able to take action immediately”
“Direct important information…means no problems understanding the information”
These participants indicated that direct and concise Emails were useful later as a quick reference
tool:
“They’re straight to the point and good to look back on for extra info”

124
“Emails are sent with summarised information about products and processes, and this is
good because we file them and go back to them to check details if we need to…”
The total time needed to read Emails was also minimized when they were short and concise,
perhaps leaving time for other tasks:
“The information is concise and relevant, which helps to eliminate the problem of time
wasting while reading emails”
Coupled with concise typewritten information, participants also appreciated Emails that provided
direct links to web pages, as it was an easy way for them to access all the relevant information:
“Emails with links that take you straight to the page is really handy or just the emails that
are short, but explains everything in a paragraph”
“Short and to the point with all information and links provided”
“They’re clearly set out with attachments to relevant areas”
Easy to understand – Communication Many participants also commented that Emails were generally easy to understand. The use of
everyday language and the limited use of jargon in Emails was clearly preferred by participants, as
the following examples demonstrate:
“The emails are prompt and informative and they try to use language that I can
understand”
“We receive updates often, they are easy to read and informative. Easily understood”
“When receiving emails they are always to the point with minimal jargon”
This participant felt that Emails were easiest to understand when they were forwarded on from the
original source without being altered in any way:
“The fact that they are usually forwarded from another person and left untouched…easy to
understand”

125
Most participants were reluctant to elaborate on this issue, and generally submitted short statements,
as demonstrated by these comments:
“They are clear and easy to understand”
“Clear and often simplified”
“Easy to understand”
Albeit through short and concise comments, the fact that participants showed that they felt
positively about this aspect of Emails is an important result, as the Communication dimension was
perceived as being of “highest importance” to them within this internal service (Figure 5.5.3).
Sent promptly – Responsiveness The majority of participants commented positively in relation to the promptness displayed by their
supervisors in sending through Emails. Supervisors appeared to send Emails to their subordinates
soon after receiving them themselves, which helped ensure frontline employees were kept updated
with important developments relevant to their jobs. This is shown by the following comments:
“They are emailed to us quickly and sent at appropriate times in regards to things
happening and changes made within the centre, which makes me feel as though I am kept
up-to-date at all times”
These participants indicated that Emails were sent in a timely manner so as to coincide with new
processes and/or product launches:
“…They are always sent immediately before a process is to be implemented or when a
product is available”
“Always sent prior to changes taking effect…”
“They are sent when needed, sent on time, especially if it’s about a new campaign…”
Coupled with prompt delivery, participants also appreciated when their supervisors delineated the
important Emails from the “nice to know” ones:
“We constantly receive appropriate information from our supervisor and its good when
we’re told which are important and which will assist us”

126
Below are examples of participants’ less expressive comments on this issue:
“Generally they are passed-on straight away”
“Soon as something changes we are informed straight away”
“The emails are always delivered on time”
“Are sent to us quickly after she has received them”
Like the positive comments related to the Communication dimension, these also become
increasingly significant when one considers that participants perceived the Responsiveness
dimension as being of “highest importance” to them when receiving Emails from their supervisor
(Figure 5.5.3).
While participants perceived three main components of this internal service to be performed well,
an equal number seemed to be in need of improvement. These are summarised as follows:
Inappropriate use of communication medium (New theme)
Too many Emails – Understanding
Not enough time allocated to read Emails (New theme)
Inappropriate use of communication medium (New theme) Many participants complained that some of the topics covered in Emails were more suited to a
Team Brief or Formal Training situation. This was mainly due to the importance and complexity of
some topics, where participants felt a Team Brief or Formal Training situation would facilitate
discussion and therefore foster greater understanding. This is reflected in the following comments:
“Increasingly, these [Emails] are used instead of Formal Training along with a team brief.
These should be used for important updates and reminders, and should not be a substitute
for separate Formal Training”
“Email cannot be the only way that we find out about new campaigns/products – need face-
to-face time for total explanation”

127
These three participants were unequivocal in expressing their feelings on this issue:
“Why an email? Why not a team brief? Would further clarify FAQ’s”
“Important emails need to be briefed instead”
“Don’t just send the emails – orally brief the people
This participant indicated that it was easier to remember information when an important Email was
followed-up with a Team Brief, as opposed to solely receiving an Email:
“I feel they need to be discussed, not just sent for us to deal with on our own, as they are
often sent for us to peruse and possibly learn, then nothing is mentioned about it once they
are sent, they seem to be forgotten about”
A somewhat similar message was conveyed by this participant, although he/she felt that Team
Briefs supported with paper-based reading materials was the correct mix when it came to launching
new marketing campaigns:
“I don’t think we should receive emails about campaigns. They should brief us at all times
and hand out all the right materials on campaign briefs…”
Too many Emails – Understanding Most participants were dissatisfied with the large volume of Emails they received from their
supervisors. Many commented that their supervisors forwarded Emails that were of little or no
importance to them, which often became frustrating, as time was wasted reading them. This is
demonstrated by the following comments:
“Too many low-priority emails sent out, which is really just eating up our time retrieving
them…”
“I don’t believe we need so many emails about revenue, stats, ratings, etc. This can be
interfering and a nuisance to read and delete if unnecessary”

128
This participant commented that reading unnecessary Emails wasted the time needed to achieve
performance targets and adequately service the organisation’s customers:
“Some emails may contain information that is not of use therefore taking up time that is
needed to achieve KPI’s and service our customers”
Many participants also complained about receiving too many Emails centred on the same issue.
This was not only frustrating because time was wasted reading the same subject information, but
also because many of the Emails contained information that was contradictory:
“There are too many emails about the same subject, and of course the answers change from
email to email, and then that info us different to all other sources of information”
“Sometimes we are bombarded with the same information on different emails. It’s hard to
tell which one is correct…”
This participant was so disillusioned by the volume of irrelevant Emails he/she received that he/she
compared them to “spam” mail, while also proclaiming that he/she now deletes most Emails before
even reading them as a result:
“We receive many emails that are useless and irrelevant to our day-to-day activities. More
often then not, I delete them without reading. This is a habit I’ve leant, as often you need to
sift through many items to find anything relevant…It can be compared to spam on public
webmail accounts; you get one email from a friend out of a 100 emails promoting
products”
These comments indicate that important Emails are sometimes lost among the large volumes of
irrelevant ones:
“Honestly…we receive soooooooooooooooooooooo many emails daily…that often the
importance of one is lost based on the sheer volume of email content received”
These are some of the more direct comments made by participants on this issue:
“Too many emails and amendments”
“It’s just that we get way too many”

129
“Sometimes there is too much junk”
Not enough time allocated to read Emails (New theme) Quite a number of participants felt that there was insufficient time allocated for them to read their
Emails. Based on the comments outlined in the previous section, one could assume that this would
become less of an issue if irrelevant Emails were filtered out. Nevertheless, participants felt that
time restrictions compromised their ability to effectively process the information contained in
Emails, as these comments illustrate:
“We need to be allocated more time to read through all the emails properly. We need to
actually read and digest all the information properly…”
“There is no time allocated for reading and/or responding to and/or implementing emails”
Various participants appeared to be clearly aware of the reason behind tight time restrictions on
reading Emails – quantitative performance statistics that monitored the time they spent off the
phones:
“We don’t have time to read all the emails in-depth, as we get sent so many of them in a
day, and we need to concentrate on our stats”
“Tend to become large amounts of information given with minimal time to read further due
to having to make stats. As a result we tend to skim over some emails…”
This participant indicated that Emails were often deleted unread, as a result of not having enough
time to read them. He/she acknowledged that highly important Emails were commonly among those
that were deleted:
“…Seriously, we have 4 hours on the phone, and we get about 20-30 emails each night with
heavy information, and no time to read them. I usually just hit the delete key and miss vital
information, and if I do read them, I skim over them and miss vital information
anyway’…what’s wrong with this picture?”

130
Many participants commented that time would be saved if all Emails were direct and to the point, as
too many of them were long-winded and time-consuming to read:
“…They should be more brief and to the point, therefore we don’t have to spend half our
shift reading these long emails”
These comments show that Emails represented an important form of communication to frontline
employees, although time constraints often precluded them from using it to their full advantage.
Research Question 3: How do frontline employees perceive the importance of each of the internal
services identified, in terms of increasing their ability to generate revenue for the organisation?
While participants’ service quality ratings indicated they were relatively satisfied with the Emails
they received from their supervisors, their comments showed that a number of improvements were
necessary. These improvements would likely shift the majority of participants’ ratings from the
“good” category to the “very good” category, in terms of rating the overall service quality of
Emails. Continuing to forward Emails promptly to frontline employees, coupled with improvements
to areas such as being more selective with the Emails sent to them would appear important actions,
in terms of the role Emails play in increasing frontline employees’ ability to generate revenue for
the organisation.
Figure 5.5.5 Emails and Revenue
3% 5%11%
44%
37% Not Important
Slightly Important
Undecided
Important
Very Important
Figure 5.5.5 illustrates that 37% of participants perceived the Emails they received from their
supervisor as “very important”, in terms of increasing their ability to generate revenue for the
organisation. Similarly, 44% perceived them as just “important”, while 11% were undecided on the

131
issue. 5% and 3% of frontline employees respectively perceived the Emails they received from their
supervisor as “slightly important” and “not important”, in terms of increasing their ability to
generate revenue for the organisation. Thus, only 8% of respondents selected either “slightly
important” or “not important” as their response to this question. These figures confirm the
importance of having a cohesive and efficient Emailing system for frontline employees, in the sense
that it ensures they are continually updated with important information that affects them during their
exchanges with customers, and as indicated improves their ability to make sales. Thus, better sales
results may ensue as a consequence of making the required improvements to the Email system.
Internal Service Summary – Emails Table 5.5.1 provides a summary of the key findings of this section as they relate to the study’s three
focal research questions:
Table 5.5.1 Internal Service Summary – Emails
Research Question 1 Research Question 2 Research Question 3
Dimensions of "highest
importance" (Figure 5.5.3)
Other internal services with the
same/similar set of dimensions of
“highest importance”
% "very good" service ratings (Figure 5.5.4)
New themes to emerge through
comments
% "very important" ratings for the service
(Figure 5.5.5)
Importance of delivering
optimal internal service quality
- Reliability - Team Briefs 19% - Pithiness 37% Moderate - Responsiveness - Mgt. Presentations - Suitability - Communication - Time to read - Competence
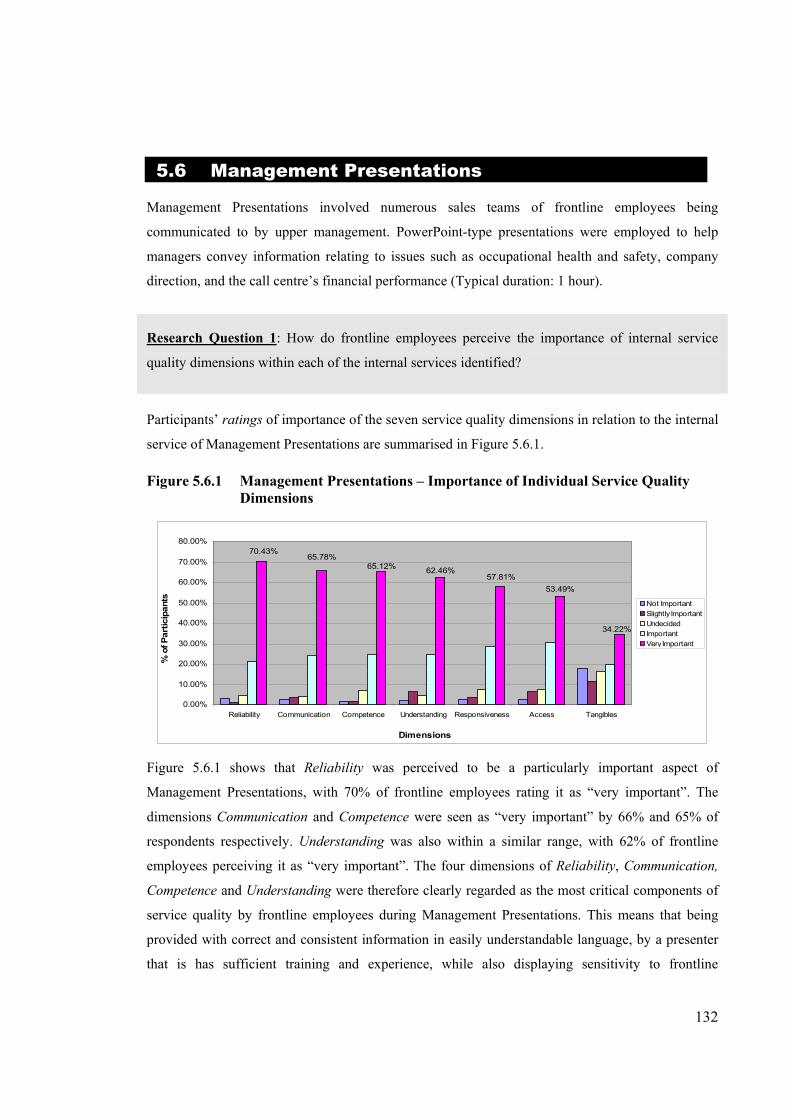
132
5.6 Management Presentations Management Presentations involved numerous sales teams of frontline employees being
communicated to by upper management. PowerPoint-type presentations were employed to help
managers convey information relating to issues such as occupational health and safety, company
direction, and the call centre’s financial performance (Typical duration: 1 hour).
Research Question 1: How do frontline employees perceive the importance of internal service
quality dimensions within each of the internal services identified?
Participants’ ratings of importance of the seven service quality dimensions in relation to the internal
service of Management Presentations are summarised in Figure 5.6.1. Figure 5.6.1 Management Presentations – Importance of Individual Service Quality
Dimensions
70.43%65.78%
53.49%
34.22%
57.81%65.12% 62.46%
0.00%
10.00%
20.00%
30.00%
40.00%
50.00%
60.00%
70.00%
80.00%
Reliability Communication Competence Understanding Responsiveness Access Tangibles
Dimensions
% o
f Par
ticip
ants Not Important
Slightly ImportantUndecidedImportantVery Important
Figure 5.6.1 shows that Reliability was perceived to be a particularly important aspect of
Management Presentations, with 70% of frontline employees rating it as “very important”. The
dimensions Communication and Competence were seen as “very important” by 66% and 65% of
respondents respectively. Understanding was also within a similar range, with 62% of frontline
employees perceiving it as “very important”. The four dimensions of Reliability, Communication,
Competence and Understanding were therefore clearly regarded as the most critical components of
service quality by frontline employees during Management Presentations. This means that being
provided with correct and consistent information in easily understandable language, by a presenter
that is has sufficient training and experience, while also displaying sensitivity to frontline

133
employees’ work needs and constraints, were the four most important service issues to frontline
employees, relative to their value to them in their customer service/sales role.
The service quality dimensions of Responsiveness and Access rated considerably lower in
comparison to the four aforementioned dimensions, as they were perceived as “very important” by
only 58% and 53% of frontline employees respectively. Tangibles was rated as “very important” by
only 34% of respondents in the context of Management Presentations. Figure 5.6.2 represents participants’ rankings of the seven dimensions in order of importance in the
context of attending Management Presentations (1st and 2nd rankings are shown).
Figure 5.6.2 Management Presentations – Ranked Dimensions (1st, 2nd)
52.14%
28.57% 28.22%
13.93%
31.07% 29.64%
16.42%
0.00%
10.00%
20.00%
30.00%
40.00%
50.00%
60.00%
% o
f Par
ticip
ants
Reliability Communication Understanding Responsiveness Competence Tangibles Access
Dimensions
2nd Most Important
Most Important
Figure 5.6.2 represents a set of results that are largely consistent with Figure 5.6.1. Reliability was
perceived as being either the most or second most important dimension during Management
Presentations by 52% of frontline employees; it was clearly perceived as the most important
dimension. Communication and Understanding were also highly ranked, and were seen as either
first or second most important dimension by 31% and 30% of frontline employees respectively.
Responsiveness was perceived as either the first or second most important dimension by 29% of
respondents, quite a high ranking since only 58% rated it as “very important”. On the other hand,
Competence was ranked either first or second most important by only 28% of frontline employees,
whereas 65% rated it as “very important” during Management Presentations. Tangibles and Access
were perceived as either first or second most important dimension by only 16% and 14% of
respondents respectively.
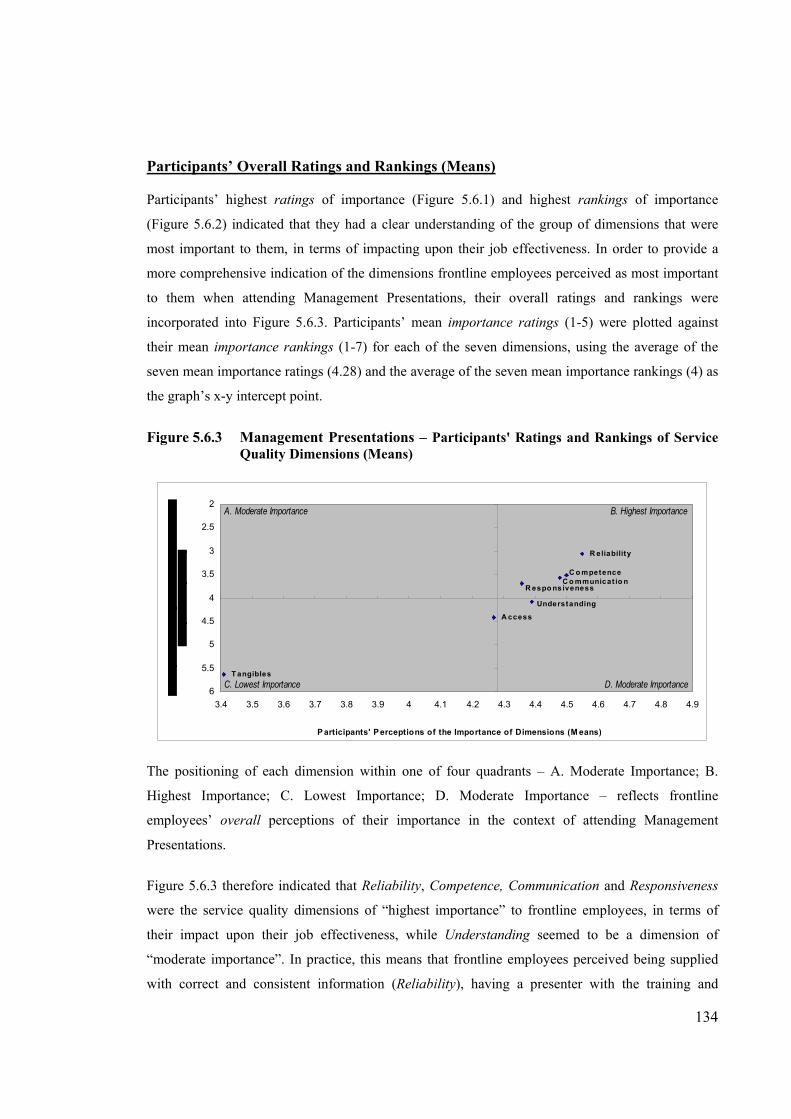
134
Participants’ Overall Ratings and Rankings (Means) Participants’ highest ratings of importance (Figure 5.6.1) and highest rankings of importance
(Figure 5.6.2) indicated that they had a clear understanding of the group of dimensions that were
most important to them, in terms of impacting upon their job effectiveness. In order to provide a
more comprehensive indication of the dimensions frontline employees perceived as most important
to them when attending Management Presentations, their overall ratings and rankings were
incorporated into Figure 5.6.3. Participants’ mean importance ratings (1-5) were plotted against
their mean importance rankings (1-7) for each of the seven dimensions, using the average of the
seven mean importance ratings (4.28) and the average of the seven mean importance rankings (4) as
the graph’s x-y intercept point.
Figure 5.6.3 Management Presentations – Participants' Ratings and Rankings of Service
Quality Dimensions (Means)
R eliability
T angibles
A ccess
Understanding
R espo nsivenessC o mmunicat io n
C o mpetence
2
2.5
3
3.5
4
4.5
5
5.5
63.4 3.5 3.6 3.7 3.8 3.9 4 4.1 4.2 4.3 4.4 4.5 4.6 4.7 4.8 4.9
Participants' Perceptions of the Importance of Dimensions (M eans)
B. Highest Importance
C. Lowest Importance D. Moderate Importance
A. Moderate Importance
The positioning of each dimension within one of four quadrants – A. Moderate Importance; B.
Highest Importance; C. Lowest Importance; D. Moderate Importance – reflects frontline
employees’ overall perceptions of their importance in the context of attending Management
Presentations.
Figure 5.6.3 therefore indicated that Reliability, Competence, Communication and Responsiveness
were the service quality dimensions of “highest importance” to frontline employees, in terms of
their impact upon their job effectiveness, while Understanding seemed to be a dimension of
“moderate importance”. In practice, this means that frontline employees perceived being supplied
with correct and consistent information (Reliability), having a presenter with the training and

135
experience to conduct the presentation properly (Competence), being spoken to in language and
terminology that is understandable (Communication), and having important questions answered
during the presentation (Responsiveness), as being most important to them when attending an
effective Management Presentation. Moreover, frontline employees perceived having a presenter
that was sensitive to their work needs and constraints (Understanding) as being of “moderate
importance” to them when attending Management Presentations.
The “highest importance” quadrant for this internal service depicts a similar result to that shown for
the two internal services of Team Briefs and Emails. This is very worthy of note considering the
stark differences in the service delivery mediums (particularly Email). The common trait that does
bind these services together, however, is that they all involve direct communication from managers
to frontline employees. Thus, participants may have thought about similar issues and past
experiences when evaluating the importance of the service quality dimensions in all three situations.
Participants commented on the four dimensions and their relevance to Management Presentations as
follows:
“The correct information is usually supplied and is very informative”
“Done in a professional manner and well practiced”
“Most of the information is presented in a way that is easy to understand”
“Sometimes presenters aren’t able to answer questions, they rarely follow-up as promised”
Research Question 2: How do frontline employees perceive the overall quality of delivery of each
of the internal services identified?
In deciding upon their service quality ratings for Management Presentations, participants are likely
to have considered factors such as the reliability of information they received, the general level of
competence displayed by the presenter, as well as the extent to which the presenter was able to
answer their important questions during the presentation, as the previous section’s results indicated
that these issues were most important to them.
Participants’ overall service quality ratings for Management Presentations fared similarly to those
submitted for the internal services of Team Briefs and Emails, in that most participants were

136
reluctant to rate it as “very good”, but rather settled for a rating of just “good”. To this end, Figure
5.6.4 illustrates that only 15% of frontline employees perceived the overall quality of Management
Presentations as being “very good”. A much larger 56% perceived them as “good”, while one in
five respondents were “undecided” on the issue. 7% of frontline employees saw the overall quality
of Management Presentations as “poor”, with only 2% perceiving them as “very poor”. Thus, the
high majority of participants appeared to be generally satisfied with the overall service quality of
Management Presentations.
Figure 5.6.4 Management Presentations – Service Quality Ratings
20%
7%
2%
15%
56% Very Poor
Poor
Undecided
Good
Very Good
Together with their service quality ratings, participants also provided comments, which outlined
both the aspects of Management Presentations they felt were being performed well, and those they
felt required improvement. The elements of Management Presentations they felt had been
performed well are summarised as follows:
Presenter discusses company direction and other relevant work issues (New
theme)
Statistics provided on the call centre’s overall performance (New theme)
The use of visual aids such as Microsoft PowerPoint (New theme)
Presenter discusses company direction and other relevant work issues (New theme) Numerous participants commented that a good aspect of Management Presentations was that the
information presented covered issues relevant to their work and the organisation’s direction. This
information gave participants an indication of coming events and changes that affected their
immediate working environment. These comments relate specifically to company direction:

137
“Good that they take the time. Info about plans and direction of the business is valuable to
understand where we fit”
“That they are enthusiastic and that they are giving us info about the company and where
we are headed as a whole”
These comments relate specifically to receiving information about general work issues:
“…Constant updates on the company and health and safety issues being acted upon”
“…Usually if issues are raised in the previous meeting they are readdressed the following
month even if they haven’t been resolved”
These participants’ comments indicated that receiving information about relevant work issues and
company direction ensured that Management Presentations remained interesting:
“They are thorough and informative, which means they are not boring”
“They are full of important information and therefore not boring”
Statistics provided on the call centre’s overall performance (New theme) There were indications that participants benefited from being presented with statistics that
summarised the call centre’s overall performance. As these comments show, the presentation of
statistics helped frontline employees place their contributions to the organisation into perspective:
“They are excellent in providing feedback on how he sales centre is doing overall. It also
brings everything together to illustrate the purpose of our job role to the bigger picture”
“The data shows, sales figures, graphs. Reports on satisfied customers. What we are not
doing so well and how we can improve the process”
Many participants also appreciated being kept informed about their progress, in terms of the degree
to which they had reached financial year sales targets:
“We are informed where we stand where we stand to date with our goals for the financial
year ahead”
“Where we are at and the targets that we have to achieve by a specified date…”

138
Participants also seemed to enjoy the presentation of statistics because it often prompted managers
to congratulate them on aspects of their work well done. This in turn appeared to have positive
implications for their job satisfaction levels:
“When they go through all the targets and congratulate us for exceeding the targets. Also
when they give away movie tickets”
“Lots of praise for employees helps you feel needed and appreciated, especially when it
comes from middle/higher management…”
Use of visual aids such as PowerPoint (New theme)
Numerous participants commented positively about the use of visual aids such as Microsoft
PowerPoint during Management Presentations. The use of such devices not only helped keep them
attentive, but also ensured that the information presented was clear and easy to interpret. These
comments address the attentiveness aspect:
“The presenters are very enthusiastic and they use visual aids to keep you interested”
“The way that they are presented using PowerPoint, they are fun and interesting, which
keeps us entertained while learning”
These participants discussed how visual aids helped make information easier to understand:
“Presenting the data in a way that’s easy to understand. Information presented is laid out
in a way that is easy to read and comprehend”
“The slides with graphs etc. which actually illustrates the point they are trying to make”
Many of the comments made on this issue were very direct, and not elaborated upon, as shown by
these examples:
“Good visual presentations”
“Slide shows to visually see how we are going”
“The PowerPoint presentations”

139
“Presentation of information, use of training aids (overheads), enthusiasm”
The comments highlighted so far provide a clear insight into the aspects of Management
Presentations participants perceived as performed well. At the same time, however, participants
perceived many aspects of Management Presentations to be in need of attention. These aspects are
summarised as follows:
Answering of important questions – Responsiveness
Too rushed (New theme)
Lack of empathy – Understanding
Answering of important questions – Responsiveness Many participants commented that important questions were often not answered during
Management Presentations. This appeared to frustrate them, even more so when managers promised
to follow-up with responses at later dates and then did not do so. This becomes an increasingly
important finding when considering that the Responsiveness dimension was perceived by
participants as being of “highest importance” to them during Management Presentations (Figure
5.6.3). Their comments on this issue read as follows:
“Sometimes when presenters aren’t able to answer questions, then they rarely follow-up as
promised”
“I personally asked something 4 months ago…nothing has been done. Therefore an issue
would be the speed at which issues are resolved”
One participant was particularly frustrated with the situation, not able to restrain him/herself from
making these comments:
“They don’t give a shit what we have to say, they never follow-up on shit and they only
promote their relatives”
When important questions were answered by managers, it was often done up to a month later during
the following Management Presentation. This was not soon enough in the eyes of participants, as
these comments indicate:
“…Feedback on unknown answers to questions is not given soon enough – waiting until the
next presentation to respond to a question is taking a month too long…”

140
This participant was a little more fortunate, in terms of the time taken to receive responses to his/her
important questions:
“…Generally the people in charge of passing on the information don’t have all the
information on hand…often having to get back to us in 2 weeks…”
Some participants offered suggestions in an attempt to help eradicate this problem:
“Perhaps having more than one presenter would help answer any unexpected questions
that may arise”
“…maybe a follow-up by email or a quick visit to see what has been done…even if no
action has been taken…”
Too rushed (New theme)
As has been the case with other internal services, many participants perceived Management
Presentations to be too rushed. As a result, the information presented was often not fully understood
by frontline employees, as these comments suggest:
“Presentations should not be rushed and time needs to be allocated so everyone comes out
with the same knowledge and understanding”
“I think presentations should be explained in a little more depth. It seems sometimes they
are rushed through but not really explained what each section is about”
A number of participants seemed to be aware of the main reason behind rushed presentations – their
performance statistics:
“Rushing through the presentations, as they want us back on the phones”
“Presentations are generally rushed through so we are not off the phones for too long…”
This problem could have seemingly been resolved if managers were more selective with the
information they presented. Hence, many participants felt managers wasted too much time
presenting information that was of little relevance to them, as these comments show:
“Too much time spent on things that don’t seem to matter to us and they get very boring…”

141
“…Much of the information is barely relevant to our general working environment…”
Lack of empathy – Understanding Many participants commented that managers did not understand their work needs and the
constraints they encountered within their roles. This appeared to cause a lot of resentment on the
part of frontline employees, as these comments demonstrate:
“Many presenters are not UNDERSTANDING of what we face with customers and systems,
they provide us with information that we know is crap or not possible”
“Need to be more aware of the roadblocks and problems that we face and be understanding
of those and be able to offer solutions…”
These participants inferred that managers did not consider them as equals, and as a result “looked
down” on them when they had something to say:
“Need to understand what we face as consultants and don’t look down on us when we ask
questions that they may not like”
“Need some ice breakers…break down the barriers of them vs. us…make it fun”
This participant commented that his/her motivation was adversely affected when managers
displayed a lack of understanding for the challenges and needs of the frontline employee role:
“…It is very obvious with some presenters that they are completely out of touch with what it
is like being on the phones. The major drawback of this is the info they present is not in line
with our needs…This can result in negative motivation”
It is essential that the significance of these comments is not understated, as the Understanding
dimension very nearly qualified as a dimension of “highest importance” to frontline employees
within this internal service (see Figure 5.6.3).

142
Research Question 3: How do frontline employees perceive the importance of each of the internal
services identified, in terms of increasing their ability to generate revenue for the organisation?
Many different themes and ideas were presented in relation to Management Presentations and their
overall service quality. Participants’ comments indicated that there were some aspects they were
satisfied with, whilst a number of areas seemed to be in need of attention. Figure 5.6.5 places the
importance of eradicating some of the problems related to Management Presentations into
perspective, as it shows how participants rated the importance of Management Presentations, in
terms of increasing their ability to generate revenue for the organisation.
Figure 5.6.5 Management Presentations and Revenue
8%
12%
17%44%
19%Not Important
Slightly Important
Undecided
Important
Very Important
Figure 5.6.5 shows that a high proportion of participants perceived Management Presentations as
being of little importance. More specifically, 20% of participants perceived Management
Presentations as being either “not important” (8%) or “slightly important” (12%), in terms of
increasing their ability to generate revenue for the organisation. There were, however, a larger
proportion of participants that had an opposing view. To this end, 19% of participants perceived
Management Presentations as “very important”, while a considerable percentage (44%) perceived
them as “important”. Quite a substantial proportion of participants (17%) also remained
“undecided” on this issue. While these figures show that Management Presentations may not be as
valuable to frontline employees as an internal service such as Formal Training, there would still
seem to be some benefit in ensuring problem areas were addressed. In particular, Management
Presentations appear to have an enormous capacity to motivate frontline employees. Thus,
improving aspects such as manager empathy could potentially translate into more sales, as staff feel
more motivated and appreciated.

143
Internal Service Summary – Management Presentations Table 5.6.1 provides a summary of the key findings of this section as they relate to the study’s three
focal research questions:
Table 5.6.1 Internal Service Summary – Management Presentations
Research Question 1 Research Question 2 Research Question 3
Dimensions of "highest
importance" (Figure 5.6.3)
Other internal services with the
same/similar set of dimensions of
“highest importance”
% "very good" service ratings (Figure 5.6.4)
New themes to emerge through
comments
% "very important" ratings for the service
(Figure 5.6.5)
Importance of delivering
optimal internal service quality
- Reliability - Team Briefs 15% - Relevance 19% Low - Communication - Emails (information) - Competence - Visual aids - Responsiveness - Pace
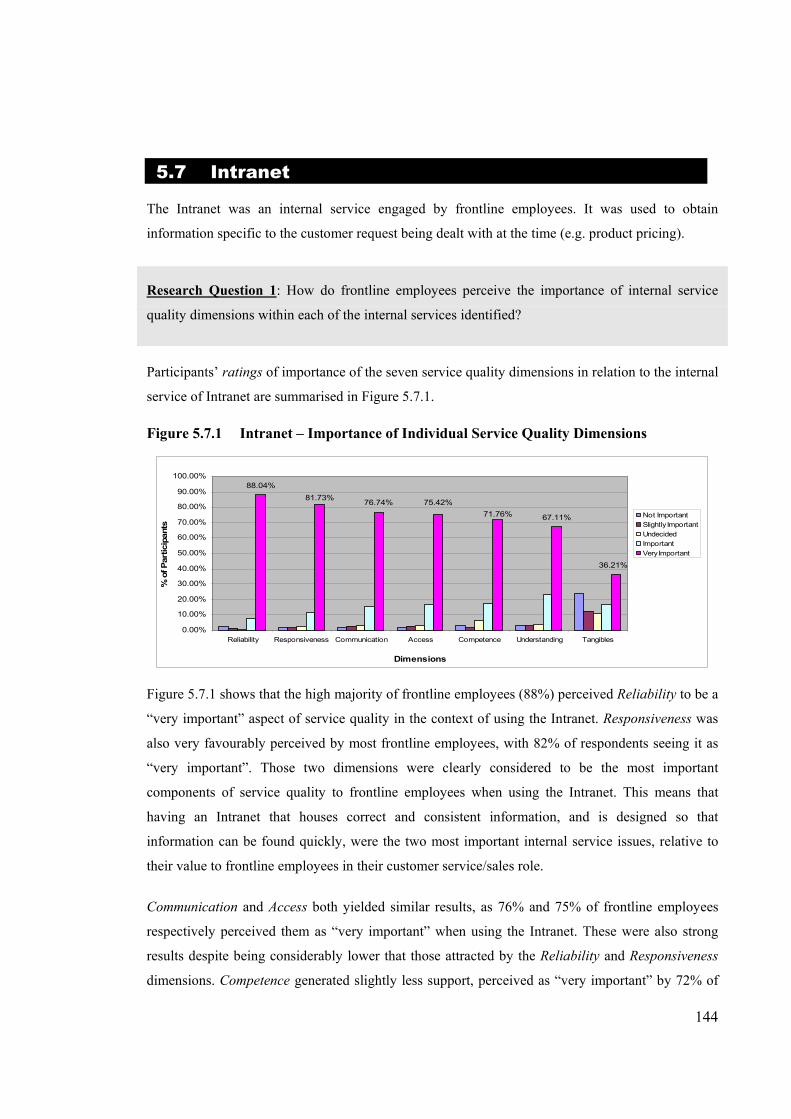
144
5.7 Intranet The Intranet was an internal service engaged by frontline employees. It was used to obtain
information specific to the customer request being dealt with at the time (e.g. product pricing).
Research Question 1: How do frontline employees perceive the importance of internal service
quality dimensions within each of the internal services identified?
Participants’ ratings of importance of the seven service quality dimensions in relation to the internal
service of Intranet are summarised in Figure 5.7.1. Figure 5.7.1 Intranet – Importance of Individual Service Quality Dimensions
88.04%
67.11%
81.73% 76.74% 75.42%
36.21%
71.76%
0.00%
10.00%
20.00%
30.00%
40.00%
50.00%
60.00%
70.00%
80.00%
90.00%
100.00%
Reliability Responsiveness Communication Access Competence Understanding Tangibles
Dimensions
% o
f Par
ticip
ants
Not ImportantSlightly ImportantUndecidedImportantVery Important
Figure 5.7.1 shows that the high majority of frontline employees (88%) perceived Reliability to be a
“very important” aspect of service quality in the context of using the Intranet. Responsiveness was
also very favourably perceived by most frontline employees, with 82% of respondents seeing it as
“very important”. Those two dimensions were clearly considered to be the most important
components of service quality to frontline employees when using the Intranet. This means that
having an Intranet that houses correct and consistent information, and is designed so that
information can be found quickly, were the two most important internal service issues, relative to
their value to frontline employees in their customer service/sales role.
Communication and Access both yielded similar results, as 76% and 75% of frontline employees
respectively perceived them as “very important” when using the Intranet. These were also strong
results despite being considerably lower that those attracted by the Reliability and Responsiveness
dimensions. Competence generated slightly less support, perceived as “very important” by 72% of

145
respondents, while Understanding was seen in the same light by 5% fewer respondents (67%).
Tangibles fared much worse than the other six dimensions, seen as “very important” when using the
Intranet by just 36% of frontline employees.
Figure 5.7.2 represents participants’ rankings of the seven dimensions in order of importance in the
context of using the Intranet (1st and 2nd rankings are shown).
Figure 5.7.2 Intranet – Ranked Dimensions (1st, 2nd)
67.14%
48.92%
15.71%
22.85%
15.36%
18.58%
11.43%
0.00%
10.00%
20.00%
30.00%
40.00%
50.00%
60.00%
70.00%
% o
f Par
ticip
ants
Reliability Responsiveness Access Understanding Competence Communication Tangibles
Dimensions
2nd Most Important
Most Important
Figure 5.7.2 reinforces the results shown by Figure 5.7.1, as Reliability and Responsiveness again
figured most prominently. Reliability was perceived as either the first or second most important
dimension when using the Intranet by 67% of frontline employees, while Responsiveness had just
under half of respondents (49%) see it as either the first or second most important dimension.
Access was ranked as either the first or second most important dimension by approximately one in
four respondents (23%), while Understanding was seen in that light by just under a fifth of the
frontline employees surveyed (19%). Competence and Communication were perceived as either the
first or second most important dimension when using the Intranet by a similar 16% and 15% of
frontline employees respectively. Predictably, Tangibles was seen as either the first or second most
important dimension in relation to the Intranet by only 11% of frontline employees.
Participants’ Overall Ratings and Rankings (Means) Participants’ highest ratings of importance (Figure 5.7.1) and highest rankings of importance
(Figure 5.7.2) indicated that they perceived two service quality dimensions in particular –
Reliability and Responsiveness – as being key components of this internal service, in terms of their
impact on their job effectiveness. In order to provide a more comprehensive indication of all the
dimensions frontline employees perceived as most important to them when using the Intranet, their

146
overall ratings and rankings were incorporated into Figure 5.7.3. Participants’ mean importance
ratings (1-5) were plotted against their mean importance rankings (1-7) for each of the seven
dimensions, using the average of the seven mean importance ratings (4.43) and the average of the
seven mean importance rankings (4) as the graph’s x-y intercept point.
Figure 5.7.3 Intranet – Participants' Ratings and Rankings of Service Quality Dimensions
(Means)
T angibles
UnderstandingC o mmunicat io n
R eliability
R espo nsiveness
A ccessC o mpetence
2
2.5
3
3.5
4
4.5
5
5.5
6
6.53.2 3.3 3.4 3.5 3.6 3.7 3.8 3.9 4 4.1 4.2 4.3 4.4 4.5 4.6 4.7 4.8 4.9 5
Participants' Perceptions of the Importance of Dimensions (M eans)
B. Highest Importance
C. Lowest Importance D. Moderate Importance
A. Moderate Importance
The positioning of each dimension within one of four quadrants – A. Moderate Importance; B.
Highest Importance; C. Lowest Importance; D. Moderate Importance – reflects frontline
employees’ overall perceptions of their importance in the context of using the Intranet.
Figure 5.7.3 therefore indicated that Reliability, Responsiveness, Access and Competence were the
service quality dimensions of “highest importance” to frontline employees, in terms of their impact
upon their job effectiveness, while Communication and Understanding seemed to be of “moderate
importance” to them. In practice, this means that frontline employees perceived being supplied with
correct and consistent information (Reliability), being able to find the information they need quickly
(Responsiveness), being able to locate and load-up the Intranet easily when needed (Access), and
having the Intranet designed and upgraded by people who have the training and experience to do
that job (Competence), as being most important to them when using an effective Intranet facility.
Moreover, frontline employees perceived having Intranet web pages that use language and
terminology that is understandable (Communication), as well as an Intranet that is designed and
upgraded by people who are sensitive to their work needs and constraints (Understanding) as being
of “moderate importance” to them.

147
The “highest importance” quadrant for this internal service displays a similar result to that shown
for the internal service Customer on Hold. This demonstrates how seemingly dissimilar internal
services can possess almost identical demand characteristics. Both internal services do share a
common feature though, in that frontline employees utilise them on an impromptu basis, while
being engaged with customers. Participants commented on the four service quality dimensions
within the “highest importance” quadrant as they related to using the Intranet as follows:
“At times information is incorrect and is not easy to find”
“It is reasonably quick and easy to locate the information needed”
“System is easy to load-up when needed”
“The people who designed it need to know how to make a search function that actually
works”
Research Question 2: How do frontline employees perceive the overall quality of delivery of each
of the internal services identified?
Participants are likely to have considered factors such as the reliability of information they had
received, the speed in accessing information, and the overall ease in accessing the Intranet when
submitting their service quality ratings for the Intranet, as the previous section’s results indicated
that these issues were most important to them.
Participants’ overall service quality ratings for the Intranet were extremely positive. Figure 5.7.4
illustrates that 78% of frontline employees perceived the Intranet to be of either “good” or “very
good” overall service quality. Of the 78% of respondents, 21% perceived the Intranet as “very
good”, while a considerable 57% perceived it to be “good”. 11% of frontline employees were
“undecided” on the question, while only 8% of participants perceived the overall quality of the
Intranet as “poor”. An even smaller number of frontline employees perceived it as “very poor”
(3%).

148
Figure 5.7.4 Intranet – Service Quality Ratings
11%
8%
3%
21%
57%
Very Poor
Poor
Undecided
Good
Very Good
Participants’ service quality ratings were supported with comments, which outlined both the aspects
of the Intranet they felt were being done well, coupled with those aspects they felt required
improvement. The aspects of the Intranet participants felt had been performed well are summarised
as follows:
Quick and easy to find information – Responsiveness
Information is easy to understand – Communication
Easy to load-up – Access
Quick and easy to find information – Responsiveness A considerable number of participants commented that the Intranet was generally very user-
friendly, which is an important result considering that the Responsiveness dimension emerged as
being of “highest importance” to frontline employees within this internal service (Figure 5.7.3).
Participants indicated that information was accessible quickly and easily when required, which
aided them in providing more effective and efficient customer service. These comments reflect this:
“The homepage has instant links to most used information, that is handy as this takes me
fast to the place I need to be at that time”
“Generally easy to find the information quickly. This helps when you have a customer that
is in a hurry”

149
This participant indicated that a user-friendly Intranet facility saved time overall, as it meant not
having to wait for a supervisor to come and provide assistance:
“Everything is easily found…saves time waiting for a supervisor who never comes”
These comments indicate that the speed and ease of finding information on the Intranet was largely
attributable to its visual layout:
“Products are easy to find – listed alphabetically”
“Nicely laid out. Easily accessible things like descriptions, pricing, incompatibilities, etc.”
“…Each part is segmented so it’s quick and easy to find the information”
These comments provide further evidence of frontline employees’ reliance on a responsive Intranet
facility as a source of information:
“It’s easy to locate and use, and we know that everything we need to know is there and is
therefore very reassuring”
“I like the fact that it’s the one spot we go to for info on products and services – it’s like a
bible…”
Information is easy to understand – Communication Many participants commented that information within the Intranet was easy to read and understand.
Most comments on this issue were very short and concise, as these examples demonstrate:
“Information is presented in a clear concise way”
“The use of language that is easy to understand…”
“Almost all information required is set out in an easy to understand way”
“…explain everything in basic and comprehendible terms”
These participants were a little more specific about the parts of the Intranet that had easy to
understand language and terminology:
“Work instructions usually make sense and are easily followed”

150
“Easy to follow links and information on phones”
Easy to load-up – Access Many participants commented that the Intranet was easy to locate and load-up when needed.
However, like their comments in the previous section, participants chose not to elaborate any
further than this. These are typical examples of comments made by participants concerning the ease
of locating and loading-up the Intranet:
“Loads up quickly and easily…”
“It’s easy to access; all the products are available to view”
“It’s easy to locate and use…”
“System is easy to load-up”
Although information to this effect was not provided, one could infer that frontline employees
would have likely commented that more efficient customer service resulted from having an Intranet
facility that was easy to locate and load-up when required. Participants’ satisfaction with this aspect
of the Intranet is a significant finding, as the Access dimension was rated as being of “highest
importance” to them within this internal service (Figure 5.7.3).
Participants appeared to be satisfied with a number of aspects of the Intranet, despite being reluctant
to elaborate on their thoughts in most instances. They were a lot more willing to fully express their
point of view, however, when prompted on the aspects of the Intranet they felt required
improvement. To this end, participants perceived the following aspects of the Intranet to be in need
of improvement:
Incorrect information – Reliability
Too much irrelevant information (New theme)
Ineffective search function (New theme)
Session time-outs (New theme)
Incorrect information – Reliability Numerous participants commented that the Intranet contained too much incorrect information. This
was attributable to information being either out-of-date, or simply recorded incorrectly initially.

151
This is an important finding in light of the fact that the Reliability dimension was perceived by
participants as being of “highest importance” to them within this internal service (Figure 5.7.3).
Participants’ comments in relation to the issue of outdated information, and how it affected their
exchanges with customers read as follows:
“Updating of information is needed to be able to supply the customer with the correct
information…a lot of times you are told to refer to [the Intranet]…and you find the
information is actually wrong”
“…needs to be more regularly updated…so many times I have a question by a customer
and there is no answer given to that question…therefore it is no help at all!”
These comments provide further insights into the effects of the Intranet’s lack of reliable
information:
“The reliability factor has yet to exist during the 8 months of employment that I have been
here…Constantly supplying incorrect information…leads the consultant to take the blame
for something that he/she is genuinely trying to do correctly”
“The reliability of the information to be correct…there is no 100% guarantee that the info
is correct, as we have seen in many instances where the info is wrong”
This participant’s comments indicate that he/she had lost total confidence in the Intranet as a
reliable source of information:
“…Information is shaky at best… some have the same incorrect information for months.
When we were trained, we were told [the Intranet] was the bible, but it’s more useful to
seek out a supervisor”
One participant suggested that a lack of accountability was the root of this problem, and
recommended that someone within the company take personal responsibility for maintaining the
reliability of information on the Intranet:
“…Somebody has got to stop passing the blame around and step up, and say that he/she
will make sure [the Intranet] is constantly updated by the hour, because its reliability
affects EVERYONE and their reputation”

152
Too much irrelevant information (New theme) As was the case with Online Training modules, many participants commented that the Intranet
contained a considerable amount of irrelevant information. As a result, time was often wasted
sifting through large chunks of information that was of little or no use in order to find a small piece
of relevant information. This participant’s comments reflect this:
“Sometimes info is just too hard to find, especially if a customer is waiting for an answer.
Once a section is found the relevant info can be hidden amongst irrelevant info”
These participants put forth a similar viewpoint, and suggested that the use of tables and summaries
could help solve this problem:
“It’s very difficult to find the information you need immediately. This is especially
contributed by the fact that there are no summarised tables, everything is in essay format”
“…More use of tables, summaries and flowcharts, etc., which will make it much easier to
find and interpret the info when on the phone”
These participants attributed the problem of too much irrelevant information to the fact that the
Intranet is designed to act as an information source to too many different areas of the organisation:
“In some sections it contains a lot of product codes that we don’t really use in this centre –
so in some cases finding information can be hard…”
“…always written for other areas and not for the needs of our workplace”
Ineffective search function (New theme) Many participants commented that the Intranet lacked an effective search function. This in turn
affected their ability to find the information they needed in the quickest possible time. These
comments provide evidence of this:
“The search engine needs to be able to pick up more words and take you to the
products/services related to these. This would assist in minimizing the time it takes to follow
pathways to find information – an often time consuming task”

153
These participants’ comments indicate that the search function often brought up irrelevant results:
“Search field – all information found on the search is generally nor relevant to the search
option”
“Search function on [the Intranet] is not very reliable, as it doesn’t bring up the required
information if you don’t know where to look for it”
This participant commented that the search function was particularly ineffective when seeking
information about new or old product promotions:
“Access to information via the search function – too often you put in a search and the
search button cannot locate it, especially when looking for a new or old promotion”
Session time-outs (New theme)
Various participants expressed their frustration with the fact that the Intranet often “timed out”,
which meant they were forced to log back in. This was seen as an unnecessary inconvenience and
waste of time, and ultimately translated into prolonged customer waiting times. These comments
exemplify this:
“It is a big pain when you are not in [the Intranet] for a certain period of time and it logs
you out. Even though it does not take a great deal of time to get back in, if you have a
customer who is on hold waiting for you to get the information they can get a bit impatient
waiting for you to log back in”
“… [The Intranet] always seems to log me out, so I have to log back in and wait for it to
load up again, meanwhile the customer is left waiting”
These comments indicate that session time-outs adversely affected frontline employees’ job
satisfaction levels:
“The really annoying thing about it is that it logs out if you haven’t used it for an hour,
which when you are on a call and need to look at something quickly, is really frustrating”
“…the fact that it times out far too often, this is very, very frustrating…”

154
This participant commented that he/she would be encouraged to use the Intranet more if session
time-outs were eliminated:
“…It disappears after about 10, 20 minutes…I would use it more if it was open all day”
Participants therefore felt positively about the Intranet in general, but required it to have less
interruptions for them to be more satisfied with its operational effectiveness.
Research Question 3: How do frontline employees perceive the importance of each of the internal
services identified, in terms of increasing their ability to generate revenue for the organisation?
Many different concepts and ideas were conveyed by participants in relation to the Intranet and its
overall service quality. Participants were clearly more passionate in presenting their views about the
aspects of the Intranet requiring improvement then commenting on those aspects performed well.
Figure 5.7.5 places the urgency of making the necessary improvements into perspective, as it shows
participants’ ratings of importance of the Intranet, in terms of its impact in increasing their ability to
generate revenue for the organisation.
Figure 5.7.5 The Intranet and Revenue
2% 27%
64%
5%2%Not Important
Slightly Important
Undecided
Important
Very Important
Figure 5.7.5 shows that 64% of frontline employees perceived the Intranet to be “very important”,
in terms of increasing their ability to generate revenue for the organisation. Another 27% saw the
Intranet as “important”, thus meaning that a total of 91% of frontline employees perceived the
Intranet to be either “important” or “very important”. 5% of respondents were “undecided” on the
question, while 2% felt the Intranet was “slightly important” in terms of increasing their ability to

155
generate revenue for the organisation. Only a further 2% perceived the Intranet to be “not
important”.
These figures indicate that it is vitally important that particular aspects of the Intranet continue to be
performed well, but also that those areas requiring improvement are given due attention.
Acknowledging this would appear to be in the best interests of the organisation, as ensuring the
Intranet operates in a more effective and efficient manner would seemingly translate into greater
sales volumes, as frontline employees seem reliant on it for important pieces of information that
help them convince customers of the viability and benefit of particular products.
Internal Service Summary – The Intranet Table 5.7.1 provides a summary of the key findings of this section as they relate to the study’s three
focal research questions:
Table 5.7.1 Internal Service Summary – The Intranet
Research Question 1 Research Question 2 Research Question 3
Dimensions of "highest
importance" (Figure 5.7.3)
Other internal services with the
same/similar set of dimensions of
“highest importance”
% "very good" service ratings (Figure 5.7.4)
New themes to emerge through
comments
% "very important" ratings for the service
(Figure 5.7.5)
Importance of delivering
optimal internal service quality
- Reliability - Customer on Hold 21% - Relevance 64% High - Responsiveness - Systems Support (information) - Access - Computer Programs - Search function - Competence - Interruption

156
5.8 Systems Support Systems Support was an internal service initiated by frontline employees. A Systems Support
person was contacted for assistance in situations where a fault occurred with a frontline employee’s
computer.
Research Question 1: How do frontline employees perceive the importance of internal service
quality dimensions within each of the internal services identified?
Participants’ ratings of importance of the seven service quality dimensions in relation to the internal
service of Systems Support are summarised in Figure 5.8.1. Figure 5.8.1 Systems Support – Importance of Individual Service Quality Dimensions
81.40%
70.76% 68.44%72.76%
44.85%
63.79%
77.41%
0.00%
10.00%
20.00%
30.00%
40.00%
50.00%
60.00%
70.00%
80.00%
90.00%
Competence Reliability Responsiveness Access Communication Understanding Tangibles
Dimensions
% o
f Par
ticip
ants
Not ImportantSlightly ImportantUndecidedImportantVery Important
Figure 5.8.1 shows that Competence was perceived as being a critical aspect of Systems Support,
with 81% of frontline employees rating it as a “very important” service quality dimension. Closely
behind was Reliability, seen as “very important” by 77% of respondents. Responsiveness also
generated strong support, and was perceived as “very important” by 73% of respondents. The three
dimensions of Competence, Reliability and Responsiveness were therefore regarded as the most
critical aspects of service quality to staff in the Systems Support situation. This means that having a
computer problem fixed the first time, by a well trained and experienced Systems Support person,
who comes to provide assistance quickly were the three most important internal service issues to
frontline employees, relative to their value to them in their customer service/sales role.
Access generated a slightly lower rating than Responsiveness, with 71% of frontline employees
perceiving it as being a “very important” dimension when receiving Systems Support. Considerably

157
lower, Communication and Understanding both gained similar results, and were perceived as “very
important” by 68% and 64% of frontline employees respectively. Tangibles was of even less
concern, with only 45% of frontline employees perceiving it as “very important” when receiving
Systems Support. Figure 5.8.2 represents participants’ rankings of the seven dimensions in order of importance in the
context of receiving Systems Support (1st and 2nd rankings are shown).
Figure 5.8.2 Systems Support – Ranked Dimensions (1st, 2nd)
56.43% 56.79%
28.22%
18.93%
8.93%
17.14%13.58%
0.00%
10.00%
20.00%
30.00%
40.00%
50.00%
60.00%
% o
f Par
ticip
ants
Responsiveness Reliabiliy Competence Access Understanding Tangibles Communication
Dimensions
2nd Most Important
Most Important
Figure 5.8.2 largely corroborates the results depicted by Figure 5.8.1, in that Reliability,
Competence and Responsiveness figured most prominently. Responsiveness and Reliability were
particularly outstanding, seen as either the first or second most important dimension when receiving
Systems Support by 57% and 56% of frontline employees respectively. Competence generated less
high rankings than one might have anticipated, but was still seen as either first or second most
important dimension by 28% of respondents. Access and Understanding attracted similar results,
and were seen as either the first or second most important dimension by 19% and 17% of frontline
employees respectively. Tangibles was seen as either the first or second most important dimension
when receiving Systems Support by just 14% of respondents, while an even smaller proportion
(9%) saw Communication in the same light.
Participants’ Overall Ratings and Rankings (Means) While participants’ highest ratings of importance (Figure 5.8.1) displayed a relatively even trend,
their highest rankings of importance (Figure 5.8.2) indicated that three dimensions in particular –
Reliability, Responsiveness and Competence – were of key value to them, in terms of their impact
on their job effectiveness. In order to provide a more comprehensive indication of the dimensions

158
frontline employees perceived as most important to them when receiving Systems Support, their
overall ratings and rankings were incorporated into Figure 5.8.3. Participants’ mean importance
ratings (1-5) were plotted against their mean importance rankings (1-7) for each of the seven
dimensions, using the average of the seven mean importance ratings (4.47) and the average of the
seven mean importance rankings (4) as the graph’s x-y intercept point.
Figure 5.8.3 Systems Support – Participants' Ratings and Rankings of Service Quality
Dimensions (Means)
T angibles
UnderstandingC o mmunicat io n
A ccessC o mpetence
R espo nsivenessR eliability
2
2.5
3
3.5
4
4.5
5
5.5
63.4 3.5 3.6 3.7 3.8 3.9 4 4.1 4.2 4.3 4.4 4.5 4.6 4.7 4.8 4.9
Participants' Perceptions of the Importance of Dimensions (M eans)
B. Highest Importance
C. Lowest Importance D. Moderate Importance
A. Moderate Importance
The positioning of each dimension within one of four quadrants – A. Moderate Importance; B.
Highest Importance; C. Lowest Importance; D. Moderate Importance – reflects frontline
employees’ overall perceptions of their importance in the context of receiving Systems Support.
Figure 5.8.3 therefore indicated that Responsiveness, Reliability, Competence and Access were the
service quality dimensions of “highest importance” to frontline employees, in terms of their impact
upon their job effectiveness, while Communication seemed to be a dimension of “moderate
importance”. In practice, this means that frontline employees perceived receiving quick assistance
(Responsiveness), having the problem fixed properly the first time (Reliability), having a Systems
Support person that has the training and experience to do the job (Competence), and being able to
contact or approach the Systems Support person easily (Access), as being most important to them
when receiving effective Systems Support. Moreover, frontline employees perceived having a
Systems Support person that made a genuine effort to listen to them (Communication) as being of
“moderate importance” to them.

159
The “highest importance” quadrant for this internal service parallels those shown for the internal
services Intranet and Customer on Hold. As mentioned in the previous section, this may be
attributable to the fact that such internal services are predominantly utilized by frontline employees
on a spur-of-the-moment basis during their exchanges with customers. Participants commented on
the four “highest importance” dimensions as they related to them in the Systems Support situation
as follows:
“Quick solutions to most problems and timely response”
“If they are there, usually able to fix it first time”
“Contactable easily and quickly on mobile”
“Well trained, understand the problem pretty well straight away”
Research Question 2: How do frontline employees perceive the overall quality of delivery of each
of the internal services identified?
In submitting their overall service quality ratings for Systems Support, participants are likely to
have considered factors such as the ability of Systems Support personnel to fix problems the first
time, the ease in being able to contact Systems Support personnel, as well as the promptness
displayed by Systems Support personnel when providing assistance, as the previous section’s
results indicated that these issues were most important to them.
Participants’ overall service quality ratings for Systems Support were very positive. Figure 5.8.4
illustrates that a third of frontline employees (33%) perceived the overall quality of the Systems
Support they received to be “very good”. A further 41% of respondents perceived Systems Support
to be of “good” overall quality, while 13% were “undecided”. This shows that participants were
divided in terms of the degree to which they were satisfied with the Systems Support they received.
At the other end of the scale, only one in ten respondents (10%) felt the Systems Support they
received was “poor”, while just 3% perceived it to be “very poor”.

160
Figure 5.8.4 Systems Support – Service Quality Ratings
41%
13%
10%
3%
33%
Very Poor
Poor
Undecided
Good
Very Good
Participants supported their service quality ratings with comments, which outlined both the aspects
of Systems Support they felt had been performed well, as well as those aspects they perceived
required improvement. The elements of Systems Support participants felt had been performed well
are summarised as follows:
Quick to arrive and fix problems – Responsiveness
Problems are fixed the first time – Reliability
Understanding of problems – Competence
It is important to note here that the three dimensions highlighted above – Responsiveness,
Reliability and Competence – were also perceived by participants as being of “highest importance”
to them when receiving Systems Support (Figure 5.8.3). Participants’ favourable comments in
relation to them therefore take on a greater meaning in this instance.
Quick to arrive and fix problems – Responsiveness Many participants commented that Systems Support personnel were not only prompt in arriving to
provide assistance, but were also quick in identifying problems and fixing them. These comments
demonstrate this:
“They come around quickly and are very good at solving the problem almost immediately”
“Systems support are usually very quick to fix the problem and come to your assistance
quickly”

161
Systems Support personnel were even able to offer quick makeshift solutions when more complex
problems arose that required attention at a later time:
“Quick to resolve the problem and offer possible solutions if the entire problem cannot be
rectified immediately”
“Quickly tries to fix the problem, and if she can’t, then offers a quick alternative to try in
the meantime”
These participants were particularly satisfied with the responsiveness exhibited by Systems Support
personnel, which would seemingly also have positive implications for their job satisfaction levels in
general:
“Every time I’ve had a problem it has been corrected almost immediately. Systems support
at [name of organisation] is top notch”
“Phil is always there quickly like he had 8 arms and legs”
“Always there and very quick response…excellent in this aspect”
Problems are fixed the first time – Reliability Numerous participants commented that their systems problems were usually fixed properly the first
time. Thus, Systems Support personnel seemed to have the ability to work both efficiently and
accurately when rectifying systems problems. These are some of the typical comments made by
participants on this issue:
“The job is usually fixed first time”
“Usually problem is fixed quickly the first time”
“Fixed permanently, problem doesn’t reoccur”
Reliable Systems Support also ensured that any negative impact upon participants’ performance
statistics was kept to a minimum:
“When the systems support person comes to fix the problem it is always fixed properly and
this means my stats aren’t too badly affected”

162
These comments indicate further just how important reliable Systems Support was to participants:
“Kay is one of the most valuable resources we have in the centre. She understands the
importance of having things fixed properly the first time and doesn’t give vague answers”
Understanding of problems – Competence
Many participants also commented positively on the level of expertise displayed by Systems
Support personnel when attending to systems problems. These are some of the general comments
made about this issue:
“They attend to SP’s [sales professionals] readily and the systems support people are
competent”
“The systems support staff generally understand whatever problems I experience and have
the competence to resolve the issue quickly”
As shown by these comments, Systems Support personnel often drew upon their training and
experience to educate frontline employees on how to avoid future systems problems:
“Often the support person will explain why a problem has occurred, this helps so that you
can potentially avoid a similar situation in future, or know how to fix it yourself if able”
This participant also seemed impressed by the high standard of knowledge displayed by Systems
Support personnel:
“Have all the knowledge about systems that’s required plus more…future problems are
prevented by back-ups that the support staff also assist with”
The comments outlined to this point show that participants were satisfied with a number of key
aspects of Systems Support. Interestingly, the areas viewed as performed well were also the same
key areas participants perceived to be of “highest importance” to this internal service (Figure 5.8.3).
There were, however, some aspects of Systems Support participants were dissatisfied with. These
aspects have been summarised below:
Lack of Systems Support personnel (New theme)
Impersonal Systems Support service (New theme)
Lack of courtesy (New theme)

163
Lack of Systems Support personnel (New theme) Most participants commented that additional Systems Support personnel were required within the
call centre. These are some of the typical comments to that effect:
“The only improvement needed is we need more than one person for systems support. At the
moment I’ve only seen one”
“Sometimes this area is short staffed…they could do with more staff”
Although many participants commended the responsiveness of Systems Support personnel, others
believed that there was scope for improvement in this area. They commented that a lack of Systems
Support personnel caused frontline employee and customer waiting times to be longer than
necessary:
“The fact that sometimes it takes a while to get hold of systems support because there are
only a few of them”
“We need more systems support people on the floor. When you call 1 person and he has 10
calls at that time, thus the customer is waiting for a long time…”
These participants felt that they would receive a more well-rounded service if additional Systems
Support personnel were employed:
“More systems support staff so the systems staff can spend more time with SP’s [sales
professional] so we can understand problems
“More staff on, as often staff are run off their feet, which stresses them and often means we
only get quick explanations. There is little time to discuss the problem and fully understand
what to do next time should that difficulty arise”
Impersonal Systems Support service (New theme)
A considerable number of participants expressed dissatisfaction with the fact that they sometimes
had to call a 1300 number in order to receive Systems Support. This appeared to be a less efficient
process, while also creating confusion among frontline employees, as they were often faced with the

164
task of fixing problems themselves after following a series of instructions. These comments
demonstrate this:
“When we need to go through IT support to fix problems the whole system becomes
convoluted and much more difficult. We need an IT specialist on hand…”
“Having to call a 1300 number is more time consuming and not as easy to get the problem
fixed myself compared to having support personnel”
This participant commented that a lack of onsite support meant that some systems problems were
left unsolved for several days:
“…Some problems still not fixed for several days, as there is no one nearby that we can go
to so they can fix the problem”
This participant commented on how this process adversely affected his/her performance statistics:
“…It negatively affects our results…we now have to ring IT support, which is not very
efficient as they are always busy. Therefore problems can take a while to be fixed”
Lack of courtesy (New theme) Many participants were of the view that Systems Support personnel lacked courtesy and
exhibited a negative attitude. This appeared to frustrate frontline employees, and therefore also
likely negatively impacted upon their job satisfaction levels. These comments reflect this view:
“Lighten up. It’s not our fault that computer system is hopeless. A hello and a smile is nice
every once in a while”
“Two of the other systems support people, who make it feel like it is a pain in the arse for
them to assist you – you are an interruption to them”
This negativity made some frontline employees feel nervous about asking for assistance:
“Sometimes the systems guys present a negative attitude towards staff who have systems
problems, which makes the SP [sales professional] apprehensive when requesting
assistance”

165
Courtesy seemed to be lacking irrespective of the size of systems problems reported by frontline
employees:
“The level of service provided by the staff over the phone is terrible. They have attitude
towards staff for any problem big or small”
It was therefore clearly apparent that frontline employees demanded a certain level of respect from
their internal suppliers, and it annoyed them when it was grossly lacking.
Research Question 3: How do frontline employees perceive the importance of each of the internal
services identified, in terms of increasing their ability to generate revenue for the organisation?
Participants as a whole seemed quite ambivalent about a number of aspects of the Systems Support
they received. While some were clearly satisfied with the responsiveness and attitude of Systems
Support personnel, others were quite emphatic in expressing their disapproval. This may suggest
why there was such a split between participants’ “good” and “very good” service quality ratings for
Systems Support (Figure 5.8.4). Figure 5.8.5 suggests that it is critical for Systems Support to be
improved to an overall “very good” standard, as the majority of participants perceived it as being of
paramount importance, in terms of increasing their ability to generate revenue for the organisation.
One would expect such a result when considering that frontline employees need efficiently
functioning systems in order to effectively deal with customer requests and provision their sales.
Figure 5.8.5 Systems Support and Revenue
2%4%
29%
64%
1%
Not Important
Slightly Important
Undecided
Important
Very Important
In relation to the specifics of Figure 5.8.5, it demonstrates that 64% of frontline employees
perceived the Systems Support they received to be “very important”, in terms of increasing their

166
ability to generate revenue for the organisation. Just under half that figure (29%) saw Systems
Support as “important”, while 4% of frontline employees were “undecided” on the question. This
shows that 93% of participants perceived the Systems Support they received as either “important”
or “very important”, in terms of increasing their ability to generate revenue for the organisation.
Only 1% of frontline employees saw Systems Support as “slightly important”, while double that
number (2%) perceived it as “not important”.
Internal Service Summary – Systems Support Table 5.8.1 provides a summary of the key findings of this section as they relate to the study’s three
focal research questions:
Table 5.8.1 Internal Service Summary – Systems Support
Research Question 1 Research Question 2 Research Question 3
Dimensions of "highest
importance" (Figure 5.8.3)
Other internal services with the
same/similar set of dimensions of
“highest importance”
% "very good" service ratings (Figure 5.8.4)
New themes to emerge through
comments
% "very important" ratings for the service
(Figure 5.8.5)
Importance of delivering
optimal internal service quality
- Reliability - Customer on Hold 33% - No. of staff 64% High - Responsiveness - Intranet - Personal service - Access - Computer Programs - Courtesy - Competence

167
5.9 Computer Programs Computer Programs were an internal service engaged by frontline employees. They were used for
the purpose of accessing specific customer information and provisioning products/sales.
Research Question 1: How do frontline employees perceive the importance of internal service
quality dimensions within each of the internal services identified?
Participants’ ratings of importance of the seven service quality dimensions in relation to the internal
service of Computer Programs are summarised in Figure 5.9.1. Figure 5.9.1 Computer Programs – Importance of Individual Service Quality
Dimensions
41.53%
71.76%72.09%72.76%74.09%
82.06%85.05%
0.00%
10.00%
20.00%
30.00%
40.00%
50.00%
60.00%
70.00%
80.00%
90.00%
Reliability Responsiveness Competence Access Understanding Communication Tangibles
Dimensions
% o
f Par
ticip
ants Not Important
Slightly ImportantUndecidedImportantVery Important
Figure 5.9.1 illustrates that Reliability and Responsiveness, in particular, were perceived as vital
aspects of service quality when using the organisation’s Computer Programs, with 85% and 82% of
frontline employees respectively rating those dimensions as “very important”. Those two
dimensions were clearly regarded by frontline employees as the most important attributes when
using the organisation’s Computer Programs. This means that using Computer Programs free of
technical faults that allow for customer orders and requests to be completed quickly were the two
most important internal service issues to frontline employees, relative to their value to them in their
customer service/sales role.
Competence, Access, Communication and Understanding seemed to be of less importance to
frontline employees, and all had very similar results attached to them, with 74%, 73%, 72% and
72% of frontline employees respectively perceiving them as “very important”. Tangibles was

168
perceived to be much less important than the other six dimensions, and was seen as “very
important” when using the organisation’s Computer Programs by only 42% of frontline employees.
Figure 5.9.2 represents participants’ rankings of the seven dimensions in order of importance in the
context of using the organisation’s Computer Programs (1st and 2nd rankings are shown). Figure 5.9.2 Computer Programs – Ranked Dimensions (1st, 2nd)
71.43%
57.15%
15.71% 15.71% 13.57% 14.64% 11.79%
0.00%
10.00%
20.00%
30.00%
40.00%
50.00%
60.00%
70.00%
80.00%
% o
f Par
ticip
ants
Reliability Responsiveness Competence Access Understanding Communication Tangibles
Dimensions
2nd Most Important
Most Important
Figure 5.9.2 clearly confirms the results shown by Figure 5.9.1, as Reliability and Responsiveness
were again the two standout dimensions. Reliability was seen as either the first or second most
important dimension when using the organisation’s Computer Programs by 71% of frontline
employees, while Responsiveness was seen in the same light by 57% of frontline employees. The
four dimensions of Competence, Access, Communication and Understanding again had similar
results, perceived as either the first or second most important dimension by 16%, 16%, 14% and
15% of frontline employees respectively. Only 12% of frontline employees perceived Tangibles as
being either the first or second most important dimension when using the organisation’s Computer
Programs.
Participants’ Overall Ratings and Rankings (Means) Participants’ highest ratings of importance (Figure 5.9.1) and highest rankings of importance
(Figure 5.9.2) indicated that two dimensions in particular – Reliability and Responsiveness – were
of paramount importance to them, in terms of their impact upon their job effectiveness. In order to
provide a more comprehensive indication of the dimensions frontline employees perceived as most
important to them when using the organisation’s Computer Programs, their overall ratings and
rankings were incorporated into Figure 5.9.3. Participants’ mean importance ratings (1-5) were
plotted against their mean importance rankings (1-7) for each of the seven dimensions, using the

169
average of the seven mean importance ratings (4.50) and the average of the seven mean importance
rankings (4) as the graph’s x-y intercept point.
Figure 5.9.3 Computer Programs – Participants' Ratings and Rankings of Service Quality
Dimensions (Means)
R eliability
R espo nsiveness
C o mmunicat io nUnderstanding
T angibles
C o mpetence/ A ccess
1.5
2
2.5
3
3.5
4
4.5
5
5.5
63.5 3.6 3.7 3.8 3.9 4 4.1 4.2 4.3 4.4 4.5 4.6 4.7 4.8 4.9
Participants' Perceptions of the Importance of Dimensions (M eans)
B. Highest Importance
C. Lowest Importance D. Moderate Importance
A. Moderate Importance
The positioning of each dimension within one of four quadrants – A. Moderate Importance; B.
Highest Importance; C. Lowest Importance; D. Moderate Importance – reflects frontline
employees’ overall perceptions of their importance in the context of using the organisation’s
Computer Programs.
Figure 5.9.3 therefore indicated that Reliability, Responsiveness, Competence and Access were the
service quality dimensions of “highest importance” to frontline employees, in terms of their impact
upon their job effectiveness, while Communication and Understanding emerged as dimensions of
“moderate importance”. In practice, this means that frontline employees perceived using Computer
Programs that operate without any technical faults (Reliability), having Computer Programs that
allow customer orders and requests to be completed quickly (Responsiveness), having Computer
Programs designed and upgraded by people who have the training and experience to do that job
(Competence), and being able to locate and load-up Computer Programs easily when needed
(Access), as being most important to them. Moreover, frontline employees perceived Computer
Programs that use language and terminology that is understandable (Communication) and Computer
Programs that are designed and upgraded by people sensitive to their work needs and constraints
(Understanding) as being of “moderate importance” to them.

170
The “highest importance” quadrant for this internal service is distinctly similar to those shown for
the internal services Intranet, Systems Support and Customer on Hold. Such a result could be
expected when one considers the obvious parallels between an organisation’s Intranet facility and
its Computer Programs, but becomes a little more surprising when reflecting upon the dynamics
involved in delivering the Systems Support and Customer on Hold services. All four internal
services do seem to share a common characteristic though, in that frontline employees’ use of them
is largely unscripted and dictated by the workplace situation of the time. Participants commented on
the four dimensions – Reliability, Responsiveness, Competence and Access – as they related to the
organisation’s Computer Programs as follows:
“Everything crashes all the time, it would be a miracle if a day passed when nothing
crashed and burned on my PC”
“Can apply most products and services reasonably quickly”
“The people who design them need to know how to make them so they don’t crash”
“The computer programs are easy to access and load”
Research Question 2: How do frontline employees perceive the overall quality of delivery of each
of the internal services identified?
In submitting their service quality ratings in relation to the organisation’s Computer Programs,
participants would have likely considered factors such as the incidence of technical faults, the ease
in being able to locate and load-up Computer Programs, and the speed with which Computer
Programs facilitated the completion of customer orders and requests, as the previous section’s
results indicated that these issues were most important to them.
Participants’ overall service quality ratings indicated that a large proportion of frontline employees
perceived the organisation’s Computer Programs to be grossly inadequate. Figure 5.9.4 illustrates
that more than a third of participants (35%) perceived them as being of either “poor” or “very poor”
overall service quality. Specifically, 28% perceived them as “poor”, while 7% perceived them as
“very poor”. Only 6% of participants perceived the organisation’s Computer Programs as “very
good”, while a further 36% felt they were of “good” overall quality. 23% of frontline employees

171
were “undecided” on this question. Hence, of the internal services explored so far, this has clearly
been the one with the most negative overall service quality rating.
Figure 5.9.4 Computer Programs – Service Quality Ratings
6%
7%28%
36%
23% Very Poor
Poor
Undecided
Good
Very Good
Participants supplemented their service quality ratings with some very provocative comments,
which discussed the aspects of the organisation’s Computer Programs they felt were done well,
together with those aspects they felt required improvement. The two aspects of Computer Programs
perceived by participants as done well are summarised as follows:
User-friendly – Understanding
Allow customer orders to be completed quickly – Responsiveness
User friendly – Understanding Many participants commented that Computer Programs were generally easy to use and therefore
user-friendly. Thus, those responsible for designing and maintaining the organisation’s Computer
Programs seemed to be sensitive to the work needs of frontline employees. Participants typically
commented on the user friendliness of their Computer Programs as follows:
“They are user-friendly and effective, particularly considering all the information and
systems they need to link together for our use to meet customer needs”
These participants commented that the right mix of technical training ensured that Computer
Programs were easy to use:
“They are all easily accessible and most are quite user friendly with the right training and
an understanding of the procedures…”

172
“…they are user friendly, as we have been taught how to investigate through a customer’s
problem by searching through the systems”
Most of the other comments related to the user friendliness of Computer Programs were short and
concise like the following examples:
“Easy to use”
“Most systems are user friendly and easy to understand”
“Easy to use and navigate through”
Allow customer orders to be completed quickly – Responsiveness Quite a few participants commented that the Computer Programs they used allowed customer
orders and requests to be completed quickly. This becomes an increasingly important result when
one considers that the Responsiveness dimension was perceived by participants as being of “highest
importance” to them when using Computer Programs (Figure 5.9.3). These are some of the general
comments made about this issue:
“The efficiency is good, the responsiveness times are great, Kay is doing a great job”
“They generally run fairly quickly, and often follow a logical process”
This participant’s comments reflect how fast running Computer Programs minimize customer
waiting times, which therefore helps keep them satisfied:
“They run really fast, which means that customers aren’t left waiting for too long, keeps
them happy”
These comments provide further evidence of how responsive Computer Programs facilitate the
delivery of better customer service:
“Enable us to find the fastest way of providing better service for customers”
The comments so far show that participants perceived only two areas to be performed well when it
came to the Computer Programs they used. Participants clearly made a more concerted effort to
comment on the areas requiring improvement, and did so without any hesitation or restraint.

173
Overall, participants commented consistently on four aspects of Computer Programs that required
improvement, which have been summarised as follows:
Too many systems crashes – Reliability
Too many programs (New theme)
Incompatibility of programs (New theme)
Information not up-to-date (New theme)
Too many systems crashes – Reliability The unreliability of Computer Programs was clearly the issue of greatest concern to participants.
This is a very meaningful result in light of the fact that the Reliability dimension was perceived to
be of “highest importance” to participants when using Computer Programs (Figure 5.9.3). As these
comments demonstrate, systems crashes seemed to negatively impact upon participants job
satisfaction levels:
“Having [name of Computer Program] drop out as you start a call, click on a product,
enter a number…is intolerable. It makes the simple task of doing our job aggravating and
painful”
“[Name of Computer Program] crashes on average once a day... drives me crazy, this
takes time out of my day”
Systems crashes even meant the loss of sales in many cases, as these comments clearly indicate:
“The amount of times need to be decreased of systems errors…these errors ultimately effect
KPI’s – revenue”
“Some programs are always crashing and sometimes even cause the loss of a sale”
When Computer Programs didn’t crash completely, they were slowed down considerably, which
meant that customers became increasingly frustrated:
“…important systems tend to run slowly leading to delays and giving an unprofessional
feeling to the customer
“[Name of Computer Program] is always crashing or running very slow which makes
handling customers very hard”

174
Some participants even expressed fears about losing their jobs, as unreliable Computer Programs
adversely affected their ability to reach sales targets:
“…I cannot tolerate waiting 10 seconds or more to click between screens. We have to work
hard and fast or we don’t achieve our stats. This means chances of being fired and not
getting my bonus…”
Too many programs (New theme) Many participants commented that there were too many programs needed to complete simple sales
transactions. This seemed to not only create confusion, but also unnecessarily extended customer
waiting times. As these comments show, participants suggested that Computer Programs be more
streamlined, which would subsequently simplify sales processes:
“…too many programs and at times I find it confusing in which program to go when
sourcing information…should have just the one or just two programs with everything on it.
This should make things easier and speed things up for both sales professional and
customers…”
This participant commented that the confusion caused by too many Computer Programs meant that
frontline employees became reluctant to sell certain products:
“…The biggest reason SP’s [sales professionals] don’t sell certain things is because they
are afraid of so many systems, and don’t understand how to do it”
Several participants attributed this problem to management’s unwillingness to embrace new
technologies. This participant’s comments reflect this view:
“All of the programs used by [name of organisation] are outdated – they do not utilise
modern technologies that would improve efficiency…should incorporate all programs into
one big program…”
This participant’s comments reinforce the notion of too many Computer Programs creating longer
customer waiting times:
“Systems need to be integrated and simplified, currently too many systems and take too
long to complete processes…customers are kept waiting”
175
Incompatibility of programs (New theme) Numerous participants complained that some Computer Programs were incompatible with one
other. This meant that some programs needed to be closed down before others could be opened,
which led to longer customer waiting times. These comments explain this:
“Most programs are incompatible with each other. This requires shutting one program
down before opening another…sometimes taking up to 5 minutes to open…”
There were indications that frontline employees would reflect on such work issues, as many of them
offered their own solutions to this problem:
“Certain programs should be changed to a windows interface and thus be able to better
communicate with each other”
“There are too many programs that don’t work together well enough…less web based
programs should be used”
Along with the obvious impact upon customers, this issue also seemed to create a lot of frustration
for frontline employees:
“Many are incompatible or so slow to load/use they are frustrating!!”
“…the most useless program ever created/formulated, total waste of time, so frustrating
and infuriating”
Information not up-to-date (New theme) Many participants commented that their Computer Program often contained information that was
out of date. This not only posed the risk of customers receiving incorrect information, but also
meant that frontline employees’ sales processes were extended considerably. As these comments
indicate, one out-of-date program often meant that two extra programs were needed to complete a
normally straightforward, one-step sales process:
“In [name of Computer Program A] the details are not updated enough…and then we have
to order things for them through [name of Computer Program B] and then complete
manual data to retrieve our points – this just generates too many processes – and this
wouldn’t need to be done if [name of Computer Program A] was refreshed more often”

176
This participant’s comments show that important details such as customers’ addresses were often
out-of-date:
“Need to be upgraded so our information is the latest (customer address is not updated in
[name of Computer Program]…”
Frontline employees even seemed to experience difficulty trying to source up-to-date billing
information for customers:
“I think that when the customer requires updated information on their current bill this
should be in the system to provide the customer with full service, rather than leaving them
unsure what their current bill is”
The lack of up-to-date information on Computer Programs was clearly a pivotal issue, as it not only
negatively affected frontline employees, but more importantly the quality of service received by
external customers.
Research Question 3: How do frontline employees perceive the importance of each of the internal
services identified, in terms of increasing their ability to generate revenue for the organisation?
While participants commented positively about two aspects of the Computer Programs they used,
they were clearly more concerned with expressing their dissatisfaction with numerous other areas.
To this end, participants’ comments were extremely provocative and emphatic in criticizing the
Computer Programs provided, which were reflected by their unfavourable service quality ratings
(Figure 5.9.4). Figure 5.9.5 indicates that it is critical for the organisation to implement measures to
improve the service quality of Computer Programs, as the high majority of participants perceived
Computer Programs to be of paramount importance, in terms of increasing their ability to generate
revenue for the organisation.

177
Figure 5.9.5 Computer Programs and Revenue
0.33%
0.00%
3.65%
16.61%
79.41% Not Important
Slightly Important
Undecided
Important
Very Important
Figure 5.9.5 shows that 79% of frontline employees felt the Computer Programs they used were
“very important”, in terms of increasing their ability to generate revenue for the organisation. A
further 17% perceived the Computer Programs they used to be “important”, while 4% of
respondents were “undecided” on this question. This therefore translates into 96% of participants
perceiving the Computer Programs they used as being either “very important” or “important”, in
terms of increasing their ability to generate revenue for the organisation. Thus, less than 1% of
frontline employees felt the Computer Programs they used were either “slightly important” or “not
important”.
These results are not surprising when one considers frontline employees’ reliance on their
Computer Programs for tasks such as providing customers with account information, discussing
information with customers regarding their phone usage in order to justify the sale of new products,
as well as the obvious task of using Computer Programs to physically provision sales and therefore
capture revenue points. It is therefore not difficult grasp the notion of frontline employees
generating more sales as a result of improving aspects of Computer Programs such as their
efficiency, compatibility, reliability and information content. Figure 5.9.5 helps to underline the
importance in making these improvements a top priority.

178
Internal Service Summary – Computer Programs Table 5.9.1 provides a summary of the key findings of this section as they relate to the study’s three
focal research questions:
Table 5.9.1 Internal Service Summary – Computer Programs
Research Question 1 Research Question 2 Research Question 3
Dimensions of "highest
importance" (Figure 5.9.3)
Other internal services with the
same/similar set of dimensions of
“highest importance”
% "very good" service ratings (Figure 5.9.4)
New themes to emerge through
comments
% "very important" ratings for the service
(Figure 5.9.5)
Importance of delivering
optimal internal service quality
- Reliability - Customer on Hold 6% - No. of programs 79% High - Responsiveness - Intranet - Compatibility - Access - Systems Support - Up-to-date info. - Competence

179
5.10 Call Monitoring and Feedback Call Monitoring and Feedback involved frontline employees having their calls with customers
monitored to ensure pre-specified quality standards were being met. Subsequent feedback was
provided that outlined an overall score, areas of strength and suggestions for improvement. Each
frontline employee had approximately three of their calls monitored every month.
Research Question 1: How do frontline employees perceive the importance of internal service
quality dimensions within each of the internal services identified?
Participants’ ratings of importance of the seven service quality dimensions in relation to the internal
service of Call Monitoring and Feedback are summarised in Figure 5.10.1. Figure 5.10.1 Call Monitoring and Feedback – Importance of Individual Service Quality Dimensions
50.16%
62.46%63.46%65.45%
43.19%45.85%
53.16%
0.00%
10.00%
20.00%
30.00%
40.00%
50.00%
60.00%
70.00%
Understanding Competence Reliability Responsiveness Communication Access Tangibles
Dimensions
% o
f Par
ticip
ants Not Important
Slightly ImportantUndecidedImportantVery Important
Figure 5.10.1 shows that Understanding was perceived by frontline employees as being a key
aspect of being Call Monitored and receiving Feedback, with 65% rating it as “very important”.
Competence and Reliability yielded a similar result, as 63% and 62% of frontline employees
respectively perceived them as “very important” dimensions. Those three dimensions were clearly
regarded as the most important components of service quality to staff in the situation of being Call
Monitored and receiving Feedback. This means that receiving an assessment that is free of errors,
by someone who is sensitive to work needs and constraints, and has the relevant training and
experience to perform the role were the three most important internal service issues to frontline
employees, relative to their value to them in their customer service/sales role.

180
The remaining four dimensions generated a much lower percentage of “very important” ratings in
comparison to the three aforementioned dimensions. Specifically, Responsiveness and
Communication were perceived as “very important” by 53% and 50% of frontline employees
respectively. Access and Tangibles were seen in the same light by only 46% and 43% of frontline
employees respectively when being Call Monitored and receiving Feedback.
Figure 5.10.2 represents participants’ rankings of the seven dimensions in order of importance in
the context of being Call Monitored and receiving Feedback (1st and 2nd rankings are shown). Figure 5.10.2 Call Monitoring and Feedback – Ranked Dimensions (1st, 2nd)
43.57%
33.57% 35.00%
10.36%
20.36%
38.21%
18.93%
0.00%
5.00%
10.00%
15.00%
20.00%
25.00%
30.00%
35.00%
40.00%
45.00%
% o
f Par
ticip
ants
Reliability Understanding Competence Responsiveness Communication Tangibles Access
Dimensions
2nd Most Important
Most Important
Figure 5.10.2 confirms the results depicted by Figure 5.10.1, in that Reliability, Competence and
Understanding figured as prominent dimensions. 44% of frontline employees ranked Reliability as
being either the first or second most important dimension when being Call Monitored and receiving
Feedback. 38% and 35% of frontline employees respectively ranked Understanding and
Competence as being either the first or second most important dimension. Responsiveness also
received strong support, as 34% of frontline employees perceived it as either the first or second
most important dimension when being Call Monitored and receiving Feedback. Consistent with
Figure 5.10.1, the three dimensions of Communication, Tangibles and Access received lower
rankings, as 20%, 19% and 10% of frontline employees respectively perceived them as being either
the first or second most important dimension.
Participants’ Overall Ratings and Rankings (Means) Participants’ highest ratings of importance (Figure 5.10.1) and highest rankings of importance
(Figure 5.10.2) indicated that they were extremely clear in deciding which dimensions were of most

181
value to them, in terms of their impact on their job effectiveness. In order to provide a more
comprehensive indication of the dimensions frontline employees perceived as most important to
them when receiving Call Monitoring and Feedback, their overall ratings and rankings were
incorporated into Figure 5.10.3. Participants’ mean importance ratings (1-5) were plotted against
their mean importance rankings (1-7) for each of the seven dimensions, using the average of the
seven mean importance ratings (4.14) and the average of the seven mean importance rankings (4) as
the graph’s x-y intercept point.
Figure 5.10.3 Call Monitoring and Feedback – Participants' Ratings and Rankings of Service Quality Dimensions (Means)
T angibles
A ccess
C o mmunicat io n
R espo nsivenessUnderstanding
C o mpetenceR eliability
2
2.5
3
3.5
4
4.5
5
5.53.5 3.6 3.7 3.8 3.9 4 4.1 4.2 4.3 4.4 4.5 4.6 4.7 4.8 4.9
Participants' Perceptions of the Importance of Dimensions (M eans)
B. Highest Importance
C. Lowest Importance D. Moderate Importance
A. Moderate Importance
The positioning of each dimension within one of four quadrants – A. Moderate Importance; B.
Highest Importance; C. Lowest Importance; D. Moderate Importance – reflects frontline
employees’ overall perceptions of their importance in the context of receiving Call Monitoring and
Feedback.
Figure 5.10.3 therefore indicated that Competence, Reliability, Responsiveness and Understanding
were the service quality dimensions of “highest importance” to frontline employees, in terms of
their impact upon their job effectiveness, while Communication appeared to be the dimension of
“moderate importance”. In practice, this means that frontline employees perceived being Call
Monitored and receiving Feedback from someone with the training and experience to do that job
(Competence), undergoing and evaluation that is free of errors (Reliability), being supplied with
their results and Feedback soon after being Call Monitored (Responsiveness), and being Call
Monitored and receiving Feedback from someone that is sensitive to their work needs and

182
constraints (Understanding), as being most important to them. Moreover, frontline employees
perceived receiving their results and feedback in language and terminology that is understandable
(Communication) as being of “moderate importance” to them in being effectively Call Monitored
and receiving Feedback.
The “highest importance” quadrant for this internal service represents a unique result in comparison
to most of the other internal services explored. The emergence of the Understanding dimension is
most reflective of this, coupled with the more modest positioning of the Reliability dimension (in
comparison to how it fared within other internal services such as Computer Programs). Participants
commented on all four dimensions as they related to their experiences in being Call Monitored and
receiving Feedback as follows:
“The QAA [Quality Assurance Assessors] team is extremely competent and very thorough
in their monitoring”
“The feedback I have received from QAA [Quality Assurance Assessors] the last few times
had not been accurate…”
“I got my results straight away when I got monitored. I was told which areas I had to
improve upon”
“Try to be more understanding, it’s a different account/person each time, some are much
more difficult than others”
Research Question 2: How do frontline employees perceive the overall quality of delivery of each
of the internal services identified?
In submitting their overall service quality ratings for the internal service of Call Monitoring and
Feedback, participants would have likely considered factors such as the accuracy of their previous
assessments, the promptness in receiving their feedback, and the sensitivity shown by quality
assurance assessors, in terms of the difficulties experienced within the frontline employee role, as
the previous section’s results indicated that these issues were most important to them.
Participants’ overall service quality ratings for this internal service were quite ambiguous. This is
largely attributable to the fact that a large proportion of respondents (29%) remained “undecided”

183
on this issue. Figure 5.10.4 also shows that only one in ten (10%) frontline employees perceived the
Call Monitoring and Feedback they received to be of “very good” overall quality, while a much
larger proportion of respondents (43%) perceived the overall quality to be just “good”. Furthermore,
11% of participants felt the overall quality of the Call Monitoring and Feedback they received was
“poor”, while only 7% saw it as being “very poor”. This means that the high majority of
respondents (72%) were either “undecided” or perceived the Call Monitoring and Feedback they
received to be of “good” overall service quality.
Figure 5.10.4 Call Monitoring and Feedback – Service Quality Ratings
10%
7%
11%
29%
43%
Very Poor
Poor
Undecided
Good
Very Good
Participants also offered comments to support their service quality ratings, which outlined both the
aspects of Call Monitoring and Feedback they felt had been performed well, and those areas they
perceived required improvement. The aspects of Call Monitoring and Feedback participants
perceived had been performed well are summarised as follows:
Feedback received quickly – Responsiveness
Constructive feedback provided – Competence
Feedback received quickly – Responsiveness Many participants commented positively about receiving feedback soon after their calls had been
monitored. This allowed them to easily remember the calls that had been assessed and therefore
better reflect on their results. This point is demonstrated through the following comments:
“I received info once the calls being monitored were completed – therefore allowing me to
remember better the call and what I did wrong during the call”

184
As indicated by these comments, some participants equated receiving their feedback quickly to a
time frame of approximately 24 hours:
“The feedback is always delivered very soon after the monitoring takes place (last time
was 1 day after)
“The way that we receive the information regarding the call quickly i.e. less than 1 days
time…”
These comments take on a greater meaning when one considers that the Responsiveness dimension
was perceived by participants to be of “highest importance” to them within this internal service
(Figure 5.10.3). Here are some of the more general comments made by participants on the
responsiveness of quality assurance assessors:
“The results of call monitoring are fed back quickly, and they explain reasons for results”
“Feedback is received on time…is important to see where you go wrong and how you can
improve”
Constructive feedback provided – Competence A large number of participants commented that the feedback provided by quality assurance
assessors was constructive and helpful. This becomes an increasingly important finding when
bearing in mind that participants perceived the Competence dimension to be of “highest
importance” to them when being Call Monitored and receiving Feedback (Figure 5.10.3). These are
some of the comments made by participants on this issue:
“There is always ways to improve and I like that kind of feedback”
“We get written information on how we performed and it’s scored on a sheet that lets us
know whether we did the calls right and what we need to improve on”
Many participants appeared to appreciate the fact that quality assurance assessors not only provided
suggestions on how to improve, but also emphasised areas of strength:
“…he is constructive in his feedback, also points out the good aspects of the call as well as
the need for improvement”

185
“Making sure they also commend you on what you did right”
Several participants also seemed to judge the competency of quality assurance assessors in terms of
their ability to convey feedback in a non-threatening manner:
“The feedback is well done, they don’t make you feel as if you have done something wrong”
“They tell you what to do correctly the next time and not just tell you like you were a
naughty child”
These participants’ comments reinforce the value in having competent quality assurance assessors:
“…I have picked up a lot of good techniques from the call monitoring group”
“We need their expertise because there are many people out there that are divulging
incorrect info to customers, which results in customer dissatisfaction and even loss of
customers to other carriers”
While participants commented positively about two main aspects of the Call Monitoring and
Feedback they received, they also expressed dissatisfaction with two different aspects of this
internal service. To this end, participants perceived the following aspects of Call Monitoring and
Feedback to be in need of improvement:
Greater consideration of constraints – Understanding
Inconsistent reports – Reliability
Before discussing these areas in greater detail, it is important to note that many participants made
negative comments about the Call Monitoring and Feedback they received in general. These
comments questioned the value of this internal service in helping to develop frontline employees’
skills and knowledge. These are some examples of the types of comments made by participants:
“Call monitoring is a total waste of time and money”
“Wasting of shareholders money, do we not have any integrity…?”
“It seldom has any meaningful information or anything that relates to being able to do your
job”

186
Greater consideration of constraints – Understanding A considerable number of participants commented that quality assurance assessors were not
sensitive enough to the constraints of the frontline employee role. This is a very meaningful result
considering that the Understanding dimension was perceived by participants as being of “highest
importance” to them when being Call Monitored and receiving Feedback (Figure 5.10.3). These
comments exemplify how participants viewed this issue:
“They are often not understanding of difficult situations/customers, and you get marked
down for not asking particular questions, even though on the call these points may be
covered or totally irrelevant”
“Assessors need to be more understanding of the nuisances of a particular campaign, and
better at making judgments as to what is applicable to a particular call/customer (products,
services etc.)”
Many participants seemed frustrated by being made to quote verbatim statements and questions to
customers by the quality assurance area. This, in their eyes, was a failure to “understand that each
SP is an absolute individual”:
“They can often focus on the minor points. We should be allowed to put more of our
personalities into the call”
“…I think way too much emphasis is placed on saying something WORD FOR WORD
when were are continually told it’s about people talking to people…I think circumstances
should be taken into account for situations like these, and at the moment they are not”
This participant offered an example of a situation where he/she was “marked down” for making a
trivial verbal error:
“Allowing me to actually have a personality. e.g. If I say “today” instead of the mandatory
“now” I loose points and reduce my bonus. I’m human…”
Numerous participants commented that they felt nervous and self-conscious as a result of the strict
marking methods implemented by quality assurance assessors. This is one such example:
“…People are afraid of being on the phones and what they say to people. We are told that
it is people talking to people, however things must be said 100% verbatim…”

187
This participant suggested that quality assurance assessors make more of an effort to engage
frontline employees in order to better understand the challenges of the role:
“…They need to hold a big discussion with all of us on the phones so they can hear what
we go through, what we have to say and listen to us”
Inconsistent reports – Reliability A considerable number of participants appeared dissatisfied with the reliability of the Call
Monitoring and Feedback they received. They commented that the consistency of their assessments
varied considerably from one call to another and also from one assessor to another. Like the
previous section, this becomes a result of greater significance when considering that the Reliability
dimension was perceived by participants as being of “highest importance” to them within this
internal service (Figure 5.10.3). These comments typify how participants viewed this aspect of Call
Monitoring and Feedback:
“Some inconsistency in marking. You can do the same thing on two separate calls and get
marked down in one, and marked up in the other”
“There is no consistency in the way the calls are monitored e.g. on a given day you’ll get
85% then 65% for a call almost identical to the previous”
Many participants attributed this problem to the rotating nature of the quality assurance assessor
role. In other words, quality assurance assessors spent three months in the role before making way
for a new group of assessors. Thus, as these comments indicate, quality assurance assessors were
being rotated out of the role just as they were reaching a high level of competency:
“The assessors should not be rotating. Consistency will not be maintained when people are
removed from the position just as they are getting proficient and knowledgeable…”
This participant commented that monitoring procedures were in conflict with what had been taught
in training, and recommended that they be rectified in order to avoid confusion and promote
consistency:
“Failed aspects are not clearly defined and are even in conflict with previous
training…Needs to establish a solid uniformed quality assurance area that can…relay
correct procedure to staff without confusion or conflicting statements”

188
This participant suggested that frontline employees should be provided with the phone numbers
related to their monitored calls, as this would give them the opportunity to better reflect on their
performance and challenge any inconsistencies in results:
“I would like to see the phone number provided to be able to follow-up on any queries and
errors regarding my evaluation”
Participants therefore had mixed feelings about the quality of Call Monitoring and Feedback in
general, but were very clear about their concerns regarding the reliability of assessments.
Research Question 3: How do frontline employees perceive the importance of each of the internal
services identified, in terms of increasing their ability to generate revenue for the organisation?
Participants’ comments about the areas of Call Monitoring and Feedback performed well and
requiring improvement were directly related to the four dimensions of “highest importance” to them
– Reliability, Responsiveness, Competence and Understanding (Figure 5.10.3). This is an interesting
result, especially when considering that two of the dimensions were perceived as performed well,
while the other two were perceived to be in need of attention. Figure 5.10.5 provides an indication
of the urgency required in both improving the problem areas, and continuing to excel in the areas of
strength. It shows how participants rated the importance of Call Monitoring and Feedback, in terms
of increasing their ability to generate revenue for the organisation. To this end, the results show that
a third of frontline employees (33%) perceived Call Monitoring and Feedback to be either “slightly
important” (17%) or “not important” (16%), in terms of increasing their ability to generate revenue
for the organisation. These results suggest that this internal service would be unlikely to become a
high priority project for management, relative to how participants perceived the importance of other
internal services such as the Intranet.

189
Figure 5.10.5 Call Monitoring and Feedback and Revenue
16%
17%14%
34% 19%Not Important
Slightly Important
Undecided
Important
Very Important
Figure 5.10.5 does show, however, that just over half of the participants surveyed (53%) perceived
Call Monitoring and Feedback to be either “important” (34%) or “very important” (19%), in terms
of increasing their ability to generate revenue for the organisation. Thus, if we take an overall view
of these results, it would seem beneficial to better manage specific aspects this internal service,
albeit as a lesser priority to other internal services such as the Intranet. More prudent management
of this internal service could not only help better equip frontline employees with the tools required
to sell products to customers, but also help ensure a minimum standard of care is displayed by
frontline employees during their exchanges with customers. This in turn would likely have positive
implications for customer satisfaction.
Internal Service Summary – Call Monitoring and Feedback Table 5.10.1 provides a summary of the key findings of this section as they relate to the study’s
three focal research questions:
Table 5.10.1 Internal Service Summary – Call Monitoring and Feedback
Research Question 1 Research Question 2 Research Question 3
Dimensions of "highest
importance" (Figure 5.10.3)
Other internal services with the
same/similar set of dimensions of
“highest importance”
% "very good" service ratings (Figure 5.10.4)
New themes to emerge through
comments
% "very important" ratings for the service
(Figure 5.10.5)
Importance of delivering
optimal internal service quality
- Reliability - Performance Feedback 10% N/A 19% Low - Understanding - Rewards - Competence - Responsiveness

190
5.11 Rewards Rewards programs involved the offering of prizes to frontline employees if they achieved pre-
specified performance targets. Some were conducted in a more competitive manner, where only the
highest performers were given prizes.
Research Question 1: How do frontline employees perceive the importance of internal service
quality dimensions within each of the internal services identified?
Participants’ ratings of importance of the seven service quality dimensions in relation to the internal
service of Rewards are summarised in Figure 5.11.1. Figure 5.11.1 Rewards – Importance of Individual Service Quality Dimensions
50.83%53.16%
69.44%
41.86%44.19%
64.78%65.45%
0.00%
10.00%
20.00%
30.00%
40.00%
50.00%
60.00%
70.00%
80.00%
Reliability Understanding Tangibles Responsiveness Communication Competence Access
Dimensions
% o
f Par
ticip
ants
Not ImportantSlightly ImportantUndecidedImportantVery Important
Figure 5.11.1 depicts Reliability, Understanding and Tangibles as being the standout dimensions
within this internal service, and were therefore clearly regarded by participants as the most
important components in receiving Rewards for achievement. Hence, 69% of frontline employees
perceived Reliability to be “very important” when receiving Rewards for achievement. Similarly,
both Understanding and Tangibles were seen as “very important” by 65% of respondents. This
means that being provided with Rewards of value, by staff that not only deliver on their original
promises, but also set fair and achievable targets were the three most important internal service
issues to frontline employees, relative to their value to them in their customer service/sales role.
A large gap was evident between the three leading dimensions and the four that remained. 53% and
51% of frontline employees respectively perceived Responsiveness and Communication to be “very

191
important”. In addition, 44% and 42% of frontline employees respectively perceived Competence
and Access as “very important” when receiving Rewards for achievement. Figure 5.11.2 represents participants’ rankings of the seven dimensions in order of importance in
the context of receiving Rewards (1st and 2nd rankings are shown).
Figure 5.11.2 Rewards – Ranked Dimensions (1st, 2nd)
54.28%
33.58%
17.50%
8.22%13.93%
37.14% 35.36%
0.00%
10.00%
20.00%
30.00%
40.00%
50.00%
60.00%
% o
f Par
ticip
ants
Reliability Understanding Tangibles Responsiveness Competence Communication Access
Dimensions
2nd Most Important
Most Important
The trend depicted by Figure 5.11.2 is very consistent with that shown by Figure 5.11.1. It shows
that 54% of frontline employees perceived Reliability as being either the first or second most
important dimension when receiving Rewards for achievement. Furthermore, 37% of respondents
saw Understanding as either the first or second most important dimension, while Tangibles was
closely behind with 35% of frontline employees rating it as being either the first or second most
important dimension. The only dimension within a similar range to those leading three was
Responsiveness, as 34% of frontline employees ranked it as being either the first or second most
important dimension when receiving Rewards for achievement. Competence, Communication and
Access attracted considerably lower results, as only 18%, 14% and 8% of frontline employees
respectively saw them as being either the first or second most important dimension.
Participants’ Overall Ratings and Rankings (Means) Participants’ highest ratings of importance (Figure 5.11.1) and highest rankings of importance
(Figure 5.11.2) indicated that they were relatively certain about which dimension were most critical
to them, in terms of their impact upon their job effectiveness. In order to provide a more
comprehensive indication of the dimensions frontline employees perceived as most important to
them when receiving Rewards, their overall ratings and rankings were incorporated into Figure

192
5.11.3. Participants’ mean importance ratings (1-5) were plotted against their mean importance
rankings (1-7) for each of the seven dimensions, using the average of the seven mean importance
ratings (4.19) and the average of the seven mean importance rankings (4) as the graph’s x-y
intercept point.
Figure 5.11.3 Rewards – Participants' Ratings and Rankings of Service Quality Dimensions (Means)
R eliability
R espo nsiveness
Understanding
T angiblesC o mmunicat io nC o mpetence
A ccess
2
2.5
3
3.5
4
4.5
5
5.5
63.5 3.6 3.7 3.8 3.9 4 4.1 4.2 4.3 4.4 4.5 4.6 4.7 4.8 4.9
Participants' Perceptions of the Importance of Dimensions (M eans)
B. Highest Importance
C. Lowest Importance D. Moderate Importance
A. Moderate Importance
The positioning of each dimension within one of four quadrants – A. Moderate Importance; B.
Highest Importance; C. Lowest Importance; D. Moderate Importance – reflects frontline
employees’ overall perceptions of their importance in the context of receiving Rewards.
Figure 5.11.3 therefore indicated that Reliability and Understanding were the service quality
dimensions of “highest importance” to frontline employees, in terms of their impact upon their job
effectiveness, while Tangibles and Responsiveness seemed to be of “moderate importance” to them.
In practice, this means that frontline employees perceived being supplied with the Reward/s they
were originally promised (Reliability), and being rewarded by people who were sensitive to their
work needs and constraints (Understanding), as being most important to them in an effective
Rewards program. Moreover, frontline employees perceived being rewarded with prizes/incentives
of value to them (Tangibles) and receiving their Rewards without delays (Responsiveness) as being
of “moderate importance”.
The “highest importance” quadrant for this internal service produced a very unique result, in that
only two dimensions emerged. The fact that the Understanding dimension was one of them is a

193
unique result in itself when one considers how participants perceived its importance within most of
the other internal services explored. Participants commented on the two dimensions of “highest
importance” as they related to receiving Rewards as follows:
“When winning a prize they should deliver exactly what was promised”
“They need to make sure the targets are set at a reasonable level so that it is achievable.
Not too low of course, but just so you feel like you can reach it so you feel more motivated”
Research Question 2: How do frontline employees perceive the overall quality of delivery of each
of the internal services identified?
In deciding on how to rate the overall service quality of Rewards programs, participants are likely
to have considered factors such as the type of incentives previously offered to them, the speed in
which they had received their Rewards, as well as the degree to which organizers of Rewards
programs had delivered on their original promises, as the previous section’s results indicated that
these issues were most important to them.
The overall service quality ratings for Rewards were quite ambiguous, reflected by the fact that
23% of participants remained “undecided” on the issue. Figure 5.11.4 also shows that only one in
ten (10%) frontline employees perceived Rewards programs to be of “very good” overall quality,
while a much larger proportion of participants (42%) rated them as simply “good”. A quarter of
frontline employees perceived Rewards programs as being of either “poor” or “very poor” overall
quality. More specifically, 17% perceived them as being “poor” and 8% perceived them as “very
poor”. These results therefore show that the high majority of participants (65%) were either
“undecided” about the overall service quality of Rewards programs or felt they were just “good”.

194
Figure 5.11.4 Rewards – Service Quality Ratings
10%
8%
17%23%
42%
Very Poor
Poor
Undecided
Good
Very Good
Participants supported their service quality ratings of Rewards with comments, which described the
aspects of the internal service they perceived had been performed well, as well as those elements
they perceived required improvement. The aspects of Rewards participants perceived had been
performed well are summarised below:
Useful prizes – Tangibles
Receiving recognition (New theme)
Provided motivation (New theme)
Useful prizes – Tangibles Participants generally seemed to be satisfied with the quality of prizes offered in Rewards
programs. As these comments indicate, useful incentives appeared to encourage frontline
employees to try and perform better in their roles:
“The prizes are generally useful and therefore encourage us to improve”
“The competitions are interesting and the types of prizes provide a good incentive to win”
This participant’s comments indicate that it was important to be offered useful Rewards on a regular
basis, as it helped make the frontline employee role feel more purposeful:
“I think we are given very good rewards…they are offered very frequently, which gives
everyone something to aim for at work”

195
These comments tend to carry more weight when one considers that the Tangibles dimension very
nearly qualified as “highest important” within this internal service (Figure 5.11.3). Below are some
of the more general comments made by participants on this issue:
“The rewards on offer are really good and well thought of”
“Prizes are good…you get to save your rewards points and spend them when ready”
“There are excellent incentives for employees who achieve their targets”
Receiving recognition (New theme) Many participants commented that Rewards programs were effective in recognising those frontline
employees that had excelled in their roles. This seemed to make participants feel more valued and
satisfied with their jobs, as these comments demonstrate:
“Being rewarded…makes me feel important and understand that I am being recognised”
These comments suggest that the organisation ultimately benefits from recognising and rewarding
frontline employees for their efforts:
“When we are recognised it is a big deal, which essentially makes you feel good and strive
for more, which essentially increases revenue for [the organisation]”
This participant’s comments further reinforce the notion that recognising frontline employees likely
leads to increased job satisfaction:
“Always an incentive for doing well and the person is recognised in front of the group,
which leads to greater personal pride”
Provided motivation (New theme) Several participants commented that Rewards programs were promoted in a way that created
greater motivation among frontline employees. This in turn encouraged them to strive for better
results overall, as these comments demonstrate:
“They are designed to make you want to work harder, therefore increasing your overall
work ethics”

196
“Most of them are a good incentive to work that bit harder to receive rewards in return”
As these examples indicate, most participants that commented on this issue did so in a very general
manner:
“The rewards awarded to workers are a great motivational tool”
“They inspire us to achieve our targets. Without them work would be dull”
“Lots of different incentives exist, which help motivate ourselves to excel”
While participants commented positively about three different aspects of Rewards programs, there
were other areas of this internal service they felt required improvement. These aspects have been
summarised below:
Fairness – Understanding
Delays receiving prizes – Responsiveness
Incorrect recording of Rewards points – Reliability
Frequency (New theme)
It is important to note here that two of the dimensions highlighted above – Understanding and
Reliability – were also perceived by participants as being of “highest importance” to them when
receiving Rewards (Figure 5.11.3). In addition, the Responsiveness dimension also very nearly fell
into the same category. Participants’ unfavourable comments in relation to these three dimensions
therefore take on a greater meaning in this instance.
Fairness – Understanding Many participants commented that Rewards programs concentrated too heavily on recognising high
performers, and thus disregarded employees that had improved or displayed consistency in their
performances. As this example demonstrates, this approach appeared to discourage many frontline
employees from trying to perform better:
“Sometimes the rewards programs reward the same people – the people who are always
ranked first. Those that are genuinely trying to improve think what’s the point in trying, I
will never win…they need to do more to reward the try-hards”

197
Some participants also seemed discouraged by the fact that performance targets were not adjusted to
reflect the different calling campaigns that teams were placed on, as these campaigns varied in
difficulty:
“In most instances the rewards programs can be seen as unfair – this is because to win it
can depend on what campaign you have worked on throughout the month”
“There are a few campaigns and some generate more revenue than others, so it is often
very unfair. Only those on high revenue campaigns seem to get the rewards”
It was also interesting to learn that considerable differences existed between the Rewards offered to
permanent and agency staff. This participant provided a specific example of this:
“There is dislike about the fact that the agency staff are not given the same recognition as
the permanent staff. Example: last year the award for best permanent staff member was a
trip to Hong Kong, the agency staff member, who was equal in the job, received a $100
Myer shopping voucher…”
Agency staff were even excluded from some Rewards programs, which seemed to have a negative
impact upon their job satisfaction levels:
“Often rewards are limited to permanent staff, and this makes contractors feel isolated and
unhappy”
Delays receiving prizes – Responsiveness Numerous participants commented that they experienced too many lengthy delays when waiting to
receive their prizes. As a result, frontline employees felt that management lacked respect for them
and did not appreciate their hard work. This participant’s comments indicate this:
“Faster turn around time and more organisation… [the organisation] wants their targets
and results now, and we are made to wait for our rewards, which does not seem fair…why
can’t they have the same respect…”

198
As these examples show, participants were made to wait up to six months for their prizes in some
cases:
“Delaying prizes for up to 6 months and no response when you ask about it”
“The actual time in getting the reward to the consultant is very, very poor…some had to
wait six months for their prizes, so that isn’t up to scratch”
This participant commented on an experience where a lengthy delay for a prize turned into a
situation where he/she received no prize at all:
“Delays in getting your prizes (or getting your prizes at all). I was supposed to get a prize
and then after a few months they lost my application, so I missed out on my prize”
Incorrect tallying of Rewards points – Reliability Many participants commented that Rewards points were usually tallied incorrectly, which meant
that they often received the wrong prizes. These are some of the typical comments made on this
issue:
“…I made it to level seven, but because they stuffed up the points I only got to level four,
and then I was politely put to level five because of their error. Gee, thanks for that!.”
“Promises need to be followed through – getting the right prize that was mentioned at the
beginning of the campaign…”
Several participants clearly became discouraged when errors were made with their Rewards points.
These comments demonstrate this:
“…when they totalled my points and said that I had only achieved a fraction of what I
actually did…and that I wouldn’t get my deserved prize I was annoyed!! Totally
discouraged for future rewards programs…”
“…I’m tired of getting excited about these things when they only stuff them up anyway”
199
This participant indicated that he/she had little confidence in the reliability of Rewards programs,
specifically the manner in which Rewards points were tallied:
“In the whole time I have been here, I don’t believe I have ever actually trusted what I have
received in my rewards points to be accurate…”
Frequency (New theme) A large number of participants felt that there were too few Rewards programs implemented by
management. These are some of the comments made on this issue:
“The amount of prizes and competitions are too few and far between”
“I feel we need to be rewarded more frequently and with quality rewards”
As these comments indicate, many frontline employees relied upon Rewards programs as a source
of their motivation:
“They should be on a regular basis to keep us motivated, monetary rewards are the best
motivators”
“We need a few more rewards and recognition programs, as it is easy to fall into a slump”
Various participants felt that more Rewards programs were needed in order to better reflect the
contributions they were making to the organisation:
“More rewards programs for work conducted i.e. a 20 buck Myer voucher for earning the
company in excess of $1000 per paid hour is diddling squat!”
Participants therefore considered Rewards programs as a means for management to say “thank you”
for work well done, and that this needed to be carried out more often.
Research Question 3: How do frontline employees perceive the importance of each of the internal
services identified, in terms of increasing their ability to generate revenue for the organisation?
A variety of new themes emerged as result of participants commenting on their Rewards programs.
Offering Rewards to frontline employees seemed to have the clear capacity to motivate them to

200
achieve better results. Bearing this in mind, one would have expected participants to have rated the
importance of Rewards somewhat higher, in terms of increasing their ability to generate revenue for
the organisation. Figure 5.11.5 shows that only 39% of participants perceived Rewards programs as
being “very important”, in terms of increasing their ability to generate revenue for the organisation.
Compared to Formal Training (65%), this is a relatively small proportion of respondents.
Figure 5.11.5 Rewards and Revenue
9%
7%13%
39%
32%
Not Important
Slightly Important
Undecided
Important
Very Important
A similar proportion of participants (32%) rated Rewards programs as “important”, while 13% were
“undecided” on this issue. At the other end of the scale, only 7% of participants saw Rewards
programs as “slightly important”, in terms of increasing their ability to generate revenue for the
organisation, while 9% of participants perceived them to be “not important”.
These results show that although Rewards programs may not be as high a priority to frontline
employees as some other internal services, they certainly seem to have an impact on their levels of
motivation and general self worth, which as they commented affects their capacity to perform their
role most effectively. Thus, one would suggest that it would be in the best interests of the
organisation to improve upon specific aspects of Rewards programs, as this would help frontline
employees feel more motivated and valued, and in turn strive for better results. The fact that almost
a third of participants (32%) perceived Rewards programs as “very important” demonstrates their
value to many frontline employees in the sense of positively impacting upon their job effectiveness.
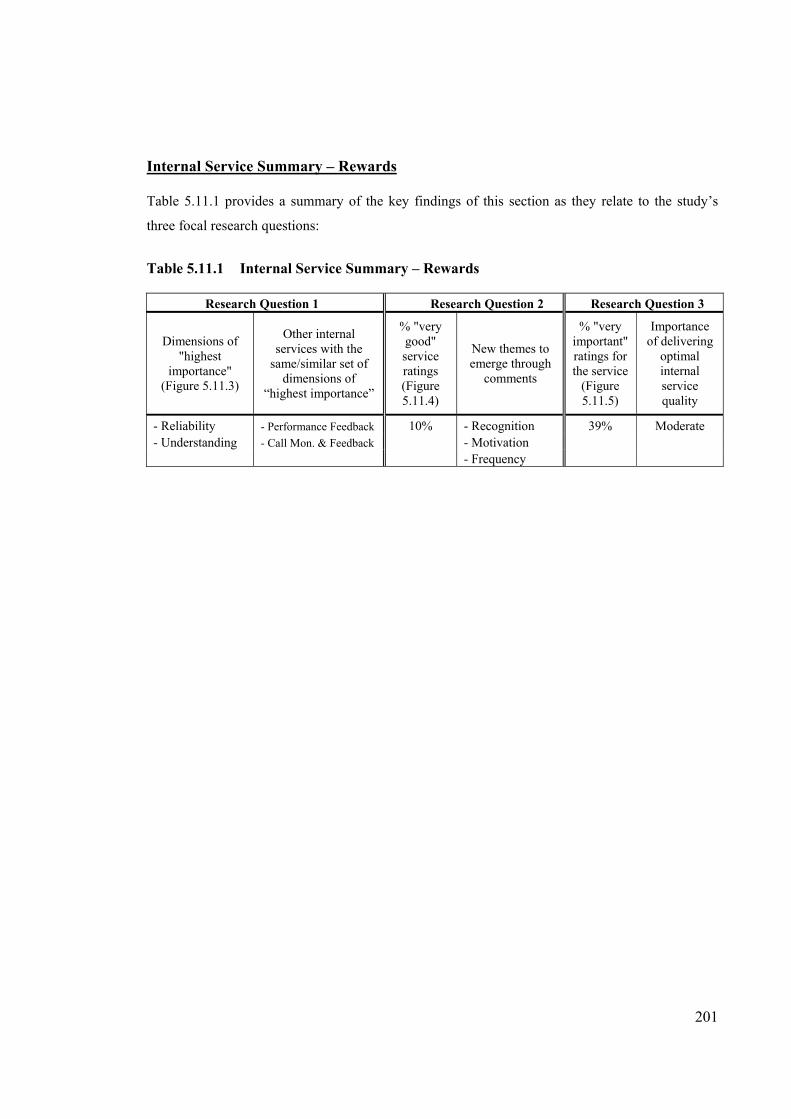
201
Internal Service Summary – Rewards Table 5.11.1 provides a summary of the key findings of this section as they relate to the study’s
three focal research questions:
Table 5.11.1 Internal Service Summary – Rewards
Research Question 1 Research Question 2 Research Question 3
Dimensions of "highest
importance" (Figure 5.11.3)
Other internal services with the
same/similar set of dimensions of
“highest importance”
% "very good" service ratings (Figure 5.11.4)
New themes to emerge through
comments
% "very important" ratings for the service
(Figure 5.11.5)
Importance of delivering
optimal internal service quality
- Reliability - Performance Feedback 10% - Recognition 39% Moderate - Understanding - Call Mon. & Feedback - Motivation - Frequency

202
5.12 Performance Feedback Performance Feedback involved frontline employees receiving feedback from their supervisors
(one-on-one and via email) in relation to their results over a given period of time (e.g. daily sales
figures).
Research Question 1: How do frontline employees perceive the importance of internal service
quality dimensions within each of the internal services identified?
Participants’ ratings of importance of the seven service quality dimensions in relation to the internal
service of Performance Feedback are summarised in Figure 5.12.1. Figure 5.12.1 Performance Feedback – Importance of Individual Service Quality Dimensions
77.74%
59.80%63.79%57.14%
64.78%
73.42%
44.52%
0.00%
10.00%
20.00%
30.00%
40.00%
50.00%
60.00%
70.00%
80.00%
90.00%
Reliability Understanding Competence Responsiveness Access Communication Tangibles
Dimensions
% o
f Par
ticip
ants
Not ImportantSlightly ImportantUndecidedImportantVery Important
Figure 5.12.1 depicts Reliability and Understanding as the two principal dimensions. It shows that
78% of frontline employees perceived Reliability to be “very important” when receiving
Performance Feedback from their supervisor, while 73% saw Understanding in the same light.
Those two dimensions were clearly regarded by frontline employees as the most integral aspects of
receiving Performance Feedback from their supervisor. This means that being supplied with correct
and consistent performance statistics and information, by a supervisor that displays sensitivity to the
work needs and constraints of frontline employees were the two most important internal service
issues to frontline employees, relative to their value to them in their customer service/sales role.
Competence and Responsiveness had considerably less “very important” ratings than the two
aforementioned dimensions, with 65% and 64% of frontline employees respectively perceived them

203
as such. Further down the scale were Access and Communication, with 60% and 57% of frontline
employees respectively perceived them as being “very important” dimensions. Tangibles was
clearly the dimension of least concern to respondents, with only 45% perceiving it as being “very
important” when receiving Performance Feedback from their supervisor. Figure 5.12.2 represents participants’ rankings of the seven dimensions in order of importance in
the context of receiving Performance Feedback (1st and 2nd rankings are shown). Figure 5.12.2 Performance Feedback – Ranked Dimensions (1st, 2nd)
53.57%
37.14%
21.07%
16.07%
20.36%
36.07%
15.71%
0.00%
10.00%
20.00%
30.00%
40.00%
50.00%
60.00%
% o
f Par
ticip
ants
Reliability Responsiveness Understanding Competence Communication Access Tangibles
Dimensions
2nd Most Important
Most Important
Figure 5.12.2 displays a profile that is very consistent with Figure 5.12.1. To this end, Reliability
and Understanding featured most prominently, along with Responsiveness. 54% of frontline
employees perceived Reliability as being either the first or second most important dimension when
receiving Performance Feedback from their supervisor. 37% and 36% of frontline employees
respectively ranked Responsiveness and Understanding as either the first or second most important
dimension. Competence and Communication were regarded as far less important, with 21% and
20% of frontline employees respectively perceived them as being the first or second most important
dimension. Access and Tangibles seemed even less important among respondents, as both were seen
as either the first or second most important dimension by only 16% of frontline employees in the
context of receiving Performance Feedback from their supervisor.
Participants’ Overall Ratings and Rankings (Means) Participants’ highest ratings of importance (Figure 5.12.1) and highest rankings of importance
(Figure 5.12.2) indicated that they were quite clear about which of the seven service quality
dimensions were of most value to them, relative to their impact on their job effectiveness. In order

204
to provide a more comprehensive indication of the dimensions frontline employees perceived as
most important to them when receiving Performance Feedback, their overall ratings and rankings
were incorporated into Figure 5.12.3. Participants’ mean importance ratings (1-5) were plotted
against their mean importance rankings (1-7) for each of the seven dimensions, using the average of
the seven mean importance ratings (4.38) and the average of the seven mean importance rankings
(4) as the graph’s x-y intercept point.
Figure 5.12.3 Performance Feedback – Participants' Ratings and Rankings of Service Quality Dimensions (Means)
T angibles
R espo nsiveness
R eliability
UnderstandingC o mpetence
A ccessC o mmunicat io n
2
2.5
3
3.5
4
4.5
5
5.5
63.5 3.6 3.7 3.8 3.9 4 4.1 4.2 4.3 4.4 4.5 4.6 4.7 4.8 4.9
Participants' Perceptions of the Importance of Dimensions (M eans)
B. Highest Importance
C. Lowest Importance D. Moderate Importance
A. Moderate Importance
The positioning of each dimension within one of four quadrants – A. Moderate Importance; B.
Highest Importance; C. Lowest Importance; D. Moderate Importance – reflects frontline
employees’ overall perceptions of their importance in the context of receiving Performance
Feedback.
Figure 5.12.3 therefore indicated that Reliability, Responsiveness, Understanding and Competence
were the service quality dimensions of “highest importance” to frontline employees, in terms of
their impact upon their job effectiveness, while Access seemed to be the dimension of “moderate
importance” to them. In practice, this means that frontline employees perceived being supplied
correct and consistent performance statistics and information (Reliability), being supplied with
regular up-to-date feedback (Responsiveness), their supervisor being sensitive to their work needs
and constraints (Understanding), and their supervisor having the training and experience to do the
job in that situation (Competence), as being most important to them when receiving effective
Performance Feedback. Moreover, frontline employees perceived being able to contact or approach

205
their supervisor easily to discuss their performance (Access) as being of “moderate importance” to
them.
The “highest importance” quadrant for this internal service closely resembles that shown for the
internal service Call Monitoring and Feedback, and to a lesser extent that depicted for Rewards.
Frontline employees highly demanded Reliability and Understanding within all three internal
services, a conceivable similarity when one considers that these internal services share a key feature
– all of them are centred on scrutinizing frontline employees’ job performance. Participants
commented on all four dimensions within the “highest importance” quadrant as they related to the
internal service of Performance Feedback as follows:
“Our supervisor always gives us an accurate account of how we are going and learning as
far as achieving goes”
“The areas that I need improvement in are focused on and explained to me consistently”
“More consideration of circumstances, such as campaigns should be given”
“My manager is great with performance feedback and encouragement to do better and
develop you further”
Research Question 2: How do frontline employees perceive the overall quality of delivery of each
of the internal services identified?
In submitting their overall service quality ratings for Performance Feedback, participants are likely
to have considered factors such as the reliability of previous performance statistics and information
received, the regularity and timeliness of feedback, and the degree of empathy displayed by their
supervisors for the constraints of the frontline employee role, as the previous section’s results
indicated that these issues were most important to them.
Participants’ overall service quality ratings for Performance Feedback were generally very positive.
Figure 5.12.4 illustrates that 22% of participants perceived the Performance Feedback they received
from their supervisor to be of “very good” overall quality. More than double that number (51%)
perceived Performance Feedback as being “good”, while quite a large proportion of respondents
remained “undecided” (18%). Only 8% of participants perceived that the overall quality of the

206
Performance Feedback they received from their supervisor was “poor”, while an even smaller
percentage (1%) saw it as “very poor”.
Figure 5.12.4 Performance Feedback – Service Quality Ratings
51%
18%
8%
1%
22%
Very Poor
Poor
Undecided
Good
Very Good
Together with their overall service quality ratings, participants also submitted comments, which
described the aspects of Performance Feedback they felt had been performed well, as well as those
aspects they perceived required improvement. The aspects participants perceived as performed well
have been summarised as follows:
Regular, up-to-date feedback – Responsiveness
Helpful and supportive – Competence
It is important to note here that the two dimensions outlined above – Responsiveness and
Competence – were also perceived by participants as being of “highest importance” to them when
receiving Performance Feedback from their supervisor (Figure 5.12.3). Participants’ favourable
comments in relation to these two dimensions therefore take on a greater significance in this
instance.
Regular, up-to-date feedback – Responsiveness Many participants commented that their supervisors sent them updated Performance Feedback
regularly, mostly via email. This seemed important to frontline employees, as it gave them a timely
indication of the degree to which they had met their targets. These comments touch on this point:
“Regular feedback gives you a good indication of where you are at in relation to key
performance indicators”

207
“Everyday we receive feedback to let us know how we are going. That is great…”
While some participants preferred receiving Performance Feedback on a daily basis, others felt that
a weekly update was sufficient, as it provided a more balanced overview of their achievements:
“A weekly email is plenty, as it shows the overall trend across the week rather than putting
too much pressure on one night’s stats”
This participant commented that receiving Performance Feedback daily ensured that high
performers were recognised and could share their skills with the rest of the team:
“The supervisor gives a daily update on our performance for the previous day.
Consequently, those who have done well within the team are recognised, and skill sharing
takes place with them”
Helpful and supportive – Competence Some participants commented that their supervisors provided useful advice that helped them
improve their performances. They also appreciated the fact that feedback was provided in a
constructive and non-threatening manner. This is how some participants commented on this issue:
“What I am doing well and what I am not doing so well. Ways to improve my sales and
processes of making sales i.e. sales tactics”
“My manager is great with performance feedback and encouragement to do better and
develop you further”
Participants commented about their supervisors’ ability to provide constructive feedback as follows:
“We are encouraged to send feedback and receive feedback between our supervisors, and
the feedback received is always constructive and never negatively portrayed”
This participant’s comments demonstrate the importance for supervisors to be skilled enough to
convey feedback in a constructive manner:
“Positive reinforcement will always result in increased productivity and personal morale.
Andy has the ability to turn negative results in encouraging advice”

208
While these comments show that participants were satisfied with two important aspects of
Performance Feedback, there were three other areas of the internal service they felt required
improvement. These areas are summarised below:
Greater consideration of circumstances – Understanding
Recognise quality as well as quantity (New theme)
More one-on-one feedback (New theme)
Greater consideration of circumstances – Understanding A large number of participants felt that limiting factors out of their control were not taken into
consideration by their supervisors when providing Performance Feedback. This becomes an
increasingly important finding when bearing in mind that the Understanding dimension was
perceived by participants as being of “highest importance” to them within this internal service
(Figure 5.12.3). This participant commented that time spent off the phone for events such as
training were not taken into account when receiving Performance Feedback:
“I find that contributing factors are not recognised in our team…when we are put on bad
campaigns or have had a lot of training, we are expected to explain why our targets are
down...”
This participant made the same point, using this study’s survey as the basis for his comments:
“Supervisors tell SP’s [sales professionals] to do something like this survey and 2 weeks
from now they’re looking at the stats and pulling individuals up for spending time off the
phone”
As demonstrated by these comments, a lack of understanding on the part of supervisors ultimately
led to feelings of fear, dissatisfaction and disloyalty in some frontline employees:
“…Give us some flexibility. If one day we miss our KPI’s it is hard to make them up by the
end of the month. Threatening us doesn’t make us work any harder, just makes us unhappy
and not drive us to continue working in this area”

209
Recognise quality as well as quantity (New theme) Some participants felt that their supervisors focused too heavily upon quantitative sales data, and
not enough on qualitative information relating to customer satisfaction and loyalty. These
comments reflect this point:
“Most feedback is based on qualitative data such as revenue and sales, but none focus on
qualitative data such as quality of customer service…etc.”
This participant appeared particularly frustrated by this issue, as he/she felt that much of the good
work being done by frontline employees was not being duly recognised:
“Results never accurately portray the amount of effort someone has put into their job…No
consideration is given to giving the customer a positive experience…no credit is given to
the astute employee who is looking after the customer’s requirements and promoting a
good rapport between them and [the organisation]…”
Several participants commented that even Call Monitoring Feedback data lacked sufficient
qualitative information on subjects such as customer satisfaction and rapport building:
“We don’t even receive much information that is positive in the area of customer service
from the quality assurance area e.g. how well we treated the customer, how we spoke with
them, empathized any complaints”
More one-on-one feedback (New theme) Many participants desired more face-to-face interaction with their supervisors when it came to
receiving Performance Feedback. They felt that there was a great imbalance between the amount of
Performance Feedback emailed and the amount that was communicated in person. These comments
demonstrate this:
“We don’t have enough face-to-face feedback, unless we are doing badly, we usually just
receive emails”

210
One-on-one Performance Feedback was perceived by many participants as an important part of
their role, as it facilitated being developed and listened to by their supervisors:
“…we need more one-on-one time with team leaders so that we can better ourselves with
their help and that they can understand us and if we are having problems that we just
aren’t discarded and fired…”
This participant suggested that supervisors allocate at least thirty minutes a month to each of their
frontline employees to discuss their performances:
“Performance feedback should be done on a monthly basis in a meeting room…Managers
should be allocated at least 30 minutes per sales professional…to clarify information with
their manager on a one-to-one basis face-to-face…”
The same participant was adamant that this would increase frontline employees’ sales figures:
“…will no doubt increase sales figures if the correct and concise procedures are followed”
Participants were therefore supportive of their supervisors in general, but required greater personal
contact with them in order to maximize their job effectiveness.
Research Question 3: How do frontline employees perceive the importance of each of the internal
services identified, in terms of increasing their ability to generate revenue for the organisation?
Many different themes and ideas were raised by participants in commenting on the Performance
Feedback received from their supervisors. Much of their commentary related to three of the four
service quality dimensions they perceived as most important to them within this internal service –
Responsiveness, Competence and Understanding (Figure 5.12.3), and how each was either being
performed well or in need of improvement. Figure 5.12.5 places into context the importance of
supervisors delivering high quality Performance Feedback to their frontline employees, as it shows
participants’ perceptions of the importance of Performance Feedback, in terms of increasing their
ability to generate revenue for the organisation. It indicates that Performance Feedback was seen by
participants as being of relatively high importance, evidenced by the fact that 42% rated it as “very
important”. Compare this to the results attached to an internal service such as Online Training
(19%), and this becomes a particularly strong result. The strength of this result is bolstered by the

211
fact that an additional 42% of participants perceived Performance Feedback as “important”, in
terms of increasing their ability to generate revenue for the organisation.
One would have expected such results when bearing in mind that participants commented that they
relied upon Performance Feedback not only for added motivation and drive, but also for the
development and advice provided by their supervisors on how to improve sales techniques and thus
create additional revenue for the organisation. It is therefore obvious that more revenue could result
from improving specific aspects of internal service quality related to Performance Feedback, as
highly motivated and skilled frontline employees are more likely to perform better during their
exchanges with customers.
Figure 5.12.5 Performance Feedback and Revenue
2% 6%8%
42%
42%Not Important
Slightly Important
Undecided
Important
Very Important
The remaining results from Figure 5.12.5 reinforce the earlier discussion, as it shows that only 6%
of participants perceived the Performance Feedback they received from their supervisors as
“slightly important”, in terms of increasing their ability to generate revenue for the organisation,
while a even smaller proportion (2%) perceived it as being “not important”. Moreover, only 8% of
participants were “undecided” on this issue.

212
Internal Service Summary – Performance Feedback Table 5.12.1 provides a summary of the key findings of this section as they relate to the study’s
three focal research questions:
Table 5.12.1 Internal Service Summary – Performance Feedback
Research Question 1 Research Question 2 Research Question 3
Dimensions of "highest
importance" (Figure 5.12.3)
Other internal services with the
same/similar set of dimensions of
“highest importance”
% "very good" service ratings (Figure 5.12.4)
New themes to emerge through
comments
% "very important" ratings for the service
(Figure 5.12.5)
Importance of delivering
optimal internal service quality
- Reliability - Rewards 22% - Quality 42% Moderate - Understanding - Call Mon. & Feedback - One-on-one - Responsiveness - Competence

213
5.13 Internal Service Summaries A comprehensive set of results were presented throughout this chapter in accordance with the
study’s three research questions. A diverse set of themes and ideas were discussed in relation to
each of the twelve internal services investigated, all of which have been summarised below:
Table 5.13.1 Formal Training Summary
Research Question 1 Research Question 2 Research Question 3
Dimensions of "highest
importance" (Figure 5.1.3)
Other internal services with the
same/similar set of dimensions of
“highest importance”
% "very good" service ratings (Figure 5.1.4)
New themes to emerge through
comments
% "very important" ratings for the service
(Figure 5.1.5)
Importance of delivering
optimal internal service quality
- Reliability Online Training 8% - Fun 65% High - Competence - Interaction - Communication - Timing - Practical - Pace/length
Table 5.13.2 Online Training Summary
Research Question 1 Research Question 2 Research Question 3
Dimensions of "highest
importance" (Figure 5.2.3)
Other internal services with the
same/similar set of dimensions of
“highest importance”
% "very good" service ratings (Figure 5.2.4)
New themes to emerge through
comments
% "very important" ratings for the service
(Figure 5.2.5)
Importance of delivering
optimal internal service quality
- Reliability Formal Training 6% - Structure 19% Low - Competence - Self-paced - Communication - Test learning - Understanding - Ease of use - Interaction - Relevance (information)

214
Table 5.13.3 Customer on Hold Summary
Research Question 1 Research Question 2 Research Question 3
Dimensions of "highest
importance" (Figure 5.3.3)
Other internal services with the
same/similar set of dimensions of
“highest importance”
% "very good" service ratings (Figure 5.3.4)
New themes to emerge through
comments
% "very important" ratings for the service
(Figure 5.3.5)
Importance of delivering
optimal internal service quality
- Reliability - Systems Support 26% - Availability 60% High - Responsiveness - Computer Programs (supervisors) - Competence - Intranet - Access
Table 5.13.4 Team Briefs Summary
Research Question 1 Research Question 2 Research Question 3
Dimensions of "highest
importance" (Figure 5.4.3)
Other internal services with the
same/similar set of dimensions of
“highest importance”
% "very good" service ratings (Figure 5.4.4)
New themes to emerge through
comments
% "very important" ratings for the service
(Figure 5.4.5)
Importance of delivering
optimal internal service quality
- Reliability - Emails 27% - Interaction 48% Moderate - Responsiveness - Mgt. Presentations - Fun - Communication - Pace - Competence - Frequency
Table 5.13.5 Emails Summary
Research Question 1 Research Question 2 Research Question 3
Dimensions of "highest
importance" (Figure 5.5.3)
Other internal services with the
same/similar set of dimensions of
“highest importance”
% "very good" service ratings (Figure 5.5.4)
New themes to emerge through
comments
% "very important" ratings for the service
(Figure 5.5.5)
Importance of delivering
optimal internal service quality
- Reliability - Team Briefs 19% - Pithiness 37% Moderate - Responsiveness - Mgt. Presentations - Suitability - Communication - Time to read - Competence

215
Table 5.13.6 Management Presentations Summary
Research Question 1 Research Question 2 Research Question 3
Dimensions of "highest
importance" (Figure 5.6.3)
Other internal services with the
same/similar set of dimensions of
“highest importance”
% "very good" service ratings (Figure 5.6.4)
New themes to emerge through
comments
% "very important" ratings for the service
(Figure 5.6.5)
Importance of delivering
optimal internal service quality
- Reliability - Team Briefs 15% - Relevance 19% Low - Communication - Emails (information) - Competence - Visual aids - Responsiveness - Pace
Table 5.13.7 The Intranet Summary
Research Question 1 Research Question 2 Research Question 3
Dimensions of "highest
importance" (Figure 5.7.3)
Other internal services with the
same/similar set of dimensions of
“highest importance”
% "very good" service ratings (Figure 5.7.4)
New themes to emerge through
comments
% "very important" ratings for the service
(Figure 5.7.5)
Importance of delivering
optimal internal service quality
- Reliability - Customer on Hold 21% - Relevance 64% High - Responsiveness - Systems Support (information) - Access - Computer Programs - Search function - Competence - Interruption
Table 5.13.8 Systems Support Summary
Research Question 1 Research Question 2 Research Question 3
Dimensions of "highest
importance" (Figure 5.8.3)
Other internal services with the
same/similar set of dimensions of
“highest importance”
% "very good" service ratings (Figure 5.8.4)
New themes to emerge through
comments
% "very important" ratings for the service
(Figure 5.8.5)
Importance of delivering
optimal internal service quality
- Reliability - Customer on Hold 33% - No. of staff 64% High - Responsiveness - Intranet - Personal service - Access - Computer Programs - Courtesy - Competence

216
Table 5.13.9 Computer Programs Summary
Research Question 1 Research Question 2 Research Question 3
Dimensions of "highest
importance" (Figure 5.9.3)
Other internal services with the
same/similar set of dimensions of
“highest importance”
% "very good" service ratings (Figure 5.9.4)
New themes to emerge through
comments
% "very important" ratings for the service
(Figure 5.9.5)
Importance of delivering
optimal internal service quality
- Reliability - Customer on Hold 6% - No. of programs 79% High - Responsiveness - Intranet - Compatibility - Access - Systems Support - Up-to-date info. - Competence
Table 5.13.10 Call Monitoring and Feedback Summary
Research Question 1 Research Question 2 Research Question 3
Dimensions of "highest
importance" (Figure 5.10.3)
Other internal services with the
same/similar set of dimensions of
“highest importance”
% "very good" service ratings (Figure 5.10.4)
New themes to emerge through
comments
% "very important" ratings for the service
(Figure 5.10.5)
Importance of delivering
optimal internal service quality
- Reliability - Performance Feedback 10% N/A 19% Low - Understanding - Rewards - Competence - Responsiveness
Table 5.13.11 Rewards Summary
Research Question 1 Research Question 2 Research Question 3
Dimensions of "highest
importance" (Figure 5.11.3)
Other internal services with the
same/similar set of dimensions of
“highest importance”
% "very good" service ratings (Figure 5.11.4)
New themes to emerge through
comments
% "very important" ratings for the service
(Figure 5.11.5)
Importance of delivering
optimal internal service quality
- Reliability - Performance Feedback 10% - Recognition 39% Moderate - Understanding - Call Mon. & Feedback - Motivation - Frequency

217
Table 5.13.12 Performance Feedback Summary
Research Question 1 Research Question 2 Research Question 3
Dimensions of "highest
importance" (Figure 5.12.3)
Other internal services with the
same/similar set of dimensions of
“highest importance”
% "very good" service ratings (Figure 5.12.4)
New themes to emerge through
comments
% "very important" ratings for the service
(Figure 5.12.5)
Importance of delivering
optimal internal service quality
- Reliability - Rewards 22% - Quality 42% Moderate - Understanding - Call Mon. & Feedback - One-on-one - Responsiveness - Competence

218
5.14 Chapter Summary The internal service summaries will now be discussed as they relate to the study’s three research
questions.
Research Question 1: How do frontline employees perceive the importance of internal service
quality dimensions within each of the internal services identified?
The internal service summaries indicate that participants perceived the importance of the service
quality dimensions similarly across some internal services, yet quite differently across others.
Participants seemed to evaluate the importance of the seven dimensions very similarly within the
context of both Formal Training and Online Training. They perceived Reliability, Competence
and Communication as being of “highest importance” within both internal services, while
Understanding emerged as most important solely within Online Training. These are interesting
results when one considers the differences in the two service delivery mediums. Formal Training is
conducted in a group environment, where a trainer/facilitator’s role is somewhat similar to that of a
school teacher, while an Online Training activity is completed by frontline employees
independently in front of a computer with little to no outside tutelage or group interaction. These
distinct dissimilarities indicate that participants’ service quality preferences for training-based
activities were to some degree independent of the actual delivery mechanisms.
There was also a clear parallel in the way participants perceived the internal services that related to
their own performance. Namely, whether it concerned receiving Performance Feedback or Call
Monitoring and Feedback, the same combination of dimensions – Reliability Understanding,
Responsiveness and Competence – were of “highest importance” to them, in terms of their
effectiveness in their role. Furthermore, the internal service Rewards also produced a similar result,
with Reliability and Understanding emerging as the dimensions of “highest importance”.
Participants’ strong preference for Understanding was the demand characteristic that separated
these three internal services from the others explored. It therefore seemed increasingly important in
each situation for internal suppliers to display sensitivity for the work needs and constraints of
frontline employees, while of course giving due attention to the other key dimensions. Participants’
comments indicated that “sensitivity” to them simply meant being treated fairly, where everyone’s
performance was scrutinized according to their own unique set of circumstances.

219
A common trend also emerged in the way participants determined the importance of the seven
dimensions in relation to the internal services Customer on Hold, Systems Support, Computer
Programs and Intranet. They perceived Reliability, Responsiveness, Competence and Access to be
of “highest importance” to them within all four internal services. Also important to note, these were
the only instances in which Access and Responsiveness emerged together in terms of being of
“highest importance” to participants.
While the likenesses shared between the internal services Customer on Hold and Systems Support
were just as close as those shared by the Intranet and Computer Programs, these two sets of internal
services are patently diverse when compared to each other. Perhaps the similarity in the results can
be attributed to the fact that all four internal services do share unique features, in that their use is
largely unscripted and spontaneous, and dictated by the workplace situation at the time (e.g. using
the Intranet to access a specific piece of information requested by a customer). They are also the
only internal services directly initiated by frontline employees, and are utilized predominantly while
they are engaged with customers. Thus, participants’ high demand for the Responsiveness and
Access dimensions in these situations was perhaps indicative of them being conscious of limiting
response and waiting times for customers, as both dimensions revolve around making processes
quicker and easier for frontline employees during customer exchanges.
The three internal services that revolved predominantly around manager-to-frontline employee
communication – Emails, Team Briefs and Management Presentations – also had obvious
similarities. More specifically, participants perceived Reliability, Responsiveness, Communication
and Competence as being of “highest importance” to them within all three internal services. This is
an interesting result when bearing in mind the dynamic differences between receiving an Email and
being communicated to verbally within a group environment (Team Briefs and Management
Presentations). Emails are also in many cases very impersonal, especially when simply forwarded
on from an original source, while Team Briefs and Management Presentations are largely centred
on engaging and involving an entire group in discussions. Thus, as was the case with training-based
activities, frontline employees’ service quality preferences seemed to transcend the specific
characteristics of these internal services, and appeared to be simply tailored to the type of service
being delivered.
This discussion has highlighted clear similarities and differences in the way frontline employees
perceived the importance of the seven dimensions in relation to the twelve internal services. Similar

220
results seemed to emerge among internal services with like-characteristics. For example,
participants appeared to perceive the same group of dimensions as most important to them within
both of the internal services concerned with training (Online Training and Formal Training). Clear
differences are apparent however, when the results connected to these various groups of internal
services are compared against one another. For example, the results attached to the four ‘real-time-
based’ internal services (Customer on Hold, Systems Support, Computer Programs and Intranet)
were considerably different to those concerned with training. Overall it was apparent that frontline
employees’ needs were similar among groups of like internal services as opposed to being distinctly
different in each of the twelve internal services. The four classification categories that emerged can
be best characterized as follows:
1. Training-intensive internal services
2. Performance-related internal services
3. Real-time-based internal services
4. Communication-based internal services
This discussion also showed that the Reliability dimension was clearly the most prominent overall,
perceived by participants as being of “highest importance” across all twelve internal services. The
Competence and Responsiveness dimensions also featured consistently, perceived in the same light
within eleven and nine internal services respectively. Thus, being delivered a correct and consistent
service, from employees with sufficient training and experience, who can facilitate a prompt
response when required, seemed to be the three attributes of greatest value to participants within
most of the internal services explored, relative their impact on their job effectiveness. The four
remaining service quality dimensions were far less outstanding in comparison. Communication was
perceived as being of “highest importance” across five internal services, while the Access and
Understanding dimensions were both perceived in that context within four internal services.
Tangibles was clearly the least prominent dimension, as it was perceived by participants as being of
“highest importance” to them within none of the internal services investigated.
This chapter also illustrated that participants’ perceptions of the importance of like dimensions
varied considerably across some internal services. For example, Responsiveness was clearly of
“highest importance” to participants within the internal services Intranet and Computer Programs,
yet was of “lowest importance” to them in the context of Formal Training and Online Training.
Similarly, Understanding emerged as being of “highest importance” within the internal services
Performance Feedback and Rewards, while participants perceived that dimension as being of

221
“lowest importance” to them when receiving Emails and Systems Support. Such disparities were
also evident with the Access and Communication dimensions.
It is also essential that the service quality dimensions of “moderate importance” to participants are
not overlooked or underestimated, especially as some were positioned within close proximity to the
“highest/moderate importance” intersect point (e.g. Access within Performance Feedback;
Understanding within Formal Training; Tangibles within Rewards). Recognising this is pivotal in
better understanding the unique demand characteristics of each internal service as they relate to
frontline employees and their job effectiveness.
Research Question 2: How do frontline employees perceive the overall quality of delivery of each
of the internal services identified?
Participants’ overall service quality ratings varied considerably across the twelve internal services
investigated. While the internal services Systems Support, Team Briefs and Customer on Hold were
perceived quite favourably, participants seemed most dissatisfied with the internal services Formal
Training, Online Training and Computer Programs. This is reflected by wide gap between the
proportion of participants that perceived the overall quality of Systems Support as “very good”
(33%) and the proportion that perceived Online Training in the same light (8%). Internal services
such as Performance Feedback (22%), Intranet (21%) and Emails (19%) generated moderate ratings
in comparison. These figures also show that none of the internal services investigated generated
overwhelmingly positive “very good” ratings, which suggests that participants felt there was
considerable scope for improvement within all of them.
Participants provided further insights into their service quality ratings by offering comments, which
highlighted the aspects of each internal service they perceived had both been performed well and
required improvement. Their comments touched on many of the seven service quality dimensions
included within the survey, while also exploiting a number of new themes and issues. It was
interesting to discover that many of the themes to emerge transcended a number of the internal
services investigated.
The notion of incorporating Fun and Interaction into the delivery of internal services emerged when
participants commented on Online Training, Formal Training and Team Briefs. Many participants
indicated that they opposed Online Training as a delivery mechanism because unlike Formal

222
Training and Team Briefs it offered very little opportunity for interaction and fun, thereby
demonstrating the importance of those two attributes to them in their workplace.
Participants’ comments also suggested that it was important that the information presented to them
was Concise, Practical and Relevant to their roles. Concise and direct information appeared highly
salient when receiving Emails, while similarly within Online Training, Management Presentations
and the Intranet there was an obvious preference for need to know information as opposed to nice to
know information. Furthermore, participants clearly craved practical exercises during Formal
Training sessions that involved simulations of their customer exchanges.
The Pace of delivery of some internal services also emerged as a common theme in participants’
comments. They felt that their ability to properly digest and comprehend information was
compromised when Formal Training, Online Training, Team Briefs and Management Presentations
were completed too hastily. Perhaps this would have been a non-issue had the information
presented within these internal services been Concise and strictly Relevant to participants’ roles.
Nevertheless, many participants felt that these internal services were rushed due to management
being too mindful of maintaining their performance statistics, which were negatively impacted by
these internal services (e.g. time spent off the phone to complete Formal Training reduced sales
volumes for that day). Participants commented that they were allocated insufficient Time to Read
their work-related Emails for that same reason.
The Number of Staff Available to assist frontline employees also surfaced as an important theme,
especially within the internal services Systems Support and Customer on Hold. Participants
commented that customer waiting times and their own work efficiency were adversely affected
when Systems Support personnel and their supervisors were unavailable to assist them when
required.
It was also apparent that participants preferred Personalized Service in some instances. They were
clearly opposed to receiving Systems Support over the phone, and felt that it was beneficial to
receive Performance Feedback in person as well as via email, as their supervisors could listen to
them and provide valuable advice that helped improve their job effectiveness.
The level of Frequency in delivering some internal services was also an issue of concern to
participants. They commented that Rewards programs and Team Briefs needed to be conducted
more regular basis, as they were a good source of motivation and guided them towards a common
set of goals.

223
Participants also indicated that their job effectiveness was positively impacted when job processes
were quick and easy to complete. They seemed clearly concerned by the Number of Computer
Programs that were needed during their exchanges with customers, and equally relieved by the
Ease of Use of Online Training modules.
While many of the themes to emerge from participants’ comments were common across multiple
internal services, others were very specific to individual internal services. These included the
Timing of Formal Training sessions; the Structure of Online Training modules and their ability to
Test Learning; the Suitability of Emails as a delivery mechanism in certain instances; the use of
Visual Aids during Management Presentations; limited Interruptions and an effective Search
Function when using the Intranet; Systems Support personnel that display Courtesy; Computer
Programs that contain Up-to-Date information and are Compatible with other programs; Rewards
programs that genuinely Motivate and Recognise good performance; and Performance Feedback
that acknowledges Quality of performance.
Research Question 3: How do frontline employees perceive the importance of each of the internal
services identified, in terms of increasing their ability to generate revenue for the organisation?
Participants’ perceptions of the importance of each internal service, in terms of increasing their
ability to generate revenue for the organisation, varied to an even greater degree than their overall
services quality ratings. The internal services Computer Programs (79%), Formal Training (65%),
Intranet (64%), Systems Support (64%) and Customer on Hold (60%) were clearly the most highly
rated by participants, in terms of rating them as “very important”. The four internal services of
Team Briefs (48%), Performance Feedback (42%), Rewards (39%) and Emails (37%) were the
more moderately rated internal services, while Online Training (19%), Call Monitoring and
Feedback (19%) and Management Presentations (19%) appeared to be clearly least important to
participants. These results indicate that the importance of delivering optimal service quality is
“high” in relation to some internal services, “moderate” in others, while some seem to fall into the
“low” category.
The considerable gap between Online Training and Formal Training indicated that participants
perceived the latter internal service as being much more effective, with respect to instilling them
with the skills and knowledge required to maximize sales during their exchanges with customers. It

224
is unclear, however, whether the lower importance of Online Training is due to the delivery
mechanism itself, or because of another factor such as the subject matter covered in Online Training
modules. Nevertheless, this result also poses the question of whether Online Training is a suitable
substitute for Formal Training in any circumstances. Participants’ comments on this issue indicated
that it was not.
These results also suggest that the urgency associated with improving and maintaining the quality of
internal services may need to be prioritized according to each one’s ability to contribute to the
organisation’s bottom line. For example, it would appear logical for management to allocate
resources towards ensuring that Computer Programs are of optimal service quality before doing so
for an internal service such as Call Monitoring and Feedback. It is unknown however how each
internal service contributes to other areas such as customer satisfaction and loyalty. It is therefore
difficult to make a totally informed judgment before exploring these additional aspects.
While these results demonstrated the high level of importance staff placed on the delivery of
optimal service quality in situations such as Formal Training and Computer Programs, participants’
overall service quality ratings showed that this was far from being a reality. In fact, Formal Training
and Computer Programs generated the lowest proportion of “very good” ratings from participants,
indicating that frontline employees may have been foregoing all the skills, knowledge and technical
means necessary to be most effective in selling the organisation’s products to customers. Although
the actual impact on revenue is unknown, one could infer it would be considerable based on
participants’ high ratings of importance of both internal services.
An interesting relationship seemed to emerge between participants’ ratings of importance of each
internal service and their ratings of importance of the seven service quality dimensions.
Specifically, it was apparent that participants’ overall ratings of the importance of the seven service
quality dimensions were much stronger within the internal services they perceived to be of highest
importance, in terms of increasing their ability to generate revenue for the organisation. For
example, Reliability was the highest rated dimension by participants in both Online Training and
Computer Programs, yet their “very important” ratings varied considerably in those situations (65%
and 85% respectively). This disparity coincides with the large gap between participants’ ratings of
importance of these internal services, in terms of increasing their ability to generate revenue for the
organisation, where 19% and 79% respectively rated them as “very important”. This pattern was
consistent throughout the presentation and discussion of results in chapter five.

Chapter
6
225
6.0 Discussion of Results
The previous chapter presented the results from the online survey completed by 301 frontline
employees. Those results were discussed in accordance with the study’s three research questions: Research Question 1: How do frontline employees perceive the importance of internal service
quality dimensions within each of the internal services identified? Research Question 2: How do frontline employees perceive the overall quality of delivery of each
of the internal services identified? Research Question 3: How do frontline employees perceive the importance of each of the internal
services identified, in terms of increasing their ability to generate revenue for the organisation? Many diverse themes and concepts emerged as a result of exploring these research questions. This
chapter will provide the linkages between the findings and the established literature reviewed in
chapters two and three, while also reflecting upon how the overall results of this study add to the
body of knowledge in the area of internal service quality. This will be followed by the presentation
of managerial implications and recommendations for further research. The shaded areas within
Figure 6.0.1 place the focus of this chapter into context by showing how it corresponds to the
various other phases undertaken throughout the study.
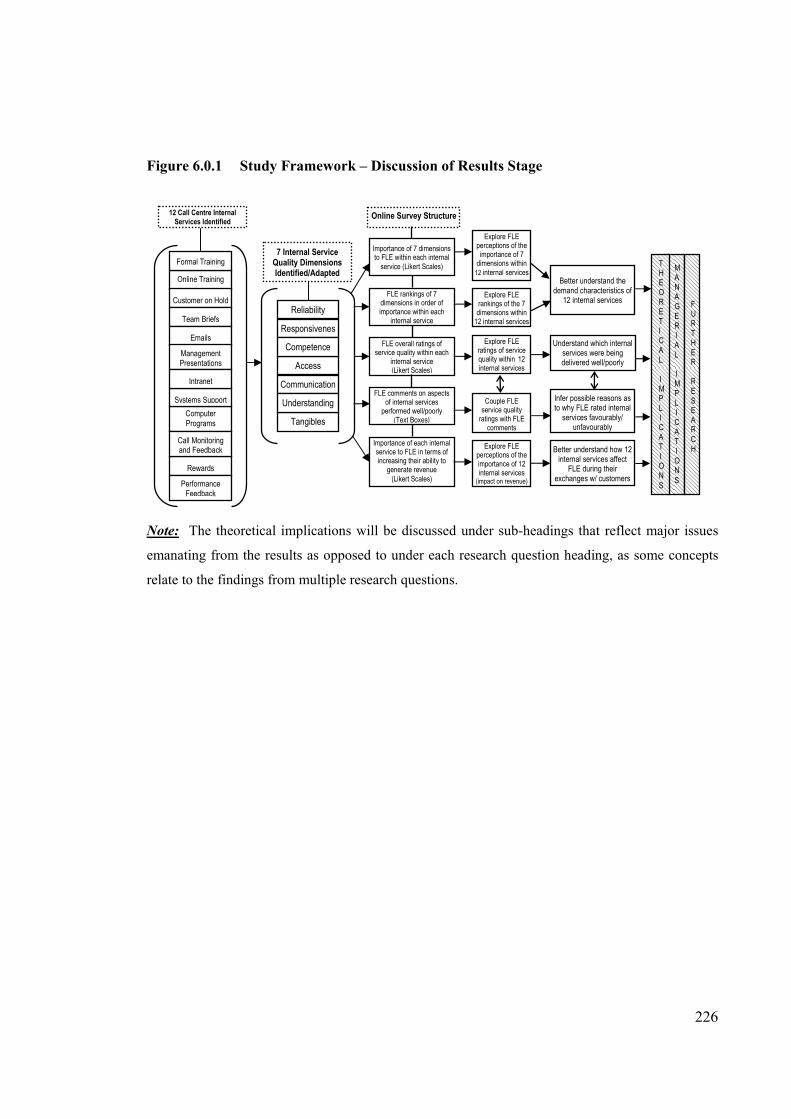
226
Figure 6.0.1 Study Framework – Discussion of Results Stage
Note: The theoretical implications will be discussed under sub-headings that reflect major issues
emanating from the results as opposed to under each research question heading, as some concepts
relate to the findings from multiple research questions.
Responsivenes
Access
Competence
Tangibles
Reliability
Communication
Understanding
Importance of 7 dimensions to FLE within each internal
service (Likert Scales)
FLE overall ratings of service quality within each
internal service (Likert Scales)
FLE rankings of 7 dimensions in order of importance within each
internal service
FLE comments on aspects of internal services
performed well/poorly (Text Boxes)
Importance of each internal service to FLE in terms of increasing their ability to
generate revenue (Likert Scales)
M A N A G E R I A L I M P L I C A T I O N S
Explore FLE perceptions of the importance of 7
dimensions within 12 internal services
Explore FLE ratings of service quality within 12 internal services
Couple FLE service quality
ratings with FLE comments
Explore FLE perceptions of the importance of 12 internal services
(impact on revenue)
Better understand the
demand characteristics of 12 internal services
Online Training
Customer on Hold
Team Briefs
Emails
Management Presentations
Formal Training
Rewards
Computer
Programs
Call Monitoring and Feedback
Systems Support
Intranet
Performance Feedback
Understand which internal services were being delivered well/poorly
Infer possible reasons as to why FLE rated internal
services favourably/ unfavourably
Better understand how 12 internal services affect
FLE during their exchanges w/ customers
Explore FLE rankings of the 7 dimensions within
12 internal services
T H E O R E T I C A L I M P L I C A T I O N S
FURTHER RESEARCH
7 Internal Service Quality Dimensions Identified/Adapted
Online Survey Structure 12 Call Centre Internal Services Identified

227
6.1 Classifying and Adapting Internal Services This case study of frontline employees and the internal services that support their role has provided
many fruitful reflections in relation to various key issues raised in the literature. These reflections
corroborate many aspects of the literature, while also providing augmented theory to add to the
existing body.
The results associated with this case study indicated that it was essential that internal service
delivery be adapted in specific situations in order to better satisfy the workplace needs of frontline
employees. This supports the views advocated by Cannon (2002), as well as Marshall, Baker and
Finn (1998), who perceived the adaptation of internal services to be at the heart of high internal
service quality. It was also apparent that some internal services possessed similar demand
characteristics, which therefore facilitated the processes of classifying them into like categories. A
classification scheme helped provide a clear guideline as to “when” and “how” internal service
delivery needed to be customized. The four internal service categories that emerged (see Section
5.14) – training-intensive internal services; performance related internal services; real-time-based
internal services; communication-based internal services – were quite diverse in their make-up,
indicating that frontline employees’ preferences varied according to both the type of service being
delivered, as well as the context in which internal services were ultimately consumed by them. For
example, while the two internal services within the “training-intensive internal services” category –
Formal Training and Online Training – were clearly similar in purpose, some of the internal
services within the “real-time-based internal services” category varied considerably in nature. The
factor that seemed to link the “real-time-based internal services” was that they were predominantly
utilized by frontline employees in the context of being engaged with customers, where speed and
access were of paramount importance to them.
This finding suggests that authors such as Davis (1993) adopted an overly simplistic approach when
defining internal service categories, as he and others appeared to focus upon service type (i.e.
support service and advice) and tended to overlook service delivery context. The current study
demonstrated that it was insufficient to intuitively define internal service categories based solely on
their characteristics, as such an approach fails to fully appreciate the complex nature of the internal
environment and the requisites needed to deliver optimum service quality in all situations.
Undertaking the process of identifying specific internal services as performed by Bruhn, (2003),
and subsequently isolating the quality factors most important to employees in each situation
provided an effective mechanism for developing a comprehensively informed classification scheme.

228
Furthermore, while the “backstage support” function characterised by authors such as Chase (1978),
Grove and Fisk (1983) and Grönroos and Gummesson (1986) acts as a useful starting point, it is
essential to acknowledge the finer, more specific elements that support frontline employees.
It was clear that the Reliability dimension was of greatest overall importance to frontline employees
when being delivered call centre internal services. Interestingly, this coincides with Berry,
Parasuraman and Zeithaml’s (1994) assessment of the external services, where they discovered
through conducting customer surveys that Reliability was the single most important feature in
judging service quality. However, this result seems to somewhat dispute the findings reported by
Frost and Kumar (2001), who found in their study of an international airline that Responsiveness
influenced overall perceptions of internal service quality the most. While this study showed that
Responsiveness was highly important to frontline employees in most situations, in some it emerged
as being of minimal concern. This reaffirms the need to identify different internal service types, as
this process acknowledges that each internal service differs with respect to its supply/demand
characteristics (Stauss, 1995). This diversity of results also highlights the need to conduct research
in various settings, as the nature of the workplace environment can largely dictate the service
quality factor most critical to internal customers. Thus, it is perfectly conceivable that
Responsiveness was at the core of effective internal service delivery in the fast-paced airline
industry, although its level of importance is unknown in different workplace situations.
In terms of the other dimensions included in the survey, most of them emerged as highly relevant to
frontline employees in the different internal services explored. This adds further weight to the claim
made by Vandermerwe and Gilbert (1991), that “the needs of internal service users…are highly
consistent with what we know about the external marketplace” (p.51), as the dimensions used were
adapted from the original ten external service quality dimensions delineated by Parasuraman,
Zeithaml and Berry (1985). The Tangibles dimension, which in this study was centred on frontline
employees receiving paper-based reading materials, was the only dimension that seemed to be of
limited relevance to the call centre setting. Kuei (1999) also deemed Tangibles to be of little use in
her study, which can perhaps be attributed to the fact that internal environments today are so highly
technologically geared, where Email and Intranet facilities have taken the place of “paper” as
sources of information. It should be noted however that Kang, James and Alexandris (2002) found
Tangibles to be valid and reliable within an internal service setting, which may in part be due to
their definition of Tangibles being less specific than that used in this study.

229
The overall similarities between the preferences of internal and external customers supported by
this study also validates the theories of authors such as Reynoso and Moores (1997), who also
developed their service quality dimensions based on Parasuraman, Zeithaml and Berry’s (1985)
original external dimensions. For example, their Preparedness and Professionalism dimensions are
contextually similar in a definitional sense to the Competence dimension used in this case study,
which was of “highest importance” to frontline employees within all but one internal service.
Similarly, Vandermerwe and Gilbert’s (1989) perceptions of Reliability and Responsiveness being
relevant to the internal environment was strongly supported by the results of this study.
While the dimensions Reliability, Competence and Responsiveness were consistently of “highest
importance” to frontline employees, the importance of Access, Communication and Understanding
varied considerably from one internal service to the next. Thus, the classification of the twelve
internal services was largely dependant upon the importance frontline employees attached to those
latter three dimensions. For example, the high importance of the Understanding dimension within
the internal services Rewards, Performance Feedback and Call Monitoring and Feedback was the
factor that distinguished those three internal services from the other nine, and subsequently led to
the classification category “performance-related internal services”. This indicates that internal
service delivery customization requires a slight shifting of consciousness towards one or two unique
quality elements, rather than the adoption of a totally different delivery approach. This finding
appears to coincide with the recommendation made by Reynoso and Moores (1995), as they
suggested that researchers establish a set of dimensions that were not only generic, but also peculiar
to specific situations.
While it was clear that participants valued the service quality dimensions adapted from the
literature, their comments indicated that there were additional components of service quality that
were also important to them. Some of these elements seemed to encompass multiple internal
services, while others were specific to the individual workplace situation. A common theme to
emerge involved the incorporation of Fun and Interaction into internal service delivery. It was clear
that participants perceived having a fun working environment that allowed them to interact and
share ideas with their co-workers as an important attribute when being delivered internal services
such as Team Briefs. Participants’ perceived lack of Fun and Interaction when undergoing Online
Training is what seemed to cause much of their opposition to it as a delivery mechanism, and
appeared to encourage them to endorse Formal Training as a much preferred alternative. The fact
that an alternative actually existed was quite interesting considering Vandermerwe and Gilbert’s
(1989) claim that internal customers could not choose alternative suppliers when dissatisfied, due to

230
the existence of internal market monopolies. However, in the context of internal services such as
Computer Programs, where alternatives do not exist, internal customers are clearly “captive” of
internal suppliers (Nagel and Cilliers, 1990).
Another attribute that participants seemed to associate with effective internal service was the Pace
of delivery. In other words, they appeared to perceive internal services that were too rushed as
poorly executed, as it adversely affected their capacity to digest the information. Another theme that
appeared to encompass multiple internal services was the Relevance and depth of information,
where participants indicated that they valued only need-to-know information that was exclusively
relevant to their roles. Coincidentally, Vandermerwe and Gilbert (1991) delineated Relevance as
one of their internal service quality dimensions, which was defined in part as involving the internal
service being generally useful. The other component of their Relevance definition touched on the
Ease of Use of internal services, a theme that also emerged in this study when participants
commented about Online Training and Computer Programs.
In exploring these three themes and others, it became apparent that some were not only interrelated
with one another, but also with the service quality dimensions adapted from the literature (and
included in the survey). For example, one could logically infer that internal services such as Formal
Training may appear less rushed to participants if only the need-to-know information was
presented, as less information would need to be spread out over the time allocated. Thus, the
adverse impact of one poorly executed dimension (i.e. Pace) could be negated by performing
another one well (i.e. Relevance). Another example of this related to the issue of Available Staff,
where participants commented that not enough supervisors and Systems Support personnel were
available in some instances. By rectifying that attribute of service quality, the likelihood of frontline
employees experiencing Responsiveness from internal suppliers is simultaneously increased.
While attributes such as Personalized Service and Frequency of delivery also emerged across
multiple internal services, others were commented on in a more exclusive sense. One that seemed to
generate heavy attention was related to the Timing of Formal Training sessions. Frontline
employees seemed to value “when” they received that internal service equally as much as “how” it
was delivered, as both elements had deep implications for their effectiveness when dealing with
customers. Almost every internal service investigated had a theme associated with it that was
unique, which has far reaching implications for how internal service delivery should be approached.

231
While classifying internal services into like categories provides a valuable guideline as to how
different workplace situations need to be approached, the broad-based nature of these additional
themes indicate that all internal services are unique and worthy of individually specialized delivery.
Although the actual importance of these additional elements is unknown, one could infer that they
would have a true bearing on how frontline employees perceive the overall service quality of
internal services. Moreover, this indicates that the external service quality dimensions adapted from
the literature (and included in the online survey) should act simply as a starting point, vis-à-vis fully
understanding the needs of frontline employees in different situations. Figure 6.1.1 shows the
internal services within each classification category, and illustrates how the additional themes relate
in some cases to multiple internal services and in others to individual internal services.
Figure 6.1.1 Internal Service Categories and Additional Themes
By reflecting on these additional themes, coupled with the dimensions included in the survey, it also
becomes apparent that frontline employees sought satisfaction in both a technical and an emotional
sense, in terms of enhancing their job effectiveness. For example, while the Relevance of
information sought during Online Training would bolster their skill and knowledge base, the
Rewards
Call Monitoring and Feedback
Performance Feedback
Intranet
Computer Programs
Systems Support
Customer on Hold
Online Training
Formal Training
Team Briefs
Management Presentations
Emails
Pace
Fun & Interaction
Time to Read Concise Relevance
Practical
Available Staff/Resources
Personalized Service
Ease of UseFrequency
Timing
Structure
Test Learning
Suitability
Visual Aids
Search Function
Interruption
Courtesy
Up-to-date
Compatibility
Recognition
Motivation
Quality
No. of Programs
Real-Time-Based Performance-Related
Communication-Based Training-Intensive

232
Courtesy desired during Systems Support was clearly related to increasing what authors such as
Rafiq and Ahmed (2000) referred to as “motivation” in their definitions of internal marketing. It is
therefore important to make these distinctions, as it facilitates a greater understanding of the multi-
faceted workplace needs of frontline employees.
6.2 Internal Services and the Bottom Line The findings of this case study also indicated that frontline employees perceived some internal
services as being considerably more important than others, in terms of increasing their ability to
generate revenue for the organisation. This implies that in situations such as Formal Training and
Customer on Hold frontline employees were particularly reliant on the supply of “job products”
(Berry and Parasuraman, 1991) to assist them in selling the organisation’s products to customers.
Alternatively, they seemed to obtain considerably fewer revenue-making tools during the delivery
of internal services such as Online Training and Management Presentations. These differences
indicated that organisations could realize some key benefits from classifying and resourcing internal
services according to their varying impacts on revenue.
Such a classification scheme would not only promote an understanding of the workplace situations
that need to be most closely monitored in order to maximize revenue, but also facilitate the process
of helping managers in their decision-making concerning the allocation of organisational resources.
For example, this case study showed that frontline employees perceived Computer Programs as
being considerably more important than Call Monitoring and Feedback, while they both generated
similar overall service quality ratings. Managers with this information at their disposal would be
better equipped to make a decision as to where the organisation’s limited resources should primarily
be allocated, as the frontline employee feedback would help them to clearly identify which internal
services affect the bottom line most directly. Larkin and Larkin (1996) touched on this subject when
they recommended that managers channel substantial resources towards those who support frontline
employees, with the major distinction here being that managers can do so on a service-to-service
level, based on how each directly impacts the generation of revenues. In addition to the bottom line,
the impact of internal services on other key areas, such as their capacity to help frontline employees
build customer loyalty, may also impact upon management’s decision-making process.

233
These findings, together with those detailed in the previous section also provide implications for the
umbrella concept of internal marketing. Before this is discussed further, consider these two
delineations of internal marketing, and note that both emerged in distinctly different eras:
“By satisfying the needs of its customer-affecting employees, the retail firm upgrades its
capability for satisfying the needs of its customers” (Berry, Hensel and Burke, 1976, p. 8).
“Internal marketing is a planned effort using a marketing-like approach to overcome
organisational resistance to change and to align, motivate and inter-functionally co-ordinate
and integrate employees towards the effective implementation of corporate and functional
strategies in order to deliver customer satisfaction through a process of creating motivated
and customer-orientated employees” (Rafiq and Ahmed, 2000, p. 454).
These definitions show that while both sets of authors addressed the link between employee
satisfaction and customer satisfaction, neither made any reference to the potential impact that
internal marketing, and specifically the delivery of high quality, highly customized internal services
to frontline employees, can have upon revenue. Therefore, if Berry, Hensel and Burke’s (1976)
definition was amended to include the findings of this study, it would acknowledge that
organisations that implement sophisticated internal marketing strategies may enhance their ability to
not only satisfy customers’ needs, but also generate additional revenue:
“By satisfying the needs of its customer-affecting employees through the delivery of high
quality, highly customized internal services, the retail firm upgrades its capability for
satisfying the needs of its customers and generating additional revenue”
This characterization of internal marketing also works towards describing in part what Rafiq and
Ahmed referred to as a “marketing-like approach” in their definition, and touches on Berry and
Parasuraman’s (1991) notion of “shaping job-products to fit human needs” (p.151). Furthermore,
the realization that internal marketing can positively impact the bottom line may create the degree
of transparency necessary to encourage managers to both understand and practise internal
marketing, something that Sargeant and Asif (1998) stated very few organisations had achieved.
Their motivation to grow the bottom line could see them embrace an internal marketing culture that
“puts frontline employees first and designs the business system around them” (Schlesinger and
Heskett, 1991, p. 72). In addition, by classifying internal services according to their impact on
revenue, this enables internal suppliers to identify with their roles as “part-time marketers”
(Gummesson, 1991), and outlines where they can most influence sales and customer relations.

234
6.3 Researching the Internal Environment This case study also reinforced the value to organisations of researching their internal environments.
The complex and multi-faceted work needs of frontline employees showed that it was insufficient to
map out internal service delivery based simply on intuition, but rather it was essential to conduct
research in order to identify the unique demand characteristics of each workplace situation.
Undertaking such a process not only permits internal suppliers to identify the similarities and
differences in frontline employees’ preferences across various internal services, but also provides
them with a more robust guideline as to what is required in order to achieve high internal service
quality, and in turn assist frontline employees in performing their roles most effectively.
Internal research also acts as an important mechanism for monitoring the quality of delivery of
internal services. This is particularly crucial, as internal service quality largely affects the quality of
service delivered to external customers (Berry, Parasuraman and Zeithaml, 1994) and, based upon
the results of this study, may also affect frontline employees’ ability to generate revenue. It is
therefore clearly within an organisation’s best interests to not only identify the internal services
requiring improvement, but to pinpoint the specific actions necessary to make effective
improvements. Berry, Parasuraman and Zeithaml (1994) saw the value in seeking out the opinions
of frontline employees, and stated that they have the ability to see more than customers see and
observe things from a completely different angle. Their added perspective can therefore alert
managers to important issues that do not appear in documents such as balance sheets, sales records
and customer survey data.
This case study demonstrated that quality internal research can produce information that has the
capacity to guide managers in their decision making and priority setting in a way that can directly
impact customer satisfaction, employee satisfaction and revenue generation. Without this depth of
information, managers could find themselves allocating resources into areas that yield no tangible
benefit for customers, employees and the organisation’s bottom line, which of course has further
ramifications for other key stakeholder groups such as shareholders. For example, in this case study
a considerable proportion of frontline employees indicated that they strongly objected to Online
Training as a delivery mechanism, while an equally large proportion perceived it to be of little
importance, in terms of increasing their ability to generate revenue for the organisation. A manager
faced with this information, and through further investigation, could make an informed decision as

235
to whether such an internal service should continue to be pursued, or whether another more
effective training instrument should be sought.
6.4 Managerial Implications Through the broad-based findings of this case study a number of managerial implications emerged,
related to the recruitment, training and development of internal suppliers, the ongoing assessment of
their performance, and how the delivery of internal services to frontline employees need to be
approached in general within the organisation studied.
An appropriate starting point for managers would be to underline to internal suppliers the high
importance of delivering Reliability within each internal service. This ranges from supervisors
supplying correct and consistent information during Team Briefs and via Emails to computer
programmers ensuring that Computer Programs operate without any technical faults. This should be
matched with a similar emphasis on the overall importance of displaying Competence in delivering
internal services to frontline employees. Frontline employees were particularly explicit about the
importance of that dimension in situations such as Formal Training, where they indicated that
supervisors were far less effective overall than trainers, who in their estimations had far greater
qualifications and experience for the role. Managers should also ensure that the overall importance
of the Responsiveness dimension is not understated. For example, supervisors should understand
that providing prompt assistance is paramount when a frontline employee has a Customer on Hold,
while Intranet technicians must be aware of the need for information on internal web pages to be
quickly accessible.
While it is beneficial as a starting point to outline the dimensions of high overall importance to
frontline employees, it is most critical that internal suppliers grasp the notion of internal service
customization. This means understanding that frontline employees perceive some internal service
quality dimensions as highly important only in some situations. Classifying internal services into
categories based on these peculiarities provides clear guidelines for internal suppliers as to how
different situations need to be generally approached. Supervisors would likely yield considerable
benefit from this, as they deliver numerous different internal services to frontline employees on a
daily basis. For example, a classification scheme allows them to clearly identify the situations
where it is highly important to exhibit Understanding (performance related services such as
Performance Feedback), as opposed to those where the Access-Responsiveness combination is
uniquely important (real-time-based internal services such as Customer on Hold) to frontline

236
employees. At the same time, internal suppliers associated with training-intensive internal services
would more easily recognise the low importance of Responsiveness in both Formal Training and
Online Training relative to its importance within other internal services.
Internal suppliers should also be made aware of the interdependence of some dimensions. For
example, by ensuring that they are easily Accessible, supervisors can simultaneously increase the
likelihood of delivering Responsiveness to frontline employees in situations such as Customer on
Hold. Also, trainers that convey only the most Relevant information to frontline employees
simultaneously increase their capacity to conduct Formal Training sessions at an adequate Pace, as
less time is used-up covering irrelevant bits of information.
Managers could improve the effectiveness of their frontline employees if they coach their internal
suppliers to recognise the unique nature of each internal service. In other words, while groups of
internal services share numerous likenesses in their demand characteristics, they also share some
small dissimilarities. For example, comments submitted by frontline employees indicated that
Timing was important to them with respect to Formal Training, yet there was no mention of this
attribute in relation to Online Training. Similarly, having an effective Search Function was
exclusively important to frontline employees in the context of using the Intranet, whereas
Compatibility was solely associated with the call centres’ Computer Programs. Identifying these
individual differences within each classification category is essential if internal suppliers are to
deliver internal services that maximize the job effectiveness of frontline employees.
It is just as imperative that internal suppliers embrace the broader themes that transcended across
the various classification categories, of which Relevance and Fun and Interaction emerged as most
prominent. Being provided with only the most Relevant information was clearly an important issue
when using the Intranet, and increasingly so in the context of Online Training and Management
Presentations, where there was often tight time constraints. Frontline employees were particularly
explicit about the need to incorporate Fun and Interaction into internal services such as Formal
Training, Online Training and Team Briefs, indicating that engagement was a key component in
enhancing their motivation and ability to properly process information. The fact that that attribute
was perceived to be lacking in Online Training seemed to be the basis for much of their opposition,
in terms of its use as a service delivery mechanism. Thus, internal suppliers can be more effective if
they better understand that the perceived success or failure of an internal service can hinge on the
proper execution of one or two key attributes. In addition, this further reinforces the need for
internal suppliers to view the classification scheme as simply a starting point, and then adopt a

237
methodical approach in carefully identifying and implementing all the unique qualities that frontline
employees require from each workplace situation.
It is also essential for managers to acknowledge that internal services vary in importance to
frontline employees, in terms of increasing their ability to generate revenue for the organisation.
Classifying internal services according to their different levels of importance could help managers
make more informed decisions with respect to allocating organisational resources. For example,
while Online Training and Computer Programs both generated low internal service quality ratings,
the latter was clearly more important to frontline employees vis-à-vis revenue, and could therefore
be prioritized for action by managers according to this key difference. Managers could also use this
classification scheme as the basis for emphasizing to internal suppliers that their performance is a
crucial part of the end product the external customer ultimately buys from frontline employees.
However, part of the issue of influencing internal suppliers to deliver optimum internal service
quality is to also educate them to view frontline employees as their primary customers, as opposed
to perceiving them as a peripheral part of their roles. Only through this realization will an internal
marketing culture begin to truly emerge and flourish within the organisation.
The placement of the right people in the right jobs is another key component in properly executing
internal service delivery that maximizes the job effectiveness of frontline employees. Evidently,
frontline employees seemed to receive inadequate service when internal suppliers were not properly
qualified for their roles, as shown by their negative comments regarding supervisors acting as
substitutes for formal trainers. Therefore, before promoting, substituting or recruiting internal
suppliers it is essential that they have the mindset and competencies needed to successfully perform
the job. This means that it is insufficient to assume that because someone performs well as a
supervisor that they can also perform effectively as a trainer. It is important that managers first test
and probe prospective internal suppliers about frontline employees’ expectations in the relevant
workplace situation/s. This could be facilitated by having them complete aptitude tests that explore
their decision-making and understanding of frontline employees’ different work needs. These
results could then be reconciled against the information gained from conducting internal research
with frontline employees to help managers decide which candidate/s best fit each position.
After selecting the most skilled and competent internal suppliers it is imperative that their training
and ongoing development reinforces both the notion of frontline employees being their primary
customers, and that their actions can directly affect customer relations and revenue. Internal
suppliers such as supervisors not only require training that helps them in undertaking the

238
administrative aspects of their roles, but also clearly need to be educated about meeting the needs of
frontline employees in different situations. For example, the classification schemes developed from
this case study could act as effective instruments in guiding supervisor trainees during role playing
exercises, teaching them how and when internal service delivery needs to be customized, together
with how different internal services impact areas such as revenue. At the same time, other internal
suppliers such as Formal Training facilitators could learn of the importance of incorporating
attributes like Fun and Interaction into their training activities.
Managers could also integrate frontline employees’ service quality ratings into the performance
reviews of internal suppliers, especially considering how some internal services ultimately impact
revenue. For example, computer programmers should not only be assessed on their productivity
levels, but also on whether frontline employees perceived that Computer Programs were of a
standard that maximized their job effectiveness. Such an approach promotes greater accountability
in internal suppliers, and further encourages them to view their jobs as internal products that need to
be constantly refined and shaped to best match employee needs and maximize revenue-making
opportunities. In addition, managers could use qualitative comments from frontline employee
surveys and feedback sessions as the basis for making recommendations to internal suppliers on
how to develop and improve. Such information could also become useful during meetings among
internal suppliers such as supervisors, where pivotal issues raised by frontline employees could be
tackled as workshop-type activities, thereby promoting a sense of teamwork and camaraderie.
Managers can also employ internal advertising to reinforce the types of behaviours and attitudes
they seek from internal suppliers towards frontline employees. For example, customer
commendations could be framed and hung-up on walls to recognise frontline employees and
emphasize the important contributions of supervisors as service providers. Similarly, internal
suppliers who receive high service quality ratings from frontline employees could also have their
achievements put on display in order to further promote the internal service standards desired by
management, while also bolstering their levels of motivation and morale. Even displaying posters
showing the inverted organisational pyramid (Albrecht, 1988) would underline the importance of
frontline employees and those that support them. Emails would also be likely to prove effective
throughout this process, in terms of their ability to convey key messages to large target groups in
quick time with minimal cost.
More significant than internal advertising, managers can benefit from employing a comprehensive
and sophisticated internal research strategy in order to sustain their understanding of the complex

239
issues associated with the frontline employee role. This can be approached in a variety of ways.
Firstly, smaller scale research should occur regularly (i.e. fortnightly-monthly) in the form of focus
groups and feedback sessions, where managers engage frontline employees to discuss both internal
and external service quality issues. This research method would likely cause minimal disruption to
the normal course of business, as focus group-like activities can be run effectively with only 8-12
participants needed at one time. Internal suppliers could also be incorporated into these activities to
ensure that all parties have a fair say, and gives each side an opportunity to see things from the
others perspective. In addition, this acts as a forum for internal suppliers to express any concerns
with the internal services being delivered to them, especially if they are negatively impacting the
quality of service ultimately consumed by frontline employees. This process of listening to and
involving employees would also likely have positive implications for their morale and job
satisfaction levels.
Secondly, larger scale research such as employee opinion surveys could be conducted on a semi-
regular basis to explore issues on a more universal scale. Managers could then gain broad-based
insights into issues related to internal service quality, job satisfaction, and other key areas that affect
their decision-making and overall perceptions of the internal environment. This would provide
answers to questions like, has internal service quality improved? Have frontline employees
preferences changed? What areas need to be addressed with internal suppliers? Are frontline
employees’ perceptions of the importance of internal services the same vis-à-vis revenue? How
important is each internal service in terms of increasing frontline employees’ abilities to satisfy
customers’ needs? Obtaining such information is essential if managers are to remain updated and
learn new things about their most crucial competitive tool – frontline employees.
These managerial implications show the degree of commitment required to ensure frontline
employees receive high quality internal services. It stems from recruiting, developing and
motivating internal suppliers towards the correct behaviours and attitudes, together with an ongoing
thirst for internal research. This process should culminate with a universal realization that internal
services have the ability to grow or diminish an organisation’s bottom line, where every
organisational employee’s actions matter.

240
6.5 Key Contributions to Theory This chapter has outlined numerous contributions to theory made in undertaking this case study,
which has been summarised below and are represented by Table 6.5.1 thereafter.
1. Classifying all internal services into categories to reflect core similarities and differences in
their demand characteristics proved to be both legitimate and essential, as it provides a
framework in terms of how internal service delivery should be approached and adapted in
different situations to best accommodate internal customer needs. These findings bring greater
weight to positions advocated by Cannon (2002) and Marshall, Baker and Finn (1998), who
were among the few authors who highlighted the need for internal service delivery to be
adapted to meet the unique needs of internal customers.
2. Beyond the classification of internal services lies a critical distinction, in that each internal
service requires unique delivery ingredient/s to fully address the needs of those employees
being served, which emphasises the importance of viewing classification categories as only a
contextual starting point before drilling down further to the unique needs of the employee group
for each internal service (eg. Time to read – Emails). These findings support Stauss’s (1995)
view that each internal service differs with respect to its supply/demand characteristics.
3. The case study also underlined the importance of not only defining specific internal services
(Bruhn, 2003), but also undertaking a process to classify them according to employee needs, as
opposed to adopting an intuitive approach that accounts for service type, but tends to overlook
factors such as service delivery context. It is therefore vital that researchers go further than to
simply refer to the internal services that support frontline employees as “backstage support”
(eg. Grönroos and Gummesson, 1986), or to create broad categories based solely on services’
characteristics (eg. Davis, 1993). Continuing with such an approach would likely provide little
value in terms of maximising an organisation’s ability to deliver high levels of internal service
quality to their employees.
4. Reliability appeared to be the internal service quality dimension of highest overall importance
to the frontline employees studied, which differs from the findings reported by Frost and Kumar
(2001), who determined that Responsiveness influenced overall perceptions of service quality
the most.

241
5. The Tangibles dimension was of little importance to the frontline employees studied, which
somewhat contradicts the findings of Kang, James and Alexandris (2002), who confirmed that
Tangibles was valid and reliable in a service setting. Kuei (1999) on the other hand also found
Tangibles to be of little relevance. This indicates that there is still no uniform agreement on this
issue.
6. A number of new themes emerged beyond the seven internal service quality dimensions
explored, some of which had been addressed in previous research, others that appeared unique
to this case study. For example, Relevance emerged as important to frontline employees within
a number of internal services, an internal service quality dimension previously delineated by
Vandermerwe and Gilbert (1991). On the other hand, numerous themes such as Fun and
Interaction were brought to light through this study, and these have the potential to extend the
depth of theory into internal service quality dimensions.
7. The varying levels of importance of internal services to frontline employees, in terms of
increasing their ability to generate revenue for the organisation represented a further key
contribution to theory. This finding further legitimises the importance of internal service
classification, as it presents another context to which internal services can be categorised, and
subsequently allocated resources in order to maximise frontline employees’ revenue-making
opportunities. Authors such as Larkin and Larkin (1996) touched on this issue, but did not go
far enough as to encourage resource allocation on a service-to-service level. Previous literature
has thus failed to conceptualise internal service quality in such a sophisticated manner, also
evidenced by prior definitions of internal marketing, which have lacked clear direction and
largely avoided descriptions of specific outcome opportunities (eg. increased revenue).
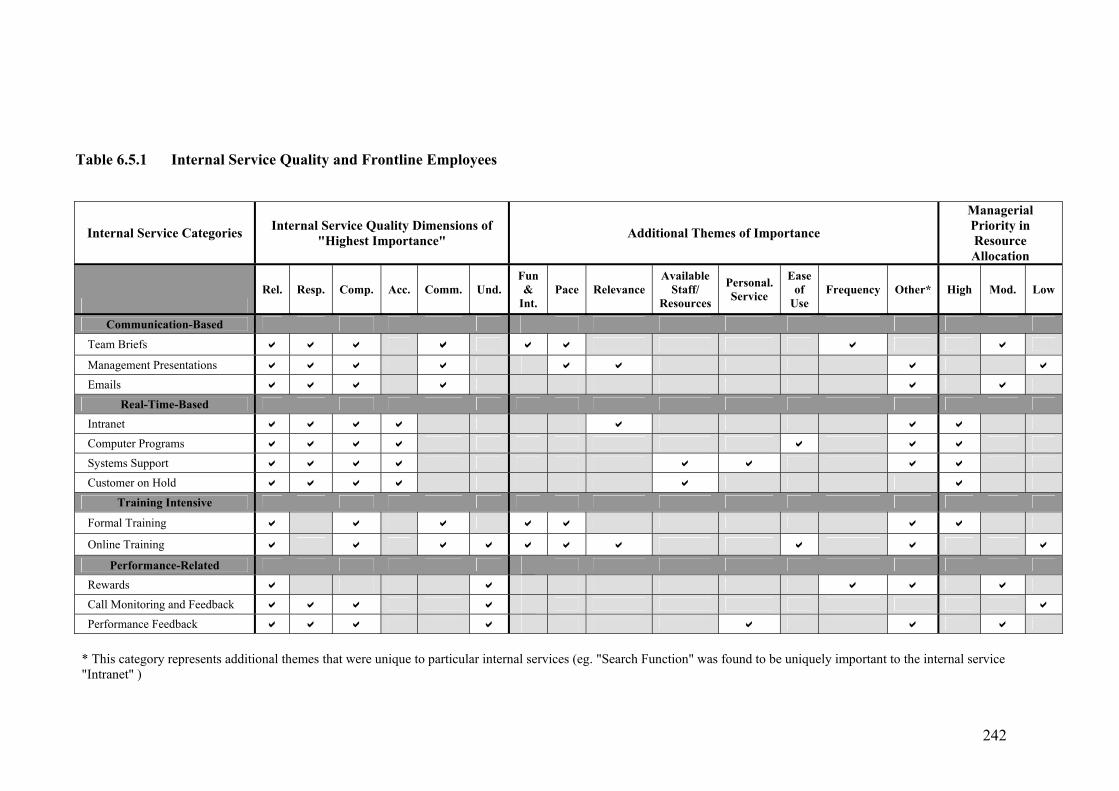
242
Table 6.5.1 Internal Service Quality and Frontline Employees
Internal Service Categories Internal Service Quality Dimensions of "Highest Importance" Additional Themes of Importance
Managerial Priority in Resource Allocation
Rel. Resp. Comp. Acc. Comm. Und.
Fun &
Int. Pace Relevance
Available Staff/
Resources
Personal. Service
Ease of
Use Frequency Other* High Mod. Low
Communication-Based
Team Briefs
Management Presentations
Emails
Real-Time-Based
Intranet
Computer Programs
Systems Support
Customer on Hold
Training Intensive
Formal Training
Online Training
Performance-Related
Rewards
Call Monitoring and Feedback
Performance Feedback
* This category represents additional themes that were unique to particular internal services (eg. "Search Function" was found to be uniquely important to the internal service "Intranet" )

243
6.6 Further Research A number of avenues for further research emerged in completing this case study of frontline
employees in a telecommunication organisation’s call centres. Firstly, the results suggested that
researchers should continue to undertake studies in diverse workplace settings. To this end, the
findings from this study indicated that the Reliability dimension was most important to frontline
employees overall, while Frost and Kumar (2001) in their study of an international airline
discovered that Responsiveness influenced overall perceptions of internal service quality the most.
Researching a range of different settings such as a bank branches, retail outlets and restaurants may
produce further differences in results, which in any case would improve our understanding of
internal service quality concepts and theory as they relate to different working environments.
This study also demonstrated the value of investigating the importance of internal service quality
dimensions within different internal services. Most of the external dimensions adapted from the
literature varied in importance from one internal service to the next, although the Tangibles
dimension, in terms of paper-based reading materials, was consistently of limited importance to
frontline employees. Exploring that dimension further, perhaps with a modified description is
needed in order to clarify its legitimacy within the internal environment. Coupled with this, it is
recommended that the themes that emerged through participants’ comments are incorporated into
future studies in order to gain a more complete insight into their importance to frontline employees
relative to the seven dimensions already explored.
In order to advance the concept of internal service classification and customization, it is
recommended that further research occurs among employee groups other than frontline employees.
For example, exploring the internal service needs of internal suppliers may provide further valuable
insights into how their workplace situations should be approached in order to allow them to be most
effective in delivering internal services to frontline employees. Such studies would also produce
some interesting points for comparison, in terms of whether the needs of these different employee
groups are similar or not. Furthermore, such research could work to further advance the relationally-
oriented internal marketing literature, which continues to grow in importance as competition within
the service industry intensifies, worldwide.
It is also essential to continue investigating the impact of internal services on the external
environment. While this case study inferred that frontline employees perceived that some internal
services impacted revenue more than others, no information was gathered to show whether internal

244
services varied in impact in terms of increasing their abilities to satisfy customer needs. Perhaps
frontline employees perceive that the process of generating revenue and satisfying customer needs
occurs simultaneously. Further research would contribute towards answering this question.
Although the descriptive quantitative data and qualitative comments obtained from this study
proved to be effective in answering the three research questions, further studies should aim to
produce more conclusive and generalisable results in order to further legitimize the body of
literature into internal service quality. For example, a conclusive examination of the seven
dimensions used in this survey could be undertaken to show whether frontline employees perceive
like dimensions as significantly more important to them in some situations than others. Such
research has the capacity to more definitively support or refute the findings from this study, which
primarily suggested than internal service delivery should be customized in order to best satisfy the
needs of frontline employees.

Chapter
7
245
7.0 Conclusions and Limitations This chapter will outline the major conclusions and limitations that emerged in completing this case
study. The conclusion will address the theoretical context of the study, its key findings and the role
that future researchers should play in further developing this strand of internal marketing theory.
The limitations section provides an insight into the main obstacles and challenges encountered in
planning and implementing the data collection stage.
7.1 Conclusion The Australian service sector has experienced considerable growth over the past few decades. This
has resulted in fierce competition amongst the many diverse players in the industry, ranging from
providers of entertainment to suppliers of telecommunications products. The intense struggle to
attract and retain customers has meant that those employees that directly serve customers – frontline
employees – have become increasingly important to service organisations. Their performance has
become crucial in generating customer loyalty and positive word of mouth in the public domain.
The emergence of frontline employees as vital competitive assets has made it more important than
ever for service organisations to understand and meet their job needs. An exhaustive review of the
literature found that while solid progress had been made in the area of services marketing, very few
studies to this point had focused upon investigating frontline employees’ expectations of internal
suppliers. This was despite the existence of a growing body of literature in the area of internal
marketing (e.g. Naudé, Desai and Murphy, 2003; Ahmed and Rafiq, 2003), which in large part
focused upon stressing the general importance of the frontline employee role (e.g. Carlzon, 1987;
Albrecht, 1988). There was, however, some discussion in the area of internal service quality that
alluded to the notion of needing to customize internal service delivery in order to meet the demands
of employees in different workplace situations (e.g. Marshall, Baker and Finn, 1998; Cannon,
2002). At the same time, other authors were of the view that internal services – like external
services – could be classified because of their different characteristics. It became clearly apparent in
reviewing these topic areas that further research was required, and that this could be facilitated in
the context of the frontline employee role. In turn, this research would provide the insights required
to better understand frontline employees’ needs in performing their roles.
246
Three research questions emerged through undertaking the literature review. The first two were
centred on gaining comprehensive insights into the work needs of frontline employees, and show
the extent to which these needs varied in different workplace situations. The final research question
explored the importance of different internal services to frontline employees, in terms them
increasing their abilities to generate revenue for the organisation. While the first two research
questions were specifically designed to better inform the theory on internal service customization
and classification, the third addressed the broader concept of internal marketing, which implies a
strong link between an organisation’s internal performance and external success.
The research questions were investigated by conducting an online survey of frontline employees
that worked in two call centres in the telecommunications industry. This case study was chosen in
light of the rapid recent growth within the telecommunications sector (www.abs.gov.au), which had
principally occurred due to increased deregulation, privatization and technological advancement
(i.e. mobile phones and internet). The first research question was explored by asking frontline
employees to rate and rank the importance of seven service quality dimensions across twelve
different internal services. The twelve internal services were identified through extensive
observation and interviews, as were the internal service quality dimensions, which were then
adapted from external service quality literature, something that had been done successfully in
previous research. The second research question was investigated by asking participants to rate the
quality of each internal service and provide supporting comments. The third research question was
explored by asking frontline employees to rate the importance of each internal service, in terms of
increasing their ability to generate revenue for the organisation. Participants were asked to answer
all of the survey questions according to how their ability to perform their customer service/sales
role was affected.
The descriptive data obtained from the survey thoroughly informed all three research questions and
in turn presented numerous theoretical implications. As advocated by Cannon (2002) and Marshall,
Baker and Finn (1998), it was apparent that frontline employees required internal service delivery to
be customized in order for them to perform most effectively in their roles. To this end, while service
quality dimensions such as Reliability were generically important to them across all twelve internal
services, some dimensions such as Understanding were peculiar to particular situations. Hence,
Reynoso and Moores (1995) suggested that researchers investigate the possibility of internal service
quality dimensions being both generically important and uniquely important. Each internal service
shared a peculiarity with at least one other internal service, which facilitated the process of
classifying them into categories to reflect these similarities, thereby going beyond the broad

247
“backstage support” label used by many to describe the functions that support frontline employees
(eg. Grönroos and Gummesson, 1986). At the same time, frontline employees’ qualitative
comments indicated that some of their needs were unique to individual internal services, while
others such as Fun and Interaction transcended across numerous classification categories. This
finding further reinforced the need for internal suppliers to approach internal service delivery
methodically, using the classification scheme as only a starting point before identifying the
characteristics uniquely important to frontline employees in each workplace situation.
These results therefore supported Stauss’ (1995) contention that each internal service differs with
respect to its supply/demand characteristics. They also confirmed the notion that needs of internal
service users were similar to those of external customers (Vandermerwe and Gilbert, 1991),
evidenced by the fact that other than Tangibles, all the internal service quality dimensions adapted
from external service quality literature (see Parasuraman, Zeithaml and Berry, 1985) seemed highly
relevant to the internal setting studied. It was also apparent though that numerous themes such as
Fun and Interaction only seemed relevant within an internal organisational context, and/or perhaps
only relevant to the setting studied. To that point, the emergence of themes such as Fun and
Interaction represent a new strand of theory in internal service quality literature, while the re-
emergence of others such as Relevance add weight to the theories of authors such as Vandermerwe
and Gilbert (1991).
Some findings from this case study also disputed those reported in previous studies and literature.
For example, while the Reliability dimension seemed to be of greatest overall importance to
frontline employees in this case study, Frost and Kumar (2001) in conducting their study of an
international airline found that Responsiveness influenced employees’ perceptions of internal
service quality the most. Also, like Kuei (1999), Tangibles was seen to be of little relevance in this
study, although Kang, James and Alexandris (2002) conducted research that confirmed Tangibles as
valid and reliable in a service setting. In addition, authors such as Davis (1993) appeared to classify
internal services solely according to their type, as opposed to also acknowledging the different
contexts in which internal services were consumed by internal customers. This demonstrates how
this study was able to both add to the body of literature and challenge existing theories.
Another major finding from this case study indicated that internal services varied in importance to
frontline employees, in terms of increasing their ability to generate revenue for the organisation. It
was therefore also legitimate to classify internal services into categories to reflect these differences,
as this would likely help internal suppliers better understand the importance of delivering optimal

248
service quality in specific situations, while at the same time assist managers in their decision
making with respect to the allocation of organisational resources. Larkin and Larkin (1996) touched
on this issue, but were not specific in encouraging resource allocation on a service-to-service level.
Furthermore, incorporating the notion that internal services can impact revenue into the internal
marketing definition may provide the degree of transparency necessary to encourage managers to
both understand and practice internal marketing, something that Sargeant and Asif (1998) stated
very few organisations had achieved.
The overall results from this case study demonstrated the great depth of knowledge required to fully
understand the dynamics associated with the frontline employee role. This indicates that it is
essential for service organisations to employ internal research to ensure they remain updated and
generate fresh insights into frontline employees’ needs and the impact of internal services upon
their encounters with external customers. A greater understanding of these areas would likely
provide a platform for managers to make better informed decisions in allocating organisational
resources and planning internal strategies. In addition, these findings also presented implications for
managers related to the recruitment, training and development of internal suppliers, the ongoing
assessment of their performances, and the general approach required to deliver high quality internal
services to frontline employees and in turn increase the potential for external success.
Coupled with the managerial implications also emerged several avenues for further research. As
noted in the previous chapter, it is important that internal service quality research continue within
diverse workplace settings, with a focus on learning about the needs of different employee groups.
It is also suggested that the internal service quality dimensions used in this study be incorporated
into future research, along with those additional themes that emerged through participants’
qualitative comments. This is essential if progress is to continue in the area of internal service
customization and classification. It is also important for research to be ongoing into the impact of
internal services on the external environment. In conducting such future research, it is perhaps most
critical that the results produced are of a more conclusive and generalisable nature, as this works
towards further legitimizing the body of literature in the area of internal service quality.
7.2 Limitations The study’s first limitation emerged due to the two call centres being located in different states –
Melbourne and Adelaide. These diverse geographical locations meant that the researcher was
unable to brief both sets of respondents in person prior to them completing the survey. This obstacle

249
was overcome, however, by allowing Adelaide sales team managers to brief respondents at that call
centre. This was facilitated by the researcher comprehensively briefing those managers as to the
essential instructions and information to convey to respondents before allowing them to take the
survey.
The second limitation relates to the x-y scatter diagrams (see Figure 5.1.3 for example) that were
adapted from Martilla and James’ (1977) “Importance-Performance Analysis” study. Although their
application was extremely useful in providing insights into the relative importance of the seven
service quality dimensions to frontline employees in different situations, they were limited in only
being able to describe three levels of importance – Highest, Moderate and Lowest. This limitation
was particularly apparent in instances where Reliability was clearly the most important dimension
to frontline employees, yet was not recognised as such, but rather grouped among other dimensions
of “highest importance”.
The third limitation is centred on the issue of generalisability. While this study was effective in
providing an in-depth insight into a specific case, the findings could not be discussed in the context
of the general population. However, as discussed earlier, further research of large numbers of
frontline employees across multiple service environments and from a range of industry sectors
would provide an opportunity for greater generalisability of results.

250
References Adler, P. A., and Adler, P., (1994), “Observational Techniques”, in Denzin, N. K. and Lincoln, Y. S., (eds.), Handbook of Qualitative Research, 2nd Edition, Thousand Oaks, CA, Sage Publications, pp. 377-392. Ahmed, P. K. and Rafiq, M., (2003), “Internal Marketing Issues and Challenges”, European Journal of Marketing, vol. 37, no. 9, pp. 1177-1186. Ahmed, P. K., Rafiq, M. and Saad, N. M., (2003), “Internal Marketing and the Mediating Role of Organisational Competencies”, European Journal of Marketing, vol. 37, no. 9, pp. 1221-1241. Albaum, G., (1997), “The Likert Scale Revisited: An Alternate Version”, Journal of the Market Research Society, vol. 39, no. 2, pp. 331-348. Albrecht, K., (1988), At America’s Service, Homewood, Illinois, Dow Jones-Irwin. Albrecht, K., (1990), Service Within: Solving the Middle Management Leadership Crisis, Homewood, Illinois, Business One Irwin. Andrews, F. M., (1984), “Construct Validity and Error Components of Survey Measures: A Structured Modelling Approach”, Public Opinion Quarterly, vol. 48, no. 2, pp. 409-442. Angrosino, M. and Mays de Pérez, K., (2000), “Rethinking Observation: From Method to Context”, in Denzin, N. K. and Lincoln, Y. S., (eds.), Handbook of Qualitative Research, 2nd Edition, Thousand Oaks, CA, Sage Publications, pp. 673-702. Atkins, P. M., Marshall, B. S. and Javalgi, R. G., (1996), “Happy Employees Lead to Loyal Patients”, Journal of Health Care Marketing, vol. 16, no. 4, pp. 14-23. Australian Associated Press, http://www.aap.com.au, last accessed November 23rd 2004. Australian Bureau of Statistics, http://www.abs.gov.au, last accessed November 19th 2004. Australian Productivity Commission, (2002), “Australia’s Service Sector: A Study in Diversity”, Productivity Commission Staff Research Paper, AusInfo, Canberra. Australian Productivity Commission, http://www.pc.gov.au, last accessed November 22nd 2004. Auty, S. and Long, G., (1999), “Tribal Warfare and Gaps Affecting Internal Service Quality”, International Journal of Service Industry Management, vol. 10, no. 1, pp. 7-22. Avkiran, N. K., (1999), “Quality Customer Service Demands Human Contact”, International Journal of Bank Marketing, vol. 17, no. 2, pp. 61-71. Ballantyne, D., (2000), “Internal Relationship Marketing: A Strategy for Knowledge Renewal”, International Journal of Bank Marketing, vol. 18, no. 6, pp. 274-286. Ballantyne, D., (2003), “A Relationship-mediated Theory of Internal Marketing”, European Journal of Marketing, vol. 37, no. 9, pp. 1242-1260.

251
Ballantyne, D., Christopher, M. and Payne, A., (1995), “Improving the Quality of Services Marketing: Service (Re)design is the Critical Link”, Journal of Marketing Management, vol. 2, no. 1, pp. 7-24. Barley, N., (1989), Not a Hazardous Sport, London, UK, Penguin. Barnes, B. R., Fox, M. T. and Morris, D. S., (2004), “Exploring the Linkage Between Internal Marketing, Relationship Marketing and Service Quality: A Case Study of a Consulting Organisation”, Total Quality Management, vol. 15, no. 5-6, pp. 593-601. Bartels, R., (1962), The History of Marketing Thought, First Edition, Columbus, Ohio, Publishing Horizons Inc. Bartels, R., (1988), The History of Marketing Thought, Third Edition, Columbus, Ohio, Publishing Horizons. Bateson, J. E. G., (1979), “Why We Need Services Marketing”, in Ferrell, O. C., Brown, S. W. and Lamb, C. W., Jr., (eds.), Conceptual and Theoretical Developments in Marketing, Chicago, Illinois, American Marketing Association, pp. 131-46. Bell, J., (1999), Doing Your Research Project: A Guide for First Time Researchers in Educational and Social Sciences, 3rd Edition, Buckingham, UK, Open University Press. Bell, C. and Zemke, R., (1989), “Coaching for Distinctive Services”, Management Review, vol. 78, no. 5, pp. 27-30. Bell, S. J., Mengüc, B. and Stefani S. L., (2004), “When Customers Disappoint: A Model of Relational Internal Marketing and Customer Complaints”, Journal of the Academy of Marketing Science, vol. 32, no. 2, pp. 112-126. Berry, L. L., (1980), “Services Marketing is Different”, Business, vol. 30, no. 3, pp. 24-29. Berry, L. L., (1981), “The Employee as Customer”, Journal of Retail Banking, vol. 3, no. 1, pp. 25-28. Berry, L. L., (1983), “Relationship Marketing”, in Berry, L.L., Shostack, G. L. and Upah, G. D., (eds.), Emerging Perspectives in Services Marketing, Chicago, Illinois, American Marketing Association, pp. 25-28. Berry, L. L. and Parasuraman, A., (1991), Marketing Services: Competing Through Quality, New York, New York, The Free Press. Berry, L. L., Hensel, J. S. and Burke, M. C., (1976), “Improving Retailer Capability for Effective Consumerism Response”, Journal of Retailing, vol. 52, no. 3, pp. 3-14. Berry, L. L., Parasuraman, A. and Zeithaml, V. A., (1994), “Improving Service Quality in America: Lessons Learned”, The Academy of Management Executive, vol. 8, no. 2, pp. 32-52. Bitner, M. J., (1990), “Evaluating Service Encounters: The Effects of Physical Surroundings and Employee Responses”, Journal of Marketing, vol. 54, no. 2, pp. 69-82.

252
Bitner, M. J., Booms, B. H. and Tetreault, M. S., (1990), “The Service Encounter: Diagnosing Favourable and Unfavourable Incidents”, Journal of Marketing, vol. 54, no. 1, pp. 71-84. Bitran, G. R. and Hoech J., (1990), “The Humanisation of Service: Respect at the Moment of Truth”, Sloan Management Review, vol. 31, no. 4, pp. 89-96 Blois, K. J., (1974), “The Marketing of Services: An Approach”, European Journal of Marketing, vol. 8, no. 2, pp. 137-45. Bowen, D. E. and Greiner, L. E., (1986), “Moving from Production to Service in Human Resource Management”, Organisational Dynamics, vol. 15, Spring, pp. 35-53. Brogowicz, A. A., Delene, L. M. and Blyth, D. M., (1990), “A Synthesised Service Quality Model with Managerial Implications”, International Journal of Service Industry Management, vol. 1, no. 1, pp. 27-45. Brown, S. W. and Swartz, T. A., (1989), “A Gap Analysis of Professional Service Quality”, Journal of Marketing, vol. 53, no. 2, pp. 92-98. Bruhn, M., (2003), “Internal Service Barometers. Conceptualisation and Empirical Results of a Pilot Study in Switzerland”, European Journal of Marketing, vol. 37, no. 9, pp. 1187-1204. Cândido, C. J. F. and Morris, D. S., (2000), “Charting Service Quality Gaps”, Totally Quality Management, vol. 11, nos. 4, 5 and 6, pp. s463-s472. Cannon, D. F., (2002), “Expanding Paradigms in Providing Internal Service”, Managing Service Quality, vol. 12, no. 2, pp. 87-99. Carlzon, J., (1987), Moments of Truth, New York, New York, Harper and Row. Chase, R. B., (1978), “Where Does the Customer Fit in a Service Operation”, Harvard Business Review, vol. 56, no. 6, pp. 137-142. Chowdhury, J., Reardon, J. and Srivastava, R., (1998), “Alternative Modes of Measuring Store Image: An Empirical Assessment of Structured Versus Unstructured Measures”, Journal of Marketing Theory and Practice, vol. 6, no. 2, pp. 72-86. Churchill, G. A. and Peter, J. P., (1984), “Research Design Effects on the Reliability of Rating Scales: A Meta-Analysis”, Journal of Marketing Research, vol. 21, November, pp. 360-375. Clulow, V. and Lasky, B., (2002), “Internal Service Quality: Using Gap Analysis for the HR Function”, Proceedings of the 4th Australasian Services Research Workshop, Monash University, Melbourne, Australia, pp. 45-51. Committee on Definitions, American Marketing Association, (1960), Marketing Definitions, A Glossary of Marketing Terms, Chicago, Illinois, American Marketing Association. Converse, P. D., (1921), Marketing, Methods and Policies, New York, New York, Prentice-Hall.

253
Cooper, D. R. and Emory, C. W., (1995), Business Research Methods, 5th Edition, Sydney, Australia, Irwin. Couper, M. P., (2001), “Web Surveys: The Questionnaire Design Challenge”, Proceedings of the 53rd Session of the ISL, Seoul, Korea. Cox, E. P., (1980), “The Optimum Number of Response Alternatives for a Scale: A Review”, Journal of Marketing Research, vol. 17, pp. 407-422. Crabtree, B. and Miller, W., (1992), Doing Qualitative Research, USA, Sage Publications. Crompton, F., George, W. R., Grönroos, C. and Karvinen, M., (1987), “Internal Marketing”, in Czepiel, J. A., Congram, C. A. and Shanahan, J., (eds.), The Services Challenge: Integrating for Competitive Advantage, Chicago, Illinois, American Marketing Association Proceedings Series, pp. 7-12. Cronin, J. J. and Taylor, S. A., (1992), “Measuring Service Quality: A Re-examination and Extension”, Journal of Marketing, vol. 56, no. 3, pp. 55-68. Czaplewski, A. J., Ferguson, J. M. and Milliman J. F., (2001), “Southwest Airlines: How Internal Marketing Pilots Success”, MM, September-October, pp. 14-17. Davis, T. R. V., (1993), “Managing Internal Service Delivery in Organisations”, in Swartz T. A., Bowen, D. E. and Brown, S. W., (eds.), Advances in Services Marketing and Management, vol. 2, Greenwich, Connecticut, Jai Press Inc., pp. 301-321. Department of Industry, Science and Resources and the Australian Service Network, (2000), “The Australian Service Sector Review 2000”, Volume Two. De Vaus, D. A., (1995), Surveys in Social Research, 4th Edition, Australia, Allen and Unwin. Dillman, D. A., (1978), Mail and Telephone Surveys, Brisbane, Australia, Wiley. Dillman, D. A., Tortora, R. D. and Bowker, D., (1998), “Principles for Constructing Web Surveys”, http://survey.sesrc.wsu.edu/dillman/papers/websurveyppr.pdf Dobbins, K., (1996), “Achieving Customer Loyalty Through Increased Usage of Teleservices”, Direct Marketing, vol. 59, November, pp. 46-49. Dommeyer, C. J. and Moriarty, E., (2000), “Comparing Two Forms of an Email Survey: Embedded vs. Attached”, International Journal of Market Research, vol. 42, no. 1, pp. 39-50. Donnelly, J. H., Jr., (1976), “Marketing Intermediaries in Channels of Distribution for Services”, Journal of Marketing, vol. 40, no. 1, pp. 55-70. Eiglier, P., Langeard, E., Lovelock, C. H., Bateson, J. E. G. and Young, R. F., (1977), Marketing Consumer Services: New Insights, Massachusetts, Marketing Science Institute. Eisenhardt, K., (1989), “Building Theories from Case Study Research”, Academy of Management Review, vol. 14, no. 4, pp. 532-550.

254
Elmore, P. E. and Beggs, D. L., (1975), “Salience of Concepts and Commitment to Extreme Judgments in Response Pattern of Teachers”, Education, vol. 95, no. 4, pp. 325-334. Fink, A., (1995), The Survey Handbook, Thousand Oaks, CA, Sage Publications. Finn, R. H., (1972), “Effects of Some Variations in Rating Scale Characteristics on the Means and Reliabilities of Ratings”, Educational and Psychological Measurement, vol. 32, pp. 255-265. Fisk, R. P., Brown, S. W. and Bitner, M. J., (1993), “Tracking the Evolution of the Services Marketing Literature”, Journal of Retailing, vol. 69, no. 1, pp. 61-96. Flipo, J. P., (1986), “Service Firms: Interdependence of External and Internal Marketing Strategies”, European Journal of Marketing, vol. 20, no. 8, pp. 5-14. Foddy, W., (1993), Constructing Questions for Interviews and Questionnaires: Theory and Practice in Social Research, Cambridge, Cambridge University Press. Foreman, S. K. and Money, A. H., (1995), “Internal Marketing: Concepts, Measurement and Application”, Journal of Marketing Management, vol. 11, pp. 755-768. Fowler, F. J., (1993), Survey Research Methods, Newbury Park, CA, Sage Publications. Frazer, L. and Lawley, M., (2000), Questionnaire Design and Administration: A Practical Guide, Queensland, Australia, John Wiley and Sons. Frenkel, S., Tam, M., Korczynski, M. and Shire, K., (1998), “Beyond Bureaucracy? Work Organisation in Call Centres”, International Journal of Human Resource Management, vol. 9, no. 6, pp. 957-979. Frost, F. A. and Kumar, M., (2001), “Service Quality Between Internal Customers and Internal Suppliers in an International Airline”, International Journal of Quality and Reliability Management, vol. 18, no. 4, pp. 371-386. Gaddis, S. E., (1998), “How to Design Online Surveys”, Training and Development, vol. 52, no. 6, pp.67-72. Garvin, D. A., (1987), “Competing on the Eight Dimensions of Quality”, Harvard Business Review, vol. 65, no. 6, pp. 101-109. George, W. R., (1977), “The Retailing of Services – A Challenging Future”, Journal of Retailing, vol. 53, no. 3, pp. 85-98. George, W. R., (1990), “Internal Marketing and Organisational Behaviour: A Partnership in Developing Customer-Conscious Employees at Every Level”, Journal of Business Research, vol. 20, no. 1, pp. 63-70. Givon, M. M. and Shapira, Z., (1984), “Response to Rating Scales: A Theoretical Model and Its Application to the Number of Categories Problem”, Journal of Marketing Research, vol. 21, pp. 410-419.

255
Glasser, B. G. and Strauss, A. L., (1967), The Discovery of Grounded Theory. Strategies for Qualitative Research, Chicago, Illinois, Aldine Publishing Company. Glassman, M. and McAfee, B., (1992), “Integrating the Personnel and Marketing Functions: The Challenge of the 1990’s”, Business Horizons, vol. 35, no. 3, pp. 52-59. Greene, W. E., Walls, G. D. and Schrest, L. J., (1994), “Internal Marketing: The Key to External Marketing Success”, Journal of Services Marketing, vol. 8, no. 4, pp. 5-13. Grönroos, C. and Gummesson, E., (1986), “Service Orientation in Industrial Marketing”, in Venkatesan, M., Schmalensee, D. M. and Marshall, C., (eds.), Creativity in Services Marketing: What’s New, What Works, What’s Developing, Chicago, Illinois, American Marketing Association, pp. 23-26 Grönroos, C., (1981), “Internal Marketing: An Integral Part of Marketing Theory”, in Donnelly, J. H. and George W. E., (eds.), Marketing of Services, Chicago, Illinois, American Marketing Association Proceedings Series, pp. 236-238. Grönroos, C., (1983), Strategic Management and Marketing in the Service Sector, London, United Kingdom, Chartwell-Bratt. Grönroos, C., (1985), “Internal Marketing – Theory and Practise”, in Bloch, T. M., Upah, G. D. and Zeithaml, V. A., (eds.), Services Marketing in a Changing Environment, Chicago, Illinois, American Marketing Association, pp. 41-47. Grönroos, C., (1988), “Service Quality: The Six Criteria of Good Perceived Service Quality”, Review of Business, vol. 9, no. 3, pp. 10-13. Grönroos, C., (1990), Service Management and Marketing. Managing the Moments of Truth in Service Competition, Lexington, Massachusetts, Free Press/ Lexington Books. Grönroos, C., (1994), “From Scientific Management to Service Management: a Management Perspective for the Age of Service Competition”, International Journal of Services Industry Management, vol. 5, no. 1, pp. 5-20. Grove, S. and Fisk, R., (1983), “The Dramaturgy of Service Exchange: An Analytical Framework for Services Marketing”, in Berry, L. L., Shostack, G. L. and Upah, G. D., (eds.), Emerging Perspectives in Services Marketing, Chicago, Illinois, American Marketing Association, pp. 45-54. Gummesson, E. and Grönroos, C., (1987), “Quality of Products and Services – A Tentative Synthesis Between Two Models”, Paper Presented at the American Marketing Association’s Sixth Annual Services Marketing Conference, San Diego, California. Gummesson, E., (1987), “Using Internal Marketing to Develop a New Culture: The Case of Ericsson Quality”, Journal of Business and Industrial Marketing, vol. 2, no. 3, pp. 23-28. Gummesson, E., (1991), “Market-orientation Revisited: The Crucial Role of the Part-Time Marketer”, European Journal of Marketing, vol. 25, no. 2, pp. 60-75.

256
Gummesson, E., (1994), “Service Management: An Evaluation and the Future”, International Journal of Service Industry Management, vol. 5, no. 1, pp. 77-96. Hartline, M. D. and Jones, K. C., (1996), “Employee Performance Cues in a Hotel Service Environment: Influence on Perceived Service Quality, Value, and Word-of-Mouth Intentions”, Journal of Business Research, vol. 35, pp. 207-215. Herington, C., Scott, D. and Johnson, L. W., (2005), “Focus Group Exploration of Firm-Employee Relationship Strength”, Qualitative Market Research: An International Journal, vol. 8, no. 3, pp. 256-276. Hermann, J. A. and Baker, E. M., (1985), “Teamwork is Meeting Internal Customer Needs”, Quality Progress, vol. 18, no. 7, pp. 12-16. Herrington, G. and Lomax, W., (1999), “Do Satisfied Employees Make Customers Satisfied? An Investigation into the Relationship Between Service Employee Job Satisfaction and Customer Perceived Service Quality”, Kingston University Occasional Paper Series, no. 34, pp. 1-9. Heskett, J. L., (1987), “Lessons in the Service Sector”, Harvard Business Review, vol. 65, no. 2, pp. 118-126. Heskett, J. L., Jones, T. O., Loveman, G. W., Sasser, W. E. and Schlesinger, L. A., (1994), “Putting the Service-Profit Chain to Work”, Harvard Business Review, vol. 72, no. 2, pp. 164-174. Hunt, S. D., (1976), Marketing Theory, Columbus, Ohio, Grid. Ilieva, J., Baron, S. and Healey, N. M., (2002), “Online Surveys in Marketing Research: Pros and Cons”, International Journal of Market Research, vol. 44, no. 3, pp. 361-378. Janes, J., (2001), “Survey Research Design”, Library Hi Tech, vol. 19, no. 4, pp. 419-421. Jevons, C. and Pidgeon, J., (2001), “Service Quality Measures in Vietnam and Australia”, Journal of Transnational Management Development, vol. 6 (3/4), pp. 85-100. Johlke, M. C. and Duhan, D. F., (2000), “Supervisor Communication Practise and Service Employee Job Outcomes”, Journal of Service Research, vol. 3, no. 2, pp. 154-165. Johnson, E. M., (1969), “Are Goods and Services Different? An Exercise in Marketing Theory”, Ph.D. Dissertation, Washington University. Johnson, L. W. and Frohman, A. L., (1989), “Identifying and Closing the Gap in the Middle of Organisations”, The Academy of Management Executive, vol. 3, no. 2, pp. 107-114. Judd, R. C., (1964), “The Case for Redefining Services”, Journal of Marketing, vol. 28, no. 1, pp. 58-59. Kane, E. J., (1986), “IBM’s Quality Focus on the Business Process”, Quality Progress, vol. 19, no. 4, pp. 24-33.

257
Kang, G., James, J. and Alexandris, K., (2002), “Measurement of Internal Service Quality: Application of the SERVQUAL Battery to Internal Service Quality”, Managing Service Quality, vol. 12, no. 5, pp. 278-291. Kelemen, M. and Papasolomou-Doukakis, I., (2004), “Can Culture be Changed: A Study of Internal Marketing”, The Service Industries Journal, vol. 24, no. 5, pp. 121-135. Keller, S. B., (2002), “Internal Relationship Marketing: A Key to Enhanced Supply Chain Relationships”, International Journal of Physical Distribution and Logistics Management, vol. 32, no. 8, pp. 649-668. Kingman-Brundage, J., (1995), “Service Mapping: Back to Basics”, in Glynn, W. J. and Barnes, J. G., (eds.), Understanding Services Management, Dublin, Ireland, Oak Tree Press, pp. 119-142. Kingman-Brundage, J., George, W. R. and Bowen, D. E., (1995), “Service Logic: Achieving Service System Integration”, International Journal of Service Industry Management, vol. 6, no. 4, pp. 20-39. Kinnear, T. and Taylor, J., (1996), Marketing Research: An Applied Approach, Sydney, Australia, McGraw-Hill. Krios, K., (2001), “An Exploratory Study of the Factors Affecting Frontline Employees’ Ability to Deliver Service to Customers in a Telecommunication Company’s Call Centre,” Unpublished Honours Thesis, Melbourne, Australia, Swinburne University of Technology. Kuei, C., (1999), “Internal Service Quality – An Empirical Assessment”, International Journal of Quality and Reliability Management, vol. 16, no. 8, pp. 783-791. Larkin, T. J. and Larkin, S., (1996), “Reaching and Changing Frontline Employees”, Harvard Business Review, vol. 74, no. 3, pp. 95-104. Lehtinen, U. and Lehtinen, J. R., (1985), “Service Quality: A Study of Quality Dimensions”, Paper Read at the Second World Marketing Congress, University of Stirling, Scotland. Levitt, T., (1960), “Marketing Myopia”, Harvard Business Review, vol. 38, no. 4, pp. 45-56. Levitt, T., (1981), “Marketing Intangible Products and Product Intangibles”, Harvard Business Review, vol. 59, no. 3, pp. 94-102. Lincoln, Y. S. and Guba, E. G., (1985), Naturalistic Inquiry, London, Sage Publications. Lings, I. N., (2004), “Internal Market Orientation – Construct and Consequences”, Journal of Business Research, vol. 57, pp. 405-413. Lings, I. N. and Greenly, G. E., (2005), “Measuring Internal Market Orientation”, Journal of Service Research, vol. 7, no. 3, pp. 390-305. Loftland, J., (1971), Analysing Social Settings, Belmore, CA, Wadsworth.

258
Lovelock, C. H., (1979), “Theoretical Contributions from Services and Non-Business Marketing”, in Ferrell, O. C., Brown, S. W. and Lamb, C. W., Jr., (eds.), Conceptual and Theoretical Developments in Marketing, Chicago, Illinois, American Marketing Association, pp. 147-65. Lovelock, C. H., (1983), “Classifying Services to Gain Strategic Marketing Insights”, Journal of Marketing, vol. 47, no. 3, pp. 9-20. Lovelock, C. H., (1992a), “A Basic Toolkit for Service Managers”, in Lovelock, C. H., (ed.), Managing Services- Marketing, Operations and Human Resources, New Jersey, Prentice-Hall, pp. 17-30. Lovelock, C. H., (1992b), “Are Services Really Different”, in Lovelock, C. H., (ed.), Managing Services- Marketing, Operations and Human Resources, New Jersey, Prentice-Hall, pp. 1-8. Malhotra, N., Hall, J., Shaw, M. and Crisp, M., (1996), Marketing Research: An Applied Orientation, Sydney, Australia, Prentice Hall. Malhotra, N., (1999), Marketing Research: An Applied Orientation, 3rd Edition, Sydney, Australia, Prentice Hall. Marshall, G. W., Baker, J. and Finn, D. W., (1998), “Exploring Internal Customer Service Quality”, Journal of Business and Industrial Marketing, vol. 13, no. 4/5, pp. 381-392. Martilla, J. A. and James, J. C., (1977), “Importance-Performance Analysis”, Journal of Marketing, vol. 41, no. 1, pp. 77-79. Martin, R. A., (1992), “Creating and Maintaining Service Culture”, International Journal of Quality and Reliability Management, vol. 9, no. 1, pp. 9-19. Mattell, M. S. and Jacoby, J., (1972), “Is There an Optimal Number of Alternatives for Likert Scale Items?”, Journal of Applied Psychology, vol. 56, pp. 506-509. Mclachlan, R., Clark, C. and Monday, I., (2002), “Australia’s Service Sector: A Study in Diversity”, Productivity Commission Staff Research Paper, AusInfo, Canberra. Mcleod, C., Iverson, R. D. and Bittigieg, D. M., (1995), “Services and Internal Marketing: An Organisational Commitment Perspective”, 7th Bi-Annual World Marketing Congress, vol. 7, no. 1, pp. 1-2, 13. Mehta, R. and Sivadas, E., (1995), “Comparing Response Rates and Response Content in Mail Versus Electronic Surveys”, Journal of Market Research Society, vol. 37, no. 4, pp. 429-440. Mels, G., Boshoff, C. and Nel, D., (1997), “The Dimensions of Service Quality: The Original European Perspective Revisited”, The Service Industries Journal, vol. 17, no. 1, pp. 173-189. Merton, R. K., Fisk, M. and Kendall, P.L., (1990), The Focused Interview: A Manual of Problems and Procedures, 2nd Edition, New York, New York, The Free Press. Miles, M. B. and Huberman, M. A., (1994), Qualitative Data Analysis – An Expanded Sourcebook, 2nd Edition, Thousand Oaks, CA, Sage Publications. MindBranch, Inc., www.mindbranch.com, last accessed November 19th 2004.

259
Mitchell, V., (1996), “Assessing the Reliability and Validity of Questionnaires: An Empirical Example”, Journal of Applied Management Studies, vol. 5, no. 2, pp. 199-207. Mudie, P., (2003), “Internal Customer: By Design or by Default”, European Journal of Marketing, vol. 37, no. 9, pp. 1261-1276. Murray, J. G., (1979), “The Importance of Internal Marketing”, The Bankers Magazine, July/August, pp. 38-40. Nagel, P. J. A. and Cilliers, W. W., (1990), “Customer Satisfaction: A Comprehensive Approach”, International Journal of Physical Distribution and Logistics Management, vol. 20, no. 6, pp. 1-46. Naudé, P., Desai, J. and Murphy, J., (2003), “Identifying the Determinants of Internal Marketing Orientation”, European Journal of Marketing, vol. 37, no. 9, pp. 1205-1220. Neuman, W. L., (1997), Social Research Methods, 3rd Edition, USA, Allyn and Bacon. Norman, R., (1984), Service Management: Strategy and Leadership in Service Businesses, Chichester, England, Wiley. Nunnally, J. C., (1978), Psychometric Theory, 2nd Edition, Sydney, Australia, McGraw-Hill. Orlich, D. C., (1978), Designing Sensible Surveys, Pleasantville, New York, Redgrave Publishing Company. Palmer, A., (1998), Principles of Services Marketing, 2nd Edition, Berkshire, England, McGraw-Hill. Parasuraman, A., Berry, L. L. and Zeithaml, V. A.., (1991), “Perceived Service Quality as a Customer-Based Performance Measure: An Empirical Examination of Organisational Barriers Using an Extended Service Quality Model”, Human Resource Management, vol. 30, no. 3, pp. 335-364. Parasuraman, A., Zeithaml, V. A. and Berry, L. L., (1985), “A Conceptual Model of Service Quality and Its Implications for Future Research”, Journal of Marketing, vol. 49, no. 4, pp. 41-50. Parasuraman, A., Zeithaml, V. A. and Berry, L. L., (1988), “SERVQUAL: A Multiple-Item Scale for Measuring Consumer Perceptions of Service Quality”, Journal of Retailing, vol. 64, no. 1, pp. 12-40. Patton, M. Q., (1990), Qualitative Evaluation and Research Methods, Newbury Park, CA, Sage Publications. Perry, C., (1998), “Processes of a Case Study Methodology for Postgraduate Research in Marketing”, European Journal of Marketing, vol. 32, no. 9/10, pp. 785-802. Pettigrew, A., (1988), “Longitudinal Field Research on Change: Theory and Practise”, Paper Presented at the National Science Foundation Conference on Longitudinal Research Methods in Organisations, Austin, Texas.

260
Piercy, N. and Morgan, N., (1991), “Internal Marketing – The Missing Half of the Marketing Programme”, Long Range Planning, vol. 24, no. 2, pp. 82-93. Platt, J., (1992), “Case Study in American Methodological Thought”, Current Sociology, vol. 40, pp. 17-48. Rafiq, M. and Ahmed, P. K., (1993), “The Scope of Internal Marketing: Defining the Boundary Between Marketing and Human Resource Management”, Journal of Marketing Management, vol. 9, pp. 219-232. Rafiq, M. and Ahmed, P. K., (2000), “Advances in the Internal Marketing Concept: Definition, Synthesis and Extension”, Journal of Services Marketing, vol. 14, no. 6, pp. 449-462. Rathmell, J. M., (1966), “What is Meant by Services?”, Journal of Marketing, vol. 30, no. 4, pp. 32-36. Redline, C. D. and Dillman, D. A., (1999), “The Influence of Auxiliary, Symbolic, Numeric, and Verbal Language on Navigational Compliance in Self-administered Questionnaires”, http://survey.sesrc.wsu.edu/dillman/papers/Auxiliary,Symbolic,Numeric%20paper--with%20Cleo.pdf Regan, W. J., (1963), “The Service Revolution”, Journal of Marketing, vol. 27, no. 3, pp. 57-62. Reynoso, J. and Moores, B., (1995), “Towards the Measurement of Internal Service Quality”, International Journal of Service Industry Management, vol. 6, no. 3, pp. 64-83. Reynoso, J. and Moores, B., (1997), “Operationalising the Quality of Internal Support Operations in Service Organisations”, in Swartz T. A., Bowen, D. E. and Brown, S. W., (eds.), Advances in Services Marketing and Management, vol. 6, Greenwich, Connecticut, Jai Press Inc., pp. 147-170. Richards, L., (1993), “Writing a Qualitative Thesis or Grant Application”, in Beattie, K., (eds.), So Where’s Your Research Profile, South Melbourne, Australia, Union of Australian College Academics. Robson, O., (1993), Real World Research: A Resource for Social Scientists and Practitioner Researchers, Oxford, Blackwell. Romano, C., (1989), “Research Strategies for Small Business: A Case Study”, International Small Business Journal, vol. 7, no. 4, pp. 35-43. Rucci, A. J., Kirn, J. and Quinn, S. P., (1998), “The Employee-Customer Profit Chain at Sears”, Harvard Business Review, vol. 76, no. 1, pp. 82-97. Sales, L. R., (1964), Managerial Behaviour: Administration in Complex Organisations, New York, New York, McGraw Hill. Sargeant, A. and Asif, S., (1998), “The Strategic Application of Internal Marketing – An Investigation of UK Banking”, International Journal of Bank Marketing, vol. 16, no. 2, pp. 66-79. Sasser, W.E. and Arbeit, S., (1976), “Selling Jobs in the Service Sector”, Business Horizons 19, June Issue, pp. 61-65.

261
Saunders, M., Lewis, P. and Thornhill, A., (2000), Research Methods for Business Students, 2nd Edition, Harlow, Pearson Education. Schaefer, E., (2001), “Web Surveying: How to Collect Important Assessment Data Without Any Paper”, http://oiir.iit.edu/oiir/Presentations/WebSurveying/WebSurveying_20010424.pdf Schaefer, R. and Dillman, D. A., (1998), “Development of a Standard Email Methodology: Results of an Experiment”, Public Opinion Quarterly, vol. 62, no. 3, pp. 378-397. Schlesinger, L. A. and Heskett, J. L., (1991), “The Service-Driven Service Company”, Harvard Business Review, vol. 69, no. 5, pp. 71-81. Schuldt, B. A. and Totten, J. W., (1994), “Electronic Mail Versus Mail Survey Response Rates”, Marketing Research, vol. 6, no. 1, pp. 36-39. Schuman, H. and Presser, S., (1981), Questions and Answers in Attitude Surveys, New York, New York, Academic Press. Schuman, H. and Presser, S., (1996), Questions and Answers in Attitude Surveys, London, Sage Publications. Sergeant, A. and Frenkel, S., (2000), “When do Customer Contact Employees Satisfy Customers?”, Journal of Service Research, vol. 3, no. 1, pp. 18-34. Shipley, D., (1994), “Achieving Cross-Functional Co-Ordination for Marketing Implementation”, Management Decision, vol. 32, no. 8, pp. 17-20. Shostack, G. L., (1977), “Breaking Free from Product Marketing”, Journal of Marketing, vol. 41, no. 2, pp. 73-80. Silvestro, R., Fitzgerald, L., Johnston, R. and Voss, C., (1992), “Towards a Classification of Service Processes”, International Journal of Service Industry Management, vol. 3, no. 3, pp. 62-75. Smith, H., (1975), Strategies of Social Research: The Methodological Imagination, Englewood Cliffs, New Jersey, Prentice Hall. Spector, P. E., (1992), Summated Rating Scale Construction: An Introduction, London, Sage Publications. Stake, R. E., (2000), “Case Studies”, in Denzin, N. K. and Lincoln, Y. S., (eds.), Handbook of Qualitative Research, 2nd Edition, Thousand Oaks, CA, Sage Publications, pp. 435-454. Stanton, W. J., Miller, K. E. and Layton, R. A., (1994), Fundamentals of Marketing, 3rd Australian Edition, Sydney, N.S.W., McGraw-Hill Book Company Australia Pty. Ltd. Stauss, B., (1995), “Internal Services: Classification and Quality Management”, International Journal of Service Industry Management, vol. 6, no. 2, pp. 62-78. Stenbacka, C., (2001), “Qualitative Research Requires Quality Concepts of its Own”, Management Decision, vol. 39, no. 7, pp. 551-555.

262
Suprenant, C. F. and Soloman, M. R., (1987), “Predictability and Personalisation in the Service Sector”, Journal of Marketing, vol. 51, no. 2, pp. 73-80. Thompson, T. W., Berry, L. L. and Davidson, P. H., (1978), Banking Tomorrow: Managing Markets Through Planning, New York, New York, Van Nostrand Reinhold Company. Vandermerwe, S. and Gilbert, D., (1989), “Making Internal Services Market Driven”, Business Horizons, vol. 32, no. 6, pp. 83-89. Vandermerwe, S. and Gilbert, D., (1991), “Internal Services: Gaps in Needs/ Performance and Prescriptions for Effectiveness”, International Journal of Service Industry Management, vol. 2, no. 1, pp. 50-60. Varey, R. J., (1995), “Internal Marketing: A Review and Some Interdisciplinary Research Challenges, International Journal of Service Industry Management, vol. 6, no. 1, pp. 40-63. Voima, P., (2000), “Internal Relationships Management: Broadening the Scope of Internal Marketing”, in Varey, R. J. and Lewis B. R., (eds.), Internal Marketing, Directions for Management, Routledge, London, pp. 239-253. Voss, M. D., Calantone, R. J. and Keller, S. B., (2005), “Internal Service Quality. Determinants of Distribution Centre Performance”, International Journal of Physical Distribution and Logistics Management, vol. 35, no. 3, pp. 161-176. Wasmer, D. J. and Bruner, G. C., (1991), “Using Organisational Culture to Design Internal Marketing Strategies”, Journal of Services Marketing, vol. 5, no. 1, pp. 35-46. Wilson, A., (1995), “The Internal Marketing of Services: The New Age Surge”, Logistics Information Management, vol. 8, no. 4, pp. 4-7. Winter, J. P., (1985), “Getting Your House in Order With Internal Marketing: A Marketing Prerequisite”, Health Marketing Quarterly, vol. 3, no. 1, pp. 69-77. Yin, R. K. and Heald K. A., (1975), “Using the Case Study Survey Method to Analyse Policy Studies”, Administrative Science Quarterly, vol. 20, no. 3, pp. 371-381. Yin, R. K., (1994), Case Study Research – Design and Methods, 2nd Edition, Thousand Oaks, CA, Sage Publications. Zanutto, E., (2001), “Web and Email Surveys”, http://www-stat.wharton.upenn.edu/~zanutto/Annenberg2001/docs/websurveys01.pdf Zeithaml, V. A., Berry, L. L. and Parasuraman, A., (1988), “Communication and Control Processes in the Delivery of Service Quality”, Journal of Marketing, vol. 52, no. 2, pp. 35-48. Zikmund, W. G., (1997), Business Research Methods, 5th Edition, Fort Worth, Texas, Dryden. Zimmer, M. and Golden, L., (1988), “Impressions of Retail Stores: A Content Analysis of Consumer Images”, Journal of Retailing, vol. 64, no. 3, pp. 265-293.

Appendix 1 – Sample Survey