swiss national bank working papers€¦ · swiss national bank working papers immigration and swiss...
TRANSCRIPT

2010
-16
Swis
s Na
tion
al B
ank
Wor
king
Pap
ers
Immigration and Swiss House PricesKathrin Degen and Andreas M. Fischer

The views expressed in this paper are those of the author(s) and do not necessarily represent those of the Swiss National Bank. Working Papers describe research in progress. Their aim is to elicit comments and to further debate.
Copyright ©The Swiss National Bank (SNB) respects all third-party rights, in particular rights relating to works protectedby copyright (information or data, wordings and depictions, to the extent that these are of an individualcharacter).SNB publications containing a reference to a copyright (© Swiss National Bank/SNB, Zurich/year, or similar) may, under copyright law, only be used (reproduced, used via the internet, etc.) for non-commercial purposes and provided that the source is mentioned. Their use for commercial purposes is only permitted with the prior express consent of the SNB.General information and data published without reference to a copyright may be used without mentioning the source.To the extent that the information and data clearly derive from outside sources, the users of such information and data are obliged to respect any existing copyrights and to obtain the right of use from the relevant outside source themselves.
Limitation of liabilityThe SNB accepts no responsibility for any information it provides. Under no circumstances will it accept any liability for losses or damage which may result from the use of such information. This limitation of liability applies, in particular, to the topicality, accuracy, validity and availability of the information.
ISSN 1660-7716 (printed version)ISSN 1660-7724 (online version)
© 2010 by Swiss National Bank, Börsenstrasse 15, P.O. Box, CH-8022 Zurich

1
Immigration and Swiss House Prices
Kathrin Degen1
Andreas M. Fischer2
April 2010
Abstract
This study examines the behavior of Swiss house prices to immigration flowsfor 85 districts from 2001 to 2006. The results show that the nexus betweenimmigration and house prices holds even in an environment of low houseprice inflation, nationwide rent control, and modest immigration flows. Animmigration inflow equal to 1% of an area’s population is coincident with anincrease in prices for single-family homes of about 2.7%: a result consistentwith previous studies. The overall immigration effect for single-family housescaptures almost two-thirds of the total price increase.
Keywords: Immigration, Housing PricesJEL Classification Number: F22, J61, R21
1 Swiss National Bank, Postfach, 8022 Zurich, Switzerlandtelephone (+41 44) 631 37 94, FAX (+41 44) 631 81 72e-mail: [email protected] Swiss National Bank and CEPR, Postfach, 8022 Zurich, Switzerlandtelephone (+41 44) 631 32 94, FAX (+41 44) 631 81 72e-mail: [email protected]
* The authors thank an anonymous referee, Tommaso Frattini, Sarah Lein,Albert Saiz, Steven Stillman, and the SNB’s IR Unit for comments on anearlier draft. The authors also benefited from discussions with Urs Hausmannand Dieter Marmet from Wuest and Partner. The views expressed here arethose of the authors and do not necessarily reflect the position of the SwissNational Bank.

2 3
1. Introduction
Recent evidence from country studies on house prices suggests that the im-
pact of immigration on local house prices is a global phenomenon. Saiz (2007)
estimates that an immigrant inflow equal to 1% of a city’s population results
in a 2% increase in house prices for U.S. cities. Gonzalez and Ortega (2009)
show that the price effect through immigration is higher for the Spanish
housing market. Akbari and Aydede (2009) instead find muted immigration
effects for the Canadian housing market. Stillman and Mare (2008) uncover
a separation result between migrant groups. They find that the inflows of
returning New Zealanders are related to rising house prices but that inflows
of new foreign immigrants are not.
A striking feature of these spatial correlations - the correlation between
house prices and immigration across local markets - is that they coincide with
episodes of high house price inflation and pronounced immigration flows at
the national level. Gonzalez and Ortega (2009), for example, consider a boom
episode where Spanish house prices grew annually by 17.5% and the foreign-
born share in the working population increased from 2 to 16% between 1998
and 2008. Similarly, Saiz (2007) examines a 15-year episode where prices for
new single-family homes grew annually by 6.3% and the 10 largest American
1

2 3
immigrant cities recorded levels of new legal immigration of 13% of the initial
population.1 Immigrations impact for periods of low house price inflation
have not been previously examined.
The objective of this paper is to show that the nexus between house
prices and immigration holds also for episodes of low house price inflation and
modest immigration inflows. At the extreme we consider a country with low
rates of home ownership and nationwide rent control. Both of these market
features may suggest that the demand induced pressures from immigration
are weaker in an environment of low house price inflation. More specifically,
we examine the behavior of Swiss house prices to immigration flows for 85
districts between 2001 and 2006. During this period, the population-weighted
average price change for single-family homes grew annually by 1.5% and the
immigration inflow to Switzerland was consistent with the European average
of around 3 immigrants per 1000 inhabitants.
To interpret our short-run estimates that attribute price increases to de-
mand effects through immigration flows, we rely on country specific features
of the Swiss housing market. We argue that the structure of the housing
1The figure 6.3% is from 1983 to 1997 for new single-family homes using the index from
the U.S. Department of Housing and Development.
2

4 5
market is important for understanding the links between house prices and
immigration. On the one hand, nationwide rent control and a low level of
home ownership characterize the Swiss housing market. A prior shared by
most researchers is that these two market features should lead to moder-
ate house price movements. On the other hand, low vacancy rates and low
turnover rates depict the Swiss housing market. These features mean that
the tight Swiss housing market is susceptible to local shocks, say through un-
expected immigration inflows. This latter channel suggests that the relation
between immigration and house prices could be broader than is documented
in previous country studies.
Our empirical analysis of the Swiss housing market that exploits the cross-
regional variation at the annual frequency fits closest to studies by Saiz (2007)
and Gonzalez and Ortega (2009). Conditioning on a set of local variables,
our estimates find that an immigration inflow equal to 1% of a district’s
population is coincident with an increase in prices for single-family homes
of about 2.7%. The average immigration impact for single-family houses
explains almost two-thirds of the total price increase.
The paper is organized as follows. Section 2 outlines the main features
of the Swiss housing market. Section 3 presents the empirical methodology.
3

4 5
Section 4 discusses the data and descriptive statistics. Section 5 documents
the empirical results. Section 6 concludes.
2. Distinct Features of the Swiss Housing Market
To show that our results are primarily explained by demand shocks in tight
local markets, we first outline the main distinguishing features of the Swiss
housing market. House price inflation in Switzerland is low by international
standards. Table 1 lists the average annual real increase in house prices for
18 OECD countries from 1970 to 2006. The historical record shows that
the average real price increase for Swiss housing is 0.34%. This figure is the
second lowest among the advanced countries and is seven times lower than
the returns for U.S. homes examined in Saiz (2007).2
Low demand for owner occupancy and nationwide rent control are fre-
quently mentioned as factors explaining the muted growth in Swiss house
prices, see Werczberger (1997). The rates for home ownership in Canada
(65.8%, national census 2001), New Zealand (67.8%, 2001), Spain (85.3%,
2000), and the United States (67.8%, 2000), countries examined in previ-
2Wuest and Partner (2004b) calculate international investment returns for housing,
yielding similar results as in Table 1.
4

6 7
ous house price-immigration studies, are twice that of Switzerland’s (35.5%,
2000). Unlike in many other countries, the Swiss federal government does
not actively promote home ownership.3
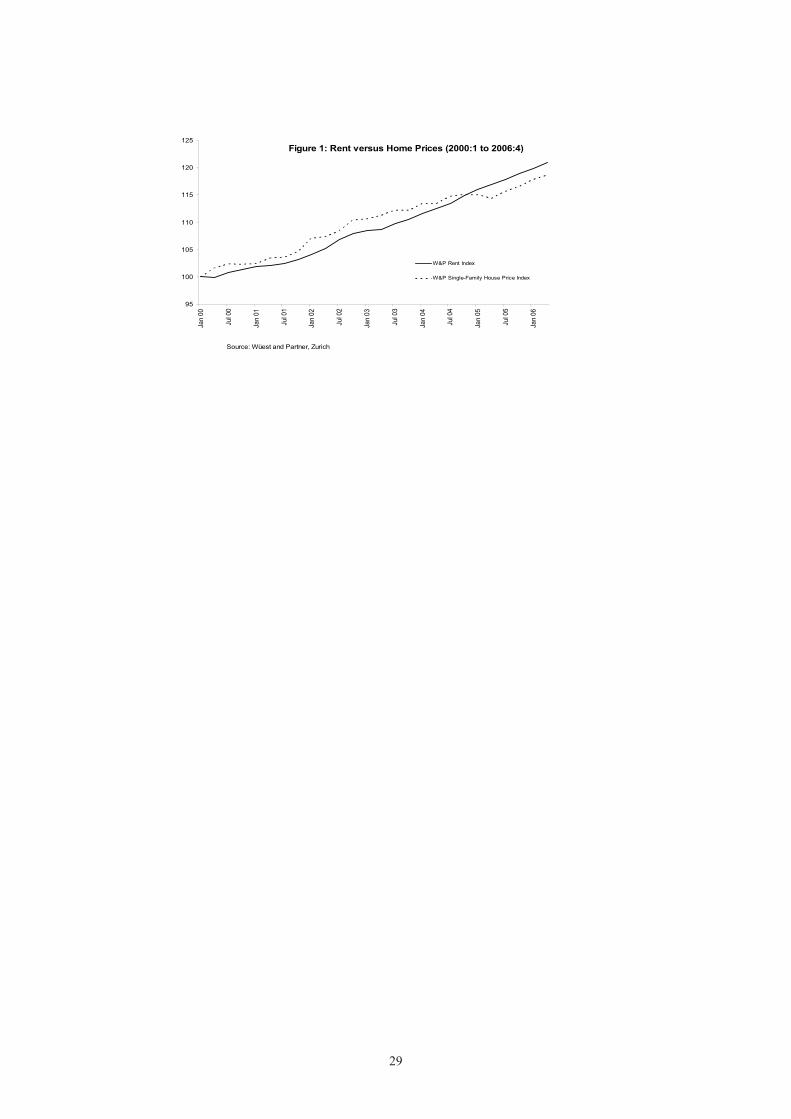
Nationwide rent control is a further reason for low house price inflation
in Switzerland. Rent increases must be justified by the landlord’s cost in-
creases, see Stalder (2003). As such, rent increases do not fully reflect mar-
ket pressures. Figure 1 shows the levels of the Wuest and Partner index for
rents and single-family homes from 2000:1 to 2006:4. The quarterly index
for rents moves in a trend like manner, reflecting legislative constraints for
rent increases. Instead, home prices show greater fluctuations with moderate
growth.4
A tight housing market is often the consequence of pro-tenant laws.
Tightness of the housing market is observed in low vacancy and low turnover
rates. For our period of investigation, the average vacancy rate, measured
by the Bundesamt fur Statistik, is 1.34% for Swiss rental units compared
3In fact, taxes discourage owner-occupancy in Switzerland. Property is treated as an
asset subject to wealth and income taxes for imputed rental income. Further, unlike other
financial investments in Switzerland, housing is subject to capital gains taxes. Capital
gains are taxed at the cantonal level with rates differing by duration of ownership.4A corresponding rent index at the regional level is unavailable for Switzerland.
5

6 7
to 9.7% for U.S. rental units. The tightness of the Swiss housing market
is also reflected in low occupancy turnover rates. Wuest and Partner esti-
mate the average stay to be 5 to 6 years for rental units, 12 to 14 years for
condominiums, and 20 years for single family homes.5
In the empirical analysis of section 5, only local information from vacancy
rates enters our micro specification. Information on turnover and on home
ownership rates is unavailable at the annual frequency. Similarly, the mar-
ket impact from nationwide rent control is only indirectly captured as an
explanation for moderate price movements in Swiss house prices.
3. Econometric Specification
We estimate the impact of immigrant inflows on house prices at the district
level. Our empirical baseline specification follows Saiz (2007)
∆pit = µt + β(∆Iit
POPit−1
) + γ1∆uit−1 + γ2Xi + εit, (1)
where ∆pit = ln(pit/pit−1) denotes the annual change in house prices in
district i at time t. The immigration effect is captured by ( ∆Iit
POPit−1), the
immigrant flow relative to the population at t − 1 for area i. Changes in
5These turnover rates are indicative for select districts based on information from Wuest
and Partner (2004a).
6

8 9
unemployed divided by population is denoted by ∆uit−1. Further, µt is a
year fixed effect and Xi is a set of control variables, capturing region-specific
characteristics. The shock to house prices in region i at time t is εit.
The specification in first differences assumes that regional fixed effects
are filtered out. Still, we are interested in regional indicators that capture
common information across local regions. These five indicators are an index
for district size (8 different categories), an index for district typology (14 dif-
ferent categories from agglomeration to rural), an index for district language
(4 categories), a dummy for economic strength (+1 if receives fiscal transfers,
0 otherwise), and an index for social economic status (index from 0 to 100
based on education, job possibilities, income).
The coefficient of interest, β, is interpreted as the percentage change of
house prices associated with annual inflows of immigrants equal to 1% of
a district’s population. Because of the annual frequency of our sample, β
is interpreted as a short-run estimate in which the supply of housing does
not respond immediately to immigration.6 In other words, an increase in
6Gonzalez and Ortega (2009) and Saiz (2007) also work with annual data and interpret
β as a short-run estimate capturing demand effects. Instead, the literature that relies on
census data such as Greulich et al. (2004) and Ottaviano and Peri (2007) for the United
States interpret the results at the decennial frequency as long-run estimates. The latter
7

8 9
immigration into a district raises its local population and thereby the demand
for housing. The increase in local demand raises prices and results in a
positive β. This positive effect of immigration on house prices also assumes
that natives are not infinitely sensitive to changes in housing costs and that
native displacement from the local housing market is not complete. One
interpretation for this effect offered by Saiz (2007) is that immigrants are
less sensitive to housing costs, because local immigrant-specific amenities
and networks are more important to them.
An empirical shortcoming of the baseline equation (1) is that we do not
include a measure of household income for the full sample estimates. This
limitation is due to data availability.7 The absence of Swiss income means
that our estimates for β in equation (1) are subject to an omitted variables
bias. In other words, OLS estimates overstate potentially the immigration
effect. For a restricted sample with household income at the district level,
we show that the omitted variables bias linked to income does not influence
interpretation assumes that housing supply varies in response to immigration, while the
former interpretation does not.7Income data at the city level is available only for the cantons of Basel-City, Zurich and
Thurgau for the year 2000. We are therefore unable to construct a measure for income
changes at the district level for the full sample.
8

10 11
our empirical results.
Potential measurement problems for our measure of immigrant flows raise
concerns of the attenuation bias for our estimate of β, see Aydemir and Bor-
jas (2006). Immigration flow is measured as the annual change in the number
of foreign nationals residing in Switzerland. Because the immigration stock
varies in response to naturalized citizens and births of foreign nationals, our
measure of immigration flow is contaminated. This measurement problem
drives the OLS estimate of β towards zero. Although at the national level
the difference between foreign nationals and foreign born population is small
by international comparisons, it is difficult to determine how large the mea-
surement problem is across regions.8
Establishing causality through an exogenous source of fluctuations in im-
migration inflows represents an additional concern for OLS estimation of β
in equation (1). Immigration to a local area is likely to be an endogenous
event. For example when controlling for local factors, immigrants may pre-
fer areas where housing costs are increasing more slowly. This sensitivity to
8Swiss record keeping of immigrants follows the “ius sanguinis” concept. In 2006,
foreign nationals were 20.2% of the population, while foreign born were 22.9% of the
population. See table 3 in Munz (2008) for European comparisons.
9

10 11
rising housing costs biases the OLS estimate of β towards zero.
To overcome problems of measurement error and of endogeneity linked
to ( ∆Iit
POPit−1), we employ an instrumental variables (IV) strategy based on the
settlement patterns of immigrants in previous periods. This instrument strat-
egy has been used previously by Saiz (2007), Gonzalez and Ortega (2009),
and Ottaviano and Peri (2007). The instrument is constructed such that
it is independent from local contemporary demand factors, which possibly
affect the settlement choices of immigrants. The instrument, referred as the
“supply push component” by Card (2001), is constructed as follows:
SPit =∑
c
λ1997ci ∆Ict
POPit−1
, with λ1997ci =
I1997ci
I1997c
. (2)
The share of immigrants from country c settling in district i in 1997 is denoted
by λ1997ci .9 The variable, ∆Ict = Ict − Ict−1, is the year-to-year change in the
national level of immigrants from country c. By summing λ1997ci ∆Ict over
origin countries, we hope to obtain a predicted measure of total immigrant
inflows in district i at time t that is orthogonal to local demand conditions.
9Munshi (2003) shows that settlement patterns of previous immigrants determine lo-
cation choices of arriving immigrants from the same country of origin. We construct the
instrument with 11 countries of origin: Austria, France, Germany, Italy, the Netherlands,
Portugal, Serbia, Spain, Turkey, the United Kingdom, and other.
10

12 13
Finally, the instrument is normalized by the population in district i at t− 1.
4. Data and Descriptive Statistics
The annual sample is from 2001 to 2006. The hedonic adjusted prices are
for single-family homes, multi-family homes, and condominiums, spanning
85 districts that have a residential population of at least 25,000 inhabitants
in 2001.10 Similar data for rents are unavailable at the district level. The
average annual increase in house prices from 2001 to 2006 is 1.52% for single-
family homes, 2.06% for multi-family homes, and 1.43% for condominiums
(weighted by population over the 85 districts).11 The examined areas encom-
pass 96.38% of the Swiss residential population. Data on house prices are
from Informations- und Ausbildungszentrum fur Immobilien.
Data on the number of foreigners grouped by their country of origin are
10The term “district” refers to the 106 MS-Regionen, see Wuest and Partner (2004a)
for further definitions.11The respective unweighted figures are 1.20% for single-family homes, 2.08% for multi-
family homes, and 0.99% for condominiums, suggesting that home prices for larger districts
grew slightly faster. The fact that new construction investment as a percentage of GDP
stagnated at 6% throughout our sample is a further reflection of the moderate price growth
for Swiss homes. Weak persistence is a further implication of the moderate house price
inflation.
11

12 13
available at the city level. Between 2001 and 2006, Switzerland had an overall
positive net migration rate of 2.9 per 1,000 inhabitants, consistent with the
European average of 3.0 per 1,000 inhabitants, see Munz (2008). For our
sample of 85 districts, the figure rises to 3.3. The source is the Federal Office
for Migration. Further, data on the number of unemployed for each city
are from the State Secretariat for Economic Affairs. Last, data on the total
resident population and on the five socio-economic and regional indicators
for each city are from the Federal Statistics Office. Information at the city
level is aggregated to match our housing data at the district level.
Table 2 shows descriptive statistics for immigration, house prices, and the
vacancy rate for 10 districts with the largest immigrant-to-population ratio
and 10 districts with the smallest immigrant-to-population ratio. Despite
modest house price inflation and immigration flows at the national level, the
statistics, except for the vacancy rates, show considerable variation at the
local level. The first column records the immigrant-to-population ratio for
2001. The unweighted average of the 10 largest immigrant cities is more
than three times larger than the unweighted average of the 10 smallest im-
migrant cities. The second column documents larger immigrant cities in 2006
have larger populations by a factor of three. The third column displays the
12

14 15
aggregate change in immigration between 2001 to 2006 over the population
from 2001. Again, larger immigrant cities experienced greater immigration
flows than did smaller immigrant cities. The unweighted averages differ by
a factor of 13. The next three columns show the cumulative price change
over the sample for single-family homes (sfh), multi-family homes (mfh), and
condominiums (con). Larger price changes are observed for larger immigrant
cities. Particular large differences between large and small immigrant cities
arise for condominiums and single-family houses. The last column presents
the vacancy rates for 2006. Again, larger immigrant cities have lower vacancy
rates. The differences between the averages for the largest and smallest im-
migrant cities however are not strikingly large. This evidence suggests that
the Swiss house market is tight irrespective of location.
5. Estimation Results
In this section, we show that immigration flows are coincident with increases
in house prices using price indexes of three different home types. This result
is surprising given the low level of house price inflation. We first present
baseline estimates based on equation (1) in Tables 3 and 4. Thereafter, we
conduct numerous checks to determine the robustness of our point estimates
13

14 15
for local immigration flows. In particular, we show that income is not an
important determinant of house price inflation. This result suggests that
our estimates of β in the baseline specification do not suffer from omitted
variables bias due to the absence of income.
Table 3 presents OLS regressions for single-family homes, multi-family
homes, and condominiums. All regressions are estimated with time effects.
In addition to our baseline specification with five regional controls shown
in columns 1 to 3, separate regressions are also estimated without regional
controls in columns 4 to 6 and with regional fixed effects in columns 7 to 9.
The coefficients of the regional and time controls are not reported in the ta-
bles. Heteroskedasticity-robust standard errors are reported in parentheses,
while robust standard errors controlling for district clustering are reported
in brackets.
The OLS regressions for the three house prices show that the coefficients
for immigrant flows lie between 0.361 and 0.914. The price impact from im-
migration is highest for multi-family homes, followed by single-family homes,
then condominiums. This ordering is consistent with the average price in-
creases for the three house types. The regressions show that controlling for
regional factors matters. The estimated price impact from immigration is
14

16 17
highest for the specification without regional controls, followed by the spec-
ification with regional fixed effects, and then the specification with regional
indicators. Apart from the specification without regional controls, no clear
pattern of significance emerges for ( ∆Iit
POPit−1).
Table 4 presents IV regressions for the same specifications shown in Table
3. For all IV specifications, the price effects through immigration are larger
than the OLS estimates. This result suggests that the OLS estimates are
biased downward due to measurement and endogeneity problems, a finding
consistent with Saiz (2007) and Gonzalez and Ortega (2009). The regressions
of the baseline specification with regional indicators are in columns 1 to 3.
The coefficient estimates of the immigrant-price effect are significant and
range between 1.456 and 3.485, depending on house type. More specifically,
an immigration inflow equal to 1% of an area’s population is associated with
an increase in single-family house prices is 2.7%.
The regressions without regional controls are shown in columns 4 to 6. As
in the OLS regressions, regional controls matter in the IV regressions. The
significant coefficient estimates tend to be larger than those in the specifica-
tion with regional controls. This result suggests that our regional controls
capture common information across districts, absent in the regressions in
15

16 17
columns 4 to 6.
Next in columns 7 to 9, we present regressions with fixed effects. Although
our specification in first differences should eliminate regional fixed effects,
including them reduces concerns about the validity of the instrument in that
it allows districts to experience specific shocks. The coefficient estimates
are slightly lower with respect to our preferred specification with regional
controls in columns 1 to 3. As expected with fixed effects, the standard
errors increase such that only multi-family homes remain significant at the
10% level.
Table 4 Panel B shows the first-stage regressions between the endogenous
variable ( ∆Iit
POPit−1) and the instrument, SPit. Our estimate for the instruments
in the specification with regional controls is 0.856, without regional controls is
0.861, and with fixed effects is 1.132. Each of these instruments are significant
at the 1% level. As a further check of the instruments, the F-test for weak
instruments is used. The F-tests for the joint significance of the excluded
instruments range between 11.70 and 25.93, suggesting that our instruments
do not suffer from the criticism of weak instruments.
Next, Table 5 presents several robustness tests for single-family homes
with regional controls. Almost all robustness checks show that our baseline
16

18 19
estimate of 2.7 is not sensitive to alternative specifications. Column 1 repli-
cates the baseline estimates from Table 4 for comparative purposes. As a
first simple check, we present the estimate without unemployment in column
2. The estimates for ( ∆Iit
POPit−1) in columns 1 and 2 are identical.
The next three columns consider the role of income changes, which should
impact house prices in a positive manner. In column 3, we add changes
in taxable household income (per capita) for the 85 districts for 2002 to
2006. Column 3 shows the immigrant effect for ( ∆Iit
POPit−1) rises to 3.245 in the
specification with lagged changes in household income. To determine whether
income or the smaller sample that excludes 124 observations is responsible
for the stronger price effect, column 4 shows the specification without income
for the restricted sample. Although income enters significantly in column 3,
the regression in column 4 shows an estimate of 3.334 for ( ∆Iit
POPit−1). This
evidence suggests that changes in household income do not strongly impact
house prices.
As an additional check for income, immigration effects for high- and
low-income growth districts are considered separately. To test for nonlin-
ear effects in income changes, we include an interaction term ( ∆Iit
POPit−1)high =
( ∆Iit
POPit−1)*dhigh, where dhigh is a dummy that takes the value 1 if a district’s
17

18 19
income changes are above the 75th percentile and 0 otherwise.
The regressions with high- and low-income districts are shown in column
5. Compared to the baseline estimate of 2.7, the effect is higher in the districts
with lower income changes (3.184) and slightly lower in regions with high
income changes: 3.187 - 1.148 = 2.039. For both groups, the null hypothesis
that the coefficients are equal to the baseline coefficient is rejected. A χ2(1)
test = 4.52 for equivalency with the baseline estimate for the high growth
districts has a p-value of 0.033 and a χ2(1) test = 3.460 for the low growth
districts has a p-value of 0.063. An explanation for these results is that the
immigration effect is partly compensated by high income growth.
As a further robustness check, we consider whether the 11 largest districts
with a population greater than 150,000 influence our estimates.12 Column 6
shows that the coefficient estimate for ( ∆Iit
POPit−1) falls to 2.1 in the restricted
sample that excludes the 11 largest cities compared to the baseline estimate
of 2.7 in the full sample. A χ2(6) test with a p-value of 0.017 rejects the null
that the immigration effect from the sample without large cities is the same
as the baseline estimate. We interpret this result to mean that our baseline
12The 11 districts are Aarau, Basel-City, Basel-Lower Area, Bern, Geneva, Glattal-
Furttal, Lausanne, Luzern, St Gall, Winterthur, and Zurich.
18

20 21
estimates are driven by large city dynamics. An explanation for this large city
effect is simply that immigrants are more likely to reside in larger districts
because these regions offer better job opportunities and amenities. Indeed,
over 40% of the total immigrants live in the 11 districts with populations
larger than 150,000.
A final check examines whether local tightness in the housing market in-
fluences the baseline estimate. Column 7 shows the regression of the baseline
specification with local vacancy rates. This added variable is insignificant and
has no influence on the baseline estimate of 2.7 for ( ∆Iit
POPit−1). We interpret
this result to mean that the housing market is tight throughout Switzerland
and therefore cannot help explain local differences in house prices.
To better understand the price effect from immigration of 2.7 for single-
family homes, we calculate the average impact from immigration on house
prices. First, we consider the average immigrant flows over the 85 districts
from 2001 to 2006. This annual average is 0.33% of a district’s population.
The overall immigration effect for single-family houses in our sample is 0.33%
* 2.7 ≈ 0.99%. This means that almost two-thirds (0.99%/1.52% ≈ 0.60)
of the total price increase is attributed to demand effects of immigration.13
13The numbers for multi-family homes are (0.33% * 3.5 ≈ 1.15%, yielding 1.15% / 2.06%
19

20 21
This average impact effect from immigration flows is higher for Switzerland
than the average estimate of one-third for Spain’s boom episode examined
by Gonzalez and Ortega (2009).
6. Conclusions
We find that an increase in immigrant flows equal to 1% of the total popu-
lation in each district is coincident with a 2.7% price increase in Swiss house
prices for single-family homes. The short-run estimates for an environment
of low house price inflation are consistent with international evidence found
for episodes with higher house price inflation. The results show that rent
control and low home ownership rates, distinct features of the Swiss housing
market, do not mitigate the house price effect associated with immigration.
≈ 0.55 of the total price increase. Similarly, the numbers for condominiums are (0.33% *
1.5 ≈ 0.5%, yielding 0.5% / 1.53% ≈ 0.35 of the total price increase.
20

22 23
References
Aydemir, A. and G. Borjas, 2006. Attenuation Bias in Measuring the WageImpact of Immigration, mimeo.
Akbari, A. and Y. Aydede, 2009. Effects of Immigration on Housing Pricesin Canada, Atlantic Metropolis Centre, Working Paper No. 24-2009.
Card, D., 2001. Immigrant Inflows, Native Outflows, and the Local La-bor Market Impacts of Higher Immigration, Journal of Labor Economics19(1), 22-64.
Fischer, A. M., 2009. European Hoarding, Currency Use Among Immigrantsin Switzerland,” Globalization and Monetary Policy Institute WorkingPaper 35.
Frattini, T., 2008. Immigration and Prices in the UK, UCL Working Paper.
Gonzalez, L. and F. Ortega, 2009. Immigration and Housing Booms: Evi-dence from Spain, IZA DP No. 4333.
Greulich, E., J. M. Quigley and S. Raphael, 2004. The Anatomy of RentBurdens: Immigration, Growth and Rental Housing, Brookings Paperson Urban Affairs, 149-187.
Munz, R., 2008. Migration, Labor Markets, and Integration of Migrants: AnOverview for Europe, SP Discussion Paper No. 0807.
Munshi, K., 2003. Networks in the Modern Economy: Mexican Migrants inthe U.S. Labor Market, Quarterly Journal of Economics 188(2), 549-599.
Ottaviano, G. I. P. and G. Peri, 2007. The Effects of Immigration on U.S.Wages and Rents: A General Equilibrium Approach, working paper.
Saiz, A., 2007. Immigration and Housing Rents in American Cities, Journalof Urban Economics 61(2), 345-371.
Saiz, A., 2003. Room in the Kitchen for the Melting Pot: Immigration andRental Prices, Review of Economics and Statistics 85(3), 502-521.
Stalder, P., 2003. Entkoppelung der Mieten vom Hypozins: Implikationender Mietrechtsrevision fur die Geldpolitik, SNB Quartalsheft (3), 44-57.
21

22 23
Stillman, S. and D.C. Mare, 2008. Housing Markets and Migration: Evidencefrom New Zealand, Motu Working Paper 08-06.
Werczberger, E., 1997. Home Ownership and Rent Control in Switzerland,Housing Studies 12(3), 337-353.
Wuest and Partner, 2004a. Immo-Monitoring 2004/1 Analysen und Prog-nosen Fokus Wohnungsmarkt, Verlag W&P, Zurich.
Wuest and Partner, 2004b. Immo-Monitoring 2004/3 Analysen und Prog-nosen Fokus Geschaftsflachenmarkt, Verlag W&P, Zurich.
22

24 25
Table 1:Average Annual Real Increase in Single Family House Prices1970-2006
Germany -0.38Switzerland 0.34Japan 0.36Sweden 1.00Finland 1.59Norway 2.19Italy 2.23USA 2.29Denmark 2.42Canada 2.53France 2.55Australia 2.97New Zealand 3.19Netherlands 3.26Belgium 3.58Ireland 3.90Spain 3.95United Kingdom 4.14source:finfacts.ie
23

24 25
Distr
ictIm
mig
rant
to P
opul
ation
Ra
tioPo
pulat
ion
Chan
ge in
Imm
igra
nts o
ver
Popu
latio
nHo
me V
acan
cy
Rate
(in %
)(I
/ Pop
) 200
6Po
p 200
6 ((I
2006
- I 2
001
)/Pop
2001
)x10
0(in
200
6)
sfhm
fhco
n
Larg
est i
mm
igra
nt-r
egio
nsLa
usan
ne0.
3425
0'132
3.40
18.6
119
.95
16.3
00.
16Ge
nève
0.32
439'7
851.
0634
.30
29.1
330
.71
0.22
Aigl
e0.
3137
'017
6.40
23.5
731
.26
15.4
41.
56Ve
vey
0.31
83'28
83.
4919
.08
20.9
816
.08
0.38
Base
l-Stad
t0.
2919
0'324
2.03
13.7
210
.82
14.8
70.
90Li
mm
attal
0.29
75'63
91.
929.
066.
7110
.98
0.83
Unter
see
0.28
53'66
64.
304.
2911
.20
2.91
1.23
Belli
nzon
a0.
2745
'180
1.23
9.96
15.7
08.
231.
09Lu
gano
0.27
128'6
077.
7311
.77
14.0
610
.50
0.50
Züric
h0.
2736
9'335
0.72
21.0
314
.33
22.5
60.
05Av
erag
e0.
3016
7'29
73.
2316
.54
17.4
114
.86
0.69
Smal
lest i
mm
igra
nt-r
egio
nsSu
rselv
a0.
1025
'471
0.97
5.87
10.9
54.
321.
14Er
lach-
Seela
nd0.
0951
'726
0.16
-0.0
96.
67-0
.24
1.30
Lint
hgeb
iet0.
0957
'085
0.17
5.15
9.38
4.96
0.92
Wein
land
0.09
28'59
00.
861.
336.
642.
131.
00Ur
i0.
0934
'575
0.41
0.74
8.87
0.31
0.76
Burg
dorf
0.08
72'03
7-0
.33
-0.4
86.
39-0
.40
1.31
Thun
0.08
117'8
93-0
.12
2.95
8.59
2.98
0.45
Sens
e0.
0839
'490
0.50
-1.2
69.
70-2
.05
0.85
Aare
tal0.
0559
'809
0.38
-0.2
56.
150.
131.
53Ob
eres
Em
men
tal0.
0424
'658
-0.6
0-1
.65
7.56
-2.3
21.
39Av
erag
e0.
0851
'133
0.24
1.23
8.09
0.98
1.06
Aver
age o
ver a
ll 85
regi
ons
0.18
83'3
771.5
67.
1812
.495.
971.0
2
Relat
ive C
hang
e in
Hous
e Pric
es
((P20
06 -
P20
01)/P
2001
)x10
0
Tabl
e 2: D
escr
iptiv
e Sta
tistic
s
Notes
: Ta
ble 2
show
s the
regi
ons w
ith th
e 10
large
st an
d 10
small
est i
mm
igra
nt-to
-pop
ulati
on ra
tios (
in 2
006)
. Th
e cha
nges
in im
mig
ratio
n an
d ho
use p
rices
disp
lay th
e ag
greg
ate ch
ange
s ove
r 200
1 to
200
6. H
ouse
pric
e cha
nges
are s
hown
for s
ingl
e-fa
mily
hom
es (s
fh),
mul
ti-fa
mily
hom
es (m
fh),
and
cond
omin
ium
s (co
n).
24

26 27
(1)
(2)
(3)
(4)
(5)
(6)
(7)
(8)
(9)
sfhmf
hco
nsfh
mfh
con
sfhmf
hco
n
ΔIit
/ Pop
it-1
0.55
30.
803
0.36
10.
829
0.91
40.
610
0.56
90.
800
0.38
8
[0.4
08]
[0.3
91]*
*[0
.269
][0
.432
]*[0
.398
]**
[0.3
00]*
*[0
.272
]**
[0.2
38]*
**[0
.206
]*(0
.345
)(0
.371
)**
(0.2
34)
(0.3
54)*
*(0
.361
)**
(0.2
50)*
*
(0.4
93)
(0.4
72)*
(0
.322
) Δ
u it-1
-0.1
111.
833
0.95
40.
468
1.48
01.
636
-0.3
091.
901
0.81
7[1
.144
][0
.862
]**
[0.8
33]
[1.0
55]
[0.7
60]*
[0.8
14]*
*[1
.404
][1
.224
][1
.062
](0
.914
)(0
.954
)*(0
.696
)(1
.116
) (0
.930
) (1
.020
)
(1.1
28)
(0.8
79)*
* (0
.803
) Ye
ar F
Ey
yy
yy
y
yy
y
Obse
rvati
ons
510
510
510
510
510
510
510
510
510
Regi
ons
8585
8585
8585
8585
85R-
Squa
re (w
ithin
)0.
560.
880.
320.
530.
870.
230.
580.
890.
27
Tabl
e 3 -
OLS
Reg
ress
ions
Samp
le: 8
5 M
S Re
gion
s fro
m 20
01-2
006
Pane
l: O
LS E
stim
ates
- Dep
. Var
. is t
he y
/y L
n-ch
ange
in H
ouse
Pric
es ( Δ
pit)
with
Reg
iona
l Con
trol V
aria
bles
w/o R
egio
nal C
ontro
l Var
iabl
eswi
th R
egio
nal F
ixed E
ffects
Notes
:Tab
le3
disp
layst
heba
selin
eOLS
relat
ion
betw
een
chan
gesi
nim
mig
ratio
nan
dth
eSwi
ssho
use
price
inde
x.Th
edep
ende
ntva
riabl
esar
eth
ean
nual
chan
gein
the
loga
rithm
ofth
eho
use
price
indi
ces,
Δpit,
for
singl
e-fa
mily
hom
es(sf
h),m
ulti-
fam
ilyho
mes
(mfh
),an
dco
ndom
iniu
ms(
con)
.ΔI it
/Pop
it-1
isth
ey/y
chan
gein
imm
igra
ntsr
elativ
eto
thep
opul
ation
inre
gion
iatt
imet
-1.Δ
u it-1de
notes
thec
hang
ein
unem
ploy
eddi
vide
dby
popu
latio
nin
regi
onia
ndtim
et-1
.All
estim
ation
sinc
lude
fixed
effe
ctsby
year
.Col
umns
1to
3es
timate
theb
aseli
nesp
ecifi
catio
nwi
th5
regi
onal
indi
cato
rs.Co
lum
ns4
to6
show
thee
stim
atesw
ithou
treg
iona
lcon
trolv
ariab
les,a
ndco
lum
ns7
to9
acco
untf
orre
gion
aldi
ffere
nces
byin
cludi
ngre
gion
alFE
.Hete
rosk
edas
ticity
-robu
ststa
ndar
derro
rsin
pare
nthe
ses;
cluste
red
stand
ard
erro
rs(b
yre
gion
)in
brac
kets;
*sig
nific
anta
t10%
;**s
igni
fican
tat5
%;*
**sig
nific
anta
t1%
.
25

26 27
(1)
(2)
(3)
(4)
(5)
(6)
(7)
(8)
(9)
sfhmf
hco
nsfh
mfh
con
sfhmf
hco
n
ΔIit
/ Pop
it-1
2.74
93.
485
1.45
64.
398
2.36
33.
537
2.56
92.
833
0.65
3
[1.0
09]*
**[1
.078
]***
[0.7
10]*
*[1
.246
]***
[0.8
65]*
**[1
.064
]***
[1.6
59]
[1.6
29]*
[1.3
47]
(1.0
27)*
**(1
.122
)***
(0.7
36)*
*
(0.9
58)*
**(0
.776
)***
(0.7
72)*
**
(1.7
74)
(1.5
34)*
(1.2
65)
Δ u it
-1-0
.193
1.73
20.
913
0.36
81.
439
1.55
4-0
.378
1.83
10.
808
[1.0
55]
[0.8
49]*
*[0
.787
][1
.045
][0
.737
]*[0
.854
]*[1
.059
][0
.828
]**
[0.7
78]
(0.9
01)
(1.0
15)*
(0.7
25)
(1
.228
)(0
.921
)(1
.200
)
(0.9
62)
(1.0
34)*
(0.7
57)
Year
FE
yy
yy
yy
yy
y
SPit
0.85
60.
856
0.85
60.
861
0.86
10.
861
1.13
21.
132
1.13
2
[0.1
93]*
**[0
.193
]***
[0.1
93]*
**[0
.169
]***
[0.1
69]*
**[0
.169
]***
[0.3
31]*
**[0
.331
]***
[0.3
31]*
**(0
.201
)***
(0.2
01)*
**(0
.201
)***
(0.1
36)*
**(0
.136
)***
(0.1
36)*
**
(0.3
31)*
**(0
.331
)***
(0.3
31)*
**
Obse
rvati
ons
510
510
510
510
510
510
510
510
510
Regi
ons
8585
8585
8585
8585
85R-
Squa
re (f
irst s
tage)
0.15
0.15
0.15
0.11
0.11
0.11
0.09
0.09
0.09
F-Te
st (1
st sta
ge w
ith cl
uster
ing)
19.6
219
.62
19.6
225
.93
25.9
325
.93
11.7
011
.70
11.7
0
Pane
l B: 1
st St
age E
stim
ates
- De
p. V
ar. i
s the
y/y
Cha
nge o
f Im
mig
rant
s to
Popu
latio
n Ra
tio (Δ
I it /
Pop it
-1)
Tabl
e 4 -
IV R
egre
ssio
nsw/
o Reg
iona
l Con
trol V
aria
bles
with
Reg
iona
l Con
trol V
aria
bles
Samp
le: 8
5 M
S Re
gion
s fro
m 20
01-2
006
Pane
l A: 2
nd S
tage
Esti
mat
es- D
ep. V
ar. i
s the
y/y
Ln-
chan
ge in
Hou
se P
rices
(Δ p
it)
with
Reg
iona
l Fixe
d Ef
fects
Notes
:Pan
elA
inTa
ble
4di
splay
sthe
2nd
stage
ofth
ein
strum
ental
varia
bles
(IV)r
elatio
nsbe
twee
nch
ange
sofi
mm
igra
tion
and
the
Swiss
hous
epr
icein
dex.
The
depe
nden
tvar
iables
are
the
annu
alch
ange
inth
elo
garit
hmof
the
hous
epr
icein
dice
s,Δ
p it,fo
rsin
gle-
fam
ilyho
mes
(sfh)
,mul
ti-fa
mily
hom
es(m
fh),
and
cond
omin
ium
s(co
n).Δ
I it/P
opit-
1is
the
y/y
chan
gein
imm
igra
nts
relat
ive
toth
epo
pulat
ion
inre
gion
iatt
ime
t-1.Δ
u it-1
deno
testh
ech
ange
inun
empl
oyed
divi
ded
bypo
pulat
ion
inre
gion
iand
time
t-1.I
nPa
nelB
the
first-
stage
relat
ion
isdi
splay
ed.T
hein
strum
entS
P itis
the
estim
ated
imm
igra
ntch
ange
,bas
edon
the
settl
emen
tpatt
erns
ofim
mig
rant
sin
1997
.All
estim
ation
sinc
lude
fixed
effe
ctsby
year
.Col
umns
1to
3es
timate
the
base
line
spec
ifica
tion
with
5re
gion
alin
dica
tors.
Colu
mns
4to
6sh
owth
ees
timate
swi
thou
treg
iona
lcon
trolv
ariab
les,a
ndco
lum
ns7
to9
acco
untf
orre
gion
aldi
ffere
nces
byin
cludi
ngre
gion
alFE
.He
teros
keda
sticit
y-ro
bust
stand
arde
rrors
inpa
rent
hese
s;clu
stere
dsta
ndar
der
rors
(by
regi
on)i
nbr
acke
ts;*
signi
fican
tat1
0%;*
*sig
nific
anta
t5%
;***
signi
fican
tat1
%.
26

28 29
(1)
(2)
(3)
(4)
(5)
(6)
(7)
Base
line
w/o
Unem
ploy
ment
Restr
icted
Sam
ple
Restr
icted
Sam
ple
diffe
rent
iated
by
excl.
Lar
ge
incl.
Vac
ancy
wi
th In
come
w/o
Inco
meHi
gh vs
. Low
Inco
meDi
strict
sRa
tes
∆I it
/ Pop
it-1
2.74
92.
753.
245
3.33
43.
187
2.11
52.
741
[1
.009
]***
[1.0
09]*
**[1
.095
]***
[1.0
96]*
**[1
.154
]***
[0.8
17]*
**[1
.000
]***
(1.0
27)*
**(1
.027
)***
(0.9
28)*
**(0
.930
)***
(1.1
05)*
**(0
.919
)**
(1.0
25)*
**
(∆I it
/ Pop
it-1)hi
gh
-1.1
48
[0.6
84]*
(0.8
16)
∆ u it
-1-0
.193
-0
.447
-0.5
42-0
.260
1.32
9-0
.232
[1.0
55]
[0
.639
][0
.633
][1
.039
][3
.173
][1
.038
](0
.901
)
(0.8
62)
(0.8
61)
(0.9
14)
(2.0
70)
(0.8
95)
∆ ln
yit-
10.
031
[0.0
12]*
**(0
.013
)**
∆ ν i
t-10.
004
[0.0
05]
(0.0
05)
Year
FE
yy
yy
yy
y
SPit
0.85
60.
855
1.14
71.
156
0.7
23a
0.98
70.
854
[0
.193
]***
[0.1
93]*
**[0
.246
]***
[0.2
46]*
**[0
.217
]***
[0.1
81]*
**[0
.194
]***
(0.2
01)*
**(0
.201
)***
(0.1
72)*
**(0
.171
)***
(0.2
30)*
**(0
.215
)***
(0.2
01)*
**(S
P it)hi
gh
1
.554
b
[0
.163
]***
(0
.156
)***
Obse
rvati
ons
510
510
304
304
510
444
510
Regi
ons
8585
8585
8574
85R-
Squa
re (f
irst s
tage)
0.17
0.15
0.26
0.25
0.
08a /
0.25
b 0.
160.
15F-
Test
(1st
stage
with
clus
terin
g)28
.95
19.6
521
.68
22.1
115
.52a /
47.0
9 b
29.8
519
.38
Tabl
e 5 -
Robu
stnes
s
Pane
l A: 2
nd S
tage
Esti
mat
es- D
ep. V
ar. i
s the
y/y
Ln-
chan
ge in
Hou
se P
rices
(∆ p
it)
Pane
l B: 1
st St
age E
stim
ates
- De
p. V
ar. i
s the
y/y
Cha
nge o
f Im
mig
rant
s to
Nativ
es R
atio
(∆I it
/ Po
p it-1
)
Samp
le: 8
5 M
S Re
gion
s fro
m 20
01-2
006
Notes
:Pan
elA
ofTa
ble
5di
splay
sthe
base
line
relat
ion
betw
een
chan
geso
fim
mig
ratio
nan
dth
eSw
issho
use
price
inde
x.Th
ede
pend
entv
ariab
leis
the
annu
alch
ange
inth
elo
garit
hmof
theh
ouse
price
inde
x,∆
p it,f
orsin
gle-
fam
ilyho
mes
(sfh)
.∆I it
/Pop
it-1
isth
ey/y
chan
gein
imm
igra
ntsr
elativ
eto
thep
opul
ation
inre
gion
iatt
imet
-1.
(∆I it
/Pop
it-1)hi
ghis
the
y/y
chan
gein
imm
igra
ntsi
nhi
ghin
com
ere
gion
s.∆u
it-1de
notes
the
chan
gein
unem
ploy
eddi
vide
dby
popu
latio
nre
gion
iand
time
t-1,∆
lny it-
1is
the
chan
gein
the
log
ofpe
rcap
itain
com
e,an
d∆
ν it-1
isth
ech
ange
inth
eho
me
vaca
ncy
rate.
InPa
nelB
the
first-
stage
relat
ion
isdi
splay
ed.T
hein
strum
ents
are
the
estim
ated
imm
igra
ntch
ange
s,ba
sed
onth
esett
lemen
tpatt
erns
ofim
mig
rant
sin
1997
,SP it,
and
(SP it)hi
ghre
spec
tively
.All
estim
ation
sinc
lude
fixed
effe
ctsby
year
and
cont
rolf
orre
gion
alef
fects
.Hete
rosk
edas
ticity
-robu
ststa
ndar
der
rors
inpa
rent
hese
s;clu
stere
dsta
ndar
der
rors
(by
regi
on)i
nbr
acke
ts;*
signi
fican
tat1
0%;*
*sig
nific
anta
t5%
;***
signi
fican
tat
1%.a
First
stage
regr
essio
nof(
SPit)
;bFi
rststa
gere
gres
sion
of(S
P it)high
.
27
28 29
95
100
105
110
115
120
125
Jan
00
Jul 0
0
Jan
01
Jul 0
1
Jan
02
Jul 0
2
Jan
03
Jul 0
3
Jan
04
Jul 0
4
Jan
05
Jul 0
5
Jan
06
W&P Rent Index
W&P Single-Family House Price Index
Source: Wüest and Partner, Zurich
Figure 1: Rent versus Home Prices (2000:1 to 2006:4)
28

Swiss National Bank Working Papers published since 2004: 2004-1 Samuel Reynard: Financial Market Participation and the Apparent Instability of
Money Demand 2004-2 Urs W. Birchler and Diana Hancock: What Does the Yield on Subordinated Bank Debt Measure? 2005-1 Hasan Bakhshi, Hashmat Khan and Barbara Rudolf: The Phillips curve under state-dependent pricing 2005-2 Andreas M. Fischer: On the Inadequacy of Newswire Reports for Empirical Research on Foreign Exchange Interventions 2006-1 Andreas M. Fischer: Measuring Income Elasticity for Swiss Money Demand: What do the Cantons say about Financial Innovation? 2006-2 Charlotte Christiansen and Angelo Ranaldo: Realized Bond-Stock Correlation:
Macroeconomic Announcement Effects 2006-3 Martin Brown and Christian Zehnder: Credit Reporting, Relationship Banking, and Loan Repayment 2006-4 Hansjörg Lehmann and Michael Manz: The Exposure of Swiss Banks to
Macroeconomic Shocks – an Empirical Investigation 2006-5 Katrin Assenmacher-Wesche and Stefan Gerlach: Money Growth, Output Gaps and
Inflation at Low and High Frequency: Spectral Estimates for Switzerland 2006-6 Marlene Amstad and Andreas M. Fischer: Time-Varying Pass-Through from Import
Prices to Consumer Prices: Evidence from an Event Study with Real-Time Data 2006-7 Samuel Reynard: Money and the Great Disinflation 2006-8 Urs W. Birchler and Matteo Facchinetti: Can bank supervisors rely on market data?
A critical assessment from a Swiss perspective 2006-9 Petra Gerlach-Kristen: A Two-Pillar Phillips Curve for Switzerland 2006-10 Kevin J. Fox and Mathias Zurlinden: On Understanding Sources of Growth and
Output Gaps for Switzerland 2006-11 Angelo Ranaldo: Intraday Market Dynamics Around Public Information Arrivals 2007-1 Andreas M. Fischer, Gulzina Isakova and Ulan Termechikov: Do FX traders in
Bishkek have similar perceptions to their London colleagues? Survey evidence of market practitioners’ views

2007-2 Ibrahim Chowdhury and Andreas Schabert: Federal Reserve Policy viewed through a Money Supply Lens
2007-3 Angelo Ranaldo: Segmentation and Time-of-Day Patterns in Foreign Exchange
Markets 2007-4 Jürg M. Blum: Why ‘Basel II’ May Need a Leverage Ratio Restriction 2007-5 Samuel Reynard: Maintaining Low Inflation: Money, Interest Rates, and Policy
Stance 2007-6 Rina Rosenblatt-Wisch: Loss Aversion in Aggregate Macroeconomic Time Series 2007-7 Martin Brown, Maria Rueda Maurer, Tamara Pak and Nurlanbek Tynaev: Banking
Sector Reform and Interest Rates in Transition Economies: Bank-Level Evidence from Kyrgyzstan
2007-8 Hans-Jürg Büttler: An Orthogonal Polynomial Approach to Estimate the Term
Structure of Interest Rates 2007-9 Raphael Auer: The Colonial Origins Of Comparative Development: Comment.
A Solution to the Settler Mortality Debate
2007-10 Franziska Bignasca and Enzo Rossi: Applying the Hirose-Kamada filter to Swiss data: Output gap and exchange rate pass-through estimates
2007-11 Angelo Ranaldo and Enzo Rossi: The reaction of asset markets to Swiss National
Bank communication 2007-12 Lukas Burkhard and Andreas M. Fischer: Communicating Policy Options at the Zero
Bound 2007-13 Katrin Assenmacher-Wesche, Stefan Gerlach, and Toshitaka Sekine: Monetary
Factors and Inflation in Japan 2007-14 Jean-Marc Natal and Nicolas Stoffels: Globalization, markups and the natural rate
of interest 2007-15 Martin Brown, Tullio Jappelli and Marco Pagano: Information Sharing and Credit:
Firm-Level Evidence from Transition Countries 2007-16 Andreas M. Fischer, Matthias Lutz and Manuel Wälti: Who Prices Locally? Survey
Evidence of Swiss Exporters 2007-17 Angelo Ranaldo and Paul Söderlind: Safe Haven Currencies

2008-1 Martin Brown and Christian Zehnder: The Emergence of Information Sharing in Credit Markets
2008-2 Yvan Lengwiler and Carlos Lenz: Intelligible Factors for the Yield Curve 2008-3 Katrin Assenmacher-Wesche and M. Hashem Pesaran: Forecasting the Swiss
Economy Using VECX* Models: An Exercise in Forecast Combination Across Models and Observation Windows
2008-4 Maria Clara Rueda Maurer: Foreign bank entry, institutional development and
credit access: firm-level evidence from 22 transition countries 2008-5 Marlene Amstad and Andreas M. Fischer: Are Weekly Inflation Forecasts
Informative? 2008-6 Raphael Auer and Thomas Chaney: Cost Pass Through in a Competitive Model of
Pricing-to-Market 2008-7 Martin Brown, Armin Falk and Ernst Fehr: Competition and Relational Contracts:
The Role of Unemployment as a Disciplinary Device 2008-8 Raphael Auer: The Colonial and Geographic Origins of Comparative Development 2008-9 Andreas M. Fischer and Angelo Ranaldo: Does FOMC News Increase Global FX
Trading? 2008-10 Charlotte Christiansen and Angelo Ranaldo: Extreme Coexceedances in New EU
Member States’ Stock Markets
2008-11 Barbara Rudolf and Mathias Zurlinden: Measuring capital stocks and capital services in Switzerland
2008-12 Philip Sauré: How to Use Industrial Policy to Sustain Trade Agreements 2008-13 Thomas Bolli and Mathias Zurlinden: Measuring growth of labour quality and the
quality-adjusted unemployment rate in Switzerland 2008-14 Samuel Reynard: What Drives the Swiss Franc? 2008-15 Daniel Kaufmann: Price-Setting Behaviour in Switzerland – Evidence from CPI
Micro Data
2008-16 Katrin Assenmacher-Wesche and Stefan Gerlach: Financial Structure and the Impact of Monetary Policy on Asset Prices
2008-17 Ernst Fehr, Martin Brown and Christian Zehnder: On Reputation: A
Microfoundation of Contract Enforcement and Price Rigidity

2008-18 Raphael Auer and Andreas M. Fischer: The Effect of Low-Wage Import Competition on U.S. Inflationary Pressure
2008-19 Christian Beer, Steven Ongena and Marcel Peter: Borrowing in Foreign Currency:
Austrian Households as Carry Traders
2009-1 Thomas Bolli and Mathias Zurlinden: Measurement of labor quality growth caused by unobservable characteristics
2009-2 Martin Brown, Steven Ongena and Pinar Ye,sin: Foreign Currency Borrowing by
Small Firms 2009-3 Matteo Bonato, Massimiliano Caporin and Angelo Ranaldo: Forecasting realized
(co)variances with a block structure Wishart autoregressive model 2009-4 Paul Söderlind: Inflation Risk Premia and Survey Evidence on Macroeconomic
Uncertainty 2009-5 Christian Hott: Explaining House Price Fluctuations 2009-6 Sarah M. Lein and Eva Köberl: Capacity Utilisation, Constraints and Price
Adjustments under the Microscope 2009-7 Philipp Haene and Andy Sturm: Optimal Central Counterparty Risk Management 2009-8 Christian Hott: Banks and Real Estate Prices 2009-9 Terhi Jokipii and Alistair Milne: Bank Capital Buffer and Risk
Adjustment Decisions
2009-10 Philip Sauré: Bounded Love of Variety and Patterns of Trade 2009-11 Nicole Allenspach: Banking and Transparency: Is More Information
Always Better?
2009-12 Philip Sauré and Hosny Zoabi: Effects of Trade on Female Labor Force Participation 2009-13 Barbara Rudolf and Mathias Zurlinden: Productivity and economic growth in
Switzerland 1991-2005 2009-14 Sébastien Kraenzlin and Martin Schlegel: Bidding Behavior in the SNB's Repo
Auctions 2009-15 Martin Schlegel and Sébastien Kraenzlin: Demand for Reserves and the Central
Bank's Management of Interest Rates 2009-16 Carlos Lenz and Marcel Savioz: Monetary determinants of the Swiss franc

2010-1 Charlotte Christiansen, Angelo Ranaldo and Paul Söderlind: The Time-Varying Systematic Risk of Carry Trade Strategies
2010-2 Daniel Kaufmann: The Timing of Price Changes and the Role of Heterogeneity 2010-3 Loriano Mancini, Angelo Ranaldo and Jan Wrampelmeyer: Liquidity in the Foreign
Exchange Market: Measurement, Commonality, and Risk Premiums 2010-4 Samuel Reynard and Andreas Schabert: Modeling Monetary Policy 2010-5 Pierre Monnin and Terhi Jokipii: The Impact of Banking Sector Stability on the
Real Economy 2010-6 Sébastien Kraenzlin and Thomas Nellen: Daytime is money 2010-7 Philip Sauré: Overreporting Oil Reserves 2010-8 Elizabeth Steiner: Estimating a stock-flow model for the Swiss housing market 2010-9 Martin Brown, Steven Ongena, Alexander Popov, and Pinar Ye,sin: Who Needs
Credit and Who Gets Credit in Eastern Europe? 2010-10 Jean-Pierre Danthine and André Kurmann: The Business Cycle Implications of
Reciprocity in Labor Relations 2010-11 Thomas Nitschka: Momentum in stock market returns: Implications for risk premia
on foreign currencies 2010-12 Petra Gerlach-Kristen and Barbara Rudolf: Macroeconomic and interest rate
volatility under alternative monetary operating procedures 2010-13 Raphael Auer: Consumer Heterogeneity and the Impact of Trade Liberalization:
How Representative is the Representative Agent Framework? 2010-14 Tommaso Mancini Griffoli and Angelo Ranaldo: Limits to arbitrage during the
crisis: funding liquidity constraints and covered interest parity 2010-15 Jean-Marc Natal: Monetary Policy Response to Oil Price Shocks 2010-16 Kathrin Degen and Andreas M. Fischer: Immigration and Swiss House Prices

Swiss National Bank Working Papers are also available at www.snb.ch, section Publications/ResearchSubscriptions or individual issues can be ordered at Swiss National Bank, Fraumünsterstrasse 8, CH-8022 Zurich, fax +41 44 631 81 14, E-mail [email protected]