switching from imatinib to 2g tki : when & how...
TRANSCRIPT

Switching from Imatinib to 2G TKI : When & how ?
Giuseppe Sagl io , MD Univers i ty o f Tur in Tur in , I ta ly

Parameters to evaluate response to imatinib
• Degree of leukemic burden reduction
• Time to achieve it
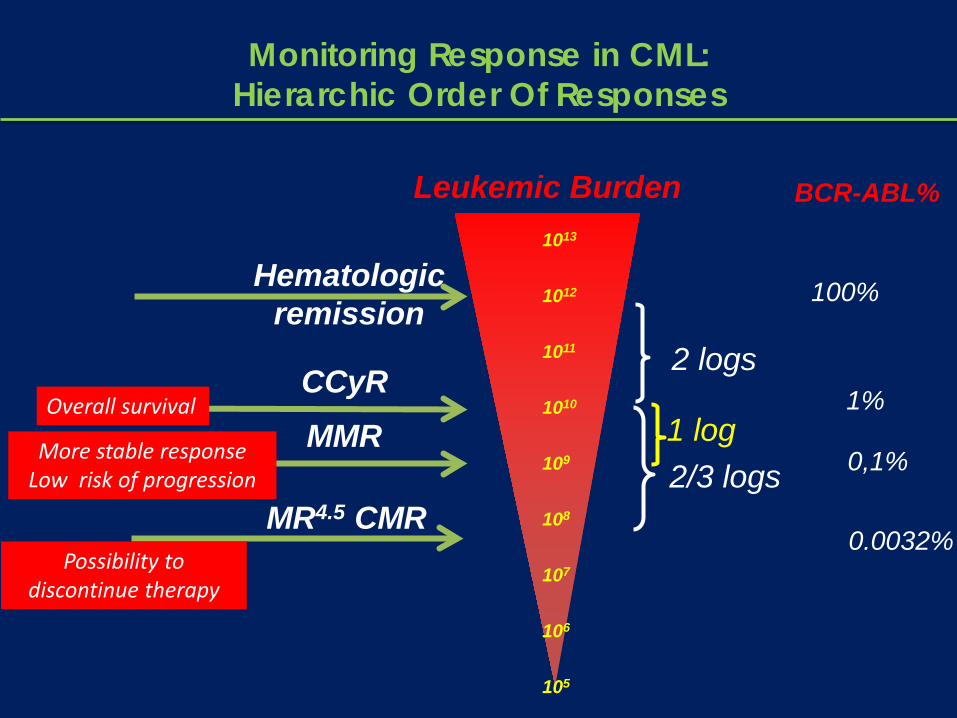
Hematologic remission
CCyR
Leukemic Burden
2 logs
2/3 logs
1013
1012
1011
1010
109
108
107
106
105
MR4.5 CMR
1 log MMR
Monitoring Response in CML: Hierarchic Order Of Responses
Overall survival
More stable response Low risk of progression
Possibility to discontinue therapy
BCR-ABL% 1%
0.0032%
0,1%
100%

Optimal Response to imatinib 400 mg per day
CHR within 3 months With at least minor CyR
PCyR at 6 months
CCyR at 12 months
MMR at 18 months
ELN reccomendations 2009; Baccarani et al. JCO 2009
U n t i l t h e a c h i e v e m e n t o f M M R ( “ s a f e h a ve n ” ) a l s o a p a t i e n t w i t h a n o p t i m a l r e s p o n s e c a n p r o g r e s s , b u t t h e r i s k i s v e r y l o w.
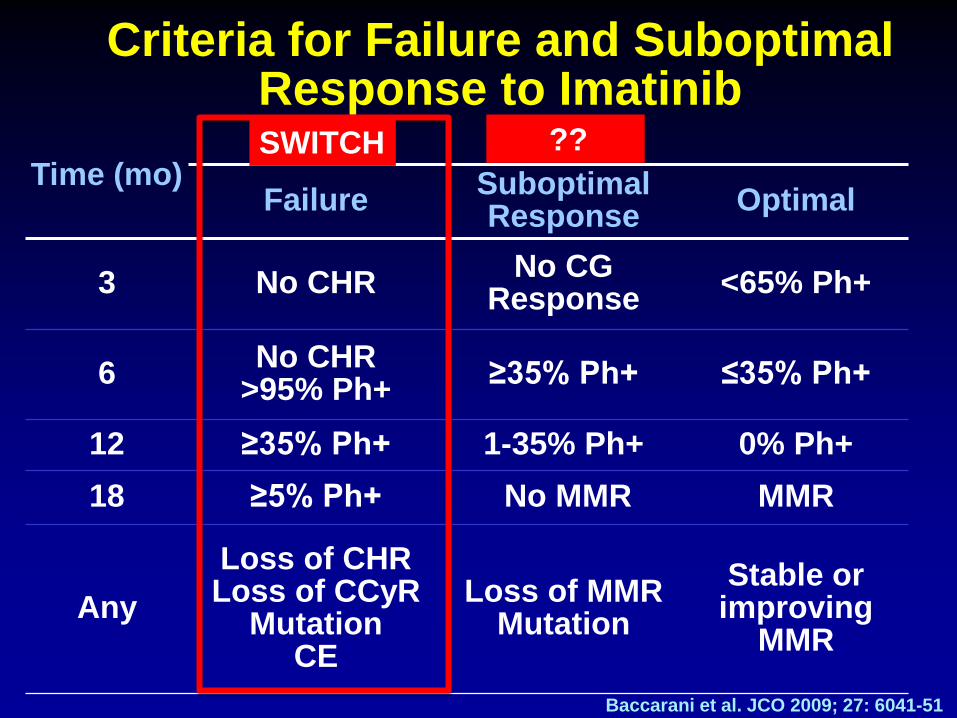
Criteria for Failure and Suboptimal Response to Imatinib
Time (mo) Failure Suboptimal
Response Optimal
3 No CHR No CG Response <65% Ph+
6 No CHR >95% Ph+ ≥35% Ph+ ≤35% Ph+
12 ≥35% Ph+ 1-35% Ph+ 0% Ph+ 18 ≥5% Ph+ No MMR MMR
Any Loss of CHR Loss of CCyR
Mutation CE
Loss of MMR Mutation
Stable or improving
MMR
Baccarani et al. JCO 2009; 27: 6041-51
SWITCH ??
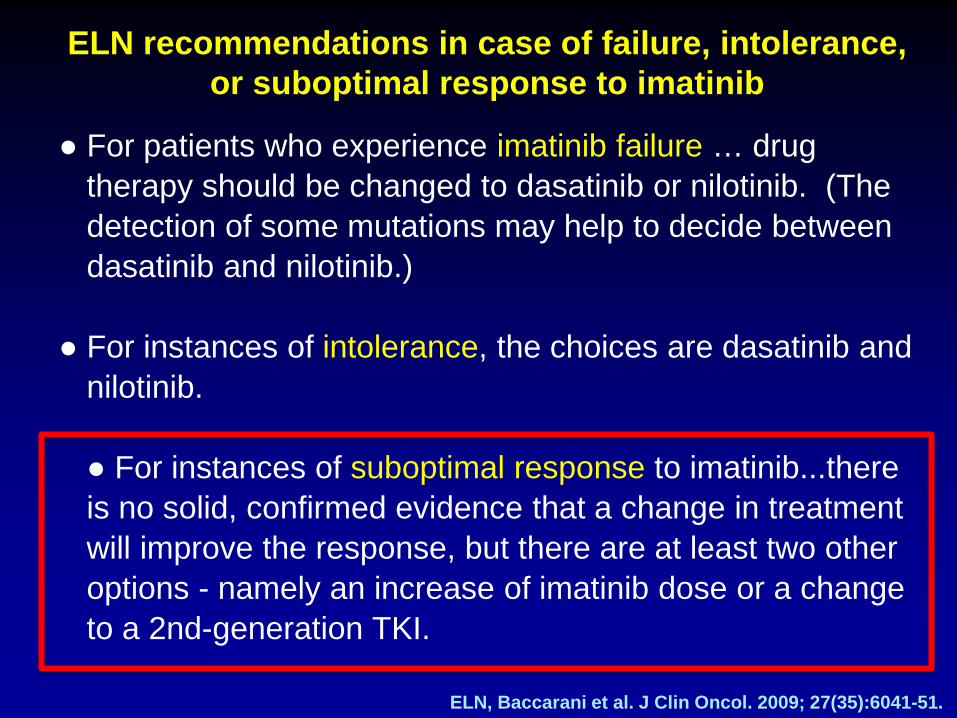
● For patients who experience imatinib failure … drug therapy should be changed to dasatinib or nilotinib. (The detection of some mutations may help to decide between dasatinib and nilotinib.)
● For instances of intolerance, the choices are dasatinib and
nilotinib. ● For instances of suboptimal response to imatinib...there is no solid, confirmed evidence that a change in treatment will improve the response, but there are at least two other options - namely an increase of imatinib dose or a change to a 2nd-generation TKI.
ELN recommendations in case of failure, intolerance, or suboptimal response to imatinib
ELN, Baccarani et al. J Clin Oncol. 2009; 27(35):6041-51.
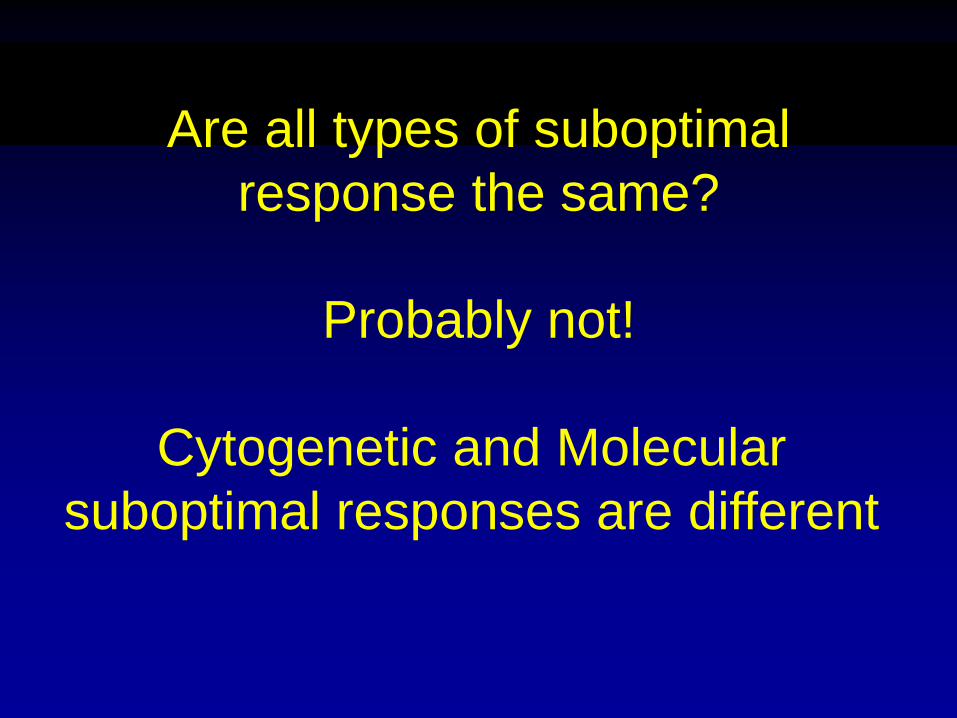
Are all types of suboptimal response the same?
Probably not!
Cytogenetic and Molecular suboptimal responses are different

Cytogenetic Criteria for Suboptimal Responses to Imatinib 400 mg per day
Time (mo) Response
Failure Suboptimal Optimal
3 No CHR No CG Response <65% Ph+
6 No CHR >95% Ph+ ≥35% Ph+ ≤35% Ph+
12 ≥35% Ph+ 1-35% Ph+ 0% Ph+ 18 ≥5% Ph+ No MMR MMR
Any Loss of CHR
Loss of CCgR Mutation
CE
Loss of MMR Mutation
Stable or improving
MMR
Baccarani et al. JCO 2009; 27: 6041-51
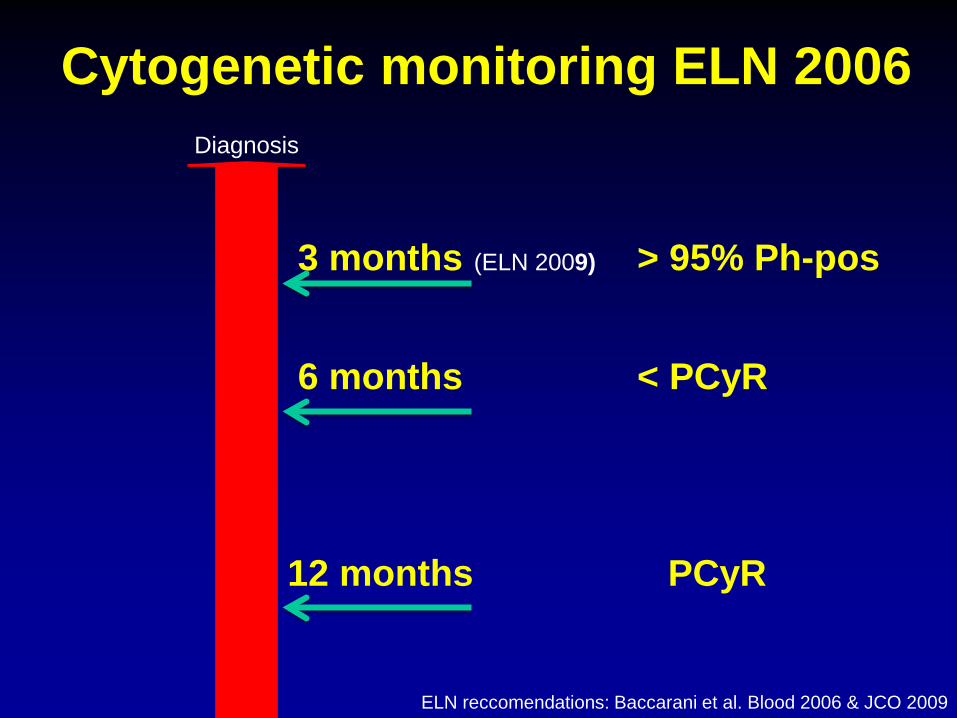
Cytogenetic monitoring ELN 2006
3 months (ELN 2009)
6 months
12 months
ELN reccomendations: Baccarani et al. Blood 2006 & JCO 2009
Diagnosis
> 95% Ph-pos
< PCyR
PCyR
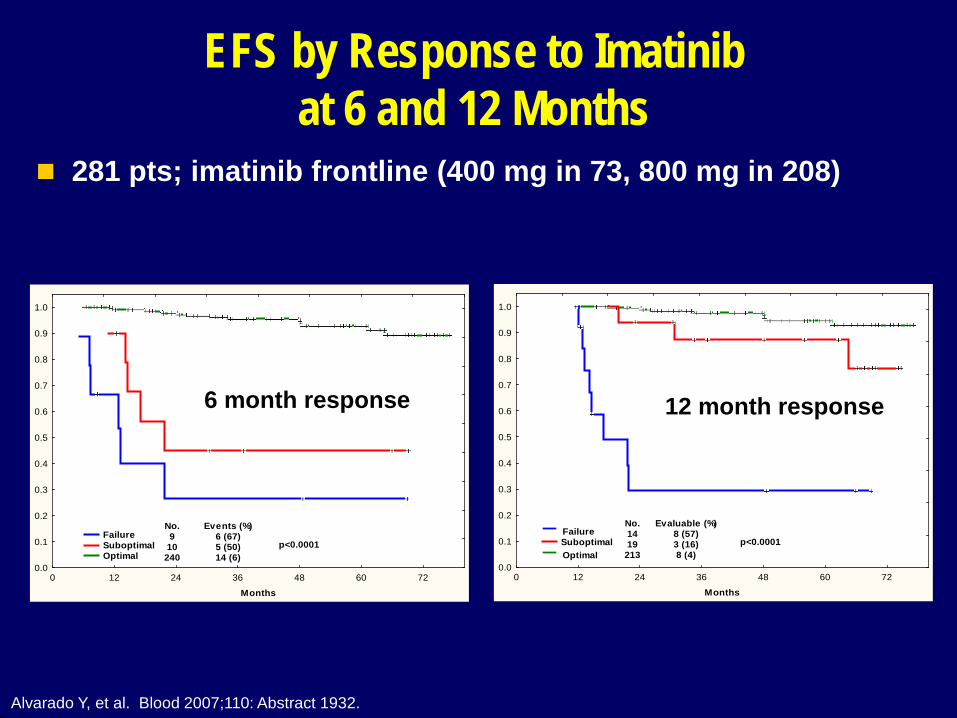
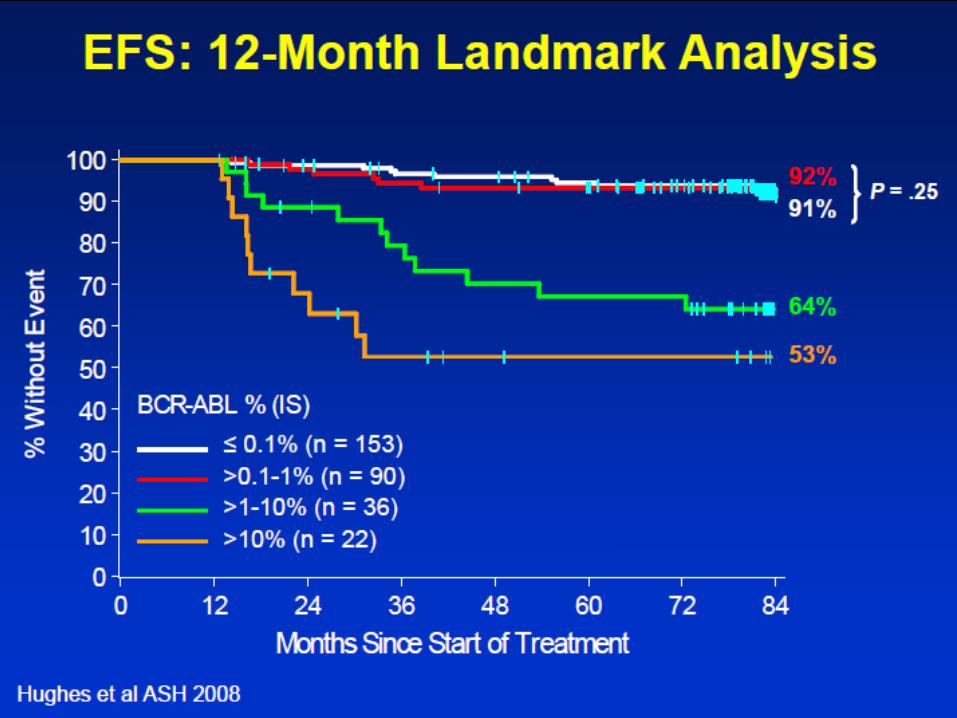
EFS by Response to Imatinib at 6 and 12 Months
0 12 24 36 48 60 72
Months
0.0
0.1
0.2
0.3
0.4
0.5
0.6
0.7
0.8
0.9
1.0
Failure Suboptimal Optimal
p<0.0001
No.9
10240
Events (%)6 (67)5 (50)14 (6)
0 12 24 36 48 60 72
Months
0.0
0.1
0.2
0.3
0.4
0.5
0.6
0.7
0.8
0.9
1.0
Failure Suboptimal Optimal
p<0.0001
No.1419
213
Evaluable (%)8 (57)3 (16)8 (4)
6 month response 12 month response
Alvarado Y, et al. Blood 2007;110: Abstract 1932.
281 pts; imatinib frontline (400 mg in 73, 800 mg in 208)

Subopt. Resp.
N
% EFS
%
CCyR
%
MMR
6 mos No Yes
341 20
90 60
98 60
93 50
12 mos No Yes
323 31
94 68
100 81
96 68
Castagnetti. Hematologica 2009;94 abstract 0528
Suboptimal Response to Imatinib in CP CML (GIMEMA; n = 423)
423 newly Dx pts Rx with IM 400 mg/D; median FU 41 mos

Definition of Failure and Suboptimal Response
(ELN Recommendations, Baccarani et al., JCO 2009)
Time Failure Subopt Resp Warnings
Diagnosis - - High risk
ACA in Ph+ cells
3 mos No CHR No CyR
6 mos No CyR < PCyR
12 mos No PCyR < CCyR < MMR
18 mos < CCyR < MMR
Anytime
Loss of CHR Loss of CCyR
ACA in Ph+ cells Mutations (IM-
insensit.)
Loss of MMR Mutations (IM-
sensit.)
Any BCR-ABL transcript level
OCA in Ph- cells
??

Which is the best way to react in suboptimal responders?
• Increasing Imatinib dosage?
• Switching directly to 2° gen TKIs?
Few data at the moment
for “suboptimal responders” only!

Study Design: Phase III, randomized, open label Primary Endpoint: The rate of CCyR after 6 months on study
Enrollment: On hold, will restart in March 2010, 56/188 (LATAM, Europe and EGM)
FPFV: 22-Jun-2010
Number of sites: 56/63 sites opened
LASOR (2404): Study design
56/188, 1:1 Randomization
CML-CP No CyR after 3 months of Glivec
<PCyR after 6 months of Glivec
<CCyR after 12 months of Glivec
R A N D O M I Z E Imatinib 600 mg QD
Nilotinib 400 mg BID Cross-over allowed for
intolerance or when <CCyR after
6 months
ClinicalTrials.gov Identifier: NCT00802841
Latin America, Europe, EGM; PI - Cortes, le Coutre

Consideration
• If the results are so good with second generation TKIs for all patients from the beginning, why to deny at least an early switch to those who do not have an optimal response to imatinib?
Is it important to achieve MMR in addition to CCyR?
No CCyR<3 log reduction>=3 log reduction%
with
out p
rogr
essio
n
0102030405060708090
100
Months since randomization0 3 6 9 12 15 18 21 24 27 30 33 36 39 42 45 48 51
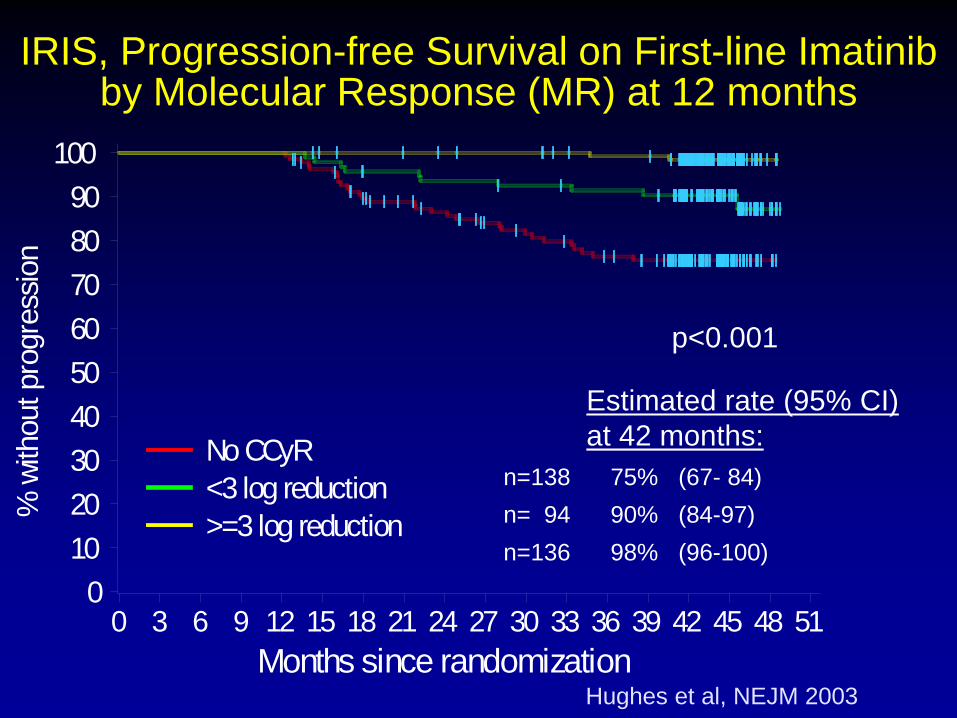
IRIS, Progression-free Survival on First-line Imatinib by Molecular Response (MR) at 12 months
p<0.001
n=138 75% (67- 84) n= 94 90% (84-97) n=136 98% (96-100)
Estimated rate (95% CI) at 42 months:
Hughes et al, NEJM 2003


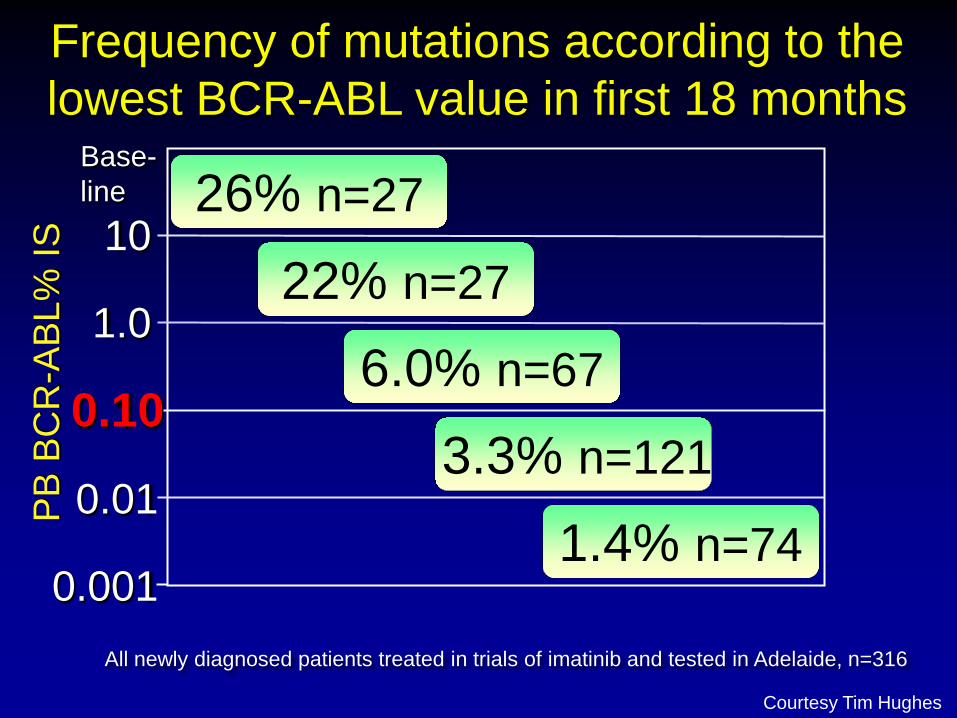
1.4% n=74
26% n=27
3.3% n=121
22% n=27
6.0% n=67 0.10
1.0
0.01
10
Base-line
PB B
CR
-ABL
% IS
0.001
Frequency of mutations according to the lowest BCR-ABL value in first 18 months
All newly diagnosed patients treated in trials of imatinib and tested in Adelaide, n=316
Courtesy Tim Hughes
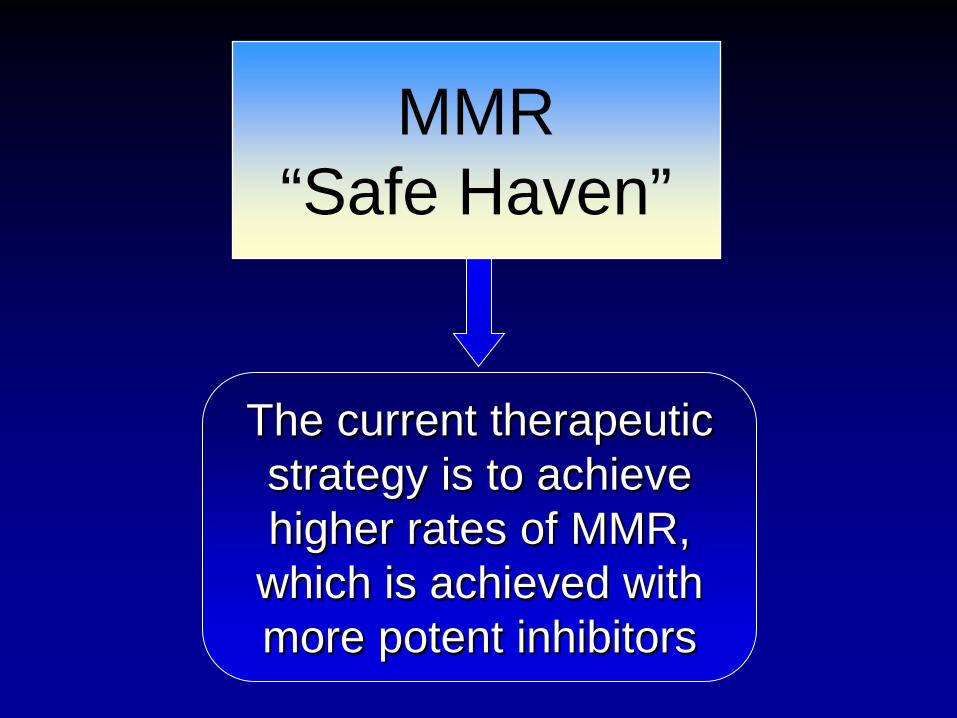
The current therapeutic strategy is to achieve higher rates of MMR, which is achieved with more potent inhibitors
MMR
“Safe Haven”
37% 69% 93% 47%
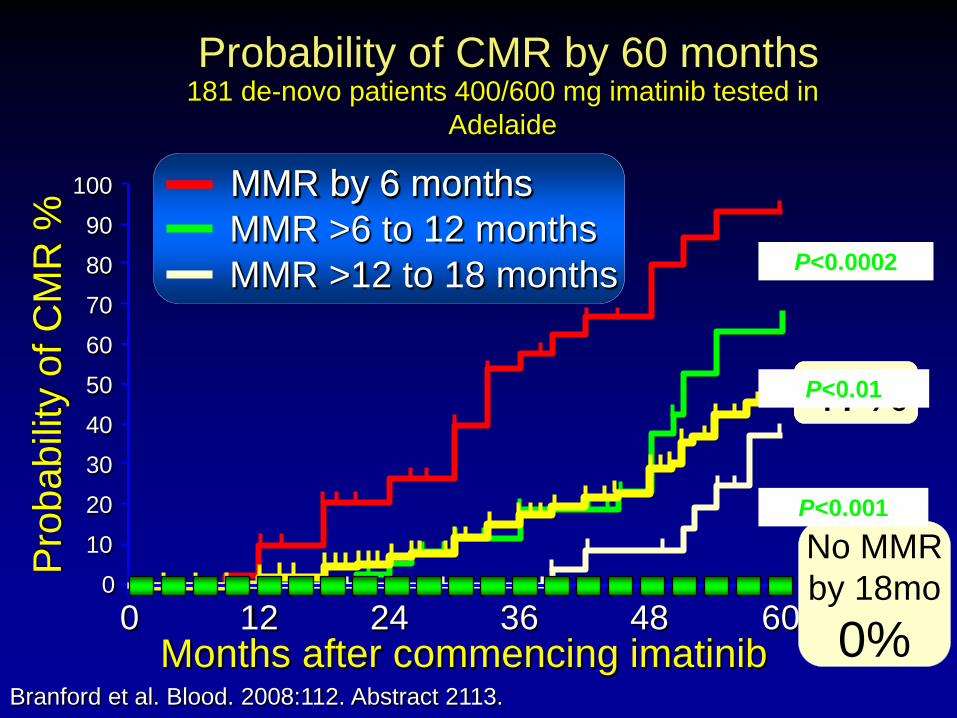
181 de-novo patients 400/600 mg imatinib tested in Adelaide
Months after commencing imatinib
Pro
babi
lity
of C
MR
%
10
0 12 24 0 36 60
Probability of CMR by 60 months
48
50
60
70
80
90
100
20
30
40
MMR by 6 months
MMR >12 to 18 months MMR >6 to 12 months
No MMR by 18mo
0% Branford et al. Blood. 2008:112. Abstract 2113.
MMR by 6 months
P<0.0002
P<0.01
P<0.001
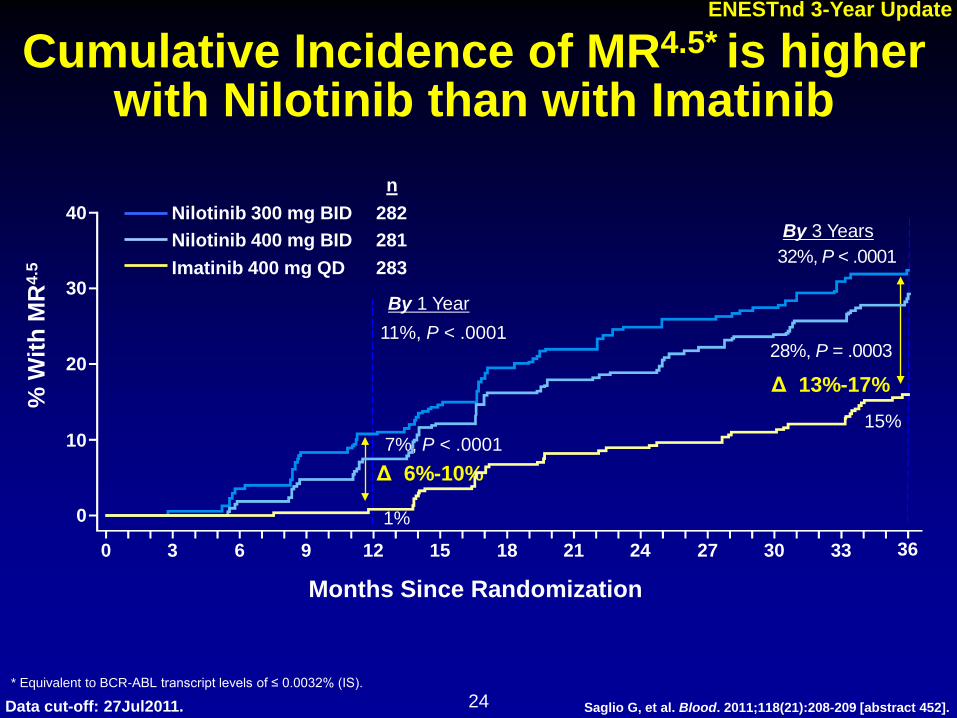
Cumulative Incidence of MR4.5* is higher with Nilotinib than with Imatinib
Nilotinib 300 mg BID Nilotinib 400 mg BID Imatinib 400 mg QD
282 281 283
n
* Equivalent to BCR-ABL transcript levels of ≤ 0.0032% (IS).
% W
ith M
R4.
5
40
30
20
10
0
0 3 6 9 12 15 18 21 24 27 30 33
11%, P < .0001
7%, P < .0001
1%
By 1 Year
Δ 6%-10%
36
32%, P < .0001
28%, P = .0003
15%
By 3 Years
Δ 13%-17%
Months Since Randomization
24 Data cut-off: 27Jul2011.
ENESTnd 3-Year Update
Saglio G, et al. Blood. 2011;118(21):208-209 [abstract 452].
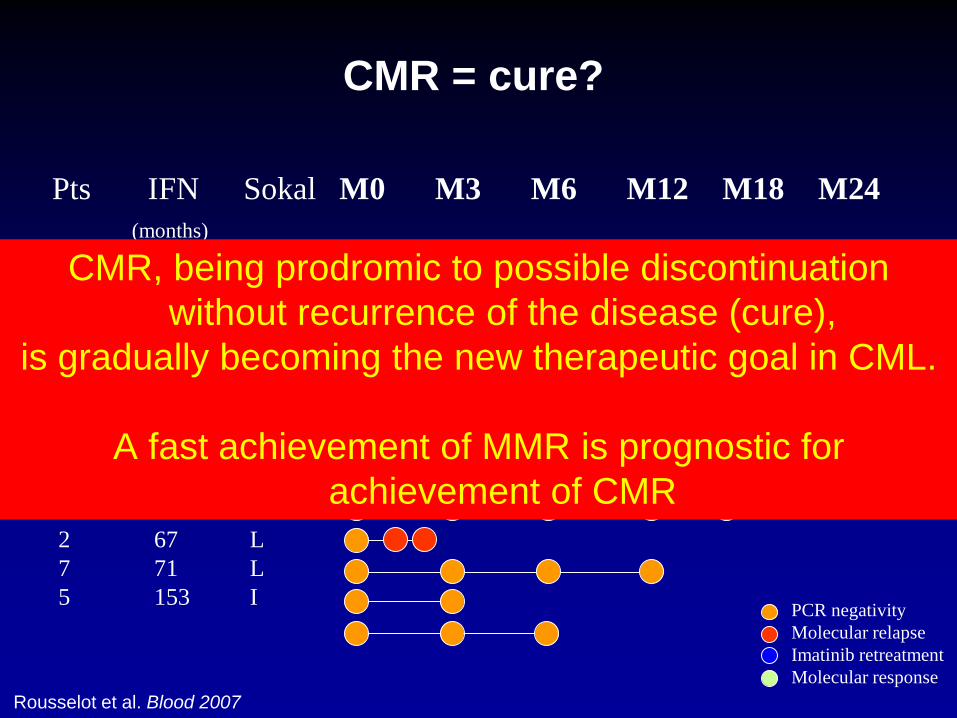
Pts IFN Sokal M0 M3 M6 M12 M18 M24 (months)
1 0 L 4 0 L 8 9 H 11 29 I 10 29 I 12 29 I 3 32 I 6 33 L 9 63 2 67 L 7 71 L 5 153 I PCR negativity
Molecular relapse Imatinib retreatment Molecular response
Rousselot et al. Blood 2007
CMR = cure?
CMR, being prodromic to possible discontinuation without recurrence of the disease (cure),
is gradually becoming the new therapeutic goal in CML.
A fast achievement of MMR is prognostic for achievement of CMR

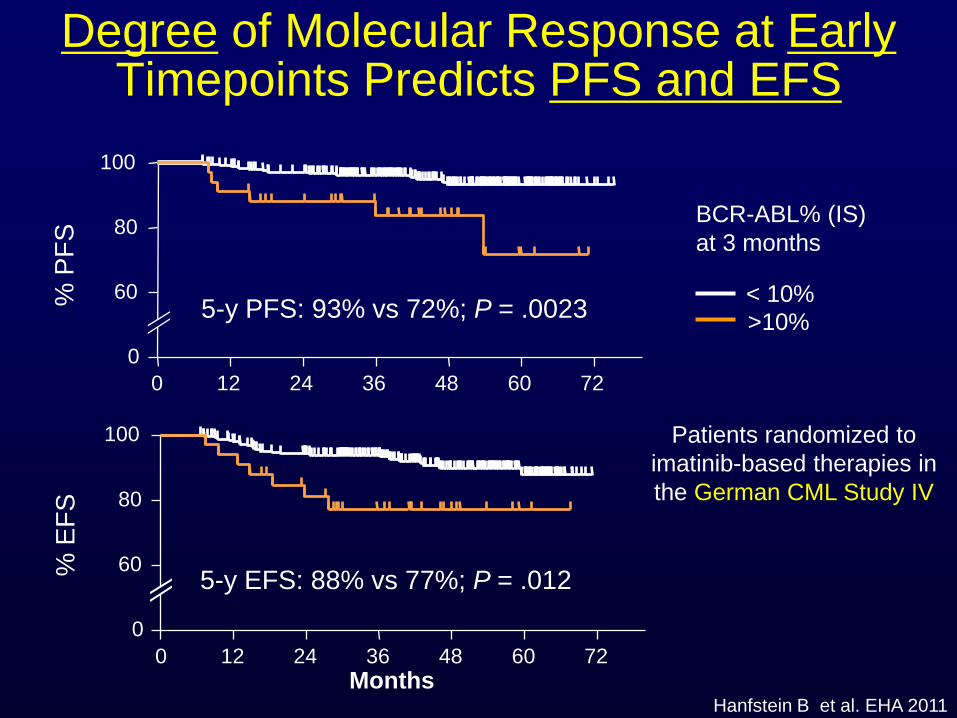
Is it important to achieve a fast response?
% P
FS
0 12 24 36 48 60 72 0
60
80
100
% E
FS
Months 0 12 24 36 48 60 72
0
60
80
100
Hanfstein B et al. EHA 2011
5-y PFS: 93% vs 72%; P = .0023
5-y EFS: 88% vs 77%; P = .012
< 10% >10%
BCR-ABL% (IS) at 3 months
Patients randomized to imatinib-based therapies in the German CML Study IV
Degree of Molecular Response at Early Timepoints Predicts PFS and EFS
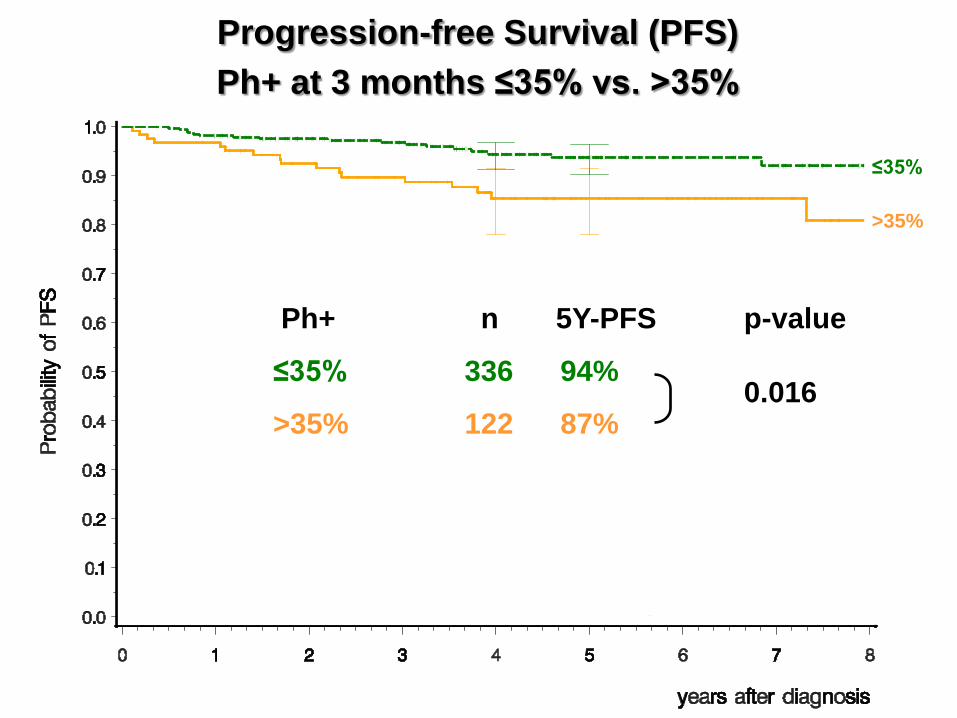
>35%
≤35%
Ph+ n 5Y-PFS
≤35% 336 94%
>35% 122 87% 0.016
p-value
Progression-free Survival (PFS) Ph+ at 3 months ≤35% vs. >35%

Ph+ n 5Y-OS
≤35% 336 95%
>35% 124 87% 0.036
p-value
>35%
≤35%
Overall Survival (OS) Ph+ at 3 months ≤35% vs. >35%
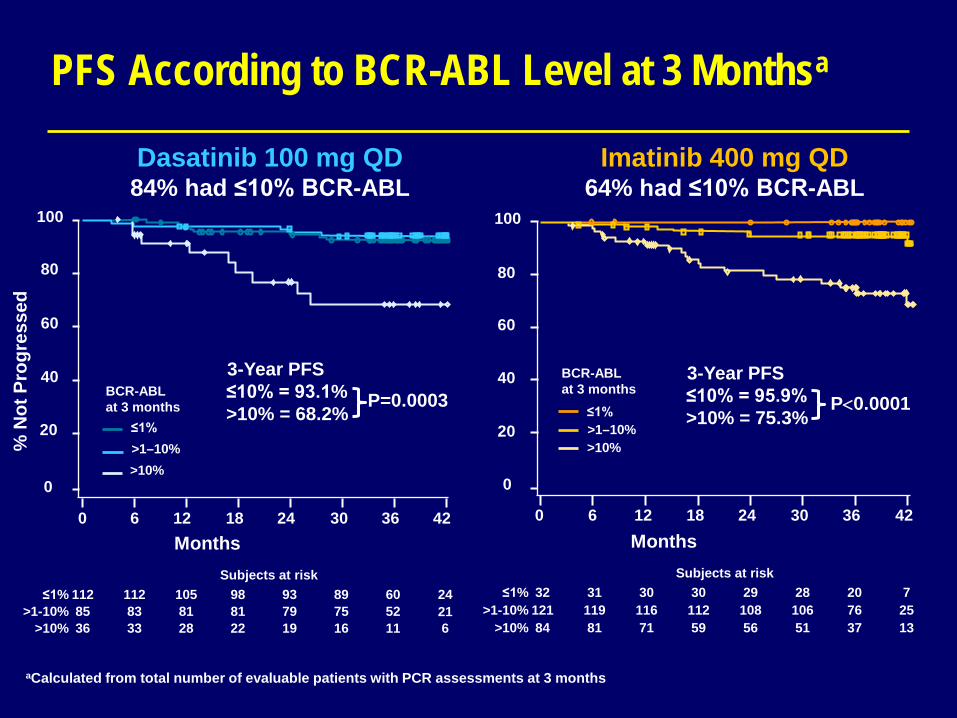
PFS According to BCR-ABL Level at 3 Monthsa
Imatinib 400 mg QD 64% had ≤10% BCR-ABL
Dasatinib 100 mg QD 84% had ≤10% BCR-ABL
aCalculated from total number of evaluable patients with PCR assessments at 3 months
≤1% >1–10% >10%
BCR-ABL at 3 months
0
20
40
60
80
100
0 6 12 18 24 30 36 42
% N
ot P
rogr
esse
d
0
20
40
60
80
100
0 6 12 18 24 30 36 42 Months
≤1% >1–10% >10%
BCR-ABL at 3 months
≤1% 112 112 105 98 93 89 60 24 >1-10% 85 83 81 81 79 75 52 21
>10% 36 33 28 22 19 16 11 6
Subjects at risk ≤1% 32 31 30 30 29 28 20 7
>1-10% 121 119 116 112 108 106 76 25 >10% 84 81 71 59 56 51 37 13
Subjects at risk
Months
3-Year PFS ≤10% = 93.1% >10% = 68.2%
P=0.0003 3-Year PFS
≤10% = 95.9% >10% = 75.3%
P<0.0001

OS According to BCR-ABL Level at 3 Monthsa Imatinib 400 mg QD
64% had ≤10% BCR-ABL Dasatinib 100 mg QD
84% had ≤10% BCR-ABL
≤1% 112 112 110 109 106 104 85 29 >1-10% 86 85 84 83 83 79 66 25
>10% 37 37 35 34 33 27 22 9
≤1% 32 32 32 32 31 30 28 11 >1-10% 122 121 120 118 118 116 96 33
>10% 85 85 82 80 76 70 55 20
Subjects at risk
0
20
40
60
80
100
0 6 12 18 24 30 36 42
% A
live
Months
≤1% >1–10% >10%
BCR-ABL at 3 months
Subjects at risk
3-year OS: ≤10% = 95.9% >10% = 85.9%
P=0.0348
0
20
40
60
80
100
0 6 12 18 24 30 36 42 Months
≤1% >1–10% >10%
BCR-ABL at 3 months
3-year OS: ≤10% = 96.0% >10% = 88.0%
P=0.0036
aCalculated from total number of evaluable patients with PCR assessments at 3 months
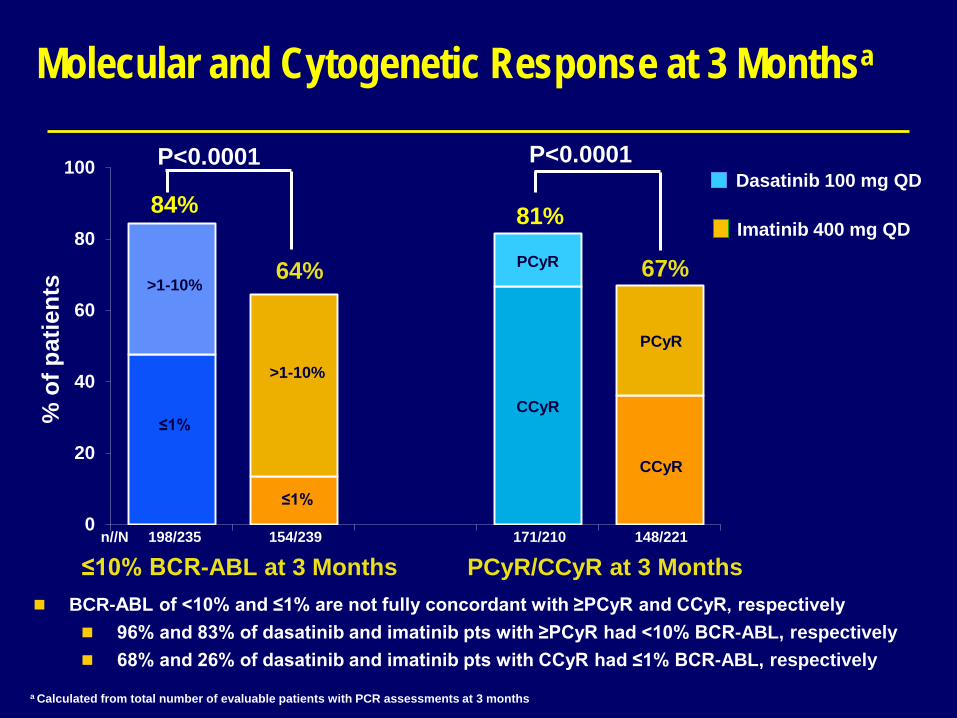
Molecular and Cytogenetic Response at 3 Monthsa
0
20
40
60
80
100
84%
64%
% o
f pat
ient
s
≤10% BCR-ABL at 3 Months n//N 198/235 154/239 171/210 148/221
a Calculated from total number of evaluable patients with PCR assessments at 3 months
>1-10%
≤1%
>1-10%
≤1%
P<0.0001
CCyR
CCyR
PCyR
PCyR
PCyR/CCyR at 3 Months
81%
67%
P<0.0001
Dasatinib 100 mg QD
Imatinib 400 mg QD
BCR-ABL of <10% and ≤1% are not fully concordant with ≥PCyR and CCyR, respectively 96% and 83% of dasatinib and imatinib pts with ≥PCyR had <10% BCR-ABL, respectively 68% and 26% of dasatinib and imatinib pts with CCyR had ≤1% BCR-ABL, respectively

Nilotinib 300 mg BID Imatinib 400 mg QD
BCR-ABL at
3 months ≤ 1%
N=145 >1– ≤10%
N=89 >10% N=24
≤ 1% N=43
>1– ≤10% N=133
>10% N=88
MMR n=120 n=89 n=24 n=41 n=133 n=88
by 1 year (%) 76 40 4 71 31 2
by 2 years (%) 89 67 29 78 52 20
CMR4.5 n=144 n=89 n=24 n=43 n=133 n=88
by 2 years (%) 40 12 4 33 8 0
by 3 years (%) 50 18 4 53 14 1
ENESTnd: 3-Month Landmark Analyses (Hochhaus A. et al. EHA 2012)
Evaluable patients (n) excluded patients with unevaluable/missing PCR assessments at 3 months, atypical transcripts at baseline, or patients who achieved response within 3 months
The response kinetics can tell us something


? ELN 2013 ?
3 months
6 months
12 months
Diagnosis Responders Non responders
< PCyR or <10% BCR-ABL
<CCyR or <1% BCR-ABL
MMR / < 0,1% BCR-ABL
> PCyR or >10% BCR-ABL
>CCyR or >1% BCR-ABL
MMR / > 0,1% BCR-ABL

Thank you!