swot analysis in challenging times - danske bank
TRANSCRIPT

SWOT analysis in challenging times
Carnegie Large Cap Seminar 2008
Tonny Thierry Andersen CFO & Member of the Executive Board22 September 2008

2
11m positive liquidity
Funding of Danish mortgages
Excess capital
Resilient income
Cost under control
Higher lending margins
Lower relative funding costs
Organic growth opportunities
Higher funding costs
Wholesale
Retail
Low economic growth
Increasing credit losses
International financial turmoil
Protracted recession
Breakdown of banking infrastructure
3
Something rotten in the state ofDenmark?

4
GDP growth (%) Budget balance (% of GDP) Gross pub. debt (% of GDP) Unemp. rate (%)
1.0 4.5 21.6 1.8
2.6 *5.3 *35.4 6.3
2.1 2.4 37.4 6.2
3.3 *19.3 **48.9 2.6
1.4 **-0.6 *66.6 7.3
= lower than EU average = higher than EU average
* Figures from 2007. ** Figures from 2006.
Low growth, but a very healthy economy
S

5
-4
-2
0
2
4
6Fi
nlan
d
EK
Sw
eden
Spa
in
Irel
and
Bel
gium E
U
Ital
y
Fran
ce
Uni
ted
Kin
gdom
Uni
ted
Sta
tes
Source: OECD.
General government budget balance (% of GDP, 2007)
Significant fiscal elbow room
S

6
35%
40%
>60%
Is disposable income useful in analysing consumer leverage?
Welfare system or not�
W

7
Gross saving (% of GDP, 2006)
High level of national savings
14
15
25
S

8
0 20 40 60 80 100 120 140
Denmark
Netherlands
Switzerland
Canada
United Kingdom
Finland
Australia
Portugal
Spain
Norway
Japan
Austria
% of GDP
Source: OECD, Economic survey of Denmark.
Private pension assets reduce the need for real property equity
S

9
>3-month arrears (%)
0.0
0.2
0.4
0.6
0.8
1.0
1.2
1.4
2001 2002 2003 2004 2005 2006 2007
Source: Council of Mortgage Lenders and Danske Bank.
This quality gap is not new�
Danske Bank�s Mortgage Finance division
S

10
0
4
8
12
16
1980 1984 1988 1992 1996 2000 2004 2008
0
500
1.000
1.500
2.000
Unemployment is a leading indicator to look for
No.
Source: Danske Research.
<=Unemployment
Foreclosures =>
<= 10-year yield
S
Foreclosures, unemployment and 10-year yield
Source: Danske Research
%
,
,
,

11
Size (� bn) 258 111 10 app. 4,000 1,600
30-year fixed rate Yes No No No No
Maturity match 100% < 100% < 100% < 100% < 100%
Pricing risk No Yes Yes Yes Yes
LTV max Yes Yes Yes No No
Originate/Distribute No No No Yes Yes
Use of brokers No No No Yes Yes
Infrastructure and governancemodel are proven pillars of the Danish mortgage system
Mortgage market characteristics
S
12
-100
0
100
200
300
1 w
eek
2 w
eeks
3 w
eeks
1 m
onth
2 m
onths
3 m
onths
4 m
onths
5 m
onths
6 m
onths
9 m
onths
12
months
DKr bn
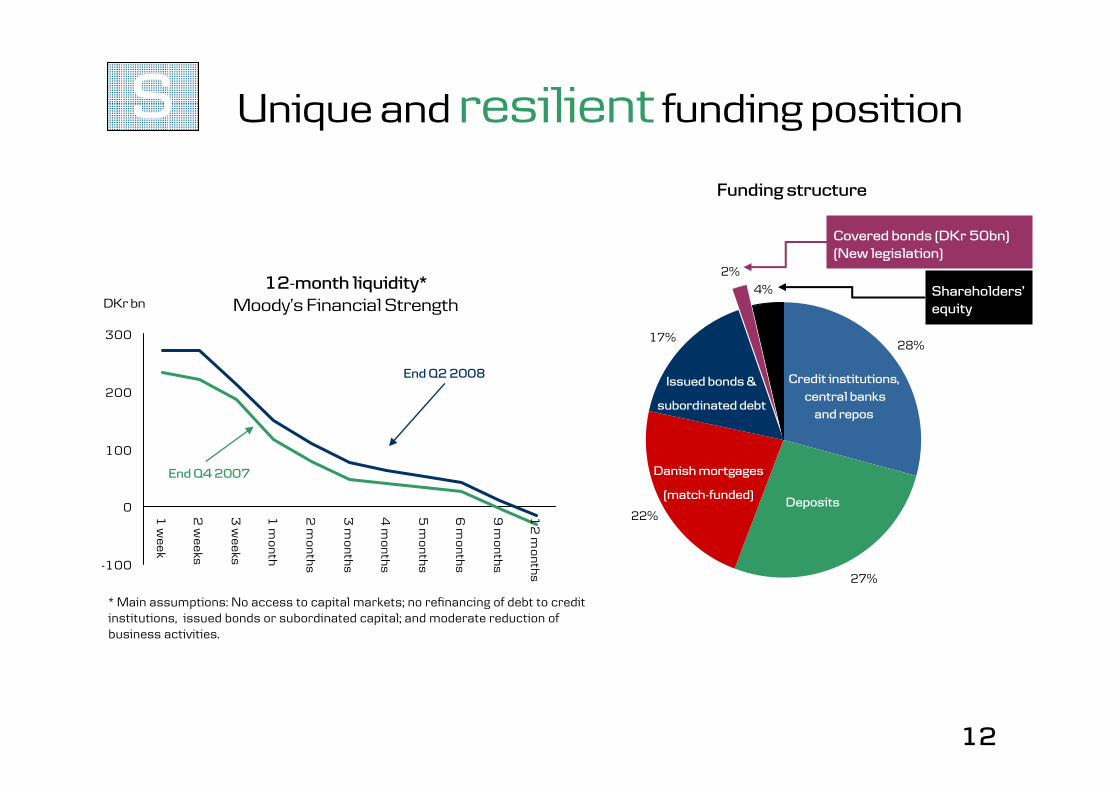
12-month liquidity*Moody�s Financial Strength
End Q4 2007
End Q2 2008
28%
27%
22%
17%
2%4%
Funding structure
Deposits
Issued bonds &
subordinated debt
Danish mortgages
(match-funded)
Credit institutions, central banks
and repos
Unique and resilient funding position
Covered bonds (DKr 50bn)(New legislation)
Shareholders�equity
* Main assumptions: No access to capital markets; no refinancing of debt to credit institutions, issued bonds or subordinated capital; and moderate reduction of business activities.
S
13
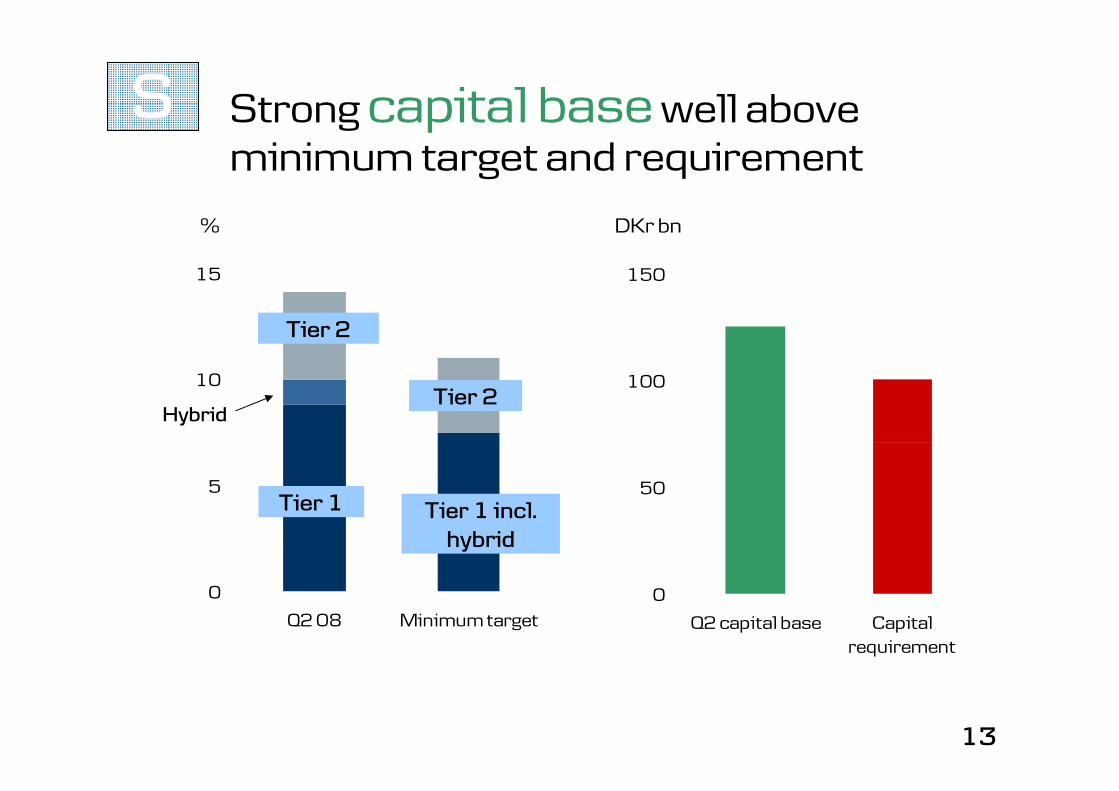
Strong capital base well above minimum target and requirement
0
5
10
15
Q2 08 Minimum target0
50
100
150
Q2 capital base Capitalrequirement
Tier 1 Tier 1 incl. hybrid
Tier 2
Tier 2
Hybrid
% DKr bn
S

14
0
1,000
2,000
3,000
4,000
Q2 07 Q3 07 Q4 07 Q1 08 Q2 08
Profit before credit loss expenses ex trading and insurance
Trading and Insurance income
DKr m
Resilient income base from well-diversified retail banking operations
S

15
Capital structure in the light of comparability
Tier 1 capital : 10.0%
Deductions from Tier 1:Pension deficit: YESHTM: NASolvency margin: 50%
Tier 1 capital: 7.3%*
Deductions from Tier 1:Pension deficit: ?HTM: ?Solvency margin: ?
* Source: Morgan Stanley & Danske Bank.
Selected European banks
S

16
-500
0
500
1,000
1,500
2,000
2,500
2007 2008 2009
Integration Costs Amortisations Synergies, Sampo
Expenses: Net impact on integration costs and synergies: 2007 vs. 2009: -DKr 1.8bn
DKr m
Tailwind from �low complexity� cost reductions coming through the P&L
S

17
The spreads are validating the same story � staying much narrower than peers
European covered bonds (5-yr bullets)Swap spreads (bp)
W
-20
0
20
40
60
80
100
120
01
/07
03
/07
05
/07
07
/07
09
/07
11
/07
01
/08
03
/08
05
/08
07
/08
Spain
Denmark
Sweden
UK

18
Also pressure from lower deposit margins
0.0
0.2
0.4
0.6
0.8
1.0Ja
n-0
3
May
-03
Sep
-03
Jan
-04
May
-04
Sep
-04
Jan
-05
May
-05
Sep
-05
Jan
-06
May
-06
Sep
-06
Jan
-07
May
-07
Sep
-07
Jan
-08
May
-08
% Deposit margins - Denmark
W
*Source: Nationalbanken.

19
Banks17%
Personal customers
30%
Govts & public authorities
2%
Subsidied housing companies
5%
Health care1%
Commercial property
8%
IT1%
Other industrials3%
Materials2%
Tele-communication
0%
Tranportation and shipping
3%Consumer
9%Energy and utilities
2%
Construction & bldg mat.
2%
Div. financials11%Other financials
4%
Diversified loan book
Credit exposure, end Q2 2008(DKr 2,699bn)
BUSINESS TRENDS
W

20
Developer, commercial property and construction exposure
Construction & building materials
DKr bn Denmark Ireland GroupContractors 4.2 5.1 23.6Others 10.1 0.7 24.1Total 14.3 5.8 47.7
Commercial property
DKr bn Denmark Ireland GroupRental comm. 52.0 12.0 172.9Developers 1.6 6.5 15.7
Others 7.1 2.1 22.6
Total 60.7 20.6 211.2
W

21
-5
0
5
10
15
Q207 Q307 Q407 Q108 Q208
Credit loss expensesbp
Collective impairment chargesOther credit loss expenses
Safe loan book, yes � but losses are on the rise
W

22
Between large US banks and regional Danish banks
T

23
Long-term decline in lending margins at a turning point
% Lending margins - Denmark
1.0
2.0
3.0
4.0
5.0Q
1 1
99
5
Q3
19
96
Q1
19
98
Q3
19
99
Q1
20
01
Q3
20
02
May
-03
Nov
-03
May
-04
Nov
-04
May
-05
Nov
-05
May
-06
Nov
-06
May
-07
Nov
-07
May
-08
O
* Source: Nationalbanken.

24
Time for a much-needed rebound in lending margins
O

25
2007 2008
Total lending margin
Lending margins in Denmark are coming up
O
1,5
1,8
2,0
Q2 Q3 Q4 Q1 Q2
%
1.5
1.8
2.015 bp

26
☺☺
But spread management is quite different in different markets
☺
What�s holding the banks back from repricing?
Northern Ireland & Ireland
Norway
Sweden:
Denmark
Finland
The Baltics
O
☺?

27
Summary
Slow growth, but a
very healthy Danish economy
Danish consumers not overleveraged
Unique Danish mortgage model
The financial storm will be managed
through
active and proven widening of lending
spreads
cost reductions with low execution risk
solid liquidity and capital management

28www.danskebank.com/ir