syllabus class: - b.b.a. iv semester subject: - operations
TRANSCRIPT

B.B.A. 4th Sem. Subject- Operation Research
45, Anurag Nagar, Behind Press Complex, Indore (M.P.) Ph.: 4262100, www.rccmindore.com 1
SYLLABUS
Class: - B.B.A. IV Semester
Subject: - Operations Research
UNIT – I Definition of operations research, models of operations research, scientific
methodology of operations research, scope of operations research, importance of
operations research in decision making, role of operations management,
limitations of OR.
UNIT – II Linear Programming: Introduction – Mathematical formulation of a problem –
Graphical solutions, standard forms the simplex method for maximization and
minimization problems. Method application to management decisions.
Transportation problem – Introduction – Initial basic feasible solution - NWC
method – Least cost method – Vogel’s method – MODI – moving towards
optimality – solution procedure without degeneracy
UNIT – III Assignment problem – Algorithm – Hungarian method – simple problems.
UNIT – IV Sequencing and replacement model: Sequencing problem – processing through 2
machines, 3 machine – s jobs and k machines and traveling salesman problem.
Replacement of items that deteriorate gradually – with time, without time, that
fails completely – individual replacement – group replacement.
UNIT – V Network models and simulation. Network models for project analysis CPM;
Network construction and time analysis; cost time trade off, PERT – problems.
B.B.A. 4th Sem. Subject- Operation Research
45, Anurag Nagar, Behind Press Complex, Indore (M.P.) Ph.: 4262100, www.rccmindore.com 2
UNIT- 1 Introduction: Now a day life is becoming more and more complex. Everybody has to take certain decisions for him or for others. Therefore, one has to take correct decision but at right time. An effective decision depends on many factors they may be political, social and economical. Decision making in business and industry is extremely difficult since the world is full of uncertainty. In past, businessmen generally make their decisions with experience or intuition but in this world it does not make any sense. They realized that in this way they are net able to make an effective decision so that they need some scientific methods which help them to take an appropriate decision in a particular, situation. Every organization has limited resources. Operations research provides the solution that how to optimum utilizes scarce resources? Operations research provides a facility to, decision maker to evaluate the given problems, identify the alternative solutions, recognize the constraints and then assist the decision maker to have the best possible solution available as optimal solution. OR also provides the quantitative technique model to the problem so that it will become easier for decision maker to predict the future outcomes of the solutions. The uncertainty of future and complexities of present scenarios increase the responsibility of decision maker to take the accurate decision for the organization. OR theory makes the problems of real life, more structured and hence, easily solvable and having correct answer. OR seeks they optimal solution to a problem. This optional solution is not just a solution which provides the best result but the, solutions have been calculated after considering the various aspects of time and cost constraints. Operations Research is one of the quantitative aid to decision making offers the decision maker a method of evaluating e cry possible complex problem, Real life problems by using various techniques. Definition of OR
1. Operations Research is a scientific method of providing executive departments with a quantitative basis for decision regarding the operations under their control.
P M Morse & GE & Kimball 2. Operations Research is a scientific approach to problem solving for executive Management.
H.M. Wagner 3. Operations Research is the art of finding bad answers to problems to which otherwise worse
answers are given. T.L. Saaty
4. Operations Research is concerned with scientifically deciding how to best design & operate man-machine system usually requiring the allocation of scarce recourses.
Operations Research Society, UK 5. Operations Research is the art of winning war without actually fighting it
Miller & Starr 6. Operations Research is the systematic, method oriented study of the basic structure, characteristics,
functions and relationships of an organization to provide the execute with a sound, scientific and quantitative basis for decision making.
E.L. Arnoff M.J.Netzorg 7. Operations Research-is the systematic application of quantitative methods, techniques and tools to
the analysis of problems involving the operation of system. Daellenbach & George
8. Operations Research may be described as a scientific approach to decision making that involves the operations of organizational system.
F S Hiller & G J Lieberman 9. This new decision making field has been characterized by the use of scientific knowledge through
interdisciplinary team effort for the purpose of determining the best utilization of limited resources. H A Taha

B.B.A. 4th Sem. Subject- Operation Research
45, Anurag Nagar, Behind Press Complex, Indore (M.P.) Ph.: 4262100, www.rccmindore.com 3
10. Operations Research, in the most general sense, can be characterized as the application of scientific methods, techniques and tools, to problems involving the operations of a system so as to provide those in control of the operations with optimum solutions to the problems.
Churchman, Ackoff and Arnoff Characteristics of OR Following are the characteristics of Operations Research
1. Interdisciplinary team approach – The problems an OR of analyst faces are heterogeneous in nature, involving the number Variables and constraints which are beyond the analytical ability of a person. So a number of people from various disciplines are required to understand the problem. They apply their specialized knowledge and experience to get a better understanding and solution to the problem on hand.
2. System approach – Any organization is it a business or government of a defence organization can be considered as a system having various sub systems. The decision made by any sub systems made by will have its effect on other sub systems. Like decision taken by finance department will have its effect on marketing department. When dealing with OR problem the system should be treated as a whole so that the interrelation between sub systems and the problem on the entire system are kept in mind. Hence OR is a system approach.
3. Scientific method – OR uses scientific methods for the following steps: a. The problem is defined and analyzed b. Observations are made under different conditions. c. On the basis of observations, a hypothesis is formulated how the various factors interact for the
best solution to the problem. d. An experiment is designed and executed to test the hypothesis. e. Finally the results of the experiments are analyzed and the hypothesis is either accepted or
rejected. 4. It helps increasing the creative ability of the decision market – OR provides the managers
mathematical took, techniques and models to analyze the problem on hand and to evaluate the result of all alternatives and make lair Optimal choice, thereby helping him in faster and better decisions. Hence a manager who uses OR techniques will have a better creativity ability than a manager who does not use these techniques.
5. Helpful in finding: optimum decisions – OR techniques always try to provide the best or optimum decisions regarding to the organization. It provides the solution by considering all the constraints.
6. Quantitative solutions – OR techniques provide quantitative basis for decision making to the management. Different problems related to business and management like Assignment problem, Transportation problem, Game Theory, Simulation, and Markov Chain etc. are solved in quantitative form.
7. Use of computer – Since OR techniques are mathematical in nature therefore it requires a computers to solve the complex mathematical models. A large amount of calculations are required so use of digital computer has become an integral part of the Operations research approach to decision making.
• Equipment replacement policies • Transportation planning Personnel Management • Recruitment policies and assignment of jobs • Manpower planning, wage/salary administration • Negotiation in a bargaining situation • Skills and wages balancing • Establishing equitable bonus system

B.B.A. 4th Sem. Subject- Operation Research
45, Anurag Nagar, Behind Press Complex, Indore (M.P.) Ph.: 4262100, www.rccmindore.com 4
Production Management 1. Project planning
a. Location and size of warehouse or new plant, distribution centres and retail outlets. b. Logistics layout and engineering design c. Transportation, planning and scheduling
2. Manufacturing a. Aggregate production Planning, assembly line, blending, purchasing and inventory control b. Allocating R&D budgets-most affectively
3. Maintenance and project scheduling. a. Maintenance policies and preventive maintenance b. Maintenance crew size and scheduling c. Project scheduling and allocation of resources
Government • Economic planning, natural resources, social planning and energy • Urban and housing problems. • Military, police, pollution control Research and development • Determination of areas of concentration of R&D • Control of development projects • Determination of cost and time requirements PHASES OF OPERATIONS RESEARCH The most important feature of OR is the use of scientific methods and building of decision models. The three phases of the scientific methods are as follows
a. Judgement Phase – This phase includes: • Identification of real-life problem • Selection of an appropriate objective & the values of various variables related to that ob.jective • Application of appropriate scale of measurement • Formulation of an appropriate model of the problem.
b. Research Phase: This phase includes: • Observations and data collection for a better understanding of the problem • Formulation of hypothesis and models • Observation and experimentation to lest the hypothesis • Analysis of the availably information and verification of the hypothesis • Predictions Of various result-from the hypothesis • Generalization of the result and consideration of alternative methods.
c. Action Phase: This phase consist of making, recommendations for implementing the decision. There must be awareness of environment in which the problem occurred, objective, assumption and omission of the model of the problem.
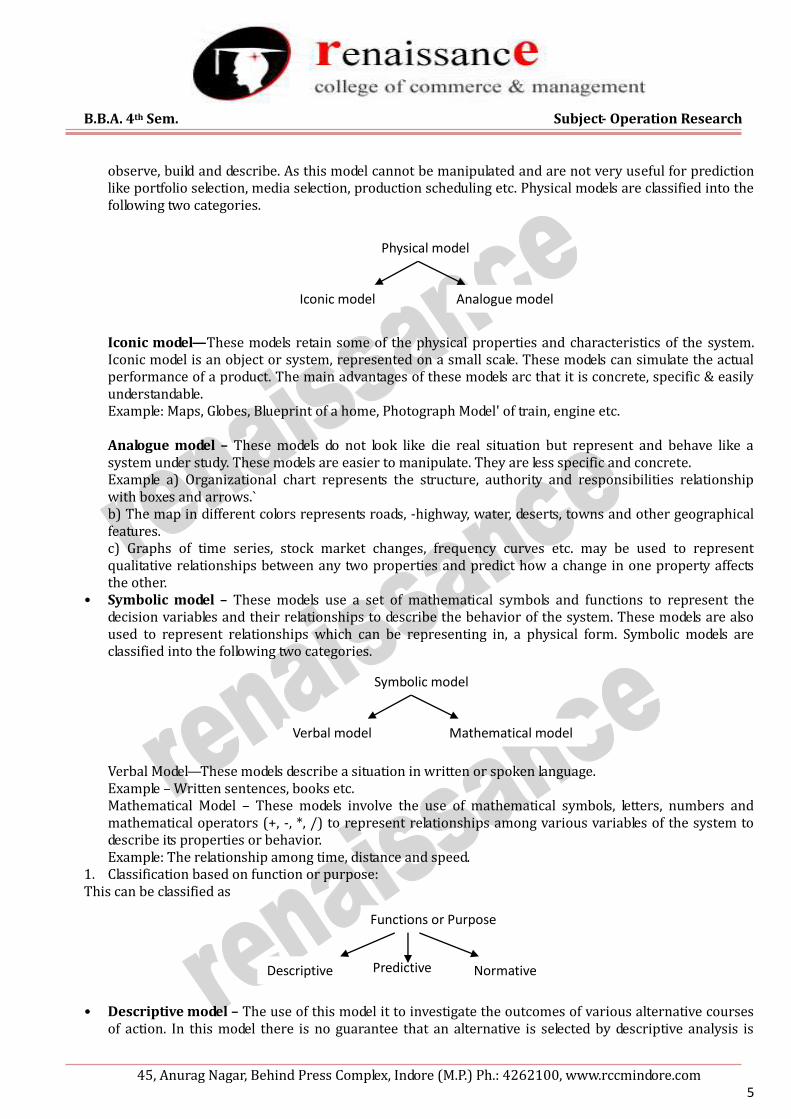
MODELS IN OR Classification based on structure This can be classified as • Physical model- These models provide a physical appearance of the real object under study either
reduced in site or scaled up. Physical models are useful only in design problems because they are easy to
Structure
Physical Symbolic
B.B.A. 4th Sem. Subject- Operation Research
45, Anurag Nagar, Behind Press Complex, Indore (M.P.) Ph.: 4262100, www.rccmindore.com 5
observe, build and describe. As this model cannot be manipulated and are not very useful for prediction like portfolio selection, media selection, production scheduling etc. Physical models are classified into the following two categories. Iconic model—These models retain some of the physical properties and characteristics of the system. Iconic model is an object or system, represented on a small scale. These models can simulate the actual performance of a product. The main advantages of these models arc that it is concrete, specific & easily understandable. Example: Maps, Globes, Blueprint of a home, Photograph Model' of train, engine etc. Analogue model – These models do not look like die real situation but represent and behave like a system under study. These models are easier to manipulate. They are less specific and concrete. Example a) Organizational chart represents the structure, authority and responsibilities relationship with boxes and arrows.` b) The map in different colors represents roads, -highway, water, deserts, towns and other geographical features. c) Graphs of time series, stock market changes, frequency curves etc. may be used to represent qualitative relationships between any two properties and predict how a change in one property affects the other.
• Symbolic model – These models use a set of mathematical symbols and functions to represent the decision variables and their relationships to describe the behavior of the system. These models are also used to represent relationships which can be representing in, a physical form. Symbolic models are classified into the following two categories. Verbal Model—These models describe a situation in written or spoken language. Example – Written sentences, books etc. Mathematical Model – These models involve the use of mathematical symbols, letters, numbers and mathematical operators (+, -, *, /) to represent relationships among various variables of the system to describe its properties or behavior. Example: The relationship among time, distance and speed.
1. Classification based on function or purpose: This can be classified as
• Descriptive model – The use of this model it to investigate the outcomes of various alternative courses of action. In this model there is no guarantee that an alternative is selected by descriptive analysis is
Physical model
Iconic model Analogue model
Symbolic model
Verbal model Mathematical model
Functions or Purpose
Descriptive Normative
Predictive
e
B.B.A. 4th Sem. Subject- Operation Research
45, Anurag Nagar, Behind Press Complex, Indore (M.P.) Ph.: 4262100, www.rccmindore.com 6
optimal. These models are usually used in decision situations where optimizing models are not applicable. These are used in predicting the behavior of a system under various conditions. Example: Simulation
• Predictive model – These models indicate “if this occurs, then that will follow”. They relate dependent and independent variables. These models do not have an objective function as apart of the model to evaluate decision alternatives. Example – S=a+ bA+ cI is a model that describes how the sale (S) of a product changes with a change in advertising expenditure (A) and disposable income (I)
• Normative or Optimization model – These models provide the ‘best’ or ‘optimal’ solution to problems subject to certain limitations on the use of resources. These models provide recommended courses of action. Example – Mathematical Programming
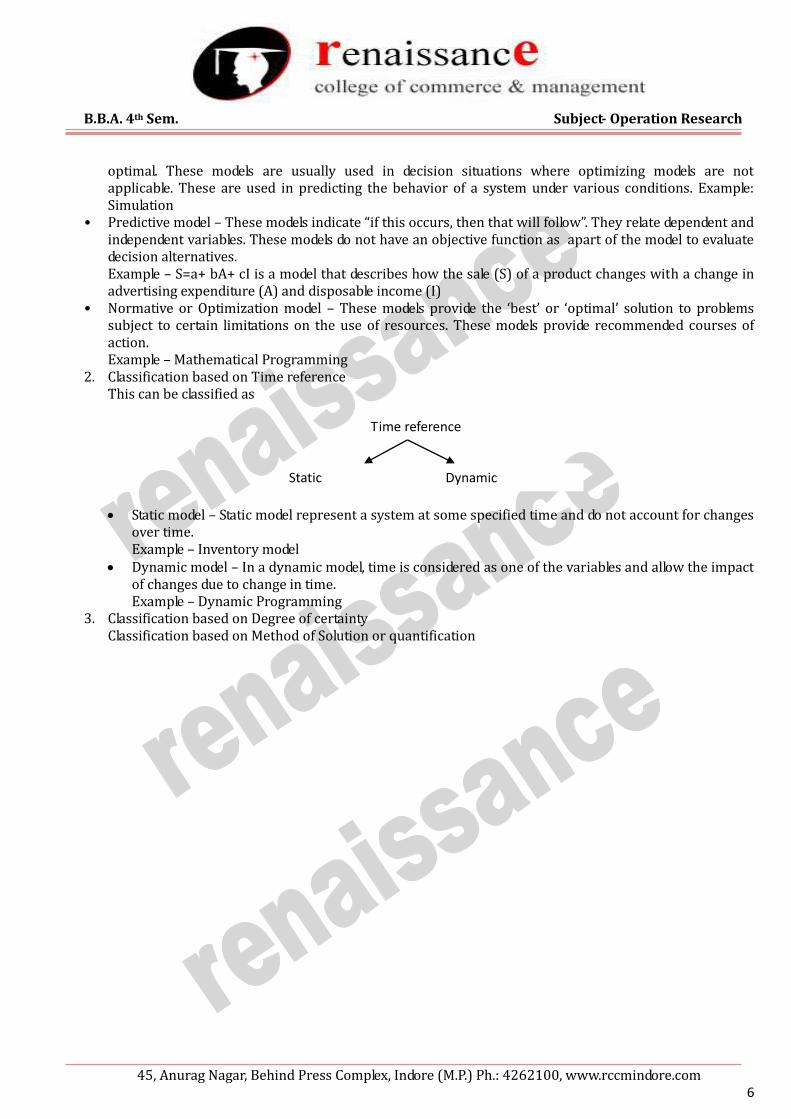
2. Classification based on Time reference This can be classified as Static model – Static model represent a system at some specified time and do not account for changes
over time. Example – Inventory model
Dynamic model – In a dynamic model, time is considered as one of the variables and allow the impact of changes due to change in time. Example – Dynamic Programming
3. Classification based on Degree of certainty Classification based on Method of Solution or quantification
Time reference
Static Dynamic

B.B.A. 4th Sem. Subject- Operation Research
45, Anurag Nagar, Behind Press Complex, Indore (M.P.) Ph.: 4262100, www.rccmindore.com 7
UNIT II LINEAR PROGRAMMING PROBLEM
Introduction to Linear Programming
A linear from is meant a mathematical expression of the type a1x1 + a2x2+…..+anxn, where a1, a2, …., an are constants and x1, x2 … xn are variables. The term programming refers to the process of determining a particular program or plan of action. So linear Programming (LP) is one of the most important optimization (maximization / minimization) techniques developed in the field of Operations Research (OR). The methods applied for solving a linear programming problem are basically simple problems; a solution can be obtained by a set of simultaneous equations. However a unique solution for a set of simultaneous equations in n-variables (x1, x2 …xn), at least one of them is non-zero, can be obtained if there are exactly n relations. When the number of relations is greater than or less than n, a unique solution does not exist but a number of trial solutions can be found. Definition – The general LPP calls for optimizing (maximizing / minimizing) a linear function of variables called the ‘Objective function’ subject to a set to a set of linear equations and or inequalities called the ‘Constraints’ or ‘Restrictions’.
General form of LLP
We formulate a mathematical model for general problem of allocating resources to activities. In particular, this model is to select the values for x1, x2 … xn so as to maximize or minimize Z = clx1 + c2x2 + ………..+cnxn Subject to restrictions A1 1x1 + a12x2 + ……….+a1nxn (<_ or >_) b1 A2 1x1 + a22x2 + ……….+a2nxn (<_ or >_) b2 Am1x1 + am 2x2 + ……….+amnxn (<_ or >_) bm Andx1 >_0, x2 >_0,………xn >_o Where Z = value of overall measure of performance xj = level of activity (for j = 1, 2,…,n) cj = increase in Z that would result from each unt increase in level of activity j bj = amount of resources i that is available allocation to activities (for I = 1,2,…,m) aij = amount of resources i consumed by each unit of activity j
Applications of Linear Programming
1. Personnel Assignment Problem 2. Transportation Problem 3. Efficiency on Operation of system of Dams 4. Optimum Estimation of Executive Compensation 5. Agriculture Applications 6. Military Applications 7. Production Management 8. Marketing Management 9. Manpower Management
Advantages of Linear Programming Techniques
1. It helps us in making the optimum utilization of productive resources. 2. The quality of decisions may also be improved by linear programming techniques. 3. Provides practically solutions. 4. In production processes. High lighting of bottlenecks is the most significant advantage of this
technique.

B.B.A. 4th Sem. Subject- Operation Research
45, Anurag Nagar, Behind Press Complex, Indore (M.P.) Ph.: 4262100, www.rccmindore.com 8
Formulation of LP Problems GRAPHICAL METHOD
The graphical solution procedure: 1. Consider each inequality constraint s equation. 2. Plot each equation on the graph as each one will geometrically represent a straight line. 3. Shade the feasible region. Every point on the line will satisfy the equation of the line. If the inequality
constraint is corresponding to that line is ‘<’ then the region below the line lying in the first quadrant is shaded. Similarly for ‘>’ the region above the line is shaded. The points lying in the common region will satisfy the constraints. This common region is called feasible region.
4. Choose the convenient value of Z and plot the objective function line. 5. Pull the objective function line until the extreme points of feasible region. a. In the maximization case this line will stop far from the origin and passing through at least one
corner of the feasible region. b. In the minimization case, this line will stop near to the origin and passing through at least one
corner of the feasible region. 6. Read the co-ordinates of the extreme points selected in step 5 and find the maximum or minimum
value of Z.
Definitions 1. Solution – Any specification of the values for decision variable among (x1, x2,…, xn) is called a
solution. 2. Feasible solution is a solution for which all constraints are satisfied. 3. Infeasible solution is a solution for which at least one constraint is not satisfied. 4. Feasible region is a collection of all feasible solutions. 5. Optimal solutions are a feasible solution that has the most favorable value of the objective function. 6. Most favorable value is the largest value if the objective function is to be maximized, whereas it is
the smallest value if the objective function is to be minimized. 7. Multiple optimal solution – More than one solution with the same optimal value of the objective
function. 8. Unbounded solution – If the value of the objective function can be increased or decreased
identifinitely such solutions are called unbounded solution. 9. Feasible region – The region containing all the solutions of an inequality.
SIMPLEX METHOD
General Linear Programming Problem (GLPP) Maximize / Minimize Z = c1x1 + c2x2 + c3x3 + ………….+cnxn Subject to constraints A11x1 + a12x2 + ………..+a1nxn (< or >) b1 A21x1 + a22x2 + ………..+a2nxn (< or >) b2 An1x1 + am2x2 + ……….+ amnxn (< or >) bm And X1 > 0, ….. xn > 0 Where constraints may be in the form of any inequality (< or >) or even in the form of an equation (-) and finally satisfy the non-negativity restrictions.
Step to convert GLPP to SLPP (Standard LPP) Step 1 – Write the objective function in the minimization for. If the given objective function is of minimization form then multiply throughout by -1 and write max z=min (-z) Step 2 – convert all inequalities as equations.
If an quality of ‘<’ appears then by adding a variable called slack variable. We can convert it to an equation. For example x1 + 2x2 <12, we can write as x1 +2x2 +sl = 12.

B.B.A. 4th Sem. Subject- Operation Research
45, Anurag Nagar, Behind Press Complex, Indore (M.P.) Ph.: 4262100, www.rccmindore.com 9
If the constraint is of ‘>’ type, we can subtract a variable called Surplus variable and convert it to an equation. For example 2x1 +x2>15;
2x1 +x2 –s2 = 15 Step 3- The right side element of each constraint should be made non-negative 2x1 + x2 – s2 =15 -2x1 – x2 + s2 = 15 (That is multiplying throughout by -1) Step 4- All variables must have non-negative values. For example: x1 +x2<3 X1 > 0, x2 is unrestricted in sign Then x2 is written as x2 – x2 – x2 where x2, x2 >_ 0 Therefore the inequality takes the form of equation as x1 + (x2 – x2) s1 = 3
Some Basic Definition
Solution of LPP Any set of variable (x1, x2…xn) which satisfies the given constraint is called solution of LPP.
Basic solution Is a solution obtained by setting any ‘n’ variable equal to zero and solving remaining ‘m’ Variables. Such ‘m’ variables are called basic variables and ‘n’ variables are called non-basic variables.
Basic feasible solution A basic solution that is feasible (all basic variables are non negative) is called basic feasible solution. There are two types of basic feasible solution. 1. Degenerate basic feasible solution
If any of the basic variables of a basic feasible solution is zero than it I said to be degenerate basic feasible solution.
2. Non degenerate basic feasible solution It is a basic feasible solution which has exactly ‘m’ positive xi, where i=1,2,…m. in other words all ‘m’ basic variables are positive and remaining ‘n’ variables are zero.
Optimal basic feasible solution A basic feasible solution is said to be optimum if it optimize (max / min) the objective function.
Introduction to Simplex Method
It was developed by G. Dazting in 1947. The simplex method provides an algorithm (a rule of procedure usually involving repetitive application of a prescribed operation) which is based on the fundamental theorem of linear programming. The simplex algorithm is an iterative procedure for solving LP problems in a finite number steps. It consists of
Having a trial basic feasible solution to constraint equations Testing whether it is an optimal solution Improving the first trial solution by a set of rules and repeating the process till an optimal solution is
obtained.
Computational Procedure of Simplex Method Step 1- Write the given GLPP in the form of slpp Step 2- present the constraints in the matrix form Step 3- Construct the starting simplex table using the notations Step 4- Calculation of Z and j and test the basic feasible solution for optimality by the rules given. Procedure to test the basic feasible solution for optimality by the rules given Rule 1- If all j >_ 0, the solution under the test will be optimal. Alternate optimal solution will exist if any non-basic j is also zero. Rule 2- If atleast one j is negative, the solution is not optimal ad then proceeds to improve the solution in the next step.
B.B.A. 4th Sem. Subject- Operation Research
45, Anurag Nagar, Behind Press Complex, Indore (M.P.) Ph.: 4262100, www.rccmindore.com 10
Rule 3- if corresponding to any negative j, all elements of the column Xj are negative or zero, then the solution under test will be unbounded. Step 5- To improve the basic feasible solution, the vector entering the basis matrix and the vector to be removed from the basis matrix are determined.
Incoming vector The incoming vector Xk is always selected corresponding to the most negative value of j. it is indicated by (↑).
Outgoing vector The outgoing vector is selected corresponding to the least positive value of minimum ratio. It is indicated by (→).
Step 6- Mark the key element of pivot element by ‘1’. The element of the intersection of Outgoing vector and incoming vector is the pivot element:
If the number in the marked position is other than unity, divide all the elements of that row by the key element.
Then subtract appropriate multiples of this new row from the remaining rows, so as to obtain zeroes in the remaining position of the column Xk.
Step 7- Now repeat step 4 through step 6 until an optimal solution is obtained.
Numerical on Graphical Method Q.1) A furniture seller prepares and sells tables and chairs only. There is space in his go down to store 80 units only and he has a capital of Rs. 18,000 . a table costs Rs. 400 and a chair costs Rs.300. he earn profit of Rs. 100 on each table and Rs. 80 on each chair. Give a mathematical formulation of linear program plan to get maximum profit. Obtain its solution by graphical method. Q.2) A dealer wishes to purchase a number of fans and sewing machines. He has only Rs. 5760 to invest and has space at most for 20 items. A fan costs him Rs. 360 and a sewing machine at profit of Rs. 18 assuming that he can sell each item which he purchases, how should he invest his money in order to maximize the profit? Formulate this problem as a linear programming problem and then use graphical method to solve it. Q.3) Max Z = 2x+3y STC, 3x + 4y < 12 4x + 3y <12 X,y > 0 Q. 4) Min Z = 20x + 10y STC, 3X + Y > 30 X + 2Y < 40 4X + 3Y > 60 X, y > 0 Q.5) Max Z = 20x + 10y STC, 3x + y > 30 X + 2y < 40 4x + 3y > 60 X, y > 0 Q. 6) Min Z = 2x – y STC, x + y < 5 X + 2y < 8 X, y > 0
B.B.A. 4th Sem. Subject- Operation Research
45, Anurag Nagar, Behind Press Complex, Indore (M.P.) Ph.: 4262100, www.rccmindore.com 11
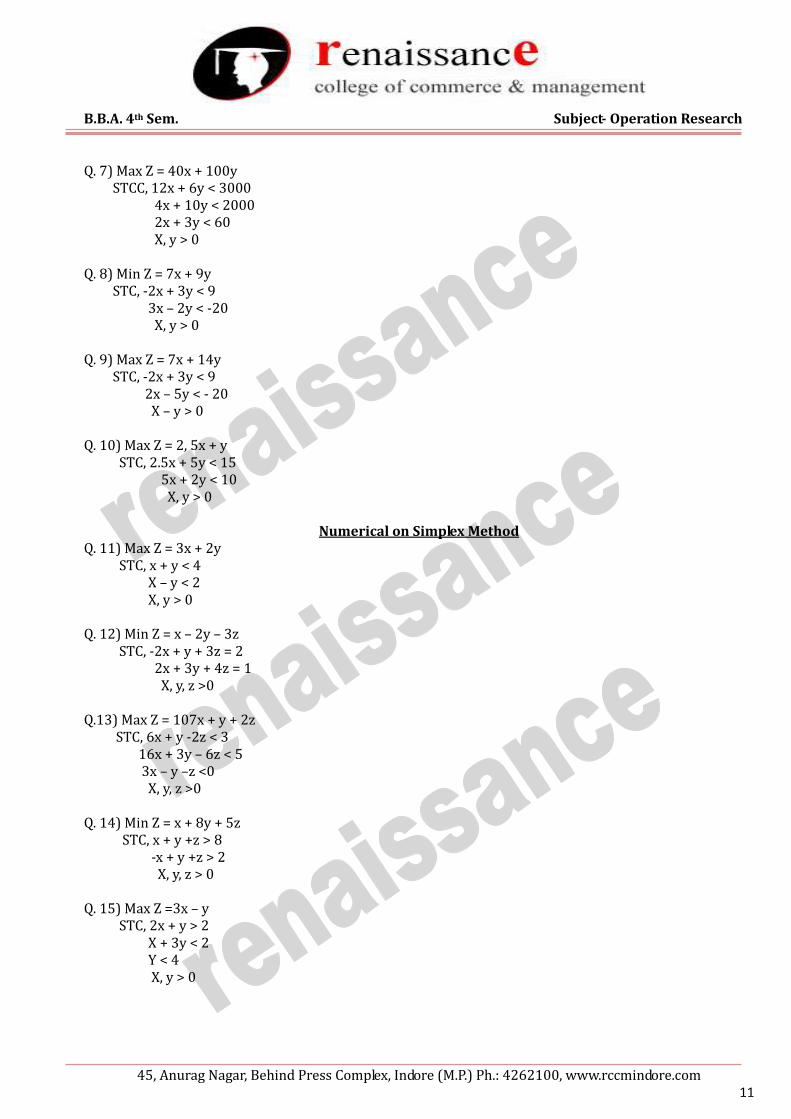
Q. 7) Max Z = 40x + 100y STCC, 12x + 6y < 3000 4x + 10y < 2000 2x + 3y < 60 X, y > 0 Q. 8) Min Z = 7x + 9y STC, -2x + 3y < 9 3x – 2y < -20 X, y > 0 Q. 9) Max Z = 7x + 14y STC, -2x + 3y < 9 2x – 5y < - 20 X – y > 0 Q. 10) Max Z = 2, 5x + y STC, 2.5x + 5y < 15 5x + 2y < 10 X, y > 0
Numerical on Simplex Method
Q. 11) Max Z = 3x + 2y STC, x + y < 4 X – y < 2 X, y > 0 Q. 12) Min Z = x – 2y – 3z STC, -2x + y + 3z = 2 2x + 3y + 4z = 1 X, y, z >0 Q.13) Max Z = 107x + y + 2z STC, 6x + y -2z < 3 16x + 3y – 6z < 5 3x – y –z <0 X, y, z >0 Q. 14) Min Z = x + 8y + 5z STC, x + y +z > 8 -x + y +z > 2 X, y, z > 0 Q. 15) Max Z =3x – y STC, 2x + y > 2 X + 3y < 2 Y < 4 X, y > 0
B.B.A. 4th Sem. Subject- Operation Research
45, Anurag Nagar, Behind Press Complex, Indore (M.P.) Ph.: 4262100, www.rccmindore.com 12
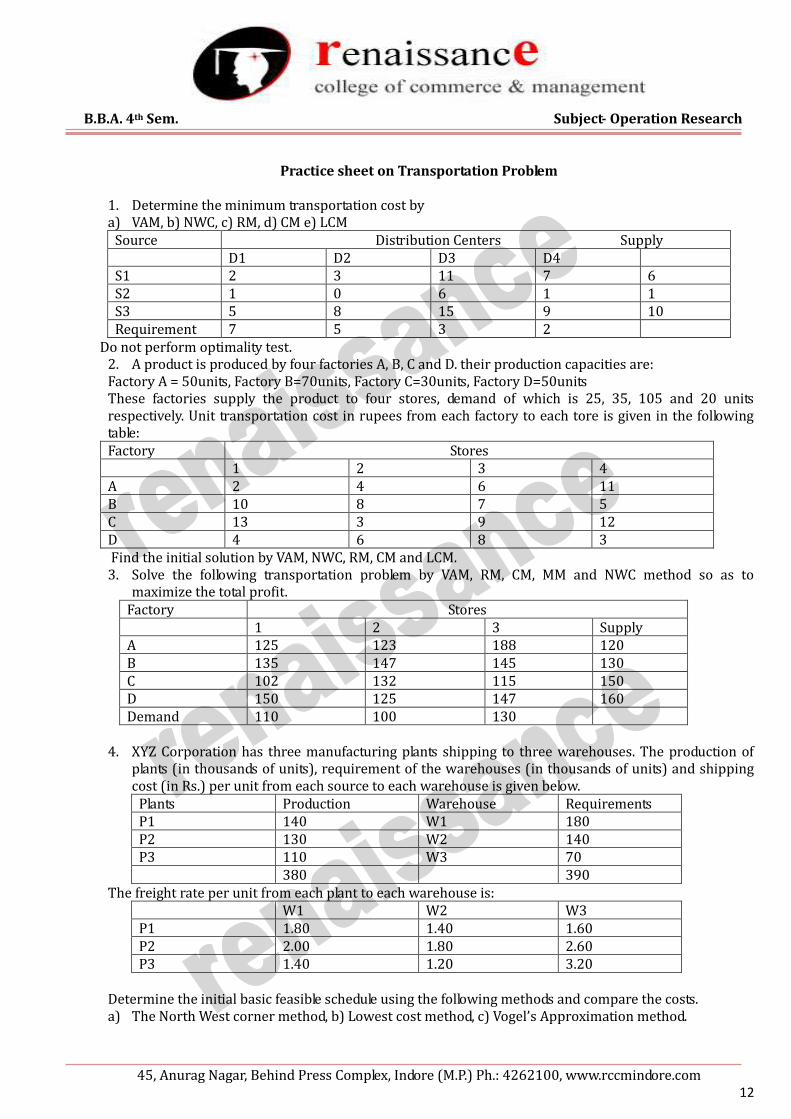
Practice sheet on Transportation Problem
1. Determine the minimum transportation cost by a) VAM, b) NWC, c) RM, d) CM e) LCM
Source Distribution Centers Supply D1 D2 D3 D4 S1 2 3 11 7 6 S2 1 0 6 1 1 S3 5 8 15 9 10 Requirement 7 5 3 2
Do not perform optimality test. 2. A product is produced by four factories A, B, C and D. their production capacities are: Factory A = 50units, Factory B=70units, Factory C=30units, Factory D=50units These factories supply the product to four stores, demand of which is 25, 35, 105 and 20 units respectively. Unit transportation cost in rupees from each factory to each tore is given in the following table: Factory Stores 1 2 3 4 A 2 4 6 11 B 10 8 7 5 C 13 3 9 12 D 4 6 8 3 Find the initial solution by VAM, NWC, RM, CM and LCM. 3. Solve the following transportation problem by VAM, RM, CM, MM and NWC method so as to
maximize the total profit. Factory Stores 1 2 3 Supply A 125 123 188 120 B 135 147 145 130 C 102 132 115 150 D 150 125 147 160 Demand 110 100 130
4. XYZ Corporation has three manufacturing plants shipping to three warehouses. The production of
plants (in thousands of units), requirement of the warehouses (in thousands of units) and shipping cost (in Rs.) per unit from each source to each warehouse is given below.
Plants Production Warehouse Requirements P1 140 W1 180 P2 130 W2 140 P3 110 W3 70 380 390
The freight rate per unit from each plant to each warehouse is: W1 W2 W3 P1 1.80 1.40 1.60 P2 2.00 1.80 2.60 P3 1.40 1.20 3.20
Determine the initial basic feasible schedule using the following methods and compare the costs. a) The North West corner method, b) Lowest cost method, c) Vogel’s Approximation method.
B.B.A. 4th Sem. Subject- Operation Research
45, Anurag Nagar, Behind Press Complex, Indore (M.P.) Ph.: 4262100, www.rccmindore.com 13
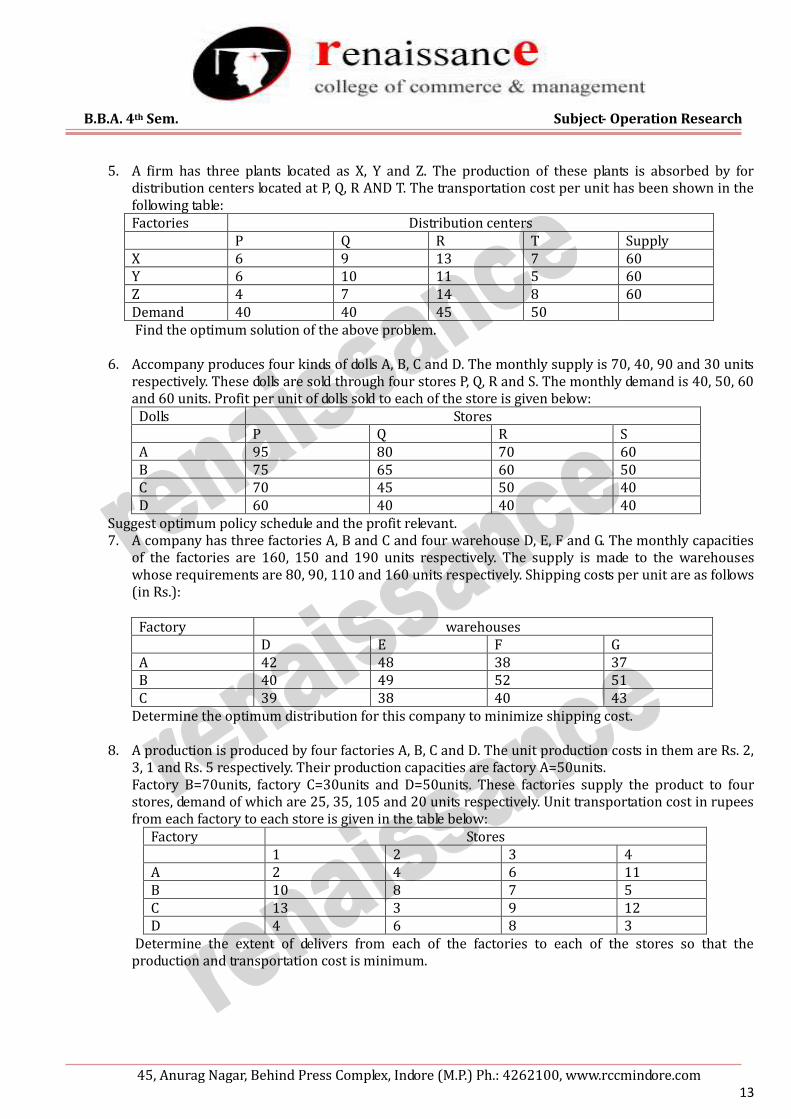
5. A firm has three plants located as X, Y and Z. The production of these plants is absorbed by for distribution centers located at P, Q, R AND T. The transportation cost per unit has been shown in the following table: Factories Distribution centers P Q R T Supply X 6 9 13 7 60 Y 6 10 11 5 60 Z 4 7 14 8 60 Demand 40 40 45 50 Find the optimum solution of the above problem.
6. Accompany produces four kinds of dolls A, B, C and D. The monthly supply is 70, 40, 90 and 30 units respectively. These dolls are sold through four stores P, Q, R and S. The monthly demand is 40, 50, 60 and 60 units. Profit per unit of dolls sold to each of the store is given below:
Dolls Stores P Q R S A 95 80 70 60 B 75 65 60 50 C 70 45 50 40 D 60 40 40 40
Suggest optimum policy schedule and the profit relevant. 7. A company has three factories A, B and C and four warehouse D, E, F and G. The monthly capacities
of the factories are 160, 150 and 190 units respectively. The supply is made to the warehouses whose requirements are 80, 90, 110 and 160 units respectively. Shipping costs per unit are as follows (in Rs.):
Factory warehouses D E F G A 42 48 38 37 B 40 49 52 51 C 39 38 40 43
Determine the optimum distribution for this company to minimize shipping cost.
8. A production is produced by four factories A, B, C and D. The unit production costs in them are Rs. 2, 3, 1 and Rs. 5 respectively. Their production capacities are factory A=50units. Factory B=70units, factory C=30units and D=50units. These factories supply the product to four stores, demand of which are 25, 35, 105 and 20 units respectively. Unit transportation cost in rupees from each factory to each store is given in the table below:
Factory Stores 1 2 3 4 A 2 4 6 11 B 10 8 7 5 C 13 3 9 12 D 4 6 8 3
Determine the extent of delivers from each of the factories to each of the stores so that the production and transportation cost is minimum.

B.B.A. 4th Sem. Subject- Operation Research
45, Anurag Nagar, Behind Press Complex, Indore (M.P.) Ph.: 4262100, www.rccmindore.com 14
9. A company has three factories manufacturing the same product and four sales agencies in different parts of the country. Production costs differ from factory to factory and the sales prices from agency to agency. The shipping cost per unit product from each factory to each agency is known. Given the following data, find the production and distribution schedule most suitable to the company:
Production Cost Capacity Factory 20 15 F1 22 25 F2 12 5 F3
Shipping Cost
5 5 15 4 5 10 2 11 3 27 19 19 A B C D Rs. 30 Rs.40 Rs.30 Rs.28 5 15 15 11
Agency sales Price Requirements
10. The product of the three plants A, B and C are to be transported to four warehouses W1, W2, W3 and W4. The cost of transportation of each unit from plants to the warehouses along with the normal capacities of plants and warehouses are indicated below:
Plants Warehouses W1 W2 W3 W4 Capacity A 7 8 9 11 230 B 5 11 8 7 280 C 4 23 3 12 180 Demand 165 175 205 165
Overtime can be used in each plant and the capacities can be increased to 300, 360 and a 190 respectively. But the corresponding incremental unit overtime costs are Rs. 5, 4 and Rs. 6 respectively. Solve the problem for minimum cost of transportation.
11. A leading firm has three auditors. Each auditor can work up to 160 hours during the next month, during which time three projects must be completed. Project I will take 130 hours, project 2 will take 140 hours and project 3 will take 160 hours. The amount per hour that can be billed for assigning each auditor to each project is given in the following table:
Auditor Project 1 (Rs.) 2 (Rs.) 3(Rs.)
1 1200 1500 1900 2 1400 1300 1200 3 1600 1400 1500
Formulate this as a transportation problem and find the optimal solution.
12. A company has four factories F1. F2, F3 & F4 manufacturing the same product. Production and raw material costs differ from factory to factory and are given in the following table in the first two rows the transportation costs from the factories to the sales depots S1, S2, S3 are also given. The last two columns in the table give the sale price and the total requirement at each depot. The production capacity of each factory is given in the last row:

B.B.A. 4th Sem. Subject- Operation Research
45, Anurag Nagar, Behind Press Complex, Indore (M.P.) Ph.: 4262100, www.rccmindore.com 15
F1 F2 F3 F4 Sales price per unit
Requirement
Production cost/unit 15 18 14 13 Raw material cost/unit 10 9 12 9 Transportation cost/unit S1 3 9 5 4 34 80 S2 1 7 4 5 32 120 S3 5 8 3 6 31 150 Supply 10 150 50 100
Determine the most profitable production and distribution schedule and the corresponding profit.

B.B.A. 4th Sem. Subject- Operation Research
45, Anurag Nagar, Behind Press Complex, Indore (M.P.) Ph.: 4262100, www.rccmindore.com 16
UNIT-III The Assignment Model
The objective of assignment problem is to assign a number of resources (item to an equal number of activities (receivers) on a one to one basis so as to minimize total costs (or total time) of performing the tasks at hand or maximize total profit of allocation. In other words the problem is how the assignments should be made so as to optimize the given objective. Applications of Assignments Method:-
1. Assign salespeople to sales territories. 2. Assign vehicles to routes. 3. Assign contracts to bidders. 4. Schedule teachers to classes. 5. Men are matched to machines according to pieces produced per hour by each individual on each
machine. 6. Assign development engineers to several construction sites. 7. Assign novel vessels to petrol sectors. 8. Assign accountants to client accounts. 9. Teams are matched to projects by the expected cost of each team to accomplish each project.
Types of Assignment Problem
Maximization Problem Minimization Problem
1. Maximization Problem: An assignment problem wherein the basic objective of the problem is to be reduced is known as a minimization problem. Every firm wants to reduce factors like cost of production, time involved in producing a unit, idle time etc. and so they are a minimization problem.
2. Maximization Problem: An assignment problem wherein the basic objective of the problem is to be increased or maximized is known as a maximization problem. Every firm wants to increase its profits, sales etc. and so they tend t form a maximization problem.
Hungarian Assignment Method (HAM) HAM is also known as Flood’s Technique or Reduced Matrix Method. It provides an efficient means of finding the optimal solution without having to make a direct comparison of every option. It operates on a Principle of Matrix Reduction. We can reduce the Matrix to the point where there is one zero element in each row and column, it will then be possible to make optimal assignments i.e. assignments in which all the opportunities costs are zero. Steps used in Hungarian Assignment Method: Steps 1: To check for equality of rows & columns and if they are not equal, adding dummy row or dummy column to make them equal. Steps2: Row minimization Detecting the lowest element in each row and deducting it from the rest of the row elements. Steps 3: Column Minimization: Column minimization is applied in the reduced matrix obtained after row minimization. Detecting the lowest element in each column and deducting it from the rest of the column elements. Steps 4: Check for optimum Assignments: Try to make assignments in the reduced matrix attained after column minimization assignments are done in such a manner that there is only one assignment in each row and each column. Assignments can be made on only those row and column elements where the value is zero. Steps 5: If assignments cannot be made then cover all the zeros with minimum possible vertical and horizontal lines. After the zeros have been covered, find the lowest uncovered element and deduct it from all the uncovered elements and adding the same of all the intersection elements. Steps 6: Try to make assignments in the new matrix so obtained and still if assignments cannot be made then repeat steps 4, 5 and 6 till optimum assignments are attained.

B.B.A. 4th Sem. Subject- Operation Research
45, Anurag Nagar, Behind Press Complex, Indore (M.P.) Ph.: 4262100, www.rccmindore.com 17
Variations of the Assignment Problem
Unbalanced Assignment Restrictions Multiple Problem (Non-Square Matrix) on Assignments Optimal Solutions
1. Unbalanced Assignment Problem: An assignment problem wherein the number of rows in the matrix is not equal to the number of columns in the matrix is an unbalanced assignment problem. To convert an unbalanced assignment problem into a balanced problem a dummy row or dummy column has to be added.
Example:
Since, No. of rows =/ No. of Columns. Hence, it is an unbalanced assignment problem As number of rows is greater than number of columns we will take add a dummy columns to convert it to a balanced assignment problem.
Jobs Operators
J1 J2 J3 J4 J5 Do
O1 6 2 5 3 6 0 O2 2 5 8 7 7 0 O3 7 8 6 9 8 0 O4 6 2 3 4 5 0 O5 9 3 8 9 7 0 O6 4 7 4 6 8 0
Balanced Assignment Problem 2. Restriction on Assignments: Some technical, legal or other restrictions do not permit the
assignment of a particular facility to a particular job. Such problem can be solved by assigning a c=very heavy cost (infinite cost) to the corresponding cell.
3. Alternate optimal Solutions: When there are more than one ways of making assignments for a problem then it is said to be a case alternate optimal solutions.

B.B.A. 4th Sem. Subject- Operation Research
45, Anurag Nagar, Behind Press Complex, Indore (M.P.) Ph.: 4262100, www.rccmindore.com 18
Questions on Assignment Model
1. A computer centre has three expert programmers. The centre wants three application programmes to be developed. The head of the computer centre, after studying carefully the programmes to be developed, estimates the time in minutes required by the experts for the application programs as follow:
Programmers Programmes
Assign the programmers to the programs in such a way that the total computer tie is minimum.
2. A department has five employees with five jobs to be performed. The time (in hours) each men will take to perform each job is given in the effectiveness matrix.
Employees
Job How should the jobs be allotted, one per employee, so as to minimize the total man-hours?
3. Solve the following assignment problem so as to minimize the cost.
Persons Jobs 1 2 3 4 5
A 8 4 2 6 1 B 0 9 5 5 4 C 3 8 9 2 6 D 4 3 1 0 3 E 9 5 8 9 5
4. A tourist company has one car at each of 5 depots a, b, c, d & e. A customer rquire a car in each city,
say A, B, C, D & E. Distance (kms.) between depots & cities are given in the following distance matrix.
Cities Depots a b c d e
A 160 130 175 190 200 B 135 120 130 160 175 C 140 110 155 170 185 D 50 50 80 80 110 E 55 35 70 80 105
How should cars be assigned to customers so as to minimize the distance travelled?
5. Solve the following assignment problem of minimizing total time (hours) for doing all the jobs.
A B C 1 120 100 80 2 80 90 110 3 110 140 120
I II III IV V A 10 5 13 15 16 B 3 9 18 13 6 C 10 7 2 2 2 D 7 11 9 7 12 E 7 9 10 4 12
B.B.A. 4th Sem. Subject- Operation Research
45, Anurag Nagar, Behind Press Complex, Indore (M.P.) Ph.: 4262100, www.rccmindore.com 19
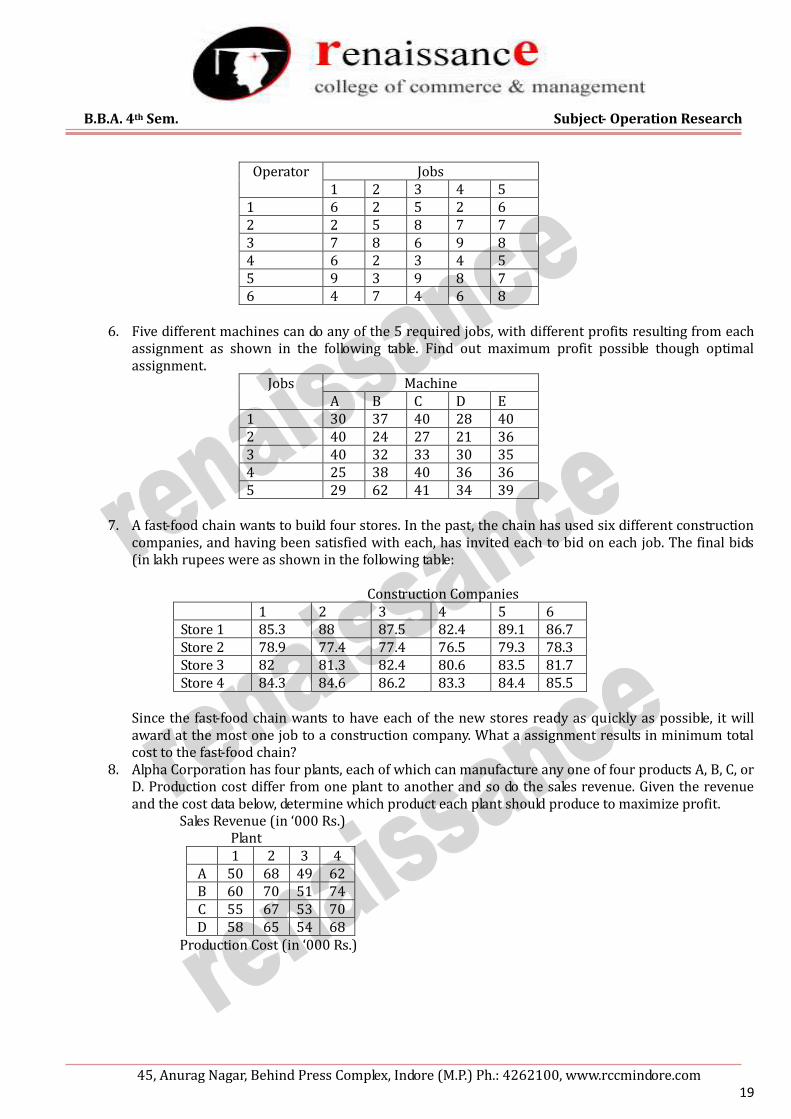
Operator Jobs 1 2 3 4 5
1 6 2 5 2 6 2 2 5 8 7 7 3 7 8 6 9 8 4 6 2 3 4 5 5 9 3 9 8 7 6 4 7 4 6 8
6. Five different machines can do any of the 5 required jobs, with different profits resulting from each
assignment as shown in the following table. Find out maximum profit possible though optimal assignment.
Jobs Machine A B C D E
1 30 37 40 28 40 2 40 24 27 21 36 3 40 32 33 30 35 4 25 38 40 36 36 5 29 62 41 34 39
7. A fast-food chain wants to build four stores. In the past, the chain has used six different construction
companies, and having been satisfied with each, has invited each to bid on each job. The final bids (in lakh rupees were as shown in the following table:
Construction Companies 1 2 3 4 5 6 Store 1 85.3 88 87.5 82.4 89.1 86.7 Store 2 78.9 77.4 77.4 76.5 79.3 78.3 Store 3 82 81.3 82.4 80.6 83.5 81.7 Store 4 84.3 84.6 86.2 83.3 84.4 85.5
Since the fast-food chain wants to have each of the new stores ready as quickly as possible, it will award at the most one job to a construction company. What a assignment results in minimum total cost to the fast-food chain?
8. Alpha Corporation has four plants, each of which can manufacture any one of four products A, B, C, or D. Production cost differ from one plant to another and so do the sales revenue. Given the revenue and the cost data below, determine which product each plant should produce to maximize profit.
Sales Revenue (in ‘000 Rs.) Plant
1 2 3 4 A 50 68 49 62 B 60 70 51 74 C 55 67 53 70 D 58 65 54 68
Production Cost (in ‘000 Rs.)

B.B.A. 4th Sem. Subject- Operation Research
45, Anurag Nagar, Behind Press Complex, Indore (M.P.) Ph.: 4262100, www.rccmindore.com 20
Plant
9. The marketing director of a multi-unit company is faced with a problem of assigning 5 senior managers to six zones. From past experience he knows that the efficiency percentage judged by sales, operating costs etc. depends on manager-zone combination. The efficiency of different managers is given below:
Zones
Managers
Find out which zone will be managed by a junior manager due to non-availability of a senior manager.
10. A company has 4 machines to do 3 jobs. Each job can be assigned 1 & only 1 machine. The cost of each job on each machine is given in the following table:
Jobs Machine W X Y Z
A 18 24 28 32 B 8 13 17 18 C 10 15 19 22
What are the job assignments which will minimize the cost?
11. In the modification of a plant layout of a factory four new machines M1, M2, M3 and M4 are to be installed in a machine shop. There are five vacant places A, B, C, D and E available. Because of limited space, machine M2 cannot be placed at C and M3 cannot be placed at A. The cost of locating a machine at a place (in ’00 Rs.) is as follows:
Location Machine Find the optimal assignment schedule.
12. Consider a problem of assigning 4 clerks to 4 tasks. The time (hours) required to complete the tasks are given below:
1 2 3 4 A 49 60 45 61 B 55 63 45 49 C 52 62 49 68 D 55 64 48 66
I II III IV V VI A 73 91 87 82 78 80 B 81 85 69 76 74 85 C 75 72 83 84 78 91 D 93 96 86 91 83 82 E 90 91 79 89 69 76
A B C D E M1 9 11 15 10 11 M2 12 9 - 10 9 M3 - 11 14 11 7 M4 14 8 12 7 8
B.B.A. 4th Sem. Subject- Operation Research
45, Anurag Nagar, Behind Press Complex, Indore (M.P.) Ph.: 4262100, www.rccmindore.com 21
Clerk Task
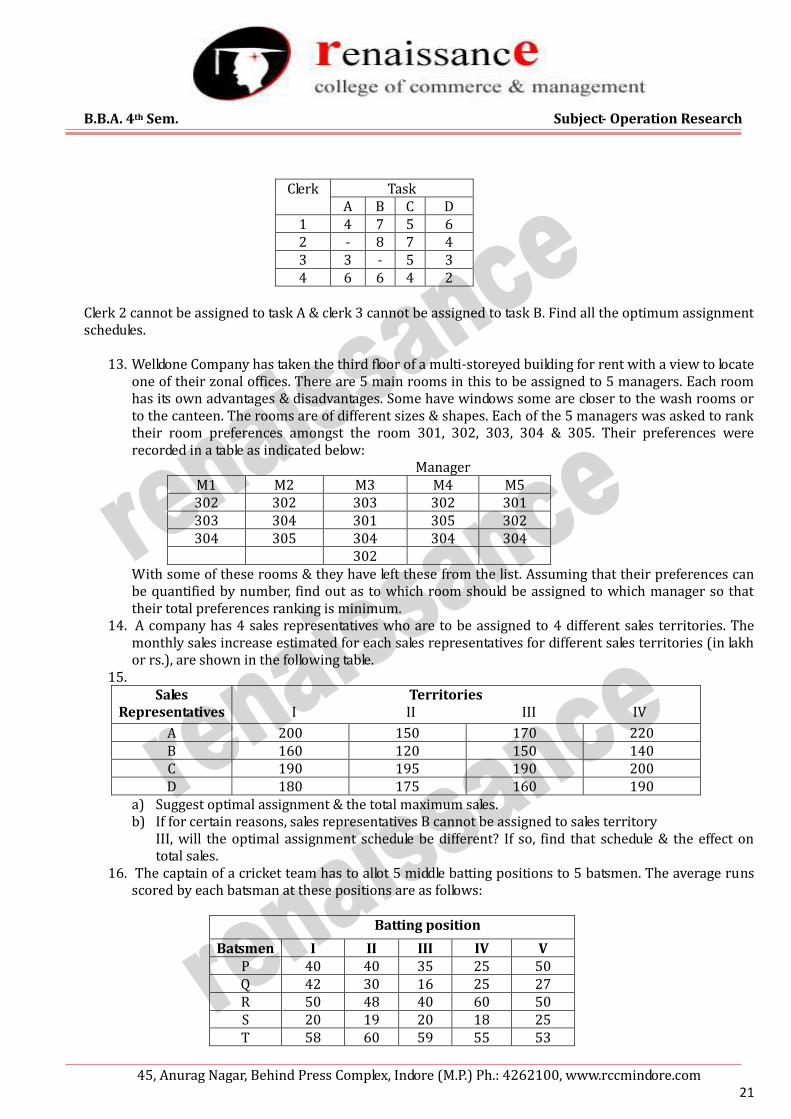
A B C D 1 4 7 5 6 2 - 8 7 4 3 3 - 5 3 4 6 6 4 2
Clerk 2 cannot be assigned to task A & clerk 3 cannot be assigned to task B. Find all the optimum assignment schedules.
13. Welldone Company has taken the third floor of a multi-storeyed building for rent with a view to locate one of their zonal offices. There are 5 main rooms in this to be assigned to 5 managers. Each room has its own advantages & disadvantages. Some have windows some are closer to the wash rooms or to the canteen. The rooms are of different sizes & shapes. Each of the 5 managers was asked to rank their room preferences amongst the room 301, 302, 303, 304 & 305. Their preferences were recorded in a table as indicated below:
Manager M1 M2 M3 M4 M5 302 302 303 302 301 303 304 301 305 302 304 305 304 304 304
302 With some of these rooms & they have left these from the list. Assuming that their preferences can be quantified by number, find out as to which room should be assigned to which manager so that their total preferences ranking is minimum.
14. A company has 4 sales representatives who are to be assigned to 4 different sales territories. The monthly sales increase estimated for each sales representatives for different sales territories (in lakh or rs.), are shown in the following table.
15. Sales
Representatives Territories
I II III IV
A 200 150 170 220 B 160 120 150 140 C 190 195 190 200 D 180 175 160 190
a) Suggest optimal assignment & the total maximum sales. b) If for certain reasons, sales representatives B cannot be assigned to sales territory
III, will the optimal assignment schedule be different? If so, find that schedule & the effect on total sales.
16. The captain of a cricket team has to allot 5 middle batting positions to 5 batsmen. The average runs scored by each batsman at these positions are as follows:
Batting position
Batsmen I II III IV V P 40 40 35 25 50 Q 42 30 16 25 27 R 50 48 40 60 50 S 20 19 20 18 25 T 58 60 59 55 53

B.B.A. 4th Sem. Subject- Operation Research
45, Anurag Nagar, Behind Press Complex, Indore (M.P.) Ph.: 4262100, www.rccmindore.com 22
a) Find the assignment of batsmen to positions which would give the maximum number of runs. b) Find the assignment of batsmen to positions which would give the maximum number of runs.
Batting Positions I II III IV V Average Runs 45 52 38 50 49
Is added to the team, should he be included to play in the team? If so, who will be replaced by him? Since number of runs increases by including batsmen U, he should be included in the team. Batsmen S will e replaced by him.
17. A firm produces 4 products. There are 4 operators who are capable of producing any of these 4 products. The firm records 8 hours a day & allow 30 minutes for lunch. The processing time (min.) & the profit for each of the products are given below:
Products
Operator A B C D 1 15 9 10 6 2 10 6 9 6 3 25 15 15 9 4 15 9 10 10
Profit (Rs)/unit
8 6 5 4
Find the optimal assignment of products to operators.
18. A company has 4 territories open & 4 salesmen available for an assignment. The territories are not equally rich in their sales potential. It is estimated that a typical salesmen operating in each territory would bring in the following annual sales:
Territory I II III IV Annual sales (Rs) 126000 105000 84000 63000
The 4 salesmen also differ in their ability. It is estimated that, working under the same conditions, their yearly sales would be proportionately as follows:
Salesmen A B C D Proportion 7 5 5 4
If the criterion is maximum expected total sales, the intuitive answer is to assign the best salesmen to the richest territory, the next best salesmen to the second richest, & so on; verify this answer by assignment technique.
19. A small garment making unit has 5 tailors stitching 5 different types of garments. All the 5 tailors are capable of stitching all the 5 types of garments. The output per day per tailor & the profit (Rs) of each types of garment are given below:
Tailors
Garments 1 2 3 4 5
A 7 9 4 8 6 B 4 9 5 7 8 C 8 5 2 9 8 D 6 5 8 10 10 E 7 8 10 9 9
PROFIT (Rs)/ garment 2 3 2 3 4

B.B.A. 4th Sem. Subject- Operation Research
45, Anurag Nagar, Behind Press Complex, Indore (M.P.) Ph.: 4262100, www.rccmindore.com 23
a) Which type of garment should be assigned to which tailor in order to maximize profit. Assuming that there are no other constraints?
b) If tailor D is absent for a specified period and no other substitute is available, what should be the optimal assignment?
20. A solicitors firm employs typists on hourly piece-rate basis for their work. There are 5 typists & their charges & speeds are different. According to an earlier understanding only 1 job is given to 1 typist & the typist is paid for full hour even if he works for a fraction of an hour. Find the least cost allocation for the following data:
Typist Rate/hr.(Rs.) No. of pages typed/hr A 5 12 B 6 14 C 3 8 D 4 10 E 4 11
Job No. of Pages
P 199 Q 175 R 145 S 298 T 178
21. ABC airline, operating 7 days a week, has given the following time table. The crews must have a
minimum of 5 hours between flights. Obtain the pairing that minimize lay-over time away from home. For any given pairing the crew will be based at the city that results the smallest lay-over: Hyderabad - Delhi Delhi - Hyderabad
Flight No. Departure Arrival Flight No. Departure Arrival A1 6AM 8AM B1 8AM 10AM A2 8AM 10AM B2 9AM 11AM A3 2PM 4PM B3 2PM 4PM A4 8PM 10PM B4 7PM 9PM

B.B.A. 4th Sem. Subject- Operation Research
45, Anurag Nagar, Behind Press Complex, Indore (M.P.) Ph.: 4262100, www.rccmindore.com 24
Unit – IV Class: BBA IV Sem. Sub: Operation Research
REPLACEMENT MODEL When some items involved in performing a job become less effective or useless due to sudden or gradual deterioration in their efficiency, failure or breakdown. Although systematic and regular maintenance can reduce the deterioration but cannot eliminate it completely and thus the operating inferiority goes on increasing with time which is reflected by increased maintenance costs, higher frequency of breakdown etc.
NEED FOR REPLACEMENT Obsolescence: It is one of the major causes of replacement. Obsolescence is when an existing
technology becomes outdated due to availability of new, better or more efficient technology. Changes in requirements of the firm: Change in the demand pattern of customers i.e. increase in
demand of a product also leads to replacement of machinery. For ex: firm shifting from batch production to continuos production.
Expensive maintenance: When the condition of items is really bad and they have to be repaired again and again it is better to get them replaced.
Failure of equipment: When the equipment fails due to some accident or other reason an stops working then in that ease the machinery needs to be replaced.
Time factor: When the items are expected to fail shortly as the time passes, it is essential to plan for its replacement.
FAILURE MACHANISM OF ITEMS Decreased efficiency of complete breakdown collective called failure may be either gradual or all of a sudden. Failure can be divided into two main categories: 1) Gradual Failure: The failure mechanism is termed as gradual or progressive if its efficiency
deteriorates with time. This happens due to: Increase in maintenance cost as time passes. Decrease in productivity of items. Decrease in resale value of items with time.
2) Sudden Failure: When the items ultimately fail after a period of time of use then it is termed as sudden failure. The probability distribution of these items can be progressive or random.
Progressive Failure: The probability of failure increase with the increase in the life of an item. Example, electric bulbs, tubes etc.
Retrogressive Failure: The probability of failure is more in early life on the items and probability of failure decreases with tie. Example, aircraft engines etc.
Random Failure: When items fail due to some random causes but not due to age i.e. items fail without aging effect. Example, vaccum tubes, electronic items etc.
CATEGORIES OF REPLACEMENT ROBLE The various categories of replacement problems are as follows: Replacement of items that deteriorate with time (fail gradually) Replacement of items that fail suddenly and completely
Replacement of items that deteriorate with time
Generally cost of maintenance and repair always increases with time and situation reaches when the maintenance cost becomes so high that replacing the equipment with a new one becomes more economical then its effective working life is utilized. Case1: When maintenance cost increases with time and value of money is constant The aim is to determine the optimum replacement age of an equipment whose maintenance cost increases with time and the value of money remains constant during that period. The following steps are followed in solving such a problem: Col 1: Write the number of years in the first column

B.B.A. 4th Sem. Subject- Operation Research
45, Anurag Nagar, Behind Press Complex, Indore (M.P.) Ph.: 4262100, www.rccmindore.com 25
Col 2: Write the maintenance cost to be incurred against the corresponding years (given in question) Col 3: Calculate cumulative maintenance cost Col 4: Write the purchase price of the machinery Col 5: Write the scrap value Col 6: Fins the value of C-S (Cost-Scrap Value) Col 7: Calculate Total Cost (Total Cost=C-S + Cum Maintenance Cost) Col 8: Calculate Average Cost (AC=TC/n where, TC means Total Cost and represents number of year) Note: It is assumed that by default Maintenance/Running/ Operating Cost is incurred in the beginning of the year and Scrap Value is realized at the end of the year. Machinery should be replaced in the year where the average cost is minimum. Case 2: When maintenance Cost increases with time and time value of money is also considered Not considering the time factor leads to various errors in decision making and considering time value of money overcomes all these errors. The following steps are followed in solving such a case: Col 1: Write the number of years in first column Col 2: write the maintenance cost incurred in each year Col 3: Calculate the Present Value Factor ( 1/1 +r)n NOTE:
Whenever it is given that the maintenance cost is incurred in the beginning of the year we will star Present Value Factor from 1
Whenever it is given that the cost is incurred at the end of the year we will start Present Value Factor by first value of Present value factor
Whenever it is given that the cot is incurred at the mid of the year, we will follow these 3 steps: a. Find out the first value of PVF let’s call it x. b. Find the square root of ‘x’ (Vx) c. Multiply all the mid-year cost by Vx so as to convert them into the cost incurred at the beginning
of the year. Col 4: Calculate Discounted Maintenance Cost (Col 2 * Col 3) Col 5: Calculate Cumulate Discounted Maintenance Cost Col 6: Write the Cost of Machinery (C) Col 7: Write the Scrap Value of Machinery (S) Col 8: Write the Present Value Factor of Scrap Value Col 9: Calculate Discounted Scrap Value Col 10: Calculate value of C-DS (Cost –Discounted Scrap Value) Col 11: Calculate Total Cost (Total Cost = Cost – Discounted Scrap Value + Cumulative Maintenance Cost) Col 12: Calculate Cumulative Present Value Factor Col 13: Calculate Average Cost (AC = TC/n where, TC is Total Cost and ‘n’ represents number of year) Machinery should be replaced in the year where the average cost is minimum.
Replacement of items that fail suddenly and completely Some items fail all of a sudden which may result in complete breakdown of the system. These items may be expensive to be replaced individually. So we have to make a policy of replacement for items that fail suddenly. Two types of replacement policies are considered with the situations of complete failure of items. Single Unit Replacement or Individual Replacement Policy: Under this policy an item is replaced
immediately after its failure. Group Replacement Policy: When a system consists of large number of low cost items which will fail
as the time passes then in such a case to replace all the items at the same time at fixed internals is beneficial than replacing an individual item. This policy is called Group Replacement Policy.
Under this policy, items are replaced individually as and when they fail and in group at the end of some suitable time period without waiting for their failure.

B.B.A. 4th Sem. Subject- Operation Research
45, Anurag Nagar, Behind Press Complex, Indore (M.P.) Ph.: 4262100, www.rccmindore.com 26
Rules of Replacement Replace the group of items at the end of the period if the cost of individual replacement for the
tth eriod is greater than the average cost per period through the end of ‘t’ periods. Do not replace the group of items at the end of tth period if the cost of individual replacement for
the tth period is less than average cost per period through the end of ‘t’ periods.
PRACTICE SHEET Q.1) A firm is considering placement of a machine whose cost price is Rs. 13,200 and the scrap value id Rs. 300. The running costs are found fro the past experience to be as follows:
Year 1 2 3 4 5 6 7 8 Running
Costs (Rs)
300 600 900 1300 1900 2600 3300 4100
When should the machine be replaced? (Ans: Machinery should be replaced at the end of 7th year as the AC=Rs 3,400) Q.2) A auto owner finds from his past record that the running cost per year and resale price of an auto whose purchase price is Rs. 60,000 are:
Year 1 2 3 4 5 6 7 8 Running
Costs (Rs)
10000 12000 14000 18000 23000 28000 34000 40000
Resale Price (Rs)
30000 15000 7500 3750 2000 2000 2000 2000
Determine at what age is it’s replacement de. (Ans: The auto should be replaced at the ens of 5th year as the AC=Rs.27,000) Q.3) A taxi owner estimates from his past record that the cost per year for operating an old taxi whose purchase price Rs. 60,000 are as given below:
Year 1 2 3 4 5 Running Cost (Rs)
10000 12000 15000 18000 20000
From 6th year the operating cost=6000K, where K=6,7,8,9,10, K=age in years. If the resale value decreases by 10% of purchase price every year, what is the best replacement policy? Value of money does not changes with time. (Ans: The taxi should be replaced at the end of 1st year as the AC is minimum) Q.4) Cost of a new machine is Rs. 5,000. Maintenance cost for nth year is given by Rn=500 (n-1), n=1,2,………. Interest rate (or discount rate) is 5%. When shall the machine be replaced? (Ans: The machine should be replaced after the 5th year) Q.5) Purchase price of a machine in Rs. 3000 and its running costs are given below. If the money costs 10%, find at what age the machine should be replaced?
Year 1 2 3 4 5 6 7 Running
Costs (Rs) 500 600 800 1000 1300 1600 2000
The salvage value of the machine is Rs. 2000 and Rs. 1000 in the first two years respectively and thereafter it is nil. (Ans: The machine should be replaced at the end of 5th year as the AC is minimum)

B.B.A. 4th Sem. Subject- Operation Research
45, Anurag Nagar, Behind Press Complex, Indore (M.P.) Ph.: 4262100, www.rccmindore.com 27
Q.6) Following mortality rates have been observed for a certain type of fuses: Week 1 2 3 4 5
% failing by the end of
week
5 15 35 75 100
There are 1000 fuses in use and it costs Rs.5 to replace an individual fuse. It all were replaced simultaneously it costs Rs. 1.25 per fuse. What replacement policy for group and individual shall be followed? (Ans: The company should go for group replacement and should replace all fuses after 2nd week) Q.7) A computer contains 10000 resistors. When any one of the resistor fails it is replaced. The cost of replacing a single resistor is Re. 1 only. If all the resistors are replaced at the same time, the cost per resistor would be reduced to 35 paisa. The present surviving are given below in the table:
Month 0 1 2 3 4 5 6 %
Surviving by end of
month
100 97 90 70 30 15 0
What is the optimum replacement policy? (Ans: As the average minimum cost is in the 3rd week, it optimal to have a group replacement after every three months.) Q.8) Solve the problem for individual replacement and group replacement of bulbs: Week 1 2 3 4 5 % of bulbs failing by that week
8 16 40 75 100
There are 1000 bulbs in use and it costs Rs.5 for individual bulbs. Cost in group replacement is s. 1.25 per bulb. Which is the best policy? (Ans: The group replacement should be done after every second week) Q.9) A group of process plant in an oil refinery are filled with values. Over a period of time the failure pattern of these 400 values has been observed and it is as follows:
Months 1 2 3 4 5 6 7 8 Failures 8 20 48 104 120 56 32 12
Rs. 100 for individual replacement cost/valve and Rs. 50 for group replacement cost/valve. Find which option to choose. Q.10) A firm is using a machine whose purchase price is Rs. 1,30,000. The installation charges amount to Rs. 36,000 and the machine and the machine has a scrap value of only Rs.16,000. The maintenance cost in varios years is given in the following table: Year 1 2 3 4 5 6 7 8 9 Maintenance Cost
2500 7500 10000 15000 21000 29000 40000 48000 60000
The firm wants to determine after how many years should the machine be replaced on economic consideration, assuming that the machine replacement can be done only at the year ends. (Ans: Machine should be replaced at the end of 6th year) Q.11) The item owner finds from its past records that the maintenance cost and resale price per year f an item whose purchase price is Rs.24,000 are given below:
Year 1 2 3 4 5 6 7 8 Maintenance
Cost 300 3900 5100 6000 8700 11400 14400 18000
Resale Price 12000 6000 3600 1800 1500 1200 1200 1200 Determine at what time it is profitable to replace the item

B.B.A. 4th Sem. Subject- Operation Research
45, Anurag Nagar, Behind Press Complex, Indore (M.P.) Ph.: 4262100, www.rccmindore.com 28
(Ans: The item should be replaced after 5 years) Q.12) A truck is priced at Rs.60000 and running costs are estimated at Rs. 6000 for each of the first four years, increasing by Rs. 2000 per year in the fifth and subsequent years. If one is worth 10% per annum, when should the truck be replaced? Assume that the truck will eventually be sold for scrap at a negligible price . (Ans: The truck should be replaced after 9 years) Q.13) A scooter costs Rs.6000 when new. The maintenance cost and the scrap value at the end of the ear is given in the following table. It is assumed that the maintenance cost is incurred at the mid of the year and the money costs 10%. When should the machinery be replaced?
Year 1 2 3 4 5 6 7 Maintenance Cost(Mid of
the Year)
1200 1400 1600 1800 2000 2400 3000
Scrap Value (End of the
Year)
4000 2666 2000 1500 1000 600 600
Q.14) An equipment contains 1600 units of a particular component. Failure of any of them stops the functioning of that equipment and hence the failed component needs immediate replacement when the failure occurs. The mortality pattern of these components based on the data is as follows:
Month 1 2 3 4 5 6 % failure by month end
5 25 45 70 85 100
The cost of component replaced under the presently followed individual replacement policy is Re. 1 each and the cost of disruption is Rs. 9 per failure. If all the components are replaced concurrently the cost per replacement including disruption cost works out to be Rs.7. Decide whether it would be worth while to switch over group replacement policy from the existing individual replacement policy and, if so, find the optimal replacement period and cost. (Ans: Individual replacement is better) Q.15) The following mortality rates have been observed for a certain type of light bulbs: End of the
week 1 2 3 4 5 6
Probability of failure to
date
0.09 0.25 0.49 0.85 0.97 1.00
The number of bulbs in use is 1000. The cost of replacement of a single bulb is Rs. 3.00 and average cost of a bulb in group replacement is Rs. 0.70. Solve the problem for individual and group replacement.
B.B.A. 4th Sem. Subject- Operation Research
45, Anurag Nagar, Behind Press Complex, Indore (M.P.) Ph.: 4262100, www.rccmindore.com 29
UNIT-V LOCATION & LAYOUT OF FACILITIES
FACILITY LOCATION What do you mean by Facility Location? In simple words plant Location or Facility Location means the people where the plant or the factory has to be established. Location plays a very important role in the success of any firm. When does a Location Decision arise? The main reasons are: When a new facility is to be established. The facility or plant operations and subsequent expansion are restricted by a poor site, thereby
necessitating the setting up of the facility at a new site. The growing volume of business makes it advisable to establish additional facilities in new
territories. Decentralization and dispersal of industries reflected in the Industrial Policy resolution so as to
achieve a overall development of a developing country, would necessitate a location decision at a macro level.
It could happen that the original advantages of the plant have been outweighed due to new developments.
New economic, social legal or political factors could suggest a change of location of the existing plant. General Procedure for making location decisions: The general procedure for making location decisions usually consists of the following steps:
1. Determine the criteria that will be used to evaluate location alternatives such as increased revenues and service.
2. Identify factors that are important such as location of markets or raw materials. 3. Develop location alternatives. 4. Evaluate alternatives and make a selection.
FACTORS AFFECTING LOCATION DECISIONS
There are many factors which can influence location decisions. It often happens that one or a few factors may be so important that they may dominate the location decision. The objective of industrial organization is to minimize the cost of production and to achieve progress in that industry. The success of business depends on the process of organization and planning. A) PRIMARY FACTORS: Supply of Raw Materials: Nearness to the source of supply of raw materials is very important and it
should be kept in mind that there s adequate supply of raw material. Nearness to Market: Every firm wants to sell its product in the market. Nearness to market is
important from the view of his control over the market. Transport facilities: Speedy transport facilities are needed for the regular and timely supply of raw
materials at low cost and for transporting finished products on time to the market. Supply of Labour: The supply of labour at low cost is important. Labour costs are important therefore,
nearness to the source of labour is important. Power: Power is necessary for the process of production and for transporting finished goods and raw
materials. Power storages lead to tremendous losses due to stoppage of machinery. Therefore, industries must have a sufficient and regular supply of power if continuity in production is to be maintained and if industries are to operate at full capacity.
Supply of Capital: Industries require capital for initial promotion and expansion. Therefore, a capital market must be developed in industrial centers.
B) SECONDARY FACTORS:
Natural Factors: Land, water, climate etc. are some natural factors which are important some industries like cotton textiles, sugar etc.

B.B.A. 4th Sem. Subject- Operation Research
45, Anurag Nagar, Behind Press Complex, Indore (M.P.) Ph.: 4262100, www.rccmindore.com 30
Political Factors: The government’s policy of licensing and encouraging the development of industries in underdeveloped regions determines the location of industries.
Government Subsidies and Facilities: The government may give subsidies on land and facilities are lesser rates to develop the back ward areas.
Historical and Religious Factors: The industrialists should keep in ind all the historical and religious factors elated to the location where they are planning to establish industry.
Miscellaneous Factors: The following factors also affect the location of the industrial unit. o Disposal of waters. o Availability of fire-fighting facilities. o Sufficient water supply, if water is consumed in large quantities in the production process. o Ecological and environmental considerations. o Regional aspirations of people and their political satisfaction.
Factors Important deciding Location of Cinema Hall:
City Proximity. Nearness of Market Transportation Facility Free from noise pollution Sufficient space for parking
Factors Important deciding Location of Airport:
City Proximity Availability of commercial facilities like banks etc. Transportation Facility Favorable Climate Sufficient parking space Government Policies
CPM (Critical Path Method) CPM was developed by Du Pont and the emphasis was on the trade-off between the cost of the project and its overall completion time (e.g. for certain activities it may be possible to decrease their completion times by spending more money – how does this affect the overall completion time of the projet?) Path - A connected sequence of activities leading from the starting event to the ending event Critical Path - The longest path (time): determines the project duration Critical Activities
All of the activities that make up the critical path Forward Pass: Earlier Start Time (ES) - Earlier time an activity can start - ES = maximum EF of immediate predecessors Earlier finish time (EF) - Earliest time an activity can finish - Earliest start plus activity time EF=ES + t
Backward Pass: Latest Start Time (LS) Latest time an activity can start without delaying critical path time LS=LF – t Latest finish time (LF)
B.B.A. 4th Sem. Subject- Operation Research
45, Anurag Nagar, Behind Press Complex, Indore (M.P.) Ph.: 4262100, www.rccmindore.com 31
Latest time an activity can be completed without delaying critical path time LS=minimum LS of immediate predecessors CPM Analysis:
Draw the CPM network Analyze the paths through the network Determine the float for each activity
- Compute the activity’s float Float = LS – ES = LF – EF
- Float is the maximum amount of time that this activity can be delay its completion before it becomes a critical activity, i.e. delays completion of the project Find the critical path is that sequence of activities and events where there is no “slack” i.e. Zero
slack - Longest path through a network
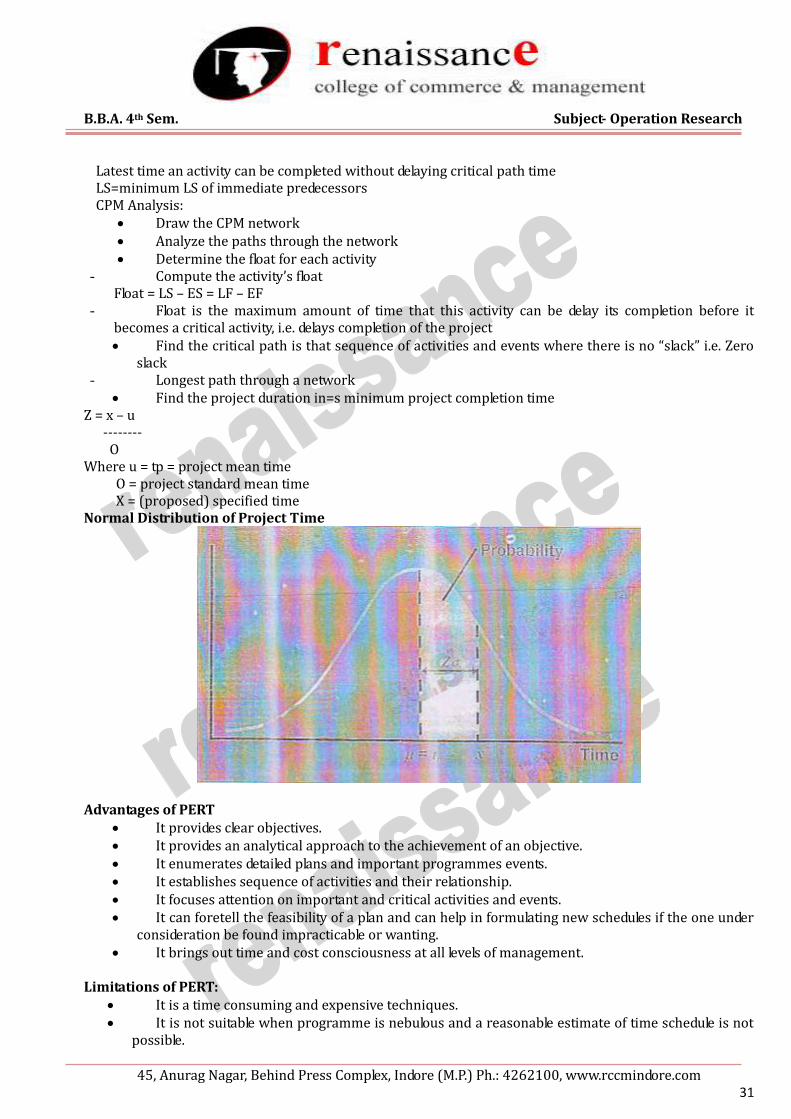
Find the project duration in=s minimum project completion time Z = x – u -------- O Where u = tp = project mean time O = project standard mean time X = (proposed) specified time Normal Distribution of Project Time
Advantages of PERT
It provides clear objectives. It provides an analytical approach to the achievement of an objective. It enumerates detailed plans and important programmes events. It establishes sequence of activities and their relationship. It focuses attention on important and critical activities and events. It can foretell the feasibility of a plan and can help in formulating new schedules if the one under
consideration be found impracticable or wanting. It brings out time and cost consciousness at all levels of management.
Limitations of PERT:
It is a time consuming and expensive techniques. It is not suitable when programme is nebulous and a reasonable estimate of time schedule is not
possible.

B.B.A. 4th Sem. Subject- Operation Research
45, Anurag Nagar, Behind Press Complex, Indore (M.P.) Ph.: 4262100, www.rccmindore.com 32
The expected time and the corresponding variance are only estimated values. Two methods are used for Network Analysis:
PERT CPM
PERT PERT was developed by the US navy for the planning and control of the Polaris missile program and the emphasis was on completing the program in the shortest possible time. In addition PERT had the ability to cope with uncertain activity completion times (e.g. for a particular activity the most likely completion time is 4 weeks but it could be anywhere between 3 weeks and 8 weeks). Major Features of PERT:
All individual tasks should be shown in a network. Vents are shown by circles. Each circle represents an event-a subsidiary plan whose completion can be measured at a given time.
Each arrow represents an activity-the time consuming element of a programme, the effort that must be made between events.
Time estimates in PERT: In PERT for each activity, three time estimates are made. There estimates are: Most Likely Time: The time which I taken most frequently by the activity. Optimistic Time: The time by which activity can be completed, if everything went well. Pessimistic Time: The time by which the activity will get completed even under adverse
conditions.
PERT Analysis: Draw the network. Analyze the paths through the network and find the critical path. The length of the critical path is the mean of the project duration probability distribution which is assumed to be normal The standard deviation of the project duration probability distribution is computed by adding the variances of the critical activities (all of the activities that make up the critical path) and taking the square root of that sum Probability computations can now be made using the normal distribution table. Probability Computation: Determine probability that project is completed within specified time. Indicate ACTIVITY a time consuming effort that is required to perform a part of the work. Nodes: A node is represented by a circle - Indicate EVENT, a point in time where one or more activities start and/or finish. - Activity
o A task or a certain amount of work required in the project. o Requires time to complete o Represented by an arrow
- Dummy Activity

B.B.A. 4th Sem. Subject- Operation Research
45, Anurag Nagar, Behind Press Complex, Indore (M.P.) Ph.: 4262100, www.rccmindore.com 33
o Indicates only precedence relationships o Does not require any time of effort
- Event o Signals the beginning or ending of an activity o Designates a point in time o Represented by a circle (node)
- Network o Shows the sequential relationships among activities using nodes and arrows Activity-on-node (AON) Nodes represent activities, and arrows show precedence relationship Activity-on-arrow (AOA) Arrows represent activities and nodes are events for points in time AOA Project Network for House:
AON Project network for House:
a situation where n jobs must be processed by two machines, M1 followed M2. The processing times of all jobs on M1 and M2 are known and deterministic. It is required to find that sequence which minimize the time to complete all jobs. Johnson developed an algorithm that can be used to obtain an optimal sequence in such a case Johnson’s algorithm is summarized below:
1) List all processing times of all jobs on machine M1 and M2. 2) Scan through al processing times for all jobs. Locate the minimum processing time. 3) If the minimum processing time is on M1, place the corresponding job last (as late as possible) in
the sequence. 4) Eliminate the assigned jobs (already placed in the sequence as a result of step3) and repeat steps
2 and 3 until all jobs are sequenced.
NETWORK ANALYSIS Network analysis is the general name given to certain specific techniques which can be used for the planning, management and control of projects.

B.B.A. 4th Sem. Subject- Operation Research
45, Anurag Nagar, Behind Press Complex, Indore (M.P.) Ph.: 4262100, www.rccmindore.com 34
What is a project? A project is a temporary endeavor involving a connected sequence of activities and a range of resources, which is designed to achieve a specific and unique outcome and which operates within time, cost and quality constraints and which is often used to introduce change. Characteristics of a project:
A unique, one-time operational activity or effort Requires the completion of a large number of interrelated activities Established to achieve specific objective Resources, such as tie and/or money, are limited Typically has its own management structure Need leadership Examples of Projects: Constructing houses, factories, shopping malls, athletic stadium or arenas Developing military weapons systems, aircrafts, new ships Launching satellite systems Constructing oil pipelines Developing and implementing new computer systems Planning concert, football games or basketball tournaments Introducing new products into market What is Project Management?
The application of a collection of tools and techniques to direct the use of diverse resources towards the accomplishment of a unique, complex, one time task within time, cost and quality constraints.
Its origins lie in World War II, when the military authorities used the techniques of operational research to plan the optimum use of resources.
One of these techniques was the use of networks to represent a system of related activities Project Network
Network analysis is the general name given to certain specific techniques which can be used for the planning, management and control of projects
Use of nodes and arrows Arrows: An arrow leads from tail event to head event directionally
Features of Batch Production Batch production normally is done employing a process layout. Here similar machines or equipment are in departments and different jobs will follow their own route depending on requirements advantages and disadvantages of process layouts are as follows: Advantages of Batch Production:
Better utilization of achiness is possible; consequently fewer machines are required. A high degree o flexibility exists Comparatively low investment in machies is needed. Specialized supervision is possible.
Disadvantages of Batch Production:
Since longer and irregular flow line result, material handling is more expensive. Production planning and control system are more involved. Total production time is usually longer.

B.B.A. 4th Sem. Subject- Operation Research
45, Anurag Nagar, Behind Press Complex, Indore (M.P.) Ph.: 4262100, www.rccmindore.com 35
Space and capita are tied up by work in process. Because of diversity of job in specialized departments, higher grades of skills are required.
JOB SHOP PRODUCTION
Job shop characterizes a situation where a variety of jobs is handled, each job being different from the previous one. There is slight difference in job shop production and batch production. In batch production there is generally a continuous demand for products but owing to a higher rate of production as compared to the rate of demand, production is undertaken in batches. In job shop, both the nature and the demand of jobs are unpredictable. A job shop typically consists of general purpose machines clubbed into different departments. Planning for the job shop essentially involves deciding the order or priority for jobs waiting to be processed at each machine to achieve the desired objectives. Job One Machine Case: The case when a number of jobs is to be processed on a single facility occurs quite often in practice such as a number of cars to be serviced at service station, number of patients to be treated by a doctor, etc. in all such cases, we as human beings are used to the first come first served concept. But in real manufacturing, we use various different rules. These are:
Shortest Processing Time (SPT): Sequencing the job in a way that the job with least processing time is picked up first followed by the one with the next smallest processing time and so on is referred to as SPT sequencing.
Longest Processing Time (LPT): sequencing the jobs in a way that the job with highest processing time is picked up first followed by the one with the next highest processing time and so on is referred to LPT sequencing.
Earliest Due Date (EDD): Sequencing the jobs in a way that the jobs with earliest due date is picked up first followed by the one with the next earliest due date and so on is referred to as EDD sequencing.
First Come First Served (FCFS): Sequencing the jobs in a way that the job that is done as soon as it is felt i.e. jobs are done in the order of their occurrence is called as FCFS sequencing.
Least Slack (LS): Sequencing the jobs in ascending order of their slack is Least Slack sequencing. Jobs 2 Machines Case: Q.1) The lifetime of a particular product is normally distributed with mean of 500 hours and standard deviation of 100 hours. What percentage of product will have life: a) Less than 400 hours b) More than 400 hours c) Less than 600 hours Q.2) Lifetime of LCD T.V picture tubes is normally distributed with mean of 10 years and standard deviation of 3 years. How much picture tubes will have life: a) less than 7 years b) More than 7 years c) More than 13 years d) Between 7-13 years Q.3) A firms wants to determine an ideal warranty policy for its microprocessor chips. The lifetime of microprocessor chips is normally distributed with mean of 5 years, standard deviation 2 years. At present the firm is not providing any warranty and is able to sell 1000 microprocessor chips at a price of Rs. 10,000. The cost of manufacture one microprocessor chip is Rs. 6000 and repair cost per chip is Rs. 3000. Evaluate the following warranty decision: a) No warranty b) If it provides 3 years warranty, its sales will increase by 50% c) If it provides 5 years warranty sales will increase 100% d) If 7 years warranty is provided sales will increase by 200% (For Z=1 value of normal distribution curve=0.3413) Q.4) Lifetime of a mobile phone is normally distributed with mean of 7 years and standard deviation of 3 years. Selling price per phone Rs. 6000 and the cost to produce each fridge is Rs. 4000. Firm is considering following guarantee options:

B.B.A. 4th Sem. Subject- Operation Research
45, Anurag Nagar, Behind Press Complex, Indore (M.P.) Ph.: 4262100, www.rccmindore.com 36
Guarantee Options Unit Sold No Guarantee 2000
4 Years Guarantee 3000 7 Years Guarantee 4000
10 Years Guarantee 6000 Q.5) ABC color television manufacturing company is evaluating four warrantee option on its television sets. The options are: a) Provides 5 years warrantee increase sales by 50% b) Provides 7 years warrantee increase sales by 100% c) Provides 9 years warrantee increase sales by 200% The company is not providing any warrantee at present and sells 1000 T.V sets per month. Cost/T.V set=Rs. 10000 Selling price/Set=Rs. 12000 Repair Cost/set=Rs. 4000 The life T.V set is normally distributed with means of 7 years and S. d of 2 years. Suggest which option should be selected. Q.6) The lifetime of a color T.V is normally distributed with a mean of 7.8 years and a standard deviation of 2 years. a) What is the probability that a picture tube will last more than 10 years? b) Brief the firm guarantees the tube for 2 years what percentage of T.V sets sold will have to be replaced because of failures in the picture tubes. c) If the firm is willing to replace only 1% of the picture tubes, what will be the warrantee period? Q.7) Shown below are the due date and processing time remaining for five jobs that were assigned a letter as they arrived. Sequence the jobs by priority rules (a) FCFS (b) EDD (c) LS (d) SPT (LPT) (e) Critical Ratio
Jobs Due Date (Days) Process Time (Days) A 8 7 B 3 4 C 7 5 D 9 2 E 6 6
Q.8) The process times for the five jobs A, B, C, D, E and the due date of the jobs are given below. Schedule the jobs according to various rules:
Jobs Due Date (Days) Process Time (Days) A 16 9 B 20 7 C 25 5 D 15 11 E 40 6
Q.9) Six jobs are to be processed on a machine. Rank them according to various scheduling rules:
Jobs Time Remaining (Days) Work Remaining (Days) A 20 18 B 4 2 C 15 5 D 45 50 E 27 27 F 6 12

B.B.A. 4th Sem. Subject- Operation Research
45, Anurag Nagar, Behind Press Complex, Indore (M.P.) Ph.: 4262100, www.rccmindore.com 37
Q.10) Jobs waiting to be processed at the milling shop today (the July 23) are as follows: Jobs Due Date (Days) Estimate of time needed to
complete the job (Days) A July 31 9 B Aug 2 6 C Aug16 24 D July 29 5 E Aug 30 30
Q.11) Today is day 22 on the production control calendar and four jobs are on order as shown. Sequence according to various sequencing rules:
Jobs Due Date Work days remaining A 28 8 B 26 2 C 24 2 D 30 12
Q.12) Consider the following two machines and six jobs flow shop scheduling. Using Johnson’s gorithm, obtain the optimal sequence which will minimize the Makespan. Also prepare a Gantt Task Chart
Jobs Mach 1 (Time in mins) Mach 2 (Time in Mins) A 5 4 B 2 3 C 13 14 D 10 1 E 8 9 F 12 11
Q.13) Vidyasagar Book Binding Works has six binding jobs on hand today. Book binding consists of a two step procedure (cutting and binding). The time estimate for the jobs are as follows. Schedule the jobs and also prepare Gantt Task Chart and Make Span Chart.
Jobs Cutting (Times in Mins) Binding (Times in Mins) A 10 30 B 55 65 C 25 60 D 70 50 E 20 30 F 35 70
Q.14) A market research firm has seven customers orders that must be processed sequentially through 2 activities data compilation and analysis. Estimated time (in hours) are as follows. Schedule the jobs and to prepare Gantt Task Chart Make Span Chart.
A B C D E F G Data Compilation 5 7 2 1 8 3 16
Analysis 4 9 7 2 2 9 5 Q.15) Schedule the jobs and also prepare Gantt Task Chart and Make Span Chart.
A B C D E F G Machine 10 6 5 4 6 9 7
Polish 2 3 12 5 9 11 6

B.B.A. 4th Sem. Subject- Operation Research
45, Anurag Nagar, Behind Press Complex, Indore (M.P.) Ph.: 4262100, www.rccmindore.com 38
Q.16) Schedule the jobs and also prepare Gantt Task Chart and Make Span Chart. A B C D E F G I J K
Machine1 33 37 31 38 35 36 43 34 32 30 Machine 2 41 35 30 39 32 40 38 43 31 34
Q.17) Schedule the jobs and also prepare Gantt Task Chart and Make Span Chart.
A B C D E F Machine 1 2 4 0.75 1.5 2 2 Machine 2 1 2.25 2.5 3 4 3.5
Q.18) Schedule the jobs and also prepare Gantt Task Chart and Make Span Chart.
A B C D E F Machine 1 8 6 10 5 3 6 Machine 2 4 10 5 6 8 2
Q.19) Consider 4 jobs which have to be processed on the three machines. The processing times for each jobs on each of the three machines are given n the table. Sequence the following jobs and prepare a Makespan Chart.
A B C D Machine 1 12 6 7 8 Machine 2 6 4 5 3 Machine 3 10 8 6 7
Q.20) Sequence the following jobs and prepare a Makespan Chart.
A B C D E Machine 1 9 8 7 8 9 Machine 2 5 6 2 4 1 Machine 3 3 2 12 6 8
Q.21) Sequence the following jobs and prepare a Makespan Chart.
A B C D E F G H Machine 1 4 8 5 9 3 4 9 6 Machine 2 6 4 7 1 4 2 5 2 Machine 3 8 7 9 7 9 8 9 7
Q.22) Consider the following project:
Activity A B C D E F G H I J Preceding Act - A A A B C C E,F D,G H,I
Time week 12 8 4 3 12 18 5 4 9 6 (a) Draw the network diagram. (b) Find the critical path and project completion time (c) Calculate the ES, LS, EF, LF (d) Calculate Total Float, Free Float and Independent Float
Q.23) Consider the following project:
Activity 1-5 1-2 2-3 3-4 5-6 4-12 5-7 6-8 8-9 9-10 7-10
10-11 11-12
Time (weeks) 6 5 2 2 2 1 6 5 6 2 4 3 1 (a) Draw the network diagram.

B.B.A. 4th Sem. Subject- Operation Research
45, Anurag Nagar, Behind Press Complex, Indore (M.P.) Ph.: 4262100, www.rccmindore.com 39
(b) Find the critical path and project completion time (c) Calculate the ES, LS, EF, LF (d) Calculate Total Float, Free Float and Independent Float
Q.24) Consider the following project:
Activity 1-2 1-4 1-5 2-3 2-6 3-6 4-6 5-7 5-8 6-8 7-8 To 2 4 5 3 3 2 3 1 2 6 2 Tm 5 19 11 9 6 5 6 4 5 12 5 Tp 8 28 17 27 15 14 15 7 14 30 8
(a) Draw the network diagram. (b) Find the critical path and project completion time (c) Find the standard deviation and variance of each activity (d) Find the standard deviation of critical path.
Q.25) Consider the following project:
Activity A B C D E F G H Prec. Act - - A B A C,D C,D,E F
To 1 2 6 1 1 1 1 1 Tm 2 2 7 2 4 5 2 2 Tp 3 8 8 3 7 9 3 9
(a) Draw the network diagram. (b) Find the critical path and project completion time (c) Find the standard deviation and variance of each activity (d) Find the standard deviation of critical path. (e) What is the probability of completing the project on or before 20 weeks?
Q.26) Consider the following project:
Activity A-B B-C B-D B-E C-F D-F D-G E-G F-H G-H H-I To 2 5 8 5 8 3 4 2 9 1 1 Tm 3 7 10 6 9 4 6 3 11 2 1 Tp 4 9 12 7 10 5 8 10 13 3 1
(a) Draw the network diagram. (b) Find the critical path and project completion time (c) Find the standard deviation and variance of each activity (d) Find the standard deviation of critical path.
Q.27) Consider the following project:
Activity A B C D E F G H I J K L M PREC. Act - A A B B C C D D,F F F,G H,I J,K
To 2 3 4 4 3 1 4 2 1 2 4 1 1 Tm 3 6 6 7 5 4 8 5 2 3 5 2 1 Tp 4 9 8 10 7 7 12 8 3 10 12 3 1
(a) Draw the network diagram. (b) Find the critical path and project completion time (c) Find the standard deviation and variance of each activity (d) Find the standard deviation of critical path. (e) What is the probability of completing the project in 22 minutes?

B.B.A. 4th Sem. Subject- Operation Research
45, Anurag Nagar, Behind Press Complex, Indore (M.P.) Ph.: 4262100, www.rccmindore.com 40
Q.28) Consider the following project: Activity A B C D E F G H
Prec. Act - A A B C,D D F E,G Time 1 4 3 2 5 2 2 3
(a) Draw the network diagram. (b) Find the critical path and project completion time (c) calculate the ES, LS, EF, LF (d) calculate total Float, Free Float and Independent Float
Q.29 Calculate the reliability of the following:

B.B.A. 4th Sem. Subject- Operation Research
45, Anurag Nagar, Behind Press Complex, Indore (M.P.) Ph.: 4262100, www.rccmindore.com 41

B.B.A. 4th Sem. Subject- Operation Research
45, Anurag Nagar, Behind Press Complex, Indore (M.P.) Ph.: 4262100, www.rccmindore.com 42