symbiotic fungi: principles and practice (soil...
TRANSCRIPT

Soil Biology
Volume 18
Series EditorAjit Varma, Amity Institute ofMicrobial Technology,Amity University Uttar Pradesh, Noida, UP, India

Volumes published in the series
Applied Bioremediation and Phytoremediation (Vol. 1)
A. Singh, O.P. Ward (Eds.)
Biodegradation and Bioremediation (Vol. 2)
A. Singh, O.P. Ward (Eds.)
Microorganisms in Soils: Roles in Genesis and Functions (Vol. 3)
F. Buscot, A. Varma (Eds.)
In Vitro Culture of Mycorrhizas (Vol. 4)
S. Declerck, D.-G. Strullu, J.A. Fortin (Eds.)
Manual for Soil Analysis – Monitoring and Assessing Soil Bioremediation (Vol. 5)
R. Margesin, F. Schinner (Eds.)
Intestinal Microorganisms of Termites and Other Invertebrates (Vol. 6)
H. Konig, A. Varma (Eds.)
Microbial Activity in the Rhizosphere (Vol. 7)
K.G. Mukerji, C. Manoharachary, J. Singh (Eds.)
Nucleic Acids and Proteins in Soil (Vol. 8)
P. Nannipieri, K. Smalla (Eds.)
Microbial Root Endophytes (Vol. 9)
B.J.E. Schulz, C.J.C. Boyle, T.N. Sieber (Eds.)
Nutrient Cycling in Terrestrial Ecosystems (Vol. 10)
P. Marschner, Z. Rengel (Eds.)
Advanced Techniques in Soil Microbiology (Vol. 11)
A. Varma, R. Oelmuller (Eds.)
Microbial Siderophores (Vol. 12)
A. Varma, S. Chincholkar (Eds.)
Microbiology of Extreme Soils (Vol. 13)
P. Dion, C.S. Nautiyal (Eds.)
Secondary Metabolites in Soil Ecology (Vol. 14)
P. Karlovsky (Ed.)
Molecular Mechanisms of Plant and Microbe Coexistence (Vol. 15)
C.S. Nautiyal, P. Dion (Eds.)
Permafrost Soils (Vol. 16)
R. Margesin (Ed.)
Advances in Applied Bioremediation (Vol. 17)
A. Singh, R.C. Kuhad, O.P. Ward (Eds.)

Ajit Varma l Amit C. KharkwalEditors
Symbiotic Fungi
Principles and Practice

EditorsProf. Dr. Ajit VarmaDirector GeneralAmity Institute of Microbial TechnologyAmity University Uttar Pradesh& Vice ChairmanAmity Science, Technology &Innovation FoundationBlock A, Amity Campus, Sector 125Noida, UP [email protected]
Dr. Amit C. KharkwalLecturerAmity Institute of Microbial Technology (AIMT)Amity University Uttar Pradesh (AUUP)Sector 125Noida, UP 201 [email protected]
ISSN: 1613-3382ISBN 978-3-540-95893-2 e-ISBN 978-3-540-95894-9DOI: 10.1007/978-3-540-95894-9Springer Heidelberg Dordrecht London New York
Soil Biology
Library of Congress Control Number: 2009926002
# Springer-Verlag Berlin Heidelberg 2009
This work is subject to copyright. All rights are reserved, whether the whole or part of the material isconcerned, specifically the rights of translation, reprinting, reuse of illustrations, recitation, broadcasting,reproduction on microfilm or in any other way, and storage in data banks. Duplication of this publicationor parts thereof is permitted only under the provisions of the German Copyright Law of September 9,1965, in its current version, and permission for use must always be obtained from Springer. Violations areliable to prosecution under the German Copyright Law.The use of general descriptive names, registered names, trademarks, etc. in this publication does not imply,even in the absence of a specific statement, that such names are exempt from the relevant protective lawsand regulations and therefore free for general use.
Cover design: SPI Publisher Services
Printed on acid-free paper
Springer is part of Springer Science+Business Media (www.springer.com)

Foreword
So old, so new. . .More than 450 million years ago, plants and fungi associated to produce a
mutually beneficial symbiosis that assisted plants to invade the terrestrial environ-
ment, which was poor in nutrients and subject to desiccation and full sunlight. This
is one of the main lessons that fossil records have transmitted to us, thanks to the
reports of many paleontologists, starting with Kidston and Lang (1921). Their
wonderful observations, which have been confirmed by many others, provided
the evolutionary background to understand how mycorrhizas are a powerful driving
force for the functioning of ecosystems, supplying land plants with phosphorus and
nitrogen, as well as fungi with carbon, which finally accumulates in the soil.
On the other hand, few biological issues have entered the mainstream of biology
in such a vigorous way as mycorrhizas. Mainly thanks to DNA technologies and
genomics, new tools to discover symbiont communication, development and diver-
sity and to reveal the contribution of each partner to the functioning of the associa-
tion have been deciphered, thus offering breakthrough findings. Looking at the
history of mycorrhizas, it can be seen that some very important events have marked
recent years: the first sequenced genome of Laccaria laccata (Martin et al. 2008)
opened a window on the secrets of ectomycorrhizal fungi thriving in forests and
associated with woody plants; the identification of the plant genes that control the
signal transduction pathways in arbuscular mycorrhizal (AM) legumes has allowed
us to dissect the crucial steps of the fungal colonization process (Parniske 2008); the
discovery that plant molecules, strigolactones, are perceived by AM fungi and act
as ‘‘branching factors’’ (Akiyama et al. 2005) represents a landmark in our knowl-
edge, but has also led to a second very recent discovery. Strigolactones have been
found to impact the plant phenotype, representing a novel class of endogenous plant
hormones that are present in a wide range of angiosperms from Arabidopsisthaliana to rice (Gomez-Roldan et al. 2008; Umehara et al. 2008).
But mycorrhizas also go beyond the issue of plant/fungal biology by occupying
new fields, like that of environmental microbiology, and by pushing the development
of new approaches, like those required for metagenomics.While the foundation set up
by Craig Venter, the world-renowned genome research pioneer (www.jcvi.org/),
v

has the aim of exploring the microbial diversity in the world’s oceans, the dream of
soil microbiologists instead is to understand what the creatures that live in the soil
are doing there (Dance 2008). However, in the rhizosphere, the thin soil layer where
roots and soil microbes interact (Little et al. 2008), mycorrhizal fungi with their
diverse guilds of associated microbes (bacteria, endophytes, saprotrophs) prolifer-
ate and dominate. To detect and quantify microbes in this environment, where
researchers believe they can find the world’s widest biodiversity (Dance 2008), will
be one of the most exciting challenges for the scientific community working in the
mycorrhizal field. This will mean overcoming some of the reductionisms related to
laboratory practices and moving into the field, using updated high-throughput DNA
sequencing technologies and large-scale genomic analysis. The development of
such new platforms could lead to new paradigms, i.e. the description of mycor-
rhizas as the result of multiple organism interactions and functioning.
The chapters in this book mirror this mixture of old and new concepts, starting
from the seminal concept of symbiosis, which is central in the evolution of
complexity and is critical to the lifestyles of many animals and plants, and also to
whole ecosystems, in which symbiotic organisms are key players (Moran 2006).
The main aim of the book, however, is to combine the impetuous increase in
knowledge concerning mycorrhizas with the best laboratory practices. Expert
researchers illustrate the most updated techniques to deal with old/new questions.
Lastly, researchers enjoy investigating mycorrhizas since they are aware of their
importance on the sustainability of our ecosystem. In this context, some chapters
are devoted to technologies aimed at improving the quality of mycorrhizal inocula,
thus increasing their application range in the frame of a more friendly agriculture.
This Soil Biology volume can surely offer many replies to the current questions
concerning the way in which we can unlock the potential of mycorrhizal fungi, in
order to make them a resource that will become available to everybody.
Torino
January 2009
Paola Bonfante
References
Akiyama K, Matsuzaki KI, Hayashi H (2005) Plant sesquiterpenes induce hyphal branching in
arbuscular mycorrhizal fungi. Nature 435:824–827
Dance A (2008) What lies beneath. Nature 455:724–725
Gomez-Roldan V, Fermas S, Brewer PB, et al. (2008) Strigolactone inhibition of shoot branching
Nature 455:189–194
Kidston R, Lang WH (1921) On Old Red Sandstone plants showing structure, from the Rhynie
Chert bed, Aberdeenshire. Part V. The Thallophyta occuring in the peat-bed; the succession of
the plants throughout a vertical section of the bed, and the conditions of accumulation and
preservation of the deposit. Trans R Soc Edinb 52:855–902
vi Foreword

Little AE, Robinson CJ, Peterson SB, Raffa KF, Handelsman J (2008) Rules of engagement:
interspecies interactions that regulate microbial communities. Annu Rev Microbiol 62:375–401
Martin F, Aerts A, Ahren D, Brun A, Danchin EG, et al. (2008) The genome of Laccaria bicolorprovides insights into mycorrhizal symbiosis. Nature 452:88–92
Moran NA (2006) Symbiosis. Curr Biol 16:R866–R871
Parniske M (2008) Arbuscular mycorrhiza: the mother of plant root endosymbioses. Nat Rev
Microbiol 6:763–775
Umehara M, Hanada A, Yoshida S, Akiyama K et al. (2008) Inhibition of shoot branching by new
terpenoid plant hormones. Nature 455:195–200
Foreword vii

Preface
It has been a pleasure to edit this manual. The final outcome is the result of our
painstaking efforts involving a passionate discussion with eminent scientists from
across the globe working on symbiosis, students and fellow colleagues. The first
edition of Mycorrhiza Manual edited by Ajit Varma was published in 1998 by
Springer. This new edition is published as a volume under the banner of the Soil
Biology series as Symbiotic Fungi: Principles and Practice. The timing of the
present edition has coincided with tremendous technical progress that has been
made in the area of fungal symbiosis. The third edition of Mycorrhiza — Genetics
and Molecular Biology, Eco-Function, Biotechnology, Eco-Physiology, Structure
and Systematics, edited by Ajit Varma, appeared in July 2008. This leads to
enormous demand for the protocol book to carry out the laboratory exercises and
field trials.
Growing on mineral particles and decaying organic matter, and living in the
vicinity of or within plant roots, are a diverse array of fungal species, many of
which form diverse symbiotic associations with plant roots. These symbiotic
associations that form between the roots of most plant species and fungi are very
well-known. They are characterized by bi-directional movement of nutrients where
carbon flows to the fungus and inorganic nutrients move to the plant, thereby
providing a critical linkage between the plant root and soil. In infertile soils,
nutrients taken up by the fungi can lead to improved plant growth and reproduction.
As a result, these associations are often more competitive and better able to tolerate
environmental stresses than other plants. The book contains the current state of
practice on many aspects of symbiotic fungi and associated microbes. It deals with
organismic interactions, diversity of microbial communities, mycorrhizal bioas-
says, nutrient transfer techniques, restoration ecology, AM inoculum procedures,
biotechnological application, microbial communication and mushroom technology.
It will be of interest to a diverse audience of researchers and instructors, especially
biologists, biochemists, agronomist, foresters, horticulturists, mycologists, soil
scientists, plant physiologists, microbiologists and molecular biologists.
It is hoped that the protocols proposed by the authors will stimulate further
research, as the information presented tends to highlight both the need for further
ix

work in this challenging field and the lack of agreement on some fundamental
issues.
In planning this volume, invitations for contributions were extended to leading
international authorities working with symbiotic fungi. We would like to express
our sincere appreciation to each contributor for his/her work, and for their patience
and attention to detail during the entire production process. We sincerely hope these
eminent contributors will encourage us in the future as well, in the greatest interest
of academia.
The encouragement and inspiration received fromDr. Ashok K Chauhan (Founder
President, Ritnand Balved Education Foundation), Sri Atul Chauhan (Chancellor,
Amity University Uttar Pradesh), and Sri Aseem Chauhan (Chancellor, Amity
University Rajasthan) need special mention. We are extremely grateful to the staff
members of Springer Heidelberg, especially Dieter Czeschlik and Jutta Lindenborn,
for their continued interest, critical evaluation, constructive criticism and support. We
wish to acknowledge the help and support given to us by our students, faculty
colleagues, family members and friends for their constant encouragement.
Amity University Uttar Pradesh, India Ajit VarmaJanuary 2009 Amit C. Kharkwal
x Preface
Contents
1 Symbiosis: The Art of Living . . . . . . . . . . . . . . . . . . . . . . . . . . . . . . . . . 1Ajit Varma and Aparajita Das
2 Analysis of Rhizosphere Fungal Communities Using
rRNA and rDNA . . . . . . . . . . . . . . . . . . . . . . . . . . . . . . . . . . . . . . . . . . 29Ari Jumpponen
3 Use of Mycorrhiza Bioassays in Ecological Studies . . . . . . . . . . . . . . . 41I.A.F. Djuuna, L.K. Abbott, and Z.M. Solaiman
4 In Vivo Model Systems for Visualisation, Quantification
and Experimental Studies of Intact Arbuscular Mycorrhizal
Networks . . . . . . . . . . . . . . . . . . . . . . . . . . . . . . . . . . . . . . . . . . . . . . . . 51Manuela Giovannetti, Luciano Avio, Cristiana Sbrana,
and Paola Fortuna
5 Measurement of Net Ion Fluxes Using Ion-Selective
Microelectrodes at the Surface of Ectomycorrhizal Roots. . . . . . . . . . 65A. Gobert and C. Plassard
6 Assessment of Phosphatase Activity Associated with Mycorrhizal
Fungi by Epi-Fluorescent Microscopy . . . . . . . . . . . . . . . . . . . . . . . . . 89Ingrid M. van Aarle
7 In Vitro Compartmented Systems to Study Transport
in Arbuscular Mycorrhizal Symbiosis . . . . . . . . . . . . . . . . . . . . . . . . 101H. Dupre de Boulois, L. Voets, and S. Declerck
8 Use of the Autofluorescence Properties of AM Fungi
for AM Assessment and Handling . . . . . . . . . . . . . . . . . . . . . . . . . . . 123B. Dreyer and A. Morte
xi
9 Role of Root Exudates and Rhizosphere Microflora in the
Arbuscular Mycorrhizal Fungi-Mediated Biocontrol of
Phytophthora nicotianae in Tomato . . . . . . . . . . . . . . . . . . . . . . . . . . 141Mario Jolicoeur, Laetitia Lioussanne, and Marc St-Arnaud
10 Assessing the Mycorrhizal Diversity of Soils and Identification
of Fungus Fruiting Bodies and Axenic Cultures . . . . . . . . . . . . . . . . 159Dirk Kruger, Manisha Sharma, and Ajit Varma
11 Isolation of Metabolically Active Arbuscules and Intraradical
Hyphae from Mycorrhizal Roots . . . . . . . . . . . . . . . . . . . . . . . . . . . . 189Zakaria M. Solaiman
12 Interaction with Soil Microorganisms . . . . . . . . . . . . . . . . . . . . . . . . 197R. Hampp and M. T. Tarkka
13 Isolation, Cultivation and In Planta Visualization of Bacterial
Endophytes in Hanging Roots of Banyan Tree
(Ficus bengalensis) . . . . . . . . . . . . . . . . . . . . . . . . . . . . . . . . . . . . . . . 211Khyati Pathak, Haresh Keharia, and Amit C. Kharkwal
14 Micro-PIXE Analysis for Localization and Quantification of
Elements in Roots of Mycorrhizal Metal-Tolerant Plants . . . . . . . . . 227Katarina Vogel-Mikus, Paula Pongrac, Primoz Pelicon,
Primoz Vavpetic, Bogdan Povh, Hermann Bothe, and Marjana Regvar
15 Functional Genomic of Arbuscular Mycorrhizal Symbiosis:
Why and How Using Proteomics . . . . . . . . . . . . . . . . . . . . . . . . . . . . 243Eliane Dumas-Gaudot, Ghislaine Recorbet, Franck Robert,
Benoit Valot, and Nardjis Amiour
16 Using Stable Carbon Isotope Labelling in Signature Fatty
Acids to Track Carbon Allocation in Arbuscular Mycorrhiza . . . . . 275Pal Axel Olsson
17 15N Enrichment Methods to Quantify Two-Way Nitrogen
Transfer Between Plants Linked by Mychorrhizal Networks . . . . . . 285XH He, C Critchley, K Nara, D Southworth, and CS Bledsoe
18 Analyses of Ecophysiological Traits of Tropical Rain Forest
Seedlings Under Arbuscular Mycorrhization: Implications
in Ecological Restoration . . . . . . . . . . . . . . . . . . . . . . . . . . . . . . . . . . 293Javier Alvarez-Sanchez, Irene Sanchez-Gallen,
and Patricia Guadarrama
xii Contents

19 Techniques for Arbuscular Mycorrhiza Inoculum Reduction . . . . . . 307Isabel Brito, Mario de Carvalho, and Michael J Goss
20 Best Production Practice of Arbuscular Mycorrhizal Inoculum . . . . 319Falko Feldmann, Imke Hutter, and Carolin Schneider
21 The Use of AMF and PGPR Inoculants Singly and Combined
to Promote Microplant Establishment, Growth and Health . . . . . . . 337Mauritz Vestberg and Alan C. Cassells
22 Co-Culture of Linum album Cells and Piriformospora indicafor Improved Production of Phytopharmaceuticals. . . . . . . . . . . . . . 361A. Baldi, A. Jain, N. Gupta, A.K. Srivastava, and V.S. Bisaria
23 Fungal Elicitors for Enhanced Production of Secondary
Metabolites in Plant Cell Suspension Cultures. . . . . . . . . . . . . . . . . . 373A. Baldi, A.K. Srivastava, and V.S. Bisaria
24 Auxin Production by Symbiotic Fungi: Bioassay and HPLC-MS
Analysis . . . . . . . . . . . . . . . . . . . . . . . . . . . . . . . . . . . . . . . . . . . . . . . . 381Anke Sirrenberg, Richard Splivallo, Astrid Ratzinger,
Katharina Pawloswki, and Petr Karlovsky
25 Siderophores of Mycorrhizal Fungi: Detection, Isolation
and Identification . . . . . . . . . . . . . . . . . . . . . . . . . . . . . . . . . . . . . . . . 393K. Haselwandter and G. Winkelmann
26 Biology and Molecular Approaches in Genetic Improvement
of Cultivated Button Mushroom (Agaricus Bisporus) . . . . . . . . . . . . 403E. Mohammadi Goltapeh, Y.R. Danesh, Shwet Kamal,
and Ajit Varma
Index . . . . . . . . . . . . . . . . . . . . . . . . . . . . . . . . . . . . . . . . . . . . . . . . . . . . . . . 423
Contents xiii

Contributors
L.K. Abbott
School of Earth and Geographical Sciences M087, Faculty of Natural and Agricul-
tural Sciences, The University of Western Australia, Crawley, WA 6009, Australia
Javier Alvarez-Sanchez
Departamento de Ecologıa y Recursos Naturales, Facultad de Ciencias, Universi-
dad Nacional Autonoma de Mexico, Circuito Exterior, Ciudad Universitaria 04510
Mexico, D.F., Mexico
Nardjis Amiour
Unite de Nutrition Azotee, IJPB, INRA Centre de Versailles, 78026 Versailles
Cedex, France
Luciano Avio
Institute of Agricultural Biology and Biotechnology, CNR, Via del Borghetto 80,
56124 Pisa, Italy
A. Baldi
Department of Biochemical Engineering and Biotechnology, Indian Institute of
Technology Delhi, Hauz Khas, New Delhi 110 016, India
V.S. Bisaria
Department of Biochemical Engineering and Biotechnology, Indian Institute of
Technology Delhi, Hauz Khas, New Delhi 110 016, India
C.S. Bledsoe
Department of Land, Air and Water Resources, University of California, Davis, CA
95616, USA
xv

Hermann Bothe
Universitat zu Koln, Botanisches Institut, Gyrhofstrasse 15, 50923 Koln, Germany
Isabel Brito
Universidade de Evora, ICAM, Apartado 94, 7002-554 Evora, Portugal
Alan C. Cassells
Department of Zoology, Ecology and Plant Science, National University of Ireland
Cork, Ireland
C. Critchley
School of Integrative Biology, University of Queensland, Brisbane, QLD 4072,
Australia
Y.R. Danesh
Department of Plant Protection, Faculty of Agriculture, Urmia University, Urmia,
Iran
Aparajita Das
Amity Institute of Microbial Technology, Amity University Uttar Pradesh, Sector-
125, Noida 201303, Uttar Pradesh, India
Mario de Carvalho
Universidade de Evora, ICAM, Apartado 94, 7002-554 Evora, Portugal
S. Declerck
Universite Catholique de Louvain, Unite de Microbiologie, Croix du Sud 3, 1348
Louvain-la Neuve, Belgium
I.A.F. Djuuna
School of Earth and Geographical Sciences M087, Faculty of Natural and Agricul-
tural Sciences, The University of Western Australia, Crawley, WA 6009, Australia
B. Dreyer
Universidad de El Salvador, CENSALUD-CIC, Autopista Norte y Final 25 avenida
Norte, Ciudad Universitaria, San Salvador, El Salvador
Eliane Dumas-Gaudot
UMR 1088 INRA/CNRS 5184/UB Plante-Microbe-Environnement, INRA/CMSE,
BP 86510, 21065 Dijon Cedex, France
H. Dupre de Boulois
Universite Catholique de Louvain, Unite de Microbiologie, Croix du Sud 3, 1348
Louvain-la Neuve, Belgium
xvi Contributors

Falko Feldmann
Julius-Kuhn-Institut, Messeweg 11-12, 38104 Braunschweig, Germany
www.jki.bund.de, [email protected]
Paola Fortuna
Department of Crop Plant Biology, University of Pisa, Via del Borghetto 80, 56124
Pisa, Italy
Manuela Giovannetti
Department of Crop Plant Biology, University of Pisa, Via del Borghetto 80, 56124
Pisa, Italy
A. Gobert
UMR 1222 Biogeochimie du Sol et de la Rhizosphere (formerly Rhizosphere &
Symbiose), INRA-SupAgro, Bat 12, 2, place Viala, 34060 Montpellier cedex 01,
France
E. Mohammadi Goltapeh
Department of Plant Pathology, School of Agriculture, Tarbiat Modaress University,
P.O. Box 14115-336, Tehran, Iran
[email protected], [email protected]
Michael J Goss
Kemptville College, University of Guelph, Kemptville, ON, Canada K0G 1J0 ,
Patricia Guadarrama
Departamento de Ecologıa y Recursos Naturales, Facultad de Ciencias, Universi-
dad Nacional Autonoma de Mexico, Circuito Exterior, Ciudad Universitaria 04510
Mexico, D.F., Mexico
N. Gupta
Department of Biochemical Engineering and Biotechnology, Indian Institute of
Technology Delhi, Hauz Khas, New Delhi 110 016, India
K. Haselwandter
Institut fur Mikrobiologie, Universitat Innsbruck, Technikerstrasse 25, A-6020
Innsbruck, Austria
X.H. He
School of Plant Biology, University of Western Australia, Crawley, WA 6009,
Australia,
[email protected], [email protected]
Contributors xvii

Imke Hutter
Institut fur Pflanzenkultur, Solkau 2, 29465 Schnega, Germany, www.mykorrhiza.de
A. Jain
Department of Biochemical Engineering and Biotechnology, Indian Institute of
Technology Delhi, Hauz Khas, New Delhi 110 016, India
Mario Jolicoeur
Bio-P2 Research Unit, Department of Chemical Engineering, Ecole Polytechnique
de Montreal, P.O. Box 6079, Centre-ville Station, Montreal, QC, Canada H3C 3A7
Ari Jumpponen
Division of Biology, Kansas State University, Manhattan, KS 66506, USA,
Shwet Kamal
Amity Institute of Microbial Technology, Amity University Uttar Pradesh, Sector
125, Noida 201303, Uttar Pradesh, India
Petr Karlovsky
Georg-August-Universitat Gottingen, Department of Crop Sciences Molecular
Phytopathology and Mycotoxin Research Unit, Grisebachstr. 6, 37077 Gottingen,
Germany
Haresh Keharia
BRD School of Biosciences, Sardar Patel Maidan, Satellite campus, Vadatal road,
Sardar Patel University, P.O. Box 39, Vallabh Vidyangar-388120, Gujarat, India
Amit C. Kharkwal
Amity Institute of Microbial Technology (AIMT), Amity University Uttar Pradesh
(AUUP), Sector 125, Noida 201 303, Uttar Pradesh, India
Dirk Kruger
UFZ, Helmholtz Centre for Environmental Research Ltd., Department of Soil
Ecology, Theodor-Lieser-Straße 4, 06120 Halle/Saale, Germany
Laetitia Lioussanne
Institut de recherche en biologie vegetale, Jardin botanique de Montreal, 4001 East,
Sherbrooke Street, Montreal, QC, Canada H1X 2B2
A. Morte
Departamento de Biologıa Vegetal, Facultad de Biologıa, Universidad de Murcia,
Campus de Espinardo, 30100 Murcia, Spain
xviii Contributors
K. Nara
Asian Natural Environmental Science Center, University of Tokyo, Nishi-Tokyo,
Tokyo 188-0002, Japan
Pal Axel Olsson
Department of Plant Ecology and Systematics, Lund University, Ecology Building,
223 62 Lund, Sweden
Khyati Pathak
BRD School of Biosciences, Sardar Patel Maidan, Satellite Campus, Vadatal Road,
Sardar Patel University, P.O. Box 39, Vallabh Vidyangar-388120, Gujarat, India
Katharina Pawloswki
Department of Botany, Stockholm University, 10691 Stockholm, Sweden
Primoz Pelicon
Jozef Stefan Institute, Jamova 39, 1000 Ljubljana, Slovenia
C. Plassard
UMR 1222 Biogeochimie du Sol et de la Rhizosphere (formerly Rhizosphere &
Symbiose), INRA-SupAgro, Bat 12, 2, place Viala, 34060 Montpellier cedex 01,
France
Paula Pongrac
Department of Biology, Biotechnical Faculty, University of Ljubljana, Vecna pot
111, SI-1000 Ljubljana, Slovenia
Bogdan Povh
Max-Planck-Institut fur Kernphysik, P.O. Box 103980, 69029 Heidelberg, Germay
Astrid Ratzinger
Department of Crop Sciences, Molecular Phytopathology and Mycotoxin Research
Unit, Georg-August-Universitat Gottingen, Grisebachstr. 6, 37077 Gottingen,
Germany
Ghislaine Recorbet
UMR 1088 INRA/CNRS 5184/UB Plante-Microbe-Environnement, INRA/CMSE,
BP 86510, 21065 Dijon Cedex, France
Marjana Regvar
Department of Biology, Biotechnical Faculty, University of Ljubljana, Vecna pot
111, 1000 Ljubljana, Slovenia
Contributors xix

Franck Robert
UMR 1088 INRA/CNRS 5184/UB Plante-Microbe-Environnement, INRA/CMSE,
BP 86510, 21065 Dijon Cedex, France
Irene Sanchez-Gallen
Departamento de Ecologıa y Recursos Naturales, Facultad de Ciencias, Universi-
dad Nacional Autonoma de Mexico, Circuito Exterior, Ciudad Universitaria 04510
Mexico, D.F., Mexico
Cristiana Sbrana
Institute of Agricultural Biology and Biotechnology, CNR, Via del Borghetto 80,
56124 Pisa, Italy
Carolin Schneider
Institut fur Pflanzenkultur, Solkau 2, 29465 Schnega, www.mykorrhiza.de
Manisha Sharma
Amity Institute of Microbial Technology (AIMT), Amity University Uttar Pradesh,
Sector 125, Noida, Uttar Pradesh 201303, India
Anke Sirrenberg
Department of Crop Sciences, Molecular Phytopathology and Mycotoxin Research
Unit, Georg-August-Universitat Gottingen, Grisebachstr. 6, 37077 Gottingen,
Germany
Zakaria M. Solaiman
Soil Science and Plant Nutrition, School of Earth and Geographical Sciences,
M087, Faculty of Natural and Agricultural Sciences, The University of Western
Australia, Crawley, WA 6009, Australia
D. Southworth
Department of Biology, Southern Oregon University, Ashland, OR 97520, USA
Richard Splivallo
Department of Crop Sciences, Molecular Phytopathology and Mycotoxin Research
Unit, Georg-August-Universitat Gottingen, Grisebachstr. 6, 37077 Gottingen,
Germany
A.K. Srivastava
Department of Biochemical Engineering and Biotechnology, Indian Institute of
Technology Delhi, Hauz Khas, New Delhi 110 016, India
xx Contributors

Marc St-Arnaud
Institut de recherche en biologie vegetale, Jardin botanique de Montreal, 4001 East,
Sherbrooke Street, Montreal, QC, Canada H1X 2B2
M.T. Tarkka
UFZ, Helmholtz-Centre for Environmental Research, Department of Soil Ecology,
Theodor-Lieser-Strasse 4, 06120 Halle, Germany
Benoit Valot
UMR de Genetique Vegetale, IFR 87, Plate-Forme de Proteomique du Moulon, Gif
sur Yvette, France
Ingrid M. van Aarle
Universite catholique de Louvain, Unite de Microbiologie, Croix du Sud 3/6, 1348
Louvain-la-Neuve, Belgium
Ajit Varma
Amity Institute of Microbial Technology (AIMT), Amity University Uttar Pradesh,
Sector 125, Noida 201303, Uttar Pradesh, India
Primoz Vavpetic
Jozef Stefan Institute, Jamova 39, 1000 Ljubljana, Slovenia
Mauritz Vestberg
MTT Agrifood Research Finland, Plant Production Research Laukaa, Antinnie-
mentie 1, FIN-41330 Vihtavuori, Finland
Katarina Vogel-Mikus
Department of Biology, Biotechnical Faculty, University of Ljubljana, Vecna pot
111, SI-1000 Ljubljana, Slovenia
L. Voets
Universite catholique de Louvain, Unite de Microbiologie, Croix du Sud 3, 1348
Louvain-la Neuve, Belgium
G. Winkelmann
Institut fur Mikrobiologie und Biotechnologie, Universitat Tubingen, Auf der
Morgenstelle 28, 72076 Tubingen, Germany
Contributors xxi
Chapter 1
Symbiosis: The Art of Living
Aparajita Das and Ajit Varma
1.1 Introduction
The term symbiosis (from the Greek: sym, ‘‘with’’; and biosis, ‘‘living’’) commonly
describes close and mostly long-term interactions between different biological
species. The term was first used in 1879 by the German mycologist, Heinrich
Anton de Bary, who defined it as ‘‘the living together of unlike organisms’’.
In symbiosis, at least one member of the pair benefits from the relationship. The
other member may be injured, i.e., have the parasitism association, or be relatively
unaffected, i.e., have the commensalism association. Another type of relationship
is mutualism; in this type both the partners get benefit from the associationship
(Fig. 1.1). In this current chapter, we will discuss the term symbiosis only in
relationship to these mutually beneficial interactions.
Endosymbiosis is any symbiotic relationship in which the symbionts lives within
the tissues of the host, either in the intracellular space or extracellularly. Examples
are nitrogen-fixing bacteria (called rhizobia) which live in root nodules on legume
roots, Actinomycete nitrogen-bacteria called Frankia which live in alder tree root
nodules, single-celled algae inside reef-building corals, and bacterial endosym-
bionts that provide essential nutrients to about 10–15% of insects.
Ectosymbiosis, also referred to as exosymbiosis, is any symbiotic relationship in
which the symbiont lives on the body surface of the host, including the inner surface
of the digestive tract or the ducts of exocrine glands. Examples of this include
ectoparasites such as lice, commensal ectosymbionts, such as the barnacles that
attach themselves to the jaw of baleen whales, and mutualist ectosymbionts such as
cleaner fish.
A. Das and A. Varma (*)
Amity Institute of Microbial Technology, Amity University Uttar Pradesh, Sector-125, Noida
201303, India
e-mail: [email protected]
A. Varma and A.C. Kharkwal (eds.), Symbiotic Fungi, Soil Biology 18, 1
DOI: 10.1007/978‐3‐540‐95894‐9_1, # Springer‐Verlag Berlin Heidelberg 2009

All the divisions of the plant kingdom, namely bryophytes, pteridophytes,
gymnosperms, and angiosperms, form symbiotic relationships with bacteria, cyano-
bacteria, actinomycetes, and fungi.
1.2 History of Symbiosis
Plants are the very foundations of life on the earth. A large proportion of the
microbial population are present in the region immediately around plant roots,
the rhizosphere. The surface and immediate neighborhood of a root provides a
specialized environment for microorganisms where the microbial population is
enhanced because of the root exudates. Almost 90% of all vascular plant families
enjoy symbiotic relationships with microorganisms. Most symbiotic relationships
probably started out as facultative. Over many generations, the organisms came to
depend more on the symbiosis because natural selection favored those traits and
not others. Eventually, the symbiosis became the sole source of the food, shelter,
enzyme, or whatever else the symbionts derived from one another (http://science
howstuffworks.com/symbiosis.htm).
Symbiotic relationships in which both the species of the association benefits are
mutualistic. Mutualistic relations between plants and fungi are very common. The
fungus helps the host plant absorb inorganic nitrogen and phosphorus from the soil.
Some mycorrhizal fungi also secrete antibiotics which may help protect their host
from invasion by parasitic fungi and bacteria. One of the most important examples
of mutualism in the overall economy of the biosphere is the symbiotic relationship
between certain nitrogen-fixing bacteria and their legume hosts. About 80% of all
land plants have a symbiotic relationship with fungi of the phylum Glomeromycota.
The fungus penetrates cells in the plant’s roots, and provides the plant with
Fig. 1.1 Types of symbiosis
2 A. Das and A. Varma
phosphates and other nutrients from the soil. This kind of symbiosis is called an
arbuscular mycorrhiza. Fossil evidence (Remy et al. 1994) and DNA sequence
analysis (Simon et al. 1993) have suggested that arbuscular mycorrhiza had
appeared 400–460 million years ago, when the first plants were colonizing land.
Remy et al. (1994) have reported the existence of arbuscules in the Early Devonian,which indicates that nutrient-transfer mutualism may have been in existence when
plants invaded the land. The discovery of arbuscules in Aglaophyton major, anEarly Devonian land plant, provides unequivocal evidence that mycorrhizae were
established >400 million years ago. Nonseptate hyphae and arbuscules occur in a
specialized meristematic region of the cortex that continually provided new cells
for fungal infection. Arbuscules are morphologically identical to those of living
arbuscular mycorrhizae, in consisting of a basal trunk and repeatedly branched
bush-like tufts within the plant cell.
The arbuscular mycorrhiza play an important role in nature. Beneficial plant–
microbe interactions in the rhizosphere are primary determinants of plant health and
soil fertility. The carbohydrates produced by plants are translocated from their
source location (usually leaves) to the root tissues and then to the fungal partners.
In return, the plant gains the use of the mycelium’s very large surface area to absorb
water and mineral nutrients from the soil, thus improving the mineral absorption
capabilities of the plant roots. Plant roots alone may be incapable of taking up
phosphate ions that are immobilized, for example, in soils with basic pH. The
mycelium of the mycorrhizal fungus can, however, access these phosphorus
sources, and make them available to the plants they colonize. The mechanisms of
increased absorption are both physical and chemical. Mycorrhizal mycelia are
much smaller in diameter than the smallest root, and can explore a greater volume
of soil, providing a larger surface area for absorption. Also, the cell membrane
chemistry of fungi is different from that of plants. Mycorrhizae are especially
beneficial for the plant partner in nutrient-poor soils. Arbuscular mycorrhizae are
the most important microbial symbioses for the majority of plants and, under
conditions of P-limitation, influence plant community development, nutrient up-
take, water relations and above-ground productivity. They also act as bioprotectants
against pathogens and toxic stresses. Other valuable effects of mycorrhiza in
ecosystems are biological nitrogen fixation by Rhizobium in legume hosts, which
can also be enhanced through co-infection with AMF (Xavier and Germida 2002).
A.B. Frank’s observations and hypotheses about mycorrhizae in 1885 flew in the
face of conventional thinking of the time. He reported that what we now term
ectomycorrhizae were widespread on root systems of many woody plant species in
a great diversity of habitats and soils. He hypothesized that mycorrhizae represent
an all-encompassing mutualistic symbiosis in which fungus and host nutritionally
rely on each other. He explained that the fungus extracts nutrients from both
mineral soil and humus and translocates them to the tree host; and the host tree,
in turn, nourishes the fungus. Today, with the help of modern scientific tools, it has
been possible to achieve conclusive evidence to nearly Frank’s entire hypothesis.
Nonetheless, the revolution in thinking about plant and fungal evolution, ecology
and physiology generated by Frank is still in the process of acceptance by much of
1 Symbiosis: The Art of Living 3

the scientific community, 120 years and tens of thousands of scientific papers since
he coined the term mycorrhiza (Trappe 2005). Frank in 1885 gave the name
‘‘mycorhiza’’ to the peculiar association between tree roots and ectomycorrhizal
fungi. In another publication, Frank in 1887 recognized a distinction between
ectotrophic and endotrophic mycorrhizae, which included at the time only erica-
ceous and orchid mycorrhizas. A thorough discussion of the derivation of the word
‘‘mycorrhiza’’, including the incorporation of the second r, is given by Kelley
(1931).
Koide and Mosse (2004) have reviewed the history of research on arbuscular
mycorrhiza.
Arbuscular mycorrhizas may have been described as early as 1842 by Nageli,
but most of Nageli’s drawings only remotely resemble the arbuscular mycorrhiza.
Trappe and Berch (1985) cite other early observations of the symbiosis during the
period 1875–1895. Light and electron microscopical studies of arbuscular mycor-
rhizas were facilitated by the founding in 1950 of the Centro di Studio sulla
Micologia del Terreno by Peyronel in Torino, Italy (Bonfante 1991).
Although there were already many independent descriptions of the arbuscular
mycorrhiza in the late 1800s and early 1900s, the true identity of the fungi involved
remained unknown for many decades. So unclear was their identity that at one point
the possibility was circulated that a single fungus could form both ectomycorrhizas
and arbuscular mycorrhizas (Lohman 1927).
Between 1952 and 1957 a fungus first isolated by Nicholls (1952) from surface-
sterilized mycorrhizal onion roots was identified as a strain of Pythium ultimum. In1955 Harrison, also from the Bristol group, isolated the organism again using the
hanging drop technique of Magrou. Experiments to test whether inoculation with
such isolates could produce typical arbuscular mycorrhizas were summarized by
Hawker et al. (1957).
1.3 Symbiosis of Bacteria
1.3.1 Symbiotic Association of Bacteria with Leguminous Plants
The symbiotic relationship of bacteria of the genus Rhizobium together with many
members of the family Leguminosae, such as peas, beans, clovers, soyabean, forms
an important nitrogen-fixing co-operative. An essential feature of the symbiotic
fixation is the formation of nodules on the roots of the plants. Leguminous crops can
fix nitrogen on earth through a symbiotic process with the gram-negative species of
Rhizobium (Fig. 1.2).
Rhizobium has two types of strain:
(a) Fast growers that include R. leguminosarum or Bacillus radicicola, etc.(b) Slow growers include R. japonicum and R. lupinii, etc.
4 A. Das and A. Varma
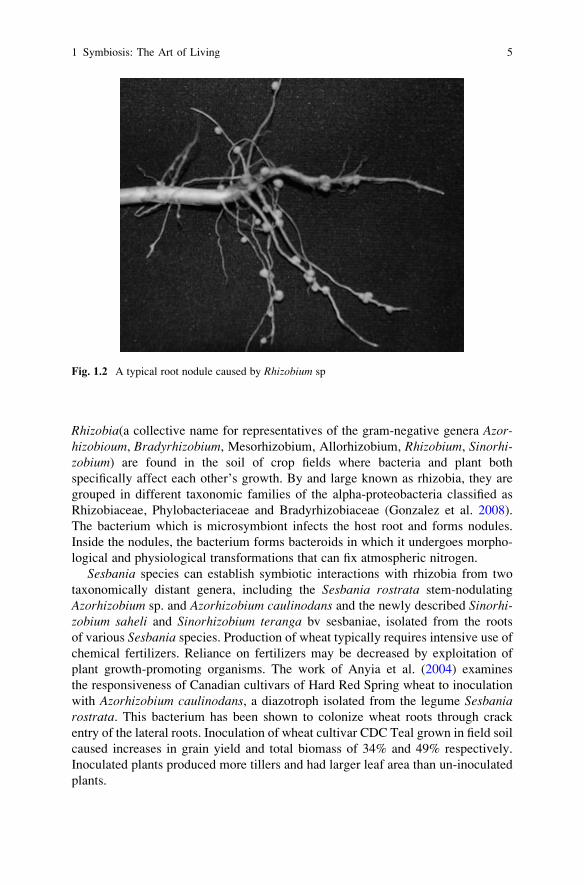
Rhizobia(a collective name for representatives of the gram-negative genera Azor-hizobioum, Bradyrhizobium, Mesorhizobium, Allorhizobium, Rhizobium, Sinorhi-zobium) are found in the soil of crop fields where bacteria and plant both
specifically affect each other’s growth. By and large known as rhizobia, they are
grouped in different taxonomic families of the alpha-proteobacteria classified as
Rhizobiaceae, Phylobacteriaceae and Bradyrhizobiaceae (Gonzalez et al. 2008).
The bacterium which is microsymbiont infects the host root and forms nodules.
Inside the nodules, the bacterium forms bacteroids in which it undergoes morpho-
logical and physiological transformations that can fix atmospheric nitrogen.
Sesbania species can establish symbiotic interactions with rhizobia from two
taxonomically distant genera, including the Sesbania rostrata stem-nodulating
Azorhizobium sp. and Azorhizobium caulinodans and the newly described Sinorhi-zobium saheli and Sinorhizobium teranga bv sesbaniae, isolated from the roots
of various Sesbania species. Production of wheat typically requires intensive use ofchemical fertilizers. Reliance on fertilizers may be decreased by exploitation of
plant growth-promoting organisms. The work of Anyia et al. (2004) examines
the responsiveness of Canadian cultivars of Hard Red Spring wheat to inoculation
with Azorhizobium caulinodans, a diazotroph isolated from the legume Sesbaniarostrata. This bacterium has been shown to colonize wheat roots through crack
entry of the lateral roots. Inoculation of wheat cultivar CDC Teal grown in field soil
caused increases in grain yield and total biomass of 34% and 49% respectively.
Inoculated plants produced more tillers and had larger leaf area than un-inoculated
plants.
Fig. 1.2 A typical root nodule caused by Rhizobium sp
1 Symbiosis: The Art of Living 5
1.3.2 Symbiotic Association of Bacteriawith Nonleguminous Plants
Many species of as many as thirteen genera of nonleguminous angiosperms, which
are all woody and dicots, bear root nodules that can fix nitrogen, e.g., Casuarina,Alnus. Some members of the family Rubiaceae develop nodule-like structures on
the leaves, which contain nitrogen-fixing bacteria. Over 400 species of three genera
of Rubiaceae and one genus of Myrsinaceae reportedly have bacterial leaf nodules.
Light and/or electron microscope studies of a few species have shown that bacteria
exist in spaces within buds filled with mucilage secreted by glands. These bacteria
enter substomatal chambers (Rubiaceae) or marginal hydathodes(Myrsinaceae) and
establish short-lived colonies, in intercellular spaces, that die out almost before full
leaf expansion. Bacteria occur in seeds between endosperm and embryo, but only
two studies have followed bacteria into flowers and ovules. Previous work on the
physical relations of bacteria and host plants is discussed critically. Reviewing
work done on isolation and identification of presumed endophytes leads to the
conclusion that there is no agreement as to whether one or several bacterial taxa are
the endophyte, and there are no unambiguous identifications, although four genera
are suggested as possibilities (Lersten and Horner 1976).
1.3.3 Establishment of the Mutualistic RelationshipBetween Rhizobia and Legumes
1.3.3.1 Presymbiosis Stage
A diverse group of rhizobia may inhabit the rhizosphere (root and soil area) of a
specific legume, but only one or a limited number of species will interact with the
legume. Assessment of rhizobial diversity indicates rhizobia are highly heteroge-
neous, as they differ in growth rates, biosynthetic pathways, habitats, catabolic
activities, etc. (Gonzalez et al. 2008). The soil contains various bacteria and
microorganisms. Each species of legume generally excretes a spectrum of flavo-
noids, stachydrines and aldenic acids into the rhizosphere, making the biochemical
environment in which the rhizobia grow unique for each type of legume. This
unique concentration gradient and spectrum of flavonoids is used to attract the
appropriate rhizobial species to colonize the root and produce nodules. Some of
these root exudates are also used as nutrients by some of the rhizobia, e.g.,
homoserine released by pea plants is the preferred nutrient (carbon and nitrogen
source) for R. leguminosarum biovar vicieae, which forms a symbiotic relationship
with pea plants (Van Egeraat 1975). Hence, a combination of preferential rhizobial
population growth and movement, possibly by chemotaxis and/or electrotaxis
(Miller et al. 1986) results in the appropriate rhizobial species colonizing the
legume root and producing effective nodules.
6 A. Das and A. Varma

1.3.3.2 Rhizobial Attachment and Root Hair Deformation
The recognition factors between the host root and Rhizobium are shown to be
proteins and sugars (Boogerda and Rossuma 1997). The proteins involved are the
glycoproteins (carbohydrate containing proteins) also known as lectins. Such lec-
tins can bind with several sugars. The lectins are present on the surface of the host
root, while polysaccharides are present on the surface of the bacterium. The lectins
have several attachment sites, each of which is specific to a particular type of
polysaccharide. Consequently, the lectins of the host root recognize the polysac-
charide receptors present on the surface of compatible Rhizobium. When such
polysaccharides bind with a lectin molecule, this facilitates attachment of the
bacterium to the root. Since lectins have several binding sites and the bacterium
produces a range of sugars, this can ensure high specificity of recognition (Dazzo
et al. 1988). Such lectins have been detected both in the seeds and nodulated plants
of peanut and soybean (Kishinevsky et al. 1988). Leguminous plants release
tryptophan into the soil, which is absorbed by Rhizobium and is metabolized to
produce IAA (indole acetic acid).
The first random nonspecific interaction between the symbiotic partners is
mediated by the bacterial microfibrili, rhicadhesin (14 kD, calcium binding protein),
on individual plant cells and root hair tips (Smith et al. 1992). This is followed by
more specific attachment in which multivalent lectins are involved and the attach-
ment of the rhizobia becomes more secured with the aid of extracellular bacterial
microfibrili(Dazzo and Wopereis 2000). Initial plant physiological responses to
attachment of rhizobia (Felle et al. 1998) are:
1. Calcium influx (rapid intake of calcium causes a cascade of signal transduction
that leads to the induction of nodulin genes)
2. Potassium/chloride efflux
In addition to plant lectins and calcium, the other four types of polysaccharides
involved in the attachment process are:
1. Extracellular polysaccharides (EPS)
2. Capsular polysaccharides (CPS)
3. Lipopolysaccharides (LPS)
4. b-2 glucans
EPS and LPS are heteropolymers, which show species-specific variation and may
react with lectins (Sprent 1989). The function of the CPS is that it mediates polar
attachment to the legume host root hairs (Halverson and Stacey 1986).
As the bacteria attach to the cell wall of the root hair, a series of morphological
and physiological changes occur in the root hair. Inhibition of cell expansion on one
side of the root hair causes it to curl back on itself (root hair curl or ‘‘Shepard’s
crook’’) with the rhizobia attached to the inside surface of the curled root hair wall
(Dazzo and Hubbell 1982). It is well established that lipo-chitin nodulation signals,
produced by the bacterium, initiate these changes in the root hair cell. However, not
1 Symbiosis: The Art of Living 7

all the root hairs which get infected show curling (root curling factor). It is therefore
not a necessary prerequisite for infection.
The root hair is covered with a mucilaginous substance in which the bacterium
first becomes embedded. The cell wall of the root hair dissolves at the point of
bacterial attachment, probably because of the secretion of enzymes like pectinases
and polygalactouronases by the bacteria. Such dissolution of the root hair cell wall
facilitates the entry of the bacterium into the root hair cell. This is the normal and
common mode of infection. At times for instance in peanut, the bacteria may infect
the root at the point of emergence of lateral root.
1.3.3.3 Infection Thread Formation
The area on the plant cell wall where the bacteria are attached begins to grow
inwards (invaginates), which forms a growing tube (infection thread) made of plant
cell wall material and membrane with the rhizobia inside the tube (Dazzo and
Wopereis 2000). When once the bacterium enters the root hair, certain structural
and physiological changes occur in the root hair cell. Cytoplasmic streaming and
respiration increase. The nucleus also increases in size. A new wall is laid down
around the bacterium so that it is separated from the contents of the surrounding
host cell. The new cell wall extends like a tube (infection thread), and the bacterium
inside the tube starts dividing (Fig. 1.3). The infection thread further extends from
the root hair cell toward the underlying cortical cells of the root (Devlin and
Witham 1986).
The cells of the root cortex develop into large cells, each with an enlarged central
nucleus. The infection thread intrudes, settles, and liberates its contents in cortical
cells which are always polyploid (tetraploid) (Brewin 1991).
Bacterial cell surface polysaccharides appear to play a crucial role in infection
thread growth. The bacteria divide as they move down the infection thread, either
by gliding motility (since the bacterium does not have flagella inside the infection
Fig. 1.3 Infection thread formation on establishment of the mutualistic relationship between
rhizobia and legume
8 A. Das and A. Varma
thread) or by being somehow connected to the reoriented microtubule cytoskeleton.
The infection thread eventually reaches the developing nodule and delivers the
rhizobia into the appropriate nodule cell via endocytosis. Bacterial mutants defec-
tive in exopolysaccharide or lipopolysaccharide synthesis form infection threads
that are blocked or fail to penetrate fully into the root. Similar mutants may also
lead to defects in bacterial release from the infection thread (Becker et al. 2000).
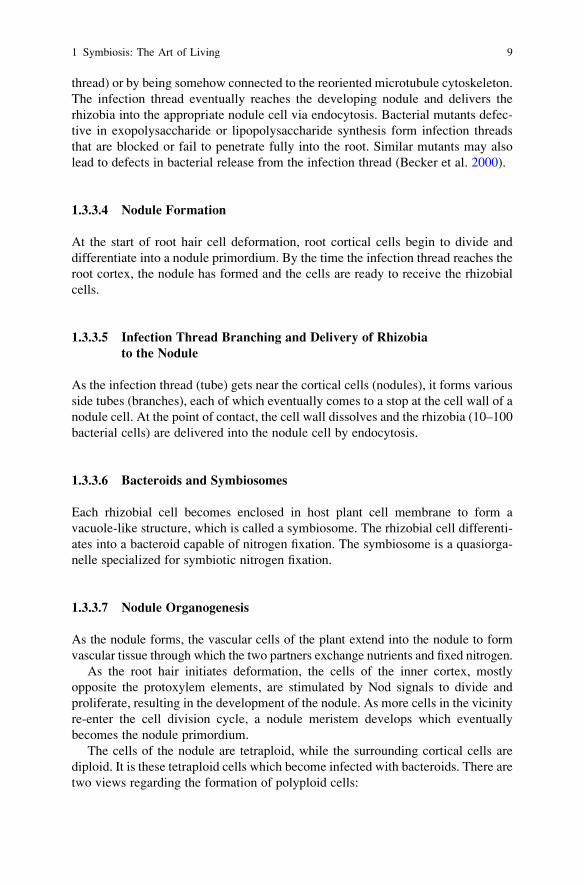
1.3.3.4 Nodule Formation
At the start of root hair cell deformation, root cortical cells begin to divide and
differentiate into a nodule primordium. By the time the infection thread reaches the
root cortex, the nodule has formed and the cells are ready to receive the rhizobial
cells.
1.3.3.5 Infection Thread Branching and Delivery of Rhizobia
to the Nodule
As the infection thread (tube) gets near the cortical cells (nodules), it forms various
side tubes (branches), each of which eventually comes to a stop at the cell wall of a
nodule cell. At the point of contact, the cell wall dissolves and the rhizobia (10–100
bacterial cells) are delivered into the nodule cell by endocytosis.
1.3.3.6 Bacteroids and Symbiosomes
Each rhizobial cell becomes enclosed in host plant cell membrane to form a
vacuole-like structure, which is called a symbiosome. The rhizobial cell differenti-
ates into a bacteroid capable of nitrogen fixation. The symbiosome is a quasiorga-
nelle specialized for symbiotic nitrogen fixation.
1.3.3.7 Nodule Organogenesis
As the nodule forms, the vascular cells of the plant extend into the nodule to form
vascular tissue through which the two partners exchange nutrients and fixed nitrogen.
As the root hair initiates deformation, the cells of the inner cortex, mostly
opposite the protoxylem elements, are stimulated by Nod signals to divide and
proliferate, resulting in the development of the nodule. As more cells in the vicinity
re-enter the cell division cycle, a nodule meristem develops which eventually
becomes the nodule primordium.
The cells of the nodule are tetraploid, while the surrounding cortical cells are
diploid. It is these tetraploid cells which become infected with bacteroids. There are
two views regarding the formation of polyploid cells:
1 Symbiosis: The Art of Living 9
1. Such polyploidy cells may be already present in the root along with the diploid
cell. However, with the infection by rhizobia these polyploid cells divide and
form the nodule.
2. The other view is that upon infection by rhizobia, probably because of the
secretion of some hormones, endomitosis occurs and the cells become
polyploidy.
Usually the nodules originate opposite the protoxylem elements in the root. In this
respect, these resemble the lateral roots. However, ontogenetically, lateral roots and
nodules are quite different. While the roots originate in the pericycle, the nodules
develop from the cells of the inner cortex. Therefore, the nodules are not analogous
to lateral roots.
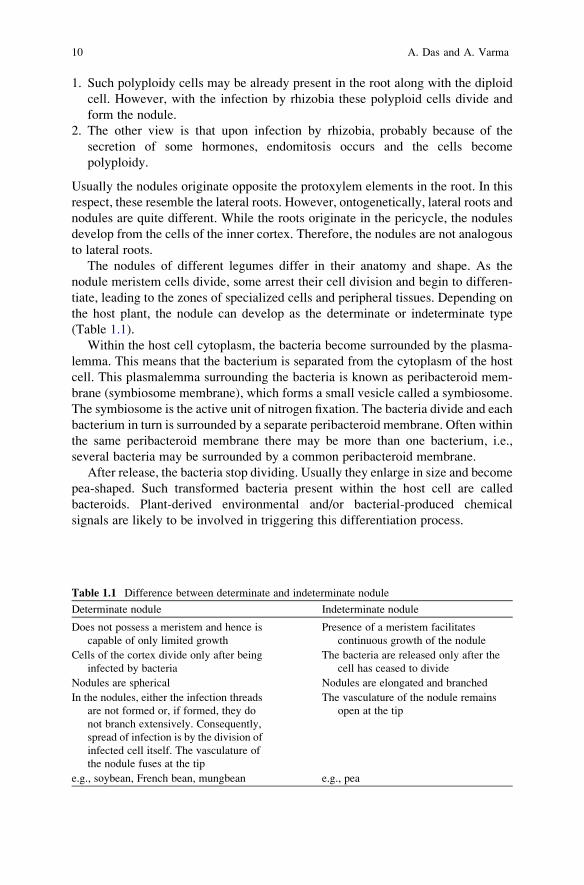
The nodules of different legumes differ in their anatomy and shape. As the
nodule meristem cells divide, some arrest their cell division and begin to differen-
tiate, leading to the zones of specialized cells and peripheral tissues. Depending on
the host plant, the nodule can develop as the determinate or indeterminate type
(Table 1.1).
Within the host cell cytoplasm, the bacteria become surrounded by the plasma-
lemma. This means that the bacterium is separated from the cytoplasm of the host
cell. This plasmalemma surrounding the bacteria is known as peribacteroid mem-
brane (symbiosome membrane), which forms a small vesicle called a symbiosome.
The symbiosome is the active unit of nitrogen fixation. The bacteria divide and each
bacterium in turn is surrounded by a separate peribacteroid membrane. Often within
the same peribacteroid membrane there may be more than one bacterium, i.e.,
several bacteria may be surrounded by a common peribacteroid membrane.
After release, the bacteria stop dividing. Usually they enlarge in size and become
pea-shaped. Such transformed bacteria present within the host cell are called
bacteroids. Plant-derived environmental and/or bacterial-produced chemical
signals are likely to be involved in triggering this differentiation process.
Table 1.1 Difference between determinate and indeterminate nodule
Determinate nodule Indeterminate nodule
Does not possess a meristem and hence is
capable of only limited growth
Presence of a meristem facilitates
continuous growth of the nodule
Cells of the cortex divide only after being
infected by bacteria
The bacteria are released only after the
cell has ceased to divide
Nodules are spherical Nodules are elongated and branched
In the nodules, either the infection threads
are not formed or, if formed, they do
not branch extensively. Consequently,
spread of infection is by the division of
infected cell itself. The vasculature of
the nodule fuses at the tip
The vasculature of the nodule remains
open at the tip
e.g., soybean, French bean, mungbean e.g., pea
10 A. Das and A. Varma

Morphological changes in bacteria as they become bacteroids (Vassa et al.
1990):
l Type I — when rhizobia are released into the nodule cell, they still resemble the
free-living bacteria without the flagella.l Type II — become more elongated, and their nucleoid region is not discernable.
Bacteria stop dividing. Their DNA continues to divide, hence they have a few
more copies of DNA than the free-living bacteria.l Type III — finish elongating and begin the transcription of nitrogen fixation
(nif and fix) genes.l Type IV — competent to begin nitrogen fixation as soon as the nodule becomes
mature and a microaerobic environment is produced.l Type V — begin to vary in morphology, show progressive changes in their
cytoplasmic content, decrease in numbers and stop their nitrogen-fixing ability.l Certain biochemical changes are also initiated both in the bacterium and in the
host cell. Now the host cell starts producing the red-pigmented protein called
leghemoglobin for which the red pigment, heme is supplied by the bacterium
while the globulin part is synthesized by the legume host. Some new cyto-
chromes, viz. cytochrome P-552 and P-420, which are not present in the free-
living rhizobia appear in the bacteroids. The nif genes become derepressed,
resulting in the synthesis of the enzyme nitrogenase. At this stage, the nodule
becomes fully symbiotic, receiving the supply of carbohydrates from the host
and exporting combined nitrogen in turn to the host.
When once the host cell becomes filled with bacteroids, mitochondria and other cell
organelles of the host are pushed to the periphery of the cell. Usually it takes about
2 weeks after inoculation for the functional nodules to appear as in Trifolium.
1.3.3.8 Leghemoglobin Production
Very early in the establishment of this relationship, plant cells begin to produce the
oxygen-binding protein, leghemoglobin, which helps in producing the microaero-
bic environment necessary for nitrogenase activity. This leghemoglobin found in
the root nodules of leguminous plants is a red pigment similar to that of hemoglobin
of red blood corpuscles. Leghemoglobin is considered to be a product of the
Rhizobium–legume complex. It is synthesized on plant genome, located in the
peribacteroid membrane and serves the purpose of oxygen carrier in the nodule
cell. Although correlation has been found between the concentration of leghemo-
globin and the rate of nitrogen fixation, the pigment does not play a direct role in
nitrogen fixation. It protects the nitrogenase inside the bacteroid from detrimental
effect of O2. It maintains adequate supply of O2 in the bacteroid membrane, so
that through respiration ATPs continue to be regenerated which are required for
nitrogen fixation.
1 Symbiosis: The Art of Living 11

1.3.3.9 Nitrogenase Production
Once the conditions are appropriate for nitrogen fixation, the bacteroids produce
nitrogenase enzyme, the enzyme that converts N2 to NH3. The enzyme nitrogenase
is reported to be present in all the nitrogenfixing organisms, viz. bacteroids,
heterocysts of cyanophyceae and vesicles of Frankia.
1.3.3.10 Senescence of Nodule and Release of Rhizobia
The ageing (senescence) process of the nodule is genetically programmed, and
leads to the release of the bacteroids and loss of nodules.
1.4 Symbiosis of Actinomycetes
Actinomycetes are gram-positive bacteria that can form branching filaments. They
may form true mycelia or produce conidiospores. Frankia is one of the representa-
tive genera of Actinomycetes.
Characteristics of Frankia are as follows:
1. It is a type IIID cell wall type.
2. It forms nonmotile sporangiospores in sporogeneous body.
3. It grows in symbiotic association with the roots of at least eight families of
higher nonleguminous plants (e.g., alder trees).
4. It is a microaerophile, able to fix nitrogen.
The roots of the infected plants develop nodules that fix nitrogen so efficiently that a
plant such as an alder can grow in the absence of combined nitrogen when
nodulated. Within the nodule cells, Frankia forms branching hyphae with globular
vesicles at their ends. These vesicles may be the sites of nitrogen fixation. The
nitrogen fixation process resembles that of Rhizobium, in that it is oxygen-sensitiveand requires molybdenum and cobalt. Some plants (Alnus, Ceanothus) have
nodules as large as baseballs. The nodules of Casuarina approach soccer-ball size
(Prescott et al. 1996).
The actinomycetes infect the root system and forms nodules in shrubs and trees
belonging to eight dicot families except Leguminosae (Table 1.2). However, this is
not of much economic significance, as none of the crop plants is infected with
Frankia. The development of Frankia and the mechanism of nitrogen fixation is
less well-understood than legume–rhizobium symbiosis. Casurina, Eleagnus, andAlnus are some of the important genera which form Frankia nodules. Such nodulesare long-lived when compared with rhizobium nodules of legumes. Frankia is a
free filamentous form which can also be cultured on nutrient media. The tip of the
filament is enlarged, forming the vesicle which contains the enzyme nitrogenase.
12 A. Das and A. Varma

This species can fix nitrogen, both symbiotically with the host plant and also
independently when cultured in vitro. The host–symbiont specificity in Frankia is
broad. The same organisms can often nodulate in a wide spectrum of species.
1.5 Symbiosis Between Blue–Green Alga and Fungus:
Geosiphon pyriforme
Geosiphon pyriforme v. Wettstein is a coenocytic soil fungus, and till now the only
known example of a fungus living in endocytobiotic association with a cyanobac-
terium, i.e., with Nostoc punctiforme. F.V. Wettstein described it as a symbiosis
between a heterotrophic siphonal chlorophyceaen alga and Nostoc. The fungus livestogether with the cyanobacterium on the surface and in the upper layer of wet soils
poor in inorganic nutrients, particularly in phosphate. When a fungal hypha
comes into contact with free-living Nostoc cells, the latter are incorporated by the
fungus at the hyphal tip, which thereafter swells and forms a unicellular ‘‘bladder’’,
Table 1.2 Nonleguminous nodule bearing plants with Fran-kia symbioses (Prescott et al. 1996)
Family Genus
Casuarinaceae Allocasuarina
Casuarina
Ceuthostoma
Gymnostoma
Coriariaceae Coriaria
Datiscaceae Datisca
Betulaceae Alnus
Myricaceae Comptonia
Myrica
Elaeagnaceae Elaeagnus
Hippophae
Shepherdia
Rhamnaceae Ceanothus
Colletia
Discaria
Kentrothamnus
Retanilla
Trevoa
Rosaceae Cercocarpus
Chaemabatia
Cowania
Dryas
Purshia
1 Symbiosis: The Art of Living 13

about 1–2 mm in size and appearing on the soil surface. Inside this bladder, the
cyanobacteria are physiologically active and dividing (Schubler and Kluge 2001). It
has been suggested that fungus could provide an important model system for
another symbiosis, the arbuscular mycorrhiza, see Fig. 1.4. Significant differences
between G. pyriforme and lichen are tabulated in Table 1.3.
Table 1.3 Difference between Geosiphon and lichen (Kluge and Schubler 2002)
Geosiphon Lichen
It represents an endocytobiotic
consortium, with the photobiont living
inside the fungal cell
There is contact between the two partners
(mycosymbiont and phycosymbioant)
in lichens
Mechanism of vegetative propagation of
the entire symbiotic system of
Geosiphon does not exist
Vegetative reproduction through soredia
and isidia by spreading both symbiotic
partners together
Geosiphon does not survive water loss Lichens are robust toward dehydration
Geosiphon is very sensitive toward high
temperature
Many lichens are resistant to high
temperatures
Geosiphon grows only in moderate light It can tolerant high light irradiance
Fig. 1.4 Schematic drawings of Geosiphon bladder compartmentation. Overview (left) and
detail (right). BLO bacteria like organism, M Mitochondrium, CW cell wall, N nucleus, NCNostoc cell, PM plasma membrane, SM symbiosome membrane, V vacuole (cf. Schubler and
Kluge 2001)
14 A. Das and A. Varma
1.6 Symbiosis Between Algae and Fungi: Lichens
Lichen is an association between an alga and a fungus in which the two organisms
jointly form a thallus that is distinct from the either partners. The fungal partner is
known as the mycobiont and the algal partner as the phycobiont. Both the partners
are benefited by this symbiotic association. The fungus derives nutrition from the
alga, which in turn is protected by the fungus (Backora et al. 2006). Lichens take
the external shape of the fungal partner, and hence are named based on the fungus.
The fungus most commonly forms the majority of the lichen’s bulk, though in
filamentous and gelatinous lichens this may not always be the case. The lichen
fungus is typically a member of the Ascomycota (termed ascolichens), and rarely a
member of the Basidiomycota (termed basidiolichens). Neither the ascolichens nor
the basidiolichens form monophyletic lineages in their respective fungal phyla, but
they do form several major solely or primarily lichen-forming groups within each
phylum (Lutzoni et al. 2004).
The algal partner in lichens may be members of blue–green algae (Anabaena,Nostoc), green algae or yellow–green algae. In lichen associations, the blue–green
alga performs the dual function of both photosynthesis and nitrogen fixation.
However, if the lichen contains an additional partner, namely a green alga, then
the blue–green alga becomes relieved of its function of photosynthesis and is geared
to fix nitrogen exclusively. This is evidenced by the fact that in the presence of
green alga, in a three-member association, the blue–green alga produces more
heterocysts, which are the sites of nitrogen fixation.
Lichens are extremely slow-growing, showing about 1 mm growth per year, but
are highly tolerant to xeric conditions such as desiccation and heat. Consequently,
one can find them growing on tree trunks and rocks. However, these are very
sensitive to atmospheric pollutants. As a result, they are rarely seen near human
habitations where automobile fumes and factory effluents prevail.
1.7 Symbiosis in Bryophytes
Liverworts such as Anthoceros, Notothylas and Blassia possess blue–green algae assymbiotic partners. Here, the endophyte is cyanobacterium Nostoc. In liverworts
there are mucilage cavities on the ventral side of the thallus. This is due to the
breakdown of the cells and their replacement by mucilage. With the maturity of the
thallus, the mucilage of these cavities dries out, resulting in an air-filled chamber.
Such cavities become invaded with Nostoc, which produces more heterocysts than
in the free-living condition, thereby indicating that these are quite active in nitrogen
fixation. Secondly, within the cavity, Anthoceros produces branched hypha-like
filaments which become interspersed with algal colony. Such filaments are also
warted. As a result, the contact of the alga with the tissues of Anthoceros becomes
increased, and facilitates transport and exchange of materials between the two
symbiotic partners. While photosynthate is transported to Nostoc by bryophytes,
1 Symbiosis: The Art of Living 15
fixed nitrogen is transferred in the reverse sequence from Nostoc to bryophytes
(Rashid 1998).
1.8 Symbiosis in Pteridophytes
Azolla, a floating fern, floats on the surface of water by means of numerous, small,
closely-overlapping scale-like leaves, with their roots hanging in the water. When
a section of Azolla is examined under a microscope, filaments of Anabaena living
within ovoid cavities inside the leaves Azolla can be seen. This association of Azollawith the filaments of the blue–green alga Anabaena forms a symbiotic relationship,
which fixes atmospheric nitrogen, giving the plant access to the essential nutrient
(Peters 1977).
When free-living, the alga develops only 5–10% of its cells into heterocysts.
However, the number of heterocysts increases to 25–30% when it lives symbioti-
cally in association with Azolla. The epidermal cells inside the leaf cavity of Azollaproject inside, to form numerous multicellular hairs with warty outgrowths. These
probably serve as transfer cells for free exchange of nutrients between Azolla and
Anabaena. Azolla can absorb nitrates from the water; it can also absorb ammonia
secreted by Anabaena within the leaf cavities (http://waynesword.palomar.edu/
plnov98.htm).
Since Azolla is easy to maintain in aquarium cultures, it is an excellent source of
prokaryotic cells and heterocysts for general biology laboratory exercises on cell
structure and function. It also has an interesting heterosporous life cycle, and can
readily be adapted to laboratory exercises on symbiosis. In addition, this little fern
and its algal partner provide an important contribution toward the production of rice
for a hungry world.
A heterocyst is a differentiated cyanobacterial cell that carries out nitrogen
fixation. The heterocysts function as the sites for nitrogen fixation under aerobic
conditions. They are formed in response to a lack of fixed nitrogen (NH4+ or NO3
�).The morphological differentiation is accompanied by biochemical alterations. The
mature heterocysts contain no functional photosystem II, and cannot produce
oxygen. Instead, they contain only photosystem I, which enables them to carry
out cyclic photophosphorylation and ATP regeneration. These changes provide the
appropriate conditions for the functioning of the oxygen-sensitive nitrogenase.
Azolla is grown in rice fields and ploughed as green manure, and this can supply
up to 50–75% of the nitrogen requirement of the crop. This practice is extensivelyemployed in China and Japan as a source of biologically fixed nitrogen in rice
cultivation.
1.9 Symbiosis in Gymnosperms
Cycas is a gymnosperm, and it belongs to Cycadales. Cycas produces two types of
roots. The normal roots grow downwards in the soil, and some of the branches
of lateral roots come just above the soil and become aerial. These roots are
16 A. Das and A. Varma

apogeotropic roots that grow toward the soil surface and repeatedly branch dichot-
omously. These are known as coralloid roots. The coralloid roots become infected
with bacteria and blue–green algae like Anabaena and Nostoc. The endophyte is
found in a single layer in the intercellular spaces between the outer cortex and inner
cortex of the root.
1.9.1 Coralloid Roots of Cycas
A coralloid root is formed at the surface of the soil. Bacteria of the soil enter and
rapidly multiply in the cells of the apical portion. As a result, the cells disorganize
and the intercellular spaces are also considerably enlarged. Then, algae such as
Anabaena and Nostoc gain entry into the disorganized zone of the cortex, through
apertures formed by the bacteroid infection. These algae are found in the midcor-
tical zone as a conspicuous ring. This root, which is thus invaded by the algae,
becomes negatively geotropic, and comes just above the surface or remains a little
below the surface of the soil. They are dichotomously branched in a profuse
manner, and form the so-called ‘‘root tubercles’’. Superficially, they form coralloid
masses, and hence they are known as coralloid roots (Sambamurty 2005). Coralloid
roots are only known to occur in cycads, and in turn cycads are the only known
gymnosperms to form symbiotic relationships with nitrogen-fixing organisms
(http://www.livingdesert.org).
1.10 Symbiosis in Angiosperms
The roots of almost all higher plants are known to form mutualistic symbioses with
fungi. These latter are termed mycorrhizas. As well as with fungus, higher plants
have symbiotic associations with blue–green algae, bacteria, and actinomycetes.
Amongst the angiosperms it is only Gunnera, belonging to the family Haloraga-
ceae, which is found to have symbiosis with Nostoc. The endophyte is situated in
the glands situated on the stem at the point of attachment of the petiole. Nostocfilaments enter the cells of the gland (intracellular) and produce a large number of
heterocysts. Here also, Nostoc is heterotrophic, dependent upon the host cells for
the carbohydrate supply, as not much photosynthesis is possible in the absence of
light in the intracellular environment of host cells.
1.10.1 Mycorrhizal Symbiosis
Mycorrhizae are symbiotic associations that form between the roots of most plant
species and fungi. The term mycorrhizas (fungus roots, from the Greek: mykes =
mushroom or fungus and rhiza = root).
1 Symbiosis: The Art of Living 17
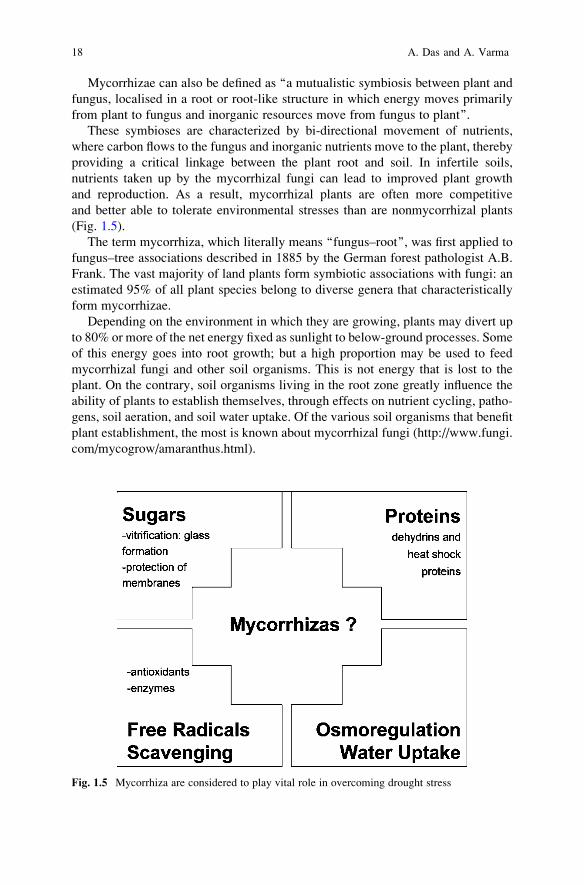
Mycorrhizae can also be defined as ‘‘a mutualistic symbiosis between plant and
fungus, localised in a root or root-like structure in which energy moves primarily
from plant to fungus and inorganic resources move from fungus to plant’’.
These symbioses are characterized by bi-directional movement of nutrients,
where carbon flows to the fungus and inorganic nutrients move to the plant, thereby
providing a critical linkage between the plant root and soil. In infertile soils,
nutrients taken up by the mycorrhizal fungi can lead to improved plant growth
and reproduction. As a result, mycorrhizal plants are often more competitive
and better able to tolerate environmental stresses than are nonmycorrhizal plants
(Fig. 1.5).
The term mycorrhiza, which literally means ‘‘fungus–root’’, was first applied to
fungus–tree associations described in 1885 by the German forest pathologist A.B.
Frank. The vast majority of land plants form symbiotic associations with fungi: an
estimated 95% of all plant species belong to diverse genera that characteristically
form mycorrhizae.
Depending on the environment in which they are growing, plants may divert up
to 80% or more of the net energy fixed as sunlight to below-ground processes. Some
of this energy goes into root growth; but a high proportion may be used to feed
mycorrhizal fungi and other soil organisms. This is not energy that is lost to the
plant. On the contrary, soil organisms living in the root zone greatly influence the
ability of plants to establish themselves, through effects on nutrient cycling, patho-
gens, soil aeration, and soil water uptake. Of the various soil organisms that benefit
plant establishment, the most is known about mycorrhizal fungi (http://www.fungi.
com/mycogrow/amaranthus.html).
Fig. 1.5 Mycorrhiza are considered to play vital role in overcoming drought stress
18 A. Das and A. Varma
1.10.1.1 Types of Mycorrhizal Fungi
So far seven types of mycorrhizae have come into general use over the years, on the
basis of morphology and anatomy but also of either host-plant taxonomy or fungal
taxonomy (Srivastava et al. 1996; Smith and Read 1997). These are: ectomycor-
rhiza, endomycorrhiza or arbuscular mycorrhiza, ericoid mycorrhiza, arbutoid
mycorrhiza, monotropoid mycorrhiza, ect-endomycorrhiza, and orchidaceous
mycorrhiza.
Ectomycorrhiza
Hyphae surround but do not penetrate the root cells. Ectomycorrhizae are commonly
found in trees growing in temperate regions. The plant symbionts include both
Gymnosperms and Angiosperms. Some have been found in the tropics also. The
willow family (Salicaceae), birch family (Betulaceae), beech family (Fagaceae) and
pine family (Pinaceae) have ectomycorrhizal associations. This possibly makes the
trees more resistant to cold, dry conditions.
The hyphae grow in between the cortical and epidermal cells of the root, forming
a network called the ‘‘Hartig net’’. A mantle of hyphae covers the root surface, and
mycelium extends from the mantle into the soil. It provides a large surface area for
the interchange of nutrients between host and the fungi. Most ectomycorrhizal fungi
are basidiomycetes, but ascomycetes are also involved.
Arbuscular Mycorrhiza
The term refers to the presence of intracellular structures — vesicles and arbu-
scules — that form in the root during various phases of development. These
mycorrhizae are the most commonly recorded group, since they occur on a vast
taxonomic range of plants, both herbaceous and woody species. The plant symbiont
ranges from Bryophytes to Angiosperms. Aseptate hyphae enter the root cortical
cells and form characteristic vesicles and arbuscules. The plasmalemma of the
host cell invaginates and encloses the arbuscules. Arbuscular mycorrhizal (AM)
fungi belong to nine genera: Gigaspora, Scutellospora, Glomus, Acaulospora,Entrophospora, Archaeospora, Gerdemannia, Paraglomus and Geosiphon, the
only known fungal endosymbiosis with cyanobacteria (Fig. 1.6).
Ericoid Mycorrhiza
In the Ericaceae, the heather family, the ectomycorrhizal hyphae form a web
surrounding the roots. The ericoid mycorrhizae are endomycorrhizae in the general
sense, since the fungal symbiont penetrates and establishes into the cortical cells.
1 Symbiosis: The Art of Living 19

Infection of each cortical cell takes place from the outer cortical wall; lateral spread
from cell to cell does not occur. Infected cells appear to be fully packed with fungal
hyphae. In the ericoid mycorrhizae, the host cell dies as the association disinte-
grates, thereby restricting the functional life (i.e., nutrient absorption) of these
epidermal cells to the period prior to breakdown of the infected cell.
Arbutoid Mycorrhiza
The arbutoid mycorrhizae have characteristics which are found in both ECM and
other endomycorrhizae. Intracellular penetration of cortical cells and formation of a
sheath can occur, and a ‘‘Hartig’s net’’ is present. A feature distinguishing them
from ericoid mycorrhizae is the presence of dolipore septum in internal hyphae.
Fungal associates in arbutoid mycorrhizae belong to basidiomycetes.
Monotropoid Mycorrhiza
This group of mycorrhiza is associated with the achlorophyllous plants in the family
Monotropaceae. These mycorrhizae are very similar to the ECM, and form a
distinct sheath and ‘‘Hartig’s net’’. However, they exhibit a distinctive type of
intracellular penetration in cortical cells that is unlike other endomycorrhizal
types. The fungus forms a peg, into the cell wall.
Ect-endomycorrhiza
These are formed with the members of the Pinaceae. These mycorrhizae form a
‘‘Hartig’s net’’ in the cortex of the root, but develop little or no sheath. Intracellular
Fig. 1.6 Diagramatic representation of molecular taxonomic position of symbiotic fungi (cf. Das
et al. 2007)
20 A. Das and A. Varma
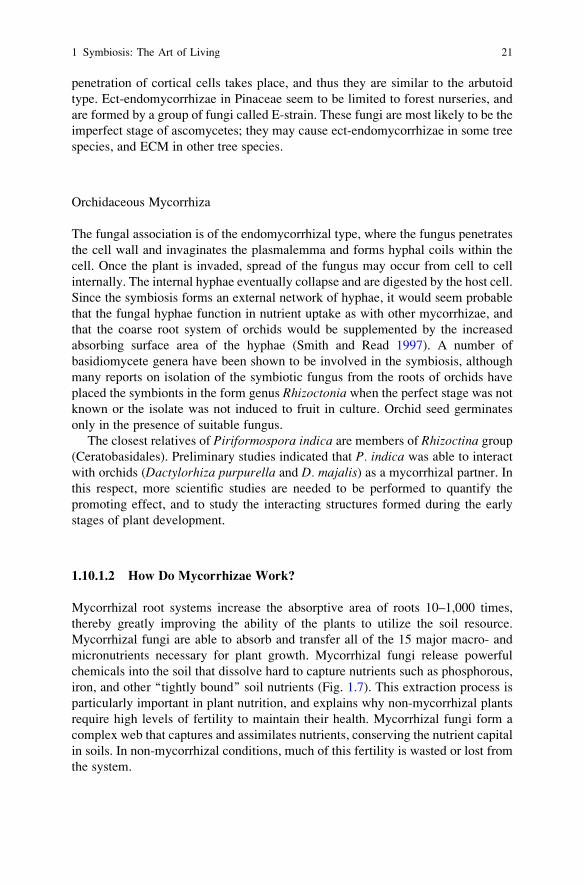
penetration of cortical cells takes place, and thus they are similar to the arbutoid
type. Ect-endomycorrhizae in Pinaceae seem to be limited to forest nurseries, and
are formed by a group of fungi called E-strain. These fungi are most likely to be the
imperfect stage of ascomycetes; they may cause ect-endomycorrhizae in some tree
species, and ECM in other tree species.
Orchidaceous Mycorrhiza
The fungal association is of the endomycorrhizal type, where the fungus penetrates
the cell wall and invaginates the plasmalemma and forms hyphal coils within the
cell. Once the plant is invaded, spread of the fungus may occur from cell to cell
internally. The internal hyphae eventually collapse and are digested by the host cell.
Since the symbiosis forms an external network of hyphae, it would seem probable
that the fungal hyphae function in nutrient uptake as with other mycorrhizae, and
that the coarse root system of orchids would be supplemented by the increased
absorbing surface area of the hyphae (Smith and Read 1997). A number of
basidiomycete genera have been shown to be involved in the symbiosis, although
many reports on isolation of the symbiotic fungus from the roots of orchids have
placed the symbionts in the form genus Rhizoctonia when the perfect stage was notknown or the isolate was not induced to fruit in culture. Orchid seed germinates
only in the presence of suitable fungus.
The closest relatives of Piriformospora indica are members of Rhizoctina group(Ceratobasidales). Preliminary studies indicated that P. indica was able to interact
with orchids (Dactylorhiza purpurella and D. majalis) as a mycorrhizal partner. In
this respect, more scientific studies are needed to be performed to quantify the
promoting effect, and to study the interacting structures formed during the early
stages of plant development.
1.10.1.2 How Do Mycorrhizae Work?
Mycorrhizal root systems increase the absorptive area of roots 10–1,000 times,
thereby greatly improving the ability of the plants to utilize the soil resource.
Mycorrhizal fungi are able to absorb and transfer all of the 15 major macro- and
micronutrients necessary for plant growth. Mycorrhizal fungi release powerful
chemicals into the soil that dissolve hard to capture nutrients such as phosphorous,
iron, and other ‘‘tightly bound’’ soil nutrients (Fig. 1.7). This extraction process is
particularly important in plant nutrition, and explains why non-mycorrhizal plants
require high levels of fertility to maintain their health. Mycorrhizal fungi form a
complex web that captures and assimilates nutrients, conserving the nutrient capital
in soils. In non-mycorrhizal conditions, much of this fertility is wasted or lost from
the system.
1 Symbiosis: The Art of Living 21
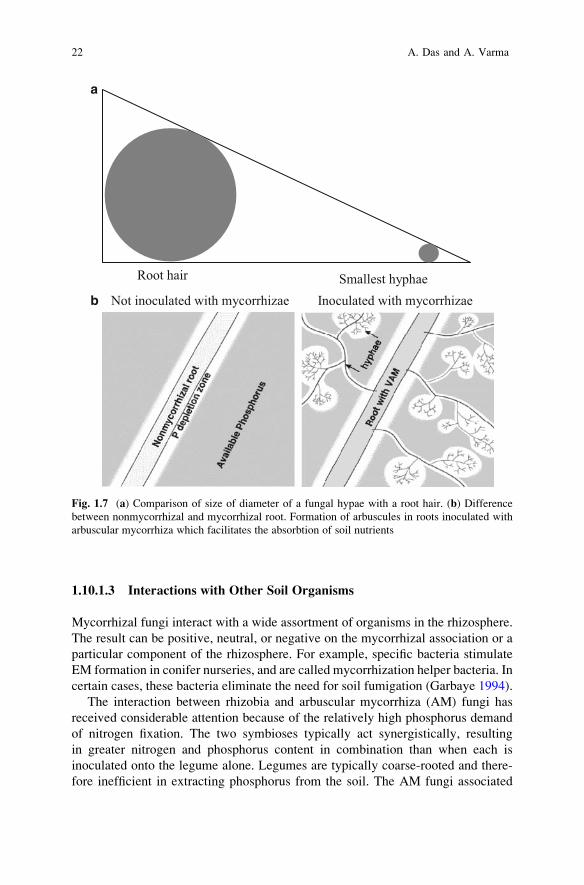
1.10.1.3 Interactions with Other Soil Organisms
Mycorrhizal fungi interact with a wide assortment of organisms in the rhizosphere.
The result can be positive, neutral, or negative on the mycorrhizal association or a
particular component of the rhizosphere. For example, specific bacteria stimulate
EM formation in conifer nurseries, and are called mycorrhization helper bacteria. In
certain cases, these bacteria eliminate the need for soil fumigation (Garbaye 1994).
The interaction between rhizobia and arbuscular mycorrhiza (AM) fungi has
received considerable attention because of the relatively high phosphorus demand
of nitrogen fixation. The two symbioses typically act synergistically, resulting
in greater nitrogen and phosphorus content in combination than when each is
inoculated onto the legume alone. Legumes are typically coarse-rooted and there-
fore inefficient in extracting phosphorus from the soil. The AM fungi associated
Root hair Smallest hyphae Inoculated with mycorrhizae Not inoculated with mycorrhizae
a
b
Fig. 1.7 (a) Comparison of size of diameter of a fungal hypae with a root hair. (b) Difference
between nonmycorrhizal and mycorrhizal root. Formation of arbuscules in roots inoculated with
arbuscular mycorrhiza which facilitates the absorbtion of soil nutrients
22 A. Das and A. Varma

with legumes are an essential link for adequate phosphorus nutrition, leading to
enhanced nitrogenase activity that in turn promotes root and mycorrhizal growth.
Mycorrhizal fungi colonize feeder roots, and thereby interact with root patho-
gens that parasitize this same tissue. In a natural ecosystem where the uptake of
phosphorus is low, a major role of mycorrhizal fungi may be protection of the root
system from endemic pathogens such as Fusarium spp. Mycorrhizae may stimulate
root colonization by selected biocontrol agents, but our understanding of these
interactions is meager. Much more research has been conducted on the potential
effects of mycorrhizal colonization on root pathogens. Mycorrhizal fungi may
reduce the incidence and severity of root diseases. The mechanisms proposed to
explain this protective effect include: (1) development of a mechanical barrier —
especially the mantle of the EM — to infection by pathogens, (2) production
of antibiotic compounds that suppress the pathogen, (3) competition for nutrients
with the pathogen, including production of siderophores, and (4) induction of
generalized host defense mechanisms.
1.10.1.4 Novel Symbiosis: Piriformospora indica with Higher Plants
Mycorrhizas, which are well-known for their exchange of nutrients and water
between the partners in the symbiotic association, was discovered way back in
1898. However, despite their important role in agriculture and other related areas,
their cultivation on culture media has not been possible to date. This restricts the
exploitation of the biotechnological applications of this mycorrhiza, as they can not
be grown in the absence of a living plant.
Piriformospora indica (Hymenomycetes, Basidiomycota) is the only cultivable
endophyte that colonizes roots. This mycorrhizal fungus can grow on an artificial
medium. P. indica can be multiplied in mass scale on cheap and industrially
produced simplified nutrient medium. Inoculation with the fungus and application
of fungal culture filtrate promotes plant growth and biomass production. Due to its
ease of culture, this fungus provides a model organism for the study of beneficial
plant–microbe interactions and a new tool for improving plant production systems
(Varma et al. 1998; Varma et al. 1999; Varma et al. 2001).
P. indica vastly improves the growth and overall biomass production of diverse
hosts, including legumes, medicinally and economically important. A pronounced
growth-promotional effect has also been seen with terrestrial orchids. The medicinal
plants which have been tested in laboratory conditions as well as in the extensive
field trial are Bacopa moniera (Sahay and Varma 1999, 2000), Azadirachta indica,(Singh et al. 2002, 2003), Withania somnifera, Spilanthes calva (Rai et al. 2001),
Adhatoda vasica (Rai and Varma 2005), and Chlorophytum borivilianum (Mathur
et al. 2008). Rai et al. (2001) reported growth increase in Withania somniferaand Spilanths calva when they were interacted with the fungus P. indica. Thefungus also provides protection when inoculated into tissue culture-raised
plantlets, by overcoming the ‘‘transient transplant shock’’ on transfer to the field,
leading to almost 100% survival (Mathur et al. 2008). The fungus forms inter- and
1 Symbiosis: The Art of Living 23
intracellular hyphae in the root cortex, often differentiating into dense hyphal coils
(arbuscule-like structures), spore and vesicle-like structures. As with AM fungi,
hyphae multiply within the host cortical tissues and never traverse through the
endodermis. Likewise, they also do not invade the aerial portion of the plant (stem
and leaves).
P. indica is a potential candidate to serve as biofertilizer, bioprotector, bioregu-
lator, bioherbicide/weedicide, and to combat environmental stresses (chemical,
thermal, and physical). The fungus also preserves soil fertility, and improves
plant health as well. Similarly to arbuscular mycorrhizal fungi, P. indica stimulates
nitrate assimilation in the roots and solubilizes insoluble phosphatic components in
the soil. Recent experiments have amply demonstrated that P. indica provides
resistance against heavy-metal contamination in the soil. Piriformospora indica,promotes growth of Arabidopsis and tobacco seedlings, and stimulates nitrogen
accumulation and the expression of the genes for nitrate reductase and the starch-
degrading enzyme glucan–water dikinase (SEX1) in roots (Sherameti et al. 2005).
P. indica is been reported to induce resistance to fungal diseases in the mono-
cotyledonous plant barley, along with tolerance to salt stress. The beneficial effect
on the defense status is detected in distal leaves demonstrating a systemic induction
of resistance by a root-endophytic fungus. The systemically altered ‘‘defense
readiness’’ is associated with an elevated antioxidative capacity due to an activation
of the glutathione–ascorbate cycle and an overall increase in grain yield. Since
P. indica can be easily propagated in the absence of a host plant, we conclude that
the fungus could be exploited to increase disease resistance as well as yield in crop
plants (Waller et al. 2005). The axenically cultivable root endophyte Piriformosporaindica has also been described as a model organism to be used as a potential for
biocontrol strategies. It is able to increase biomass and grain yield of crop plants. In
barley, the endophyte induces local and systemic resistance to fungal diseases and
to abiotic stress. To elucidate the lifestyle of P. indica, scientists have analyzed its
symbiotic interaction and endophytic development in barley roots. It was found that
fungal colonization increases with root tissue maturation. The root tip meristem
showed no colonization, and the elongation zone showed mainly intercellular
colonization. In contrast, the differentiation zone was heavily infested by inter-
and intracellular hyphae and intracellular chlamydospores. The majority of hyphae
were present in dead rhizodermal and cortical cells that became completely filled
with chlamydospores. In some cases, hyphae penetrated cells and built a meshwork
around plasmolyzed protoplasts, suggesting that the fungus either actively kills
cells or senses cells undergoing endogenous programmed cell death. Seven
days after inoculation, expression of barley BAX inhibitor-1 (HvBI-1), a gene
capable of inhibiting plant cell death, was attenuated. Consistently, fungal prolifer-
ation was strongly inhibited in transgenic barley overexpressing GFP-tagged
HvBI-1, which shows that P. indica requires host cell death for proliferation in
differentiated barley roots. It has been suggested that the endophyte interferes with
the host cell death program to form a mutualistic interaction with plants (Deshmukh
et al. 2006).
Piriformospora indica, a basidiomycete of the Sebacinaceae family, promotes
the growth, development, and seed production of a variety of plant species too.
24 A. Das and A. Varma

Arabidopsis plants colonized with the fungus produce 22% more seeds than unco-
lonized plants. Deactivating the Arabidopsis single-copy gene DMI-1, which
encodes an ion carrier, required for mycorrhiza formation in legumes, does not
affect the beneficial interaction between the two symbiotic partners. A leucine-rich
repeat protein is required for growth promotion and enhanced seed production
mediated by the endophytic fungus Piriformospora indica in Arabidopsis thaliana(Shahollari et al. 2007).
The fungus has great potential for application in agro-forestry, flori-horticulture,
arboriculture, viticulture and especially for better establishment of tissue culture
raised plants — much needed for the application in plant industry. This would
open up numerous opportunities for the optimization of plant productivity in
both managed and natural ecosystems, while minimizing risks of environmental
damage.
1.11 Conclusions
In this chapter, an attempt has been made to give an overview of the symbiotic
relationship between microorganisms and also between plants and microbes. In
recent years, great progress has been made in understanding the genetic interplay
involved in plant–microbe symbiosis as well as between different microbes. In both
cases, mankind has been able to benefit from the fascinating symbiotic relationship.
However, there are areas which need to be investigated to get a better perception of
the symbiotic relationship before we get to enjoy the full benefits. The recent
application of genomics in this field has been successful in discovering several
aspects of the symbiotic association which could be useful in the near future. It is
expected that discoveries in this field would lead to its eventual application for the
improvement of agriculture and eradication of life-threatening diseases, as well as
providing a positive solution to our environmental problems.
Acknowledgements The authors are thankful to Ms. Sreelekha Chatterjee for helpful
contribution in preparation of the manuscript.
References
Anyia AO, Archambault DJ, Slaski JJ (2004) Growth-promoting effects of the diazotroph Azorhi-zobium caulinodans on Canadian wheat cultivars. Fourth International Crop Science Congress,http://www.cropscience.org.au/icsc2004/poster/2/5/6/863_anyiaa.htm
Backora M, Pawlik-Skowronskab B, Tomkoc J, Budovaa J, Sanita di Toppid L (2006) Response to
copper stress in aposymbiotically grown lichen mycobiont Cladonia cristatella: uptake,
viability, ergosterol and production of non-protein thiols. Mycol Res 110:994–999
1 Symbiosis: The Art of Living 25
Becker A, Niehaus K, Puhler A (2000) The role of rhizobial extracellular polysaccharides (EPS) in
the Sinorhizobium meliloti-alfalfa symbiosis. In: Triplett EW (eds) Prokaryotic nitrogen
fixation: a model for analysis of a biological process. Horizon Scientific, Norfolk, UK, pp
433–448
Bonfante P (1991) Biologia delle micorrize nel Centro di Studio sulla Micologia: il passata,
il presente e il futuro. In: Estratto da Funghi, Piante e Suolo. Quarat’anni di ricerche del Centro
di Studio sulla Micologia del Terreno nel centenario della nascita del suo fondatore Beniamino
Peyronel. Centro di Studio sulla Micologia del Terreno, CNR, Torino, pp 135–156
Boogerda FC, van Rossuma D (1997) Nodulation of groundnut by Bradyrhizobium: a simple
infection process by crack entry. FEMS Microbiol Rev 21:5–27
Brewin JJ (1991) Development of the legume root nodule. Am Rev Cell Biol 7:191–226
Das A, Prasad R, Srivastava A, Giang PH, Bhatnagar K, Varma A (2007) Fungal siderophores:
structure, functions and regulation. In: Varma A, Chincholkar S (eds) Microbial siderophores.
Springer, Berlin, pp 3–5
Dazzo F, Hubbell D (1982) Control of root hair infection. In: Broughton W (ed) Ecology of
nitrogen fixation, vol II. Rhizobium. Oxford University Press, Oxford, pp 274–310
Dazzo F, Wopereis JL (2000) Unraveling the infection process in the Rhizobium-legume symbio-
sis by microscopy. In: Triplett EW (ed) Prokaryotic nitrogen fixation: a model system for
analysis of a biological process. Horizon Scientific, Norfolk, UK, pp 312–318
Dazzo F, Hollingsworth R, Philip-Hollingsworth S, Robles M, Olen T, Salzwedel J, Djordjevic M,
Rolfe B (1988) Recognition process in the Rhizobium trifolii-white clover symbiosis. In: Bothe
H, de Bruijn FJ, Newton WE (eds) Nitrogen fixation: hundred years after. Gustav Fischer,
Stuttgart, pp 112–114
Deshmukh S, Huckelhoven R, Schafer P, Imani J, Sharma M, Weiss M, Waller F, Kogel KH
(2006) The root endophytic fungus Piriformospora indica requires host cell death for prolifer-ation during mutualistic symbiosis with barley. Proc Natl Acad Sci USA 103:18450–18457
Devin RM, Witham FH (1986) Plant physiology, 4th edn. CBS, New Delhi, pp 163–166
Felle HH, Kondorosi E, Kondorosi A, Schultze M (1998) The role of ion fluxes in Nod factor
signaling in Medicago sativa. Plant J 13:455–451Garbaye J (1994) Helper bacteria: a new dimension to the mycorrhizal symbiosis. New Phytol
128:197–210
Gonzalez V, Lozano L, Castillo-Ramirez S, Gonzalez IH, Bustos P, Santamaria RI, Fernandez JL,
Acosta JL Davila G (2008) Evolutionary genomics of the nitrogen fixing symbiotic bacteria.
In: Nautiyal CS, Dion P (eds) Molecular mechanism of plant and microbe coexistence.
Springer, Berlin, pp 183–186
Halverson LJ, Stacey E (1986) Signal exchange in plant-microbe interactions. Microbiol Rev
50:193–225
Hawker LE, Harrison RW, Nicholls VO, Ham AM (1957) Studies on vesicular-arbuscular
endophytes. I. A strain of Pythium ultimum Trow. in roots of Allium ursinum L. and other
plants. Trans Br Mycol Soc 40:375–390
Kelley AP (1931) The concept of mycorrhiza. Mycologia 23:147–151
Kishinevsky BD, Law JI, Strijdom BW (1988) Detection of lectins is nodulated peanut and
soybean plants. Planta 176:10–18
Kluge M, Schubler W (2002) The Nostoc Geosiphon endocytobiosis. In: Rai AN, Bergman B,
Rasmussen U (eds) Cyanobacteria in symbiosis. Springer, Berlin, pp 19–30
Koide RT, Mosse B (2004) A history of research on arbuscular mycorrhiza. Mycorrhiza 14:
145–163
Lersten NR, Horner HT (1976) Bacterial leaf nodule symbiosis in angiosperms with emphasis on
Rubiaceae and Myrsinaceae. Bot Rev 42:145–214
Lohman ML (1927) Occurrence of mycorrhiza in Iowa forest plants. Univ Iowa Stud Nat Hist
11:33–58
Lutzoni et aletal (2004) Assembling the fungal tree of life: progress, classification, and evolution
of subcellular traits. Am J Bot 91:1446–1480
26 A. Das and A. Varma
Mathur A, Mathur AK, Verma P, Yadav S, Gupta ML, Darokar MP (2008) Biological hardening
and genetic fidelity testing of micro-cloned progeny of Chlorophytum borivilianum Sant. Et
Fernand. Aust J Bot 7:1046–1053
Miller AL, Raven JA, Sprent JI, Weisenseel MH (1986) Endogenous ion currents traverse roots
and hairs of Trifolium repens. Plant Cell Environ 9:79–83
Nicholls VO (1952) Studies on the association between certain soil fungi and the roots of some
members of the Liliiflorae. PhD dissertation, Department of Botany, University of Bristol
Peters GA (1977) The azolla–Anabaena azollae symbiosis. In: Hollaender A (ed) Genetic engi-
neering for nitrogen fixation. Plenum, London, pp 231–258
Prescott LM, Harley JP, Klein DA (1996) Microbiology, 3rd edn. WCB, Chicago, pp 496, 871
Rai MK, Varma A (2005) Arbuscular mycorrhiza-like biotechnological potential of Piriformos-pora indica, which promotes the growth of Adhatoda vasica. Electron J Biotechnol 8:107–112
Rai MK, Singh AN, Arya D, Varma A (2001) Positive growth responses of the medicinal plants
Withania somnifera and Spilanthes calva to inoculation by Piriformospora indica in a field
trial. Mycorrhiza 11:123–128
Rashid A (1998) An introduction to bryophyta (diversity, development and differentiation), 1st
edn. Vikas, New Delhi, p 59
Remy W, Taylor TN, Haas H, Kerp H (1994) Four-hundred-million-year-old vesicular arbuscular
mycorrhizae. Proc Natl Acad Sci USA. 91:11841–11843
Sahay NS, Varma A (1999) Piriformospora indica: a new biological hardening tool for micro-
propagated plants. FEMS Microbiol Lett 181:297–302
Sahay NS, Varma A (2000) Biological approach towards increasing the survival rates of micro-
propagated plants. Curr Sci 78:126–129
Sambamurty AVSS (2005) A textbook of bryophytes, pteridophytes, gymnosperms and
paleobotany. I K International, New Delhi, pp 335–338
Schubler A, Kluge M (2001) Geosiphon pyriforme, an endocytosymbiosis between fungus and
cyanobacteria, and its meaning as a model system for arbuscular mycorrhizal research. In:
Hock B (ed) The mycota IX fungal association. Springer, Berlin, pp 151–161
Shahollari B, Vadassery J, Varma A, Oelmuller R (2007) A leucine-rich repeat protein is required
for growth promotion and enhanced seed production mediated by the endophytic fungus
Piriformospora indica in Arabidopsis thaliana. Plant J 50:1–13Sherameti I, Shahollari B, Venus Y, Altschmied L, Varma A, Oelmuller R (2005) The endophytic
fungus Piriformospora indica stimulates the expression of nitrate reductase and the starch-
degrading enzyme glucan-water dikinase in tobacco and Arabidopsis roots through a homeo-
domain transcription factor which binds to a conserved motif in their promoters. J Biol Chem
280:26241–26247
Simon L, Bousquet J, Levesque RC, Lalonde M (1993) Origin and diversification of endomycor-
rhizal fungi and coincidence with vascular land plants. Nature 363:67–69
Singh AR, Singh AN, Varma A (2002) Piriformospora indica – in vitro raised leguminous plants:
a new dimension in establishment and phyto-promotion. Indian J Biotechnol 1:372–376
Singh AN, Singh AR, Kumari M, Rai MK, Varma A (2003) Biotechnology importance of
Piriformospora indica — a novel symbiotic mycorrhiza-like fungus: an overview. Indian
J Biotechnol 2:65–75
Smith SE, Read DJ (1997) Mycorrhizal symbiosis. Academic, San Diego, pp 605–606
Smith G, Swort S, Lugtenberg V, Kigne JW (1992) Molecular mechanism of attachment of
bacteria to plant roots. Mol Microbiol 6:2897–2903
Sprent JI (1989) Tansley review no. 15: which steps are essential for the formation of functional
legume nodules? New Physiol 111:129–153
Srivastava D, Kapoor R, Srivastava SK, Mukerji KG (1996) Vesicular arbuscular mycorrhiza:
an overview. In: Mukherji KG (ed) Concepts in mycorrhizal research. Kluwer, Dordrecht,
pp 1–39
Trappe JM (2005) A.B. Frank and mycorrhizae: the challenge to evolutionary and ecologic theory.
Mycorrhiza 15:277–281
1 Symbiosis: The Art of Living 27
Trappe JM, Berch SM (1985) The prehistory of mycorrhizae: A.B. Frank’s predecessors. In:
Proceedings of the 6th North Americanconference on mycorrhizae. Forest Research Laborato-
ry, Oregon State University, Corvallis, OR, USA, pp 2–11
Van Egeraat AWSM (1975) The possible role of homoserine in the development of Rhizobiumleguminosarum in the rhizosphere of pea seedlings. Plant Soil 42:381–386
Varma A (1998) Mycorrhizae, the friendly fungi: what we know, what we should know and how
do we know? In: Varma A (ed) Mycorrhiza manual. Springer, Berlin, pp 1–24
Varma A, Verma S, Sudha, Sahay N, Britta B, Franken P (1999) Piriformospora indica — a
cultivable plant growth promoting root endophyte with similarities to arbuscular mycorrhizal
fungi. Applied Environ Microbiol 65:2741–2744
Varma A, Singh A, Sudha, Sahay NS, Sharma J, Roy A, Kumari M, Rana D, Thakran S, Deka D,
Bharti K, Hurek T, Blechert O, Rexer KH, Kost G, Hahn A, Maier W, Walter M, Strack D,
Kranner I (2001) In: Hock B (ed) Piriformospora indica: axenically culturable mycorrhiza-like
endosymbiotic fungus. The Mycota IX. Springer, Berlin, pp 151–161
Vassa J, de Billy F, Camut S, Truchet E (1990) Correlation between ultrastructural differentiation
of bacteroids and nitrogen fixation in alfalfa nodules. J Bacteriol 172:4295–4306
Waller F, Achatz B, Baltruschat H, Fodor J, Becker K, Fischer M, Heier T, Huckelhoven R,
Neumann C, von Wettstein D (2005) The endophytic fungus Piriformospora indica repro-
grams barley to salt-stress tolerance, disease resistance, and higher yield. Proc Natl Acad Sci
USA 102:13386–13391
Xavier LJC, Germida JJ (2002) Response of lentil under controlled conditions to co-inoculation
with arbuscular mycorrhizal fungi and rhizobia varying in efficacy. Soil Biol Biochem 34:
181–188
28 A. Das and A. Varma
Chapter 2
Analysis of Rhizosphere Fungal Communities
Using rRNA and rDNA
Ari Jumpponen
2.1 Introduction
Soils and soil-borne microbial communities are probably the greatest source of
organismal diversity on Earth. In this soil matrix, plant roots and the soil impacted
by those roots – the rhizosphere – host a great diversity of fungi. Fungal community
composition in soil and rhizosphere has been assessed by growing fungi from
environmental samples in different pure culture media. These studies have provided
some impressive and comprehensive volumes of fungi (Domsch et al. 1980;
Rambelli et al. 1983). However, such culture-based studies may suffer from some
serious limitations because many soil-borne organisms can be difficult to bring into
pure culture, or because the diversity is shadowed by few fast-growing organisms
that hamper detection of others. The application of molecular techniques has
resulted in great improvements in our understanding of the rhizosphere fungal
ecology and revolutionized the tools available for exploring environmental fungal
communities (Horton and Bruns 2001). A majority of these fungal community
studies use PCR-based tools that specifically target the fungal ribosomal RNA
(rRNA)-encoding genes (rDNA) or the non-coding regions of the rRNA gene
repeats. The rDNA is a convenient target as the fungal rDNA is arranged in tandem
repeats in multiple copies that contain both coding regions for primary rRNAs and
non-coding regions with various levels of sequence conservation.
The rRNA genes and their spacer regions are extremely useful for detecting and
identifying the fungi in complex environmental samples. However, rDNA may
persist in the environmental DNA pools for organisms that maintain no metabolic
activity and are not necessarily participating in the ecosystem functions at the time
of assessment. This results in a fundamental difficulty of interpreting rDNA assays:
the environmental DNA pools can maintain a large component of organisms that
A. Jumpponen
Division of Biology, Kansas State University, Manhattan, KS 66506, USA
e-mail: [email protected]
A. Varma and A.C. Kharkwal (eds.), Symbiotic Fungi, Soil Biology 18, 29
DOI: 10.1007/978‐3‐540‐95894‐9_2, # Springer‐Verlag Berlin Heidelberg 2009

were once active in the environment but which presently remain dormant and
inactive community components or are present as residual naked DNA detectable
via PCR-based approaches. Use of rRNA molecules extracted directly from the
environment presents an exciting alternative which specifically targets those com-
munities that are active at the time of sampling (Girvan et al. 2004). The underlying
assumptions are that rRNA is less stable than rDNA in the environment and that the
metabolically active organisms maintain higher numbers of rRNA, or transcribe
and process the rRNA precursors at a higher rate (Anderson and Parkin 2007;
Prosser 2002).
This chapter describes a relatively rapid, kit-based application of rRNA-based
community analysis from Andropogon gerardii rhizosphere in a tallgrass prairie
ecosystem. Although one should be careful in extrapolating rRNA-based commu-
nity assessment into enumeration of active cells in the environment, rRNA assays
do provide a different view of the community when compared to rDNA-based
assays (Duineveld et al. 2001). In the effort described here, the extracted rRNAs
were reverse-transcribed, PCR-amplified, cloned and sequenced to assay the rhizo-
sphere community composition at one snapshot in this environment. To test con-
gruence among the rRNA- and rDNA-inferred community compositions, rDNA
was also extracted from the same samples and subjected to community analyses
through PCR-amplicon sequencing. The primary hypotheses included: (1) rRNA
serves as a convenient target for molecular fungal community analysis and (2)
fungal communities inferred from rRNA data include taxa that are a subset of those
observed in the fungal communities inferred from rDNA. A further inference from
the latter hypothesis implies that the species richness in the rDNA-assayed com-
munities is higher than that in the rRNA-assayed ones.
2.2 Materials
2.2.1 Equipment
Liquid nitrogen vapor cryoshipper
FastPrep instrument
Microcentrifuge (refrigerated and nonrefrigerated)
Rotating shaker
Micropipettors
�80�C Ultrafreezer
Thermocycler
Micropipettors
Power supply
Horizontal gel electrophoresis apparatus
UV illuminator
NanoDrop Spectrophotometer
42�C Water bath
37�C Incubator with a shaker
30 A. Jumpponen
2.2.2 Materials
FastRNA pro soil-direct kit
FastDNA spin kit for soil
Nuclease-free water
Thermoscript RT-PCR two-step system
Primer for reverse transcription (NS8)
RNAse inhibitor (RNaseOUT)
10� PCR buffer
25 mM MgCl22 mM dNTPs
Forward (nu-SSU-0817-50) and reverse (nu-SSU-1536-30) fungus-specific primers
Taq polymerase
TOPO-TA cloning kit for sequencing with chemically competent E. coliLuriani Broth medium with 60 mg ml�1 ampicillin (LBA)
60% Glycerol
Liquid N2
2.2.3 Procedure
2.2.3.1 Sampling of the Rhizosphere Tissues
The plant materials were collected at the Konza Prairie Biological Station (KPBS,
39�050 N, 96�350 W), a Long-Term Ecological Research (LTER) site that represents
a native tallgrass prairie in the Flint Hills of eastern Kansas, USA. The vegetation is
dominated by big blue stem (Andropogon gerardii Vitman), indian grass [Sorghas-trum nutans (L.) Nash.], little bluestem [Schizachyrium scoparium (Michx.) Nash.],
and switch grass (Panicum virgatum L). The soil parent material is chert-bearing
limestone with the soil bulk density of 1.0 g cm�3. January mean temperature
is �3�C (range �9�C to 3�C) and the July mean temperature is 27�C (range
20–33�C). Annual precipitation averages 835 mm, 75% of which falls in the
growing season.
A total of three intact A. gerardii plants with their roots attached were excavatedin early growing season (May) from an annually burned watershed (1D) at the
KPBS. The focal watershed is a part of the regular LTER program that aims to study
the impacts of fire frequency on ecosystem structure and dynamics. The watershed
represents tallgrass prairies under a frequent fire cycle. The plant roots were shaken
free of loose soil and ca. 10 cm of the root material still attached to the identifiable
A. gerardii aboveground tissues were transferred to the Lysing Matrix E of the
FastRNA Pro Soil-Direct kit (Qbiogene, Carlsbad, CA, USA). The tubes with the
Lysing Matrix and the A. gerardii tissues were immediately flash-frozen in a liquid
nitrogen cryoshipper (Mini-Moover Vapor Shipper, Chart Biomedical, Marietta,
2 Analysis of Rhizosphere Fungal Communities Using rRNA and rDNA 31

GA, USA) to avoid degradation of the RNA. The samples were maintained frozen
in the cryoshipper until the nucleic acid extraction.
2.2.3.2 Nucleic Acid Extraction
The A. gerardii roots and the soil adhering to the roots were homogenized in the
FastPrep instrument (Q-BioGene, Irvine, CA, USA) at setting 6 for 40 s in 1 ml
RNApro Soil Lysis Solution and total RNA extracted using FastRNA Pro Soil-
Direct kit as outlined by the kit manufacturer. Note that use of nuclease-free plastic
disposables, cleaning the work surfaces with nuclease eliminators and keeping the
extracts on ice will minimize the total RNA loss during the extractions. To obtain
the genomic or total environmental DNA from the same samples, the nucleic acids
that were eluted in nuclease-free water after the phenol-chloroform clean-up and
the ethanol precipitation included in the FastRNA Pro Soil-Direct protocol were
divided into two 200 ml aliquots. One of the two aliquots was cleaned up as
instructed by the manufacturer of the FastRNA Pro Soil-Direct kit and eluted in
100 ml nuclease-free water with 100 units of RNaseOUT (Invitrogen, Carlsbad, CA,
USA) to inhibit RNA degradation. The second aliquot was stored on ice until DNA
was isolated using components of the FastDNA Spin Kit for Soil (Q-BioGene,
Carlsbad, CA, USA). The DNA aliquot was combined with 978 ml of the Sodium
Phosphate Buffer and 122 ml of the MP Buffer, mixed with 250 ml of the PPS
reagent by frequent vortexing over a period of 10 min. After pelleting the precipi-
tant at 14,000 g for 5 min, the supernatant was treated as instructed by the FastDNA
Spin Kit manufacturer and eluted in 100 ml of nuclease-free water. Both nucleic
acid extracts were stored on ice or in �80�C until further processed.
2.2.3.3 Reverse Transcription of the rRNA
The extracted rRNAs were reverse-transcribed using Thermoscript RT-PCR two-
step system (Invitrogen, Carlsbad, CA, USA). To acquire a near full-length cDNA
of the small subunit (SSU) of the rRNA, NS8 primer (White et al. 1990) located
near the 30-end of the SSU was chosen. This primer choice for reverse transcription
also permits use of a number of nested priming sites within the SSU. The rRNAs
were denatured prior to the first strand cDNA synthesis. For denaturing, 2 ml of eachRNA template was combined with 1 ml of nuclease-free 10 mMNS8 primer, 2 ml ofthe 10 mM dNTP mix and 7 ml of nuclease free H2O and incubated at 65�C for 5
min in an Eppendorf Mastercycler (Hamburg, Germany). The denatured RNAs
were transferred to ice and combined with 1 ml of 0.1 M DTT, 1 ml of RNaseOUT(40 U ml�1; Invitrogen), 1 ml nuclease-free H2O, and 1 ml ThermoScript Reverse
Transcriptase (Invitrogen). Reverse transcription was carried out in an Eppendorf
32 A. Jumpponen
Mastercycler at 55�C for 60 min and the synthesized cDNAs returned to ice until
PCR amplification. Note that the relatively temperature-stable reverse transcriptase
used here allows higher reverse transcription temperatures and thus provides
more stringent reaction conditions for target-specific primers during the reverse
transcription.
2.2.3.4 PCR Amplification
The reverse-transcribed cDNAs and the environmental DNAs extracted from the
A. gerardii rhizospheres were PCR-amplified with Platinum Taq polymerase
(Invitrogen) using primers targeting an approximately 760bp region within the
SSU of the fungal rRNA gene (Borneman and Hartin 2000). For each 50 ml PCRreaction, 5 ml 10� PCR buffer, 5 ml 25 mM MgCl2, 5 ml 2 mM dNTPs, 1 ml of 10mM forward and reverse primers, 0.4 ml polymerase (5 U ml�1) and 2 ml of thecDNA or environmental DNA plus 30.6 ml of nuclease-free water were combined.
PCR reactions were carried out with initial 3 min denaturation at 93�C followed by
30 cycles of 1 min at 93�C, 1 min at 56�C, 2 min at 72�C and a terminal elongation
at 72�C for 8 min. Longer extension steps may be necessary for long amplicons in
complex environmental samples to minimize or eliminate the generation of artifac-
tual PCR products (Jumpponen 2007). Presence of the target-sized amplicons was
confirmed by visualizing the products by horizontal gel electrophoresis using 1.5%
agarose gels in 0.5� TBE. The PCR products were quantitated using an ND-1,000
spectrophotometer (NanoDrop Technologies, Wilmington, DE, USA) in a 1 mlvolume.
2.2.3.5 Control Reactions
To account for contaminating DNA in the samples, three controls were included.
First, to account for DNA contamination from the extraction system, a blank
extraction without a sample was carried through the extraction protocol. Second,
to account for PCR reagent-borne contaminants, a PCR control without template
cDNA or DNA was included in the PCR. Third, to account for DNA carry-over
through the RNA extraction, a control where Thermoscript reverse transcriptase
was replaced with Platinum Taq polymerase was included. All these controls
remained free of contaminants and yielded no visible PCR amplicons, indicating
absence of DNA carry-through in the RNA extraction, absence of contaminating
DNA in the DNA/RNA extraction, and absence of contaminating DNA in the PCR
reagents. Note that many rRNA extraction protocols may fail to exclude DNA, and
DNA removal with RNAse-free DNAse may be necessary.
2 Analysis of Rhizosphere Fungal Communities Using rRNA and rDNA 33
2.2.3.6 Cloning, Sequencing, and Analysis of the cDNA
and Environmental DNA Amplicons
The mixed populations of PCR products were cloned using TOPO-TA cloning
system (Invitrogen). A total of 40 ng of each PCR product from cDNA or environ-
mental DNA template was ligated into 10 ng of linearized pCR4 vector (Invitrogen)
and the circularized plasmids were transformed into competent TOP10 cells
(Invitrogen) by a 30 s heat shock in a 42�C water bath following the protocol for
TOPO-TA cloning. Bacteria were grown for an hour at 37�C under 200 rpm
agitation in 250 ml of SOC medium. A total of 10 and 100 ml of the incubated
bacteria were plated on LB agar with 60 mg ml�1 ampicillin and grown at 37�Covernight to confirm putative positive transformants. A random sample of the
transformants was screened for presence of an insert by PCR in 15 ml reactionvolumes, using conditions and cycling parameters outlined above, and the products
visualized on 1.5% TBE agarose gels with EtBr on a UV illuminator. The clone
libraries were combined with an equal volume of 60% glycerol, flash-frozen in
liquid N2 and shipped for plasmid prep and sequencing at University of Washington
High Throughput Genomics Unit (Seattle, WA, USA). A total of 96 clones from
each of the six clone libraries were randomly sampled and sequenced. Vector
contamination was removed using the automated vector trimming function in
Sequencher (Version 4.6, GeneCodes, Ann Arbor, MI, USA). The similarities to
existing rDNA sequences in the GenBank database were determined using Blast at
the National Center for Biotechnology Information (Altschul et al. 1997).
2.3 Results
2.3.1 Nucleic Acid Extraction and Reverse Transcriptionfrom the Andropogon gerardii Rhizosphere
This chapter describes simple, kit-based protocols for use of rRNA in fungal
community analysis. The RNA extraction and cDNA synthesis should be com-
pleted expediently following the environmental sampling. Otherwise, the preserva-
tion and storage of RNA from environmental samples require special caution.
The approach taken in this work included immediate sample preservation in an
N2-vapor cryoshipper that should ensure sample maintenance with minimal RNA
degradation. Furthermore, the addition of RNAse inhibitors in the final elutes aims
to minimize RNA template loss. Finally, use of extraction kits expedites the
protocol and maximizes the RNA yields, as well as usually improves RNA quality
for downstream applications.
The simple FastPrep-kit method successfully isolated reverse-transcribable and
PCR-amplifiable nucleic acids from A. gerardii rhizosphere. DNA contamination
is a serious concern in PCR-based applications – especially if cDNA is used as a
34 A. Jumpponen

primary template. Should DNA carry-through occur, the extracted total RNAs must
be further cleaned with RNAse-free DNAse. The three included controls behaved
as expected: (1) The controls with the reverse-transcriptase substituted with a
polymerase failed to produce visible PCR amplicons, indicating absence of con-
taminating DNA in the rRNA samples. (2) The extraction controls without the
environmental samples remained clean of PCR amplicons regardless of whether
or not the reverse-transcription step was included. (3) Finally, the regular PCR
controls indicated that no false PCR amplicons were generated in absence of the
template.
Universal primer NS8 was chosen for reverse transcription. NS8 provides a near
full-length SSU cDNA and thus allows use of a number of priming sites for
downstream PCR-applications. This work targeted the fungal community as a
whole by use of fungus-specific primers that have been shown to amplify fungal
targets across various fungal phyla (Borneman and Hartin 2000; Jumpponen 2003).
Other sets of SSU-targeting primers would similarly be compatible with the use of
a universal reverse transcription primer. For example, primer sets with strong bias
toward Ascomycota and Basidiomycota (Smit et al. 1999) as well as toward
Glomeromycota (Helgason et al. 1998) are readily available and should allow
target-specific amplification using the same cDNAs.
2.3.2 Community Assessment Using Reverse-TranscribedcDNAs and Environmental rDNAs
The communities observed in the A. gerardii rhizosphere contained fungi from
three phyla: Ascomycota, Basidiomycota and Glomeromycota (Table 2.1). The
abundances of the phyla varied among the libraries. While one of the three cDNA
libraries was comprised nearly exclusively of Glomeromycotan sequences (closest
affinity to Glomus mosseae), two additional cDNA libraries had a minimal Glo-
meromycotan component and were dominated by various ascomycetes. Similar
results on a phylum level were also observed in the rDNA libraries: only one of the
three libraries was dominated by various Glomeromycotan sequences (Glomusproliferum and an unknown Glomus species). The low frequency of Glomeromy-
cotan sequences as well as incongruences among the libraries are most likely
attributable to temporal and spatial dynamics in the tallgrass prairie ecosystem.
Ongoing, yet unpublished, results indicate that A. gerardii roots maintain low levels
of Glomeromycotan colonization early during the growing season, whereas other,
septate fungi are more common (Mandyam and Jumpponen, unpublished). These
results corroborate observations of mycorrhizal colonization made by others at the
KPBS (Bentivenga and Hetrick 1992).
The initial hypothesis in assessing the two different nucleic acid pools in the
rhizosphere was that the cDNA community should be a subset of the rDNA
community. Contrary to this hypothesis, the cDNA and rDNA clone libraries
2 Analysis of Rhizosphere Fungal Communities Using rRNA and rDNA 35
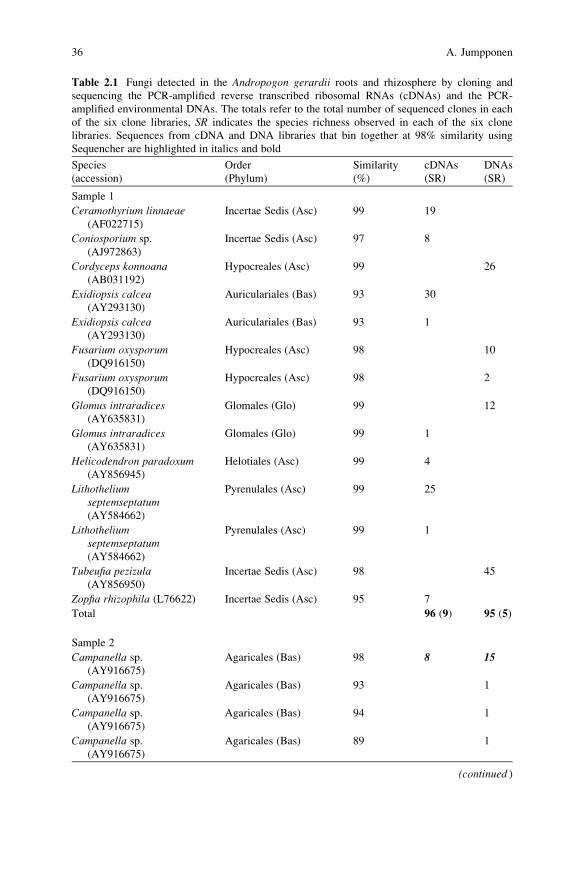
Table 2.1 Fungi detected in the Andropogon gerardii roots and rhizosphere by cloning and
sequencing the PCR-amplified reverse transcribed ribosomal RNAs (cDNAs) and the PCR-
amplified environmental DNAs. The totals refer to the total number of sequenced clones in each
of the six clone libraries, SR indicates the species richness observed in each of the six clone
libraries. Sequences from cDNA and DNA libraries that bin together at 98% similarity using
Sequencher are highlighted in italics and bold
Species
(accession)
Order
(Phylum)
Similarity
(%)
cDNAs
(SR)
DNAs
(SR)
Sample 1
Ceramothyrium linnaeae(AF022715)
Incertae Sedis (Asc) 99 19
Coniosporium sp.
(AJ972863)
Incertae Sedis (Asc) 97 8
Cordyceps konnoana(AB031192)
Hypocreales (Asc) 99 26
Exidiopsis calcea(AY293130)
Auriculariales (Bas) 93 30
Exidiopsis calcea(AY293130)
Auriculariales (Bas) 93 1
Fusarium oxysporum(DQ916150)
Hypocreales (Asc) 98 10
Fusarium oxysporum(DQ916150)
Hypocreales (Asc) 98 2
Glomus intraradices(AY635831)
Glomales (Glo) 99 12
Glomus intraradices(AY635831)
Glomales (Glo) 99 1
Helicodendron paradoxum(AY856945)
Helotiales (Asc) 99 4
Lithotheliumseptemseptatum(AY584662)
Pyrenulales (Asc) 99 25
Lithotheliumseptemseptatum(AY584662)
Pyrenulales (Asc) 99 1
Tubeufia pezizula(AY856950)
Incertae Sedis (Asc) 98 45
Zopfia rhizophila (L76622) Incertae Sedis (Asc) 95 7
Total 96 (9) 95 (5)
Sample 2
Campanella sp.
(AY916675)
Agaricales (Bas) 98 8 15
Campanella sp.
(AY916675)
Agaricales (Bas) 93 1
Campanella sp.
(AY916675)
Agaricales (Bas) 94 1
Campanella sp.
(AY916675)
Agaricales (Bas) 89 1
(continued )
36 A. Jumpponen
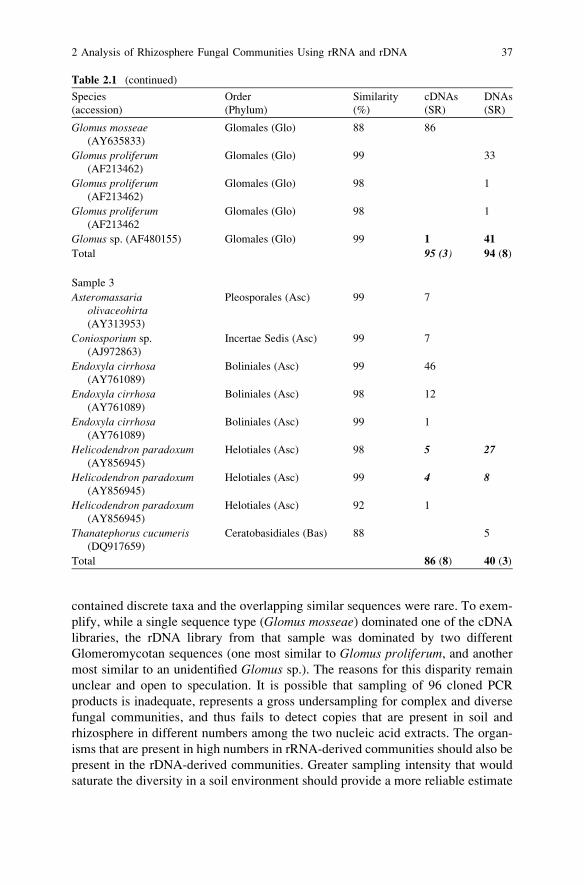
contained discrete taxa and the overlapping similar sequences were rare. To exem-
plify, while a single sequence type (Glomus mosseae) dominated one of the cDNA
libraries, the rDNA library from that sample was dominated by two different
Glomeromycotan sequences (one most similar to Glomus proliferum, and another
most similar to an unidentified Glomus sp.). The reasons for this disparity remain
unclear and open to speculation. It is possible that sampling of 96 cloned PCR
products is inadequate, represents a gross undersampling for complex and diverse
fungal communities, and thus fails to detect copies that are present in soil and
rhizosphere in different numbers among the two nucleic acid extracts. The organ-
isms that are present in high numbers in rRNA-derived communities should also be
present in the rDNA-derived communities. Greater sampling intensity that would
saturate the diversity in a soil environment should provide a more reliable estimate
Table 2.1 (continued)
Species
(accession)
Order
(Phylum)
Similarity
(%)
cDNAs
(SR)
DNAs
(SR)
Glomus mosseae(AY635833)
Glomales (Glo) 88 86
Glomus proliferum(AF213462)
Glomales (Glo) 99 33
Glomus proliferum(AF213462)
Glomales (Glo) 98 1
Glomus proliferum(AF213462
Glomales (Glo) 98 1
Glomus sp. (AF480155) Glomales (Glo) 99 1 41
Total 95 (3) 94 (8)
Sample 3
Asteromassariaolivaceohirta(AY313953)
Pleosporales (Asc) 99 7
Coniosporium sp.
(AJ972863)
Incertae Sedis (Asc) 99 7
Endoxyla cirrhosa(AY761089)
Boliniales (Asc) 99 46
Endoxyla cirrhosa(AY761089)
Boliniales (Asc) 98 12
Endoxyla cirrhosa(AY761089)
Boliniales (Asc) 99 1
Helicodendron paradoxum(AY856945)
Helotiales (Asc) 98 5 27
Helicodendron paradoxum(AY856945)
Helotiales (Asc) 99 4 8
Helicodendron paradoxum(AY856945)
Helotiales (Asc) 92 1
Thanatephorus cucumeris(DQ917659)
Ceratobasidiales (Bas) 88 5
Total 86 (8) 40 (3)
2 Analysis of Rhizosphere Fungal Communities Using rRNA and rDNA 37
of the community structure. It is also possible that the methods to isolate the
different nucleic acids result in serious biases (von Wintzingerode et al. 1997):
the template stability and the rate of template acquisition may differ among targets
due to different cell resistance to homogenization or different nucleic acid folding
structures that may preferably maintain some templates through the extraction
protocols whereas others may be lost. Finally, in addition to these biases, reverse
transcription and cDNA synthesis add steps and sources of possible incongruence to
the data acquisition for community analysis. The cDNA synthesis in addition to
the RNA isolation may be a source of bias (Kowalchuk et al. 2006) and, as such,
a possible explanation for the observed differences among the cDNA- and
rDNA-inferred fungal communities.
The analyses of reverse-transcribed and PCR-amplified rRNAs and PCR-ampli-
fied rDNAs indicated presence of relatively low diversity in the A. gerardii rhizo-sphere. On average, the rRNA-derived cDNA clone libraries had 6.7 taxa, while the
rDNA-derived clone libraries had slightly lower species richness with 5.7 taxa.
Both approaches provided comparable estimates of the diversity and evenness
(Shannon’s diversity index H = 1.17 and 1.15 and evenness EH = 0.59 and 0.71;
Simpson’s diversity index D = 2.86 and 2.67 and evenness ED = 0.41 and 0.51 for
the cDNA and rDNA libraries, respectively). Note that none of these differences is
significant at a = 0.05 (Student’s t-test). Again, contrary to the initial hypotheses,
the rDNA libraries did not contain a higher species richness or diversity than the
cDNA libraries.
2.4 Conclusions
The kit-based extractionmethod proved successful in producing reverse-transcribable
and PCR-amplifiable rRNA templates. A major drawback of the procedure described
here is that FastRNA extraction systems require relatively costly equipment (FastPrep
instrument). However, other, alternative nucleic acid purification systems can
be adopted for environmental samples (e.g., AllPrep RNA and DNA purification
system from QiaGen, Valencia, CA, USA or PowerSoil RNA system from MoBio,
Carlsbad, CA, USA). In adopting the former product, one must solve issues of tissue
homogenization.
Although RNA isolation from environmental samples is relatively simple, the
sample maintenance and inhibition of RNA degradation can be problematic. During
sampling, the samples need to be maintained frozen or specific RNA stabilization
reagents (e.g., RNAlater from QiaGen) may be necessary to minimize RNA
degradation. Both approaches may have their caveats. While the immediate flash-
freezing in a cryoshipper proved successful here, the transport of a bulky container
with residual liquid N2 can become problematic if travel by air or by foot is
necessary during the sampling. Use of RNAse inhibitors (such as RNAlater) only
extends the longevity of the environmental RNA to a limited extent, and this time is
temperature-dependent.
38 A. Jumpponen
The rRNA provides a target that may allow an improved understanding of the
microbial communities (Poulsen et al. 1993). However, one should be cautious in
considering the obtained data as a true reflection of active organisms in the
environment. Many soil-inhabiting organisms may be able to maintain high ribo-
some levels through dormancy in order to be able to regain activity when favorable
environmental conditions emerge (Kowalchuk et al. 2006). Furthermore, while the
use of rRNA may circumvent the problems of using rDNA (non-active cells, naked
DNA in soil), the reverse transcription necessitates additional steps in the data
acquisition that may introduce additional biases that complicate community
analyses. It remains unclear what is the impact of use of the universal primer for
the reverse transcription, and how that choice impacts observed species-richness
estimators.
Finally, the reasons for the observed incongruences among the cDNA- and
rDNA-derived communities remain unclear. However, one should keep in mind
that both community compositions may be equally true. While the cDNA commu-
nity may provide a snapshot of the organisms that are present in the current active
and/or dormant pools, the rDNA community carries a historical trace, and thus
provides a view of that community and of those present in the recent past. As
pointed out by Duineveld et al. (2001), the two views of the same community may
differ. One just needs to be cautious about the interpretation of those results.
Acknowledgements This material is based upon work supported by the National Science
Foundation under Grants 0344838 and 0516456. Stacie Kageyama assisted in sampling
Andropogon gerardii roots. Konza Prairie Biological Station and its personnel maintain the
research site, and are funded partly through the National Science Foundation Long Term
Ecological Research program.
References
Altschul SF, Madden TL, Schaffer AA, Zhang J, Zhang Z, Miller W, Lipman DJ (1997) Gapped
BLAST and PSI-BLAST: a new generation of protein database search programs. Nucl Acids
Res 25:3389–3402
Anderson IC, Parkin PI (2007) Detection of active soil fungi by RT-PCR amplification of
precursor rRNA molecules. J Microbiol Meth 68:248–253
Bentivenga SP, Hetrick BAD (1992) Seasonal and temperature effects on mycorrhizal activity and
dependence of cool- and warm-season tallgrass prairie grases. Can J Bot 70:1596–1602
Borneman J, Hartin RJ (2000) PCR primers that amplify fungal rRNA genes from environmental
samples. Appl Environ Microbiol 66:4356–4360
Domsch KH, Gams W, Anderson T-H (1980) Compendium of soil fungi. Academic, New York
Duineveld BM, Kowalchuk GA, Keijzer A, van Elsas JD, van Veen JA (2001) Analysis of
bacterial communities in the rhizosphere of chrysanthemum via denaturing gradient gel
electrophoresis of PCR-amplified 16S rRNA as well as DNA fragments coding for 16S
rRNA. Appl Environ Microbiol 67:172–178
2 Analysis of Rhizosphere Fungal Communities Using rRNA and rDNA 39

Girvan MS, Bullimore J, Ball AS, Pretty JN, Osborn AM (2004) Responses of active bacterial and
fungal communities in soils under winter wheat to different fertilizer and pesticide regimens.
Appl Environ Microbiol 70:2692–2701
Helgason T, Daniell TJ, Husband R, Fitter AH, Young JPW (1998) Ploughing up the wood-wide
web? Nature 394:431
Horton TR, Bruns TD (2001) The molecular revolution in ectomycorrhizal ecology: peeking into
the black-box. Mol Ecol 10:1855–1871
Jumpponen A (2003) Soil fungal community assembly in a primary successional glacier forefront
ecosystem as inferred from rDNA sequence analyses. New Phytol 158:569–578
Jumpponen A (2007) Soil fungal communities underneath willow canopies on a primary succes-
sional glacier forefront: rDNA sequence results can be affected by primer selection and
chimeric data. Microbial Ecol 53:233–246
Kowalchuk GA, Drigo B, Yergeau E, van Veen JA (2006) Assessing bacterial and fungal
community structure in soil using ribosomal RNA and other structural gene markers. In:
Nannipieri P, Smalla K (eds) Nucleic acids and proteins in soil, vol 7. Springer, Berlin, pp
159–188
Poulsen LK, Ballard G, Stahl DA (1993) Use of ribosomal-RNA fluorescence in situ hybridizationfor measuring the activity of single cells in young and established biofilms. Appl Environ
Microbiol 59:1354–1360
Prosser JI (2002) Molecular and functional diversity in soil microorganisms. Plant Soil 244:9–17
Rambelli A, Persiani AM, Maggi O, Lunghini D, Onofri S, Riess S, Dowgiallo G, Puppi G (1983)
Comparative studies on microfungi in tropical ecosystems. UNESCO, Rome
Smit E, Leeflang P, Glandorf B, van Elsas JD,Wernars K (1999) Analysis of fungal diversity in the
wheat rhizosphere by sequencing of cloned PCR-amplified genes encoding 18S rRNA and
temperature gradient gel electrophoresis. Appl Environ Microbiol 65:2614–2621
von Wintzingerode F, Gobel UB, Stackebrandt E (1997) Determination of microbial diversity
in environmental samples: pitfalls of PCR-based rRNA analysis. FEMS Microbiol Rev
21:213–229
White TJ, Bruns TD, Lee SB, Taylor JW (1990) Amplification and direct sequencing of fungal
ribosomal RNA genes for phylogenetics. In: Innis MA, Gelfand DH, Sninsky JJ, White TJ
(eds) PCR protocols: a guide to methods and applications. Academic, New York, pp 315–322
40 A. Jumpponen

Chapter 3
Use of Mycorrhiza Bioassays in Ecological
Studies
I.A.F. Djuuna, L.K. Abbott, and Z.M. Solaiman
3.1 Introduction
It is well known that arbuscular mycorrhizal (AM) fungi are ubiquitous in agricul-
tural and natural ecosystems (Brundrett 1991, 2002) and that most plant species
form symbiotic associations with these fungi (Newman and Reddell 1987). The
symbiosis can increase the growth and development of plants by enhancing nutrient
uptake, especially phosphorus (Ortas 1996; Smith et al. 2004), into plants and by
improving water relations of plants (Auge 2001; Boomsma and Vyn 2008; Jacobson
1997; Kyllo et al. 2003; Mohammad et al. 1995). Plants differ in their growth
response to mycorrhizal colonization (Monzon and Azcon 1996; Ortas et al. 2002;
Pankova et al. 2008). Explanations for differences in growth responses to mycor-
rhizal colonisation over the full life cycle of plants are complex (Gazey et al. 1992)
and new explanations of mycorrhizal function are emerging (Li et al. 2008).
Mycorrhizal dependency (Menge et al. 1978; Gerdemann 1975) varies among
plant species (Abbott et al. 1995; Pankova et al. 2008), and may influence the
abundance and community structure of AM fungi in soil and their infectivity (Crush
1978; Egerton-Warburton et al. 2007; Puschel et al. 2007; Zangaro et al. 2000). AM
fungi can also contribute to improving soil physical fertility by enhancing soil
aggregation (e.g. Moreno-Espındolaa et al. 2007; Rillig and Mummery 2006) and
protect crops against plant disease (see Douds and Johnson 2003). The soil envi-
ronment, particularly factors that control soil fertility, strongly influences mycor-
rhizal function (Abbott and Robson 1982, 1991b; Cardoso and Kuyper 2006).
The diversity of AM fungi is generally low in agriculture compared with
indigenous plant communities (Boerner et al. 1996; Helgason et al. 1998; Sieverding
I.A. F. Djuuna, L.K. Abbott (*), and Z.M. Solaiman
Faculty of Natural and Agricultural Sciences, School of Earth and Environment M087,The University of Western Australia, Crawley, WA 6009, Australia
e-mail: [email protected]
A. Varma and A.C. Kharkwal (eds.), Symbiotic Fungi, Soil Biology 18, 41
DOI: 10.1007/978‐3‐540‐95894‐9_3, # Springer‐Verlag Berlin Heidelberg 2009
1991). Crop and rotation history also influence the abundance and diversity of AM
fungi in agricultural soil (Johnson and Gehring 2007; Douds and Johnson 2003).
Therefore, the capacity of AM fungi to form mycorrhizas that contribute substan-
tially to plant nutrition, plant health or soil fertility depends on soil management.
Within this context, calibrated bioassays of infectivity have the potential to enable
interpretation of mycorrhizal function. However, due to the complexity, diversity
and dynamics of mycorrhizal associations in space and time, measurements of
mycorrhizal status of roots at one point in time is unlikely to enable
full understanding of the interactions between AM fungi and host plants over
their life cycle.
3.2 Assessment of Infectivity of AM Fungi in Soil
The term ‘‘soil infectivity’’ was used to define the ability of soil containing
propagules of pathogens to initiate infection of host plants (Hornby 1990). Based
on this plant pathology concept, ‘‘infectivity’’ of AM fungi in soil has been used
with reference to the ability of AM fungi to colonise roots of a host plant (Abbott
and Robson 1981) and explored further within the framework of mycorrhiza
bioassays (e.g. Gianinazzi-Pearson et al. 1985; Plenchette et al. 1989). The infec-
tivity of AM fungi can differ among host plants even when grown together in the
same soil (Abbott et al. 1995). It is also important to be aware that bioassay
measurements of infectivity of AM fungi can vary with soil environment, including
differences in soil fertility, soil disturbance, host plant type and architecture,
temperature, and water availability (Abbott et al. 1995).
Knowledge of the abundance and distribution of AM fungi in soil is acquired
from measurements of the length of mycorrhizal root, the proportion of the root
length colonised, the length of hyphae in soil, the number and types of spores and
other propagules in soil, and the infectivity of the community as a whole (Abbott
and Robson 1991a). Colonisation of roots by AM fungi can be estimated directly
using microscopic observation of roots and indirectly using bioassays (Abbott
and Robson 1981) or molecular assays (Jacquot et al. 2000; Stukenbrock and
Rosendahl 2005).
3.2.1 Direct Assessment of AM Fungi
Direct measurement of mycorrhizal colonisation of roots by length of root colo-
nised and percentage of root length colonised is usually based on staining to
distinguish the fungi from root tissues (see Brundrett et al. 1984). Colonisation
can also be observed in unstained roots (Arias et al. 1987), but most histological
methods have limitations because some fungi are not easily visible even after roots
are cleared and the fungi stained (Saito et al. 1993). Most assessments of AM fungi
42 I.A.F. Djuuna et al.

in roots do not take into account changes in the intensity of fungal colonisation
within the root, but McGonigle et al. (1990) overcame this limitation to some extent
by developing a magnified intersection method for assessing the colonisation of
roots. This procedure assesses the proportion of root length containing mycorrhizal
fungal structures (arbuscules, vesicles and hyphae). In-depth microscopic analysis
of colonisation intensity is necessary for more complete understanding of relation-
ships between root colonisation and mycorrhizal function (Gazey et al. 1992), and
this will differ for plants with different root structures (Merryweather and Fitter
1998; van der Heijden et al. 1998).
None of the measurements mentioned above provide information about the
activity of the fungi present inside roots or in soil, so histochemical procedures
are required to determine whether the fungi are living or dead. Hyphae and vesicles
can be observed inside roots, even in dead roots, and enzyme assays can be used to
determine whether the fungi are alive (e.g. MacDonald and Lewis 1978; Saito 1995;
Saito et al. 1993).
As root systems develop, changes occur in the abundance of fungi in the root
system either as a whole or in terms of the relative abundance of different AM
fungi; sequential sampling may be necessary. As suggested above, the architecture
of the root system also needs to be considered when interpreting colonisation data.
For example, calculation of the proportion of root length colonised for the whole of
a woody root system is of little significance compared with a measurement that is
restricted to the fine (most active) roots of the same plant. Similarly, calculations of
the proportion of root length colonised on root systems of plants with highly
differentiated root systems might be of little value without quantifying the relative
abundance of different types and ages of roots. Mycorrhizal colonisation of plants
that shed roots extensively may be difficult to determine accurately.
Morphological structures of AM fungi inside roots can be distinctive within
some communities of fungi (Abbott 1982; Merryweather and Fitter 1998) but
overall the fungi are structurally diverse (Dickson et al. 2007; Dodd et al. 2000;
Smith and Smith 1997). The recognition of morphological similarities among AM
fungi occurring in a soil community requires extensive experience based on obser-
vations of mycorrhizas formed in pure pot cultures of fungi isolated from one
location and studied on a standard host plant (Abbott 1982). The morphology
of a fungus within roots of different host plants can differ (Lackie et al. 1987;
Smith and Smith 1997), so, while morphological characteristics may provide a
tool for understanding the dynamics of colonisation of some root systems by
distinct morphotypes (e.g. Abbott and Robson 1982; Merryweather and Fitter
1998; Scheltema et al. 1987), molecular characterisation is required to distinguish
among fungi within morphotypes (e.g. Jacquot et al. 2000; Stukenbrock and
Rosendahl 2005).
Combined with methods for determining physiological activity within hyphae
(e.g. MacDonald and Lewis 1978; Saito 1995), direct morphological and molecular
features of AM fungi can be used to determine the abundance, dynamics, diversity
and activity of AM fungi inside roots (Solaiman and Abbott 2004; Wubet et al.
2004).
3 Use of Mycorrhiza Bioassays in Ecological Studies 43

3.2.2 Indirect Assessment: Mycorrhiza Bioassay
Mycorrhiza bioassays involve use of bait plants grown in a soil sample; roots are
examined for the presence of AM fungi after a set time. Glasshouse bioassays
have been used to determine the infectivity of AM fungi in a range of situations
(Table 3.1).
Table 3.1 Examples of studies using bioassays to assess the infectivity of AM fungi (after Djuuna
2006)
Purpose Bioassay technique Example references
Infectivity and effectiveness
of AM fungi
Infectivity of AM fungi was
assessed from field soil
using subterranean
clover
Abbott and Robson (1981)
Infectivity and effectiveness
of AM fungi
Glasshouse trial using bait
plants
Gianinazzi-Pearson et al.
(1985)
The concept of soil
infectivity and a method
for its determination as
applied to AM fungi
Soil infectivity was assessed
by a standard bioassay
method using Leek
(Allium porum) as hostplant
Plenchette et al. (1989)
Seasonal variation in the
infectivity of AM fungi
in an annual pasture in a
Mediterranean
environment
Undisturbed soil cores sown
with Trifolliumsubterraneum L. in the
glasshouse.
Colonisation by AM
fungi was measured
3 and 6 weeks after
sowing
Scheltema et al. (1987)
The total inoculum potential
of AM fungi
The rate of colonisation by
AM fungi assessed by
growing bait plants in
intact cores of soil
Brundrett (1991)
Spatial variation in
inoculum potential of
AM fungi in mine site
and agricultural soil
Infectivity of AM fungi in
intact cores soil from
disturbed and
undisturbed sites
Jasper et al. (1991)
Abundance and frequency
of mycorrhizal
propagules
AM fungi assessed by
growing bait plants in
intact soil cores
Brundrett et al. (1996)
Infectivity of AM fungi
exposed to long term
saline conditions
Infectivity of AM fungi in
saline soils studied after
trap pot culture and
multiple and single
spore inoculation
Rafique (2005)
Infectivity of AM fungi in
jarrah forest
rehabilitated site after
bauxite mining
Infectivity of AM fungi in
intact soil cores
collected from jarrah
forest
Solaiman and Abbott (2003)
44 I.A.F. Djuuna et al.
Generally, bioassay plants are grown in defined conditions using soil collected
from the field, and the extent of mycorrhizal colonisation is assessed after a
predetermined period. Bioassays of this type have been used to show differences
among soils in the infectivity of AM fungi present (e.g. Abbott and Robson 1982;
Gianinazzi-Pearson et al. 1985). Few studies have evaluated the relationship
between the infectivity assessed in a bioassay and the development of mycorrhizas
in situ at the site from which the bioassay soil was collected (see Abbott and Robson
1991a). Steps in each mycorrhiza bioassay (soil sampling, bioassay conditions,
calibration and testing field predictions) all need to be selected with the purpose of
the analysis well defined in advance (Abbott et al. 1995).
Soil sampling: Soil samples can be collected as bulk soil (disturbed soil samples)
or as soil cores (undisturbed soil). Sampling needs to be representative of each
sampling point. Soil samples should be used quickly or stored at low temperature
until used. Consideration should be given to whether or not to allow the soil to dry,
and this will depend on the biology of the AM fungi expected to be present. Prior
understanding of the fungi present is therefore advantageous.
Bait plants: Host plants such as grass or legume species are good bait plants for
bioassays, but other species are suitable if they are highly mycorrhizal. Plants with
fast-growing roots in the soil and environmental conditions used in the bioassay,
and plants with roots which are easy to clear and stain for AM fungi are most useful
as bait plants (Brundrett et al. 1996).
Duration of bioassays: Brundrett and Abbott (1995) noted that the duration of
bioassays should not exceed the growth stage required for an adequate level of
mycorrhizas to form. If a longer time is chosen before the bait plants are assessed,
the plateau level of colonisation may mask differences in rate of colonisation
(Abbott and Robson 1981; Sanders et al. 1977). While it is necessary to stop the
bioassay before colonisation reaches the plateau, this time might depend on the
communities of AM fungi, soil conditions, growing conditions and species of bait
plant, highlighting the need for customised bioassays.
Predicting mycorrhizal colonisation in the field: An additional value of mycor-
rhiza bioassays is that they may be used to predict mycorrhiza development in
agricultural or horticultural plants (Abbott et al. 1995). However, management
practices imposed after collection of the soil can influence the subsequent field
colonisation (Abbott and Robson 1991b). Therefore, if the intention is to use the
bioassay to predict colonisation later in the season, a calibration is needed to take
into account any effect of management practices imposed after soil is collected for
the bioassay on expected colonisation in the field.
A bioassay for predicting mycorrhiza formation could use soil collected
before the start of the season combined with (1) information about the proposed
agricultural practice, (2) soil conditions, and (3) knowledge of how the AM fungi in
this soil are expected to respond to these conditions and practices. Furthermore, in
order to consider using a mycorrhiza bioassay to predict the rate and extent of
colonisation of roots by AM fungi, the bioassay needs to be conducted under
defined conditions.
3 Use of Mycorrhiza Bioassays in Ecological Studies 45
Mycorrhiza bioassays have been used to quantify seasonal and spatial variations
in inoculum potential of AM fungi (Brundrett and Abbott 1995; Brundrett et al.
1996; Jasper et al. 1991; Scheltema et al. 1987). Bioassay plants grown in undis-
turbed soil cores are likely to closely represent field conditions, but mixed soil
samples can be used as part of a standardized bioassay procedure. However, if field
soil is disturbed, infectivity of the fungi present may be altered (Miller et al. 1995),
so interpretation of the data could be complicated by the conditions under which the
assessment is conducted.
Quantification of the rate of colonisation of bioassay plants by different
morphotypes or genetically distinguishable groups of AM fungi in field soil could
be used to estimate the potential of the components of the community to develop
mycorrhizas (Abbott et al. 1995). Alternatively, it is possible that this may not
represent the true potential infectivity of each group of fungi if there were no
competing fungi present. Observations can be complicated by competition among
the AM fungi during colonisation of roots (Solaiman and Abbott 2003).
3.3 Purpose of Bioassays for Infectivity Assessment
of AM Fungi
The majority of ecological studies of AM fungi include a measure of mycorrhizal
colonisation. However, colonisation of roots by AM fungi is a complex process and
it is difficult to represent such a dynamic process in a single measurement made at
one point in time. The complex characteristics of mycorrhizal associations depend
on root growth and architecture as well as fungal diversity in the soil and inside
roots (Abbott and Robson 1984).
The infectivity of AM fungi changes with spore maturation or dormancy
(Tommerup 1983), in response to the presence of roots of different forms and age
(e.g. associated with the nature and quantity of root exudates) and as the fungi
proceed through stages in their life cycle (Pearson and Schweiger 1993). In the
latter case, the infectivity of AM fungi associated with mycorrhizal roots paralleled
the pattern of sporulation (and transfer of energy resources), despite the presence of
fungi in the roots detected by staining. In natural ecosystems with little physical
disturbance of soil, roots may be colonised by hyphae associated with adjacent
plant species or by new hyphae from germinated spores. When soil is disturbed (e.g.
with farming practices), the infectivity of AM fungi can be altered (Evans and
Miller 1990). The extent of change may depend on the abundance of propagules of
AM fungi present in the soil (Jasper et al. 1989). Soil disturbance in natural
ecosystems can reduce the infectivity of AM fungi, especially where propagule
abundance is low (Jasper et al. 1987).
A direct measurement of the presence of AM fungi in roots at a particular time
results from colonisation events that have taken place during the life of the plant. In
contrast, a measure of infectivity of AM fungi using a bioassay bait plant represents
46 I.A.F. Djuuna et al.
the capacity of the hyphae to colonise roots at a particular point in time. A measure
of infectivity of AM fungi assessed in a bioassay can be made at different stages in
the plant’s growth cycle and interpreted in terms of the ability of the hyphae in soil
or in the roots to colonise new roots.
3.4 Conclusions
Mycorrhiza bioassays measure the infectivity in soil at a point in time, representing
the potential of AM fungal propagules present in soil to colonise roots. However,
the conditions of the bioassay may not be the same as those under field conditions;
therefore, it is possible that fungi are present in soil in an infective state but not able
to colonise roots for some reason, perhaps related to the physiological state of the
roots or due to competition from other AM fungi. Bioassays of infectivity of AM
fungi have potential to assist in predicting how roots might become colonised, but
calibrations are necessary that take into account an understanding of the relation-
ships between mycorrhizal colonisation under the expected soil conditions (i.e. that
take into account intervening management practices such as fertilizer addition, crop
or tillage practice). Therefore, several factors need to be considered before con-
ducting a mycorrhizal bioassay, including the time of soil sampling, choice of bait
plant, handling of soil samples, and length of the bioassay, and precautions are
necessary when interpreting mycorrhiza bioassay data.
References
Abbott LK (1982) Comparative anatomy of vesicular–arbuscular mycorrhizas formed on subter-
ranean clover. Aust J Bot 30:485–499
Abbott LK, Robson AD (1981) Infectivity and effectiveness of five endomycorrhizal fungi:
competition with indigenous fungi in field soils. Aust J Soil Res 32:621–630
Abbott LK, Robson AD (1982) Infectivity of vesicular arbuscular mycorrhizal fungi in agricultural
soils. Aust J Agric Res 33:1049–1059
Abbott LK, Robson AD (1984) Colonisation of the root system of subterranean clover by three
species of vesicular–arbuscular fungi. New Phytol 96:275–281
Abbott LK, Robson AD (1991a) Field management of VA mycorrhizal fungi. In: Kelster DL,
Cregan PB (eds) The Rhizosphere and Plant Growth. Kluwer, Norwell, MA, pp 355–362
Abbott LK, Robson AD (1991b) Factors influencing the occurrence of vesicular–arbuscular
mycorrhizas. Agric Ecosyst Environ 35:121–150
Abbott LK, Robson AD, Scheltema MA (1995) Managing soils to enhance mycorrhizal benefits in
mediterranean agriculture. Crit Rev Biotechnol 15:213–228
Arias I, Sainz MJ, Grace CA, Hayman DS (1987) Direct observation of vesicular–arbuscular
mycorrhizal infection in fresh unstained roots. Trans Br Mycol Soc 89:128–131
Auge RM (2001) Water relations, drought and vesicular–arbuscular mycorrhizal symbiosis.
Mycorrhiza 11:3–42
Boerner REJ, DeMars BG, Leight PN (1996) Spatial patterns of mycorrhizal infectiveness of soils
along a successional chronosequence. Mycorrhiza 6:79–80
3 Use of Mycorrhiza Bioassays in Ecological Studies 47

Boomsma CR, Vyn TJ (2008) Maize drought tolerance: potential improvements through arbus-
cular mycorrhizal symbiosis? Field Crops Res 108:14–31
Brundrett M (1991) Mycorrhizas in natural ecosystems. Adv Ecol Res 21:171–313
Brundrett M (2002) Coevolution of roots and mycorrhizas of land plants. New Phytol 154:
275–304
Brundrett M, Abbott LK (1995) Mycorrhizal fungus propagules in the jarrah forest. 2. Spatial
variability in inoculum levels. New Phytol 131:461–469
Brundrett MC, Piche Y, Peterson RL (1984) A new method for observing the morphology of
vesicular–arbuscular mycorrhizae. Can J Bot 62:2128–2134
Brundrett MC, Ashwath N, Jasper DA (1996) Mycorrhizas in the Kakadu region of tropical
Australia. 2. Propagules of mycorrhizal fungi in disturbed habitats. Plant Soil 184:173–184
Cardoso IM, Kuyper TW (2006) Mycorrhizas and tropical soil fertility. Agric Ecosyst Environ
116:72–84
Crush JR (1978) Changes in effectiveness of soil endomycorrhizal fungal populations during
pasture development. N Z J Agric Res 21:683–685
Dickson S, Smith FA, Smith SE (2007) Structural differences in arbuscular mycorrhizal
symbioses: more than 100 years after Gallaud, where next? Mycorrhiza 17:375–393
Djuuna IAF (2006) The infectivity of arbuscular mycorrhizal fungi in relation to soil character-
istics and agricultural land use history. PhD thesis, School of Earth and Geographical Sciences,
The University of Western Australia, Perth, Australia
Dodd JC, Boddington CL, Rodriguez A, Gonzalez-Chavez C, Mansur I (2000) Mycelium of
arbuscular mycorrhizal fungi (AMF) from different genera: form, function and detection.
Plant Soil 226:131–151
Douds DDJ, Johnson NC (2003) Contributions of arbuscular mycorrhizas to soil biological
fertility. In: Abbott LK, Murphy DV (eds) Soil biological fertility — a key to sustainable
land use in agriculture. Kluwer, Dordrecht, pp 129–162
Egerton-Warburton LM, Johnson NC, Allen EB (2007) Mycorrhizal community dynamics
following nitrogen fertilization: a cross-site test in five grasslands. Ecol Monogr 77:527–544
Evans DG, Miller MH (1990) The role of the external mycelial network in the effect of soil
disturbance upon vesicular–arbuscular mycorrhizal colonisation of maize. New Phytol 114:
65–72
Gerdemann JW (1975) Vesicular–arbuscular mycorrhizae. In: Torrey JG and Clarkson DT (eds)
The development and function of roots. Academic, London, pp 575–591
Gazey C, Abbott LK, Robson AD (1992) The rate of development of mycorrhizas affects the onset
of sporulation and production of external hyphae by two species of Acaulospora. Mycol Res
96:643–650
Gianinazzi-Pearson V, Gianinazzi S, Trouvelor A (1985) Evaluation of the infectivity and
effectiveness of indigenous vesicular–arbuscular fungal populations in some agricultural in
Burgundy. Can J Bot 63:1521–1524
Helgason T, Daniel TJ, Husband R, Fitter AH, Young BD (1998) Ploughing up the wood-wide
web. Nature 394:431
Hornby D (1990) Biological control of soil-borne plant pathogens. CAB International,
Wallingford
Jacobson KM (1997) Moisture and substrate stability determine VA-mycorrhizal fungal commu-
nity distribution and structure in an arid grassland. J Arid Environ 35:59–75
Jacquot E, van Tuinen D, Gianinazzi S, Gianinazzi-Pearson V (2000) Monitoring species of
arbuscular mycorrhizal fungi in planta and in soil by nested PCR: application to the study of
the impact of sewage sludge. Plant Soil 226:179–188
Jasper DA, Robson AD, Abbott LK (1987) The effect of surface mining on the infectivity of
vesicular–arbuscular mycorrhizal fungi. Aust J Bot 35:641–652
Jasper DA, Robson AD, Abbott LK (1989) Soil disturbance reduces the infectivity of external
hyphae of vesicular–arbuscular mycorrhizal fungi. New Phytol 112:93–99
48 I.A.F. Djuuna et al.

Jasper DA, Abbott LK, Robson AD (1991) The effect of soil disturbance on vesicular arbuscular
mycorrhizal fungi in soils from different vegetation types. New Phytol 118:471–476
Johnson NC, Gehring CA (2007) Mycorrhizas: symbiotic mediators of rhizosphere and ecosystem
processes. In: Cardon ZG, Whitbeck JL (eds) The rhizosphere: an ecological perspective.
Academic, Amsterdam
Kyllo DA, Velez V, Tyree MT (2003) Combined effects of arbuscular mycorrhizas and light
on water uptake of the neotropical understory shrubs, Piper and Psychotria. New Phytol 160:
443–454
Lackie SM, Garriock ML, Peterson RL, Bowley SR (1987) Influence of host plant on the
morphology of the vesicular–arbuscular mycorrhizal fungus Glomus versiforme (Daniels and
Trappe) Berch. Symbiosis 3:147–158
Li HY, Smith SE, Ophel-Keller K, Holloway RE, Smith FA (2008) Naturally occurring arbuscular
mycorrhizal fungi can replace direct P uptake by wheat when roots cannot access added P
fertiliser. Funct Plant Biol 35:124–130
McDonald RM, Lewis M (1978) The occurrence of some acid phosphatases and dehydrogenases
in the vesicular–arbuscular mycorrhizal fungus Glomus mosseae. New Phyto 80:135–140
McGonigle TP, Miller MH, Evans DG, Fairchild GL, Swan JA (1990) A new method which
gives an objective measure of colonizarion of roots by vesicular–arbuscular mycorrhizal fungi.
New Phytol 115:495–501
Menge JA, Johnson ELV, Platt RG (1978) Mycorrhizal dependency of several citrus cultivars
under three nutrient regimes. New Phytol 81:553–559
Merryweather JW, Fitter AH (1998) The arbuscular mycorrhizal fungi of Hyacinthoides non-scripta – I. Diversity of fungal taxa. New Phytol 138:117–129
Miller MH, McGonigle TP, Addy HD (1995) Functional ecology of vesicular–arbuscular mycor-
rhizas as influenced by phosphate fertilization and tillage in an agricultural ecosystem. Crit Rev
Biotechnol 15:241–255
MohammadM, Pan WL, Kennedy AC (1995) Wheat responses to vesicular–arbuscular mycorrhizal
fungal inoculation of soils from eroded toposequences. Soil Sci Soc Am J 59:1086–1090
Monzon A, Azcon R (1996) Relevance of mycorrhizal fungal origin and host plant genotype to
inducing growth and nutrient uptake in Medicago species. Agric Ecosyst Environ 60:9–15
Moreno-Espındolaa IP, Rivera-Becerrilb F, Ferrara-Guerrerob MDJ, de Leon Gonzalez F (2007)
Role of root-hairs and hyphae in adhesion of sand particles. Soil BiolBioch 39:2520–2526
Newman EI, Reddell P (1987) The distribution of mycorrhizas among families of vascular plants.
New Phytol 106:745–751
Ortas I (1996) The influence of use of different rates of mycorrhizal inoculum on root infection,
plant growth, and phosphorus uptake. Commun Soil Sci Plant Anal 27:2935–2946
Ortas I, Ortakci D, Kaya Z (2002) Various mycorrhizal fungi propagated on different hosts have
different effect on citrus growth and nutrient uptake. Commun Soil Sci Plant Anal 33:259–272
Pankova H, Munzbergova Z, Rydlova J, Vosatka M (2008) Differences in AM fungal root
colonization between populations of perennial Aster species have genetic reasons. Oecologia
157:211–220
Pearson JN, Schweiger P (1993) Scutelospora calospora (Nicol. and Gerd.) Walker and Sanders
associated with subterranean clover: dynamics of colonisation, sporulation and soluble carbo-
hydrates. New Phytol 124:215–219
Plenchette C, Perrin R, Duvert P (1989) The concept of soil infectivity and a method for its
determination as applied to endomycorrhizas. Can J Bot 67:112–115
Puschel D, Rydlova J, Vosatka M (2007) Mycorrhiza influences plant community structure in
succession on spoil banks. Basic Appl Ecol 8:510–520
Rafique R (2005) Salinity influences arbuscular mycorrhizal fungi in agricultural soil. PhD thesis,
School of Earth and Geographical Sciences, The University of Western Australia, Perth,
Australia
Rillig MC, Mummery DL (2006) Mycorrhizas and soil structure. New Phytol 171:41–53
3 Use of Mycorrhiza Bioassays in Ecological Studies 49
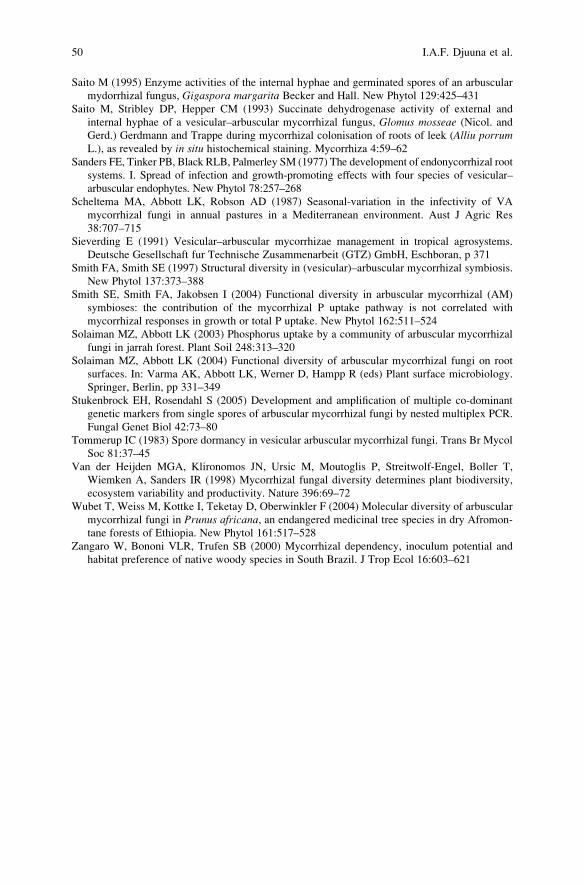
Saito M (1995) Enzyme activities of the internal hyphae and germinated spores of an arbuscular
mydorrhizal fungus, Gigaspora margarita Becker and Hall. New Phytol 129:425–431
Saito M, Stribley DP, Hepper CM (1993) Succinate dehydrogenase activity of external and
internal hyphae of a vesicular–arbuscular mycorrhizal fungus, Glomus mosseae (Nicol. and
Gerd.) Gerdmann and Trappe during mycorrhizal colonisation of roots of leek (Alliu porrumL.), as revealed by in situ histochemical staining. Mycorrhiza 4:59–62
Sanders FE, Tinker PB, Black RLB, Palmerley SM (1977) The development of endonycorrhizal root
systems. I. Spread of infection and growth-promoting effects with four species of vesicular–
arbuscular endophytes. New Phytol 78:257–268
Scheltema MA, Abbott LK, Robson AD (1987) Seasonal-variation in the infectivity of VA
mycorrhizal fungi in annual pastures in a Mediterranean environment. Aust J Agric Res
38:707–715
Sieverding E (1991) Vesicular–arbuscular mycorrhizae management in tropical agrosystems.
Deutsche Gesellschaft fur Technische Zusammenarbeit (GTZ) GmbH, Eschboran, p 371
Smith FA, Smith SE (1997) Structural diversity in (vesicular)–arbuscular mycorrhizal symbiosis.
New Phytol 137:373–388
Smith SE, Smith FA, Jakobsen I (2004) Functional diversity in arbuscular mycorrhizal (AM)
symbioses: the contribution of the mycorrhizal P uptake pathway is not correlated with
mycorrhizal responses in growth or total P uptake. New Phytol 162:511–524
Solaiman MZ, Abbott LK (2003) Phosphorus uptake by a community of arbuscular mycorrhizal
fungi in jarrah forest. Plant Soil 248:313–320
Solaiman MZ, Abbott LK (2004) Functional diversity of arbuscular mycorrhizal fungi on root
surfaces. In: Varma AK, Abbott LK, Werner D, Hampp R (eds) Plant surface microbiology.
Springer, Berlin, pp 331–349
Stukenbrock EH, Rosendahl S (2005) Development and amplification of multiple co-dominant
genetic markers from single spores of arbuscular mycorrhizal fungi by nested multiplex PCR.
Fungal Genet Biol 42:73–80
Tommerup IC (1983) Spore dormancy in vesicular arbuscular mycorrhizal fungi. Trans Br Mycol
Soc 81:37–45
Van der Heijden MGA, Klironomos JN, Ursic M, Moutoglis P, Streitwolf-Engel, Boller T,
Wiemken A, Sanders IR (1998) Mycorrhizal fungal diversity determines plant biodiversity,
ecosystem variability and productivity. Nature 396:69–72
Wubet T, Weiss M, Kottke I, Teketay D, Oberwinkler F (2004) Molecular diversity of arbuscular
mycorrhizal fungi in Prunus africana, an endangered medicinal tree species in dry Afromon-
tane forests of Ethiopia. New Phytol 161:517–528
Zangaro W, Bononi VLR, Trufen SB (2000) Mycorrhizal dependency, inoculum potential and
habitat preference of native woody species in South Brazil. J Trop Ecol 16:603–621
50 I.A.F. Djuuna et al.

Chapter 4
In Vivo Model Systems for Visualisation,
Quantification and Experimental Studies
of Intact Arbuscular Mycorrhizal Networks
Manuela Giovannetti, Luciano Avio, Cristiana Sbrana, and Paola Fortuna
4.1 Introduction
The root system of most land plants is colonised by obligately biotrophic fungi —
arbuscular mycorrhizal (AM) fungi (Glomeromycota) — which, after establishing
mutualistic symbioses, are able to develop extensive, belowground extraradical
mycelium (ERM) fundamental to the uptake of nutrients from soil and their transfer
to the host plant (Smith and Read 1997). Such mycorrhizal networks were first
visualised and quantified in vivo by means of two-dimensional experimental sys-
tems, and were shown to be able to spread from colonised roots into the surrounding
environment at growth rates ranging from 738 to 1,067 mm per day, depending on
the host plant, and to reach hyphal extents of 10–40 mm per mm of root length
(Giovannetti et al. 2001). Since AM fungi (AMF) have a wide host range, AM
extraradical networks may interconnect different plants, by means of anastomosis,
whose formation depends on a highly regulated mechanism of self-recognition
between compatible hyphae. Successful anastomoses occur between hyphae be-
longing to the same individual and to different individuals of the same isolate,
during the pre-symbiotic growth of AMF (Giovannetti et al. 1999). By contrast,
hyphae of individuals belonging to different genera and species, and even to
isolates of the same species originating from geographically different areas, are
unable to fuse, and show rejection responses, either before or after anastomoses,
revealing AMF hyphal ability to discriminate against nonself (Giovannetti et al.
2003). Extraradical mycorrhizal networks maintain the capacity of self-recognition,
M. Giovannetti (*) and P. Fortuna
Department of Crop Plant Biology, University of Pisa, Via del Borghetto 80, 56124 Pisa, Italy
e-mail: [email protected]
L. Avio and C. Sbrana
Institute of Agricultural Biology and Biotechnology, CNR, Via del Borghetto 80, 56124 Pisa, Italy
A. Varma and A.C. Kharkwal (eds.), Symbiotic Fungi, Soil Biology 18, 51
DOI: 10.1007/978‐3‐540‐95894‐9_4, # Springer‐Verlag Berlin Heidelberg 2009

evidenced by the high frequency of anastomoses between hyphae originating from
the same and different root systems colonised by a single AM fungal isolate
(Giovannetti et al. 2004).
In this chapter we review the methods devised for the visualisation and quantifi-
cation of anastomosis formation and for the study of mycorrhizal networks formed
by AMF both during the pre-symbiotic and the symbiotic stages of their life cycle.
Moreover, we describe experimental model systems showing that root systems of
plants belonging to different species, genera and families may become connected
by means of anastomosis formation between mycorrhizal networks, which can
create indefinitely large numbers of fungal linkages among plants in a community.
4.2 Structure of Pre-symbiotic Mycelium of AM Fungi:
Visualisation and Quantification of Anastomosis
4.2.1 Occurrence and Frequency of Anastomosis
Anastomosis can be detected in mycelia originating from individually germinated
spores or between mycelia originating from different germlings. Spores belonging
either to the same or to different AM fungal isolates are surface-sterilised with 2%
chloramine T, supplemented with streptomycin (400 mg l�1) for 20 min, rinsed five
times in sterile distilled water (SDW), and allowed to germinate individually in
SDW in microtiter plates. Germinated spores are then transferred onto mixed
cellulose esters membranes (0.45 mm diameter pores), which are placed on moist
sterile quartz sand in 9 cm diameter Petri dishes, sealed with Parafilm and incubated
at 25�C in the dark (Fig. 4.1a). To detect anastomoses between different indivi-
duals, pairings of different germinated spores are made by placing germlings
approximately 1 cm apart. Occurrence of anastomoses is assessed by using a double
staining method, in order to detect viable mycelia and protoplasmic continuity
between fusing hyphae. First, germlings are stained for the presence of succinate
dehydrogenase (SDH) activity (Smith and Gianinazzi-Pearson 1990), revealed by
the deposition of formazan salts in viable hyphae. Second, membranes bearing
SDH-stained germlings are mounted on microscope slides and stained with 0.05%
Trypan blue in lactic acid, in order to visualise hyphal walls of the whole mycelium
produced by each germling (Fig. 4.1b–d). Hyphal length is assessed by using image
analysis software or a microscopic gridline eyepiece. All hyphal contacts are
observed under a light microscope, counted at magnifications of �125 to �500
and verified at a magnification of �1,250. Frequency of anastomoses is calculated
by dividing the number of hyphal contacts leading to hyphal fusions by the total
number of hyphal contacts. Chi-square analysis is used to determine the homoge-
neity of anastomosis frequency data, and the chi-square test of independence is
performed to detect significant differences in anastomosis frequency between
hyphae from the same spores and hyphae from different spores.
52 M. Giovannetti et al.
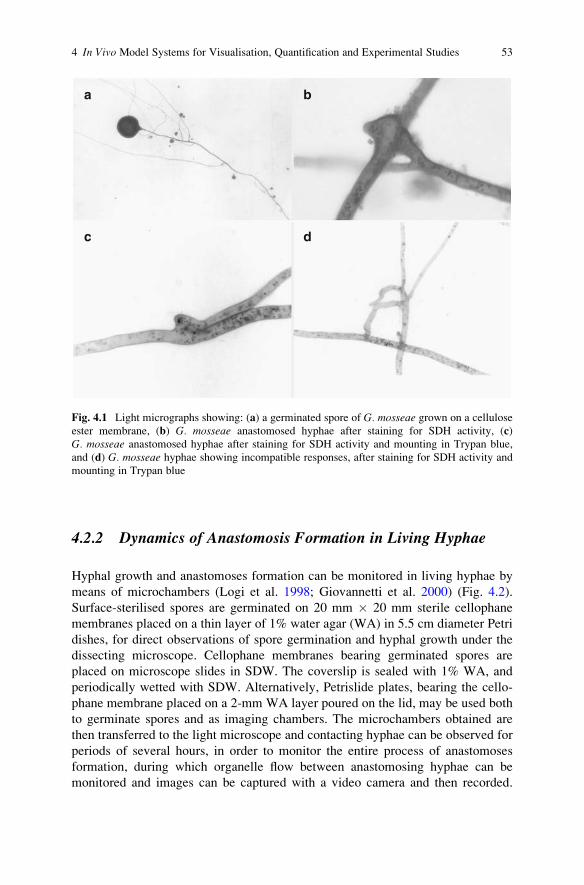
4.2.2 Dynamics of Anastomosis Formation in Living Hyphae
Hyphal growth and anastomoses formation can be monitored in living hyphae by
means of microchambers (Logi et al. 1998; Giovannetti et al. 2000) (Fig. 4.2).
Surface-sterilised spores are germinated on 20 mm � 20 mm sterile cellophane
membranes placed on a thin layer of 1% water agar (WA) in 5.5 cm diameter Petri
dishes, for direct observations of spore germination and hyphal growth under the
dissecting microscope. Cellophane membranes bearing germinated spores are
placed on microscope slides in SDW. The coverslip is sealed with 1% WA, and
periodically wetted with SDW. Alternatively, Petrislide plates, bearing the cello-
phane membrane placed on a 2-mm WA layer poured on the lid, may be used both
to germinate spores and as imaging chambers. The microchambers obtained are
then transferred to the light microscope and contacting hyphae can be observed for
periods of several hours, in order to monitor the entire process of anastomoses
formation, during which organelle flow between anastomosing hyphae can be
monitored and images can be captured with a video camera and then recorded.
a b
dc
Fig. 4.1 Light micrographs showing: (a) a germinated spore of G. mosseae grown on a cellulose
ester membrane, (b) G. mosseae anastomosed hyphae after staining for SDH activity, (c)
G. mosseae anastomosed hyphae after staining for SDH activity and mounting in Trypan blue,
and (d) G. mosseae hyphae showing incompatible responses, after staining for SDH activity and
mounting in Trypan blue
4 In Vivo Model Systems for Visualisation, Quantification and Experimental Studies 53

Sterile germinatedspores selectedunder dissectingmicroscope andtransferred to slides
b
d
e
c
a
Anastomosinghyphae monitoredunder video-enhanced lightmicroscope
Fig. 4.2 Schematic representation of the culture system used to monitor the dynamics of anasto-
mosis formation in living hyphae of AM fungi. The system allows the selection of germinated
spores and the monitoring of anastomosis formation under video-enhanced microscope
54 M. Giovannetti et al.

Bright contrast images are acquired after regulation of the condenser diaphragm.
The experiments can be carried out at room temperature.
To confirm the establishment of protoplasmic continuity and the viability of
anastomosed hyphae, cellophane membranes bearing germinated spores are trans-
ferred from microchambers and mounted on microscope slides, where, after SDH
staining, they are observed for the presence of formazan salt depositions in hyphal
bridges.
4.2.3 Cytochemical Analyses of Anastomosing Hyphae
To visualise the occurrence and location of nuclei in anastomosis bridges, spores
are germinated on polycarbonate black membranes, in order to obtain a better
visualisation of nuclei under epifluorescence. The membranes are mounted on
microscope slides, stained with Diamidinophenylindole (DAPI) (5 mg ml�1 in
water to glycerol 1:1 solution) and observed under epifluorescence using UV
light (Fig. 4.3a). To visualise hyphal compatibility/incompatibility, some mem-
branes are first stained with DAPI and then mounted in a 0.01% (w/v) solution of
Calcofluor White and observed under epifluorescence using UV light (Fig. 4.3b).
Calcofluor staining can be performed also on mixed cellulose esters membranes
without DAPI staining (Fig. 4.3c, d).
a b
c d
Fig. 4.3 Epifluorescence micrographs showing: (a) DAPI and (b) DAPI Calcofluor-stained
hyphae in, (a) compatible and (b) incompatible interactions in G. mosseae (courtesy of Applied
Environmental Microbiology); (c) Calcofluor stained hyphae in compatible and (d) incompatible
interactions in G. mosseae
4 In Vivo Model Systems for Visualisation, Quantification and Experimental Studies 55

4.2.4 Remarks
The methods described allowed the visualisation, for the first time, of anastomoses
in different species of the genus Glomus. Time-course experiments showed that
hyphal tips were able to fuse with hyphae growing nearby in about 35 min, and that
a bidirectional flow of particles (vacuoles, mitochondria, nuclei, and fat droplets)
moved at the speed of 1.8 � 0.06 mm s�1 through hyphal bridges formed during
anastomosis (Giovannetti et al. 1999, 2000). Protoplasmic continuity, the charac-
teristic feature of successful hyphal fusions, was evidenced by the complete disap-
pearance of hyphal walls and visualised by histochemical localisation of formazan
salts in hyphal fusions, after SDH staining. The established protoplasmic flow was
further demonstrated by the detection of nuclei in hyphal bridges, evidenced by
DAPI staining. Moreover, the described methods revealed that interactions between
hyphae of species of the genera Gigaspora and Scutellospora never led to anasto-
mosis formation (Giovannetti et al. 1999). This evidence was confirmed by other
authors in in vitro monoxenic cultures (de la Providencia et al. 2005).
The described methods allowed the detection of nonself incompatibility in pre-
symbiotic mycelial networks of AMF (Giovannetti and Sbrana 2001; Giovannetti
et al. 2003). These findings, suggesting that AMF can recognise self-entities
and discriminate self from nonself, opened the way to vegetative compatibility
tests, already used for the identification of genetically different isolates of patho-
genic, saprophytic and ectomycorrhizal fungi (Fries 1987; Sen 1990; Leslie 1993;
Dahlberg and Stenlid 1994; Cortesi et al. 1996; Milgroom and Cortesi 1999;
Glass et al. 2000). Such tests, carried out on geographically different isolates of
Glomus mosseae, showed that hyphal interactions between different isolates never
produce anastomoses, suggesting their genetic isolation (Giovannetti et al. 2003).
4.3 Visualisation and Quantification of Intact Mycelial
Networks Spreading from Mycorrhizal Roots
4.3.1 Experimental System
This experimental model system has been devised for visualising and quantifying
intact extraradical mycelia growing from mycorrhizal roots into the surrounding
environment (Fig. 4.4). Surface-sterilised seeds of experimental plants are germi-
nated in moist sterile quartz grit. After 15 days the root system of each seedling is
sandwiched between mixed cellulose esters membranes containing germinated
spores (obtained as described in Sect. 4.2). The seedlings with the sandwiched
root systems are placed into pots filled with sterile quartz grit. Pots are closed in
transparent polyethylene bags and maintained in a growth chamber with 24�C day
and 21�C night temperature and 16/8 light/dark cycle. After 30 days’ growth in the
sandwich system, the plants are harvested, the roots are gently removed from
56 M. Giovannetti et al.
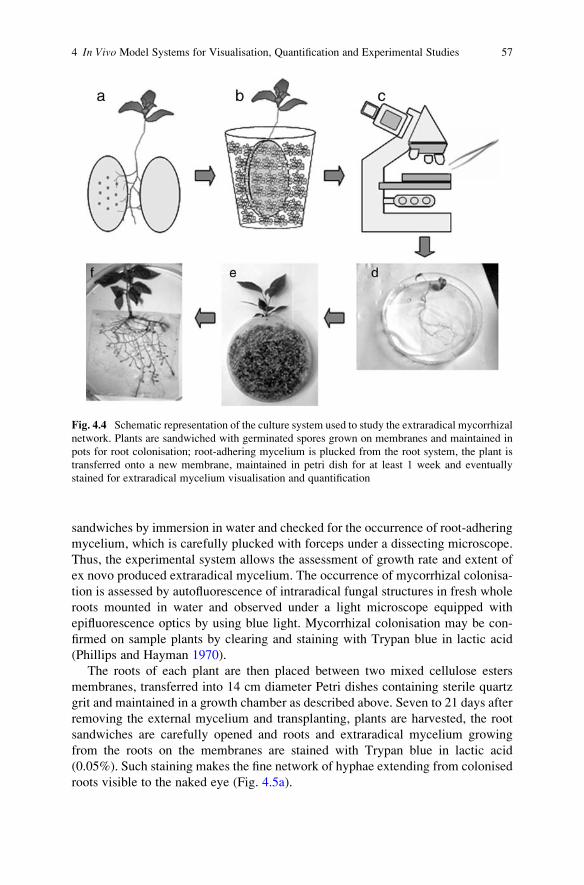
sandwiches by immersion in water and checked for the occurrence of root-adhering
mycelium, which is carefully plucked with forceps under a dissecting microscope.
Thus, the experimental system allows the assessment of growth rate and extent of
ex novo produced extraradical mycelium. The occurrence of mycorrhizal colonisa-
tion is assessed by autofluorescence of intraradical fungal structures in fresh whole
roots mounted in water and observed under a light microscope equipped with
epifluorescence optics by using blue light. Mycorrhizal colonisation may be con-
firmed on sample plants by clearing and staining with Trypan blue in lactic acid
(Phillips and Hayman 1970).
The roots of each plant are then placed between two mixed cellulose esters
membranes, transferred into 14 cm diameter Petri dishes containing sterile quartz
grit and maintained in a growth chamber as described above. Seven to 21 days after
removing the external mycelium and transplanting, plants are harvested, the root
sandwiches are carefully opened and roots and extraradical mycelium growing
from the roots on the membranes are stained with Trypan blue in lactic acid
(0.05%). Such staining makes the fine network of hyphae extending from colonised
roots visible to the naked eye (Fig. 4.5a).
Fig. 4.4 Schematic representation of the culture system used to study the extraradical mycorrhizal
network. Plants are sandwiched with germinated spores grown on membranes and maintained in
pots for root colonisation; root-adhering mycelium is plucked from the root system, the plant is
transferred onto a new membrane, maintained in petri dish for at least 1 week and eventually
stained for extraradical mycelium visualisation and quantification
4 In Vivo Model Systems for Visualisation, Quantification and Experimental Studies 57
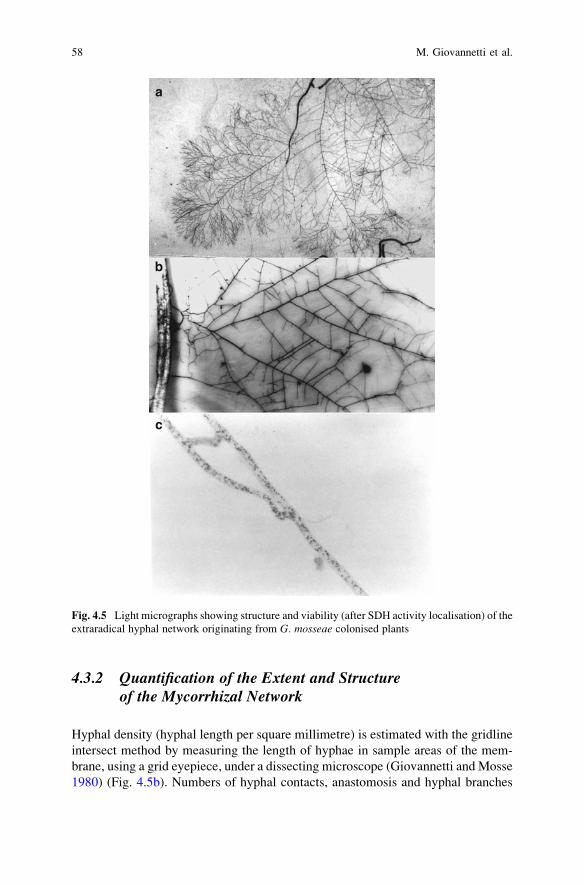
4.3.2 Quantification of the Extent and Structureof the Mycorrhizal Network
Hyphal density (hyphal length per square millimetre) is estimated with the gridline
intersect method by measuring the length of hyphae in sample areas of the mem-
brane, using a grid eyepiece, under a dissecting microscope (Giovannetti and Mosse
1980) (Fig. 4.5b). Numbers of hyphal contacts, anastomosis and hyphal branches
c
b
a
Fig. 4.5 Light micrographs showing structure and viability (after SDH activity localisation) of the
extraradical hyphal network originating from G. mosseae colonised plants
58 M. Giovannetti et al.
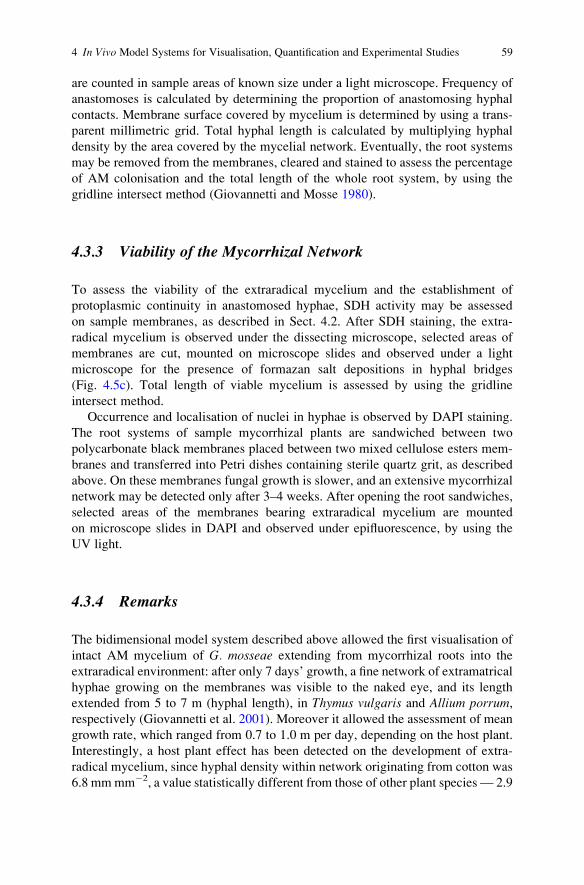
are counted in sample areas of known size under a light microscope. Frequency of
anastomoses is calculated by determining the proportion of anastomosing hyphal
contacts. Membrane surface covered by mycelium is determined by using a trans-
parent millimetric grid. Total hyphal length is calculated by multiplying hyphal
density by the area covered by the mycelial network. Eventually, the root systems
may be removed from the membranes, cleared and stained to assess the percentage
of AM colonisation and the total length of the whole root system, by using the
gridline intersect method (Giovannetti and Mosse 1980).
4.3.3 Viability of the Mycorrhizal Network
To assess the viability of the extraradical mycelium and the establishment of
protoplasmic continuity in anastomosed hyphae, SDH activity may be assessed
on sample membranes, as described in Sect. 4.2. After SDH staining, the extra-
radical mycelium is observed under the dissecting microscope, selected areas of
membranes are cut, mounted on microscope slides and observed under a light
microscope for the presence of formazan salt depositions in hyphal bridges
(Fig. 4.5c). Total length of viable mycelium is assessed by using the gridline
intersect method.
Occurrence and localisation of nuclei in hyphae is observed by DAPI staining.
The root systems of sample mycorrhizal plants are sandwiched between two
polycarbonate black membranes placed between two mixed cellulose esters mem-
branes and transferred into Petri dishes containing sterile quartz grit, as described
above. On these membranes fungal growth is slower, and an extensive mycorrhizal
network may be detected only after 3–4 weeks. After opening the root sandwiches,
selected areas of the membranes bearing extraradical mycelium are mounted
on microscope slides in DAPI and observed under epifluorescence, by using the
UV light.
4.3.4 Remarks
The bidimensional model system described above allowed the first visualisation of
intact AM mycelium of G. mosseae extending from mycorrhizal roots into the
extraradical environment: after only 7 days’ growth, a fine network of extramatrical
hyphae growing on the membranes was visible to the naked eye, and its length
extended from 5 to 7 m (hyphal length), in Thymus vulgaris and Allium porrum,respectively (Giovannetti et al. 2001). Moreover it allowed the assessment of mean
growth rate, which ranged from 0.7 to 1.0 m per day, depending on the host plant.
Interestingly, a host plant effect has been detected on the development of extra-
radical mycelium, since hyphal density within network originating from cotton was
6.8 mmmm�2, a value statistically different from those of other plant species — 2.9
4 In Vivo Model Systems for Visualisation, Quantification and Experimental Studies 59
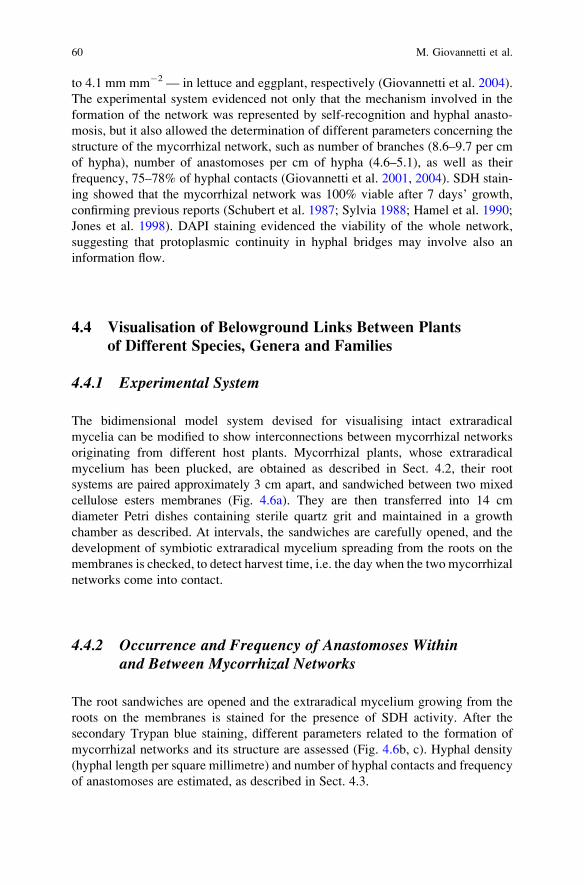
to 4.1 mm mm�2 — in lettuce and eggplant, respectively (Giovannetti et al. 2004).
The experimental system evidenced not only that the mechanism involved in the
formation of the network was represented by self-recognition and hyphal anasto-
mosis, but it also allowed the determination of different parameters concerning the
structure of the mycorrhizal network, such as number of branches (8.6–9.7 per cm
of hypha), number of anastomoses per cm of hypha (4.6–5.1), as well as their
frequency, 75–78% of hyphal contacts (Giovannetti et al. 2001, 2004). SDH stain-
ing showed that the mycorrhizal network was 100% viable after 7 days’ growth,
confirming previous reports (Schubert et al. 1987; Sylvia 1988; Hamel et al. 1990;
Jones et al. 1998). DAPI staining evidenced the viability of the whole network,
suggesting that protoplasmic continuity in hyphal bridges may involve also an
information flow.
4.4 Visualisation of Belowground Links Between Plants
of Different Species, Genera and Families
4.4.1 Experimental System
The bidimensional model system devised for visualising intact extraradical
mycelia can be modified to show interconnections between mycorrhizal networks
originating from different host plants. Mycorrhizal plants, whose extraradical
mycelium has been plucked, are obtained as described in Sect. 4.2, their root
systems are paired approximately 3 cm apart, and sandwiched between two mixed
cellulose esters membranes (Fig. 4.6a). They are then transferred into 14 cm
diameter Petri dishes containing sterile quartz grit and maintained in a growth
chamber as described. At intervals, the sandwiches are carefully opened, and the
development of symbiotic extraradical mycelium spreading from the roots on the
membranes is checked, to detect harvest time, i.e. the day when the two mycorrhizal
networks come into contact.
4.4.2 Occurrence and Frequency of Anastomoses Withinand Between Mycorrhizal Networks
The root sandwiches are opened and the extraradical mycelium growing from the
roots on the membranes is stained for the presence of SDH activity. After the
secondary Trypan blue staining, different parameters related to the formation of
mycorrhizal networks and its structure are assessed (Fig. 4.6b, c). Hyphal density
(hyphal length per square millimetre) and number of hyphal contacts and frequency
of anastomoses are estimated, as described in Sect. 4.3.
60 M. Giovannetti et al.

c
b
a
Fig. 4.6 Schematic representation of the culture system used to study plant interconnections by
means of AMF extraradical networks. Colonised host plant roots are paired on membranes (a) and
the mycelial interconnections are visualised after SDH and Trypan blue stainings (b, c: courtesy of
New Phytologist)
4 In Vivo Model Systems for Visualisation, Quantification and Experimental Studies 61
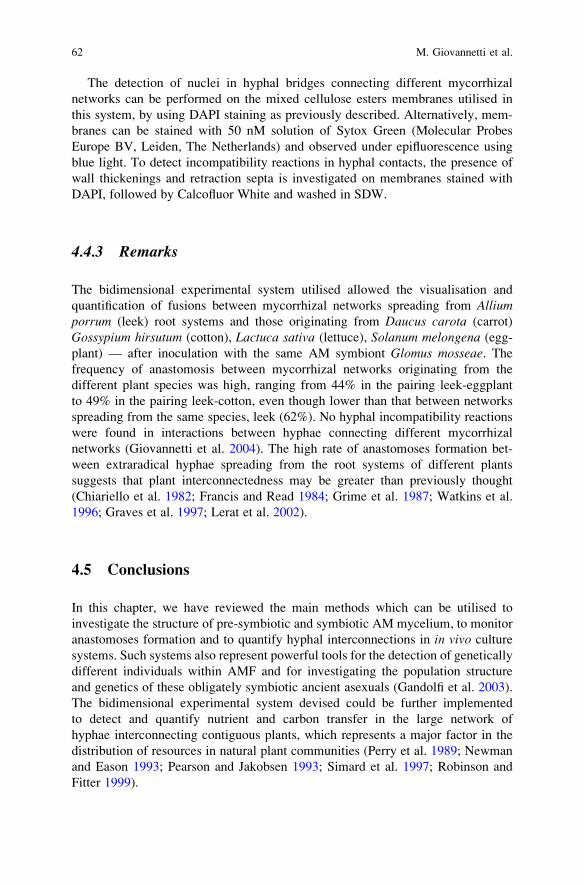
The detection of nuclei in hyphal bridges connecting different mycorrhizal
networks can be performed on the mixed cellulose esters membranes utilised in
this system, by using DAPI staining as previously described. Alternatively, mem-
branes can be stained with 50 nM solution of Sytox Green (Molecular Probes
Europe BV, Leiden, The Netherlands) and observed under epifluorescence using
blue light. To detect incompatibility reactions in hyphal contacts, the presence of
wall thickenings and retraction septa is investigated on membranes stained with
DAPI, followed by Calcofluor White and washed in SDW.
4.4.3 Remarks
The bidimensional experimental system utilised allowed the visualisation and
quantification of fusions between mycorrhizal networks spreading from Alliumporrum (leek) root systems and those originating from Daucus carota (carrot)
Gossypium hirsutum (cotton), Lactuca sativa (lettuce), Solanum melongena (egg-
plant) — after inoculation with the same AM symbiont Glomus mosseae. Thefrequency of anastomosis between mycorrhizal networks originating from the
different plant species was high, ranging from 44% in the pairing leek-eggplant
to 49% in the pairing leek-cotton, even though lower than that between networks
spreading from the same species, leek (62%). No hyphal incompatibility reactions
were found in interactions between hyphae connecting different mycorrhizal
networks (Giovannetti et al. 2004). The high rate of anastomoses formation bet-
ween extraradical hyphae spreading from the root systems of different plants
suggests that plant interconnectedness may be greater than previously thought
(Chiariello et al. 1982; Francis and Read 1984; Grime et al. 1987; Watkins et al.
1996; Graves et al. 1997; Lerat et al. 2002).
4.5 Conclusions
In this chapter, we have reviewed the main methods which can be utilised to
investigate the structure of pre-symbiotic and symbiotic AM mycelium, to monitor
anastomoses formation and to quantify hyphal interconnections in in vivo culture
systems. Such systems also represent powerful tools for the detection of genetically
different individuals within AMF and for investigating the population structure
and genetics of these obligately symbiotic ancient asexuals (Gandolfi et al. 2003).
The bidimensional experimental system devised could be further implemented
to detect and quantify nutrient and carbon transfer in the large network of
hyphae interconnecting contiguous plants, which represents a major factor in the
distribution of resources in natural plant communities (Perry et al. 1989; Newman
and Eason 1993; Pearson and Jakobsen 1993; Simard et al. 1997; Robinson and
Fitter 1999).
62 M. Giovannetti et al.
Acknowledgements The financial support from the FISR SOILSINK Project (2005–08) and from
CNR AG.P01.001 ‘‘Molecular, physiological and cellular bases of crop production’’, is gratefully
acknowledged.
References
Chiariello N, Hickman JC, Mooney HA (1982) Endomycorrhizal role for interspecific transfer of
phosphorus in a community of annual plants Plantago erecta. Science 217:941–943Cortesi P, Milgroom MG, Bisiach M (1996) Distribution and diversity of vegetative compatibility
types in subpopulations of Cryphonectria parasitica in Italy. Mycol Res 100:1087–1093
Dahlberg A, Stenlid J (1994) Size, distribution and biomass of genets in populations of Suillusbovinus (L.: Fr.) Roussel revealed by somatic incompatibility. New Phytol 128:225–234
de la Providencia IE, de Souza FA, Fernandez F, Delmas NS, Declerck S (2005) Arbuscular
mycorrhizal fungi reveal distinct patterns of anastomosis formation and hyphal healing
mechanisms between different phylogenic groups. New Phytol 165:261–271
Francis R, Read DJ (1984) Direct transfer of carbon between plants connected by mycorrhizal
mycelium. Nature 307:53–56
Fries N (1987) Somatic incompatibility and field distribution of the ectomycorrhizal fungus Suillusluteus (Boletaceae). New Phytol 107:735–739
Gandolfi A, Sanders IR, Rossi V, Menozzi P (2003) Evidence of recombination in putative ancient
asexuals. Mol Biol Evol 20:754–761
Giovannetti M, Mosse B (1980) An evaluation of techniques for measuring vesicular arbuscular
mycorrhizal infection in roots. New Phytol 84:489–500
Giovannetti M, Sbrana C (2001) Self and non-self responses in hyphal tips of arbuscular
mycorrhizal fungi. In: Geitmann A, Cresti M (eds) Cell biology of plant and fungal tip growth.
NATO science series, series I: Life and behavioural sciences, vol.328. IOS, Amsterdam,
pp 221–231
Giovannetti M, Azzolini D, Citernesi AS (1999) Anastomosis formation and nuclear and proto-
plasmic exchange in arbuscular mycorrhizal fungi. Appl Environ Microbiol 65:5571–5575
Giovannetti M, Sbrana C, Logi C (2000) Microchambers and video-enhanced light microscopy for
monitoring cellular events in living hyphae of arbuscular mycorrhizal fungi. Plant Soil
226:153–159
Giovannetti M, Fortuna P, Citernesi AS, Morini S, Nuti MP (2001) The occurrence of anastomosis
formation and nuclear exchange in intact arbuscular mycorrhizal networks. New Phytol
151:717–724
Giovannetti M, Sbrana C, Strani P, Agnolucci M, Rinaudo V, Avio L (2003) Genetic diversity of
geographically different isolates of Glomus mosseae detected by vegetative compatibility and
biochemical and molecular analysis. Appl Environ Microbiol 69:616–624
Giovannetti M, Sbrana C, Avio L, Strani P (2004) Patterns of below-ground plant interconnections
established by means of arbuscular mycorrhizal networks. New Phytol 164:175–181
Glass NL, Jacobson DJ, Shiu PKT (2000) The genetics of hyphal fusion and vegetative incompati-
bility in filamentous ascomycete fungi. Annu Rev Genetics 34:165–186
Graves JD, Watkins NK, Fitter AH, Robinson D, Scrimgeour C (1997) Intraspecific transfer of
carbon between plants linked by a common mycorrhizal network. Plant Soil 192:153–159
Grime JP, Mackey JML, Hillier SH, Read DJ (1987) Floristic diversity in a model system using
experimental microcosms. Nature 328:420–422
Hamel C, Fyles H, Smith DL (1990) Measurement of development of endomycorrhizal mycelium
using three vital stains. New Phytol 115:297–302
4 In Vivo Model Systems for Visualisation, Quantification and Experimental Studies 63
Jones MD, Durall DM, Tinker PB (1998) Comparison of arbuscular and ectomycorrhizal
Eucalyptus coccifera: growth response, phosphorus uptake efficiency and external hyphal
production. New Phytol 140:125–134
Lerat S, Gauci R, Catford JG, Vierheilig H, Piche Y, Lapointe L (2002) 14C transfer between the
spring ephemeral Erythronium americanum and sugar maple saplings via arbuscular mycor-
rhizal fungi in natural stands. Oecologia 132:181–187
Leslie JF (1993) Fungal vegetative compatibility. Annu Rev Phytopathol 31:127–150
Logi C, Sbrana C, Giovannetti M (1998) Cellular events involved in survival of individual
arbuscular mycorrhizal symbionts growing in the absence of the host. Appl Environ Microbiol
64:3473–3479
Milgroom MG, Cortesi P (1999) Analysis of population structure of the chestnut blight fungus
based on vegetative incompatible genotypes. Proc Natl Acad Sci USA 96:10518–10523
Newman EI, Eason WR (1993) Rates of phosphorus transfer within and between ryegrass (Loliumperenne) plants. Funct Ecol 7:242–248
Pearson JN, Jakobsen I (1993) Symbiotic exchange of carbon and phosphorus between cucumber
and three arbuscular mycorrhizal fungi. New Phytol 124:481–488
Perry DA, Amaranthus MP, Borchers JG, Borchers SL, Brainerd RE (1989) Bootstrapping in
ecosystems. Bioscience 39:230–237
Phillips JM, Hayman DS (1970) Improved procedure for clearing roots and staining parasites and
vesicular–arbuscular mycorrhizal fungi for rapid assessment of infection. Trans Br Mycol Soc
55:158–161
Robinson D, Fitter A (1999) The magnitude and control of carbon transfer between plants linked
by a common mycorrhizal network. J Exp Bot 50:9–13
Schubert A, Marzachı C, Mazzitelli M, Cravero MC, Bonfante-Fasolo P (1987) Development of
total and viable extraradical mycelium in the vesicular–arbuscular mycorrhizal fungus Glomusclarum Nicol. and Schenck. New Phytol 107:183–190
Sen R (1990) Intraspecific variation in two species of Suillus from Scots pine (Pinus sylvestris L.)forests based on somatic incompatibility and isozyme analyses. New Phytol 114:607–616
Simard SW, Perry DA, Jones MD, Myrold DD, Durall DM, Molina R (1997) Net transfer of
carbon between ectomycorrhizal tree species in the field. Nature 388:579–582
Smith SE, Gianinazzi-Pearson V (1990) Phosphate uptake and arbuscular activity in mycorrhizal
Allium cepa L.: effects of photon irradiance and phosphate nutrition. Aust J Plant Physiol
17:177–188
Smith SE, Read DJ (1997) Mycorrhizal symbiosis. Academic, London
Sylvia DM (1988) Activity of external hyphae of vesicular–arbuscular mycorrhizal fungi. Soil
Biol Biochem 20:39–43
Watkins NK, Fitter AH, Graves JD, Robinson D (1996) Carbon transfer between C3 and C4 plants
linked by a common mycorrhizal network, quantified using stable carbon isotopes. Soil Biol
Biochem 28:471–477
64 M. Giovannetti et al.
Chapter 5
Measurement of Net Ion Fluxes Using
Ion-Selective Microelectrodes at the
Surface of Ectomycorrhizal Roots
A. Gobert and C. Plassard
5.1 Introduction
Ion-selective microelectrodes are used to measure ion gradients across membranes,
but they can serve various purposes (Newman 2001). They are used in animal, plant
and even bacteria studies (McClure et al. 1990; Shabala et al. 2001; Kang et al. 2003).
Two different kinds of ion-selectivemicroelectrodes can be produced: microelectrodes
for net flux measurements — non-invasive — (Gobert and Plassard 2002) and micro-
electrodes for intracellular studies — impalement needed (Miller et al. 2001).
Although we have knowledge of double-barrelled microelectrodes for intracellular
studies of ectomycorrhizas, this chapter is aimed at describing the technique of ion
flux measurement outside the tissues in plants and ectomycorrhizal roots.
This technique applied to ion fluxes originating from plants is not widely used
and arose in the late 1980s and early 1990s (Newman et al. 1987; Henriksen et al.
1990). Ion-selective microelectrodes give access to net flux measurements originat-
ing from a few micrometers at the surface of the root of an undisturbed plant.
The technique can be easily applied to study the effects of gene mutation or
differences between ecotypes or fungal strains. In addition, the effect of biotic
(phytotoxins, myc factors) and abiotic factors (temperature, osmotic stress) can be
assessed. The technique has been applied on plants for cation measurements such as
K+, H+, NH4+ and Ca2+ (Kochian et al. 1989; McClure et al. 1990; Huang et al.
1992; Henriksen et al. 1992) and anion measurements such as NO3� (McClure et al.
1990). In our laboratory, we have developed this method to quantify net H+, K+ and
A. Gobert and C. Plassard (*)
UMR 1222 Eco&Sols, INRA-IRD-SupAgro, Bat 12, 2, place Viala, 34060 Montpellier, cedex, 01
France
e‐mail: [email protected]
A. Varma and A.C. Kharkwal (eds.), Symbiotic Fungi, Soil Biology 18, 65
DOI: 10.1007/978‐3‐540‐95894‐9_5, # Springer‐Verlag Berlin Heidelberg 2009

NO3� fluxes occurring along the roots of woody species and ectomycorrhizal roots
(Gobert and Plassard 2002, 2007; Plassard et al. 2002). In this chapter, we will
present the theory and the practice behind the microelectrodes, followed by some
examples of local net flux measurements.
5.2 Principle of Ion Activities Measurement
with Ion-Selective Microelectrodes
5.2.1 What Is an Ion-Selective Microelectrode?
In our system, ion-selective microelectrodes are made from a glass capillary which
has been pulled and silanized. Then the tip is filled with a minimal amount of a
liquid membrane (the cocktail) that contains the ionophore selective for an ion.
Finally, the remainder of the capillary is filled with a saline solution (the back
solution) (Fig. 5.1). The microelectrodes are then connected to an amplifier via a
silver wire to measure the electrochemical potential difference of the studied ion in
the solution, setting out and inside the microelectrode across the cocktail. Voltage
values given by the amplifier are only due to the ion under study because the
cocktails are highly specific.
The main component of the cocktail solution is a complexing agent (ligand)
responsible for ion selectivity. This agent belongs to the category of ionophores,
comprising ion channels and transporters, although only ion transporters are used
to make the cocktail (Ammann 1986). The transporter, which is dissolved in an
organic phase, diffuses throughout the membrane as complexes with the ion under
study, thus carrying the ion from the outside solution (the measuring solution) into
the inside solution (the back solution of the microelectrode).
Fig. 5.1 Schematic representation of an ion-selective microelectrode, with the cocktail containing
the ionophore at the tip and the backfilling solution creating the electric connection with the silver
chloride wire
66 A. Gobert and C. Plassard
The back solution is a salt solution containing chloride ions (Cl�) and the ion
under study. Its concentration should be very high to avoid possible variation and
to minimize possible errors in ion activity determinations. Generally, KCl is used,
but it is possible to use another salt if anion and cation mobilities are as close
as possible.
The measurement of the electrochemical potential difference requires move-
ments of small amounts of electrical charges between the aqueous phase (back
solution) and the metal phase (the silver wire) constituting an electrode. It is
necessary for the charge movement to occur through a reversible, reproducible
and dominant chemical reaction at the interface solution/solid metal. The chemical
reaction which is generally used is the one occurring at the interface silver/silver
chloride, which is as follows:
AgClðsÞ þ e� ! AgðsÞ þ Cl�:
This reaction supplies a good electrical contact between the silver wire and the
solution (Thain 1995). As indicated by the equation given above, the electrical
potential measured with the silver/silver chloride electrode will depend on the
concentration of available chloride anions in the solution. It is therefore important
that this concentration remains constant during the experiment.
5.2.2 Expression of the Voltage Difference Across the Cocktail
The system has two distinct compartments: the internal compartment (back solu-
tion) with a concentration Ci and the external compartment (the solution to be
measured) with a concentration Ce In each compartment, the ion electrochemical
potential will be
m ¼ m� þ V� Pa � P�ð Þ þ RT ln C gð Þ þMghþ nFV; ð5:1Þ
with m electrochemical potential, m� reference electrochemical potential, V voltage,
Pa � P� pressure difference, R constant of perfect gas, T temperature, C concentra-
tion, g activity coefficient, g earth force coefficient and n ion valence. In addition,
we know that at equilibrium the electrochemical potential of the ion has the same
value in both compartments; thus,
mi ¼ me ð5:2Þ
and
Dm ¼ mi � me ¼ 0: ð5:3Þ
5 Measurement of Net Ion Fluxes Using Ion-Selective Microelectrodes 67

After simplification of (5.3) (for detail of calculation, see Ammann 1986),
we obtain Nernst’s equation, which gives the voltage difference across the two
compartments as a function of the concentrations:
DV ¼ RT=nFð Þ ln Ce=Cið Þ: ð5:4Þ
Therefore, the ideal relationship between electrode output (mV) and the activity
(ai) of the ion under study (i) is log-linear, and should give an ideal slope of 59
mV per decade change in the activity of a monovalent ion at 25�C when the
electrode is calibrated in the appropriate solution. However, in practice, the
situation is more complicated than this, because no ion-selective electrode has
ideal selectivity for one particular ion, and under most conditions there is more
than one ion present in the sample solution. Hence, contributions to the overall
electro-motive force (EMF) made by each interfering ion, J, must be taken into
account (Ammann 1986). Major interfering ions for each selective membrane are
given in the Fluka catalogue. If the measuring solution contains known interfering
ions, the selectivity coefficient of the membrane should be determined during the
calibration step. For that, the fixed interference method is most commonly used to
calculate the selectivity coefficient, and it is the method recommended by the
International Union of Pure and Applied Chemistry (Ammann 1986). However,
very simplified solutions, with a minimal concentration of interfering ions, can be
used when measuring ion fluxes at the root surface, thus minimizing the lack of
sensitivity of a given membrane, if it exists.
5.3 Principle of Flux Measurement
5.3.1 Expression of Local Diffusion Flux in a Solution
If a coloured solution is poured very gently into a non-coloured solution, we will
see the delimited surface between the two liquids which disappears with time. This
is due to the diffusion of the coloured solution into the non-coloured one, and vice
versa. Similarly, across a transversal section, there are always particles running in
opposite directions. The movement of these particles occurs in both directions
and will stop only when the mixing is perfect. However, the diffusion vector Jis orientated towards the decreasing potentials. The equation that describes the
diffusion is Fick’s law:
J ¼ �D C1 � C0ð Þ= x1 � x0ð Þ ¼ �DDC=Dx; ð5:5Þ
with J local flux of diffusion, D diffusion coefficient of the ion of interest, C1 ion
concentration at the distance x1, C0 ion concentrations at the distance x0.
68 A. Gobert and C. Plassard

5.3.2 Estimation of Ion Fluxes at the Root Surface
When a root is placed in a solution where ions are moving by diffusion and where
the coordinates of radial symmetry apply (Fig. 5.2), the net radial ion flux is given
by the following equation (Newman et al. 1987; Henriksen et al. 1992):
J ¼ 2pD C2 � C1ð Þln r2=r1ð Þ ðin mmol cm�1 s�1Þ; ð5:6Þ
with D diffusion coefficient (cm2 s�1), C1 concentration at a radial distance r1, C2
concentration at a radial distance r2, r1 and r2 radial distances from the cylinder
centre.
The ion flux crossing the transversal root section of area A and with a root
density r (that we take by default equal to 1) for 1 h will be
J ¼ k 2pD=Arð Þ C2=C1ð Þln r2=r1ð Þ ; ð5:7Þ
J ¼ k 2D=r2ð Þ C2=C1ð Þln r2=r1ð Þ : ð5:8Þ
Finally, we obtain the following equation used to calculate the ion flux occurring at
the root surface:
J ¼ k 2D=r2ð Þ C2=C1ð Þln d2 þ rð Þ= d1 þ rð Þ½ � ðin mmol g�1 root fwt�1 h�1Þ; ð5:9Þ
Fig. 5.2 Schematic representation of the radial symmetry of ion diffusion occurring in the
solution at the surface of the root
5 Measurement of Net Ion Fluxes Using Ion-Selective Microelectrodes 69
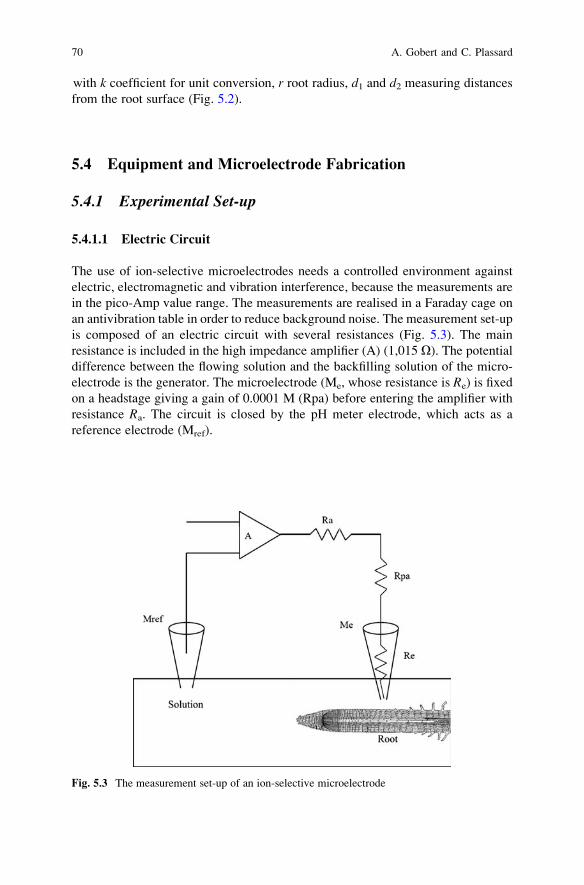
with k coefficient for unit conversion, r root radius, d1 and d2 measuring distances
from the root surface (Fig. 5.2).
5.4 Equipment and Microelectrode Fabrication
5.4.1 Experimental Set-up
5.4.1.1 Electric Circuit
The use of ion-selective microelectrodes needs a controlled environment against
electric, electromagnetic and vibration interference, because the measurements are
in the pico-Amp value range. The measurements are realised in a Faraday cage on
an antivibration table in order to reduce background noise. The measurement set-up
is composed of an electric circuit with several resistances (Fig. 5.3). The main
resistance is included in the high impedance amplifier (A) (1,015 O). The potentialdifference between the flowing solution and the backfilling solution of the micro-
electrode is the generator. The microelectrode (Me, whose resistance is Re) is fixed
on a headstage giving a gain of 0.0001 M (Rpa) before entering the amplifier with
resistance Ra. The circuit is closed by the pH meter electrode, which acts as a
reference electrode (Mref).
Fig. 5.3 The measurement set-up of an ion-selective microelectrode
70 A. Gobert and C. Plassard

5.4.1.2 Equipment Set-up
As described above, specific equipment is needed in order to carry out the flux
measurements. Indeed, the current throughout the cocktail is very small and a high
impedance electrometer amplifier and background noise protection are needed.
5.4.1.3 Equipment Needed
Faraday cage sitting over an ‘‘antivibration’’ table (home-made)
Microscope (e.g. �180, from Ealing, http://www.ealingcatalog.com/) with a fitted
live camera fixed on the table (i.e. from Sony, http://www.sonybiz.net/)
Manual micromanipulators (where the microelectrode holders are fixed, e.g. from
Narishige, http://www.narishige.co.jp/)
Computer-assisted stage (where the measuring chamber is placed; e.g. from Ealing)
Amplifiers (e.g. Axoprobe-1A, Axon Instruments, now available at http://www.
moleculardevices.com/)
Interface (e.g. MacLab/8e, ADInstruments, http://www.adinstruments.com/)
Computer with acquisition software (e.g. Chart V3.3.7, ADIntruments)
Monitor (live feed from the camera fixed to the microscope; e.g. Sony)
pH meter and electrode (e.g. Metrohm)
Optic fibre light source
Bottles and tubing for the solution entrance and exit from the chamber
The set-up is virtually described in Fig. 5.4, with equipment placed inside and
outside of the Faraday cage.
5.4.1.4 Inside the Faraday Cage
On the ‘‘antivibration’’ table, the microscope and the computer-assisted stage are
the main features. A camera is fixed at the back of the microscope. The table
supports some posts with clamps to fix the microelectrode holders (HS-2 Headstage,
Axon Instruments, 0.0001 M gain). All the cables are earthed.
The chamber holding the root is mounted on the computer-assisted stage. It is
designed so that the root system can be continuously perfused with the experimental
nutrient solution throughout the measurement. The waste solution coming out of the
chamber is collected in a plastic beaker in the cage.
5.4.1.5 Outside the Faraday Cage
All the electronic equipment is outside the cage. The electric signal coming from
the electrodes is sent to a high-impedance electrometer amplifier (1,015 O) (AxonInstruments, Inc. 1993). Then, the electrometer output is directed via an A/D
5 Measurement of Net Ion Fluxes Using Ion-Selective Microelectrodes 71

converter to a computer. The circuitry is terminated through a pH meter submerged
in the chamber.
In addition, the camera monitor and the light supply are outside the cage.
Finally, the perfusing solution is made just prior to use (the pH is carefully set in
order to avoid discrepancy between the different concentrations). The solution is
bubbled with decarbonated air (air going though soda lime and boiled water) to
obtain an HCO3� free solution. The bottles of solution stand outside the cage at a
higher position than the chamber, and the liquid moves with gravity towards the
chamber (into tubing with a tap). The flow is reduced using a low-diameter needle
plunged into the chamber.
10
54
6
InterfaceAmplifier
Motor1
Motor 2Computercontrolled
2
7
9
ME1 ME2
Motor 3 Hand controlled
pH meter3
1
8
Fig. 5.4 Experimental set-up for continuous monitoring of ion fluxes using ion-selective
microelectrodes: (1) Intact plant in a perspex cuvette, (2) flowing solution, (3) ion-selective
microelectrodes plugged in headstages and moved by a hand-controlled motor, (4) amplifier, (5)interface (McLab), (6) computer (MacIntosh), (7) combined pH-macroelectrode, (8) mobile plate
moving the cuvette using computer-controlled motors, (9) Faraday cage, (10) monitor connected
to the camera
72 A. Gobert and C. Plassard

5.4.2 Making the Microelectrodes
5.4.2.1 Pulling of Glass Micropipettes
In our set-up, the microelectrodes are made from borosilicate glass. The borosilicate
glass tubes have to be pulled into two equal pieces to create the microelectrodes.
5.4.2.2 Equipment Needed
Borosilicate capillaries (GC150F-10, Clark Electromedical Instruments, Pangbourne,
UK) two-step puller (provider).
One extremity of the borosilicate tube is fixed at each side of the puller, the
bottom mortar being lifted.
Then, a two-step protocol is applied to produce microelectrodes of the desired
size (1–2 mm diameter in our case). An estimate of the tip size of the microelectrode
is determined by measuring its electrical resistance when filled with 3 M KCl.
Smaller tips have higher resistances than larger tips, but the dimensions of the
microelectrodes are usually a compromise between obtaining a stable membrane
potential and a good calibration response (detection limit).
5.4.3 Internal Silanization of the Pulled Borosilicate Tubeor Microelectrode
The inside of the glass micropipettes must be given a hydrophobic coating, to
allow the formation of a high resistance seal between the glass and the hydrophobic
ion-selective membrane.
5.4.3.1 Equipment Needed
Fume hood (for all silanizing agent and solvent use)
Oven reaching 180�C (in a aerated area or in the fume hood)
Micropipette holder (home-made in our case, Fig. 5.5)
100-ml glass syringeSilanizing agent (e.g. N, N-dimethyltrimethylsilylamine or tributylchlorosilane,
from Fluka)
Tetrahydrofurane (for rinsing the syringe after silicone use)
First, carefully place the extremity of the microelectrodes in the hole in the holder
(tip to the sky). The holder has an inside cavity where the silanizing agent can be
poured; this cavity is linked only to the inside of the microelectrodes. When placing
5 Measurement of Net Ion Fluxes Using Ion-Selective Microelectrodes 73
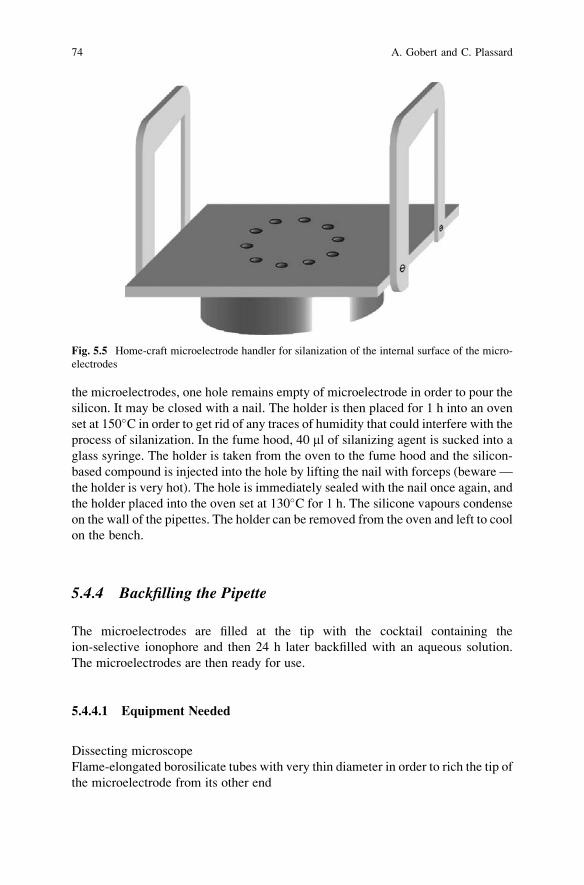
the microelectrodes, one hole remains empty of microelectrode in order to pour the
silicon. It may be closed with a nail. The holder is then placed for 1 h into an oven
set at 150�C in order to get rid of any traces of humidity that could interfere with the
process of silanization. In the fume hood, 40 ml of silanizing agent is sucked into a
glass syringe. The holder is taken from the oven to the fume hood and the silicon-
based compound is injected into the hole by lifting the nail with forceps (beware —
the holder is very hot). The hole is immediately sealed with the nail once again, and
the holder placed into the oven set at 130�C for 1 h. The silicone vapours condense
on the wall of the pipettes. The holder can be removed from the oven and left to cool
on the bench.
5.4.4 Backfilling the Pipette
The microelectrodes are filled at the tip with the cocktail containing the
ion-selective ionophore and then 24 h later backfilled with an aqueous solution.
The microelectrodes are then ready for use.
5.4.4.1 Equipment Needed
Dissecting microscope
Flame-elongated borosilicate tubes with very thin diameter in order to rich the tip of
the microelectrode from its other end
Fig. 5.5 Home-craft microelectrode handler for silanization of the internal surface of the micro-
electrodes
74 A. Gobert and C. Plassard

10-ml syringe extended with a silicon-based tube whose inner diameter matches the
outer diameter of the borosilicate tubes
Ion-selective cocktails (ready-to-use, e.g. Fluka or home-made)
Salt solution (KNO3, KCl, . . .), ultrapure water and pH meter
In our laboratory, we use H+, K+ and NO3� microelectrodes. H+ microelectrodes
are filled with a ready-to-use cocktail (Fluka 95297), as are our K+ microelectrodes
(Fluka 60398). NO3� microelectrodes are filled with a home-made cocktail
comprising MTDDA NO3� (8.3%), MTPPB (1.4%) and NPOE (90.3%).
These cocktail solutions are sucked up into the rod from the flame-elongated
tube with the syringe (the borosilicate tube being connected to the silicon base
tube). You need to pull the syringe hard to fill only a few micrometers of the rod.
This rod is then inserted into the extremity of the microelectrode (it is better to use a
magnifier) and moved towards the tip of the microelectrode. When it has reached
the tip, push the syringe to expel a minimum amount of cocktail into the tip, and
remove the rod carefully. The microelectrode is placed almost horizontally (tip part
being slightly upward) into a silica-gel-dried sealed container in the dark in order to
avoid dust and preserve the quality of the cocktail. The cocktail is going to move
upward to the tip by capillarity (you need to wait overnight at least).
Next day, the backfilling solutions can be added (usually just before use).
The solutions are buffered at pH 6 and comprise 0.3 M KCl, 0.01 M TRIS/MES
for H+, KCl 3 M for K+ et KNO3 0.1 M, KCl 0.1 M for NO3�. Before using the
microelectrodes, we break the tip carefully in order to increase the tip diameter to
5 mm. It gives a better and faster response from the microelectrodes even if their
lifetime is reduced. The microelectrodes are finished and ready for calibration.
5.4.5 Calibration
Ion-selective microelectrodes can be calibrated using concentration or activity; the
electrodes actually respond to changes in activity. For these reasons, the calibration
of microelectrodes generally uses solutions that match the extracellular environ-
ment which is going to be used during the measurements. In our case, the ion
concentrations are low and the activity coefficient can be approximated to 1. The
ideal relationship between electrode output (mV) and the concentration (mM) of the
ion under study is log-linear, and is described mathematically by the Nernst
equation (see Sect. 5.2.1).
5.4.5.1 Equipment Needed
Salt solutions (KNO3, CaSO4) and pH buffers (5, 6, 7)
Electrophysiology equipment (see Sect. 5.5)
Ag/AgCl metal electrodes (in the base of the microelectrode holder)
First, chloride must be added on the surface of the silver rod in order to create a
good electric connection. The silver rod is immersed into an HCl 0.1 M bath while
5 Measurement of Net Ion Fluxes Using Ion-Selective Microelectrodes 75
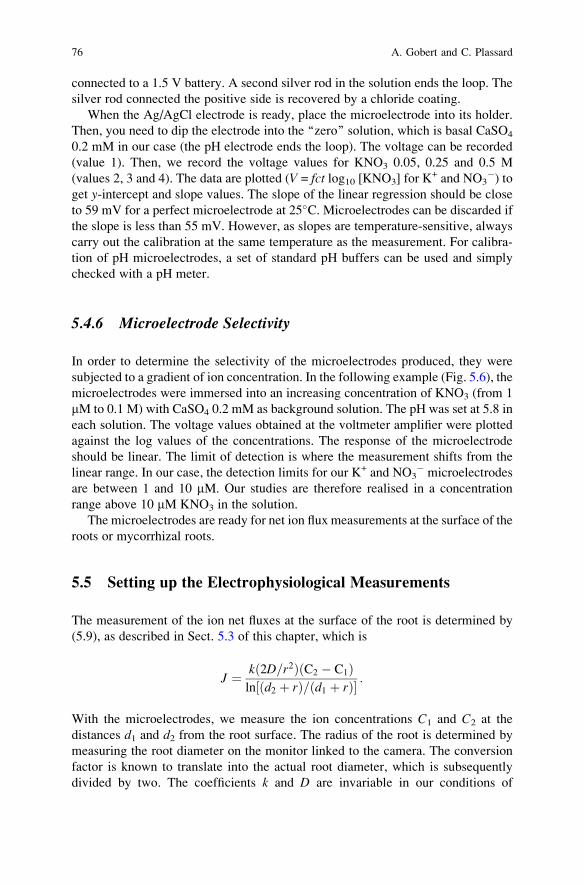
connected to a 1.5 V battery. A second silver rod in the solution ends the loop. The
silver rod connected the positive side is recovered by a chloride coating.
When the Ag/AgCl electrode is ready, place the microelectrode into its holder.
Then, you need to dip the electrode into the ‘‘zero’’ solution, which is basal CaSO4
0.2 mM in our case (the pH electrode ends the loop). The voltage can be recorded
(value 1). Then, we record the voltage values for KNO3 0.05, 0.25 and 0.5 M
(values 2, 3 and 4). The data are plotted (V = fct log10 [KNO3] for K+ and NO3
�) toget y-intercept and slope values. The slope of the linear regression should be close
to 59 mV for a perfect microelectrode at 25�C. Microelectrodes can be discarded if
the slope is less than 55 mV. However, as slopes are temperature-sensitive, always
carry out the calibration at the same temperature as the measurement. For calibra-
tion of pH microelectrodes, a set of standard pH buffers can be used and simply
checked with a pH meter.
5.4.6 Microelectrode Selectivity
In order to determine the selectivity of the microelectrodes produced, they were
subjected to a gradient of ion concentration. In the following example (Fig. 5.6), the
microelectrodes were immersed into an increasing concentration of KNO3 (from 1
mM to 0.1 M) with CaSO4 0.2 mM as background solution. The pH was set at 5.8 in
each solution. The voltage values obtained at the voltmeter amplifier were plotted
against the log values of the concentrations. The response of the microelectrode
should be linear. The limit of detection is where the measurement shifts from the
linear range. In our case, the detection limits for our K+ and NO3� microelectrodes
are between 1 and 10 mM. Our studies are therefore realised in a concentration
range above 10 mM KNO3 in the solution.
The microelectrodes are ready for net ion flux measurements at the surface of the
roots or mycorrhizal roots.
5.5 Setting up the Electrophysiological Measurements
The measurement of the ion net fluxes at the surface of the root is determined by
(5.9), as described in Sect. 5.3 of this chapter, which is
J ¼ k 2D=r2ð Þ C2 � C1ð Þln d2 þ rð Þ= d1 þ rð Þ½ � :
With the microelectrodes, we measure the ion concentrations C1 and C2 at the
distances d1 and d2 from the root surface. The radius of the root is determined by
measuring the root diameter on the monitor linked to the camera. The conversion
factor is known to translate into the actual root diameter, which is subsequently
divided by two. The coefficients k and D are invariable in our conditions of
76 A. Gobert and C. Plassard
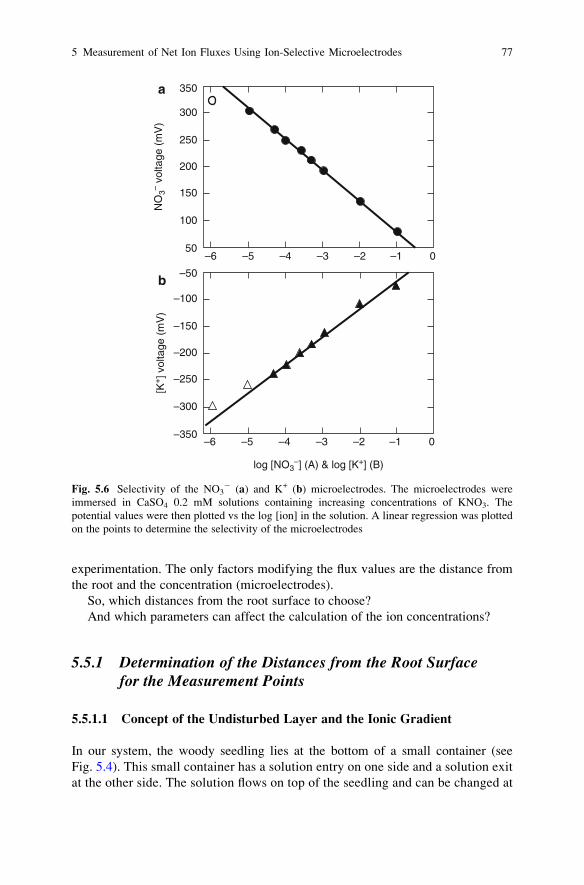
experimentation. The only factors modifying the flux values are the distance from
the root and the concentration (microelectrodes).
So, which distances from the root surface to choose?
And which parameters can affect the calculation of the ion concentrations?
5.5.1 Determination of the Distances from the Root Surfacefor the Measurement Points
5.5.1.1 Concept of the Undisturbed Layer and the Ionic Gradient
In our system, the woody seedling lies at the bottom of a small container (see
Fig. 5.4). This small container has a solution entry on one side and a solution exit
at the other side. The solution flows on top of the seedling and can be changed at
50
100
200
150
250
350
300
–6 –5 –4 –3 –2 –1 0
a
NO
3– vo
ltage
(m
V)
–6 –5 –4 –3 –2 –1 0–350
–300
–200
–250
–150
–50
–100
b
log [NO3–] (A) & log [K+] (B)
[K+] v
olta
ge (
mV
)
Fig. 5.6 Selectivity of the NO3� (a) and K+ (b) microelectrodes. The microelectrodes were
immersed in CaSO4 0.2 mM solutions containing increasing concentrations of KNO3. The
potential values were then plotted vs the log [ion] in the solution. A linear regression was plotted
on the points to determine the selectivity of the microelectrodes
5 Measurement of Net Ion Fluxes Using Ion-Selective Microelectrodes 77

any time (i.e. by increasing the ion concentration). The flow has to be small enough
in order to replace the solution far away from the root without disturbing the
solution layer at the surface of the root. The solution at the surface of the root
does not flow, or does so at a negligible speed due to friction forces (like the
wind with an object). The undisturbed layer size has to be determined using the
microelectrodes and the net flux measurements have to occur in this undisturbed
layer of solution.
In order to determine the size of the undisturbed layer, the microelectrodes were
moved from 10 to 1,510 mmwith 100 mm steps. In the undisturbed layer of solution,
the ion concentrations form a linear gradient (Fig. 5.7). If the solution flow slowly
increased from the root surface (no layer), the points would form a curve. The limit
of the gradient can be calculated from the intersect between the final concentration
and the slope of the gradient (Fig. 5.7).
Then, we measured the average distance at which the gradient disappears (Table
5.1) along the taproot of a Corsican pine seedling. The shortest distance from the
root where the gradient disappeared was around 600 mm. Measurement along
the root of maritime pine gave the same order of values (data not shown).
The limit of the gradient determined, two points in this radius are needed in order
to determine the net flux. Of course, the distance between the two measurement
points is important for the calculation of the net flux [d1 and d2 in (5.9), Sect. 5.3.2].The greater the distance, the greater the chance that a difference of concentrations
can be detected. The larger the difference in concentration, the more accurate is the
final value of the net flux.
ln((d1+r) / (d2+r))
[H+] (
µM)
47.0
47.5
49.0
48.5
49.5
50.5
50.0
0.0 0.2 0.4 0.6 0.8 1.0 1.2
4.0
0.0
0.5
1.5
1.0NO3–
K+
H+
2.0
3.5
2.5
3.0
[NO
3– ] &
[K+] (
µM)
Fig. 5.7 Gradients of NO3�, K+ and H+ concentrations from the surface of the root (�0.01 mm) to
the bulk solution (�2 mm)
78 A. Gobert and C. Plassard

5.5.1.2 What is the Distance from the Root to Choose?
Our next task was to determine which distance from the root was right to determine
the net fluxes. Of course, the points of measurement are localized in the undisturbed
layer of solution (<600 mm; Table 5.1). The distances 300, 400 and 500 mm were
tested all along the first 10 mm of the taproot of a Corsican pine seedling.
As shown in Fig. 5.8, the first 2 millimetres of the root provide a huge variation
in the net flux measurement for all the microelectrodes. Thus, for NO3�, the values
for 300 mm are divergent from the values taken at 400 and 500 mm. For H+ and K+,
values are very similar to each other whatever the distance from the root. We can
observe a huge efflux of H+ at the tip of the pine root which reduces strongly after
1–2 mm from the apex. For K+, a strong efflux appears at 2 mm and reduces
gradually towards 6 mm from the apex.
5.5.2 Factors Affecting the Calculation of the Concentration
The calculation of the ion concentration is determined by (5.4) described in Sect.
5.2.2 of this chapter, and this can be transformed to
Ce ¼ Ci exp �nFDV=RTð Þ: ð5:10Þ
Therfore, the potential at the microelectrode is the main factor to be studied. Ce can
be C1 and C2 depending on the distance from the root surface. The microelectrodes
have a time response to changes in the solution. Also, this time response is fast,
making an average of the concentration over a short length of time when the
potential values are stable more acceptable as a basis for calculating the concentration
at a given distance.
Table 5.1 Size of the undisturbed layer and/or size of the gradient at the surface of the first 10 mm
of the taproot of a Corsican pine seedling
Size of the undisturbed layer (mm)
Distance from the root tip (mm) NO3� K+
0.2 784 � 163 822 � 203
1 813 � 149 1,068 � 181
2 645 � 121 716 � 129
3 853 � 213 837 � 170
4 762 � 183 729 � 278
5 1,086 � 201 744 � 174
7 758 � 183 602 � 116
10 1,284 � 107 1,179 � 302
Average 879 � 79 837 � 73
5 Measurement of Net Ion Fluxes Using Ion-Selective Microelectrodes 79
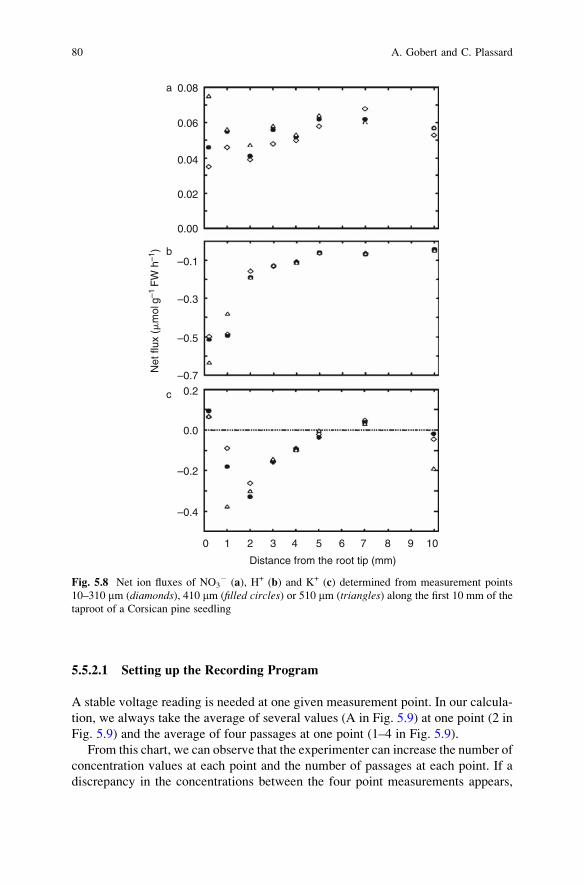
5.5.2.1 Setting up the Recording Program
A stable voltage reading is needed at one given measurement point. In our calcula-
tion, we always take the average of several values (A in Fig. 5.9) at one point (2 in
Fig. 5.9) and the average of four passages at one point (1–4 in Fig. 5.9).
From this chart, we can observe that the experimenter can increase the number of
concentration values at each point and the number of passages at each point. If a
discrepancy in the concentrations between the four point measurements appears,
Net
flux
(�
mol
g–1
FW
h–1
)
0.00
0.02
0.06
0.04
0.08
–0.7
–0.5
–0.1
–0.3
–0.4
–0.2
0.2
0.0
0 1 2 3 4 5 6 7 8 9 10
Distance from the root tip (mm)
a
b
c
Fig. 5.8 Net ion fluxes of NO3� (a), H+ (b) and K+ (c) determined from measurement points
10–310 mm (diamonds), 410 mm (filled circles) or 510 mm (triangles) along the first 10 mm of the
taproot of a Corsican pine seedling
80 A. Gobert and C. Plassard
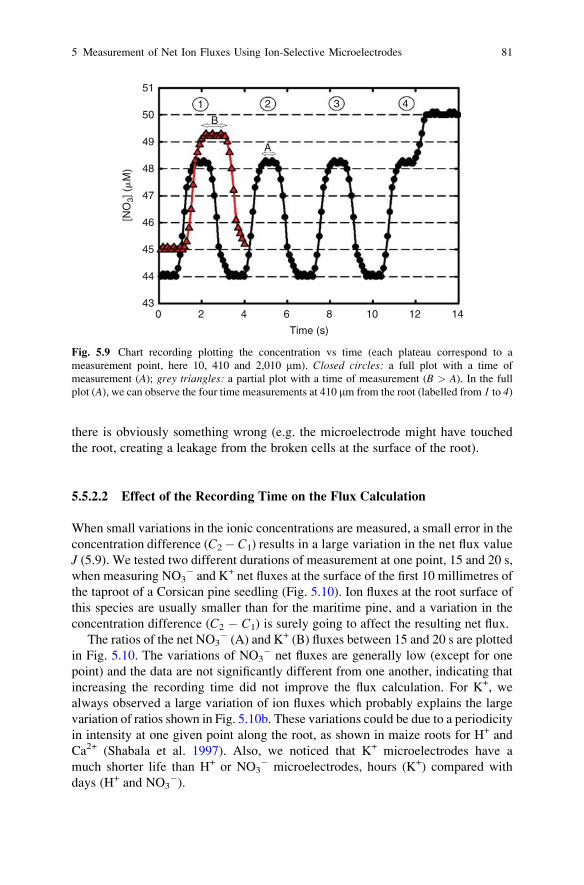
there is obviously something wrong (e.g. the microelectrode might have touched
the root, creating a leakage from the broken cells at the surface of the root).
5.5.2.2 Effect of the Recording Time on the Flux Calculation
When small variations in the ionic concentrations are measured, a small error in the
concentration difference (C2� C1) results in a large variation in the net flux value
J (5.9). We tested two different durations of measurement at one point, 15 and 20 s,
when measuring NO3� and K+ net fluxes at the surface of the first 10 millimetres of
the taproot of a Corsican pine seedling (Fig. 5.10). Ion fluxes at the root surface of
this species are usually smaller than for the maritime pine, and a variation in the
concentration difference (C2 � C1) is surely going to affect the resulting net flux.
The ratios of the net NO3� (A) and K+ (B) fluxes between 15 and 20 s are plotted
in Fig. 5.10. The variations of NO3� net fluxes are generally low (except for one
point) and the data are not significantly different from one another, indicating that
increasing the recording time did not improve the flux calculation. For K+, we
always observed a large variation of ion fluxes which probably explains the large
variation of ratios shown in Fig. 5.10b. These variations could be due to a periodicity
in intensity at one given point along the root, as shown in maize roots for H+ and
Ca2+ (Shabala et al. 1997). Also, we noticed that K+ microelectrodes have a
much shorter life than H+ or NO3� microelectrodes, hours (K+) compared with
days (H+ and NO3�).
2 3 4
A
B
1
51
50
49
48
47
46
45
44
430
[NO
3] (
�M
)
2
Time (s)
4 6 8 10 12 14
Fig. 5.9 Chart recording plotting the concentration vs time (each plateau correspond to a
measurement point, here 10, 410 and 2,010 mm). Closed circles: a full plot with a time of
measurement (A); grey triangles: a partial plot with a time of measurement (B > A). In the full
plot (A), we can observe the four time measurements at 410 mm from the root (labelled from 1 to 4)
5 Measurement of Net Ion Fluxes Using Ion-Selective Microelectrodes 81

Obviously, the longer the duration at one point, the more accurate should be
the average of the potential values at this point but this matter has to be tested at least
once for an experience condition given for the different type of microelectrode used.
5.5.3 Using a Complex Perfusing Solution
In our system, we always use a simple perfusing solution containing CaSO4 0.2
mM, and then we add the required concentration of KNO3 (in order to measure
the H+, NO3� and K+ net fluxes). Of course, we have tested the effect of the pH
on the responses of the NO3� and K+ microelectrodes (data not shown). Extreme
0.67
3.5
3.5
2.5
1.5
0.5
0.4
0.33
0.29
1
2
3
0.67
Distance from the root tip (mm)
Rat
io b
etw
een
net
K+
flu
xes
(15s
/ 20
s)R
atio
bet
wee
n n
et N
O3–
flu
xes
(15s
/ 20
s)
2.5
1.5
0.5
0.4
0.29
0.33
1
0 1 2 3 4 5 6 7 8 9 10
0 1 2 3 4 5 6 7 8 9 10
0 1 2 3 4 5 6 7 8 9 10
2
3
a
b
Fig. 5.10 Effect of the duration of the measurement (15 or 20 s) on the calculation of the NO3� (a)
and K+ (b) net fluxes. The values are expressed as the ratio between the values obtained with a 15-s
step and the values obtained with a 20-s step as a function of the distance from the root tip of
the Corsican pine seedling
82 A. Gobert and C. Plassard

pH affects the responses, but our solutions are always set around 5.8–6. If other salts
have to be added to the perfusing solution, the response of the microelectrodes to
these additional ions has to be tested and the microelectrode should be calibrated in
a solution containing these additional ions.
5.6 A Case Study: Measurement of NO3� Net Fluxes
into Ectomycorrhizal Short Roots
5.6.1 Validation of Flux Measurements into Coniferous Plants
When using ion-selective microelectrodes for measuring net fluxes occurring into
the roots, one of the main problems is to find some ways to evaluate the validity of
this methodology. We did this in young maritime pine seedlings exhibiting only one
main tap root (Plassard et al. 2002). These non-mycorrhizal young roots exhibited
highly differentiated root zones together with highly different nitrate and potassium
net fluxes measured using ion-selective microelectrodes. Potassium net uptake was
characterised by a maximum net influx in the subapical zone (the ‘‘pink’’ zone),
together with a high net efflux or no net flux occurring in the first millimetres of
apex and in the browning zone far away from the apex, respectively. Nitrate net
uptake was also maximal in the subapical root zone, but no net efflux was observed
in the apical part, and low values of net influx were measurable in the browning root
zone (Plassard et al. 2002). To validate these local measurements we measured
nitrate and potassium uptake by the whole seedlings incubated in the same condi-
tions using conventional methods (bulk medium depletion). The net uptake rates
calculated from the integration of net ion fluxes with microelectrodes were found to
be remarkably similar to those calculated from medium depletion (Fig. 5.11),
validating our measurement conditions.
Another validation of this methodology was obtained at the level of ectomycor-
rhizal short roots and 15N accumulation in Pinus pinaster plants associated with theectomycorrhizal fungus Rhizopogon roseolus. Net NO3
� fluxes measured at the
surface of R. roseolusmycorrhizal short roots were twice as high as those measured
at the surface of non-mycorrhizal short roots in plants incubated with a flowing
solution containing KNO3 50 mM (Gobert and Plassard 2007). This enhancement of
NO3� uptake into mycorrhizal roots was confirmed by incubating NM and M plants
for 6 h in a solution containing 15NO3� 50 mM. In these conditions, the 15N rates
measured were 1.2 � 0.2 and 0.7 � 0.15 mmol 15NO3� g�1 root dry. wt h�1,
respectively, in M and NM plants. Total amounts of 15N measured in mycorrhizal
plants were linearly correlated with the concentration of ergosterol, a sterol
extracted from living fungal cells (Fig. 5.12). The contribution of ectomycorrhizal
roots to the total uptake of 15NO3� into the intact plants was then calculated from
the value of the slope of the linear regression fitted to these data. This contribution
was estimated to be 2.5 mmol 15NO3� accumulated mg�1 of ergosterol h�1 whereas
5 Measurement of Net Ion Fluxes Using Ion-Selective Microelectrodes 83

the contribution of the remaining root system was calculated to be 0.6 mmol 15NO3�
per plant or 0.5 mmol 15NO3� g�1 root dry. wt h�1 (the y-intercept). The NO3
�
uptake rate into ectomycorrhizal roots (V, mmol NO3� g�1 f wt h�1) was thus
calculated using the equation:
V ¼ ðvEÞðFÞ;
Net
K+ u
ptak
e (n
mol
h–1
pla
nt1 )
Net
NO
3– upt
ake
(nm
ol h
–1 p
lant
1 )
0 50 100 150 200
Root length (mm)
0 50
a b
100 150 200
Root length (mm)
0
10
20
30
40
50
60
0
10
20
30
40
50
60
Fig. 5.11 Net uptake rates of NO3� (a) and K+ (b) determined in whole roots of young non-
mycorrhizal P. pinaster. Three-week-old plants presenting only one root, whose length varied
from c. 50 to c.160 mm, were incubated in a solution containing 0·2 mM CaSO4 and 20 mMKNO3
(pH 5·7). Uptake rates were measured either from ion depletion from the medium (open symbols)or using ion-selective microelectrodes (closed symbols). In the latter case, local flux data obtainedalong the root were integrated over the whole root length to obtain net uptake rates per plant
(redrawn from Plassard et al. 2002, with permission from Blakwell Publishing)
0.0
0.5
1.0
1.5
2.0
2.5
0.00 0.02 0.04 0.06 0.08 0.10 0.12
Ergosterol amount (mg plant–1)
15N
O3– a
mou
nt (
�m
ol p
lant
–1)
y = 15.10x + 0.60r2 = 0.70
Fig. 5.12 Relationship between root ergosterol and total 15N amounts measured in P. pinasterassociated with the ectomycorrhizal fungus R. roseolus. The plants were pre-incubated for 3 days
in 1 mM NO3� solution before incubation for 6 h into the labelling solution containing 50 mM
15KNO3. The linear regression fitted to the points was highly significant (P = 0.0012) (redrawn
from Gobert and Plassard 2007, with permission from Blackwell Publishing)
84 A. Gobert and C. Plassard

where v is the uptake rate per unit of ergosterol (mmol NO3� mg�1 ergosterol h�1),
E is the average concentration of ergosterol in the fungus in pure culture (0.34 mg
g�1 f wt, Plassard, unpublished data) and F is the percentage of fungal tissue in
ectomycorrhizal roots (62%, Plassard et al. 2002). Using the parameters in the
above equation, the estimated value of NO3� uptake rate into mycorrhizal short
roots was calculated to be 0.53 mmol NO3� g�1 f wt h�1, a value that was very
close to the one measured with an ion-selective microelectrode that was 0.6 mmol
NO3� g�1 f wt h�1 (Gobert and Plassard 2007).
5.6.2 Variation of NO3� Net Fluxes into Ectomycorrhizal Short
Roots: Effect of N Source Supplied to the Plants
Several studies have indicated that NO3� uptake by forest trees and their fungal
partners may be affected differently by variable conditions of NO3� availability
that can occur in natural conditions, e.g. temporary variations of soil nitrate or
ammonium concentrations and their ratios. We addressed this question by carrying
out a comparative study of NO3� uptake induction under various conditions, with or
without NH4+ supplied at 50 and 500 mM, two concentrations close to the actual
N level in forest soil. For this study, we used P. pinaster plants, whether associatedor not with the ectomycorrhizal basidiomycete R. roseolus. Three-month-old plants
were pre-incubated without nitrogen for 7 days (�N plants) and then 3 days with
50 mM NO3� (+NO3
�) with or without 50 or 500 mM NH4+ (+NH4
+ 50, + NH4+
500) before net NO3� flux measurements. We applied NO3
� concentrations ranging
from 0 to 500 mM as KNO3 in the flowing solution. Depending on the pre-incuba-
tion solution, we obtained different kinetics in non-mycorrhizal- and mycorrhizal
short roots (Gobert and Plassard 2007). As shown in Table 5.2, which gives a
summary of the values of apparent maximal net flux (Jmax) and affinity (km)calculated from these kinetics, nitrate net fluxes into non-mycorrhizal short roots
from N-starved plants were very low. In these conditions, the measurement of
NO3� net fluxes presented a limit, since it was not possible to measure low fluxes at
high external ion concentrations. Indeed, the voltage difference measured between
the solution and the root becomes very low in these conditions (Gobert and Plassard
2007). Given the precision of the reading on the amplifier (0.1 mV), we chose to
calculate flux values when the average voltage difference was higher than 0.5 mV.
This situation was encountered again when plants, whether mycorrhizal or not,
were incubated with high NH4+ concentration (500 mM). However, measurement of
NO3� net fluxes with NO3
� selective microelectrodes enabled us to show that a
complex kinetic process was occurring in non-mycorrhizal short roots fully induced
for NO3� uptake, resulting in different values of apparent Jmax and affinity km
(Table 5.2). In contrast, mycorrhizal short roots always displayed higher NO3� net
fluxes than non-mycorrhizal short roots, together with simple kinetics (Table 5.2).
Nevertheless, both types of short roots exhibited the same sensitivity to the NH4+
5 Measurement of Net Ion Fluxes Using Ion-Selective Microelectrodes 85
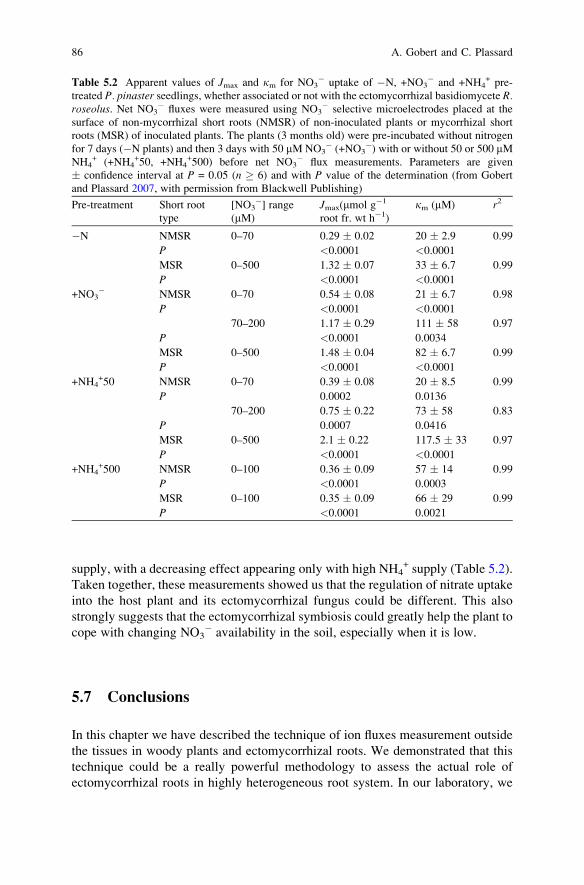
supply, with a decreasing effect appearing only with high NH4+ supply (Table 5.2).
Taken together, these measurements showed us that the regulation of nitrate uptake
into the host plant and its ectomycorrhizal fungus could be different. This also
strongly suggests that the ectomycorrhizal symbiosis could greatly help the plant to
cope with changing NO3� availability in the soil, especially when it is low.
5.7 Conclusions
In this chapter we have described the technique of ion fluxes measurement outside
the tissues in woody plants and ectomycorrhizal roots. We demonstrated that this
technique could be a really powerful methodology to assess the actual role of
ectomycorrhizal roots in highly heterogeneous root system. In our laboratory, we
Table 5.2 Apparent values of Jmax and km for NO3� uptake of �N, +NO3
� and +NH4+ pre-
treated P. pinaster seedlings, whether associated or not with the ectomycorrhizal basidiomycete R.roseolus. Net NO3
� fluxes were measured using NO3� selective microelectrodes placed at the
surface of non-mycorrhizal short roots (NMSR) of non-inoculated plants or mycorrhizal short
roots (MSR) of inoculated plants. The plants (3 months old) were pre-incubated without nitrogen
for 7 days (�N plants) and then 3 days with 50 mM NO3� (+NO3
�) with or without 50 or 500 mMNH4
+ (+NH4+50, +NH4
+500) before net NO3� flux measurements. Parameters are given
� confidence interval at P = 0.05 (n � 6) and with P value of the determination (from Gobert
and Plassard 2007, with permission from Blackwell Publishing)
Pre-treatment Short root
type
[NO3�] range
(mM)
Jmax(mmol g�1
root fr. wt h�1)
km (mM) r2
�N NMSR 0–70 0.29 � 0.02 20 � 2.9 0.99
P <0.0001 <0.0001
MSR 0–500 1.32 � 0.07 33 � 6.7 0.99
P <0.0001 <0.0001
+NO3� NMSR 0–70 0.54 � 0.08 21 � 6.7 0.98
P <0.0001 <0.0001
70–200 1.17 � 0.29 111 � 58 0.97
P <0.0001 0.0034
MSR 0–500 1.48 � 0.04 82 � 6.7 0.99
P <0.0001 <0.0001
+NH4+50 NMSR 0–70 0.39 � 0.08 20 � 8.5 0.99
P 0.0002 0.0136
70–200 0.75 � 0.22 73 � 58 0.83
P 0.0007 0.0416
MSR 0–500 2.1 � 0.22 117.5 � 33 0.97
P <0.0001 <0.0001
+NH4+500 NMSR 0–100 0.36 � 0.09 57 � 14 0.99
P <0.0001 0.0003
MSR 0–100 0.35 � 0.09 66 � 29 0.99
P <0.0001 0.0021
86 A. Gobert and C. Plassard

have made ion-selective microelectrodes only for three ions, but it is possible to
extend the range of these microelectrodes to many other ions. However, among the
numerous ionophores/cocktail solutions that are now available commercially, an
ionophore for orthophosphate activities is still missing, despite recent papers on this
topic (Wang and Bishop 2005; Zou et al. 2007). Indeed, the main problem of this
anion is that its net valence (F in Nernst’s equation) will depend on H+ concentra-
tion in the solution, thus restricting its use to extremely well-defined pH conditions.
Such pH stability will not be compatible with pH changes mediated by the root
activity that will occur at the root surface. To us, the main advantage of the
microelectrode technique is that net fluxes can be recorded for several hours,
allowing the variation of ionic conditions of the flowing solution and the measure-
ment of net fluxes at the same spot of the root. From an experimental point of view,
its main limitation is the impossibility of measuring low fluxes at high external ion
concentrations. However, it can be argued that in soil conditions, concentrations of
available mineral nutrients will probably be most of the time in the range that can be
used for measurements with ion-selective microelectrodes.
References
Ammann D (1986) Ion-selective microelectrodes. Principles, design and application. Springer,
Berlin Heidelberg, p 346
Gobert A, Plassard C (2002) Differential NO3�-dependent patterns of NO3
� uptake in Pinuspinaster, Rhizopogon roseolus and their ectomycorrhizal association. New Phytol 154:
509–516
Gobert A, Plassard C (2007) Kinetics of NO3� net fluxes in Pinus pinaster, Rhizopogon roseolus
and their ectomycorrhizal association, as affected by the presence of NO3� and NH4
+. Plant
Cell Environ 30:1309–1319
Henriksen GH, Bloom AJ, Spanswick RM (1990) Measurement of net fluxes of ammonium
and nitrate at the surface of barley roots using ion-selective microelectrodes. Plant Physiol
93:271–280
Henriksen GH, Raman DR, Walker LP, Spanswick RM (1992) Measurement of net fluxes of
ammonium and nitrate at the surface of barley roots using ion-selective microelectrodes: II.
Patterns of uptake along the root axis and evaluation of the Microelectrode Flux Estimation
Technique. Plant Physiol 99:734–747
Huang JW, Shaff JE, Grunes DL, Kochian LV (1992) Aluminum effects on calcium fluxes at the root
apex of aluminum-tolerant and aluminum-sensitive wheat cultivars. Plant Physiol 98:230–237
Kang TM, Markin VS, Hilgemann DW (2003) Ion fluxes in giant excised cardiac membrane
patches detected and quantified with ion-selective microelectrodes. J Gen Physiol 121:325–47
Kochian LV, Shaff JE, Lucas WJ (1989) High affinity K uptake in maize roots: a lack of coupling
with H+ efflux. Plant Physiol 91:1202–1211
McClure PR, Kochian LV, Spanswick RM, Shaff JE (1990) Evidence for cotransport of nitrate and
protons in Maize roots: II. Measurement of NO3� and H+ fluxes with ion-selective microelec-
trodes. Plant Physiol 93:290–294
Miller AJ, Cookson SJ, Smith SJ, Wells DM (2001) The use of microelectrodes to investigate
compartmentation and the transport ofmetabolized inorganic ions in plants. J ExpBot 52:541–549
Newman IA (2001) Ion transport in roots: measurement of fluxes using ion-selective microelec-
trodes to characterize transporter function. Plant Cell Environ 24:1–14
5 Measurement of Net Ion Fluxes Using Ion-Selective Microelectrodes 87

Newman IA, Kochian LV, Grusak MA, Lucas WJ (1987) Fluxes of H+ and K+ in corn roots:
characterization and stoichiometries using ion-selective microelectrodes. Plant Physiol 84:
1177–1184
Plassard C, Guerin-Laguette A, Very AA, Casarin V, Thibault JB (2002) Local measurements of
nitrate and potassium fluxes along roots of maritime pine. Effects of ectomycorrhizal symbio-
sis. Plant Cell Environ 25:75–84
Shabala S, Newman I, Morris J (1997) Oscillations in H+ and Ca2+ ion fluxes around the elongation
region of corn roots and effects of external pH. Plant Physiol 113:111–118
Shabala L, Ross T, Newman I, McMeekin T, Shabala S (2001) Measurements of net fluxes and
extracellular changes of H+, Ca2+, K+, and NH4+ in Escherichia coli using ion-selective
microelectrodes. J Microbiol Methods 46:119–29
Thain JF (1995) Electrophysiology. Methods Cell Biol 49:259–274
Wang JJ, Bishop PL (2005) Development of a phosphate ion-selective microelectrode and its use
in studies of the enhanced biological phosphorus removal (EBPR) process. Environ Technol
26:381–388
Zou Z, Han J, Jang A, Bishop P, Ahn C (2007) A disposable on-chip phosphate sensor with planar
cobalt microelectrodes on polymer substrate. Biosens Bioelectron 22:1902–1907
88 A. Gobert and C. Plassard

Chapter 6
Assessment of Phosphatase Activity
Associated with Mycorrhizal Fungi
by Epi-Fluorescent Microscopy
Ingrid M. van Aarle
6.1 Introduction
The use of the ELF-97 endogenous phosphatase detection kit, a fluorescence-based
method from Molecular Probes (Leiden, the Netherlands) for the assessment of
phosphatase activity associated with mycorrhizal fungi is detailed. The kit consists
of an ELF-97 phosphatase substrate [2-(5-chloro-2-phosphoryloxyphenyl)-
6-chloro-4-(3H)quinazolinone (CPPCQ)], an alkaline detection buffer and a mount-
ing medium, enabling the detection of alkaline phosphatase activity. However, use
of the substrate in combination with an acid buffer (such as citrate buffer or acetate
buffer) enables the detection of acid phosphatase activity.
The ELF-97 substrate is a fluorogenic substrate that has been used for location of
phosphatase activity in (for example) fixed, cultured cells from rat (Telford et al.
1999) and zebrafish (Cox and Singer 1999), marine phytoplankton (Gonzalez-Gil
et al. 1998), and mycorrhizal fungi (Van Aarle et al. 2001, 2005; Alvarez et al.
2004). The substrate is normally slightly fluorescent in the blue range. However,
once its phosphate is enzymatically removed the substrate forms a crystalline
precipitate, which is bright green fluorescent, indicating the site of activity
(Huang et al. 1993; Larison et al. 1995). Hence the process is called enzyme-
labelled fluorescence (ELF). The precipitate has a maximum emission at 530 nm,
and is separated by more than 100 nm from its maximum excitation at 345 nm
(Molecular Probes 2004). This specificity of the ELF substrate makes the signal
clearly distinguishable from the autofluorescence of biological material such
I.M. van Aarle (*)
Universite catholique de Louvain,Unite de Microbiologie, Croix du Sud 3/6, 1348, Louvain-la-
Neuve, Belgium
e‐mail: [email protected]
A. Varma and A.C. Kharkwal (eds.), Symbiotic Fungi, Soil Biology 18, 89
DOI: 10.1007/978‐3‐540‐95894‐9_6, # Springer‐Verlag Berlin Heidelberg 2009
as mycorrhizal hyphae. The ELF precipitate is yellow-green against the blue
background of the hyphae when visualised with a Hoechst/DAPI longpass filter set.
6.2 Phosphatase Activity
Phosphatase activity released or excreted in the growth substrate as well as the
extracellular activity of roots and hyphae can be quantified spectrophotometrically
with the p-nitrophenyl phosphate method. Location of phosphatase activity in
mycorrhizal fungal tissues has been studied with colorimetric methods such as
staining with Fast Blue RR salt in the presence of a-naphthyl phosphate (Tisserantet al. 1993; Saito 1995). The activity can be observed as a dark stain using
light microscopy. Alkaline phosphatase activity of extraradical mycelium of
mycorrhizal fungi, as well as the alkaline phosphatase activity associated with the
intraradical structures of arbuscular mycorrhizal (AM) fungi, can thus be visualised
(Boddington and Dodd 1998; Tisserant et al. 1993).
The Fast Blue method has been used by Saito (1995) and by Van Aarle et al.
(2002b) to visualise acid phosphatase activity associated with intraradical mycelium
that has been extracted from roots with the enzyme digestion method (see Chap. 11,
Solaiman for method). However, the high background of acid phosphatases in all
plant roots prevents an observation of the mycorrhizal acid phosphatase activity in
roots or root sections with this method. Due to the higher sensitivity of the ELF
substrate than that of non-fluorogenic substrates, the ELF substrate is suitable for
visualizing both alkaline and acid phosphatase activity associated with mycorrhizal
fungi, even in root sections (Van Aarle et al. 2005). Examples of possibilities of this
method are given in Sect. 6.4, whereas the advantages and limitations of the method
are discussed in Sect. 6.5.
6.3 Equipment and Laboratory Material
6.3.1 Equipment
l Epi-fluorescent microscope equipped with a Hoechst/DAPI longpass filter setl Micropipettes and tipsl Vortex mixer
6.3.2 Laboratory Material
l ELF-97 endogenous phosphatase detection kit (E6601 – Molecular Probes,
Leiden, The Netherlands)l Eppendorf tubesl Syringesl 0.22 mm syringe filters (millex-GV, Millipore)
90 I.M. van Aarle

l Slides and cover glassesl Fine forcepsl Nail varnish
6.3.3 Solutions
A couple of solutions are needed before starting an ELF-assay. Some can be
purchased, whereas others should be prepared in advance.
In order to visualise alkaline phosphatase an alkaline buffer is needed. Most
appropriate is to use the alkaline detection buffer from the ELF kit. However, if
another alkaline buffer is used (such as, e.g., Tris-HCl) one should pay attention
that the precipitate dissolves at a pH above 8.0–8.5. In order to visualise acid
phosphatase a buffer with a low pH should be used. It is possible to use a
commercial citrate buffer, such as the one from Sigma with pH 4.8 (90 mM).
Otherwise an acetate or citrate buffer can be used and in that case the pH can be set
at a specific value. These buffers are prepared as follows:
1. Acetate buffer, pH 5.5, 0.2M:
l 0.2M acetic acid solution by dissolution of 12.10 g acetic acid in dH2O, fill
up to 1 ll 0.2M sodium acetate solution by dissolution of 16.46 g sodium acetate in
dH2O, fill up to 1 ll Mix 0.2M acetic acid solution into 0.2M sodium acetate solution until pH 5.5
is reached
2. Citrate buffer, pH 4.0–6.0, 0.1M:
l 0.1M solution of citric acid by dissolution of 21.01 g citric acid in dH2O, fill
up to 1 ll 0.1M solution of sodium citrate by dissolution of 29.41 g sodium citrate
(C6H5O7Na3 �2H2O) in dH2O, fill up to 1 ll Mix x ml of citric acid solution with y mL of sodium citrate solution
according to Table 6.1l Confirm pH
After the samples have been incubated in the ELF substrate-buffer solution and
before mounting the samples on the slide, it is recommended to wash the samples in
Table 6.1 The proportion by which the two components (x = 0.1 M
citric acid solution, y = 0.1 M sodium citrate solution) of the citrate
buffer should be mixed to obtain a pH between 4.0 and 6.0
pH x (ml) y (ml)
4.0 33.0 17.0
4.4 28.0 22.0
4.8 23.0 27.0
5.2 18.0 32.0
5.6 13.7 36.3
6.0 9.5 41.5
6 Assessment of Phosphatase Activity Associated with Mycorrhizal Fungi 91

a wash buffer. This will reduce the unspecific precipitation of the substrate and it
will increase the time that samples can be stored. If the samples are not properly
washed this may result in large crystals distributed throughout the sample and
possibly also in the mounting medium. In the first protocol provided by Molecular
Probes (1994) a wash buffer based on Tris and NaCl was used. Later revised
protocols (see, e.g., Molecular Probes 2004) use a wash buffer based on PBS,
EDTA (25 mM) and levamisol (5 mM), pH 8.0. However, levamisol is not a
specific inhibitor of fungal phosphatases. It is possible to construct other wash
buffers containing a specific inhibitor for fungal alkaline phosphatases or fungal
and plant acid phosphatases. Here however, only the preparation of the original
wash buffer is detailed:
1. Tris wash buffer, pH 8.0 (30 mM Tris, 1.5M NaCl, 0.05% w/v Triton X-100):
l Add 3.635 g of Tris to 750 ml dH2Ol Add 87.7 g of NaCl to the Tris solutionl Dissolve, set pH at 8.0 with HCl and fill up to 1 ll Add 0.5 mg Triton X-100 to the bufferl Confirm pH
6.3.4 Protocol for Assessment of Phosphatase Activitywith ELF-97 Substrate
It is important to prepare all buffers, reagents and materials before starting, since
the reaction is relatively fast. The microscope should also be fitted with the proper
filter set before starting the reaction. According to Molecular Probes (2004) the
reaction occurs within 30–90 s; however, for fungal tissues the optimal incubation
time seems to be approximately 15–30 min (Van Aarle et al. 2001; Alvarez et al.
2006). With epi-fluorescent microscopy, often no precipitate associated with
mycorrhizal fungi is observed in the first 10 min of the reaction. Fixation and
especially permeabilisation of the samples could possibly influence the reaction
time. Permeabilisation does, however, increase the risk of leaking of cytoplasm and
phosphatase enzymes out of the fungal structures, which could pose a problem,
especially for non-septate AM fungal hyphae.
6.3.4.1 Collection and Processing of Material
1. Roots and Intraradical Mycelium (AM fungi):
l Collect roots or mycorrhizal root tips from the growth medium and remove all
remaining soil, medium and/or debris. Wash with dH2O and keep humid and
preferably cold until use.l Rapidly process roots (cut, section or digest) so that they can be transferred to
the ELF substrate-buffer solution, or fix the roots in ethanol:
92 I.M. van Aarle

l Cut root sections with a razor blade or with a microtome. Different protocols
exist that do not destruct the phosphatase enzymes (see, e.g., Van Aarle et al.
2005).l Cut roots in small pieces of ca. 0.5 cm and put under vacuum so that air
bubbles at the extension are removed and stain can better penetrate.l Digest roots partially or fully with an enzyme digestion solution to either
facilitate the substrate to penetrate and to improve contact with the intrar-
adical structures or to carefully collect intraradical mycelium (see chap. 11,
Solaiman, for method).
2. Extraradical mycelium:
l Carefully collect the extraradical mycelium with fine forceps from the growth
medium (mini-rhizotrons, liquid cultures, AM fungal root organ cultures with
liquid medium) or extract the mycelium according to standard protocols from
the growth substrate (pot cultures, field soil, mesh bags, AM fungal root organ
cultures with solid medium).l Wash the mycelium clean from all media or debris.l Keep humid and cold until use or fix in ethanol.
6.3.4.2 Detailed Protocol (based on Van Aarle et al. 2001, 2005 and
Olsson et al. 2002)
1. Dilute the ELF substrate in the appropriate buffer (see Sect. 6.3.3.):
l Normally a 20-fold dilution of the ELF substrate is suitable; however, depend-
ing on the samples or material used, dilutions between 1:10–1:100 should be
tested. Too high concentration might lead to over-labelling, whereas too low a
concentration might lead to abundant background crystals due to the prolonged
reaction time needed.
2. Vortex the solution for several seconds at high speed and pass it through a
0.22 mm syringe filter (millex-GV, Millipore) in order to dissolve and to remove
any crystals that might have been formed in the substrate during storage:
l Use syringe filters with a small diameter in order to limit the loss of the ELF
substrate-buffer solution.l Preferably prepare the ELF substrate-buffer solution fresh each day. However,
if a large amount remains at the end of the day it could be stored in the fridge
until the next day. Overnight storage has so far not shown to have a significant
effect on the reaction or the amount of background staining, at least not if the
solution is vortexed at high speed for at least 1 min and subsequently filtered
through a 0.22 mm syringe filter.
3. Divide the filtered ELF substrate-buffer solution over Eppendorf tubes, add a
sample to each tube and note the time of start of the reaction for each sample:
6 Assessment of Phosphatase Activity Associated with Mycorrhizal Fungi 93

l Usually 20–50 ml is used for mycelium, 40–100 ml for root sections and
100–500 ml for root pieces.
4. Let the reaction develop for 20 min:
l Optimal reaction times should be determined for each type of samples.
Ideally this is done by immersion of the sample in a couple of drops of ELF
substrate-buffer solution on a glass microscopy slide. The sample is moni-
tored continuously under the microscope for the occurrence of ELF crystals
(bright yellow-green fluorescence), and the time of appearance of first specific
ELF crystals as well as that of background staining in the medium is measured.
The fluorescent precipitate is very photostable and supports long periods of
visualisation.
5. Wash the sample with wash buffer in order to remove excess substrate.
This washing increases the preservation time of the slides:
l Normally three changes of wash buffer from 5 min each with gentle agitation
are sufficient, but sometimes more changes are needed in order to remove all
excess substrate.l The pH of the wash buffer must not be above 8.0 otherwise the crystals may
dissolve.l In order not to lose too many hyphae or not to damage the root sections during
this washing step the samples could be washed in mini-sieves. Such sieves
can be made from 2 ml Eppendorf tubes, by cutting off the bottom, heating
the cut edge in a flame and immediately put the heated edge on a piece of
nylon mesh. Once the edge is cooled the mesh is sealed to the tube, resulting
in a mini-sieve.
6. Carefully remove the wash buffer without drying the samples.
7. Mount the sample in the mounting medium provided with the kit. Put one or
two drops of mounting medium on the microscopy slide, put the sample in
the mounting medium. Hyphae and intraradical mycelium can be carefully
distributed with fine forceps. Cover the samples with a cover slip:
l Leave the mounted slides on a flat surface to dry. After several hours the
slides can be sealed with nail varnish.l The fluorescent signal of the ELF precipitate is stable for a long time;
however, it is advisable to store the samples in the dark. After several days
of storage the mounting medium might start to crack, especially if the
mounting medium was viscous/aged at the time the slides were made.l Store the mounting medium upside down. In this way the tube does not have
to be inversed when applying the mounting medium. Inversion of the tubes
readily leads to the formation of air bubbles, especially when the mounting
medium gets older and more viscous.l Do not use glycerol to mount the samples, since the ELF crystals will dissolve
within hours.
94 I.M. van Aarle

8. Visualise the ELF-stained samples through a standard Hoechst/DAPI longpass
filter set:
l The ELF precipitates appear as yellow-green fluorescent crystals. Mycorrhizal
fungi and roots without enzyme activity have a light blue fluorescence.
6.4 Various Applications of ELF-97 Substrate
in Mycorrhizal Research
The ELF-97 phosphatase substrate is a novel fluorogenic substrate that recently has
been applied in mycorrhizal research. Several publications have appeared in which
this substrate has been used to visualise and quantify acid and alkaline phosphatase
activity associated with arbuscular and ectomycorrhizal fungi (Van Aarle et al.
2001, 2002a, 2005; Olsson et al. 2002, 2005; Alvarez et al. 2004, 2005, 2006).
6.4.1 Phosphatase Activity Associated with EctomycorrhizalFungi
The ELF method has been used to quantify the acid and alkaline phosphatase activity
associated with extramatrical hyphae of Hebeloma cylindrosporum in association
with Pinus pinaster grown in different soil types (Fig. 6.1). Also the phosphatase
activity associated with pure culture of H. cylindrosporum grown in liquid medium
rich or poor in phosphorus was studied in this way. In all cases the acid phosphatase
activity associated with the mycorrhizal hyphae was much more pronounced than
the alkaline phosphatase activity (Van Aarle and Plassard, unpublished).
Alvarez et al. (2004, 2005, 2006) combined the ELF method with confocal laser
scanning microscopy to study surface-bound phosphatases of ectomycorrhizal fungi.
They were able to localise and quantify the phosphatase activity of the mycelium of
five ectomycorrhizal fungi (Alvarez et al. 2004). Furthermore, the same authors
demonstrated acid phosphatase activity associated with the mantle and the Hartig
net (Alvarez et al. 2005). They stated that the staining procedure can be performed
easily and reliably in living ectomycorrhizal material (Alvarez et al. 2004).
6.4.2 Phosphatase Activity Associated with ArbuscularMycorrhizal Fungi
Quantification of the phosphatase activity of AM fungal extraradical mycelium can
be determined with the ELF method. For Glomus intraradices the alkaline phos-
phatase activity is normally higher than the acid phosphatase activity (Olsson et al.
6 Assessment of Phosphatase Activity Associated with Mycorrhizal Fungi 95
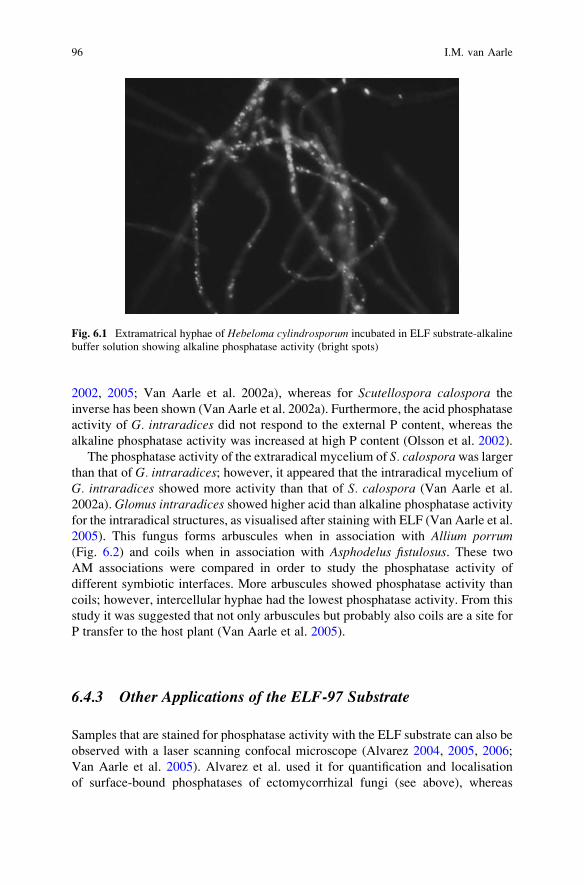
2002, 2005; Van Aarle et al. 2002a), whereas for Scutellospora calospora the
inverse has been shown (Van Aarle et al. 2002a). Furthermore, the acid phosphatase
activity of G. intraradices did not respond to the external P content, whereas the
alkaline phosphatase activity was increased at high P content (Olsson et al. 2002).
The phosphatase activity of the extraradical mycelium of S. calosporawas largerthan that of G. intraradices; however, it appeared that the intraradical mycelium of
G. intraradices showed more activity than that of S. calospora (Van Aarle et al.
2002a). Glomus intraradices showed higher acid than alkaline phosphatase activityfor the intraradical structures, as visualised after staining with ELF (Van Aarle et al.
2005). This fungus forms arbuscules when in association with Allium porrum(Fig. 6.2) and coils when in association with Asphodelus fistulosus. These two
AM associations were compared in order to study the phosphatase activity of
different symbiotic interfaces. More arbuscules showed phosphatase activity than
coils; however, intercellular hyphae had the lowest phosphatase activity. From this
study it was suggested that not only arbuscules but probably also coils are a site for
P transfer to the host plant (Van Aarle et al. 2005).
6.4.3 Other Applications of the ELF-97 Substrate
Samples that are stained for phosphatase activity with the ELF substrate can also be
observed with a laser scanning confocal microscope (Alvarez 2004, 2005, 2006;
Van Aarle et al. 2005). Alvarez et al. used it for quantification and localisation
of surface-bound phosphatases of ectomycorrhizal fungi (see above), whereas
Fig. 6.1 Extramatrical hyphae of Hebeloma cylindrosporum incubated in ELF substrate-alkaline
buffer solution showing alkaline phosphatase activity (bright spots)
96 I.M. van Aarle

Van Aarle et al. (2005) used it to visualise alkaline and acid phosphatase activity
associated with AM fungal structures such as arbusculated coils.
Another application of the ELF substrate in mycorrhizal research is the visua-
lisation of an alkaline phosphatase-conjugated antibody that had been used in in situRT-PCR studies on ectomycorrhizal mycelium (Van Aarle et al. 2007). In this way
the upregulation of a phosphate transporter gene of H. cylindrosporum under
P starvation could be visualised. This fluorescent in situ RT-PCR has great potential
and could possibly also be used to localise genes and their expression in darkly
coloured plant and fungal tissues.
6.5 Advantages and Limitation of ELF-97 Substrate
The above examples show that the ELF-97 substrate can be used to assess the
phosphatase activity associated with mycorrhizal fungal structures. The high sensi-
tivity of the ELF method for assessment of phosphatase activity is an advantage.
Furthermore, the protocol is fast to perform and allows detection of both alkaline
and acid phosphatase activity associated with the mycorrhizal fungus, even inside
root tissues. The fluorescence of the precipitate allows visualisation of phosphatase
activity even in darkly stained tissues such as those of pine roots. The yellow-
green fluorescence of the ELF precipitate also avoids interference with the auto-
fluorescence of soil particles and of plant and fungal material. Another additional
advantage of the ELF method is that it can be used for observations with confocal
laser scanning microscopy.
Fig. 6.2 AM root (A. porrum with G. intraradices) incubated in ELF substrate-alkaline buffer
solution showing alkaline phosphatase active arbuscules and hyphae
6 Assessment of Phosphatase Activity Associated with Mycorrhizal Fungi 97

A disadvantage of the ELF method is the relative high cost of the kit, which also
prevents the use of relatively large quantities. Sometimes the reaction is too
sensitive, resulting in a very intensive precipitation and a blur of fluorescence. In
that case, non-fluorescent and less sensitive methods, such as the Fast Blue method,
are more suitable. The kit has a relative short shelf-life, according to the producer
ca. 6 months, but if handled correctly it can be used up to 1 year. The shelf-life of
the kit seems mainly limited by the quality and ageing of the mounting medium.
6.6 Conclusions
The ELF-97 substrate is a suitable substrate for the location, visualisation and
quantification of acid and alkaline phosphatase activity associated with mycorrhizal
fungal structures. The ELFmethod is fast to perform and has a high sensitivity. So far
it has successfully been used to assess the acid and alkaline phosphatase activity
associated with different ectomycorrhizal and arbuscular mycorrhizal fungi.
Acknowledgements I am grateful to Dr. P.A. Olsson for valuable suggestions on this chapter.
References
Alvarez M, Godoy R, Heyser W, Hartel S (2004) Surface-bound phosphatase activity in living
hyphae of ectomycorrhizal fungi of Nothofagus oblique. Mycologia 96:479–487
Alvarez M, Godoy R, Heyser W, Hartel S (2005) Anatomical-physiological determination of
surface-bound phosphatase activity in ectomycorrhizae of Nothofagus oblique. Soil Biol
Biochem 37:125–132
Alvarez M, Gieseke A, Godoy R, Hartel S (2006) Surface-bound phosphatase activity in ectomy-
corrhizal fungi: a comparative study between a colorimetric and a microscope-based method.
Biol Fert Soils 42:561–568
Boddington CL, Dodd JC (1998) A comparison of the development and metabolic activity of
mycorrhizas formed by arbuscular mycorrhizal fungi from different genera on two tropical
forage legumes. Mycorrhiza 8:149–157
Cox WG, Singer VL (1999) A high-resolution, fluorescence-based method for localization of
endogenous alkaline phosphatase activity. J Histochem Cytochem 47:1443–1455
Gonzalez-Gil S, Keafer BA, Jovine RVM, Aguilera A, Lu S, Anderson DM (1998) Detection and
quantification of alkaline phosphatase in single cells of phosphorus-starved marine phyto-
plankton. Mar Ecol Prog Ser 164:21–35
Huang Z, YouW, Haugland RP, Paragas VB, Olson NA, Haugland RP (1993) A novel fluorogenic
substrate for detecting alkaline phosphatase activity in situ. J Histochem Cytochem 41:
313–317
Larison KD, BreMiller R, Wells KS, Clements I, Haugland RP (1995) Use of a new fluorogenic
phosphatase substrate in immunohistochemical applications. J Histochem Cytochem 43:77–83
Molecular Probes (1994) ELF97 Endogenous Phosphatase Detection Kit (E6601) Product
Information, 2 pp
Molecular Probes (2004) ELF97 Endogenous Phosphatase Detection Kit (E6601) Product
Information, 4 pp
98 I.M. van Aarle
Olsson PA, Van Aarle IM, Allaway WG, Ashford AE, Rouhier H (2002) Phosphorus
effects on metabolic processes in monoxenic arbuscular mycorrhiza cultures. Plant Physiol
130:1162–1171
OlssonPA,BurleighSH,VanAarle IM (2005)The influence of external nitrogen on carbon allocation
toGlomus intraradices in monoxenic arbuscular mycorrhiza. New Phytol 168:677–686
Saito M (1995) Enzyme activities of the internal hyphae and germinated spores of an arbuscular
mycorrhizal fungus, Gigaspora margarita Becker & Hall. New Phytol 129:425–431
Telford WG, Cox WG, Stiner D, Singer VL, Doty SB (1999) Detection of endogenous alkaline
phosphatase activity in intact cells by flow cytometry using the fluorogenic ELF-97 phospha-
tase substrate. Cytometry 37:314–319
Tisserant B, Gianinazzi-Pearson V, Gianinazzi S, Gollotte A (1993) In planta histochemical
staining of fungal alkaline phosphatase activity for analysis of efficient arbuscular mycorrhizal
infections. Mycol Res 97:245–250
Van Aarle IM, Olsson PA, Soderstrom B (2001) Microscopic detection of phosphatase activity of
saprophytic and arbuscular mycorrhizal fungi using a fluorogenic substrate. Mycologia 93:17–24
Van Aarle IM, Olsson PA, Soderstrom B (2002a) Arbuscular mycorrhizal fungi respond to
the substrate pH of their extraradical mycelium by altered growth and root colonization.
New Phytol 155:173–182
Van Aarle IM, Rouhier H, Saito M (2002b) Phosphatase activities of arbuscular mycorrhizal
intraradical and extraradical mycelium, and their relation to phosphorus availability. Mycol
Res 106:1224–1229
Van Aarle IM, Cavagnaro TR, Smith SE, Smith FA, Dickson S (2005) Metabolic activity of
Glomus intraradices in Arum- and Paris-type arbuscular mycorrhizal colonisation. New Phytol
166:611–618
Van Aarle IM, Viennois G, Amenc LK, Tatry MV, Luu DT, Plassard C (2007) Fluorescent in situRT-PCR to visualise the expression of a phosphate transporter gene from an ectomycorrhizal
fungus. Mycorrhiza 17:487–494
6 Assessment of Phosphatase Activity Associated with Mycorrhizal Fungi 99

Chapter 7
In Vitro Compartmented Systems
to Study Transport in Arbuscular
Mycorrhizal Symbiosis
H. Dupre de Boulois, L. Voets, and S. Declerck
7.1 Introduction
At the end of the 1960s up to the beginning of the 1970s, numerous studies
investigated the mechanisms behind the higher biomass and phosphorus (P) content
of arbuscular mycorrhizal (AM) plants (e.g. Daft and Nicolson 1966; Sanders and
Tinker 1971, 1973; Hayman and Mosse 1972). However, the essential role of AM
fungi in the uptake of P and its subsequent translocation and transfer to their host
plants awaited the studies of Hattingh et al. (1973), Pearson and Tinker (1975),
Rhodes and Gerdemann (1975) and Cooper and Tinker (1978, 1981) to be convincingly
demonstrated. This major finding was obtained using ingenious bi-compartmented pot
culture systems and isotopic tracers. In these systems, roots and mycorrhizal fungi
were allowed to develop in one compartment (i.e. the root compartment, RC) while
the other compartment (i.e. the hyphal compartment, HC) was restricted to the
exclusive development of the extraradical mycelium (ERM) of the AM fungi. Over
the years, numerous other compartmented pot systems based on the same concept
were developed to study AM fungal transport (see for instance Ames et al. 1983;
Frey and Schuepp 1992; Mader et al. 1993; Schweiger and Jakobsen 2000; Jansa
et al. 2003; Smith et al. 2003; Tanaka and Yano 2005).
Although these compartmented pot systems have led to striking results on element
transport by mycorrhizal fungi (see for references Marschner 1995; Schweiger and
Jakobsen 2000), they presented some important drawbacks: (1) the presence of
undesirable micro-organisms which could influence element bio-availability or
H. Dupre de Boulois (*), L. Voets, and S. Declerck
Universite catholique de Louvain, Unite de Microbiologie, Croix du Sud 3, 1348 Louvain-
la-Neuve, Belgium
email: [email protected]
A. Varma and A.C. Kharkwal (eds.), Symbiotic Fungi, Soil Biology 18, 101
DOI: 10.1007/978‐3‐540‐95894‐9_7, # Springer‐Verlag Berlin Heidelberg 2009

transport processes, (2) the difficulty of visualizing the development of the two
partners of the symbiosis and of recovering roots and extraradical fungal mycelium,
(3) the possible interaction between the element and the soil matrix, (4) the
potential direct uptake by the roots of the element under study due to tracer leakage
towards the root compartment caused by diffusion or mass-flow, and (5) the
complexity of performing physiological and molecular studies on extraradical
fungal mycelium and mycorrhizal roots (Schweiger and Jakobsen 2000; Rufyikiri
et al. 2005). For these reasons, compartmented in vitro (monoxenic) culture systems
became widely used (Rufyikiri et al. 2005).
The aim of this chapter is to provide methodologies to perform transport studies
using bi-compartmented in vitro culture systems, with root-organs or whole plants
as host, and to give a detailed description of the advantages and disadvantages of
these systems.
7.2 Equipment and Laboratory Material
7.2.1 Equipment
l Horizontal or vertical laminar flow hoodl Stereo-microscope (magnification �10–�40)l Bunsen burner or bead sterilizerl Cooled heated incubatorl Climatic chamberl Rotating agitatorl Thermo-fusible glue applicator
7.2.2 Laboratory Material
l Bi-compartmented Petri plates (usual diameter: 90 mm)l Polypropylene centrifugation tubes (50 ml)l Scalpels and forcepsl Set of cork-borersl Needlesl Manual or motorized pipettors adapted to 5–20 ml sterile pipettesl 1–1,000 ml micropipettes with corresponding sterile tipsl Cellophane wrap (roll of 2 cm-large) and Parafilm (note that Seal View, Petri
SealTM or other products can also be used)l Thermo-fusible gluel Silicon greasel Black plastic bags (12 � 12 cm)l Inclined (0–45�) support for Petri plates
102 H. Dupre de Boulois et al.

Remark: All manipulations of plant, AM fungi, medium and isotopic tracers
should be conducted under sterile conditions (i.e. under a laminar flow hood) and
with sterile or sterilized laboratory material. Equipment and laboratory material that
have no direct contact with the AM cultures do not require to be placed in a sterile
environment or to be sterile or sterilized.
7.3 Culture Media
7.3.1 Composition
In Table 7.1, the compositions of the modified Strullu-Romand (MSR – Declerck
et al. 1998, modified from Strullu and Romand 1986) medium and the minimum
(M) medium (Becard and Fortin 1988) are given. These media are the most widely
used (see Table 7.1 in Cranenbrouck et al. 2005) for the in vitro culture of
AM fungi.
Table 7.1 Mineral and vitamin composition of the modified Strullu-Romand (MSR) medium and
minimal (M) medium
MSR medium M medium
N(NO3�) (mM) 3,800 3,200
N(NH4+) (mM) 180 –
P (mM) 30 30
K (mM) 1,650 1,735
Ca (mM) 1,520 1,200
Mg (mM) 3,000 3,000
S (mM) 3,013 3,000
Cl (mM) 870 870
Na (mM) 20 20
Fe (mM) 20 20
Mn (mM) 11 30
Zn (mM) 1 9
B (mM) 30 24
I (mM) – 4.5
Mo (mM) 0.22 0.01
Cu (mM) 0.96 0.96
Ca Panthotenate (mM) 1.88 –
Biotin (mM) 0.004 –
Pyridoxine (mM) 4.38 0.49
Thiamine (mM) 2.96 0.3
Cyanocobalamine (mM) 0.29 –
Nicotinic acid (mM) 8.10 4
Glycine (mg/l) – 3
Myo-inositol (mg/l) – 50
7 In Vitro Compartmented Systems to Study Transport 103
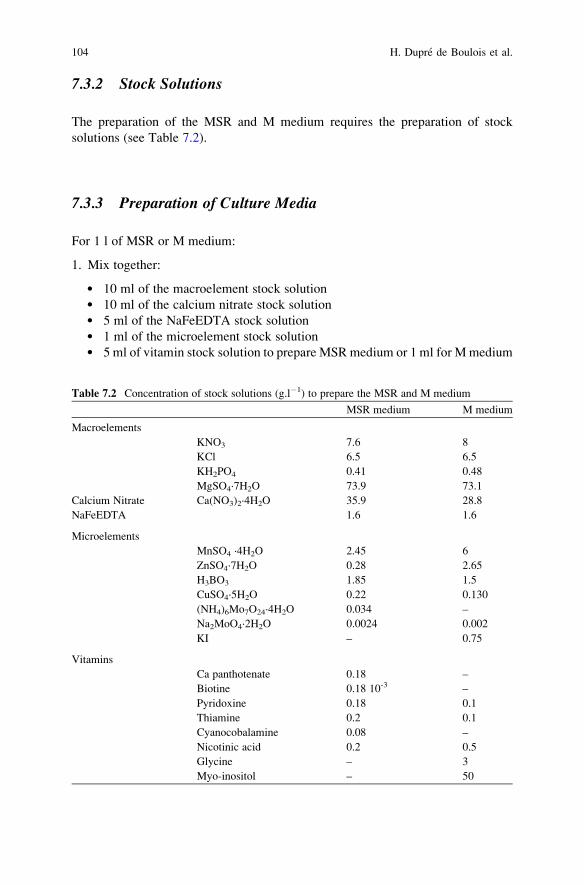
7.3.2 Stock Solutions
The preparation of the MSR and M medium requires the preparation of stock
solutions (see Table 7.2).
7.3.3 Preparation of Culture Media
For 1 l of MSR or M medium:
1. Mix together:
l 10 ml of the macroelement stock solutionl 10 ml of the calcium nitrate stock solutionl 5 ml of the NaFeEDTA stock solutionl 1 ml of the microelement stock solutionl 5 ml of vitamin stock solution to prepare MSR medium or 1 ml for Mmedium
Table 7.2 Concentration of stock solutions (g.l�1) to prepare the MSR and M medium
MSR medium M medium
Macroelements
KNO3 7.6 8
KCl 6.5 6.5
KH2PO4 0.41 0.48
MgSO4·7H2O 73.9 73.1
Calcium Nitrate Ca(NO3)2·4H2O 35.9 28.8
NaFeEDTA 1.6 1.6
Microelements
MnSO4 ·4H2O 2.45 6
ZnSO4·7H2O 0.28 2.65
H3BO3 1.85 1.5
CuSO4·5H2O 0.22 0.130
(NH4)6Mo7O24·4H2O 0.034 –
Na2MoO4·2H2O 0.0024 0.002
KI – 0.75
Vitamins
Ca panthotenate 0.18 –
Biotine 0.18 10-3 –
Pyridoxine 0.18 0.1
Thiamine 0.2 0.1
Cyanocobalamine 0.08 –
Nicotinic acid 0.2 0.5
Glycine – 3
Myo-inositol – 50
104 H. Dupre de Boulois et al.

2. Add 10 g of sucrose
3. After dissolution of sucrose, adjust the volume to 1 l
4. Adjust the pH to 5.5 with NaOH or KOH and HCl
5. Add 3 g.l�1 GelgroTM (ICN Biochemicals, Cleveland, OH), 3 g.l�1 Phytagel or
8 g.l�1 agar.
6. Autoclave for 15 min at 121�C under 1bar pressure
7. After autoclaving, the medium can be directly used but can also be stored for a
few hours at 40–60�C
Remark: Gelling agents may contain diverse macro-, micro- and trace-elements.
It can therefore be critical to determine their presence and concentration.
E.g. Gel-groTM and Phytagel contain large quantities of K and P. Declerck et al.
(2003) showed for instance that MSR medium solidified by 3 g.l�1 GelgroTM
actually had a concentration of 4.38 mM K and not 1.65 mM (see Table 7.1).
The difference (i.e. 2.73 mM K) was coming from the gelling agent.
7.4 Transport Studies with Root-Organ Cultures (ROC)
While Hattingh et al. (1973) demonstrated for the first time that AM fungi can
transport P, Mosse and Hepper (1975) reported the first in vitro co-culture between
a root-organ and an AM fungus. However, in the mid 1970s, this finding did not
receive much consideration. Indeed, AMmonoxenic cultures awaited the end of the
1980s and the beginning of the 1990s to be used and developed (Bago and Cano
2005) when (1) the experimental conditions for AM monoxenic cultivation were
reformulated by the use of transformed root-organs to allow the cultures to be easily
maintained (Becard and Fortin 1988), and (2) bi-compartmented Petri plates were
used to allow the separation of the ERM from the mycorrhizal roots (St-Arnaud
et al. 1995, 1996). These improvements participated significantly in the success of
this cultivation system (Bago and Cano 2005) and in particular for transport studies
(Rufyikiri et al. 2005).
At present, most of the monoxenic cultures of AM fungi are maintained on Ri
T-DNA transformed root-organs as host and, in particular, on Ri T-DNA trans-
formed carrot (Daucus carota L.) roots (see Table 7.1 in Cranenbrouck et al. 2005).These transformed roots offer the advantage of presenting a greater growth poten-
tial than non-transformed roots in culture media with limited supply of nutrients
(Fortin et al. 2002). In addition, AM fungi in association with Ri T-DNA trans-
formed roots show greater AM intraradical colonization and sustain higher ERM
development than non-transformed root-organs.
Theoretically any AM fungal strain should be cultivable under in vitroconditions on root-organs. However, for a large set of AM fungal species, this is
still complicated, explaining why a limited number of strains (e.g. G. intraradices,DAOM 197198, MUCL 41833; G. proliferum, MUCL 41827, Glomus sp., MUCL
43195) have been used for in vitro transport studies.
7 In Vitro Compartmented Systems to Study Transport 105

Preparation of ROC to perform transport studies comprises three major steps:
l Preparation of the Petri plates, i.e. adding medium in the RC and HCl Selection of the rootl Inoculation of the root with AM fungal propagules.
7.4.1 Adding Medium to the Petri Plates
In Figs. 7.1 and 7.2, different methods of adding medium in bi-compartmented Petri
plates are presented. In the RC, solid medium is added, while in the HC, either solid
or liquid medium can be used. For each of the different methods, it is recommended
to add medium in the RC at least to the level of the top of the partition wall in order
to facilitate the ERM spreading from the RC into the HC (Figs. 7.1a–c and 7.2a–d).
Identically, the level of medium in the HC should also be high enough to help
the ERM cross the partition wall. However, if liquid medium is added in the HC
(Fig. 7.1a–c), manipulations may lead to spilling of medium to the RC, so the level
of medium in the HC should be cautiously chosen (typically between 5 and 20 ml
for a 90 mm diameter Petri plate). If solid medium is used in the HC (Fig. 7.2a–d),
the level can be as high as in the RC (see Fig. 7.2a, b).
Logically, the type of medium (i.e. MSR or M) used in the RC should be
identical to the one in the HC. However, it is advised not to add sucrose in the
HC. Indeed, if no strict comparison has been made yet on the ERM growing with or
without sucrose in the HC, it was suggested that the lack of sucrose could increase
ERM and spore production (St-Arnaud et al. 1996). The absence of gelling agent in
the medium of the HC can be justified as it enables an easy manipulation of the
environment surrounding the ERM (e.g. modification of element composition, pH),
and an easy access and harvest (Bago and Cano 2005). However, if using liquid
medium in the HC is extremely useful for transport studies, it should be noted that
RC with solidmedium
HC with liquidmedium
ba
c
Fig. 7.1 Bi-compartmented Petri plates with solid medium in the RC and liquid medium in the HC.
Themedium in theRC (a) reaches the top of the partition wall, (b) extends above the partition wall
(i.e. convex meniscus) thanks to surface tensions, (c) is added in the entire Petri plate and extends
1–3 mm above the partition wall; after solidification, the medium in the HC is removed using a
scalpel and spatula (Dupre de Boulois et al. 2005). In the HC, liquid medium is added, and its level
can be adapted to facilitate hyphal crossing or to restrict the possibility of spilling in the RC
106 H. Dupre de Boulois et al.
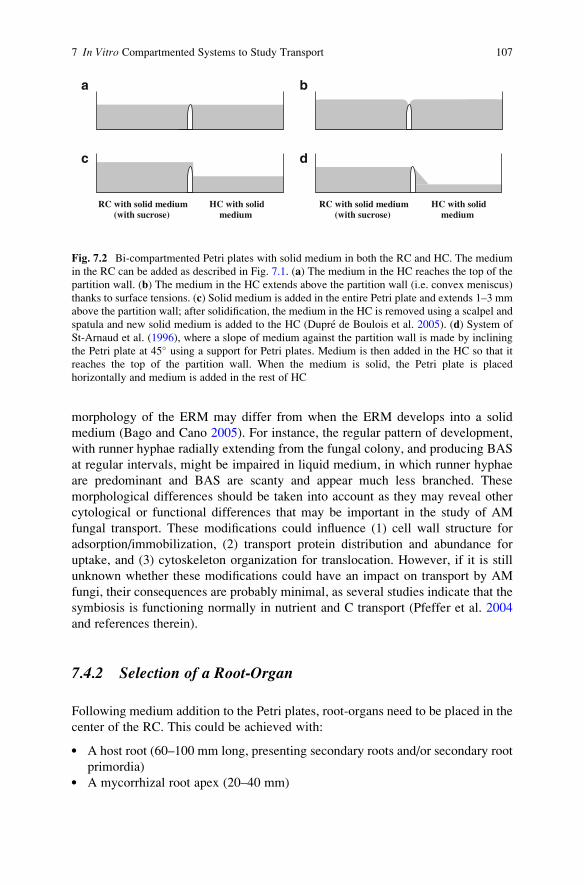
morphology of the ERM may differ from when the ERM develops into a solid
medium (Bago and Cano 2005). For instance, the regular pattern of development,
with runner hyphae radially extending from the fungal colony, and producing BAS
at regular intervals, might be impaired in liquid medium, in which runner hyphae
are predominant and BAS are scanty and appear much less branched. These
morphological differences should be taken into account as they may reveal other
cytological or functional differences that may be important in the study of AM
fungal transport. These modifications could influence (1) cell wall structure for
adsorption/immobilization, (2) transport protein distribution and abundance for
uptake, and (3) cytoskeleton organization for translocation. However, if it is still
unknown whether these modifications could have an impact on transport by AM
fungi, their consequences are probably minimal, as several studies indicate that the
symbiosis is functioning normally in nutrient and C transport (Pfeffer et al. 2004
and references therein).
7.4.2 Selection of a Root-Organ
Following medium addition to the Petri plates, root-organs need to be placed in the
center of the RC. This could be achieved with:
l A host root (60–100 mm long, presenting secondary roots and/or secondary root
primordia)l A mycorrhizal root apex (20–40 mm)
a b
dc
RC with solid medium(with sucrose)
HC with solidmedium
RC with solid medium(with sucrose)
HC with solidmedium
Fig. 7.2 Bi-compartmented Petri plates with solid medium in both the RC and HC. The medium
in the RC can be added as described in Fig. 7.1. (a) The medium in the HC reaches the top of the
partition wall. (b) The medium in the HC extends above the partition wall (i.e. convex meniscus)
thanks to surface tensions. (c) Solid medium is added in the entire Petri plate and extends 1–3 mm
above the partition wall; after solidification, the medium in the HC is removed using a scalpel and
spatula and new solid medium is added to the HC (Dupre de Boulois et al. 2005). (d) System of
St-Arnaud et al. (1996), where a slope of medium against the partition wall is made by inclining
the Petri plate at 45� using a support for Petri plates. Medium is then added in the HC so that it
reaches the top of the partition wall. When the medium is solid, the Petri plate is placed
horizontally and medium is added in the rest of HC
7 In Vitro Compartmented Systems to Study Transport 107
7.4.2.1 Remarks
Root-Organ Selection
Root choice is essential for the successful establishment of the AM fungal symbio-
sis (Fortin et al. 2002). Ideally, a Ri T-DNA transformed carrot root should be
2 weeks old and present a vigorous taproot and a pyramidal pattern of lateral root
development. Avoid selection of:
l Yellow or yellowing rootsl Roots exceeding 1 mm in diameterl Roots presenting swellings (especially at the level of themeristem) or deformationsl Roots presenting grey-translucent tipsl Roots presenting lateral roots close to the primary root tip (<2 cm)l Roots growing on the surface of the mediuml Punctured or broken roots
Mycorrhizal Root-Organ Selection
If mycorrhizal root apexes are chosen it is important to verify that ERM is extend-
ing from them under stereo-microscope. This will provide an indication that
AM symbiosis is established within these roots. Further inoculation with fungal
propagules is not necessary.
Notice that a section of medium (corresponding approximately of 5–10 ml)
containing root apexes and ERM can also be inserted in the RC (Cranenbrouck
et al. 2005). However, we would not recommend this methodology as the concen-
tration of the elements present in the RC will be strongly modified.
7.4.3 Inoculation of the Root with AM Fungal Propagules
Fungal propagules should be inoculated onto the lateral roots and their primordia as
well as in their direct vicinity, at a distance generally not exceeding 5 mm.
At present, only Glomus species producing an extensive ERM bearing several
thousand spores under ROC conditions have been used to perform transport studies
(e.g. G. intraradices, DAOM 197198, MUCL 41833; G. proliferum,MUCL 41827,
Glomus sp., MUCL 43195).
The isolation and inoculation of AM fungal spores from Glomus species
producing several thousand spores are achieved as follows:
1. Extract a section of medium containing the number of spores desired from a
well-established culture (3–6-month-old culture) and transfer it to an empty Petri
plate.
108 H. Dupre de Boulois et al.

2. Add more or less twice the volume of filter sterilized citrate buffer (pH 6, 10
mM: 1.8 mM citric acid + 8.2 mM sodium citrate).
3. Agitate the Petri plate slowly on a rotating agitator (50 rotation min�1) at
25–27�C until dissolution of the medium.
4. Transfer the spores to a new Petri plate containing sterile water using a 1,000 mLmicropipette.
5. Separate the spores attached to the extraradical hyphae with needles in order to
have clusters containing approximately 5–10 spores.
6. Inoculate approximately 100 spores on the host root apexes or branched roots
using a 200 ml micropipette (try to minimize the volume of water necessary to
take up the spores).
7. Leave the Petri plate open to evaporate excess water ( � 5 min).
8. Seal the Petri plate.
After inoculation, the Petri plates are incubated in a cooled heated incubator at
25–27�C in the dark. If the root-organs used have a negative geotropism, e.g. Ri
T-DNA transformed carrot roots of the clone DC1, Petri plates should be placed in
an inverted position. It is advised to check each Petri plate every week during the
first month to verify that no roots are growing into the HC. When roots are crossing
the partition wall, they should be trimmed and removed from the HC. This can be
easily achieved with forceps and scalpel under laminar flow.
When the extraradical hyphae start to cross the partition wall (typically 2–4
weeks after initiation of the cultures), the Petri plate can be reverted and MSR or
M medium (liquid or solid) lacking sucrose filled into the HC (see Sect. 7.4.1).
Isotopic labelling can then be performed (see Sect. 7.6).
Notice that a section of medium (corresponding approximately of 100–250 ml)containing ERM harbouring approximately 100 spores can also be inserted in the
RC as inoculum in the vicinity of the root-organs. This methodology is also very
efficient to inoculate AM fungi, but the volume of medium has to be minimal to
have the least effect on the concentration of the elements present in the RC.
7.5 Transport Studies with Autotrophic Plants
The bi-compartmented ROC systems have been successfully used for numerous
transport studies over the past 15 years, as previously mentioned, but they suffered
from several major drawbacks. These can be summarized as follows: (1) the
absence of photosynthetic tissues which prevent the determination of element
transfer from AM fungi to root cells (except if using autoradiography or NMR
(see Nielsen et al. 2002 and Pfeffer et al. 2004)) and photosynthate transport to the
AM fungi, (2) the incomplete source-sink relationships between AM fungi and host,
and root and shoot which could influence bi-directional transfers at the AM fungal-
host interface and (3) the presence of sucrose in the culture medium and the lack of
a normal hormonal balance which could alter plant-fungal symbiotic interactions
including bi-directional exchanges (Fortin et al. 2002).
7 In Vitro Compartmented Systems to Study Transport 109
In an attempt to obtain both an autotrophic plant and AM fungi under in vitroconditions, numerous systems have been developed with more or less success over
the last 20 years but have never been used thereafter (see reference in Voets et al.
2005). Indeed, these systems were too difficult to reproduce or utilize and the data
generated on the growth and development of the symbiotic partners were limited,
questioning the actual establishment of the symbiosis (see Voets et al. 2005). It
should nonetheless be noticed that the tripartite system developed by Elmeskaoui
et al. (1995) has allowed successful mycorrhization of strawberry and potato
plantlets (see Louche-Tessandier et al. 1999; Hernandez-Sebastia et al. 1999,
2000). However, in this system (1) the plants were grown in mixotrophic condi-
tions, and (2) mycorrhizal excised or transformed roots were present in the system.
Recently, Voets et al. (2005) and Dupre de Boulois et al. (2006) proposed two new
in vitro culture systems in which an AM fungus and a plant could grow in
association on gelled MSR medium lacking both sucrose and vitamins. These invitro culture systems have now been successfully used withG. intraradices (MUCL
43194 and 43204), G. clarum (MUCL 46238), G. claroideum (MUCL 46102), and
Glomus sp. (MUCL 41833, 43195) grown in association with at least one of the
following host plants:Medicago truncatula and Solanum tuberosum (five cultivars),
Solanum phureja, Plantago lanceolata, Nicotiana plumbaginifolia, Centauriumerythraea, Gentiana verna and Musa spp. It is also worth noticing that specific
adaptations of the systems of Voets et al. (2005) and Dupre de Boulois et al. (2006)
to some host plants can be necessary (e.g. due to plant size as in the case ofMusa spp.).In the section below, we will present the procedures to obtain AM fungus-plant
associations in the systems of Voets et al. (2005) and Dupre de Boulois et al. (2006)
with seeds of Medicago truncatula as plant starting material. Note however that
micro-cuttings from in vitro micro-propagated plantlets (see Voets et al. 2005) can
also be used and offer the advantage that all plantlets have the same genetic profile.
7.5.1 Surface-Sterilization/Scarification
Various methods have been developed to sterilize/scarify seeds. They can involve,
for instance, concentrated sulphuric acid, sodium/calcium hypochlorite, or mercu-
ric chloride. The procedure described here can greatly vary between plant seeds due
to the thickness of the seed coat or sensibility of the seeds.
Here we will present the sterilization/scarification of M. truncatula seeds using
sodium hypochlorite as described by Dupre de Boulois et al. (2006).
1. Place seeds into a disposable sterile 50 ml Falcon tube.
2. Add 25 ml of concentrated sodium hypochlorite (8% active chlorine).
3. Shake the falcon tube for 10 minutes. The seeds will slightly swell and the outer
hard seed coat will break.
4. Remove the sodium hypochlorite.
5. Add 25 ml of sterile distilled water to the seeds and mix gently for 10 minutes.
110 H. Dupre de Boulois et al.

6. Remove the water and repeat the rinsing step twice.
7. Place the surface-sterilized seeds in Petri plates (10–15 seeds/Petri plate) con-
taining 40 ml solidified (3 g.l�1 GelGro ) MSR or M medium lacking both
sucrose and vitamins.
8. Place the Petri plates in a cool-heated incubator (20�C) in the dark.
9. The seeds are expected to germinate within 3–5 days.
Note that surfactant such as Tween-20 or 80 can be added to sodium hypochlo-
rite to reduce surface tension and allow better surface contact.
Stratification (cold treatment) can be performed to homogenize germination and
growth, but this procedure is not compulsory and not necessary with M. truncatulaas all seeds germinate within a short period of time.
1. After sterilization/scarification, place the Petri plate at 4�C instead of 20�C in
the dark.
2. After 14 days, place the Petri plates at 20�C in the dark.
3. The seeds will germinate within 2–3 days.
7.5.2 Medium
Neither sucrose nor vitamins need to be included in the culture medium as
the plants are photosynthetically active. The host plants therefore grow in total
autotrophy.
In the works of Voets et al. (2005) and Dupre de Boulois et al. (2006), MSR
medium or an MSR-based medium (MSR medium with low K content to study Cs
transport) have been used, but K. Fernandez (pers. comm.) has successfully used
other media based either on the MSR or MS medium to associate S. tuberosum with
G. clarum in the system developed by Voets et al. (2005).
In the systems developed by Voets et al. (2005) and Dupre de Boulois et al. (2006),
medium needs to be added in the RC during the course of the experiment to support
plant and AM fungal growth, but also to restrict medium depletion due to plant
transpiration. Therefore, the RC of the systems cannot be filled as described for bi-
compartmented ROC systems (see Sect. 7.4.1.). In the following paragraphs (Sects.
7.5.3. and 7.5.4.), detailed explanation will be given for the two types of system.
7.5.3 The Half-Closed Arbuscular Mycorrhizal–Plant(HAM–P) In Vitro Culture System (Voets et al. 2005)
Originally, the half-closed AM–P (HAM–P) in vitro culture system (Fig. 7.3)
consisted of one compartment, i.e. a 90 mm diameter Petri plate, in which the
roots of an autotrophic plant and an AM fungus were associated (Voets et al. 2005),
7 In Vitro Compartmented Systems to Study Transport 111

while the shoot developed outside this compartment under open-air conditions.
Using this system, Voets et al. (2005) obtained several thousand spores, an exten-
sive ERM and abundant root colonization. The spores produced in this system were
able to colonize new plantlets under the same conditions and therefore underlined
the capacity of this autotrophic culture system to continuously culture AM fungi.
The HAM–P in vitro culture system was thereafter adapted to perform transport
studies by using a bi-compartmented Petri plate instead of a mono-compartmented
Petri plate, as shown in Fig. 7.3 with a root compartment (RC) and a hyphal
compartment (HC).
The set-up of this system is as follows:
1. A hole (�2 mm in diameter) is made using heated scalpel by melting (a) the edge
of the lid to its top (2 mm wide) and (b) the base of the Petri plate 2 mm
downwards (2 mm wide). This hole is made in the middle of the RC, perpendic-
ularly to the partition wall.
2. In the RC, 20 ml of solid culture medium lacking both sucrose and vitamins is
added at an angle of �4�, using a support for Petri plates, so that the medium
reaches the top of the partition wall while on the opposite side of the RC the
medium reaches a height of 2-3 mm (see Fig. 7.2).
3. A plantlet presenting vigorous growth and a strong primary root is transferred to
the system. The roots are placed on the surface of the medium in the RC and the
shoot is inserted in the hole previously made in the base of the Petri plate.
4. Approximately 100 spores are inoculated along the roots of the plantlet after
their isolation as described in Sect. 7.4.3.
5. The lid is placed on the Petri plate so that the cut edge of the lid is above
the plantlet shoot. The hole is then carefully plastered with sterilized (121�C for
15 min) silicon grease to avoid contamination.
6. The Petri plate is sealed with Parafilm.
7. The Petri plate is covered with an opaque black plastic bag and incubated
horizontally in a growth chamber set at 20�C with 70% relative humidity and
16/8 h photoperiod. The photosynthetic photon flux should ideally comprise
between 200 and 400 mmol.m�2.s�1.
RC HC
Fig. 7.3 Schematic representation of the half-closed arbuscular mycorrhizal–plant (HAM–P)
in vitro culture system viewed from the side. The system allows the spatial separation of a root
compartment (RC) where roots and an AM fungus grow and a hyphal compartment (HC) in whichonly the extraradical hyphae are allowed to proliferate. The shoot develops in open-air conditions
while the roots and AM fungus are maintained in vitro in the RC and HC of a bi-compartmented
Petri plate (90 mm diam)
112 H. Dupre de Boulois et al.

8. Medium is regularly added (about 5 ml once every one to three weeks) to the
RC to guarantee plant and fungal growth, but also to guarantee that medium
does not dry out. The medium is added at a temperature of �40�C in order to
reduce the risk of damaging the roots and AM fungi.
9. When extensive ERM is reached, liquid or solid medium is added into the HC
to ensure mycelium growth in this compartment (see Sect. 7.4.1.).
10. Isotopic labelling and harvest are described in Sects. 7.6.2. and 7.6.4.
7.5.3.1 Remarks
Sterility of the System
This system does not allow growth of both plant and AM fungi under strict in vitroconditions as the shoot develops in open-air conditions. The shoot can therefore be
subjected to various abiotic stresses and to possible contaminations that could lead
to the development of micro-organisms within the Petri plate (Dupre de Boulois
et al. 2006).
Depletion of the Medium
Due to the transpiration of the host plant, rapid depletion of the medium in the RC
occurs while the plant is actively growing. Regular addition of new medium is
therefore necessary. However, as plants may not deplete the medium at a similar
rate, it is difficult to add the same amount of medium to each HAM–P in vitro culturesystem. The rapid depletion of the medium in the RC is problematic as it may cause
(1) difficulties for the ERM to cross the partition wall, (2) numerous extraradical
hyphae to break after they have successfully crossed the partition wall, and eventu-
ally (3) the necessity to add medium in the RC during the labelling period.
Labelling
As the shoot develops in open-air conditions, it can easily be labelled with gases
(e.g. 13,14CO2,15NO2) or any labelled molecules or elements that can be absorbed
by the leaves or stem (e.g. sugars, fungicides, Cs, U, Zn, Sr). This represents a major
advantage compared to the system developed by Dupre de Boulois et al. (2006).
7.5.4 The Arbuscular Mycorrhizal–Plant (AM–P) In VitroCulture System (Dupre de Boulois et al. 2006)
To overcome the limitations of the HAM–P in vitro culture system (i.e. sterility and
medium depletion), Dupre de Boulois et al. (2006) developed a complete arbuscular
mycorrhizal–plant (AM–P) in vitro culture system, in which both AM fungi and
7 In Vitro Compartmented Systems to Study Transport 113
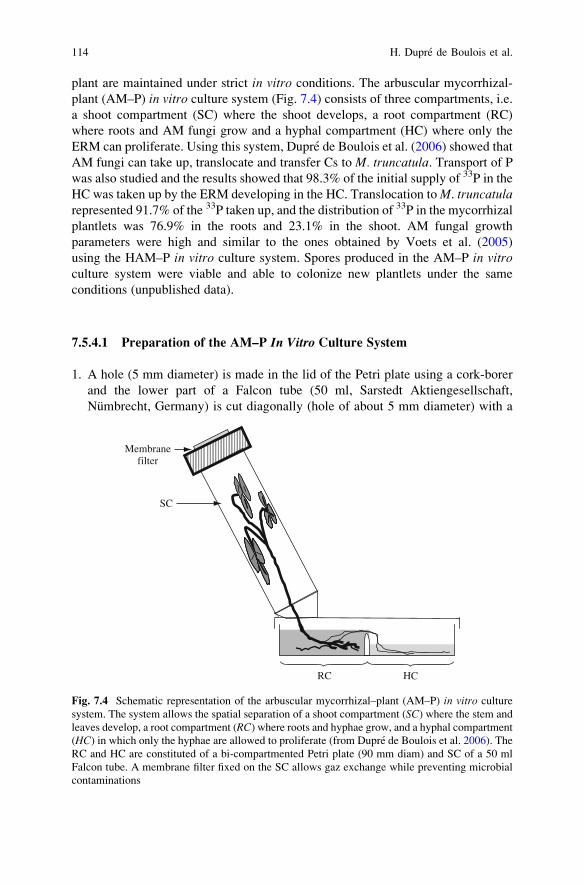
plant are maintained under strict in vitro conditions. The arbuscular mycorrhizal-
plant (AM–P) in vitro culture system (Fig. 7.4) consists of three compartments, i.e.
a shoot compartment (SC) where the shoot develops, a root compartment (RC)
where roots and AM fungi grow and a hyphal compartment (HC) where only the
ERM can proliferate. Using this system, Dupre de Boulois et al. (2006) showed that
AM fungi can take up, translocate and transfer Cs to M. truncatula. Transport of Pwas also studied and the results showed that 98.3% of the initial supply of 33P in the
HC was taken up by the ERM developing in the HC. Translocation toM. truncatularepresented 91.7% of the 33P taken up, and the distribution of 33P in the mycorrhizal
plantlets was 76.9% in the roots and 23.1% in the shoot. AM fungal growth
parameters were high and similar to the ones obtained by Voets et al. (2005)
using the HAM–P in vitro culture system. Spores produced in the AM–P in vitroculture system were viable and able to colonize new plantlets under the same
conditions (unpublished data).
7.5.4.1 Preparation of the AM–P In Vitro Culture System
1. A hole (5 mm diameter) is made in the lid of the Petri plate using a cork-borer
and the lower part of a Falcon tube (50 ml, Sarstedt Aktiengesellschaft,
Numbrecht, Germany) is cut diagonally (hole of about 5 mm diameter) with a
RC HC
SC
Membranefilter
Fig. 7.4 Schematic representation of the arbuscular mycorrhizal–plant (AM–P) in vitro culture
system. The system allows the spatial separation of a shoot compartment (SC) where the stem and
leaves develop, a root compartment (RC) where roots and hyphae grow, and a hyphal compartment
(HC) in which only the hyphae are allowed to proliferate (from Dupre de Boulois et al. 2006). The
RC and HC are constituted of a bi-compartmented Petri plate (90 mm diam) and SC of a 50 ml
Falcon tube. A membrane filter fixed on the SC allows gaz exchange while preventing microbial
contaminations
114 H. Dupre de Boulois et al.
scalpel to obtain an angle of 65 � 5� when placed on the lid of the Petri plate.
The cork-borer and scalpel are heated with the flame of a Bunsen burner to
facilitate the cuttings.
2. The Falcon tube and the Petri plate are then glued together using plastic
thermo-fusible glue adapted to plastic gluing.
3. A hole (10 mm diameter) is made in the cap of the Falcon tube using a cork-
borer, and a filter (18.6 mm diameter with inner efficient gas exchange capacity
of 10 mm diameter and surface of 78.5 mm2) is fixed on the cap. The filter used
by Dupre de Boulois et al. (2006) is an Adhesive Microfiltration Disc (AMD) in
polypropylene-laminated PTFE (Tissue Quick Plant Laboratory, Hampshire,
UK) which prevents microbial contamination but allows gas exchange (Nominal
Pore Size (NPS) of 0.25 mm). Note that other ventilation filters may be used such
as the one made of cellulose or polyvinyl chloride.
4. The AM–P in vitro culture system is then sterilized at 25 kGy by gamma
irradiation. Note that other sterilization procedures using, for instance, elec-
tron-beam (E-Beam) can also be used, but it is not recommended to use ethylene
oxide (EtO) sterilization as EtO can be absorbed by some plastics and must then
be treated to eliminate any EtO before use. Note that autoclaving the AM–P invitro culture system is not possible as thermofusible glue could melt and systems
be deformed by the heat.
7.5.4.2 Set Up
In the work of Dupre de Boulois et al. (2006), solid MSRCs medium (Declerck et al.
2003) lacking vitamins and sucrose was added in the Petri plate as described in Fig.
7.1c, but two holes were made in the medium with a cork borer to allow addition of
new medium during the course of the experiment to guarantee adequate mineral
nutrition of plant and AM fungi. However, if this procedure was efficient (Dupre de
Boulois et al. 2006), it has to be noticed that due to water uptake by the mycorrhizal
roots and transpiration, a slight medium depletion was observed (eq. to about 10 ml
of medium in 10 weeks with M. truncatula) and probably restricted the capacity of
fungal hyphae to cross the partition wall and thus develop in the HC. Therefore, we
propose here an alternative procedure.
1. In the RC, add 20 ml of MSR medium lacking sucrose and vitamins.
2. A germinated plantlet presenting vigorous growth and a strong primary root
presenting eventually lateral roots is transferred to the system. The roots are
placed on the surface of the medium in the RC and the shoot is inserted into
the SC.
3. Approximately 100 spores are inoculated along the roots of the plantlet after
their isolation, as described in Sect. 7.4.3.
4. The Petri plate is sealed with Parafilm or plastic wrap.
5. The Petri plate is then covered with an opaque black plastic bag and incubated
horizontally in a growth chamber set at 20�C with 60% relative humidity and
7 In Vitro Compartmented Systems to Study Transport 115
16/8 h photoperiod. The photosynthetic photon flux should comprise between
200 and 400 mmol m�2 s�1.
6. Medium is regularly added (about 5 ml once every 2 to 4 weeks) to the RC to
guarantee plant and fungal growth. The medium is added at a temperature of
�40�C in order to reduce the risk of damaging the roots and AM fungi.
7. When an extensive ERM is reached, liquid or solid medium is added into the
HC to ensure mycelium growth in this compartment (see Sect. 7.4.1).
8. Isotopic labelling and harvest are described in Sects. 7.6.3 and 7.6.5.
Remarks
Depletion of the Medium
Due to the transpiration of the host plant, depletion of the medium in the RC occurs
while the plant is actively growing. However, contrarily to the HAM–P in vitroculture system, the depletion of the medium is limited. Indeed, as the whole plant is
maintained under in vitro conditions, the transpiration of the plant is highly
reduced. It is nonetheless necessary to regularly check the level of medium in the
AM–P in vitro culture system and, even if no medium depletion is visible, medium
should be added regularly to provide nutrients to the plant and the AM fungus. It is
thus advised to add medium depending on the nutritional needs of the plant and AM
fungus. Concentrated medium (2–10-times) can also be used (see for instance
Dupre de Boulois et al. 2006) to provide nutrients. If other ventilation membranes
or Petri plate sizes are used, it is necessary to assess medium depletion to ensure that
the extraradical hyphae can cross the partition wall between the RC and HC.
Plant Transpiration
As the plants develop fully in vitro with only a membrane allowing gas exchange, it
is possible that the relative humidity within the AM–P in vitro culture system is
very high and limits plant transpiration. If this is advantageous as medium depletion
in the RC is low, it may have significant impact on plant physiology such as
plant photosynthesis, nutrient translocation from root to shoot or plant abscisic
acid content.
7.6 Labelling with Isotopic Tracers
Isotopic labelling is performed by using an isotopic tracer to observe the movement
of certain elements in chemical, biological, or physical processes. The term tracer is
applied commonly to any stable or radioactive isotope used to trace the course of
non-radioactive elements or biological substances (e.g. proteins, sugars, DNA), and
also radioactive elements such as radionuclide contaminants. The observations may
116 H. Dupre de Boulois et al.

be conducted by the measurement of the relative abundance of isotopes if stable
isotopes are used as tracers or of radioactivity in the case of radioactive tracers.
Instruments used to detect stable isotopes include principally mass spectrographs
and nuclear magnetic resonance (NMR) spectrometers. Instruments used to detect
radiation may include liquid scintillation counters, gamma counters and (micro)-
autoradiographs.
The isotopic tracer should be sterilized before addition to the Petri plate. Filter-
sterilization using a 0.2 mm filter is recommended.
7.6.1 Stable or Radio-Isotopic Tracer?
The choice between stable and radioactive isotopic labeling depends on:
l The purpose of the experiment. If the goal is to demonstrate the presence of an
element, both stable and radioactive isotopes can be used. However, if the goal is
to study a metabolic process, a stable isotope should be used in combination with
NMR spectrometry or mass spectrometry (MS).l The availability of the stable and suitability of the radioactive isotope. Some
elements have no stable isotope (i.e. technetium, tungsten and promethium and
all elements with an atomic number greater than 82). Therefore, all tracers used
to investigate these elements must be their radioactive forms. Conversely,
some elements have only radioactive isotopes with a very short half-life (i.e.
inferior to a few days). Therefore, they cannot, or only with difficulty, be used
for transport studies. In this case the tracer must be a low-abundance stable
isotope prepared in enriched form. Also, not all stable isotopes can be used
with NMR spectrometry (i.e. isotopes with a zero nuclear spin) or mass
spectrometry (i.e. isobars). Note that isobars and isobar molecules can be
distinguished using Accelerator Mass spectrometry (AMS) or Resonance-
Ionization Mass Spectrometry (RIMS), but these instruments are only avail-
able in some highly specialized laboratories.l The detection limit of the instruments. The choice between stable and radio-
active isotopes can be determined by the so-called ‘‘dilution factor’’, which is
a measure of the concentration of tracer required for detection. Generally,
radioactive tracers may be detected in much lower quantities than stable tracers.
For example, a pure 13C tracer would be detectable after being diluted 100,000 to
1 million times with natural 12C. Radioactive 14C, however, can be detected after
being diluted 25 billion times with 12,13C.
For many studies, it is possible to choose between stable-isotope tracers
and radioactive-isotope tracers. For example, it is possible to choose between 13C
(stable) and 14C (radioactive) or 31P (stable) and 32,33P (radioactive) isotopes.
7 In Vitro Compartmented Systems to Study Transport 117
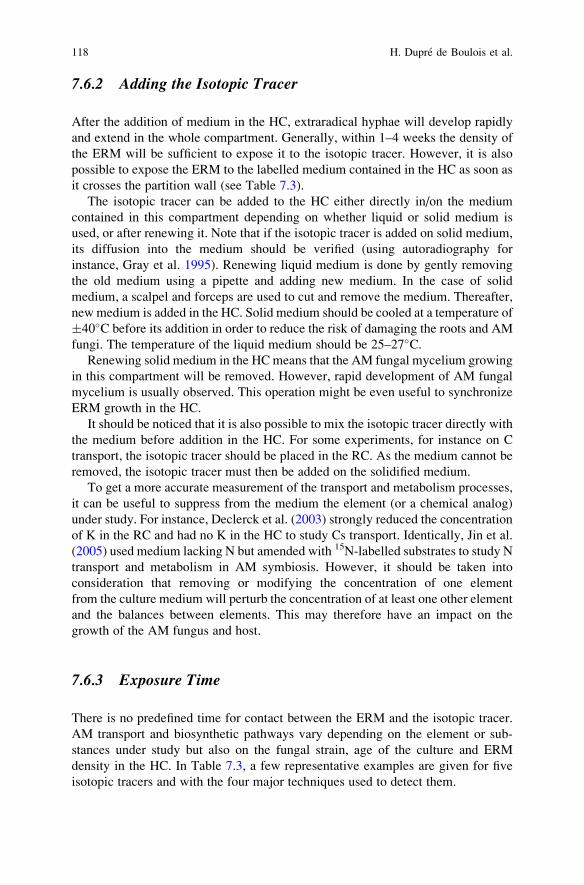
7.6.2 Adding the Isotopic Tracer
After the addition of medium in the HC, extraradical hyphae will develop rapidly
and extend in the whole compartment. Generally, within 1–4 weeks the density of
the ERM will be sufficient to expose it to the isotopic tracer. However, it is also
possible to expose the ERM to the labelled medium contained in the HC as soon as
it crosses the partition wall (see Table 7.3).
The isotopic tracer can be added to the HC either directly in/on the medium
contained in this compartment depending on whether liquid or solid medium is
used, or after renewing it. Note that if the isotopic tracer is added on solid medium,
its diffusion into the medium should be verified (using autoradiography for
instance, Gray et al. 1995). Renewing liquid medium is done by gently removing
the old medium using a pipette and adding new medium. In the case of solid
medium, a scalpel and forceps are used to cut and remove the medium. Thereafter,
new medium is added in the HC. Solid medium should be cooled at a temperature of
�40�C before its addition in order to reduce the risk of damaging the roots and AM
fungi. The temperature of the liquid medium should be 25–27�C.Renewing solid medium in the HCmeans that the AM fungal mycelium growing
in this compartment will be removed. However, rapid development of AM fungal
mycelium is usually observed. This operation might be even useful to synchronize
ERM growth in the HC.
It should be noticed that it is also possible to mix the isotopic tracer directly with
the medium before addition in the HC. For some experiments, for instance on C
transport, the isotopic tracer should be placed in the RC. As the medium cannot be
removed, the isotopic tracer must then be added on the solidified medium.
To get a more accurate measurement of the transport and metabolism processes,
it can be useful to suppress from the medium the element (or a chemical analog)
under study. For instance, Declerck et al. (2003) strongly reduced the concentration
of K in the RC and had no K in the HC to study Cs transport. Identically, Jin et al.
(2005) used medium lacking N but amended with 15N-labelled substrates to study N
transport and metabolism in AM symbiosis. However, it should be taken into
consideration that removing or modifying the concentration of one element
from the culture medium will perturb the concentration of at least one other element
and the balances between elements. This may therefore have an impact on the
growth of the AM fungus and host.
7.6.3 Exposure Time
There is no predefined time for contact between the ERM and the isotopic tracer.
AM transport and biosynthetic pathways vary depending on the element or sub-
stances under study but also on the fungal strain, age of the culture and ERM
density in the HC. In Table 7.3, a few representative examples are given for five
isotopic tracers and with the four major techniques used to detect them.
118 H. Dupre de Boulois et al.
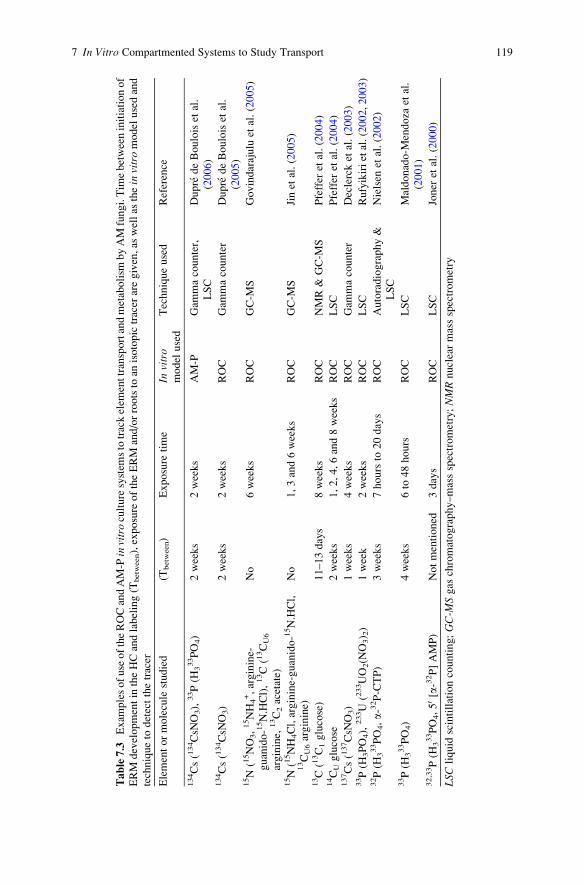
Table7.3
Exam
plesofuse
oftheROCandAM-P
invitroculturesystem
stotrackelem
enttransportandmetabolism
byAM
fungi.Tim
ebetweeninitiationof
ERM
developmentin
theHCandlabeling(T
between),exposure
oftheERM
and/orrootsto
anisotopictracer
aregiven,as
wellas
thein
vitromodelusedand
techniqueto
detectthetracer
Elementormolecule
studied
(Tbetween)
Exposure
time
Invitro
model
used
Techniqueused
Reference
134Cs(134CsN
O3),
33P(H
333PO4)
2weeks
2weeks
AM-P
Gam
macounter,
LSC
Dupre
deBouloiset
al.
(2006)
134Cs(134CsN
O3)
2weeks
2weeks
ROC
Gam
macounter
Dupre
deBouloiset
al.
(2005)
15N(15NO3,15NH4+,arginine-
guanido-15N.HCl),13C(13CU6
arginine,
13C2acetate)
No
6weeks
ROC
GC-M
SGovindarajulu
etal.(2005)
15N(15NH4Cl,arginine-guanido-15N.HCl,
13CU6arginine)
No
1,3and6weeks
ROC
GC-M
SJinet
al.(2005)
13C(13C1glucose)
11–13days
8weeks
ROC
NMR&
GC-M
SPfeffer
etal.(2004)
14CUglucose
2weeks
1,2,4,6and8weeks
ROC
LSC
Pfeffer
etal.(2004)
137Cs(137CsN
O3)
1weeks
4weeks
ROC
Gam
macounter
Declercket
al.(2003)
33P(H
3PO4),
233U(233UO2(N
O3) 2)
1week
2weeks
ROC
LSC
Rufyikirietal.(2002,2003)
32P(H
333PO4,a-
32P-CTP)
3weeks
7hoursto
20days
ROC
Autoradiography&
LSC
Nielsen
etal.(2002)
33P(H
333PO4)
4weeks
6to
48hours
ROC
LSC
Maldonado-M
endoza
etal.
(2001)
32,33P(H
333PO4,50 [a-
32P]AMP)
Notmentioned
3days
ROC
LSC
Joner
etal.(2000)
LSCliquid
scintillationcounting;GC-M
Sgas
chromatography–massspectrometry;NMRnuclearmassspectrometry
7 In Vitro Compartmented Systems to Study Transport 119

7.6.4 Harvest
Before collecting the ERM from the HC containing liquid medium, the medium is
removed using a manual or motorized pipettor, and the compartment is rinsed 2–3
times with water. The extraradical hyphae can then be harvested easily by shearing
the extraradical hyphae along the partition wall using forceps and scalpel under the
stereomicroscope.
If the HC contains solid medium, the harvest of the ERM is more arduous as
separation can only be performed by dissolving the gel using citrate buffer (pH 6, 10
mM: 1.8 mM citric acid + 8.2 mM sodium citrate) with the risk of cytoplasm leakage.
To harvest the roots and ERM in the RC, it is possible to either:
l Remove the roots from the solid medium using forceps and eventually rinse
them with citrate buffer if medium remains attached to the roots. The ERM can
then be separated from the solid medium using citrate buffer as described above.
or
l Place the medium containing the roots and ERM directly in citrate buffer. In this
case, the ERM will still be attached to the root, so hyphae will need to be sheared
from the root using scalpel and forceps. Roots and ERM are then rinsed in water.
7.7 Conclusions
In this chapter, we have presented the bases for conducting transport studies using
either the ROC or the newly developed HAM–P and AM–P in vitro culture systems.
These systems represent powerful tools for investigating nutrient, trace element and
C transport and metabolism by AM fungi. However, the utility of these systems
should not be limited to transport studies. Indeed, as the HAM-P and AM–P in vitroculture systems have major advantages over the ROC, these systems will most
probably become important models for investigating AM biology and AM fungus-
plant interactions.
Acknowledgements H.D.D.B. acknowledges receipt of a FRIA fellowship via the FNRS
(Belgium) and a grant of Charge de cherches from the F.R.S – FNRS (Belgium). L.V. was
supported by a grant of the ‘‘Fonds Speciaux de Recherche’’ (FSR) of the Universite Catholique
de Louvain.
References
Ames RN, Reid CPP, Porter LK, Cambardella C (1983) Hyphal uptake and transport of nitrogen
from two 15N-labelled sources by Glomus mosseae, a vesicular-arbuscular mycorrhizal fungus.
New Phytol 95:381–396
Bago B, Cano C (2005) Breaking myths on arbuscular mycorrhizas in vitro biology. In: Declerck
S, Strullu DG, Fortin JA (eds) In vitro culture of mycorrhizas. Springer, Berlin, pp 111–138
120 H. Dupre de Boulois et al.

Becard G, Fortin JA (1988) Early events of vesicular-arbuscular mycorrhiza formation on Ri
T-DNA transformed roots. New Phytol 108:211–218.
Cooper KM, Tinker PB (1978) Translocation and transfer of nutrients in vesicular-arbuscular
mycorrhizas. II. Uptake and translocation of phosphorus, zinc and sulphur. New Physiol
81:43–52
Cooper KM, Tinker PB (1981) Translocation and transfer of nutrients in vesicular-arbuscular
mycorrhizas. IV. Effect of environmental variables on movement of phosphorus. New Phytol
88:327–339
Cranenbrouck S, Voets L, Bivort C, Renard L, Strullu DG, Declerck S (2005) Methodologies for
successful aseptic growth of arbuscular mycorhizal fungi on root-organ cultures. In: Declerck
S, Strullu DG, Fortin JA (eds) In vitro Culture of Mycorrhizas. Springer, Berlin, pp 341–375
Daft MJ, Nicolson TH (1966) Effect of Endogone mycorrhiza on plant growth. New Phytol
65:343–350
Declerck S, Dupre de Boulois H, Bivort C, Delvaux B (2003) Extraradical mycelium of the
mycorrhizal fungus Glomus lamellosum can uptake, accumulate and translocate radiocesium.
Environ Microbiol 5:510–516
Declerck S, Strullu DG, Plenchette C (1998) Monoxenic culture of the intraradical forms of
Glomus sp. isolated from a tropical ecosystem: a proposed methodology for germplasm
collection. Mycologia 90:579–585
Dupre de Boulois H, Delvaux B, Declerck S (2005) Effects of arbuscular mycorrhizal fungi on the
root uptake and translocation of radiocaesium. Environ Pollut 134:515–524
Dupre de Boulois H, Voets L, Delvaux B, Jakobsen I, Declerck S (2006) Transport of radio-
caesium by arbuscular mycorrhizal fungi to Medicago truncatula under in vitro conditions.
Environ Microbiol 8:1926–1934
Elmeskaoui A, Damont JP, Poulin MJ, Piche Y, Desjardins Y (1995) A tripartite culture system for
endomycorrhizal inoculation of micropropagated strawberry plantlets in vitro. Mycorrhiza
5:313–319
Fortin JA, Becard G, Declerck S, Dalpe Y, St-Arnaud M, Coughlan AP, Piche Y (2002) Arbus-
cular mycorrhiza on root-organ cultures. Can J Bot 80:1–20
Frey B, Schuepp H (1992) Transfer of symbiotically fixed nitrogen from berseen (Trifolium alexan-drinum L.) to maize via vesicular-arbuscular mycorrhizal hyphae. New Phytol 122:447–454
Govindarajulu M, Pfeffer PE, Jin HR, Abubaker J, Douds DD, Allen JWB, Bucking H, Lammers
PJ, Shachar-Hill Y (2005) Nitrogen transfer in the arbuscular mycorrhizal symbiosis. Nature
435:819–823
Gray SN, Dighton J, Olsson S, Jennings D (1995) Real-time measurement of uptake of 137Cs
within mycelium of Schizophyllum commune Fr. by autoradiography followed by quantitative
image analysis. New Phytol 129:449–465
Hattingh MJ, Gray LE, Gerdemann JM (1973) Uptake and translocation of 32P-labelled phosphate
to onion roots by endomycorrhizal fungi. Soil Sci 166:383–387
Hayman DS, Mosse B (1972) Plant growth response to vesicular-arbuscular mycorrhiza. III.
Increased uptake of labile P from soil. New Phytol 71:41–47
Hernandez-Sebastia C, Piche Y, Desjardins Y (1999) Water relations of whole strawberry plantlets
in vitro inoculated with Glomus intraradices in a tripartite culture system. Plant Sci 143:81–91
Hernandez-Sebastia C, Samson G, Bernier PY, Piche Y, Desjardins Y (2000) Glomus intraradicescauses differential changes in amino acid and starch concentrations of in vitro strawberry
subjected to water stress. New Phytol 148:177–186
Jansa J, Mozafar A, Frossard E (2003) Long-distance transport of P and Zn through the hyphae of
an arbuscular mycorrhizal fungus in symbiosis with maize. Agronomie 23:481–488
Jin H, Pfeffer PE, Douds DD, Piotrowski E, Lammers PJ, Shachar-Hill Y (2005) The uptake,
metabolism, transport and transfer of nitrogen in an arbuscular mycorrhizal symbiosis. New
Phytol 168:687–696
Joner EJ, Ravnskov S, Jakobsen I (2000) Arbuscular mycorrhizal phosphate transport under
monoxenic conditions using radio-labelled inorganic and organic phosphate. Biotechnol Lett
22:1705–1708
7 In Vitro Compartmented Systems to Study Transport 121

Louche-Tessandier D, Samson G, Hernandez-Sebastia C, Chagvardieff P, Desjardins Y (1999)
Importance of light and CO2 on the effects of endomycorrhiza colonization on growth and
photosynthesis of potato plantlets (Solanum tuberosum) in an in vitro tripartite system. New
Phytol 142:539–550
Mader P, Vierheilig H, Alt M, Wiemken A (1993) Boundaries between soil compartments formed
by microporous hydrophobic membranes (Gore-Tex) can be crossed by vesicular-arbuscular
mycorrhizal fungi but not by ions in the soil solution. Plant Soil 152:201–206
Maldonado-Mendoza IE, Dewbre GR, Harrison MJ (2001) A phosphate transporter gene from the
extraradical mycelilum of an arbuscular mycorrhizal fungus Glomus intraradices is regulatedin response to phosphate in the environment. Mol Plant Microbe Int 14:1140–1148
Marschner H (1995) Mineral Nutrition of Higher Plants. Academic Press, London
Mosse B, Hepper CM (1975) Vesicular-arbuscular infections in root-organ cultures. Physiol. Plant
Pathol 5:215–223
Nielsen JS, Joner EJ, Declerck S, Olsson S, Jakobsen I (2002) Phospho-imaging as a tool for
visualization and noninvasive measurement of P transport dynamics in arbuscular mycorrhizas.
New Phytol 154:809–820
Pearson V, Tinker PB (1975) Measurement of phosphorus fluxes in the external hyphae of
endomycorrhizas. In: Sanders FE, Mosse B, Tinker PB (eds) Endomycorrhizas. Academic,
New York, pp 277–287
Pfeffer P, Douds DD, Bucking H, Schwartz DP, Shachar-Hill Y (2004) The fungus does not transfer
carbon to or between roots in an arbuscular mycorrhizal symbiosis. New Phytol 163:617–627
Rhodes LH, Gerdemann (1975) Phosphate uptake zones of mycorrhizal and non-mycorrhizal
onions. New Phytol 75:555–561
Rufyikiri G, Kruyts N, Declerck S, Thiry Y, Delvaux B, Dupre de Boulois H, Joner E (2005)
Uptake, assimilation and translocation of mineral elements in monoxenic cultivation systems.
In: Declerck S, Strullu DG, Fortin JA (eds) In vitro culture of mycorrhizas. Springer, Berlin,
pp 201–215
Rufyikiri G, Thiry Y, Delvaux B, Declerck S (2003) Contribution of hyphae and roots to uranium
uptake, accumulation and translocation by arbuscular mycorrhizal carrot roots under root-
organ culture conditions. New Phytol 158:391–399
Rufyikiri G, Thiry Y,Wang L, Delvaux B, Declerck S (2002) Uranium uptake and translocation by
the arbuscular mycorrhizal fungus, Glomus intraradices, under root-organ culture conditions.
New Phytol 156:275–281
Sanders FE, Tinker PB (1971) Mechanism of absorption of phosphate from soil by Endogone
mycorrhizas. Nature 233:278–279
Sanders FE, Tinker PB (1973) Phosphate flow into mycorrhizal roots. Pest Sci 4:385–395
Schweiger P, Jakobsen I (2000) Laboratory and field methods for measurement of hyphal uptake
of nutrients in soil. Plant Soil 226:237–244
Smith SE, Smith FA, Jakobsen I (2003) Mycorrhizal fungi can dominate phosphate supply to
plants irrespective of growth responses. Plant Physiol 133:16–20
St-Arnaud M, Hamel C, Vimard B, Caron M, Fortin JA (1995) Altered growth of Fusariumoxysporum f. sp. chrysanthemi in an in vitro dual culture system with the vesicular arbuscular
mycorrhizal fungus Glomus intraradices growing on Daucus carota transformed roots.
Mycorrhiza 5:431–438
St-Arnaud M, Hamel C, Vimard B, Caron M, Fortin JA (1996) Enhanced hyphal growth and spore
production of the arbuscular mycorrhizal fungus Glomus intraradices in an in vitro system in
the absence of host roots. Mycol Res 100:328–332
Strullu DG, Romand C (1986) Methode d’obtention d’endomycorhizes a vesicules et arbuscules
en conditions axeniques. CR Acad Sci Paris 303: 245–250
Tanaka Y, Yano K (2005) Nitrogen delivery to maize via mycorrhizal hyphae depends on the form
of N supplied. Plant Cell Environ 28:1247–1254
Voets L, Dupre de Boulois H, Renard L, Strullu DG, Declerck S (2005) Development of an
autotrophic culture system for the in vitro mycorrhization of potato plantlets. FEMS Microbiol
Lett 248:111–118
122 H. Dupre de Boulois et al.

Chapter 8
Use of the Autofluorescence Properties of
AM Fungi for AM Assessment and Handling
B. Dreyer and A. Morte
8.1 Introduction
Different methods for the visualization of arbuscular mycorrhizal (AM) fungal
structures in roots have been described (Dickson and Smith 1998; Vierheilig
et al. 2005) most based on non-vital and vital staining, thus making the biological
material useless for further analysis. Moreover, these methods present the disad-
vantages of using toxic chemical compounds and the possible loss of information
concerning the colonization percentage (Gange et al. 1999). One technique that is
free from such disadvantages is the autofluorescence detection of AM fungal
structures in roots. The method was first described by Ames et al. (1982) and
involves subjecting roots to illumination, under which the arbuscules autofluoresce.
Only a few studies have made use of the autofluorescence of AM fungal
structures as a technique for evaluating mycorrhizal colonization (Ames et al.
1982; Jabaji-Hare et al. 1984; Gange et al. 1999; Dreyer et al. 2006). Ames et al.
(1982) found that the extent of colonization detected by this method correlated well
with the colonization level detected by the staining method described by Phillips
and Hayman (1970). In contrast, Gange et al. (1999) found that autofluorescence of
roots in most plant species examined consistently produced a higher arbuscule
count than did trypan blue, acid fuchsin or chlorazol black E stainings. They also
found that stained preparations gave variable results, whereas autofluorescence
gave much more consistent data.
A. Morte (*)
Universidad de Murcia, Facultad de Biologıa, Departamento de Biologıa Vegetal, Campus de
Espinardo, E-30100 Murcia, Spain
e-mail: [email protected]
B. DreyerUniversidad de El Salvador, CENSALUD-CIC, Autopista Norte y Final 25 avenida Norte, Ciudad
Universitaria, San Salvador, El Salvador
A. Varma and A.C. Kharkwal (eds.), Symbiotic Fungi, Soil Biology 18, 123
DOI: 10.1007/978‐3‐540‐95894‐9_8, # Springer‐Verlag Berlin Heidelberg 2009

Recently, in light of criticisms that suggested that autofluorescence is attribut-
able to the dead state of the arbuscules (Vierheilig et al .1999, 2001), we reassessed
the autofluorescence method (Dreyer et al. 2006). The autofluorescence of AM
structures within, and isolated from mycorrhizal palm roots, was compared with
their succinate dehydrogenase (SDH) activity. In contrast to the previous reports,
we found that all fungal structures, both intra- and extraradical, autofluoresced
under blue light excitation, regardless of their state (dead or alive). The results
supported the use of autofluorescence for the evaluation of AM colonization, at
least in palm species. Further, it was shown that AM spores can be detected by flow
cytometry, providing an example of how the fluorescence properties of AM fungal
structures could be exploited (Dreyer et al. 2006).
The aim of this chapter is to provide a detailed description of the methodologies
that make use of the autofluorescence properties of AM fungal structures for their
assessment. The advantages and disadvantages of the techniques are discussed in
relation to other methods used for visualizing AM fungal structures.
8.2 Equipment and Laboratory Material
8.2.1 Equipment
� Stereo-microscope
� Epifluorescence microscope
� Confocal microscope
� Centrifuge
� Electronic balance
� Bunsen burner or bead sterilizer
� Incubator
� Rotating shaker
� Polytron
� Benchtop centrifuge for microtubes
� Sort flow cytometer
8.2.2 Laboratory Material
� Petri dishes (usual diameter: 90 mm)
� Scalpels
� Forceps
� Razor blades
� Needles
� Paint brushes
� Pasteur pipettes
124 B. Dreyer and A. Morte
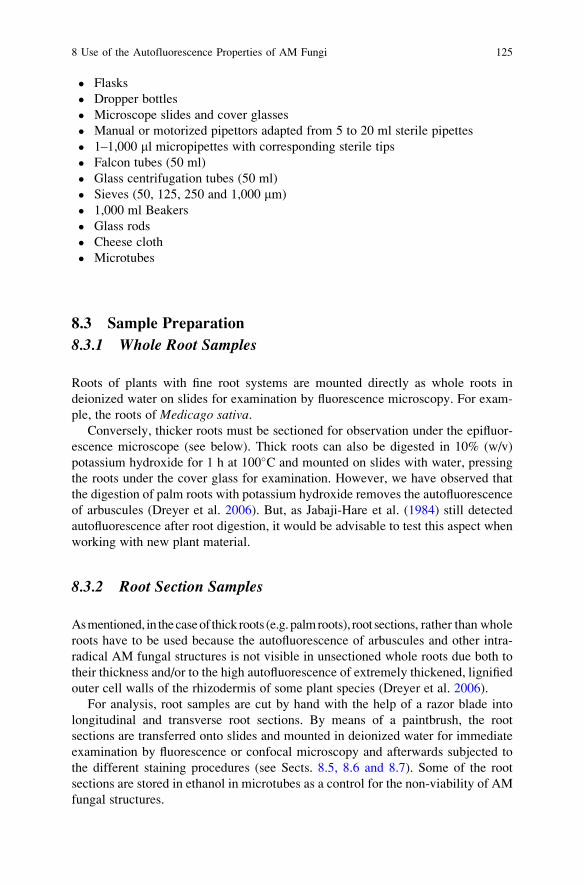
� Flasks
� Dropper bottles
� Microscope slides and cover glasses
� Manual or motorized pipettors adapted from 5 to 20 ml sterile pipettes
� 1–1,000 ml micropipettes with corresponding sterile tips
� Falcon tubes (50 ml)
� Glass centrifugation tubes (50 ml)
� Sieves (50, 125, 250 and 1,000 mm)
� 1,000 ml Beakers
� Glass rods
� Cheese cloth
� Microtubes
8.3 Sample Preparation
8.3.1 Whole Root Samples
Roots of plants with fine root systems are mounted directly as whole roots in
deionized water on slides for examination by fluorescence microscopy. For exam-
ple, the roots of Medicago sativa.Conversely, thicker roots must be sectioned for observation under the epifluor-
escence microscope (see below). Thick roots can also be digested in 10% (w/v)
potassium hydroxide for 1 h at 100�C and mounted on slides with water, pressing
the roots under the cover glass for examination. However, we have observed that
the digestion of palm roots with potassium hydroxide removes the autofluorescence
of arbuscules (Dreyer et al. 2006). But, as Jabaji-Hare et al. (1984) still detected
autofluorescence after root digestion, it would be advisable to test this aspect when
working with new plant material.
8.3.2 Root Section Samples
Asmentioned, in thecaseof thick roots (e.g.palmroots), root sections, rather than whole
roots have to be used because the autofluorescence of arbuscules and other intra-
radical AM fungal structures is not visible in unsectioned whole roots due both to
their thickness and/or to the high autofluorescence of extremely thickened, lignified
outer cell walls of the rhizodermis of some plant species (Dreyer et al. 2006).
For analysis, root samples are cut by hand with the help of a razor blade into
longitudinal and transverse root sections. By means of a paintbrush, the root
sections are transferred onto slides and mounted in deionized water for immediate
examination by fluorescence or confocal microscopy and afterwards subjected to
the different staining procedures (see Sects. 8.5, 8.6 and 8.7). Some of the root
sections are stored in ethanol in microtubes as a control for the non-viability of AM
fungal structures.
8 Use of the Autofluorescence Properties of AM Fungi 125

8.3.3 Isolation of Intraradical Fungal Structures
The intraradical fungal structures of the roots are isolated following the protocol
described by Saito (1995), with minor modifications.
The following solutions are prepared:
� Enzyme digestion solution:
� 20 g l�1 cellulase
� 1 g l�1 pectolyase
� 1 g l�1 bovine serum albumin
� 1 mM dithiothreitol (DTT)
� 0.3 M mannitol
� 0.01 M MES-NaOH buffer (pH 5.5)
� Washing buffer:
� 0.3 M mannitol
� 1 mM DTT
� 0.01 M Tris-HCl, pH 7.4
Approximately 5 g fresh mycorrhizal roots are harvested and washed first
with water and then with 0.5 mM CaSO4 for several minutes. The roots are cut
into 0.5 cm root segments and incubated under shaking in the enzyme digestion
solution at 30�C for 2 h. The digested roots are collected on a 50 mm sieve and
washed with washing buffer. The root segments are then transferred to tubes with
20 ml washing buffer for tissue homogenization using a Polytron (30 s, lowest
speed). The resulting homogenate is filtered through two layers of cheesecloth, the
filtrate is kept in reserve, and the residue is collected in the tubes and homogenized
again with 20 ml washing buffer. This process of homogenization and filtration is
repeated twice more. The filtrates are combined and centrifuged at 1,000 g for
10 min. The pellet is suspended in 2 ml washing buffer and loaded onto a Percoll
gradient consisting of 40, 20, 15 or 10% Percoll in 0.3 M mannitol, 1 mM DTT and
0.01 M Tris-HCl, pH 7.4. The Percoll gradient is prepared by successive loading of
the Percoll solutions in a 50 ml glass centrifuge tube. The centrifugation is per-
formed at 430 g for 30 min. The fractions enriched in AM fungal structures are
collected from the interfaces between the Percoll bands with a Pasteur pipette.
These fractions are mixed, diluted with 20 ml washing buffer and centrifuged again
at 1,000 g for 5 min. The pellet is transferred to a 50 mm sieve and washed with
washing buffer before being centrifuged again in 10 ml washing buffer at 1,000 g
for 10 min. The resulting pellet contains the AM fungal structures.
Remark: All steps during the enzyme digestion are performed at 4�C.The isolated fungal structures can be directly subjected to autofluorescence and/
or SDH-activity staining. The process performed for isolating AM fungal structures
does not presumably affect the enzymatic SDH-activity (Saito 1995; Dreyer
et al. 2006).
126 B. Dreyer and A. Morte
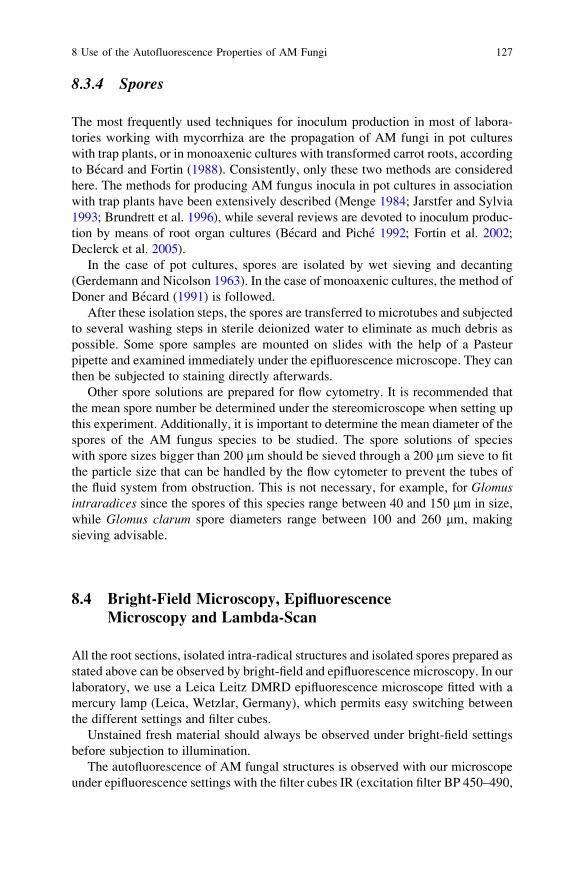
8.3.4 Spores
The most frequently used techniques for inoculum production in most of labora-
tories working with mycorrhiza are the propagation of AM fungi in pot cultures
with trap plants, or in monoaxenic cultures with transformed carrot roots, according
to Becard and Fortin (1988). Consistently, only these two methods are considered
here. The methods for producing AM fungus inocula in pot cultures in association
with trap plants have been extensively described (Menge 1984; Jarstfer and Sylvia
1993; Brundrett et al. 1996), while several reviews are devoted to inoculum produc-
tion by means of root organ cultures (Becard and Piche 1992; Fortin et al. 2002;
Declerck et al. 2005).
In the case of pot cultures, spores are isolated by wet sieving and decanting
(Gerdemann and Nicolson 1963). In the case of monoaxenic cultures, the method of
Doner and Becard (1991) is followed.
After these isolation steps, the spores are transferred to microtubes and subjected
to several washing steps in sterile deionized water to eliminate as much debris as
possible. Some spore samples are mounted on slides with the help of a Pasteur
pipette and examined immediately under the epifluorescence microscope. They can
then be subjected to staining directly afterwards.
Other spore solutions are prepared for flow cytometry. It is recommended that
the mean spore number be determined under the stereomicroscope when setting up
this experiment. Additionally, it is important to determine the mean diameter of the
spores of the AM fungus species to be studied. The spore solutions of species
with spore sizes bigger than 200 mm should be sieved through a 200 mm sieve to fit
the particle size that can be handled by the flow cytometer to prevent the tubes of
the fluid system from obstruction. This is not necessary, for example, for Glomusintraradices since the spores of this species range between 40 and 150 mm in size,
while Glomus clarum spore diameters range between 100 and 260 mm, making
sieving advisable.
8.4 Bright-Field Microscopy, Epifluorescence
Microscopy and Lambda-Scan
All the root sections, isolated intra-radical structures and isolated spores prepared as
stated above can be observed by bright-field and epifluorescence microscopy. In our
laboratory, we use a Leica Leitz DMRD epifluorescence microscope fitted with a
mercury lamp (Leica, Wetzlar, Germany), which permits easy switching between
the different settings and filter cubes.
Unstained fresh material should always be observed under bright-field settings
before subjection to illumination.
The autofluorescence of AM fungal structures is observed with our microscope
under epifluorescence settings with the filter cubes IR (excitation filter BP 450–490,
8 Use of the Autofluorescence Properties of AM Fungi 127

dichroic mirror RKP 510, barrier filter LP 515), and N2.1 (excitation filter BP
515–560, dichroic mirror RKP 580, barrier filter LP 590) for blue and green light
excitation, respectively.Most of the epifluorescence microscopes on the market allow
similar settings, as these are the most commonly used settings for biological samples.
However, the terminology applied to the different filters by the different manufac-
turers may be confusing. Basically, there are three categories of filter: exciter filters,
barrier filters and dichromatic beam splitters (dichroic mirrors). Exciter filters permit
only selected wavelengths to pass through on the way toward the specimen. Barrier
filters are designed to suppress or block the excitation wavelengths and only permit
selected emission wavelengths to pass towards the eye (or the detector). Dichroic
mirrors are specialized filters which are designed to efficiently reflect excitation
wavelengths and allow emission wavelengths to pass. As an example, our filter
cube IR has a 450–490 excitation filter, meaning that a high percentage of the
excitation light falls between 450 and 490 nm in wavelength. The dichroic mirror,
RKP 510, shows high transmission at wavelengths above 510 nm and maximum
reflectivity to the left of 510 nm. The IR filter cube has a LP 515 barrier filter which
transmits a high percentage of wavelengths above 515 nm, from green to far red.
The optics of the microscope should be checked before starting the experiment,
carefully choosing the filters in accordance with the maxima of the absorption-
emission spectra of the material to be examined. In case of doubt, it is advisable to
consult the manufacturer about the characteristics of the particular filters. Microscope
companies supply the transmission curves for their excitation and barrier filters as well
as for their dichroic mirrors.
Although we observed no autofluorescence when the AM fungal structures were
excited with UV-light using the filter cube A (BP 340–380 excitation filter, RKP
400 dichroic mirror, LP 425 barrier filter) (Dreyer et al. 2006), this should be
checked before working with a new sample for the first time.
Immediately after examination, all the samples observed for autofluorescence
are subjected to different vital and non-vital staining procedures (see Sects. 8.6
and 8.7). These are then observed under bright-field settings. In the case of sections
and spores stained with calcofluor white M2R ‘‘new’’ (CFW), these are examined
under UV excitation, while the sections treated with 0.1 M ammonium hydroxide
are observed under both UV and blue light excitation.
Remark: Micrographs should be taken from the same root section for auto-
fluorescence and for staining, to allow proper comparison.
If available in the laboratory, a confocal laser scanning microscope should be
used for examining unstained root sections and spores. In our case, we count with a
Leica TCS-SP2 confocal laser scanning microscope (Leica Microsystems Inc.,
Wetzlar, Germany). Samples are examined by excitation with an argon/krypton
(Ar/ArKr) laser at 488 nm and by using a reflection short pass (RSP) 500 filter. The
spores can be additionally excited by the 543 nm line of a green helium/neon
(GreNe) laser. Emission is observed with a water immersion lens �20 (PL APO
CS) using an FITC band pass filter.
Remark: An interesting feature of some confocal laser scanning microscopes is
that a lambda-scan can be conducted. This allows the recording of the emission
128 B. Dreyer and A. Morte
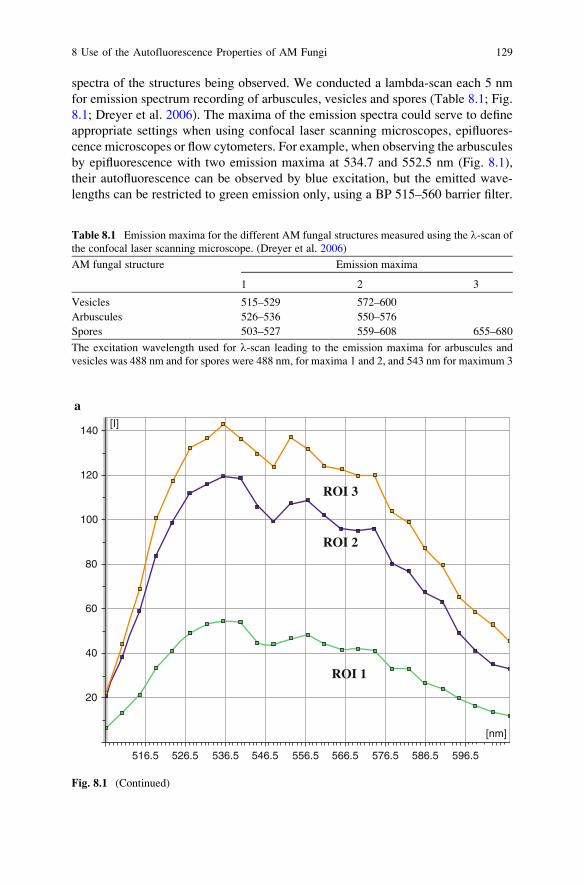
spectra of the structures being observed. We conducted a lambda-scan each 5 nm
for emission spectrum recording of arbuscules, vesicles and spores (Table 8.1; Fig.
8.1; Dreyer et al. 2006). The maxima of the emission spectra could serve to define
appropriate settings when using confocal laser scanning microscopes, epifluores-
cence microscopes or flow cytometers. For example, when observing the arbuscules
by epifluorescence with two emission maxima at 534.7 and 552.5 nm (Fig. 8.1),
their autofluorescence can be observed by blue excitation, but the emitted wave-
lengths can be restricted to green emission only, using a BP 515–560 barrier filter.
Table 8.1 Emission maxima for the different AM fungal structures measured using the l-scan ofthe confocal laser scanning microscope. (Dreyer et al. 2006)
AM fungal structure Emission maxima
1 2 3
Vesicles 515–529 572–600
Arbuscules 526–536 550–576
Spores 503–527 559–608 655–680
The excitation wavelength used for l-scan leading to the emission maxima for arbuscules and
vesicles was 488 nm and for spores were 488 nm, for maxima 1 and 2, and 543 nm for maximum 3
[nm]
596.5586.5566.5556.5546.5536.5526.5516.5
20
40
60
80
100
120
ROI 3
ROI 2
ROI 1
140[I]
576.5
a
Fig. 8.1 (Continued)
8 Use of the Autofluorescence Properties of AM Fungi 129
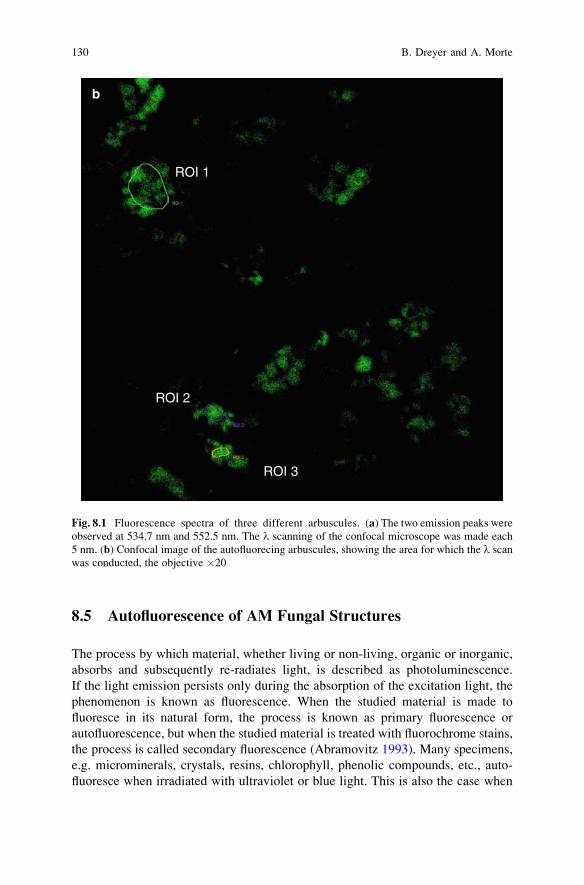
8.5 Autofluorescence of AM Fungal Structures
The process by which material, whether living or non-living, organic or inorganic,
absorbs and subsequently re-radiates light, is described as photoluminescence.
If the light emission persists only during the absorption of the excitation light, the
phenomenon is known as fluorescence. When the studied material is made to
fluoresce in its natural form, the process is known as primary fluorescence or
autofluorescence, but when the studied material is treated with fluorochrome stains,
the process is called secondary fluorescence (Abramovitz 1993). Many specimens,
e.g. microminerals, crystals, resins, chlorophyll, phenolic compounds, etc., auto-
fluoresce when irradiated with ultraviolet or blue light. This is also the case when
b
ROI 1
ROI 2
ROI 3
Fig. 8.1 Fluorescence spectra of three different arbuscules. (a) The two emission peaks were
observed at 534.7 nm and 552.5 nm. The l scanning of the confocal microscope was made each
5 nm. (b) Confocal image of the autofluorecing arbuscules, showing the area for which the l scan
was conducted, the objective �20
130 B. Dreyer and A. Morte

arbuscules, formed during AM colonization as characteristic fungal structures in
roots, are irradiated with blue light (Ames et al. 1982).
Although the method of autofluorescence detection of AM fungal structures
has been known for more than 25 years (Ames et al. 1982), it has not been widely
used and its advantages for the assessment and management of AM fungi have not
been fully explored.
Ames et al. (1982), tested five different plant species colonized by different AM
fungi, including species of the genera Glomus, Gigaspora and Acaulospora, andobserved that the arbuscules autofluoresced when illuminated with blue light
and that the AM fungal species, host plant and growth conditions had no effect
on the autofluorescence pattern. The study of Gange et al. (1999) confirmed that the
autofluorescence of AM fungal structures was a common phenomenon, since it was
observed in eight different plant species colonized by native AM fungi. Table 8.2
shows the plant species studied until now by means of autofluorescence detection of
AM fungal structures.
There are several possible reasons why autofluorescence detection has not been
more widely used as a method for visualizing AM fungal structures. One reason
may be that the title of the article by Ames et al. (1982) was misleading, since the
authors described the autofluorescence as being induced by ultraviolet light. If some
Table 8.2 Plant species studied by autofluorescence detection for visualizing AM fungal
structures
Plant speciesa Material examined Reference
Allium porrum Root sections Jabaji-Hare et al. (1984)
Allium textile Whole-root segments Ames et al. (1982)
Artemisia frigida Whole-root segments Ames et al. (1982)
Bouteloua gracilis Whole-root segments Ames et al. (1982)
Brachypodium pinnatum Whole-root segments Gange et al. (1999)
Brahea armata Root sections Dreyer et al. (2006)
Chamaerops humilis Root sections Dreyer et al. (2006)
Dactylis glomerata Whole-root segments Gange et al. (1999)
Fragaria vesca Whole-root segments Ames et al. (1982)
Holcus lanatus Whole-root segments Gange et al. (1999)
Hyacinthoides non-scripta Whole-root segments Gange et al. (1999)
Lolium perenne Whole-root segments Vierheilig et al. (1999)
Medicago sativa Whole-root segments Dreyer et al. (2006)
Nicotiana tabacum Whole-root segments Vierheilig et al. (2001)
Phoenix canariensis Root sections Dreyer et al. (2006)
Phoenix dactylifera Root sections Dreyer et al. (2006)
Plantago lanceolata Whole-root segments Gange et al. (1999)
Scutellaria brittonii Whole-root segments Ames et al. (1982)
Senecio vulgaris, Whole-root segments Gange et al. (1999)
Senecio jacobaea Whole-root segments Gange et al. (1999)
Veronica persica Whole-root segments Gange et al. (1999)aGange et al. (1999) also examined the plant species Capsella bursa-pastoris and Poa annua, butas no arbuscules were seen, they were omitted from further analysis
8 Use of the Autofluorescence Properties of AM Fungi 131
researchers followed these indications and excited their root samples with UV-light,
they would surely not have achieved any results, as the AM fungal structures do not
autofluoresce under UV-light excitation but under blue light excitation (Dreyer
et al. 2006). Another reason may be that the literature contains some contradictions
concerning the reasons for autofluorescence. Some studies attribute autofluores-
cence to the dead state of the arbuscules (Vierheilig et al. 1999, 2001), while others
show that all AM fungal structures autofluoresce regardless of their metabolic state
(Dreyer et al. 2006; see Sect. 8.6). Furthermore, it is not known whether the
autofluorescence is due to plant or fungal cell-wall components (see Sect. 8.7).
Finally, it has also to be noted that many laboratories do not possess epifluorescence
microscopes and that non-vital staining is much cheaper, which could explain why
most mycorrhizologists still use non-vital staining for visualization.
To measure autofluorescence, the whole roots, root sections, as well as the
isolated AM fungal structures are mounted in deionized water (pH 7) on slides
for observation at �100, �200 and �400 under the epifluorescence microscope, as
described above.
Figure 8.2 shows some images obtained with the epifluorescence microscope,
where it can be seen that all intra- and extra-radical AM fungal structures,
e.g. hyphae, vesicles, arbuscules and spores, autofluoresce (Fig. 8.2a). The same
autofluorescence pattern is observed in AM fungal structures isolated from roots
(Fig. 8.2b).
Switching between the different possible filter settings of the microscope is
recommended since, although all AM fungal structures autofluoresce under blue
light excitation, some, such as mature spores and some arbuscules, have been shown
to autofluoresce when excited with green light (Fig. 8.2c; Dreyer et al. 2006). No
autofluorescence was found when the sample was irradiated with UV light
(Fig. 8.2d; Dreyer et al. 2006). The only study in which excitation wavelengths
other than those in the blue range were assayed, showed strong emission in all AM
fungal structures under UV, blue and green light irradiation (Jabaji-Hare et al.
1984), emphasising the need to use all possible filter combinations when examining
new material.
Remark: When using whole roots, the autofluorescence detection method is
accurate only for detecting arbuscules and extraradical hyphae and spores (Ames
et al. 1982; Gange et al. 1999; Dreyer et al. 2006). However, when root sections
are used, all AM fungal structures can be detected, with differences, of course,
in their emission intensity (strong autofluorescence of the arbuscules, weak auto-
fluorescence of intra-radical hyphae and vesicles).
Even though it is a time-consuming task to evaluate the degree of mycorrhiza-
tion in a complete root system by producing many root sections (independently
of the visualization method chosen, i.e. staining or autofluorescence), for some non-
annual plants there may be no way of avoiding this, as not all plants are character-
ized by thin root systems that can be easily stained and/or mounted on slides
for microscopy. In addition, it should be remembered that data obtained from
whole-root observations represent qualitative results, while an approach using
sectioned material results in quantitative data (Toth and Toth 1982). Studies dealing
132 B. Dreyer and A. Morte

a
c
e
g
b
d
f
h
67 8
1 54
32
Fig. 8.2 (a) Cross root section of Phoenix canariensis irradiated with blue light, showing
autofluorescing arbuscules and vesicles (arrows). (b) Isolated arbuscule autofluorescing under
blue light excitation. (c) Spores of Glomus intraradices observed under green light excitation. (d)
Same root section as in a, but irradiated with UV light showing no autofluorescence of AM fungal
structures. (e) Longitudinal third-order root section of Phoenix canariensis under blue light
excitation showing autofluorescing arbuscules; arrows correspond to numbers 1–8 from f. (f)
Same section as in e after NBT-staining; numbers 1–8 correspond to arrows in e. (g) Transverse
root section of Phoenix dactylifera showing autofluorescing arbuscules. (h) Same section as in
e stained with trypan blue. Bar = 100 mm. (Dreyer et al. 2006)
8 Use of the Autofluorescence Properties of AM Fungi 133

with the efficiency of the association, e.g. experiments on phosphorus uptake,
require a more quantitative approach. In such cases autofluorescence detection
could be advantageous, not only because staining with harmful stains is avoided,
but because it permits the observation of structures of AM fungi in vivo (Dreyer
et al. 2006).
8.6 Viability of Fungal Structures
The quantity of viable AM fungal structures has been determined by a variety
of methods (Dickson and Smith 1998; Vierheilig et al. 2005). Some of them
use tetrazolium salts that act as electron acceptors for coenzyme-linked cellular
dehydrogenases, which, upon reduction, form highly coloured insoluble com-
pounds, called formazans. In the case of AM roots, nitroblue tetrazolium (NBT)
has frequently been used (MacDonald and Lewis 1978; Smith and Dickson 1991;
Schaffer and Peterson 1993; Vierheilig et al. 2001; Dreyer et al. 2006). NBT is
coupled to the activity of succinate dehydrogenase (SDH), a mitochondrial enzyme,
to produce the purple product formazan. However, colour reactions can range from
purple in isolated AM fungal structures to brown in root sections (Dreyer et al.
2006). The reason for the different staining of the SDH is not known. McGee and
Smith (1990) indicated that both colours were indicators of SDH activity occurring
in the fungal mitochondria and that the blue-purple colour indicated the full
reduction of the tetrazolium salt, while the red-brown colour indicated its partial
reduction.
The staining for succinate dehydrogenase (SDH) activity is performed as
follows:
The stock incubation solution for the determination of the succinate dehydroge-
nase activity consists of (MacDonald and Lewis, 1978):
� Tris buffer, 0,2 M, pH 7,4 2.5 ml
� Nitro-blue tetrazolium (4 mg ml�1) 2.5 ml
� MgCl2 0,05 M 1 ml
� Distilled Water 3 ml
Prior to use, the stock incubation solution is amended with 2.5 M disodium
succinate as follows:
� Stock incubation solution 9 ml
� Disodium succinate solution 1 ml
Remark: The disodium succinate solution is prepared fresh every time, stirring the
solution on a warm plate to dissolve the crystals. All material and samples used
must be stored in the dark as formazan is a photosensitive compound.
Root sections and isolated AM fungal structures are stained directly with this
NBT solution, without further digestion or clearing. The incubation times are 16
and 2 h for root sections and AM fungal structures, respectively (Dreyer et al. 2006).
134 B. Dreyer and A. Morte

Remark: Clearing is necessary in the case of whole roots (Schaffer and Peterson
1993; Brundrett et al. 1994). If samples are counterstained with acid fuchsin then the
viable and total (viable and non-viable) root colonisation can be assessed (Brundrett
et al. 1994; Dickson and Smith 2001).
After incubation in NBT, the fungal structures are washed with deionized water
and mounted on slides for observation. The percentage of arbuscules showing SDH
activity can be calculated.
Figure 8.2e, f show root sections observed by epifluorescence microscopy and
immediately afterwards incubated in an NBT solution. It can be clearly observed
that the arbuscules that autofluoresced were also stained by NBT, from which it
follows that metabolically active arbuscules autofluoresce. In Table 8.3 data of the
percentage of autofluorescing arbuscules showing SDH activity are listed for four
palm species. More than 80% of the autofluorescing arbuscules present in root
sections were metabolically active. In the case of arbuscules isolated from roots of
Phoenix dactylifera, 94% stained positively with NBT (Dreyer et al. 2006). These
results show that both dead and living arbuscules autofluoresced.
For comparison with the results obtained with SDH staining, further root sec-
tions, after their examination with fluorescence microscopy, can be stained over-
night with 0.05% trypan blue in lactic acid without previous digestion or clearing,
and then examined again under bright-field microscopy. Trypan blue is recom-
mended for comparative studies, as it is the most widely used non-vital stain in AM
studies (Gange et al. 1999). The non-vital staining results normally show that the
extent of arbuscular colonization is better detected by autofluorescence than by
trypan blue staining (Figs. 8.2 g, h; Gange et al. 1999). Vierheilig et al. (2001)
showed that clumped autofluorescing arbuscules were not stained by trypan blue.
This could explain why fewer arbuscules are detected by trypan blue staining than
by autofluorescence and indicates further that both dead and living arbuscules can
be detected by autofluorescence. However, the fact that some arbuscules are not
stained by trypan blue could be due to the differential stain penetrability of the roots
of different plant species, and the extent to which the stain is taken up by the fungus,
as demonstrated by Gange et al. (1999). This aspect merits further study, as if
collapsed arbuscules can not be stained by currently used non-vital stains, it would
Table 8.3 Percentage of autofluorescing arbuscules that were metabolically active. (Dreyer
et al. 2006)
Root sections
Percent of succinate
dehydrogenase-active arbusculesaTotal number
of arbuscules
B. armata 88.2 � 2.4 348
C. humilis 83.9 � 3.6 967
P. canariensis 89.0 � 1.9 889
P. dactylifera 82.7 � 5.3 482
Isolated fungal structures
of P. dactylifera93.5 � 2.4 400
aMeans with standard error
8 Use of the Autofluorescence Properties of AM Fungi 135

mean that the counterstaining used in combination with the vital staining in AM
studies, e.g. in Dickson and Smith (2001), would not function either.
8.7 Autofluorescence Localization
The literature contains many contradictions concerning the reasons for autofluor-
escence. It is not known, for example, whether the autofluorescence is due to plant
or fungal cell-wall components. The source of autofluorescence has been shown to
be localized in the fungal cell wall of both hyphae and spores (Dreyer et al. 2006).
However, in arbuscules it was almost impossible to determine whether the fungal
cell wall is the cause of the autofluorescence because of the strong emission
intensity and the small diameter of the arbuscular branches. Although we have
shown that arbuscules isolated from roots still show autofluorescence (see Sect. 8.5)
and thus it can be indirectly inferred that the autofluorescence is due to fungal
material, it is possible that some plant material is still attached or linked to the
arbuscules in spite of the multiple washing steps.
Chitin (Jabaji-Hare et al. 1984) and plant phenolic compounds (Vierheilig et al.
1999, 2001) have been mentioned as candidates for the fluorescing components.
Staining root sections and AM fungal structures for these compounds after auto-
fluorescence detection could therefore serve to characterize the source of autofluor-
escence.
Two methods are presented here that may help visualize these compounds:
Calcofluor white M2R ‘‘new’’ (CFW) is a fluorochrome that stains 1, 4-linked
polymers such as chitin and cellulose (Jensen et al. 1998). For CFW staining, a drop
of a 10% (w/v) potassium hydroxide solution is mixed with a drop of a 0.1% (w/v)
CFW solution on a microscope slide and the root sections or spores are placed in
this mixture. After 1 min, the slides are observed under epifluorescence microscopy.
Fluorescence of CFW-stained AM fungal structures is observed when the sample is
excited with UV-light which, in our microscope, corresponds to the filter cube A
(excitation filter BP 340–380, dichroic mirror RKP 400, barrier filter LP 425). The
CFW-stained structures emit an intense chalk-white colour when illuminated with
UV-light. It has been shown that CFW stains the same parts of the AM fungal
structures that autofluoresce (Dreyer et al. 2006), indicating that chitin might be the
cause of the observed autofluorescence. Unfortunately, CFW stains the cell wall of
both AM fungal structures and plant cells, which hinders documentation by micro-
graphy of the stained fungal structures in root sections (Dreyer et al. 2006). It
should also be considered that fluorescence may depend on molecules other than
chitin or on the interaction of chitin with other cell wall components.
It is known that treatment with ammonium hydroxide can shift the fluorescent
properties of phenolic acids, flavonoids and their derivatives (Harris and Hartley
1976; Mathesius et al. 1998). After examination for autofluorescence at pH 7, fresh
cross-sections can be treated with 0.1 M ammonium hydroxide (pH 10) for 5 min
and then observed for changes in fluorescence intensity and colour under UV- and
136 B. Dreyer and A. Morte
green-illumination. Such a treatment has been shown to cause the fluorescence
intensity of arbuscules to diminish (Dreyer et al. 2006). It can be assumed from this
that the autofluorescing compounds are easily hydrolyzed.
Although it has been shown that the source of autofluorescence is located in the
fungal cell wall of AM fungi, there is still no information on the exact nature of the
compounds of the AM fungal structures responsible for their autofluorescence
patterns. Further studies should be devoted to clarifying this aspect.
8.8 Spore Autofluorescence and Flow Cytometry
Spores of AM fungi also autofluoresced under blue light and green light excitation
(Fig. 8.2c; Dreyer et al. 2006). This spore autofluorescence can be exploited for
counting spore numbers, determining spore size, as well as for detecting and
separating a small number of particular spores from a large mixed population
based on their different autofluorescence patterns (e.g. young versus mature spores)
by means of flow cytometry.
By definition, cytometry means cell measurement. Flow cytometry measures
and analyzes many different physical characteristics of single cells as they move in
a fluid stream and are excited by a laser beam. As cells are exposed to the laser light
they scatter light in different directions and emit fluorescence. Scattered light and
fluorescence are recorded by a coupled electronics system which converts the
detected light signals into electronic signals that can be processed by the computer.
From these, cell properties, such as relative size, relative granularity or internal
complexity and relative fluorescence intensity, can be calculated.
This technique had never been used before to assess AM spores, but preliminary
results with spores of Glomus intraradices and Glomus clarum show that the above
technique may be a very promising tool for evaluating inocula produced on a large
scale (Fig. 8.3; Dreyer et al. 2006). As laser irradiation takes a very short time
(about 2–5 ms spore�1), spores do not suffer any alteration or fluorescence bleach-
ing and could therefore be used subsequently for inoculations or further analysis.
Solutions containing 1,000–10,000 spores per ml are prepared as stated above,
and analysed with a flow cytometer. In our laboratory, we work with a Becton
Dickinson FACSort flow cytometer (Becton Dickinson, Franklin Lakes, NJ) pow-
ered by an argon-ion laser (488 nm). Data are collected for right-angled light scatter
and fluorescence signals in the green (530/30 band pass filter), orange (585/42 band
pass filter) and red (650 long pass filter) regions of the spectrum. Instrument settings
are chosen so that 10,000 events are analysed per sample. Spontaneous settling of
the spores should be minimized by continuous shaking of the sample tubes.
Remark: Some flow cytometry instruments may be additionally equipped with a
sorting feature that permits the physical separation of subpopulations of cells based
on specific cellular characteristics. Thus, it is possible to rapidly separate spore
aliquots into different vials, facilitating the preparation of spore inocula with exact
propagule numbers and physical characteristics. Cell sorting could be performed
8 Use of the Autofluorescence Properties of AM Fungi 137

under sterile conditions and the cells could be collected into various types of
container (Eppendorf tubes or microscope slides).
The usefulness of flow cytometry for detecting AM fungi spores is currently
limited only by the diameter of the fluid system tubes, as the currently available
flow cytometers are only suitable for the analysis of particles or cells ranging from
0.2 to 200 mm in size. Some AM fungal species possess spore sizes bigger than 200
mm, which can not be managed by flow cytometry.
103
104
102
101
100
104
103
102
101
100
104103102101100
104103102101100
FL2
-HF
L3-H
FL2-H
a
b
FL1-H
Fig. 8.3 Spore populations of Glomus clarum analysed by flow cytometry. (a) FL1-H: greenfluorescence, FL2-H: orange fluorescence. (b) FL2-H: orange fluorescence, FL3-H: red fluores-
cence. (Dreyer et al. 2006)
138 B. Dreyer and A. Morte
8.9 Conclusions
This chapter provides information on the different methods tested until now that
exploit the autofluorescence properties of AM fungi for their assessment and
handling. The autofluorescence detection method is probably the only method
that permits AM colonization of roots to be measured in vivo in a non-destructive
manner. The use of this method in conjunction with confocal laser scanning
microscopy may open up a field of multiple opportunities. Spore autofluorescence
can be further used for determining the number, size and other physical characteri-
sitics of spores of AM fungi by flow cytometry.
The fluorescent patterns of AM fungal structures could be used for characteriz-
ing their optical properties and hence their chemical components by optical spec-
troscopy. As we have seen, there are differences in the emission maxima of the
different structures and also between different developmental stages (additional red
light emission coinciding with the mature stage of spores).
It is unfortunate that the advantages of the method of fluorescence detection of
AM fungi have not been fully recognized, but as more laboratories investigate the
possibilities we can expect to see further improvement in the technology and a
wider acceptance of the method.
Acknowledgements BD acknowledges receipt of a grant from the Spanish Ministry of Education
and Science. This work was further supported by the projects FEDER 1FP97-1746 and REN2003-
08241. Authors are indebted to the palm tree producing company, Jardinerıa Huerto del Cura S.A.
(Elche, Spain) for supplying the palms. They also thank Dr. F. Fernandez for supplying G. clarumspores and Dr. M. Honrubia and Dr. C. Rudamas for their useful comments to the manuscript.
References
Abramowitz M (1993) Fluorescence microscopy: the essentials. Olympus Corporation Publishing,
New York
Ames RN, Ingham ER, Reid CPP (1982) Ultraviolet-induced autofluorescence of arbuscular
mycorrhizal root infections: an alternative to clearing and staining methods for assessing
infections. Can J Microbiol 28:351–355
Becard G, Fortin JA (1988) Early events of vesicular-arbuscular mycorrhiza formation on
Ri T-DNA transformed roots. New Phytol 108:211–218
Becard G, Piche Y (1992) Establishment of vesicular-arbuscular mycorrhiza in root-organ culture:
review and proposed methodology. In: Norris JR, Read DJ, Varma AK (eds) Methods in
Microbiology, vol 24. Academic Press, London, pp 89–108
Brundrett M, Melville L, Peterson L (1994) Practical methods in mycorrhizal research. Mycologue
Publications, Waterloo
Brundrett M, Bougher N, Dell B, Grove T, Malajczuk N (1996) Working with mycorrhizas
in forestry and agriculture. ACIAR Monograph 32. Australian Centre for International Agri-
cultural Research, Canberra
Declerck S, Strullu DG, Fortin JA (2005) In Vitro culture of mycorrhizas. Springer, Berlin
Dickson S, Smith SE (1998) Evaluation of vesicular–arbuscular mycorrhizal colonisation by
staining. In: Varma A (ed) Mycorrhiza manual. Springer, Berlin, pp 77–83
8 Use of the Autofluorescence Properties of AM Fungi 139
Dickson S, Smith SE (2001) Cross walls in arbuscular trunk hyphae form after loss of metabolic
activity. New Phytol 151:735–742
Doner LW, Becard G (1991) Solubilization of gellan gels by chelation of cations. Biotechnol Tech
5:25–28
Dreyer B, Morte A, Perez-Gilabert M, Honrubia M (2006) Autofluorescence detection of arbus-
cular mycorrhizal fungal structures in palm roots: an underestimated experimental method.
Mycol Res 110:887–897
Fortin J, Becard G, Declerck S, Dalpe Y, St-Arnaud M, Coughlan A, Piche Y (2002) Arbuscular
mycorrhiza on root-organ cultures. Can J Bot 80:1–20
Gange AC, Bower E, Stagg PG, Aplin DM, Gillam AE, Bracken M (1999) A comparison of
visualization techniques for recording arbuscular mycorrhizal colonization. New Phytol
142:123–132
Gerdemann JW, Nicolson TH (1963) Spores of mycorrhizal Endogone species extracted from soil
by wet sieving and decanting. Transact Brit Mycol Soc 46:235–244
Harris PJ, Hartley RD (1976) Detection of bound ferulic acid in cell walls of the Gramineae by
ultraviolet fluorescence microscopy. Nature 259:508–510
Jabaji-Hare SH, Perumalla CJ, Kendrick WB (1984) Autofluorescence of vesicles, arbuscules, and
intercellular hyphae of a vesicular–arbuscular fungus in leek (Allium porrum) roots. Can J Bot62:2665–2669
Jarstfer A, Sylvia D (1993) Inoculum production and inoculation strategies for vesicular–arbuscular
mycorrhizal fungi. In: Metting F (ed) Soil microbial ecology: applications in agricultural and
environmental management. Marcel Dekker, New York, pp 349–377
Jensen C, Neumeister H, Lysek G (1998) Fluorescence microscopy for the observation of
nematophagous fungi inside soil. Mycologist 12:107–111
MacDonald RM, Lewis M (1978) The occurrence of some acid phosphatases and dehydrogenases
in the vesicular–arbuscular mycorrhizal fungus Glomus mosseae. New Phytol 80:135–141
Mathesius U, Bayliss C, Weinman JJ, Schlaman HRL, Spaink HP, Rolfe BG, McCully ME,
Djordjevic MA (1998) Flavonoids synthesized in cortical cells during nodule initiation are
early developmental markers in white clover. Mol Plant Microbe Interact 11:1223–1232
McGee PA, Smith SE (1990) Activity of succinate dehydrogenase in vesicular–arbuscular mycor-
rhizal fungi after enzymic digestion from roots of Allium porrum. Mycol Res 94:305–308
Menge J (1984) Inoculum production. In: Powell C, Bagyaraj D (eds) VA Mycorrhizae. CRC
Press, Boca Raton, pp 187–203
Phillips JM, Hayman DS (1970) Improved procedures for clearing roots and staining parasitic and
vesicular–arbuscular mycorrhizal fungi for rapid assessment of infection. Transact Brit Mycol
Soc 55:158–161
Saito M (1995) Enzyme activities of the internal hyphae and germinated spores of an arbuscular
mycorrhizal fungus, Gigaspora margarita Becker & Hall. New Phytol 129:425–431
Schaffer GF, Peterson RL (1993) Modifications to clearing methods used in combination with vital
staining of roots colonized with vesicular-arbuscular mycorrhizal fungi. Mycorrhiza 4:29–35
Smith S, Dickson S (1991) Quantification of active vesicular-arbuscular mycorrhizal infection
using image analysis and other techniques. Aust J Plant Physiol 18:637–648
Toth R, Toth D (1982) Quantifying vesicular–arbuscular mycorrhizae using a morphometric
technique. Mycologia 74:182–187
Vierheilig H, Bockenhoff A, Knoblauch M, Juge C, van Bel AJE, Grundler F, Piche Y, Wyss U
(1999) In vivo observations of the arbuscular mycorrhizal fungus Glomus mosseae in roots by
confocal laser scanning microscopy. Mycol Res 103:311–314
Vierheilig H, Knoblauch M, Juergensen K, van Bel AJE, Grundler FMW, Piche Y (2001) Imaging
arbuscular mycorrhizal structures in living roots of Nicotiana tabacum by light, epifluores-
cence, and confocal laser scanning microscopy. Can J Bot 79:231–237
Vierheilig H, Schweiger P, Brundrett M (2005) An overview of methods for the detection and
observation of arbuscular mycorrhizal fungi in roots. Physiol Plant 125:393–404
140 B. Dreyer and A. Morte
Chapter 9
Role of Root Exudates and Rhizosphere
Microflora in the Arbuscular Mycorrhizal
Fungi-Mediated Biocontrol of Phytophthoranicotianae in Tomato
Laetitia Lioussanne, Mario Jolicoeur, and Marc St-Arnaud
9.1 Introduction
Pesticides are still intensively used in modern agriculture in order to counterbalance
yield losses due to disease outbreaks. Fumigants are highly volatile and toxic to
human and environmental health. Other pesticides, also pollutants, are poorly
efficient against soilborne diseases and their use often leads to pathogen resistance.
These products are thus more and more banned. On the other hand, techniques such
as cultural rotation, solarization and the management of biological control agents
constitute simple and environmentally respectful alternatives that would make it
possible to fight soilborne diseases with fewer unwanted side effects. Biological
control (or biocontrol) consists in the reduction of disease damages or pathogen
propagation through the application of antagonistic agents. Arbuscular mycorrhizal
fungi (AMF) are ubiquitous and form a mutualistic symbiosis with most land plants
through which growth and resistance to abiotic and biotic stresses are then generally
increased (Smith and Read 1997). Bioprotection by these fungi has been shown in
many agricultural systems invaded not only by pathogenic soilborne protists, fungi
and nematodes (St-Arnaud and Vujanovic 2007; St-Arnaud et al. 1995a) but also by
insects (Gange 2001; Gange and Nice 1997). This biological control can be
explained through the contribution of diverse, interrelated and often synergistic
mechanisms (St-Arnaud and Vujanovic 2007). The understanding of these mecha-
nisms is a prerequisite in order to optimize AMF management in agriculture.
L. Lioussanne and M. St-Arnaud (*)
Institut de Recherche en Biologie Vegetale, Jardin Botanique de Montreal, 4001 East, Sherbrooke
Street, Montreal, QC, Canada, H1X 2B2
e-mail: [email protected]
M. JolicoeurBio-P2 Research Unit, Department of Chemical Engineering, Ecole Polytechnique de Montreal,
P.O. Box 6079, Centre-ville Station, Montreal, QC, Canada, H3C 3A7
A. Varma and A.C. Kharkwal (eds.), Symbiotic Fungi, Soil Biology 18, 141
DOI: 10.1007/978‐3‐540‐95894‐9_9, # Springer‐Verlag Berlin Heidelberg 2009

Repercussions on the host plant physiology and on the soil microbial communities
after the spread of mycorrhizal inocula or during natural mycorrhizal population
management in the field must be understood and controlled in order to efficiently
use this promising approach of plant disease control.
This chapter focuses particularly on the mechanisms implicated in the biocontrol
which AMF induce in tomato plants infected by the soilborne pathogen
Phytophthora nicotianae. The present paper focuses particularly on the role of
root exudates. P. nicotianae mainly proliferates through asexual reproduction that
leads to the massive liberation of mobile spores, making it a sensitive tool allowing
dissecting the effect of AMF on pathogen development in the soil, before root
infection.
9.2 Zoospore Chemotaxy in P. nicotianae
P. nicotianae Breda de Haan, 1896, is a filamentous stramenopile of the order
Oomycete, family Pythiaceae. Its virulence was shown over 72 genera and 40
families of angiosperms (Satour and Butler 1967) and it is responsible for important
yield losses of various agricultural crops and fruit trees, including tomato. This
pathogen essentially invades roots, but necroses, fades and biomass decreases have
also been reported on shoots of sensitive plants. Strategies to fight its propagation
mainly involve cultural rotation, soil disinfection, and fungicide drenches.
The genus Phytophthora possesses a diploid life cycle (meiosis happens when
reproductive cells are formed). It proliferates mainly by the spread of mobile spores
(zoospores), formed during asexual reproduction (Erwin and Ribeiro 1996).
The reduction in the number of zoospores attracted by roots, their encystment and
germination and then ability to form appressoria on root surface allow the plant to
efficiently activate defense pathways and to limit infection. Conversely, if these
preinfection steps are not hampered, many cycles of zoospore production occur and
the pathogen proliferates and rapidly induces diseases symptoms.
The conditions that lead to zoospore formation are high temperature (between
20�C and 25�C) and humidity. Sporangia, formed at the extremities of hyphae,
differentiate zoospores that swim towards roots, in the soil solution. Zoospores are
mostly attracted by the subapices of roots where most exudates are liberated, and
their lifespan is strongly influenced by environmental conditions (Ho and Hickman
1967a, b).
Chemotaxy of zoospores by root exudates (Deacon 1996; Deacon and Donaldson
1993) and by ethanol, sugars, amino acids, organic acids, secondary metabolites,
and volatiles (Allen and Newhook 1973; Donaldson and Deacon 1993a, b; Halsall
1975; Hickman 1970; Jones et al. 1991; Leano et al. 1998) has been shown in vitro.Attraction depends on pH (Morris et al. 1995), on the experimental conditions
(Deacon and Donaldson 1993), and is strain- and species-dependent: the more a
species is host-specific, the more its zoospores are attracted by specific molecules.
For example, the zoospores liberated by Phytophthora sojae, which is virulent
142 L. Lioussanne et al.
on soybean only, were only attracted by the flavonoids dadzeine and genisteine
(Connolly et al. 1999; Morris and Ward 1992). Zoospores of P. nicotianae were
shown to be attracted by various sugars (sucrose, dextrose, fructose, rhamnose, and
maltose) but also to a lower degree by amino acids (asparagine and glutamine
especially) (Dukes and Apple 1961; Halsall 1975). The activation of receptors
would be implicated in chemotaxy: zoospores do not take up nutrients (Deacon
and Donaldson 1993) and their aggregation is induced by antibodies (Addepalli and
Fujita 2001; Estrada-Garcia et al. 1990; Hardham et al. 1994). Nonetheless, they
have been shown to be attracted by the anode in an electric field (Khew and
Zentmyer 1973; Morris et al. 1995; van West et al. 2003) and to autoaggregate
(Reid et al. 1995).
9.3 Biocontrol Mediated by AMF on P. nicotianaeInfecting Tomato
The AMF-mediated biocontrol of the root disease caused by P. nicotianae on
tomato plants has been the object of much interest in the last decade. Colonization
with Glomus mosseae (Nicol. and Gerd.) Gerdemann and Trappe (BEG 12) was
shown to protect tomato plants subsequently infected by P. nicotianae. Reductionsof the number of infection loci, of the level of root necroses, of intraradical
pathogen development and of the biomass loss caused by the pathogen as compared
to nonmycorrhizal plants were documented (Cordier et al. 1996; Pozo et al. 2002a;
Trotta et al. 1996; Vigo et al. 2000). Using a compartmented soil system in
which tomato plants were first colonized with either Glomus mosseae or Glomusintraradices Schenck and Smith (DAOM 181,602) and then exposed to infection
with P. nicotianae, we recently showed that G. intraradices express a similar
biocontrol ability to that of G. mosseae (Lioussanne et al. 2006a), contrary to the
observations of Pozo et al. (2002a), who used another G. intraradices strain
(BEG 72). The pathogen biomass was significantly reduced within tomato roots
precolonized with both AM fungi in comparison to nonmycorrhizal plants. In plants
colonized with G. mosseae, the reduction of pathogen development was shown to
be systemic and to happen not only in mycorrhizal root tissues but also in non-
colonized parts of the root system (Pozo et al. 2002b).
9.4 Induction of Tomato Plant Defense Mechanisms
Following Mycorrhizal Colonization
The stimulation of tomato plant defense pathways has been shown. Constitutive
synthesis of b-1,3-glucanase, and new isoforms of b-1,3-glucanase and chitinase
have been detected within roots colonized with G. mosseae (Pozo et al. 1996, 1998,1999). However, these changes were shown not to be systemic (Pozo et al. 2002a).
9 Role of Root Exudates and Rhizosphere Microflora in the Arbuscular 143
Nonetheless, Cordier et al. (1998) identified in nonmycorrhizal roots of plants
colonized with G. mosseae and infected with P. nicotianae, not only local cell
wall modifications such as the accumulation of callose around cortical cells con-
taining arbuscules, but also the accumulation of PR-1 proteins and cell wall
thickenings rich in pectin characteristic of induced systemic resistance (ISR). The
stimulation of defense pathways seems therefore to play an important role in AMF
biocontrol of plant diseases, and is supported by a large body of evidence (Pozo and
Azcon-Aguilar 2007; St-Arnaud and Vujanovic 2007). Meanwhile, the activity of a
new isoform of superoxide dismutase was detected after colonization not only with
G. mosseae but also withG. intraradices (BEG 72), which did not induce biocontrol
(Pozo et al. 2002a). Moreover, the reduction of the total number of infection loci in
tomato plants inoculated with P. nicotianae (Vigo et al. 2000) suggests that the
proliferation of the pathogen would be inhibited before it penetrates mycorrhizal
roots within the soil.
Jasmonic acid (JA) is an essential hormone implicated in the ISR provoked by
rhizobacteria (Pozo et al. 2004) that also accumulates within mycorrhizal roots
(Hause et al. 2002, 2007; Isayenkov et al. 2005; Stumpe et al. 2005), in a nonsys-
temic manner (Meixner et al. 2005). The application of JA on Tropaeolum majusand on Carica papaya leaves strongly reduced colonization by G. mosseae(Ludwig-Muller et al. 2002). The overexpression of the gene MtAOC1 coding for
the JA-biosynthetic enzyme allene oxide cyclase increased the level of this hor-
mone but reduced the level of mycorrhizal colonization (Hause et al. 2007). JA is
involved in defense responses after biotic and abiotic stresses and would permit the
regulation of the mycorrhizal symbiosis. Its accumulation within cortical cells
containing arbuscules (Hause et al. 2002) could also play a role in the reduction
of pathogen proliferation, especially within colonized cells where hyphae of
P. nicotianae were never observed in the same cells as those containing G. mosseae(Cordier et al. 1996). However, a demonstration that AMF induce biocontrol via
reactions implicating JA has yet to be published.
9.5 Effect of Mycorrhizal Root Exudates on P. nicotianaeZoospore Chemotaxy In Vitro
Transformation of plants with Agrobacterium rhizogenes allowed isolated root
lines to grow in vitro (Labour et al. 2003), and greatly simplified the study of
interactions between roots, AMF and pathogens (Fortin et al. 2002; St-Arnaud et al.
1995b). Taking advantage of this approach, an in vitro bi-compartmental Magenta
box system was designed to collect exudates liberated by transformed tomato roots
colonized or not with the G. intraradices DAOM 181,602, without interference of
other soil microorganisms (Lioussanne et al. 2008). Capillaries were then filled
with exudates and exposed to zoospore suspensions of P. nicotianae (ATCC
13 196). Exudates collected from mature mycorrhizal roots attracted significantly
144 L. Lioussanne et al.
less zoospores than water or exudates from nonmycorrhizal roots. The opposite was
observed with actively growing roots, with exudates from mycorrhizal roots being
more attractive than exudates from nonmycorrhizal roots. These results suggested
that higher amounts of attractive molecules may be released by young mycorrhizal
roots compared to noncolonized roots, while older mycorrhizal roots would contain
repulsive molecules. Accumulation of the secondary metabolite blumenin within
barley and wheat roots colonized with G. intraradices has been shown to be low
when roots were 2 weeks old, reaching a maximum level when roots were 3–4
weeks old and being detected only in trace amounts when roots were older than
5 weeks (Fester et al. 1999). The liberation of attractive or repulsive compounds
could also vary according to the roots and the AMF development stage.
Quantitative and qualitative changes in root exudation after mycorrhizal coloni-
zation have often been reported (Azaizeh et al. 1995; Bansal and Mukerji 1994;
Graham et al. 1981; Kapoor et al. 2000; Marschner et al. 1997; Sood 2003).
However, among 27 sugars, amino acids and organic acids quantified within root
exudates, only proline and isocitric acid concentrations differed between mycor-
rhizal and nonmycorrhizal roots. Proline concentration in exudates liberated by
mature mycorrhizal roots was higher than in exudates from nonmycorrhizal roots
and from younger roots (Lioussanne et al. 2008). Proline accumulates and is
involved in plant protection against water and salt stresses (Kishor et al. 2005;
Kuznetsov and Shevyakova 1999; Rai 2002; Sharma and Dietz 2006). It also accu-
mulated in tomato leaves following infection withP. nicotianae (Grote and Claussen2001) and in the cortex of Theobroma cacao after infection with P. megakarya(Omokolo et al. 2002). The accumulation of proline after colonization with AMF
has been reported (Azcon et al. 1996; Diouf et al. 2005; Ruiz-Lozano et al. 1995;
Vazquez et al. 2001; Wu and Xia 2006). These results suggest that proline may
be implicated in the biocontrol induced by AMF on tomato plants infected by
P. nicotianae, reducing the accumulation of zoospores in the vicinity of roots.
Glomalin is yet the only protein detected from AMF structures that favors soil
aggregation (Wright and Upadhyaya 1998; Wright et al. 1996, 1999). Its impact on
pathogen has nonetheless never been studied. Root colonization with AMF has been
shown to inhibit further mycorrhizal colonization systemically (Vierheilig 2004;
Vierheilig et al. 2000a). Modification of root exudation after mycorrhizal coloniza-
tion would be at the origin of this regulation (Pinior et al. 1999; Vierheilig 2004;
Vierheilig and Piche 2002; Vierheilig et al. 2003). The flavonoids acacetin and
rhamnetin (Scervino et al. 2005), and the carotenoid-derived isoprenoids blumenin,
mycorradicin and nicoblumin have been shown to be accumulated within mycor-
rhizal roots (Fester et al. 1999, 2002a, b, 2005; Strack and Fester 2006; Vierheilig
et al. 2000b). Blumenin applied on barley split-root systems resulted in the systemic
suppression of colonization of already mycorrhizal roots (Strack and Fester 2006).
Moreover, some carotenoid-derived compounds isolated from maize exudates have
been shown to be responsible for the inhibition of Fusarium oxysporum f. sp.
melongenae induced by resistant maize plants (Park et al. 2004). Thus, the mole-
cules regulating mycorrhizal symbiosis may also play a significant role in the
inhibition of soil-borne pathogens within the mycorrhizosphere or colonized roots.
9 Role of Root Exudates and Rhizosphere Microflora in the Arbuscular 145

9.6 Effect of Mycorrhizal Root Exudates on Tomato
Infection by P. nicotianae in Soil
Our group recently studied the role of mycorrhizal root exudates in the biocontrol of
P. nicotianae in tomato plants in soil. Tomato plants with different mycorrhizal
inoculation or root exudate treatments were grown individually in a compartmen-
talized system and placed equidistant from a central unit inoculated with
P. nicotianae. Half of the plants were filled with root exudates collected from
tomato plants colonized with either G. mosseae or G. intraradices or from non-
mycorrhizal plants. The other half was not supplied with root exudates but was
inoculated with the same two AMF species or left noninoculated. As expected,
direct tomato root colonization significantly reduced the intraradical growth of
P. nicotianae, while the application of mycorrhizal root exudates did not affect
the growth of the pathogen which colonized roots to the same extent as in the
nonmycorrhizal plants (Lioussanne et al. 2006a). While a differential attraction of
zoospores by mycorrhizal root exudates was noted in vitro, root infection was not
affected by the application of mycorrhizal root exudates in a more complex soil
system. Other authors also observed that exudates from AMF structures or from
mycorrhizal roots affected the formation and/or the germination of pathogen
propagules. It was observed that germination and hyphal growth of F. oxysporumf. sp. chrysanthemi was stimulated when conidia were inoculated directly onto a
G. intraradices mycelium in vitro (St-Arnaud et al. 1995b). On the other hand,
Filion et al. (1999) showed that crude extracts of in vitro-grown G. intraradicesmycelium reduced germination of F. oxysporum conidia. Analogous inhibitive
effects were also reported with exudates liberated by strawberry roots colonized
by G. etunicatum or G. monosporum, on the sporangia production of the pathogen
Phytophthora fragariae in vitro (Norman and Hooker 2000). More recently, micro-
conidia germination of F. oxysporum f. sp. lycopersici was shown to be more than
doubled in the presence of root exudates from tomatoes colonized with G. mosseaecompared to nonmycorrhizal plants. The more the tomato roots were colonized by
the AMF, the more microconidia germination was increased, suggesting a relation
between the level of root colonization and the alteration of exudation pattern
(Scheffknecht et al. 2006). A similar stimulatory effect was exhibited by root
exudates of twelve F. oxysporum lycopersici nonhost species from eight plant
families, showing that mycorrhization-induced changes in the root exudates were
unrelated to the pathogen sensitivity of the plant (Scheffknecht et al. 2007).
Even if exudates frommycorrhizal plants were shown to affect the formation, the
attraction and/or the germination of various pathogen propagules, the mycorrhizal-
induced modifications would not interfere with the proliferation of P. nicotianaewithin host tissues (Lioussanne et al. 2006a). Moreover, it was shown that applica-
tion of carbenzamine, a fungicide reducing mycorrhizal colonization, had also the
effect of increasing the Aphanomyces euteiches oospores number in pea roots
(Bødker et al. 2002). In this experiment, mycorrhizal colonization extent was not
correlated with disease severity. From this, the authors suggested that AMFmay not
146 L. Lioussanne et al.

impact on the vegetative growth, causing root necrosis, of the P. nicotianae-relatedpathogen A. euteiches, but only on its capacity to form reproductive structures.
9.7 Effect of Mycorrhizal Root Exudates on the
Rhizosphere Bacterial Community Structure
Mycorrhizal colonization was shown to modify the bacterial community
structure of the rhizosphere (Marschner and Timonen 2005; Marschner et al.
2001; Wamberg et al. 2003). Among the possible mechanisms involved in this
process, modification in root exudation has been suggested (Bansal and Mukerji
1994; Marschner et al. 1997). Filion et al. (1999) observed in vitro that extracts
from G. intraradices mycelium had differential effects on soil microbes, stimulat-
ing the growth of Pseudomonas chlororaphis and Trichoderma harzianum,reducing germination of F. oxysporum, and having no effect on the growth of
Clavibacter michiganensis. Sood (2003) also reported that the chemotactic re-
sponse of the plant-growth-promoting rhizobacteria Azotobacter chroococcumand Pseudomonas fluorescens were significantly stronger towards exudates of
tomatoes colonized with G. fasciculatum than towards exudates of nonmycorrhizal
roots. The utilization of the PCR-DGGE technique on the ribosomal gene 16S
permitted Lioussanne et al. (2006a) to efficiently characterize the bacterial com-
munity structure within the rhizosphere of tomato exposed to mycorrhizal root
exudates or direct AMF inoculation. As shown before, root colonization with either
G. mosseae or G. intraradices had a significant impact. However, the bacterial
community structure of rhizosphere supplied with exudates from tomatoes colo-
nized with the same AMF isolates was not significantly different from the one of
tomatoes supplied with exudates from nonmycorrhizal-tomatoes. These results
suggest that the modification of the rhizosphere bacterial community structure
induced by mycorrhizal colonization would not be mediated by root exudation
modification. If bacterial community structure changes in mycorrhizal rhizosphere
were involved in the AMF-mediated biocontrol, it would not depend on changes in
root exudation pattern.
The high microbial activity present in the rhizosphere in comparison to the bulk-
soil was often believed to be due to the supply of nutrients liberated by the roots in
the form of exudates. Soil or rhizosphere enrichment with artificial exudates shifted
the microbial community structure more and more consistently as substrate con-
centration load increased (Baudoin et al. 2003; Griffiths et al. 1999; Kozdroj
and van Elsas 2000; Pennanen et al. 2004). The modification of the amount of
root exudate after mycorrhizal colonization would not be important enough to
induce significant bacterial community changes. Lynch and Whipps (1990) calcu-
lated that exudates contained only 9–10% of the amount of substrate required to
explain the quantified microbial biomass in the rhizosphere of barley and maize.
Lugtenberg and colleagues (1999) reported that the ability of the biocontrol bacteria
9 Role of Root Exudates and Rhizosphere Microflora in the Arbuscular 147

P. fluorescens WCS365 to use sugars, an important exudate constituent, does not
play a major role in tomato root colonization. They showed that the mutant
PCL1083 from WCS365, impaired in the ability to grow on simple sugars, reached
the same population level at the root tip as the wild-type strain, when inoculated on
germinated tomato seeds. Additionally, it was demonstrated that the bioavailability
of some amino acids detected in tomato exudates is too low to support root tip
colonization by auxotrophic mutants of P. fluorescens strain WCS365. The genes
required for amino acid synthesis are therefore necessary for root colonization
(Simons et al. 1997).
On the other hand, it has been shown that roots constitute a physical support
essential for rhizosphere competence of specific soil bacteria. Mutants of P. chlor-oraphis strain PCL1391 impaired in the known tomato root colonization traits
(motility and production of the site-specific recombinase) were not able to control
F. oxysporum f. sp. radicis-lycopersici contrarily to the wild-type strain (Chin et al.2000). Root colonization thus plays a crucial role in biocontrol for bacteria. The
presence of AMF structures may also be essential for bacterial competence within
the mycorrhizosphere and, if so, for their contribution to biocontrol. They may
extend the soil area colonized by an AMF-modified bacterial community to the
mycorrhizosphere which is far larger than the rhizosphere, and in this manner favor
their competition on soilborne pathogens.
Physical interactions between bacteria and AMF have been described. The
capacity of rhizobia and pseudomonads to adhere to Gigaspora margarita spores
and hyphae under sterile conditions has been reported to be strain-dependent
(Bianciotto et al. 1996a). The first stages of attachment (nonreceptor-dependent)
would be governed by general physiochemical parameters, such as electrostatic
attraction, and then later secured by specific bacterial cell surface components.
The capacity to adhere to G. intraradices structures by different bacterial species
was shown to depend on the capacity to form biofilms as mutants affected in the
production of extracellular polysaccharides (EPS) essential for biofilm formation
were strongly impaired in their capacity to attach to both mycorrhizal roots and
AMF mycelium (Bianciotto et al. 2001a). Furthermore, mucoid mutants of the
biocontrol strain P. fluorescens CHAO (with an alginate biosynthesis activation)
adhered more importantly to the surface of this fungus than the wild type strain
(Bianciotto et al. 2001b). Toljander et al. (2006) also reported that the attachment of
different bacteria to AMF extraradical hyphae depended on the bacterial species
and on the fungal species and vitality. Levy et al. (2003) reported the colonization
of both hyphae and spores of G. decipiens by Burkholderia spp. The spore’s outer
layer of G. geosporum was shown to be eroded and covered by mucilaginous
products, which suggests that AMF are directly consumed by bacteria (Roesti
et al. 2005). AMF may specifically favor the proliferation of some bacteria,
serving as substrate or interacting with them, favoring the formation of biofilms.
G. mosseae was shown to increase the population of the biocontrol agent
P. fluorescens within the tomato and leek rhizosphere (Edwards et al. 1998).
Nonetheless, AMF have negative effects on the biomass of some soil bacteria
(Bansal and Mukerji 1994; Cavagnaro et al. 2006; Christensen and Jakobsen
148 L. Lioussanne et al.

1993; Ravnskov et al. 1999), probably because of competition for inorganic nutri-
ents. Bacteria able to form biofilms and/or to use AMF structures as substrate would
then establish within the mycorrhizosphere. Some of them could act as antagonists
among soilborne pathogens, as many soil bacteria have been shown to act as
biocontrol agents (Bowen and Rovira 1999).
Contrarily to the two AMF species, the inoculation of P. nicotianae did
not significantly modify bacterial community structure of tomato rhizosphere
(Lioussanne et al. 2006a). Moreover, the impact of AMF on the bacterial commu-
nity structure was not significantly affected by the inoculation of P. nicotianae.Similarly, the bacterial community analyzed using PCR-DGGE in hydroponic
systems used for tomato growth was not much perturbed by the introduction of
P. cryptogea or Pythium aphanidermatum (Calvo-Bado et al. 2006). The bacterial
community associated with the rhizosphere of avocado infected with the
pathogen P. cinnamomi and receiving repetitive applications of the biocontrol
agent P. fluorescens was also shown to be similar to the rhizosphere of healthy
roots, but to be significantly different from the rhizosphere of plants infected with
the pathogen only (Yang et al. 2001). Therefore, pathogens such as P. nicotianaewould weakly impact on the rhizosphere microflora in comparison to biocontrol
agents. If AMF stimulate biocontrol agents within the mycorrhizosphere, their
establishment, which would then efficiently antagonize the pathogen proliferation,
would be poorly affected by pathogen infection.
9.7.1 Antagonistic Potential of Bacteria Associated withSpores of G. mosseae
Through surface disinfection of spores of G. mosseae and inoculation on a standardculture medium, Lioussanne et al. (2006b) obtained 18 bacterial isolates. Sequenc-
ing of the 16Sr RNA gene permitted their classification among nine different
clusters. These isolates belonged to three genera: Paenibacillus, Bacillus, andMethylobacterium. Comparatively, 34 sequence variants were observed from direct
DNA extracts of identically treated spores of G. mosseae, using PCR-DGGE of the
16S rRNA gene. Isolates identified as B. simplex, B. niacini, B. drententis, Paeni-bacillus spp. and Bacillus sp. were, in vitro, antagonistic against P. nicotianae, butalso against F. solani and F. oxysporum. A Paenibacillus sp. strain B2 that was
previously isolated from the mycorrhizosphere of G. mosseae also induced antago-nism against P. nicotianae, in vitro and in vivo, and was shown to reduce the root
necroses formed by this pathogen (Budi et al. 1999). By electron microscopy, strain
B2 was shown to disorganize the cell walls of P. parasitica and F. oxysporum (Budi
et al. 2000). The antibiotic polymyxine B1 and other analogue compounds (antag-
onistic among F. solani and F. acuminatum) were further identified within exudatesfrom the same Paenibacillus strain (Selim et al. 2005).
Paenibacillus, Bacillus, and Methylobacterium taxa were previously identified
in plant mycorrhizosphere or from soil AMF structures. About 80–92% of the
9 Role of Root Exudates and Rhizosphere Microflora in the Arbuscular 149
bacteria isolated from decontaminated spores of G. clarum NT4 were Bacillus(Xavier and Germida 2003). Using bromodeoxydurine immunocapture in soil
known to contain AMF and through RFLP analysis, Artursson and Jansson
(2003) mostly identified Bacillus and Paenibacillus taxa. Paenibacillus was alsolargely identified by FAME analysis in sterilized root-free sand extracts after
G. intraradices inoculation but not in the AMF mycelium-free control (Mansfeld-
Giese et al. 2002).
Other bacteria were isolated from extraradical and intraradical AMF structures
or from the hyphosphere (the zone of soil influenced by AMF) (Andrade et al. 1997;
Artursson and Jansson 2003; Filippi et al. 1998; MacDonald et al. 1982; Mansfeld-
Giese et al. 2002; Mayo et al. 1986; Secilia and Bagyaraj 1987; Xavier and Germida
2003). Moreover, Candidatus Glomeribacter gigasporarum (Burkholderiaceae), anoncultivable (thus obligatory) bacterial endosymbiot was described from spores
(within the vacuoles), mycelium and clover intraradical hyphae of G. margarita(Bianciotto and Bonfante 2002; Bianciotto et al. 2003; Bianciotto et al. 1996b;
Bianciotto et al. 2004). This endobacterium was later phenotypically described in
detail (Jargeat et al. 2004) and shown to be widespread within Gigasporaceae(Bonfante 2003). AMF inoculation from nonaxenically produced inocula is thus
accompanied by associated bacteria that would establish within the mycorrhizo-
sphere. These bacteria may have a significant contribution in the biocontrol that
AMF induce on soilborne pathogens. They would also be implicated in the mod-
ifications of the bacterial community structure detected within the rhizosphere after
AMF inoculation (Lioussanne et al. 2006a).
9.7.2 Other Mechanisms Contributing to the BiocontrolInduced by AMF on P. nicotianae
Through PLFA profile analysis, Larsen and Bødker (2001) showed a decrease in the
biomass and energy reserves of both G. mosseae and A. euteiches coinoculated on
pea roots. It has been observed that P. nicotianae and G. mosseae never occupied
simultaneously the same root tissues (Cordier et al. 1996). Decrease in the extent of
mycorrhizal colonization driven by different pathogens has also been reported
(Baath and Hayman 1983; Davis and Menge 1980; Krishna and Bagyaraj 1983).
AMF may thus compete with pathogens for space and nutrients.
P. nicotianae is a soilborne pathogen causing root necrosis. In conditions of
water or nutrient deficiencies, the decreased number of functional roots normally
encountered in diseased plants hampers the plant’s ability to access nutrients and
water, making it more prone to death if drought conditions happen. It is well known
that AMF increase plants’ access to nutrients and water, reducing damages caused
by water stress (Smith and Read 1997). Therefore, higher biomass and ramification
measured in mycorrhizal versus nonmycorrhizal plants (Norman et al. 1996)
exposed to pathogenic infections may be related to the increased capacity of the
150 L. Lioussanne et al.

mycorrhizal roots to access resources, counterbalancing weight loss caused by the
pathogen. Increasing inorganic phosphate supply to tomato plants inoculated with
P. nicotianae, Trotta et al. (1996) did not observe a reduction of disease symptoms
similar to that induced by G. mosseae inoculation, showing that the increase
in phosphorus nutrition by mycorrhizal colonization, often suggested as being
importantly implicated in the biocontrol induced by AMF, would not be involved
in the biocontrol in this system.
9.8 Conclusions
G. mosseae but also G. intraradices (DAOM 181 602) have been shown to induce
biocontrol on tomato plants inoculated with P. nicotianae locally (within root
tissues colonized with AMF), and also systemically (in the case of G. mosseae).Local and systemic plant defense reactions are obviously important factors which
hamper the pathogen proliferation within host tissues and decrease the extent of
disease symptoms. As our understanding of signalling pathways and of the roles of
molecules such as jasmonic acid increases, we should be able to unravel the
complex cascade of events leading to the AMF-mediated biocontrol. The quicker
and upper activation of host defense pathways does not however allow us to explain
every characteristic of biocontrol. Changes in root exudates after mycorrhizal
colonization would not directly or indirectly (by modification of the rhizosphere
bacterial community structure) diminish the pathogen ability to infect roots. How-
ever, bacteria identified within or onto the surface of mycorrhizal structures may
help to reduce the pathogen proliferation not only within the soil but also within
roots. These bacteria could contribute to the biocontrol conferred by AMF through
several mechanisms such as the formation of a suppressive area near the mycorrhi-
zal network and/or the stimulation of the plant defense reactions, but also to the
overall plant health through other beneficial effects on plant nutrition, growth and
metabolism.
References
Addepalli MK, Fujita Y (2001) Serological detection of red rot disease initiation stages of
microbial pathogen, Pythium porphyrae (Oomycota) on Porphyra yezoensis. J Appl Phycol13:221–227
Allen RN, Newhook FJ (1973) Chemotaxis of zoospores of Phytophthora cinnamomi to ethanol incapillaires of soil pore dimensions. Trans Br Mycol Soc 61:287–302
Andrade G, Mihara KL, Linderman RG, Bethlenfalvay GJ (1997) Bacteria from rhizosphere and
hyphosphere soils of different arbuscular–mycorrhizal fungi. Plant Soil 192:71–79
Artursson V, Jansson JK (2003) Use of bromodeoxyuridine immunocapture to identify active
bacteria associated with arbuscular mycorrhizal hyphae. Appl Environ Microbiol 69:6208–6215
9 Role of Root Exudates and Rhizosphere Microflora in the Arbuscular 151

Azaizeh HA, Marschner H, Romheld V, Wittenmayer L (1995) Effects of a vesicular–arbuscular
mycorrhizal fungus and other soil microorganisms on growth, mineral nutrient acquisition and
root exudation of soil-grown maize plants. Mycorrhiza 5:321–327
Azcon R, Gomez M, Tobar R (1996) Physiological and nutritional responses by Lactuca sativa to
nitrogen sources and mycorrhizal fungi under drought conditions. Biol Fertil Soil 22:156–161
Baath E, Hayman DS (1983) Plant growth responses to vesicular–arbuscular mycorrhizae XIV.
Interactions with Verticillium wilt on tomato plants. New Phytol 95:419–426
Bansal M, Mukerji KG (1994) Positive correlation between VAM-induced changes in root
exudation and mycorrhizosphere mycoflora. Mycorrhiza 5:39–44
Baudoin E, Benizri E, Guckert A (2003) Impact of artificial root exudates on the bacterial
community structure in bulk soil and maize rhizosphere. Soil Biol Biochem 35:1183–1192
Bianciotto V, Bonfante P (2002) Arbuscular mycorrhizal fungi: a specialised niche for rhizo-
spheric and endocellular bacteria. Anton Leeuw Int J G 81:365–371
Bianciotto V, Minerdi D, Perotto S, Bonfante P (1996a) Cellular interactions between arbuscular
mycorrhizal fungi and rhizosphere bacteria. Protoplasma 193:123–131
Bianciotto V, Bandi C, Minerdi D, Sironi M, Tichy HV, Bonfante P (1996b) An obligately
endosymbiotic mycorrhizal fungus itself harbors obligately intracellular bacteria. Appl Envi-
ron Microbiol 62:3005–3010
Bianciotto V, Andreotti S, Balestrini R, Bonfante P, Perotto S (2001a) Extracellular polysacchar-
ides are involved in the attachment of Azospirillum brasilense and Rhizobium leguminosarumto arbuscular mycorrhizal structures. Eur J Histochem 45:39–49
Bianciotto V, Andreotti S, Balestrini R, Bonfante P, Perotto S (2001b) Mucoid mutants of the
biocontrol strain Pseudomonas fluorescens CHA0 show increased ability in biofilm formation
on mycorrhizal and nonmycorrhizal carrot roots. Mol Plant Microbe Int 14:255–260
Bianciotto V, Lumini E, Bonfante P, Vandamme P (2003) ‘Candidatus Glomeribacter gigaspor-
arum’ gen. nov., sp nov., an endosymbiont of arbuscular mycorrhizal fungi. Int J Syst Evol
Micr 53:121–124
Bianciotto V, Genre A, Jargeat P, Lumini E, Becard G, Bonfante P (2004) Vertical transmission of
endobacteria in the arbuscular mycorrhizal fungus Gigaspora margarita through generation ofvegetative spores. Appl Environ Microbiol 70:3600–3608
Bødker L, Kjøller R, Kristensen K, Rosendahl S (2002) Interactions between indigenous arbus-
cular mycorrhizal fungi and Aphanomyces euteiches in field-grown pea. Mycorrhiza 12:7–12
Bonfante P (2003) Plants, mycorrhizal fungi and endobacteria: a dialog among cells and genomes.
Biol Bull 204:215–220
Bowen GD, Rovira AD (1999) The rhizosphere and its management to improve plant growth.
Advn Agron 66:1–102
Budi SW, van Tuinen D, Martinotti G, Gianinazzi S (1999) Isolation from the Sorghum bicolormycorrhizosphere of a bacterium compatible with arbuscular mycorrhiza development and
antagonistic towards soilborne fungal pathogens. Appl Environ Microbiol 65:5148–5150
Budi SW, van Tuinen D, Arnould C, Dumas-Gaudot E, Gianinazzi-Pearson V, Gianinazzi S
(2000) Hydrolytic enzyme activity of Paenibacillus sp. strain B2 and effects of the antagonisticbacterium on cell integrity of two soil-borne pathogenic fungi. Appl Soil Ecol 15:191–199
Calvo-Bado LA, Petch G, Parsons NR, Morgan JAW, Pettitt TR, Whipps JM (2006) Microbial
community responses associated with the development of oomycete plant pathogens on tomato
roots in soilless growing systems. J Appl Microbiol 100:1194–1207
Cavagnaro TR, Jackson LE, Six J, Ferris H, Goyal S, Asami D, Scow KM (2006) Arbuscular
mycorrhizas, microbial communities, nutrient availability, and soil aggregates in organic
tomato production. Plant Soil 282:209–225
Chin A, Woeng TFC, Bloemberg GV, Mulders IHM, Dekkers LC, Lugtenberg BJJ (2000) Root
colonization by phenazine-1-carboxamide-producing bacterium Pseudomonas chlororaphisPCL1391 is essential for biocontrol of tomato foot and root rot. Mol Plant Microbe Int
13:1340–1345
152 L. Lioussanne et al.

Christensen H, Jakobsen I (1993) Reduction of bacterial growth by a vesicular–arbuscular mycor-
rhizal fungus in the rhizosphere of cucumber (Cucumis sativus L). Biol Fertil Soil 15:253–258Connolly MS, Williams N, Heckman CA, Morris PF (1999) Soybean isoflavones trigger a calcium
influx in Phytophthora sojae. Fungal Genet Biol 28:6–11Cordier C, Gianinazzi S, Gianinazzi-Pearson V (1996) Colonisation patterns of root tissues by
Phytophthora nicotianae var. parasitica related to reduced disease in mycorrhizal tomato.
Plant Soil 185:223–232
Cordier C, Pozo MJ, Barea JM, Gianinazzi S, Gianinazzi-Pearson V (1998) Cell defense responses
associated with localized and systemic resistance to Phytophthora parasitica induced in
tomato by an arbuscular mycorrhizal fungus. Mol Plant Microbe Int 11:1017–1028
Davis RM, Menge JA (1980) Influence of Glomus fasciculatus and soil phosphorus on Phy-
tophthora root rot of Citrus. Phytopathology 70:447–452
Deacon JW (1996) Ecological implications of recognition events in the pre-infection stages of root
pathogens. New Phytol 133:135–145
Deacon JW, Donaldson SP (1993) Molecular recognition in the homing responses of zoosporic
fungi, with special reference to Pythium and Phytophthora. Mycol Res 97:1153–1171
Diouf D, Duponnois R, Ba AT, Neyra M, Lesueur D (2005) Symbiosis of Acacia auriculiformisand Acacia mangium with mycorrhizal fungi and Bradyrhizobium spp. improves salt tolerance
in greenhouse conditions. Funct Plant Biol 32:1143–1152
Donaldson SP, Deacon JW (1993a) Effects of amino acids and sugars on zoospore taxis, encyst-
ment and cyst germination in Pythium aphanidermatum (Edson) Fitzp., P. catenulatumMatthews and P. dissotocum Drechs. New Phytol 123:289–295
Donaldson SP, Deacon JW (1993b) Differential encystment of zoospores of Pythium species by
saccharides in relation to establishment on roots. Physiol Mol Plant P 42:177–184
Dukes PD, Apple JL (1961) Chemotaxis of zoospores of Phytophthora parasitica var. nicotianaeby plant roots and certain chemical solutions. Phytopathol Note 51:195–197
Edwards SG, Young JPW, Fitter AH (1998) Interactions between Pseudomonas fluorescensbiocontrol agents and Glomus mosseae, an arbuscular mycorrhizal fungus, within the rhizo-
sphere. FEMS Microbiol Lett 166:297–303
Erwin C, Ribeiro OK (1996) Phytophthora diseases worldwide. The American Phytopathological
Society Press, St Paul, MN
Estrada-Garcia MT, Ray TC, Green JR, Callow JA, Kennedy JF (1990) Encystment of Pythiumaphanidermatum zoospores is induced by root mucilage polysaccharides, pectin and a mono-
clonal antibody to a surface antigen. J Expt Bot 41:693–699
Fester T, Maier W, Strack D (1999) Accumulation of secondary compounds in barley and wheat
roots in response to inoculation with an arbuscular mycorrhizal fungus and co-inoculation with
rhizosphere bacteria. Mycorrhiza 8:241–246
Fester T, Hause B, Schmidt D, Halfmann K, Schmidt J, Wray V, Hanse G, Strack D (2002a)
Occurrence and localization of apocarotenoids in arbuscular mycorrhizal plant roots. Plant Cell
Physiol 43:256–265
Fester T, Schmidt D, Lohse S, Walter MH, Giuliano G, Bramley PM, Fraser PD, Hause B, Strack
D (2002b) Stimulation of carotenoid metabolism in arbuscular mycorrhizal roots. Planta
216:148–154
Fester T, Wray V, Nimtz M, Strack D (2005) Is stimulation of carotenoid biosynthesis in
arbuscular mycorrhizal roots a general phenomenon? Phytochemistry 66:1781–1786
FilionM, St-ArnaudM, Fortin JA (1999) Direct interaction between the arbuscular mycorrhizal fungus
Glomus intraradices and different rhizosphere microorganisms. New Phytol 141:525–533
Filippi C, Bagnoli G, Citernesi AS, Giovannetti M (1998) Ultrastructural spatial distribution of
bacteria associated with sporocarps of Glomus mosseae. Symbiosis 24:1–12
Fortin JA, Becard G, Declerck S, Dalpe Y, St-Arnaud M, Coughland A, Piche Y (2002) Arbuscular
mycorrhiza on root-organ cultures. Can J Bot 80:1–20
Gange AC (2001) Species-specific responses of a root- and shoot-feeding insect to arbuscular
mycorrhizal colonization of its host plant. New Phytol 150:611–618
9 Role of Root Exudates and Rhizosphere Microflora in the Arbuscular 153

Gange AC, Nice HE (1997) Performance of the thistle gall fly,Urophora cardui, in relation to hostplant nitrogen and mycorrhizal colonization. New Phytol 137:335–343
Graham JH, Leonard RT, Menge JA (1981) Membrane-mediated decrease in root exudation
responsible for phosphorus inhibition of vesicular–arbuscular mycorrhiza formation. Plant
Physiol 68:548–552
Griffiths BS, Ritz K, Ebblewhite N, Dobson G (1999) Soil microbial community structure: effects
of substrate loading rates. Soil Biol Biochem 31:145–153
Grote D, Claussen W (2001) Severity of root rot on tomato plants caused by Phytophthoranicotianae under nutrient- and light-stress conditions. Plant Pathol 50:702–707
Halsall DM (1975) Zoospore chemotaxis in Australian isolates of Phytophthora. Can J Microbiol
22:409–422
Hardham AR, Cahill DM, Cope M, Gabor BK, Gubler F, Hyde GJ (1994) Cell surface antigens of
Phytophthora spores — biological and taxonomic characterization. Protoplasma 181:213–232
Hause B, Maier W, Miersch O, Kramell R, Strack D (2002) Induction of jasmonate biosynthesis in
arbuscular mycorrhizal barley roots. Plant Physiol 130:1213–1220
Hause B, Mrosk C, Isayenkov S, Strack D (2007) Jasmonates in arbuscular mycorrhizal interac-
tions. Phytochemistry 68:101–110
Hickman CJ (1970) Biology of Phytophthora zoospores. Phytopathology 60:1128–1135
Ho HH, Hickman CJ (1967a) Asexual reproduction and behavior of zoospores of Phytophthoramegasperma var. sojae. Can J Bot 45:1963–1981
Ho HH, Hickman CJ (1967b) Factors governing zoospore responses of Phytophthora megaspermavar. sojae to plant roots. Can J Bot 45:1983–1994
Isayenkov S, Mrosk C, Stenzel I, Strack D, Hause B (2005) Suppression of allene oxide cyclase in
hairy roots ofMedicago truncatula reduces jasmonate levels and the degree of mycorrhization
with Glomus intraradices. Plant Physiol 139:1401–1410Jargeat P, Cosseau C, Ola’h B, Jauneau A, Bonfante P, Batut J, Becard G (2004) Isolation, free-living
capacities, and genome structure of ‘‘Candidatus glomeribacter gigasporarum,’’ the endocellular
bacterium of the mycorrhizal fungus Gigaspora margarita. J Bacteriol 186:6876–6884Jones SW, Donaldson SP, Deacon JW (1991) Behaviour of zoospores and zoospore cysts in
relation to root infection by Pythium aphannidermatum. New Phytol 117:289–301
Kapoor R, Kaur M, Mukerji KG (2000) VAM and phosphorus induced changes in the rhizosphere
ecology of Anethum graveolens L. J Expt Biol 21:185–191Khew KL, Zentmyer GA (1973) Chemotactic response of zoospores of five species of Phy-
tophthora. Phytopathology 63:1511–1517
Kishor PBK, Sangam S, Amrutha RN, Laxmi PS, Naidu KR, Rao K, Rao S, Reddy KJ, Theriappan
P, Sreenivaslu N (2005) Regulation of proline biosynthesis, degradation, uptake and transport in
higher plants: its implications in plant growth and abiotic stress tolerance. Curr Sci 88:424–438
Kozdroj J, van Elsas JD (2000) Response of the bacterial community to root exudates in soil
polluted with heavy metals assessed by molecular and cultural approaches. Soil Biol Biochem
32:1405–1417
Krishna KR, Bagyaraj DJ (1983) Interaction between Glomus fasciculatum and Sclerotium rolfsiiin peanut. Can J Bot 61:2349–2351
Kuznetsov VV, Shevyakova NI (1999) Proline under stress: biological role, metabolism, and
regulation. Russ J Plant Physiol 46:274–287
Labour K, Jolicoeur M, St-Arnaud M (2003) Arbuscular mycorrhizal responsiveness of in vitrotomato root lines is not related to growth and nutrient uptake rates. Can J Bot 81:645–656
Larsen J, Bødker L (2001) Interactions between pea root-inhabiting fungi examined using signa-
ture fatty acids. New Phytol 149:487–493
Leano EM, Vrijmoed LLP, Jones EBG (1998) Zoospore chemotaxis of two mangrove strains of
Halophytophthora vesicula from Mai Po, Hong Kong. Mycologia 90:1001–1008
Levy A, Chang BJ, Abbott LK, Kuo J, Harnett G, Inglis TJJ (2003) Invasion of spores of the
arbuscular mycorrhizal fungus Gigaspora decipiens by Burkholderia spp. Appl Environ
Microbiol 69:6250–6256
154 L. Lioussanne et al.
Lioussanne L, Jolicoeur M, St-Arnaud M (2006a) The inhibition of Phytophthora nicotianaeinduced by AMF is not related to tomato root exudation transformation. In: Abstracts of the 5th
International Conference on Mycorrhiza, Granada, Spain, 20–29 July, p 249
Lioussanne L, Keough A, Jolicoeur M, St-Arnaud M (2006b) Diversity of Glomus mosseae spore-associated bacteria and their antagonism over soil-borne pathogens in vitro. In: Abstracts of the5th International Conference on Mycorrhiza, Granada, Spain, 20–29 July, p 203
Lioussanne L, Jolicoeur M, St-Arnaud M (2008) Mycorrhizal colonization with Glomus intrar-adices and development stage of transformed tomato roots significantly modify the chemotac-
tic response of zoospores of the pathogen Phytophthora nicotianae. Soil Biol Biochem
40:2217–2224
Ludwig-Muller J, Bennett RN, Garcıa-Garrido JM, Piche Y, Vierheilig H (2002) Reduced
arbuscular mycorrhizal root colonization in Tropaeolum majus and Carica papaya after
jasmonic acid application can not be attributed to increased glucosinolate levels. J Plant
Physiol 159:517–523
Lugtenberg BJJ, Kravchenko LV, Simons M (1999) Tomato seed and root exudate sugars:
composition, utilization by Pseudomonas biocontrol strains and role in rhizosphere coloniza-
tion. Environ Microbiol 1:439–446
Lynch JM, Whipps JM (1990) Substrate flow in the rhizosphere. Plant Soil 129:1–10
MacDonald RM, Chandler MR, Mosse B (1982) The occurrence of bacterium-like organelles in
vesicular–arbuscular mycorrhizal fungi. New Phytol 90:659–663
Mansfeld-Giese K, Larsen J, Bødker L (2002) Bacterial populations associated with mycelium of
the arbuscular mycorrhizal fungus Glomus intraradices. FEMS Microbiol Ecol 41:133–140
Marschner P, Timonen S (2005) Interactions between plant species and mycorrhizal colonization
on the bacterial community composition in the rhizosphere. Appl Soil Ecol 28:23–36
Marschner P, Crowley DE, Higashi RM (1997) Root exudation and physiological status of a root-
colonizing fluorescent pseudomonad in mycorrhizal and non-mycorrhizal pepper (Capsicumannuum L). Plant Soil 189:11–20
Marschner P, Crowley DE, Lieberei R (2001) Arbuscular mycorrhizal infection changes the bacterial
16S rDNA community composition in the rhizosphere of maize. Mycorrhiza 11:297–302
Mayo K, Davis RE, Motta J (1986) Stimulation of germination of spores of Glomus versiforme byspore-associated bacteria. Mycologia 78:426–431
Meixner C, Ludwig-Muller J, Miersch O, Gresshoff P, Staehelin C, Vierheilig H (2005) Lack of
mycorrhizal autoregulation and phytohormonal changes in the supernodulating soybean mu-
tant nts1007. Planta 222:709–715
Morris PF, Ward EWB (1992) Chemoattraction of zoospores of the soybean pathogen, Phy-tophthora sojae, by isoflavones. Physiol Mol Plant Pathol 40:17–22
Morris BM, Reid B, Gow NAR (1995) Tactic response of zoospores of the fungus Phytophthorapalmivora to solutions of different pH in relation to plant infection. Microbiology
141:1231–1237
Norman JR, Atkinson D, Hooker JE (1996) Arbuscular mycorrhizal fungal-induced alteration to
root architecture in strawberry and induced resistance to the root pathogen Phytophthorafragariae. Plant Soil 185:191–198
Norman JR, Hooker JE (2000) Sporulation of Phytophthora fragariae shows greater stimulation by
exudates of non-mycorrhizal than by mycorrhizal strawberry roots. Mycol Res 104:1069–1073
Omokolo ND, Nankeu DJ, Niemenak N, Djocgoue PF (2002) Analysis of amino acids and
carbohydrates in the cortex of nine clones of Theobroma cacao L. in relation to their
susceptibility to Phytophthora megakarya Bra. and Grif. Crop Protect 21:395–402
Park S, Takano Y, Matsuura H, Yoshihara T (2004) Antifungal compounds from the root and root
exudate of Zea mays. Biosci Biotech Biochem 68:1366–1368
Pennanen T, Caul S, Daniell TJ, Griffiths BS, Ritz K, Wheatley RE (2004) Community-level
responses of metabolically-active soil microorganisms to the quantity and quality of substrate
inputs. Soil Biol Biochem 36:841–848
9 Role of Root Exudates and Rhizosphere Microflora in the Arbuscular 155

Pinior A, Wyss U, Piche Y, Vierheilig H (1999) Plants colonized by AM fungi regulate further root
colonization by AM fungi through altered root exudation. Can J Bot 77:891–897
Pozo MJ, Azcon-Aguilar C (2007) Unraveling mycorrhiza-induced resistance. Curr Opin Plant
Biol 10:393–398.
Pozo MJ, Dumas-Gaudot E, Slezack S, Cordier C, Asselin A, Gianinazzi S, Gianinazzi-Pearson V,
Azcon-Aguilar C, Barea JM (1996) Induction of new chitinase isoforms in tomato roots during
interactions with Glomus mosseae and/or Phytophthora nicotianae var parasitica. Agronomie
16:689–697
Pozo MJ, Azcon-Aguilar C, Dumas-Gaudot E, Barea JM (1998) Chitosanase and chitinase
activities in tomato roots during interactions with arbuscular mycorrhizal fungi or Phy-tophthora parasitica. J Expt Bot 49:1729–1739
Pozo MJ, Azcon-Aguilar C, Dumas-Gaudot E, Barea JM (1999) Beta-1,3-glucanase activities in
tomato roots inoculated with arbuscular mycorrhizal fungi and/or Phytophthora parasitica andtheir possible involvement in bioprotection. Plant Sci 141:149–157
Pozo MJ, Cordier C, Dumas-Gaudot E, Gianinazzi S, Barea JM, Azcon-Aguilar C (2002a)
Localized versus systemic effect of arbuscular mycorrhizal fungi on defence responses to
Phytophthora infection in tomato plants. J Expt Bot 53:525–534
Pozo MJ, Slezack-Deschaumes S, Dumas-Gaudot E, Gianinazzi S, Azcon-Aguilar C (2002b) Plant
defense responses induced by arbuscular mycorrhizal fungi. In: Gianinazzi S, Schuepp H,
Barea JM, Haselwandter K (eds) Mycorrhizal technology in agriculture: from genes to
bioproducts. Birkhauser Verlag Ag, Basel, Switzerland, pp 103–111
Pozo MJ, Van Loon LC, Pieterse CMJ (2004) Jasmonates — Signals in plant–microbe interactions.
J Plant Growth Regul 23:211–222
Rai VK (2002) Role of amino acids in plant responses to stresses. Biol Plant 45:481–487
Ravnskov S, Nybroe O, Jakobsen I (1999) Influence of an arbuscular mycorrhizal fungus on Pseudo-monas fluorescens DF57 in rhizosphere and hyphosphere soil. New Phytol 142:113–122
Reid B, Morris BM, Gow NAR (1995) Calcium-dependent, genus-specific autoaggregation of
zoospores of phytopathogenic fungi. Expt Mycol 19:202–213
Roesti D, Ineichen K, Braissant O, Redecker D, Wiemken A, AragnoM (2005) Bacteria associated
with spores of the arbuscular mycorrhizal fungi Glomus geosporum and Glomus constrictum.Appl Environ Microbiol 71:6673–6679
Ruiz-Lozano JM, Azcon R, Gomez M (1995) Effects of arbuscular–mycorrhizal Glomus specieson drought tolerance: physiological and nutritional plant responses. Appl Environ Microbiol
61:456–460
Satour MM, Butler EE (1967) A root and crown rot of tomato caused by Phytophthora capsici andP. parasitica. Phytopathology 57:510–515
Scervino JM, Ponce MA, Erra-Bassells R, Vierheilig H, Ocampo JA, Godeas A (2005) Arbuscular
mycorrhizal colonization of tomato by Gigaspora and Glomus species in the presence of root
flavonoids. J Plant Physiol 162:625–633
Scheffknecht S, Mammerler R, Steinkellner S, Vierheilig H (2006) Root exudates of mycorrhizal
tomato plants exhibit a different effect on microconidia germination of Fusarium oxysporumf. sp. lycopersici than root exudates from non-mycorrhizal tomato plants. Mycorrhiza
16:365–370
Scheffknecht S, St-Arnaud M, Khaosaad T, Steinkellner S, Vierheilig H (2007) An altered root
exudation pattern through mycorrhization affecting microconidia germination of the highly
specialized tomato pathogen Fusarium oxysporum f. sp. lycopersici (Fol) is not tomato-specific
but also occurs in Fol non-host plants. Can J Bot 85:347–351
Secilia J, Bagyaraj DJ (1987) Bacteria and actinomycetes associated with pot cultures of vesicular–
arbuscular mycorrhizas. Can J Microbiol 33:1069–1073
Selim S, Negrel J, Govaerts C, Gianinazzi S, van Tuinen D (2005) Isolation and partial characteri-
zation of antagonistic peptides produced by Paenibacillus sp. strain B2 isolated from the
sorghum mycorrhizosphere. Appl Environ Microbiol 71:6501–6507
156 L. Lioussanne et al.

Sharma SS, Dietz KJ (2006) The significance of amino acids and amino acid-derived molecules in
plant responses and adaptation to heavy metal stress. J Expt Bot 57:711–726
Simons M, Permentier HP, de Weger LA, Wijffelman CA, Lugtenberg BJJ (1997) Amino acid
synthesis is necessary for tomato root colonization by Pseudomonas fluorescens strain
WCS365. Mol Plant Microbe Int 10:102–106
Smith SE, Read DJ (1997) Mycorrhizal symbiosis. 2nd edn. Academic Press, San Diego
Sood SG (2003) Chemotactic response of plant-growth-promoting bacteria towards roots of
vesicular–arbuscular mycorrhizal tomato plants. FEMS Microbiol Ecol 45:219–227
St-Arnaud M, Vujanovic V (2007) Effect of the arbuscular mycorrhizal symbiosis on plant
diseases and pests. In: Hamel C, Plenchette C (eds) Mycorrhizae in crop production. Haworth
Press, Binghampton, NY, pp 67–122
St-Arnaud M, Hamel C, Caron M, Fortin JA (1995a) Endomycorhizes VA et sensibilite aux
maladies: synthese de la litterature et mecanismes d’interaction potentiels. In: Fortin JA,
Charest C, Piche Y (eds) La symbiose mycorhizienne — Etat des connaissances. Orbis
Publishing, Frelighsburg, Quebec, pp 51–87
St-Arnaud M, Hamel C, Vimard B, Caron M, Fortin JA (1995b) Altered growth of Fusariumoxysporum f. sp. chrysanthemi in an in vitro dual culture system with the vesicular arbuscular
mycorrhizal fungus Glomus intraradices growing on Daucus carota transformed roots.
Mycorrhiza 5:431–438
Strack D, Fester T (2006) Isoprenoid metabolism and plastid reorganization in arbuscular mycor-
rhizal roots. New Phytol 172:22–34
Stumpe M, Carsjens JG, Stenzel I, Gobel C, Lang I, Pawlowski K, Hause B, Feussner I (2005)
Lipid metabolism in arbuscular mycorrhizal roots of Medicago truncatula. Phytochemistry
66:781–791
Toljander JF, Artursson V, Paul LR, Jansson JK, Finlay RD (2006) Attachment of different soil
bacteria to arbuscular mycorrhizal fungal extraradical hyphae is determined by hyphal vitality
and fungal species. FEMS Microbiol Lett 254:34–40
Trotta A, Varese GC, Gnavi E, Fusconi A, Sampo S, Berta G (1996) Interactions between the
soilborne root pathogen Phytophthora nicotianae var. parasitica and the arbuscular mycorrhi-
zal fungus Glomus mosseae in tomato plants. Plant Soil 185:199–209
van West P, Appiah AA, Gow NAR (2003) Advances in research on oomycete root pathogens.
Physiol Mol Plant Pathol 62:99–113
Vazquez MM, Azcon R, Barea JM (2001) Compatibility of a wild type and its genetically modified
Sinorhizobium strain with two mycorrhizal fungi on Medicago species as affected by drought
stress. Plant Sci 161:347–358
Vierheilig H (2004) Regulatory mechanisms during the plant–arbuscular mycorrhizal fungus
interaction. Can J Bot 82:1166–1176
Vierheilig H, Piche Y (2002) Signalling in arbuscular mycorrhiza: facts and hypotheses.
In: Bushlig B, Manthey J (eds) Flavonoids in cell function. Kluwer, New York, pp 23–39
Vierheilig H, Garcıa-Garrido JM, Wyss U, Piche Y (2000a) Systemic suppression of mycorrhizal
colonisation of barley roots already colonized by AM fungi. Soil Biol Biochem 32:589–595
Vierheilig H, Gagnon H, Strack D, Maier W (2000b) Accumulation of cyclohexenone derivatives
in barley, wheat and maize roots in response to inoculation with different arbuscular mycor-
rhizal fungi. Mycorrhiza 9:291–293
Vierheilig H, Lerat S, Piche Y (2003) Systemic inhibition of arbuscular mycorrhiza development
by root exudates of cucumber plants colonized by Glomus mosseae. Mycorrhiza 13:167–170
Vigo C, Norman JR, Hooker JE (2000) Biocontrol of the pathogen Phytophthora parasiticaby arbuscular mycorrhizal fungi is a consequence of effects on infection loci. Plant Pathol
49:509–514
Wamberg C, Christensen S, Jakobsen I, Muller AK, Sørensen SJ (2003) The mycorrhizal fungus
(Glomus intraradices) affects microbial activity in the rhizosphere of pea plants (Pisumsativum). Soil Biol Biochem 35:1349–1357
9 Role of Root Exudates and Rhizosphere Microflora in the Arbuscular 157

Wright SF, Frankesnyder M, Morton JB, Upadhyaya A (1996) Time-course study and partial
characterization of a protein on hyphae of arbuscular mycorrhizal fungi during active coloni-
zation of roots. Plant Soil 181:193–203
Wright SF, Starr JL, Paltineanu IC (1999) Changes in aggregate stability and concentration of
glomalin during tillage management transition. Soil Sci Soc Am J 63:1825–1829
Wright SF, Upadhyaya A (1998) A survey of soils for aggregate stability and glomalin, a
glycoprotein produced by hyphae of arbuscular mycorrhizal fungi. Plant Soil 198:97–107
Wu QS, Xia RX (2006) Arbuscular mycorrhizal fungi influence growth, osmotic adjustment and
photosynthesis of citrus under well-watered and water stress conditions. J Plant Physiol
163:417–425
Xavier LJC, Germida JJ (2003) Bacteria associated with Glomus clarum spores influence mycor-
rhizal activity. Soil Biol Biochem 35:471–478
Yang CH, Crowley DE, Menge JA (2001) 16S rDNA fingerprinting of rhizosphere bacterial
communities associated with healthy and Phytophthora infected avocado roots. FEMS Micro-
biol Ecol 35:129–136
158 L. Lioussanne et al.
Chapter 10
Assessing the Mycorrhizal Diversity of Soils
and Identification of Fungus Fruiting Bodies
and Axenic Cultures
Dirk Kruger, Manisha Sharma, and Ajit Varma
10.1 Introduction
Symbiotic mycorrhizal fungi play a pivotal role in biological interactions and
biogeochemical cycles because the carbon they obtain from their photosynthetic
plant hosts is allocated through the mycorrhizal mycelium to the soil ecosystem. In
addition to these interactions with their host plant’s roots, the mycelia also interact
with a range of organic and inorganic substrates, as well as with different organisms
such as bacteria, other fungi, soil micro- and mesofauna and the roots of secondary
host plants (Finlay 2005).
Progress has been made in recent decades in the knowledge of root and mycor-
rhizae formation and turnover and its impacts on soil ecosystems; soil biota,
exudations, secretions and soil aggregation phenomena; the biology of invasive
species in soils; soil biodiversity, legacies and linkages to soil processes; and
ecosystem functional responses (Coleman 2008).
The advances and cost reduction in DNA-based identification of biological
material has been greatly improving the catalog of methods available to soil
ecologists (Anderson and Cairney 2004). While we here describe the work with
specimens and cultures, it is noteworthy that direct application of molecular
methods to environmental material can detect many more, yet often different, sets
of fungal taxa, as for example shown for the large basidiomycete diversity in
agricultural soil (Lynch and Thorn 2006).
D. Kruger (*)
UFZ - Helmholtz Centre for Environmental Research Ltd.,Department of Soil Ecology, Theodor-
Lieser-Straße 4, D-06120 Halle/Saale (Germany)
e-mail: [email protected]
M. Sharma and A. Varma
Amity Institute of Microbial Technology (AIMT), Amity University Uttar Pradesh, Sector 125,
Noida, UP 201303 (India)
A. Varma and A.C. Kharkwal (eds.), Symbiotic Fungi, Soil Biology 18, 159
DOI: 10.1007/978‐3‐540‐95894‐9_10, # Springer‐Verlag Berlin Heidelberg 2009
10.2 General Characteristics of Mycorrhizae
There can be no clear morphological, phylogenetic or ecological definition of soil
fungi as these concepts are very difficult to implement since the geographically
unbounded soil ecosystem harbors a diverse plethora of fungi with great morpho-
logical, genetic, and functional diversity. These fungi include yeasts and filamen-
tous fungi, ascomycetes and basidiomycetes, ectomycorrhizal fungi (EMF) and
arbuscular mycorrhizal fungi (AMF), anamorphic fungi and teleomorphic fungi.
Mycorrhizal fungi (Fig. 10.1) have the ability to interact with the roots of more than
80% of land plants (Newman and Reddle 1987) and form symbiotic associations
termed mycorrhizae. On the basis of the colonization pattern of host cells, two
major types of mycorrhizae can be identified: ectomycorrhizae and arbuscular
mycorrhizae. In the ectomycorrhiza the fungus does not penetrate the host cells,
but forms a sheath around the roots and only traverses the cortical layers of the roots
in the intercellular spaces, forming an interface called Hartig’s Net. However, in
arbuscular mycorrhiza the fungal hyphae penetrate cells and form intracellular
structures such as coils or arbuscules. Mycorrhizal fungi provide improved access
to limited soil sources such as phosphorus and nitrogen to the host plant.
In exchange, mycorrhizal fungi receive carbon compounds from host plants to
sustain their metabolism and complete their life cycle; they also receive protection
from other microbes in the rhizosphere, and hence form a multipartite symbiotic
interaction (Jeewon and Hyde 2007). A novel endophytic, root-interacting fungus,
Piriformospora indica (Hymenomycetes, Basidiomycota) has been isolated and
found to mimic the capabilities of a typical mycorrhizal fungus (Verma et al.
1998, Varma et al. 1999, 2001).
10.3 Classical Fungal Processing and Identification
10.3.1 Field Notes, Processing, Fungal Identification
The field label of a specimen should include (a) field identification, (b) collector’s
name, (c) collection number and date, (d) detailed locality information, including
coordinates and elevation (best by GPS), (e) a small description of the habitat,
substratum and host. If possible, photographs should be taken on site, showing the
habitat of the specimen, or on a neutral background to better show colors and
details. A digital camera is of great help. Such photographic evidence can later help
memorizing ephemeral characteristics required for identification and description.
The microscopic shape, size, color, manner of arrangement of spores on the
fruiting bodies (sporophores), the hyphal characteristics of mycelium, as well as
detailed information on fruiting bodies themselves, are the characteristics which
would suggest themselves to someone somewhat experienced in the taxonomy of
fungi, the class, order, family, and genus to which the particular fungus belongs.
160 D. Kruger et al.

Microscopic characteristics are best examined under a compound microscope,
perhaps adding various stains such as lactophenol cotton blue, toluidine blue,
Giemsa stain, etc., and vital stain such as Janus green. In any case, these character-
istics can be utilized to trace the fungus through published analytical, often dichot-
omous, keys to the genus, and perhaps finally to the species to which it belongs.
Published color photograph guides and web-based keys and photographs can help
further. Detailed descriptions of the known species are found in monographs of
Fig. 10.1 (a) Schematic presentation of mycorrhizosphere http://invam.caf.wvu.edu/collection/
pubs/abstracts/mycorhiz.jpg (accessed 06 Sept. 2008). (b) Root hair and fungal association http://
www2.warwick.ac.uk/fac/sci/whri/research/soilmicrobialdiversity/mycorrhizaldiversity_/paxillus_
involutus_root.jpg (accessed 06 Sept. 2008)
10 Assessing the Mycorrhizal Diversity of Soils and Identification of Fungi 161

genera or in individual publications in research journals. The specimen is often kept
moist for a few days to promote spore development for the production of spore print
on paper or a glass slide, e.g., for help in microscopic identification or inclusion in
the herbarium (see below). Alternatively, the fungus may be isolated as a culture
from soil, root, sporophore or germinating spores (see below) and grown on
artificial medium and identified on the basis of spores produced on the media. For
some fungi, special nutrient media have been developed that allow selective growth
only of the particular fungus.
The advent of molecular techniques, particularly the polymerase chain reaction
(PCR), quick and inexpensive sequencing of DNA, and the accumulation of large
databanks of DNA sequences have revolutionized fungal systematics and ecology
(Agrios 2005).
10.3.2 Herbarium Facilities
Herbaria serve as conservatories for voucher specimens. Preservation of vouchers
in publicly accessible herbaria is extremely important for further scientific studies
(Agerer et al. 2000), not just because of the type requirements of nomenclature
codes (McNeill et al. 2006). Herbarium specimens and their accompanying field
notes document the existence of a fungus at a given place and time and provide the
raw data from which taxonomic concepts are constructed. The examination of
voucher specimens also provides a reliable way of verifying or correcting the
identity of organisms recorded in cytological, ecological, populational, morpholog-
ical, phylogenetic, and molecular studies. Scientific specimens are also a source of
DNA and other compounds for phylogenetic, ecological, and other studies. Spore
prints, if there are any, should be placed carefully in packets and stored with the
specimens. They are also a source of DNA, identification of fungal characteristics,
growing new cultures, etc.
For scientific studies specimens collected must be accompanied with informative,
reproducible details:
l A loose label and/or field tag with the collector’s initial and collection number
should be associated with the specimen at all times to facilitate their retrieval and
identification.l Ideally, color photographs should be deposited with the specimen. In addition
the collector should provide detailed notes on the appearance of the specimen
when fresh, including pertinent information about the color (e.g., using a color
guide, Kornerup and Wanscher 1978, http://www.bio.utk.edu/mycology/Color/
color-intro.htm), stature, shape and general ecology.l Field notes should be written on archival-quality paper using permanent ink.
Some collectors enter field data directly into a computer, in which case back-up
files should be kept separately from the computer, and a hard copy should
be printed as soon as possible. Copies generated using a laser printer and
archival-quality paper is adequate for long-term preservation.
162 D. Kruger et al.

l A specimen container (e.g., jeweler’s box or folded paper, with or without
attached herbarium sheet) should be large enough to accommodate fungal speci-
mens of various shapes and sizes to provide appropriate protection. Unpacked
specimens should never be mounted directly on herbarium sheets.l Specimens may originate from staff fieldwork or as gifts, exchanges, or loans.
All incoming specimens, but especially those coming directly from the field,
should be checked on arrival to determine if they are completely dry. Damp
specimens must be dried thoroughly. Incoming specimens must also be disin-
fected (to kill insects) before they are stored in herbarium. Disinfestation can be
achieved by deep freezing. Packages of specimens are wrapped in plastic bags
and placed in a freezer at or below �20�C for 7 days. Bagging is essential for
preventing condensation of moisture on a specimen during the process. Double
plastic bags may be used to prevent air leakage. After freezing specimens should
remain in their plastic bags until the whole package regains room temperature.l Taxonomic and sometimes other information about a specimen increases as the
specimen is studied over time. Such information enhances the value of the
specimen and should be recorded by the investigators on an annotation label
provided by the herbarium. An annotation label should include: (a) the identifi-
cation number of the specimen (i.e., collector and/or herbarium number) in case
the label becomes separated from the specimen, (b) annotations for any scientific
name newly applied to the organism, (c) authorship of the scientific name,
(d) relevant literature citation(s), (e) the name of the annotator, (f) annotation
date, and (g) other observations. Annotation labels should also be made of
archival-quality paper and written with permanent ink. Policies regarding at-
tachment of annotation labels vary among herbaria. It is recommended that
investigators place annotation labels inside the packet, box, or mounting sheets
with a paper clip or rubber band. A herbarium curator or technician is then notified
of their existence and can attach themmore securely, if necessary (Wu et al. 2004).l Phalloid, clathroid and other delicate fungi can be fixed and stored in liquid
preservatives so that the forms and fragile textures of the fungi are not distorted.
However, chemical fixation alters the DNA of an organism, so specimens fixed
in that manner are not suitable for molecular studies. Consequently, warm-air
drying is the preferred method of preserving fungal specimens. Freshly collected
material is submerged in a fixative for 2–7 days and then transferred to storage
solutions such as 70% ethanol, or they can be more complex mixtures of
chemicals. Bridson and Forman (1992) recommended the Kew mixture and
Copenhagen solution for fixation and storage, respectively. Both contain glycerol,
which keeps the specimen from hardening. Collections stored in ethanol must be
monitored closely to observe that fluid loss through evaporation can be replaced.
Specimens are stored in glass jars or vials with neoprene caps or stoppers. Caps
may be sealed further with sealing wax, Parafilm, and other materials to limit
evaporation. Because chemical preservatives are harmful to human health,
safety procedures must be followed when fixative and storage media are han-
dled, both in the field and the laboratory. Investigators should wear gloves and
10 Assessing the Mycorrhizal Diversity of Soils and Identification of Fungi 163
safety goggles and should avoid breathing fumes by wearing masks or working
in a chemical fume hood (Wu et al. 2004).
10.4 Isolation of Fungal Cultures from Soils,
Mycorrhizosphere and Sporophores
10.4.1 Preparations
Before isolation, one must gather sterilized plastic items or pre-sterilize glassware,
such as Petri dishes, test tubes and pipettes, by dry heat (150-160�C for 1 h or
more), autoclaving, or dipping for one minute or more in 70–80% ethanol (Agrios
2005). There are many culture media available. The media have to be prepared in
advance. General fungal media are malt extract agar, potato dextrose agar or
Sabouraud dextrose agar. Selective agar media are designed to isolate specific
groups of fungi such as cellulose agar to isolate microbes which are able to utilize
long complex carbohydrates. Czapek yeast agar is used for the isolation and culture
of saprobic soil microorganisms and Rose Bengal agar is used for the selective
enumeration of yeast and molds. Rose Bengal is present in the media to restrict (not
inhibit) the growth of Rhizopus and Mucor sp. that often overgrow culture plates.
Some media are entirely synthetic, i.e., made up of known amounts of chemicals.
Some are broth or semi-liquid apart from solid media (Pacioni 1992). Solutions of
culture media are prepared in flasks, which are plugged and placed in an autoclave
at 121�C at 15 psi pressure for 20 min. Sterilized media are allowed to cool until
touchable (�55�C) and are subsequently poured from the flask into sterilized Petri
dishes, test tubes, or other appropriate containers. Pouring of the culture medium
into the containers is carried out aseptically either in a separate culture room or in a
clean room free from dust and contaminants. In either case the work table must be
wiped with 70% ethanol, hands should be clean, and tools such as scalpels, forceps,
and needles should be dipped in alcohol and flamed to prevent introduction of
contaminating microorganism. Working in a laminar airflow hood greatly helps to
grow the desired fungi free of airborne contaminants.
10.4.2 Isolation from Fruiting Bodies and Spores
Fungal cultures can be obtained by placing aseptically removed internal tissue of
sporophores onto media. Polyspore (thus heterokaryotic) cultures can be derived
from sporophore fragments glued onto Petri dish lids and sporulate onto the
medium. Cutting out individual germinating spores onto separate dishes can yield
monokaryotic single spore isolates. Sometimes the use of spore prints, or
164 D. Kruger et al.

plating out sterilized water in which hymenophore (the spore-producing part of
sporophores) fragments were vortexed, suffices to produce cultures.
10.4.3 Indirect Methods for Screening
Sporulating fungi are isolated by indirect techniques. The soil-dilution plate tech-
nique is the most common method (Fig. 10.2). In serial dilution methods, the spread
plate technique is advantageous over the pour plate technique as the latter may
eliminate some heat-sensitive fungi; also, some fungal spores do not germinate if
submerged. Techniques such as serial root washings, soil washings, sedimentation
and sieving are known for good recovery, as these techniques involve agitation in
soil aggregates, and thus the spores can be easily released.
10.4.4 Soil Dilution Technique for Enumeration of Fungi
1. To enumerate the total population of fungi, serial dilution and subsequent plating
of the rhizosphere soil is done on the specified medium. This will estimate the
number of viable fungal propagules present per gram of soil capable of growing
in the specified medium, as shown in Fig. 10.2.
2. Suspend 1 g of soil in 9 ml of sterile dilution blank made up of distilled water,
saline, or phosphate buffer; this produces a 1:10 dilution.
1 ml 1 ml 1 ml 1 ml 1 ml 1 ml
1 ml0.1 ml
1:10 1:100
1:100 1:1000
1:1000
1:10,000
1:10,000 1:100,000
1:100,000 1:100,0000
Dilutions
OriginalInoculum
(9 ml broth ineach test tube)
1 ml 1 ml 1 ml 1 ml
Discard
Spread Plating Pour Plating
Pour Plating
Spread Plating
Fig. 10.2 Serial dilution method: Calculation: Number of colonies on plate X reciprocal of
dilution of sample = number of colony-forming units CFU/ml. For example: 32 colonies are on
a plate of 1/10,000 dilution, then the count is 32 � 10,000 = 320,000/g in given soil sample. The
colonies obtained in Petri plates can be further subcultured and identified
10 Assessing the Mycorrhizal Diversity of Soils and Identification of Fungi 165
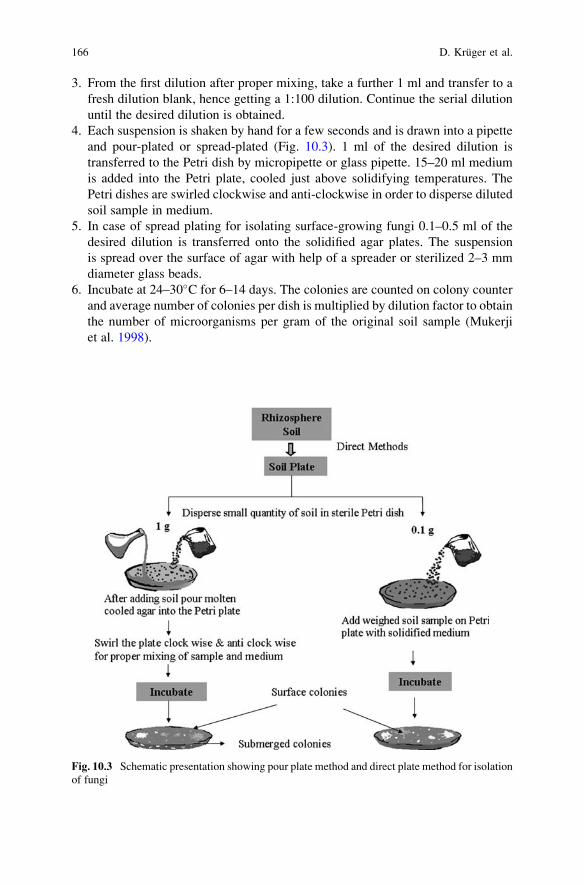
3. From the first dilution after proper mixing, take a further 1 ml and transfer to a
fresh dilution blank, hence getting a 1:100 dilution. Continue the serial dilution
until the desired dilution is obtained.
4. Each suspension is shaken by hand for a few seconds and is drawn into a pipette
and pour-plated or spread-plated (Fig. 10.3). 1 ml of the desired dilution is
transferred to the Petri dish by micropipette or glass pipette. 15–20 ml medium
is added into the Petri plate, cooled just above solidifying temperatures. The
Petri dishes are swirled clockwise and anti-clockwise in order to disperse diluted
soil sample in medium.
5. In case of spread plating for isolating surface-growing fungi 0.1–0.5 ml of the
desired dilution is transferred onto the solidified agar plates. The suspension
is spread over the surface of agar with help of a spreader or sterilized 2–3 mm
diameter glass beads.
6. Incubate at 24–30�C for 6–14 days. The colonies are counted on colony counter
and average number of colonies per dish is multiplied by dilution factor to obtain
the number of microorganisms per gram of the original soil sample (Mukerji
et al. 1998).
Fig. 10.3 Schematic presentation showing pour plate method and direct plate method for isolation
of fungi
166 D. Kruger et al.
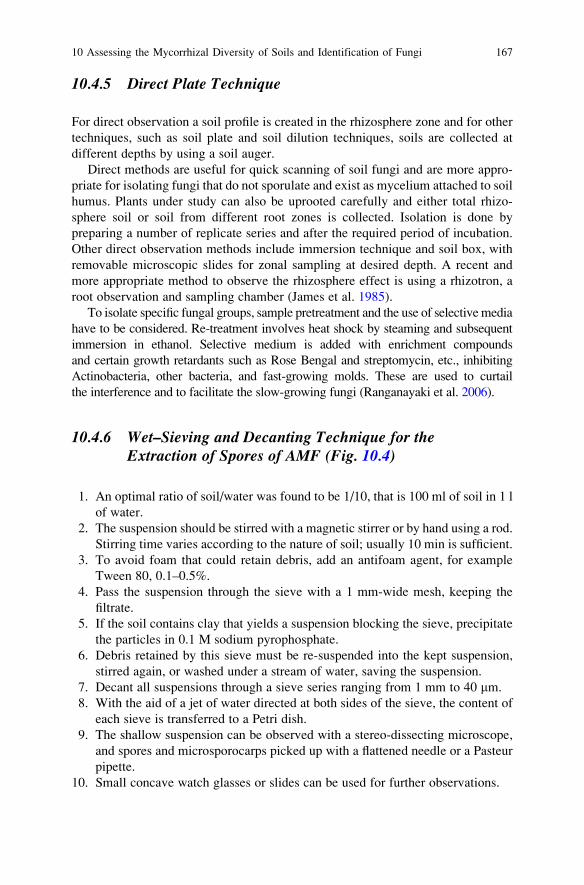
10.4.5 Direct Plate Technique
For direct observation a soil profile is created in the rhizosphere zone and for other
techniques, such as soil plate and soil dilution techniques, soils are collected at
different depths by using a soil auger.
Direct methods are useful for quick scanning of soil fungi and are more appro-
priate for isolating fungi that do not sporulate and exist as mycelium attached to soil
humus. Plants under study can also be uprooted carefully and either total rhizo-
sphere soil or soil from different root zones is collected. Isolation is done by
preparing a number of replicate series and after the required period of incubation.
Other direct observation methods include immersion technique and soil box, with
removable microscopic slides for zonal sampling at desired depth. A recent and
more appropriate method to observe the rhizosphere effect is using a rhizotron, a
root observation and sampling chamber (James et al. 1985).
To isolate specific fungal groups, sample pretreatment and the use of selectivemedia
have to be considered. Re-treatment involves heat shock by steaming and subsequent
immersion in ethanol. Selective medium is added with enrichment compounds
and certain growth retardants such as Rose Bengal and streptomycin, etc., inhibiting
Actinobacteria, other bacteria, and fast-growing molds. These are used to curtail
the interference and to facilitate the slow-growing fungi (Ranganayaki et al. 2006).
10.4.6 Wet–Sieving and Decanting Technique for theExtraction of Spores of AMF (Fig. 10.4)
1. An optimal ratio of soil/water was found to be 1/10, that is 100 ml of soil in 1 l
of water.
2. The suspension should be stirred with a magnetic stirrer or by hand using a rod.
Stirring time varies according to the nature of soil; usually 10 min is sufficient.
3. To avoid foam that could retain debris, add an antifoam agent, for example
Tween 80, 0.1–0.5%.
4. Pass the suspension through the sieve with a 1 mm-wide mesh, keeping the
filtrate.
5. If the soil contains clay that yields a suspension blocking the sieve, precipitate
the particles in 0.1 M sodium pyrophosphate.
6. Debris retained by this sieve must be re-suspended into the kept suspension,
stirred again, or washed under a stream of water, saving the suspension.
7. Decant all suspensions through a sieve series ranging from 1 mm to 40 mm.
8. With the aid of a jet of water directed at both sides of the sieve, the content of
each sieve is transferred to a Petri dish.
9. The shallow suspension can be observed with a stereo-dissecting microscope,
and spores and microsporocarps picked up with a flattened needle or a Pasteur
pipette.
10. Small concave watch glasses or slides can be used for further observations.
10 Assessing the Mycorrhizal Diversity of Soils and Identification of Fungi 167
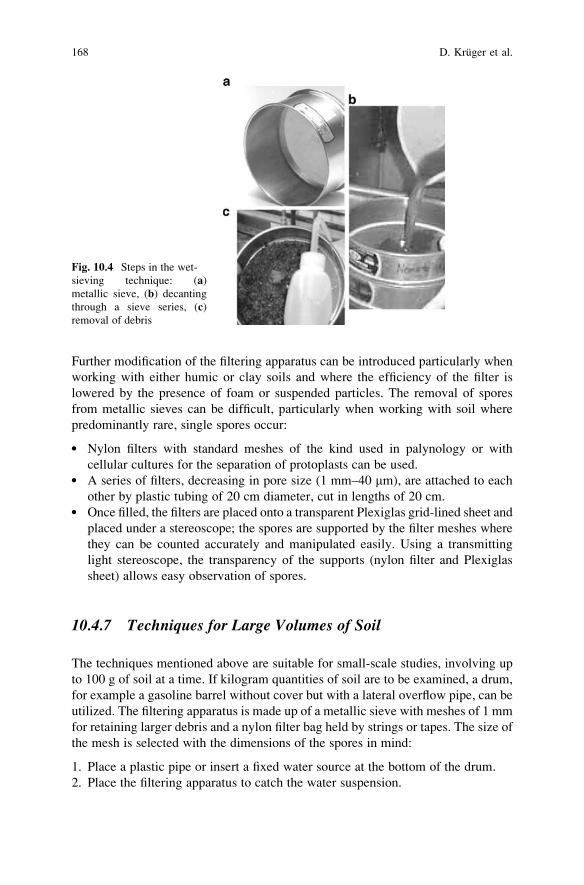
Further modification of the filtering apparatus can be introduced particularly when
working with either humic or clay soils and where the efficiency of the filter is
lowered by the presence of foam or suspended particles. The removal of spores
from metallic sieves can be difficult, particularly when working with soil where
predominantly rare, single spores occur:
l Nylon filters with standard meshes of the kind used in palynology or with
cellular cultures for the separation of protoplasts can be used.l A series of filters, decreasing in pore size (1 mm–40 mm), are attached to each
other by plastic tubing of 20 cm diameter, cut in lengths of 20 cm.l Once filled, the filters are placed onto a transparent Plexiglas grid-lined sheet and
placed under a stereoscope; the spores are supported by the filter meshes where
they can be counted accurately and manipulated easily. Using a transmitting
light stereoscope, the transparency of the supports (nylon filter and Plexiglas
sheet) allows easy observation of spores.
10.4.7 Techniques for Large Volumes of Soil
The techniques mentioned above are suitable for small-scale studies, involving up
to 100 g of soil at a time. If kilogram quantities of soil are to be examined, a drum,
for example a gasoline barrel without cover but with a lateral overflow pipe, can be
utilized. The filtering apparatus is made up of a metallic sieve with meshes of 1 mm
for retaining larger debris and a nylon filter bag held by strings or tapes. The size of
the mesh is selected with the dimensions of the spores in mind:
1. Place a plastic pipe or insert a fixed water source at the bottom of the drum.
2. Place the filtering apparatus to catch the water suspension.
Fig. 10.4 Steps in the wet-
sieving technique: (a)
metallic sieve, (b) decanting
through a sieve series, (c)
removal of debris
168 D. Kruger et al.

3. Fill the drum, suspend the soil, stir with a rod, treat as necessary and then turn on
the water, leaving the suspension to flow through the filtering apparatus.
10.5 Preservation and Maintenance
10.5.1 Culture Collections
Primary methods of culture preservation are continuous growth, drying, and
freezing. Continuous growth methods, in which cultures are grown on agar, typi-
cally are used for short-term storage. Such cultures are stored at temperatures of 5–
20�C, or they may be frozen to increase the interval between subculturing. The
methods are simple and inexpensive because specialized equipment is not required.
Freezing methods, including cryopreservation, are versatile and widely applicable.
Most fungi can be preserved, with or without cryoprotectants, in liquid nitrogen or
in standard home freezers. With freeze-drying, or lyophilization, the fungal cultures
are frozen and subsequently dried under vacuum. The method is highly successful
with cultures that produce mitospores. Freeze-drying and freezing below �135�Care excellent methods for permanent preservation, and we highly recommend them.
However, both methods require specialized and expensive equipment. Permanent
preservation is essential for strains with critically important characteristics and for
type specimens. Cultures that are permanently preserved in metabolically inactive
states can serve as type specimens (Nakasone et al. 2004).
In long-term preservation, sclerotization is an important method. Some fungi
develop sclerotia or other long-term survival propagules in culture as well as in
nature. Preserving such structures, usually at 3–5�C, is a good way of maintaining
fungal strains. Two important methods are the oil overlay method or storage in
distilled, sterilized water (Burdsall and Dorworth 1994; Nakasone et al. 2004).
They are low-cost and low-maintenance methods for preserving cultures, either
growing on agar slants and covered with mineral oil, or placed on cut-out pieces of
solid medium in vials of sterile water. These cultures can be kept for several years or,
in exceptional cases, up to 32 years at room temperature or 15�20�C. This method
is especially appropriate for mycelial or nonsporulating cultures that are not amena-
ble to freezing or freeze-drying, or when lacking suitable lab facilities (Nakasone
et al. 2004).
Traditional methods for assessing fungal diversity in the soil environment rely
mainly on the dilution-plating technique (coupled with use of selective media) and
microscopy to identify sporulating fruiting bodies. The traditional methods tend to
overestimate species that sporulate in soil, while those in mycelial state or those that
have slow growth in culture are largely overlooked. In addition, most of these
methods result in isolation of only the most common and abundant fungi (often
referred to as generalists) such as the asexual ascomycetous molds Fusarium,Penicillium and Trichoderma, Zygomycota (especially Mucor), and the Oomycota
10 Assessing the Mycorrhizal Diversity of Soils and Identification of Fungi 169
(e.g., Pythium). These cultivated microorganisms are those that can utilize the
energy source under the physical and chemical limitations of the growth medium.
This clearly indicates that many other fungi do not respond readily to cultural
techniques. Therefore the diversity data cannot be considered as accurate. Altered
and optimized growth media, coupled with advanced molecular biology techniques,
have demonstrated that a larger proportion of uncultured fungi belonging to novel
fungal lineages could be isolated and identified (Jeewon and Hyde 2007).
Public culture collections are repositories of often published or of economically
critical fungi. Some of the larger culture collections are ATCC (http://www.atcc.org),
CBS (http://www.cbs.knaw.nl), BCCM-MUCL http://bccm.belspo.be), DSMZ
(http://www.dsmz.de/), INVAM (http://invam.caf.wvu.edu), and IFO (http://www.
nbrc.nite.go.jp).
10.5.2 Cultures in Herbaria
The choice of preservation methods depends on the species of concern, the
resources available, and the goal of the project. Therefore it can be a long-term
or short-term preservation. Fungal cultures can be preserved as voucher speci-
mens by drying. The mature fungal colony, in its Petri plate, is placed in a frost-
free freezer. The freezer must be frost-free or the preparation will not dry
properly. Data are written on the plate bottom. After 4–6 weeks the colony
should be sufficiently dry so that it is loose in the plate. The colony is then
transferred either to an archival-paper envelope or to a thin (e.g., 8 mm) Petri
plate and placed in a herbarium packet, and a label with all accompanying data is
prepared. The old plate and lid are discarded. The paper envelopes can be used
for most pyrenomycetes, many discomycetes and all loculomycetes. Delicate taxa
such as zygomycetes, hyphomyctes, coelomycetes and some ascomycetes are best
stored in thin Petri plates. The material is then placed in a 100% cotton rag packet to
which the label is attached with acid-free glue (Wu et al. 2004). Drying is the most
useful method of preservation for cultures that produce spores or other resting
structures.
10.6 Modern Molecular Methods Used
in Fungal Identification
The initial task towards molecular identification of a fungal specimen or culture is
to make nucleic acid available for amplification by the PCR (Saiki et al. 1985).
While there is a plethora of modifications and personal preferences, all at some step
must include the leaking of nucleic acid into a buffer that preserves it but allows
further purification to remove it from PCR-interfering cell wall components and
170 D. Kruger et al.
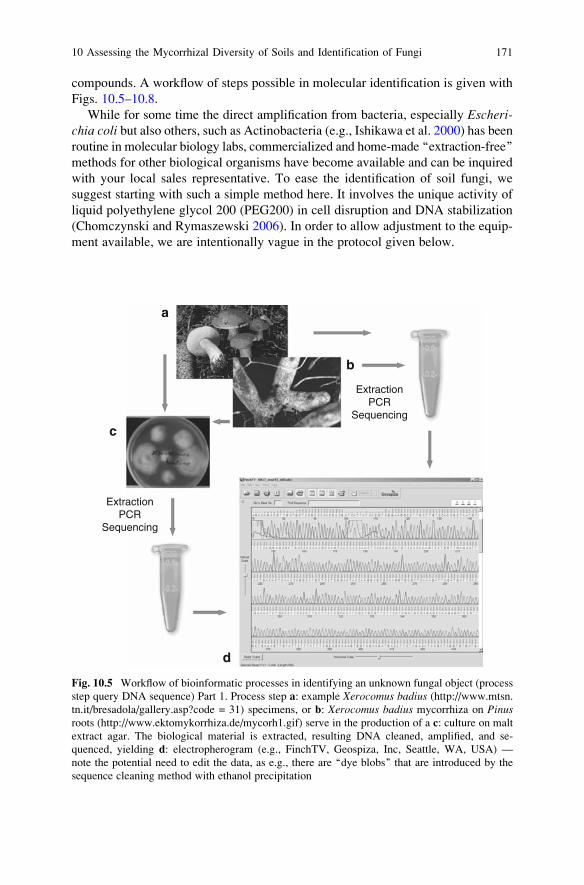
compounds. A workflow of steps possible in molecular identification is given with
Figs. 10.5–10.8.
While for some time the direct amplification from bacteria, especially Escheri-chia coli but also others, such as Actinobacteria (e.g., Ishikawa et al. 2000) has beenroutine in molecular biology labs, commercialized and home-made ‘‘extraction-free’’
methods for other biological organisms have become available and can be inquired
with your local sales representative. To ease the identification of soil fungi, we
suggest starting with such a simple method here. It involves the unique activity of
liquid polyethylene glycol 200 (PEG200) in cell disruption and DNA stabilization
(Chomczynski and Rymaszewski 2006). In order to allow adjustment to the equip-
ment available, we are intentionally vague in the protocol given below.
ExtractionPCR
Sequencing
ExtractionPCR
Sequencing
a
b
c
d
Fig. 10.5 Workflow of bioinformatic processes in identifying an unknown fungal object (process
step query DNA sequence) Part 1. Process step a: example Xerocomus badius (http://www.mtsn.
tn.it/bresadola/gallery.asp?code = 31) specimens, or b: Xerocomus badius mycorrhiza on Pinusroots (http://www.ektomykorrhiza.de/mycorh1.gif) serve in the production of a c: culture on malt
extract agar. The biological material is extracted, resulting DNA cleaned, amplified, and se-
quenced, yielding d: electropherogram (e.g., FinchTV, Geospiza, Inc, Seattle, WA, USA) —
note the potential need to edit the data, as e.g., there are ‘‘dye blobs’’ that are introduced by the
sequence cleaning method with ethanol precipitation
10 Assessing the Mycorrhizal Diversity of Soils and Identification of Fungi 171
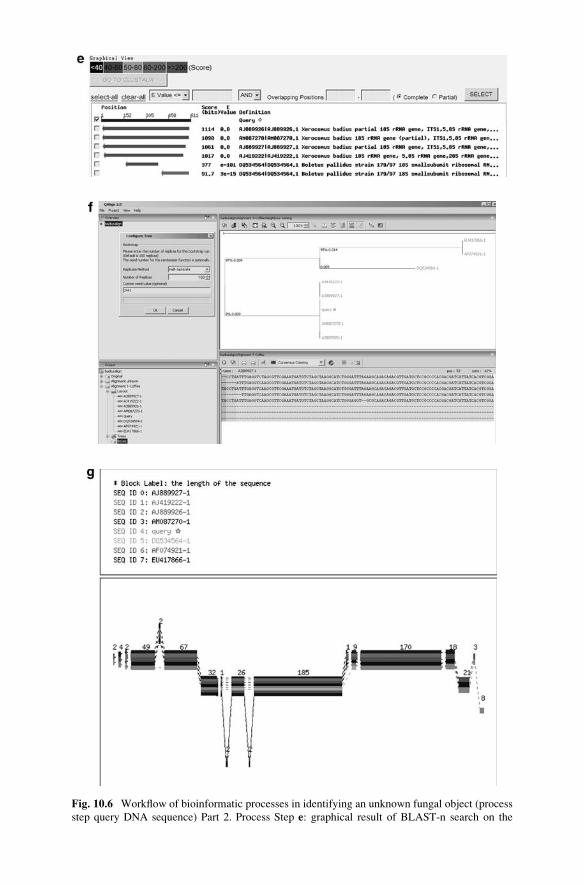
Fig. 10.6 Workflow of bioinformatic processes in identifying an unknown fungal object (process
step query DNA sequence) Part 2. Process Step e: graphical result of BLAST-n search on the
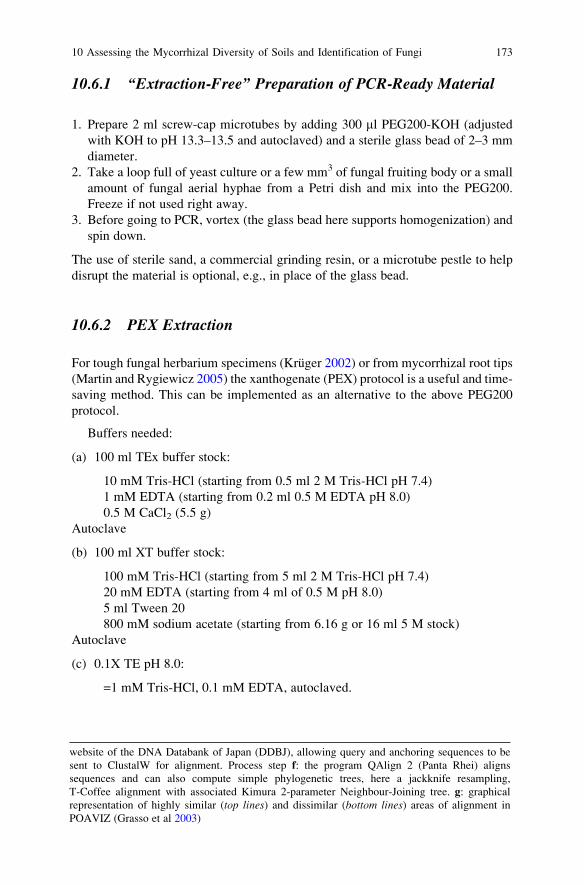
10.6.1 ‘‘Extraction-Free’’ Preparation of PCR-Ready Material
1. Prepare 2 ml screw-cap microtubes by adding 300 ml PEG200-KOH (adjusted
with KOH to pH 13.3–13.5 and autoclaved) and a sterile glass bead of 2–3 mm
diameter.
2. Take a loop full of yeast culture or a few mm3 of fungal fruiting body or a small
amount of fungal aerial hyphae from a Petri dish and mix into the PEG200.
Freeze if not used right away.
3. Before going to PCR, vortex (the glass bead here supports homogenization) and
spin down.
The use of sterile sand, a commercial grinding resin, or a microtube pestle to help
disrupt the material is optional, e.g., in place of the glass bead.
10.6.2 PEX Extraction
For tough fungal herbarium specimens (Kruger 2002) or from mycorrhizal root tips
(Martin and Rygiewicz 2005) the xanthogenate (PEX) protocol is a useful and time-
saving method. This can be implemented as an alternative to the above PEG200
protocol.
Buffers needed:
(a) 100 ml TEx buffer stock:
10 mM Tris-HCl (starting from 0.5 ml 2 M Tris-HCl pH 7.4)
1 mM EDTA (starting from 0.2 ml 0.5 M EDTA pH 8.0)
0.5 M CaCl2 (5.5 g)
Autoclave
(b) 100 ml XT buffer stock:
100 mM Tris-HCl (starting from 5 ml 2 M Tris-HCl pH 7.4)
20 mM EDTA (starting from 4 ml of 0.5 M pH 8.0)
5 ml Tween 20
800 mM sodium acetate (starting from 6.16 g or 16 ml 5 M stock)
Autoclave
(c) 0.1X TE pH 8.0:
=1 mM Tris-HCl, 0.1 mM EDTA, autoclaved.
website of the DNA Databank of Japan (DDBJ), allowing query and anchoring sequences to be
sent to ClustalW for alignment. Process step f: the program QAlign 2 (Panta Rhei) aligns
sequences and can also compute simple phylogenetic trees, here a jackknife resampling,
T-Coffee alignment with associated Kimura 2-parameter Neighbour-Joining tree. g: graphical
representation of highly similar (top lines) and dissimilar (bottom lines) areas of alignment in
POAVIZ (Grasso et al 2003)
10 Assessing the Mycorrhizal Diversity of Soils and Identification of Fungi 173
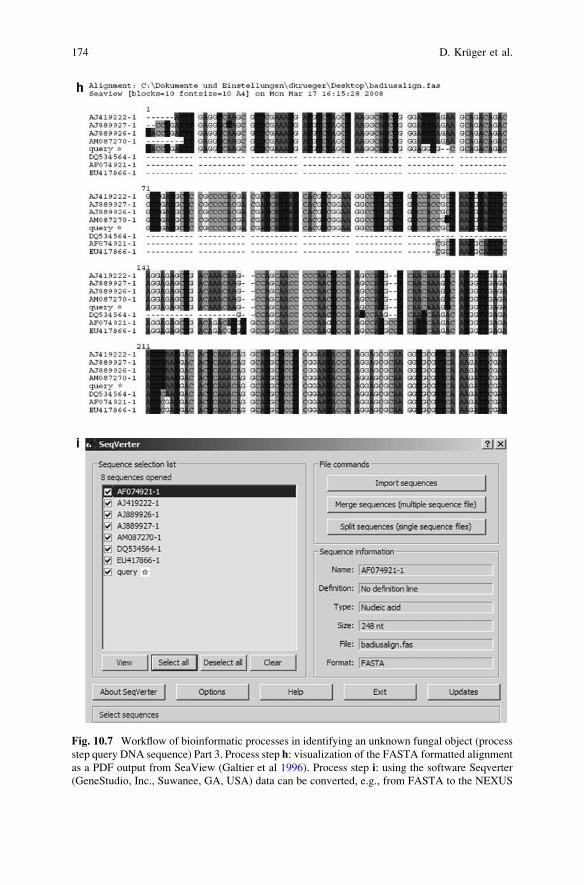
Fig. 10.7 Workflow of bioinformatic processes in identifying an unknown fungal object (process
step query DNA sequence) Part 3. Process step h: visualization of the FASTA formatted alignment
as a PDF output from SeaView (Galtier et al 1996). Process step i: using the software Seqverter
(GeneStudio, Inc., Suwanee, GA, USA) data can be converted, e.g., from FASTA to the NEXUS
174 D. Kruger et al.

Prior to extraction, for each sample dissolve 7.5 mg potassium ethyl xanthogen-
ate (O-ethyl xanthic acid, PEX) in 0.75 ml XT buffer. Possibly heat it slightly. Do
not inhale vapours:
1. Place the fungal material, some sterile sand, and 50 ml phosphate buffered
saline–Tween 20 (10%) or 1% sodium pyrophosphate with 10% Tween 20 in a
1.5 ml microtube. Mesh the material with a sterile microtube pestle. Add 50 mlTEx. Prepare a heating block to 70�C.
2. Add 750 ml XT buffer with added PEX and vortex vigorously.
3. Incubate 60 min at 70�C, shaking occasionally.
4. Incubate 30 min on ice.
5. Centrifuge 10 min at full speed.
Fig. 10.7 (Continued) format j as for example used in PAUP*, Mesquite (Maddison & Maddison
2007a), MacClade (Maddison & Maddison 2007b), or MrBayes
10 Assessing the Mycorrhizal Diversity of Soils and Identification of Fungi 175
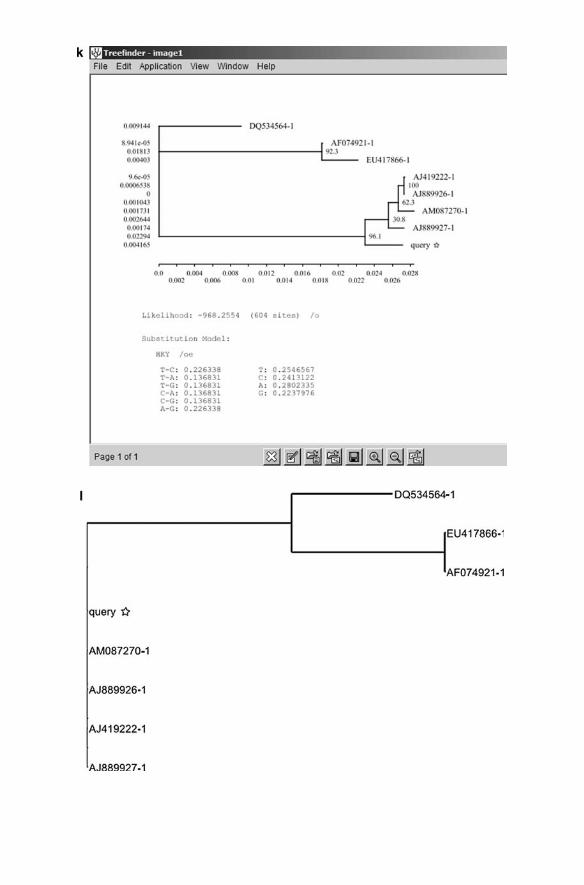
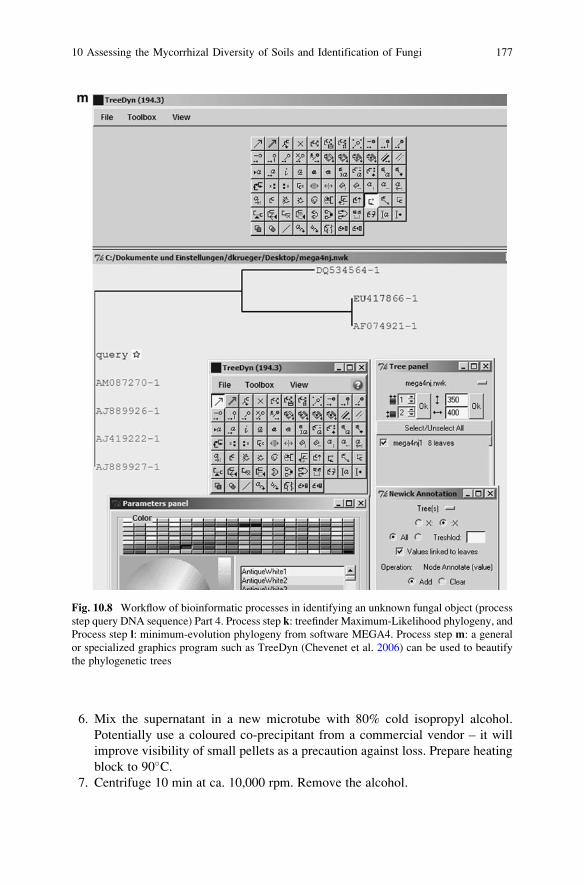
6. Mix the supernatant in a new microtube with 80% cold isopropyl alcohol.
Potentially use a coloured co-precipitant from a commercial vendor – it will
improve visibility of small pellets as a precaution against loss. Prepare heating
block to 90�C.7. Centrifuge 10 min at ca. 10,000 rpm. Remove the alcohol.
Fig. 10.8 Workflow of bioinformatic processes in identifying an unknown fungal object (process
step query DNA sequence) Part 4. Process step k: treefinder Maximum-Likelihood phylogeny, and
Process step l: minimum-evolution phylogeny from software MEGA4. Process step m: a general
or specialized graphics program such as TreeDyn (Chevenet et al. 2006) can be used to beautify
the phylogenetic trees
10 Assessing the Mycorrhizal Diversity of Soils and Identification of Fungi 177

8. Wash the pellet with 100 ml cold ethanol (100%), scraping the tube on a rack to
allow the alcohol to reach all sides.
9. Centrifuge 10 min at full speed.
10. Pipette off alcohol, then incubate 1 min at 90�C. Air dry the pellet.
11. Dissolve the pellet in 50 ml 0.1X TE, placing it 1 min at 90�C.12. Add 0.5 ml RNAse A and spin down. Store at �20�C.
If PCR is inhibited by too much pigment or carbohydrates, clean/re-extract
further with additional chloroform-isoamyl alcohol extraction, a commercial kit,
polyvinylpyrrolidone (Berthelet et al. 1996, Young et al. 1993), polyethylene glycol
8,000 (Howeler et al. 2003), glassmilk and guanidine (Saltikov and Olson 2002), or
hydroxyapatite (Purdy et al. 1996).
10.6.3 Choice of PCR Target
Because the fungal ITS rDNA barcoding region is the most commonly used genetic
marker deposited in databases, usually exhibiting high variability descriptive at the
species level, this is the target of choice. In general, the highly repetitive nature of
the ribosomal DNA genes (Fig. 10.9) by itself makes them easier amplification loci,
offering a higher amount of template than single-copy genes. However, it is
possible that not all loci are created equal, and also noteworthy is that a single
gene may not accurately represent the phylogenetic background of the organism
(Rokas and Carroll 2005). Using ribosomal DNA genes complicates this matter
because it codes for RNA and not protein, and thus the standard models of sequence
evolution may not be adequate (Gesell and von Haeseler 2006). However, for
molecular identification and measuring diversity, precise branching order in phylo-
genetic trees is not troublesome, but rather of interest to hardcore molecular
systematists. Cloning PCR products even from heterogeneous copies of rDNA
from pure cultures or specimens is no more a necessity than if amplifying from
polygenomic extractions. PCR errors and natural sequence heterogeneity within an
organism will play no major role in further analyses explained below.
For the PCR amplification we recommend using a ready mastermix that already
contains the nucleotides, Taq polymerase, and loading dye for subsequent electro-
phoresis. More and more companies provide such solutions which help decrease
cost, workload, and contamination potential. With one such mastermix, we use the
following standard protocol with primers ITS5 and ITS4 (White et al. 1990) (see
Table 10.1). Ideally, some sterile environment and gamma-irradiated reaction tubes
will also decrease chances of contamination.
For ITS5 (GGAAGTAAAAGTCGTAACAAGG) and ITS4 (TCCTCCGCTT
ATTGATATGC) we use the following cycling conditions: initial denaturation
94�C/10 min, 32 cycles of denaturation 94�C/40 s, primer-annealing 54�C/30 s,
extension 72�C/40 s, followed by final extension 72�C/4 min, and a hold at 10�C.Generally, the annealing temperature is to be about 5�C below the melting temper-
ature of the lower one of a primer pair. The melting temperature is given by the
178 D. Kruger et al.
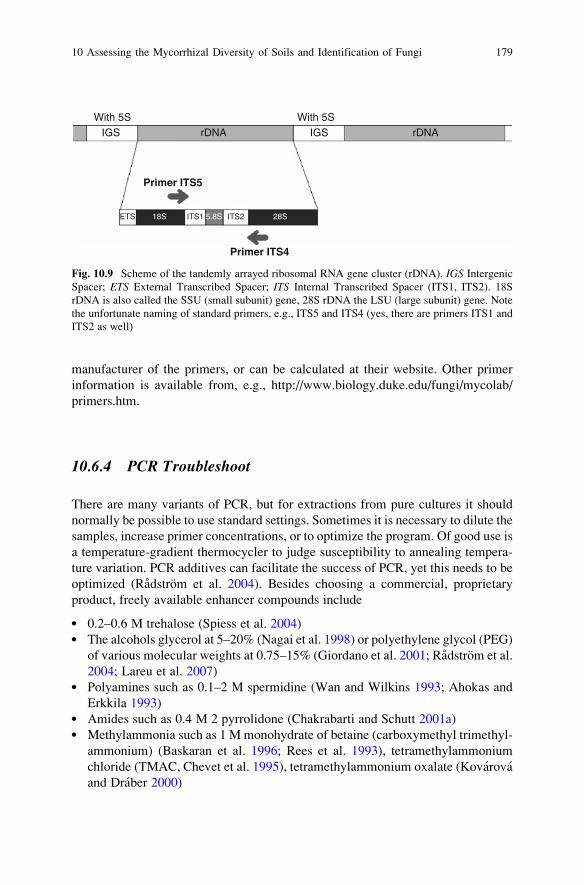
manufacturer of the primers, or can be calculated at their website. Other primer
information is available from, e.g., http://www.biology.duke.edu/fungi/mycolab/
primers.htm.
10.6.4 PCR Troubleshoot
There are many variants of PCR, but for extractions from pure cultures it should
normally be possible to use standard settings. Sometimes it is necessary to dilute the
samples, increase primer concentrations, or to optimize the program. Of good use is
a temperature-gradient thermocycler to judge susceptibility to annealing tempera-
ture variation. PCR additives can facilitate the success of PCR, yet this needs to be
optimized (Radstrom et al. 2004). Besides choosing a commercial, proprietary
product, freely available enhancer compounds include
l 0.2–0.6 M trehalose (Spiess et al. 2004)l The alcohols glycerol at 5–20% (Nagai et al. 1998) or polyethylene glycol (PEG)
of various molecular weights at 0.75–15% (Giordano et al. 2001; Radstrom et al.
2004; Lareu et al. 2007)l Polyamines such as 0.1–2 M spermidine (Wan and Wilkins 1993; Ahokas and
Erkkila 1993)l Amides such as 0.4 M 2 pyrrolidone (Chakrabarti and Schutt 2001a)l Methylammonia such as 1 M monohydrate of betaine (carboxymethyl trimethyl-
ammonium) (Baskaran et al. 1996; Rees et al. 1993), tetramethylammonium
chloride (TMAC, Chevet et al. 1995), tetramethylammonium oxalate (Kovarova
and Draber 2000)
Primer ITS5
Primer ITS4
rDNArDNAIGS
ETS 28S5.8SITS1 ITS218S
IGSWith 5SWith 5S
Fig. 10.9 Scheme of the tandemly arrayed ribosomal RNA gene cluster (rDNA). IGS Intergenic
Spacer; ETS External Transcribed Spacer; ITS Internal Transcribed Spacer (ITS1, ITS2). 18S
rDNA is also called the SSU (small subunit) gene, 28S rDNA the LSU (large subunit) gene. Note
the unfortunate naming of standard primers, e.g., ITS5 and ITS4 (yes, there are primers ITS1 and
ITS2 as well)
10 Assessing the Mycorrhizal Diversity of Soils and Identification of Fungi 179

l 0.5% non-ionic detergents Triton X-100, Tween 20 or Nonidet P-40 (Demeke
and Adams 1992)l Solvents such as 1–5% formamide (Sarkar et al. 1990), 0.15–0.4% tetramethy-
lene sulfone (Chakrabarti and Schutt 2001b), 2–10% dimethyl sulfoxide
(DMSO, Bookstein et al. 1990)l Proteins 0.1-0.8 mg ml�1 BSA or T4 gp32 (Kreader et al. 1996), 0.01–1% gelatin
(Ohler and Rose 1992)l 10–20 mM ammonium sulfate
10.6.5 Sequencing and Editing Sequences
In the modern molecular biology lab, the dye-dideoxy variant of the enzymatic
method by Sanger (Sanger and Coulson 1975) is the standard. Here, a special PCR
reaction containing only one primer synthesizes the DNA from the template, the prior
PCR product. A certain number of deoxy nucleotides are modified to interrupt chain
elongation upon being randomly incorporated in the growing DNA strands. These
also carry different fluorescence labels for each of the four different bases. Hence,
all lengths are produced, and the final nucleotide will be known when the cycle-
sequencing product is electrophoresed on the sequencer. There, it is separated on
either a polyacrylamide gel or a capillary. It is necessary to clean the PCR product
prior to cycle sequencing, and after. The former can be achieved by enzymatic
means (exonuclease/shrimp alkaline phosphatase), or centrifugation through com-
mercially available columns. After cycle sequencing, one uses columns, alcohol
precipitation (perhaps modified with magnetic beads or coprecipitants), or centri-
fugation through self-prepared Sephadex columns.
Sequence output files (electropherograms) can be visualized and edited in a
variety of free software programs, such as Chromas Lite (Technelysium Pty Ltd,
Australia), Staden Package trev.exe (https://sourceforge.net/projects/staden),
Ridom TraceEdit (Ridom GmbH, Wurzburg, Germany), FinchTV (Geospiza,
Inc., Seattle, WA, USA), BioEdit (Hall 1999; Tippmann 2004) or one of the
commercial products. It is necessary to decide on nucleotide composition where
there are artefacts such as ‘‘dye blobs’’ caused by alcohol precipitation. Unreliable
Table 10.1 Typical PCR contents
1x
2X commercial mastermix 9 mlSterile water 8.6 mlPrimer 1 50 mM 0.2 mlPrimer 2 50 mM 0.2 mlPER WELL w/o template 18 mlTemplate (DNA extract) 2 ml
180 D. Kruger et al.

ends need to be trimmed off. In addition, it might be necessary to repeat the
sequencing, sequence with another primer, or clone the PCR products if they appear
to be mixed, rather then having occasional point errors or single nucleotide poly-
morphisms (SNPs). DNA analysis software such as used for phylogenetics, as well
as BLAST-n (Altschul et al. 1997) can deal with the ambiguity codes for nucleo-
tides (see Table 10.2, Cornish-Bowden 1985).
10.6.6 Cloning
If no good sequence can be obtained, e.g., because the specimen or culture is impure
or the ribosomal DNA is heterogeneous, cloning is necessary. It is simplest to use a
T/A or U/A cloning kit (Mead et al. 1991) where the PCR products, which should
have A overhangs due to the peculiarity of Taq polymerase, are ligated into a
special cloning vector for the bacterium E. coli. In that case, one can then directly
add a little pipette tip full of E. coli single colony material into a PCR mix such as
above (barely touch individual colony on plate!), but using primers anchored in the
vector, such as recommended by the cloning kit manufacturer. The sequencing of
the colony PCR product also has the advantage of getting a clean sequence from the
start, as the otherwise usually ‘‘messy’’ start and the region where dye blobs would
Table 10.2 Meaning of letters (IUPAC codes) and symbols in nucleotide sequences
Code Meaning Complement Ribonucleotide type
A A (adenine) T purine
C C (cytosine) G pyrimidine
G G (guanine) C purine
T T (thymine) A pyrimidine
U U (uracil) A pyrimidine (in RNA only)
I I (inosine) N, X purine (RNA; can cost-efficiently
replace N in primers, Candrian
et al 1991)
M A or C K
R A or G Y purine
W A or T W
S C or G S
Y C or T R pyrimidine
K G or T M
V A or C or G B
H A or C or T D
D A or G or T H
B C or G or T V
N, X G or A or T or C N, X
� (in alignment) Indel (insertion/deletion)
* (in alignment) Identical
10 Assessing the Mycorrhizal Diversity of Soils and Identification of Fungi 181

appear are in the vector sequence area. It is necessary to find out in what region of
the DNA sequence is the vector sequence, which can be done with the aid of
commercial tools, as well as by special BLAST (e.g., EMVEC database query,
http://www.ebi.ac.uk/blastall/vectors.html).
The edited DNA data must also be oriented in the correct way, which can be
gauged by BLAST search. Sequences can then be ‘‘reverse complemented.’’ Such
manipulations can be done within the program BioEdit or with the BCM Search
Launcher (http://searchlauncher.bcm.tmc.edu).
10.6.7 Database Queries and Alignment
A good way to BLAST is to use the site of the Japanese data repository DDBJ
(http://www.ddbj.nig.ac.jp/). Here, it is possible to BLAST multiple sequences
together, and also to align query sequences with similar sequences. BLAST outputs
contain two numerical values, one score correlating with similarity of query and
database entry, and the other being the E-value that reflects the probability of
finding matches with equal scores. Hence, one looks for high scores and low
E-values. More information can be found in Korf et al. (2003). The data maintained
at DDBJ are synchronized with the American NCBI GenBank and the European
EMBL database. Alignment can be performed with the ClustalW algorithm
(Thompson et al. 1994), which in DDBJ can also be used to obtain sequences for
anchoring and new sequences for rooting the tree with an outgroup. ClustalW is
also available within BioEdit, or comes with its own graphical interface that can
even produce simple phylogenetic trees (Thompson et al. 1997). There are other,
alternative alignment programs such as Dialign-T (Morgenstern 2004, Subrama-
nian et al. 2005), Divide-and-Conquer (Stoye et al. 1997), Align-m (Van walle et al.
2004), MAVID (Bray and Pachter 2004), MUSCLE (Edgar 2004), POA (Lee et al.
2002), MAFFT (Katoh et al. 2005), multalign (Corpet 1988), T-Coffee (Notredame
et al. 2000), or combinations in the program QAlign (Sammeth et al. 2003, 2006).
A variety of these alignment programs is available for online use at EMBL (http://
www.ebi.ac.uk/Tools/sequence.html). Local databases of sequence data can be
well-managed with the programs ARB (Ludwig et al. 2004), BioEdit, GeneDoc
(Nicholas et al. 1997), or the sequence editor of MEGA (Tamura et al. 2007).
It is also possible to align sequences to the specialized database mor (Hibbett
et al. 2005), which contains the curated data of a large fungal phylogenetic project
(AFTOL, Lutzoni et al. 2004), or to use seeded alignments against the SILVA
database, a progression of ARB and the European Small Subunit Ribosomal RNA
database (http://www.arb-silva.de/, Pruesse et al. 2007). A specialized database
for ectomycorrhizal fungal sequences exists in UNITE (http://www.unite.ut.ee).
The molecular approach to systematics has even led people to propose new classifi-
cations entirely based on cladistic principles (PhyloCode, Donoghue and Gauthier
2004).
182 D. Kruger et al.

Alignment, which also decides on positional homology, is a prerequisite for
phylogenetic analysis showing the putative evolutionary relationship between the
culture or specimen to be identified and database comparison sequences. For the
ITS spacers, alignment can be very difficult beyond closely related taxa. Thus, for
uncertain homology, stretches of sequence should be excluded in the phylogenetic
analysis, although of course the complete data without potential vector sequence
would be deposited in the public repositories upon publication. SequIn (http://
www.ncbi.nlm.nih.gov/Sequin/) at NCBI GenBank can be used when publishing
own sequences. Secondary structure of the ribosomal RNA transcript can some-
times help in alignment, yet when recoding data for structure features information
content is lost (Kruger and Gargas 2004).
10.6.8 Phylogenetic Placement
To simply identify fungi, a phenetics-based distance method such as neighbor-
joining NJ (Kimura 1980) or minimal-evolution ME (Rzhetsky and Nei 1993)
suffices. These are implemented in the package PHYLIP (Felsenstein 2005), or in
MEGA, and rudimentary in ARB, ClustalX and QAlign. Some of these programs
allow specification of a model of DNA sequence evolution. For simple identifica-
tion, this may not be so important. Otherwise, the use of the popular program
PAUP* (Swofford 2002) together with modeltest (Posada and Crandall 1998) is
needed to decide on the model of sequence evolution. More sophisticated phylogenetic
analysis based on different search strategies, e.g., on the principles of maximum-
parsimonyMP (available for example in MEGA and PAUP*), maximum-likelihood
ML (programs PUZZLE, PHYML, or Treefinder; Schmidt et al. 2002, Guindon and
Gascuel 2003, Jobb et al. 2004 respectively), or Bayesian inference (program
MrBayes, Ronquist and Huelsenbeck 2003), is often not needed. One is advised
to read Hall (2004) for instructions. Conflicting signals in phylogenetic data can be
visualized as reticulogram (e.g., Makarenkov 2001, Huson and Bryant 2006). For
likelihood approaches, including Bayesian, more computing power than for NJ is
advised. Commonly, a random resampling/reanalysis strategy is used to gauge
consistency of a dataset and the support for the branching order. The two most
common forms of frequentist support of data-to-tree topology are the jackknife and
the bootstrap over characters (Kruger and Gargas 2006). For example, a clade on a
phylogenetic tree with 67% bootstrap support was found in 67 of 100 resampled
datasets. Branch lengths in phylograms can variably depict the distance, likelihood,
or steps of mutations (the latter in parsimony). A consensus tree usually collapses
all branches with less than 50% support, though perhaps 90% support is considered
as significant in the relationship of the branches. The root of the tree is usually a
sequence or group of sequences a priori known to be closely related to yet outside
the sequences of interest. The programs TreeView (Page 1996), PhyloDraw (Choi
et al. 2000) and Dendroscope (Huson et al. 2007) are three of many for visualization
of phylogenetic trees. Because file types are not always compatible, a conversion
10 Assessing the Mycorrhizal Diversity of Soils and Identification of Fungi 183

tool such as ForCon (Raes and Van de Peer 1999) is useful. A website that contains
several programs to cover various steps in phylogenetic analysis is in development
in France (http://www.phylogeny.fr/) and hopefully will be further expanded.
10.7 Conclusions
Mycorrhizal fungi have the ability to interact with roots and form symbiotic
associations termed mycorrhizae. For fungal identification, field notes, drawings,
and photographs are essential tools. A duplicate set of field notes should be kept
separately although original field notes should be placed with the specimen and, if
available, spore print, both deposited in a publicly accessible herbarium. There are
several traditional methods such as the isolation of fungi from soil samples by serial
dilution, culture plating, microscopic identifications, etc. which form the prelimi-
nary part of fungal identification. Cultures should be kept at a publicly accessible
culture collection. A variety of extraction methods for fungal material yields the
DNA template identification by sequencing, subsequent database comparison,
alignment, and phylogenetic placement of the fruiting bodies and cultures.
Acknowledgments DK thanks Stefan Hempel and Stephan Konig for critical reading of this
manuscript.
References
Agerer R, Ammirati J, Blanz P, Courtecuisse R, Desjardin ED, Gams W, Hallenberg N, Halling R,
Hawksworth LD, Horak E, Korf K, Mueller MG, Oberwinkler F, Rambold G, Summerbell CR,
Triebel D, Watling R (2000) Open letter to the scientific community of Mycologists. Can J Bot
78:981–983
Agrios NG (2005) Plant Pathology, 5th edn. Academic Press, New York
Ahokas H, Erkkila MJ (1993) Interference of PCR amplification by the polyamines, spermine and
spermidine. PCR Methods Appl 3:65–68
Altschul SF, Madden TL, Schaffer AA, Zhang J, Zhang Z, Miller W, Lipman DJ (1997) Gapped
BLAST and PSI-BLAST: A new generation of protein database search programs. Nucleic
Acids Res 25:3389–3402
Anderson IC, Cairney JW (2004) Diversity and ecology of soil fungal communities: increased
understanding through the application of molecular techniques. Environ Microbiol 6:769–779
Baskaran N, Kandpal RP, Bhargava AK, Glynn MW, Bale A, Weissman SM (1996) Uniform
amplification of a mixture of deoxyribonucleic acids with varying GC content. Genome Res
6:633–638
Berthelet M, Whyte LG, Greer CW (1996) Rapid, direct extraction of DNA from soils for PCR
analysis using polyvinylpolypyrrolidone spin columns. FEMS Microbiol Lett 138:17–22
Bookstein R, Lai CC, To H, Lee WH (1990) PCR-based detection of a polymorphic BamHI site in
intron 1 of the human retinoblastoma (RB) gene. Nucleic Acids Res 18:1666
Bray N, Pachter L (2004) MAVID: Constrained ancestral alignment of multiple sequences.
Genome Res 14:693–699
Bridson DM, Forman L (1992) The Herbarium Handbook, 2nd edn. Royal Botanic Gardens, Kew
184 D. Kruger et al.

Burdsall HH Jr, Dorworth EB (1994) Preserving cultures of wood-decaying Basidiomycotina
using sterile distilled water in cryovials. Mycologia 86:275–280
Candrian U, Furrer B, Hofelein C, Luthy J (1991) Use of inosine-containing oligonucleotide
primers for enzymatic amplification of different alleles of the gene coding for heat-stable toxin
type I of enterotoxigenic Escherichia coli. Appl Environ Microbiol 57:955–961
Chakrabarti R, Schutt CE (2001a) The enhancement of PCR amplification by low molecular
weight amides. Nucleic Acids Res 29:2377–2381
Chakrabarti R, Schutt CE (2001b) The enhancement of PCR amplification by low molecular
weight sulfones. Gene 274:293–298
Chevenet F, Brun C, Banuls AL, Jacq B, Christen R (2006) TreeDyn: towards dynamic graphics
and annotations for analyses of trees. BMC Bioinformatics 7:439
Chevet E, Lemaftre G, Katinka MD (1995) Low concentrations of tetramethylammonium chloride
increase yield and specificity of PCR. Nucleic Acids Res 23:3343–3344
Choi JH, Jung HY, Kim HS, Cho HG (2000) PhyloDraw: a phylogenetic tree drawing system.
Bioinformatics 16:1056–1058
Chomczynski P, Rymaszewski M (2006) Alkaline PEG-based method for direct PCR from
Bacteria, Eukaryotic tissue samples, and whole blood. Biotechniques 40:454–458
Coleman DC (2008) From peds to paradoxes: linkages between soil biota and their influences on
ecological processes. Soil Biol Biochem 40:271–289
Cornish-Bowden A (1985) Nomenclature for incompletely specified bases in nucleic acid sequences:
recommendations 1984. Nucleic Acids Res 13:3021–3030
Corpet F (1988) Multiple sequence alignment with hierarchical clustering. Nucleic Acids Res
16:10881–10890
Demeke T, Adams RP (1992) The effects of plant polysaccharides and buffer additives on PCR.
Biotechniques 12:332–334
Donoghue MJ, Gauthier JA (2004) Implementing the PhyloCode. Trends Ecol Evol 19:281–282
Edgar RC (2004) MUSCLE: a multiple sequence alignment method with reduced time and space
complexity. BMC Bioinformatics 5:113
Felsenstein J (2005) PHYLIP (phylogeny inference package) version 3.6. Distributed by the
author. Department of Genome Sciences, University of Washington, Seattle
Finlay DR (2005) Mycorrhizal symbiosis: myths, misconceptions, new perspectives and further
research priorities. Mycologist 19:90–95
Galtier N, Gouy M, Gautier C (1996) SeaView and Phylo_win, two graphic tools for sequence
alignment and molecular phylogeny. Comput Appl Biosci 12:543–548
Gesell T, von Haeseler A (2006) In silico sequence evolution with site-specific interactions along
phylogenetic trees. Bioinformatics 22:716–722
Giordano BC, Ferrance J, Swedberg S, Huhmer AF, Landers JP (2001) Polymerase chain
reaction in polymeric microchips: DNA amplification in less than 240 seconds. Anal Biochem
291:124–132
Grasso C, Quist M, Ke K, Lee C (2003) POAVIZ: a partial order multiple sequence alignment
visualizer. Bioinformatics 19:1446–1448
Guindon S, Gascuel O (2003) A simple, fast, and accurate algorithm to estimate large phylogenies
by maximum likelihood. Syst Biol 52:696–704
Hall B (2004) Phylogenetic trees made easy: a how-to manual, 2nd edn. Sinauer Associates,
Sunderland, MA
Hall TA (1999) BioEdit: a user-friendly biological sequence alignment editor and analysis
program for Windows 95/98/NT. Nucleic Acids Symp Ser 41:95–98
Hibbett DS, Nilsson RH, Snyder M, Fonseca M, Costanzo J, Shonfeld M (2005) Automated
phylogenetic taxonomy: an example in the Homobasidiomycetes (mushroom-forming Fungi).
Syst Biol 54:660–668
Howeler M, Ghiorse WC,Walker LP (2003) A quantitative analysis of DNA extraction and purifica-
tion from compost. J Microbiol Meth 54:37–45
Huson DH, Bryant D (2006) Application of phylogenetic networks in evolutionary studies. Mol
Biol Evol 23:254–267
Huson DH, Richter DC, Rausch C, Dezulian T, Franz M, Rupp R (2007) Dendroscope: An
interactive viewer for large phylogenetic trees. BMC Bioinformatics 8:460
10 Assessing the Mycorrhizal Diversity of Soils and Identification of Fungi 185
Ishikawa J, Tsuchizaki N, Yoshida M, Ishiyama D, Hotta K (2000) Colony PCR for detection of
specific DNA sequences in Actinomycetes. Actinomycetologica 14:1–5
James RB, Bartlett RJ, Amadon JF (1985) A root observation and sampling chamber (rhizotron)
for pot studies. Plant Soil 85:291–293
Jeewon R, Hyde KD (2007) Detection and diversity of fungi from environmental samples:
traditional versus molecular approaches. In: Varma A, Oelmuller R (eds) Advanced Techni-
ques in Soil Microbiology. Springer, Heidelberg, pp 1–3
Jobb G, von Haeseler A, Strimmer K (2004) TREEFINDER: A powerful graphical analysis
environment for molecular phylogenetics. BMC Evol Biol 4:18
Katoh K, Kuma K, Toh H, Miyata T (2005) MAFFT version 5: improvement in accuracy multiple
sequence alignment. Nucleic Acids Res 33:511–518
Kimura M (1980) A simple method for estimating evolutionary rate of base substitutions through
comparative studies of nucleotide sequences. J Mol Evol 16:111–120
Korf I, Yandell M, Joseph Bedell J (2003) BLAST. Basic local alignment search tool. O’Reilly
Media, Sebastopol, CA
Kornerup A,Wanscher JH (1978) Handbook of colour, 3rd revised edn. Eyre Methuen, London
Kovarova M, Draber P (2000) New specificity and yield enhancer of polymerase chain reactions.
Nucleic Acids Res 28:E70–E70
Kreader CA (1996) Relief of amplification inhibition of PCR with bovine serum albumin or T4
gene 32 protein. Appl Environ Microbiol 62:1102–1106
Kruger D (2002) Monographic studies in the genus Polyporus (Basidiomycotina) [doctoral thesis].
University of Tennessee, Knoxville. Available from: http://idserver.utk.edu/?id =
200300000001704
Kruger D, Gargas A (2004) The basidiomycete genus Polyporus — an emendation based on
phylogeny and putative secondary structure of ribosomal RNAmolecules. Feddes Repertorium
115:530–546
Kruger D, Gargas A (2006) New measures of topological stability in phylogenetic trees — Taking
taxon composition into account. Bioinformation 1:327–330
Lareu RR, Harve KS, Raghunath M (2007) Emulating a crowded intracellular environment in vitrodramatically improves RT-PCR performance. Biochem Biophys Res Commun 363:171–177
Lee C, Grasso C, Sharlow MF (2002) Multiple sequence alignment using partial order graphs.
Bioinformatics 18:452–464
Ludwig W et al (2004) ARB: a software environment for sequence data. Nucleic Acids Res
32:1363–1371
Lutzoni F et al. (2004) Assembling the fungal tree of life: progress, classification, and evolution of
subcellular traits. Am J Bot 91:1446–1480
Lynch MD, Thorn RG (2006) Diversity of basidiomycetes in Michigan agricultural soils. Appl
Environ Microbiol 72:7050–7056
Maddison WP, Maddison DR (2007a) Mesquite: a modular system for evolutionary analysis.
Version 2.01. Available from: http://mesquiteproject.org/
Maddison WP, Maddison DR (2007b) MacClade 4. Sinauer Associates, MA
Makarenkov V (2001) T-REX: reconstructing and visualizing phylogenetic trees and reticulation
networks. Bioinformatics 17:664–668
Martin KJ, Rygiewicz PT (2005) Fungal-specific primers developed for analysis of the ITS region
of environmental DNA extracts. BMC Microbiology 5:28
McNeill J, Barrie FR, Burdet HM, Demoulin V, Hawksworth DL,Marhold K, Nicolson DH, Prado J,
Silva PC, Skog JE, Wiersema JH, Turland NJ (2006) International code of botanical nomencla-
ture (Vienna code). Regnum Vegetabile 146. A.R.G. Gantner Verlag, Ruggell, Liechtenstein
Mead DA, Pey NK, Herrnstadt C, Marcil RA, Smith LM (1991) A universal method for the direct
cloning of PCR amplified nucleic acid. Biotechnology 9:657–663
Morgenstern B (2004) DIALIGN: multiple DNA and protein sequence alignment at BiBiServ.
Nucleic Acids Res 32:W33–W36
186 D. Kruger et al.

Mukerji KG, Mandeep, Varma A (1998) Mycorrhizosphere microorganisms: screening and
evaluation. In: Varma A (ed) Mycorrhiza Manual. Springer, Heidelberg, pp 85–96
Nagai M, Yoshida A, Sato N (1998) Additive effects of bovine serum albumin, dithiothreitol, and
glycerol on PCR. Biochem Mol Biol Int 44:157–163
Nakasone KK, Peterson WS, Jong C-S (2004) Preservation and distribution of fungal cultures. In:
Mueller GM, Bills FG, Foster SM (eds) Biodiversity of fungi: inventory and monitoring
methods. Elsevier, Amsterdam, pp 37–47
Newman EI, Reddel P (1987) The distribution of mycorrhizas among families of vascular plants.
New Phytol 106:745–751
Nicholas KB, Nicholas HB Jr, Deerfield DW II (1997) GeneDoc: analysis and visualization of
genetic variation. EMBNET.news 4:1–4
Notredame C, Higgins D, Heringa J (2000) T-Coffee: a novel method for multiple sequence
alignments. J Mol Biol 302:205–217
Ohler LD, Rose EA (1992) Optimization of long-distance PCR using a transposon-based model
system. PCR Methods Appl 2:51–59
Pacioni G (1992) Wet-Sieving and decanting techniques for the extraction of spores of vesicular–
arbuscular fungi. In: Norris JR, Read DJ, Varma AK (eds) Methods in Microbiology. Springer,
Heidelberg, pp 317–322
Page RD (1996) TreeView: an application to display phylogenetic trees on personal computers.
Comput Appl Biosci 124:357–358
Posada D, Crandall KA (1998) Modeltest: testing the model of DNA substitution. Bioinformatics
14:817–818
Pruesse E, Quast C, Knittel K, Fuchs B, Ludwig W, Peplies J, Glockner FO (2007) SILVA: a
comprehensive online resource for quality checked and aligned ribosomal RNA sequence data
compatible with ARB. Nucl Acids Res 35:7188–7196
Purdy KJ, Embley TM, Takii S, Nedwell DB (1996) Rapid extraction of DNA and rRNA
from sediments by a novel hydroxyapatite spin-column method. Appl Environ Microbiol
62:3905–3907
Radstrom P, Knutsson R, Wolffs P, Lovenklev M, Lofstrom C (2004) Pre-PCR processing:
strategies to generate PCR-compatible samples. Mol Biotechnol 26:133–146
Raes J, Van de Peer Y (1999) ForCon: a software tool for the conversion of sequence alignments.
EMBnet.news 6. Distributed for free at: http://bioinformatics.psb.ugent.be/webtools/ForCon/
Ranganayaki N, Tilak VBRK, Manoharachary C, Mukerji GK (2006) Methods and techniques for
isolation, enumeration and characterization of rhizosphere microorganism. In: Mukerji KG,
Manoharachary C, Singh J (eds) Microbial activity in the rhizosphere. Springer, Heidelberg,
pp 17–25
Rees WA, Yager TD, Korte J, von Hippel PH (1993) Betaine can eliminate the base pair
composition dependence of DNA melting. Biochemistry 32:137–144
Rokas A, Carroll SB (2005) More genes or more taxa? The relative contribution of gene number
and taxon number to phylogenetic accuracy. Mol Biol Evol 22:1337–1344
Ronquist F, Huelsenbeck JP (2003) MRBAYES 3: Bayesian phylogenetic inference under mixed
models. Bioinformatics 19:1572–1574
Rzhetsky A, Nei M (1993) Theoretical foundation of the minimum evolution. Method of phylo-
genetic inference. Mol Biol Evol 10:1073–1095
Saiki RK, Scharf S, Faloona F, Mullis KB, Horn GT, Erlich HA, Arnheim N (1985) Enzymatic
amplification of beta-globin genomic sequences and restriction site analysis for diagnosis of
sickle cell anemia. Science 230:1350–1354
Saltikov CW, Olson BH (2002) Homology of Escherichia coli R773 arsA, arsB, and arsC genes in
arsenic-resistant bacteria isolated from raw sewage and arsenic-enriched creek waters. Appl
Environ Microbiol 68:280–288
Sammeth M, Griebel T, Tille F, Stoye J (2006) Panta rhei (QAlign2): an open graphical environ-
ment for sequence analysis. Bioinformatics 22:889–890
10 Assessing the Mycorrhizal Diversity of Soils and Identification of Fungi 187

Sammeth M, Rothganger J, Esser W, Albert J, Stoye J, Harmsen D (2003) QAlign: quality-based
multiple alignments with dynamic phylogenetic analysis. Bioinformatics 19:1592–1593
Sanger F, Coulson AR (1975) A rapid method for determining sequences in DNA by primed
synthesis with DNA polymerase. J Mol Biol 94:441–448
Sarkar G, Kapelner S, Sommer SS (1990) Formamide can dramatically improve the specificity of
PCR. Nucleic Acids Res 18:7465
Schmidt HA, Strimmer K, Vingron M, von Haeseler A (2002) TREE-PUZZLE: Maximum likeli-
hood phylogenetic analysis using quartets and parallel computing. Bioinformatics 18:502–504
Spiess A-N, Mueller N, Ivell R (2004) Trehalose is a potent PCR enhancer: lowering of DNA
melting temperature and thermal stabilization of Taq Polymerase by the disaccharide trehalose.
Clin Chem 50:1256–1259
Stoye J, Moulton V, Dress AW (1997) DCA: an efficient implementation of the divide-and-conquer
approach to simultaneous multiple sequence alignment. Comput Appl Biosci 13:625–626
Subramanian AR, Weyer-Menkhoff J, Kaufmann M, Morgenstern B (2005) DIALIGN-T: An
improved algorithm for segment-based multiple sequence alignment. Bioinformatics 6:66
Swofford DL (2002) PAUP*: phylogenetic analysis using parsimony (and other methods), Version
4.0 Beta. Sinauer Associates, Sunderland, MA
Tamura K, Dudley J, Nei M, Kumar S (2007) MEGA4: molecular evolutionary genetics analysis
(MEGA) software version 4.0. Mol Biol Evol 24:1596–1599
Thompson JD, Gibson TJ, Plewniak F, Jeanmougin F, Higgins DG (1997) The CLUSTAL X
windows interface: flexible strategies for multiple sequence alignment aided by quality analy-
sis tools. Nucleic Acids Res 25:4876–4882
Thompson JD, Higgins DG, Gibson TJ (1994) CLUSTAL W: improving the sensitivity of
progressive multiple sequence alignment through sequence weighting, position-specific gap
penalties and weight matrix choice. Nucleic Acids Res 22:4673–4680
Tippmann FH (2004) Analysis for free: comparing programs for sequence analysis. Brief
Bioinform 5:82–87
Van Walle I, Lasters I, Wyns L (2004) Align-m — a new algorithm for multiple alignment of
highly divergent sequences. Bioinformatics 20:1428–1435
Varma A, Verma S, Sudha, Sahay N, Britta B, Franken P (1999) Piriformospora indica — a
cultivable plant growth promoting root endophyte with similarities to arbuscular mycorrhizal
fungi. Appl Environ Microbiol 65:2741–2744
Varma A, Singh A, Sudha, Sahay N, Sharma J, Roy A, Kumari M, Rana D, Thakran S, Deka D,
Bharti K, Franken P, Hurek T, Blechert O, Rexer K-H, Kost G, Hahn A, Hock B, Maier W,
Walter M, Strack D, Kranner I (2001) Piriformospora indica: A cultivable mycorrhiza-like
endosymbiotic fungus. In: Esser K (eds) Mycota IX. Springer, Heidelberg, pp 123–150
Verma S, Varma A, Rexer KH, Hassel A, Kost G, Sarbhoy A, Bisen P, Buetehorn P, Franken P
(1998) Priformospora indica gen. et sp. nov., a new root-colonizing fungus. Mycologia
90:895–909
Wan CY, Wilkins TA (1993) Spermidine facilitates PCR amplification of target DNA. PCR
Methods Appl 3:208–210
White TJ, Bruns T, Lee S, Taylor JW (1990) Amplification and Direct Sequencing of Fungal
Ribosomal RNA Genes for Phylogenetics. In: Innis MA, Gelfand DH, Sninsky JJ, White TJ
(eds) PCR protocols: a guide to methods and applications. Academic, London, pp 315–322
Wu Q, Thiers MB, Pfister HD (2004) Preparation, preservation and use of fungal specimen in
herbaria. In: Mueller GM, Bills FG, Foster SM (eds) Biodiversity of fungi: inventory and
monitoring methods. Academic, London, pp 23–28
Young CC, Burghoff RL, Keim LG, Minak-Berners V, Lute JR, Hinton SM (1993) Polyvinyl-
pyrrolidone-agarose gel electrophoresis purification of polymerase chain reaction amplifiable
DNA from soils. Appl Environ Microbiol 59:1972–1974
188 D. Kruger et al.
Chapter 11
Isolation of Metabolically Active
Arbuscules and Intraradical Hyphae
from Mycorrhizal Roots
Zakaria M. Solaiman
11.1 Introduction
Arbuscular mycorrhizal (AM) fungi are obligate symbionts and colonize more than
80% terrestrial plant roots and fungi belonging to the Glomales. The mutualistic
nutrient exchange in this symbiosis is characterized by the transfer of phosphorus
from fungi to host plant in exchange for carbon compounds derived from photo-
synthesis (Smith and Read 1997; Solaiman and Saito 1997). It is now well-reported
that phosphate present in soil is taken up into the extraradical hyphae by a
phosphate transporter, subsequently condensed into polyphosphate, and translo-
cated by protoplasmic streaming into the intraradical hyphae (Saito 2000). The
arbuscule is supposed to be the main site for the nutrient exchange. Alkaline
phosphatase activity has been expressed in arbuscules, and it is suggested that
this relates to the efficiency of phosphorous uptake (Tisserant et al. 1992) and
sugar metabolism (Ezawa et al. 1999; Solaiman and Saito 1997) of AM. However,
the carbon and phosphorus metabolism involved in the nutrient exchange at the
arbuscular interface remain to be investigated.
The isolation of arbuscules from the host tissue and subsequent examination of
biochemical activities are required to clarify the mechanism occurring in nutrient
exchange in this symbiotic system. The isolation of arbuscules from host tissue is a
powerful process, especially because this endo-symbiont cannot be independently
cultured in vitro. However, it is not easy to isolate the arbuscules from host tissue
because of the complex penetration of hyphae into cortical cells. Intraradical
Z.M. Solaiman (*)
Soil Science and Plant Nutrition, School of Earth and Environment, M087, Faculty of Natural and
Agricultural Sciences, The University of Western Australia, Crawley, WA 6009, Australia
e‐mail: [email protected]
A. Varma and A.C. Kharkwal (eds.), Symbiotic Fungi, Soil Biology 18, 189
DOI: 10.1007/978‐3‐540‐95894‐9_11, # Springer‐Verlag Berlin Heidelberg 2009

hyphae have been isolated from the host by enzymic digestion of root tissue with
cellulase and pectinase, followed by hand-sorting of the hyphae under a dissecting
microscope (Capaccio and Callow 1982; Smith et al. 1985; Hepper et al. 1986). But
this method was laborious, and enzymic digestion of the mycorrhizal roots for more
than 12 h reduced the metabolic activity of the hyphae, as evaluated by histochem-
ical staining for succinate dehydrogenase (SDH) activity (McGee and Smith 1990).
Later on, Saito (1995) reported a method for isolation of metabolically active
intraradical hyphae from AM onion roots after 1–2 h of enzymic digestion. The
metabolic activity of the isolated hyphae, based upon the evaluation of SDH
staining, was not significantly affected by this enzymic separation procedure. In
addition, a mass of intraradical hyphae which are almost free from plant debris can
be collected after Percoll gradient centrifugation. But this method is still laborious,
and 2–3 h are needed to complete the isolation of the intraradical hyphae or
arbuscules. A simple and rapid method is now available for the isolation of
arbuscules (Senoo et al. 2007). But it needs highly colonized plant roots from
which we can isolate arbuscules without intensive labor.
We now have an increased arbuscule-forming mutant har1 (previously known asLjsym78) of Lotus japonicus L. (Nishimura et al. 2002; Solaiman et al. 2000); this
has shown increased colonization by arbuscules on its roots compared to the wild-
type ‘Gifu’. Most of the arbuscules on the mutant root were SDH-active, well-
developed and tough in morphology. The isolation procedure of arbuscules from
the mutant roots, and the quantity and quality of the isolated arbuscule fraction have
been described elsewhere (Senoo et al. 2007).
11.2 Isolation
11.2.1 Isolation of Arbuscules and Intraradical Hyphaewith Enzymatic Digestion
11.2.1.1 Materials
Waring blender, microscope, slides, reciprocal shaker, centrifuge machine, tubes.
11.2.1.2 Chemicals
(a) Enzymic digestion solution
Mix 1% cellulase, 0.2% pectolase, 0.1% bobin serum albumin, 1 mM dithio-
threitol (DTT), 0.01 M Mesh-NaOH buffer of pH 5.5, 0.3 M mannitol
190 Z.M. Solaiman

(b) Washing buffer (WB)
Mix 0.3 M mannitol, 1 mM DTT, 0.01 M Tris-HCl of pH 7.4
(c) Percoll gradient solution
Prepare 80% Percoll stock solution (prepare 50 ml of 0.05 M Tris-HCl solution,
mix mannitol @1.5 M and DTT @ 5 mM, add 200 ml Percoll, finally adjust pH to
7.4); then prepare gradient Percoll solution by mixing Percoll stock solution (80%)
with washing buffer as 40% (25 ml stock + 25 ml WB), 20% (12.5 ml stock + 37.5
ml WB), and 10% (6.25 ml stock + 43.75 ml WB).
11.2.1.3 Protocol
Isolation of arbuscules is outlined here according to the method of Saito (1995)
used for isolation of intraradical hyphae from onion roots:
1. Immerse fresh onion roots in 0.5 mM CaSO4 for a few minutes. Take out and
remove access CaSO4 using paper towel.
2. Cut into 5-mm segments and weigh 1g, then add 10 ml of enzymic digestion
solution and incubate for 1–2 h at 30�C in a reciprocal shaker at 110–120
strokes per minute.
3. Decant digestion solution on 50 mm nylon mesh, and then wash with washing
buffer.
4. Collect roots in homogeniser in Waring blender and add 10–20 ml, washing
buffer and homogenise for 1 min at a speed of 6,000 rpm.
5. Collect suspension in a beaker on ice and homogenate filter through two layers
of cheesecloth and repeat two more times.
6. Combine filtrates in centrifuge tubes and centrifuge for 10 min at 3,000g.
7. Collect pellet and re-suspend with washing buffer before pouring 5–10 ml of
suspension into Percoll discontinuous gradient solution (prepare by adding 8 ml
of each 40%, 20% and 10% Percoll solution respectively from bottom to top in
a centrifuge tube).
8. Centrifuge at 400g for 30 min. Collect arbuscules and hyphal fraction from
layers between 40% and 20% and also between 20% and 10% in a new tube.
9. Add washing buffer and centrifuge again at 1,000g for 10 min. Filter precipi-
tates on 50 mm nylon mesh and wash with washing buffer.
10. Collect in an Eppendorf tube, centrifuge for 10 min at 1,000g. Store precipitates
and count under microscope by preparing using following methods.
Fix isolated arbuscules and intraradical hyphae with 1 m formaldehyde solution and
stain with trypan blue (0.5 mg per ml w/v). Filter an aliquot (100 ml) of the stainedhyphae on nitrocellulose membrane filter; then air-dry and immerse in microscopic
oil to render them transparent. Measure hyphal length by the gridline intersect
method (Newman 1966) using an eyepiece with a total magnification of �100.
Thick hyphae including intracellular hyphae and arbuscular trunks should be
measured, but it may not be possible to assess the very fine arbuscular branches.
11 Isolation of Metabolically Active Arbuscules and Intraradical Hyphae 191

11.2.2 Isolation of Arbuscules and IntraradicalHyphae without Enzymatic Digestion
11.2.2.1 Materials
Waring blender, microscope, slides, centrifuge machine, tubes.
11.2.2.2 Chemicals
Washing buffer: Prepare by mixing 0.3 M mannitol, 0.01 M Tris-HCl of pH 7.4,
1 mM DTT
11.2.2.3 Protocol
Isolation of arbuscules outlined here according to the method of Senoo et al (2007).
1. Immerse fresh roots of mutant (har1) of Lotus japonicus L. in a cold solution of
0.5 mM CaSO4 for a few minutes, and then cut into 5 mm length. Collect 5g of
the root pieces on nylon mesh (50 mm), and wash with washing buffer.
2. Transfer washed root pieces into a 100 ml homogenizer of Waring blender with
40 ml of cold washing buffer, and homogenize for 30 s at 6,000 rpm.
3. Filter homogenate through two layers of cheesecloth, and again homogenize the
residue with 40 ml of cold washing buffer. Repeat this homogenization/filtration
process two more times.
4. Filter through 50 mm and then 30 mm nylon mesh. Collect residue on the 30 mmnylon mesh with a Pasteur pipette as the arbuscule and hyphae fractions. Do all
the procedures at 0–4�C if possible.
5. Store precipitate and count under microscope by staining using appropriate
methods.
11.2.3 Measurement of Metabolic Activity of IsolatedArbuscules and Hyphae
11.2.3.1 Materials
Microscope, slides, needles.
11.2.3.2 Chemicals
0.25 M sodium succinate, 0.5 mMMgCl2, nitroblue tetrazolium (1 mg ml�1), 4 mM
a-naphtyl acid phosphate, Fast Blue RR (0.6 mg ml�1), 0.1 M Tris-HCl buffer
(pH 8.5), 0.1 M sodium acetate buffer.
192 Z.M. Solaiman
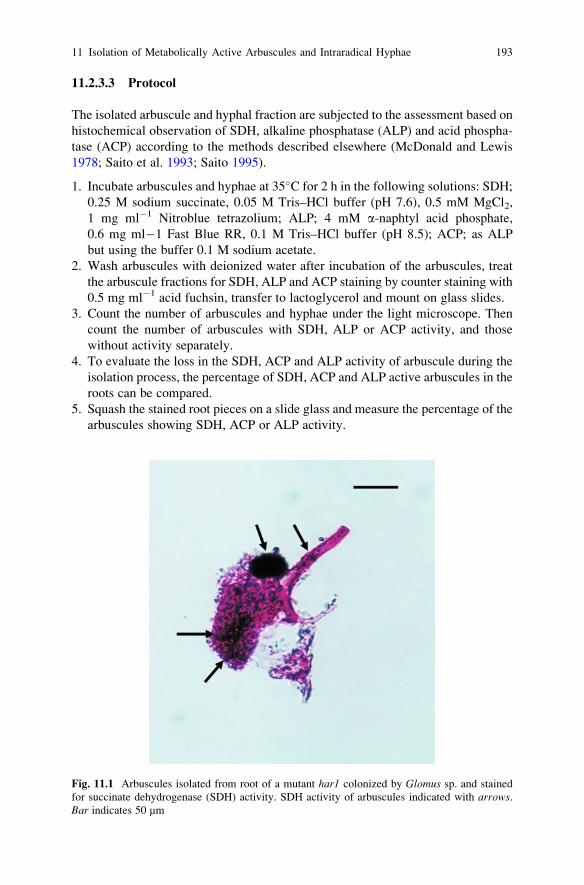
11.2.3.3 Protocol
The isolated arbuscule and hyphal fraction are subjected to the assessment based on
histochemical observation of SDH, alkaline phosphatase (ALP) and acid phospha-
tase (ACP) according to the methods described elsewhere (McDonald and Lewis
1978; Saito et al. 1993; Saito 1995).
1. Incubate arbuscules and hyphae at 35�C for 2 h in the following solutions: SDH;
0.25 M sodium succinate, 0.05 M Tris–HCl buffer (pH 7.6), 0.5 mM MgCl2,
1 mg ml�1 Nitroblue tetrazolium; ALP; 4 mM a-naphtyl acid phosphate,
0.6 mg ml�1 Fast Blue RR, 0.1 M Tris–HCl buffer (pH 8.5); ACP; as ALP
but using the buffer 0.1 M sodium acetate.
2. Wash arbuscules with deionized water after incubation of the arbuscules, treat
the arbuscule fractions for SDH, ALP and ACP staining by counter staining with
0.5 mg ml�1 acid fuchsin, transfer to lactoglycerol and mount on glass slides.
3. Count the number of arbuscules and hyphae under the light microscope. Then
count the number of arbuscules with SDH, ALP or ACP activity, and those
without activity separately.
4. To evaluate the loss in the SDH, ACP and ALP activity of arbuscule during the
isolation process, the percentage of SDH, ACP and ALP active arbuscules in the
roots can be compared.
5. Squash the stained root pieces on a slide glass and measure the percentage of the
arbuscules showing SDH, ACP or ALP activity.
Fig. 11.1 Arbuscules isolated from root of a mutant har1 colonized by Glomus sp. and stained
for succinate dehydrogenase (SDH) activity. SDH activity of arbuscules indicated with arrows.Bar indicates 50 mm
11 Isolation of Metabolically Active Arbuscules and Intraradical Hyphae 193

11.3 Conclusions
A simple and rapid method for isolation of metabolically active arbuscules from
onion root after enzymatic digestion, and from the root of increased arbuscule-
forming mutant (har1) of Lotus japonicus L. without enzymatic digestion is
described. Enzyme histochemical staining showed that the collected arbuscules
had succinate dehydrogenase (SDH), alkaline phosphatase (ALP), and acid phos-
phatase (ACP) activities. It was observed that the SDH activity of arbuscules was
retained after the isolation process (Fig. 11.1). The development of a simple and
quick method for isolation of metabolically active arbuscules will shed light for
possible investigation of the biochemical mechanisms in nutrient (phosphorus and
carbon) exchange occurring at the arbuscular interface.
References
Capaccio LCM, Callow JA (1982) The enzymes of polyphosphate metabolism in vesicular–
arbuscular mycorrhizas. New Phytol 91:81–91
Ezawa T, Kuwahara S, Sakamoto K, Yoshida T, Saito M (1999) Specific inhibitor and substrate
specificity of alkaline phosphatase expressed in the symbiotic phase of the arbuscular mycor-
rhizal fungus Glomus etunicatum. Mycologia 91:636–641
Hepper CM, Sen R, Maskall CS (1986) Identification of vesicular–arbuscular mycorrhizal fungi in
roots of leek (Allium porrum L.) and maize (Zea mays L.) on the basis of enzyme mobility
during polyacrylamide gel electrophoresis. New Phytol 102:529–539
McDonald RM, Lewis M (1978) The occurrence of some acid phosphatases and dehydrogenases
in the vesicular–arbuscular mycorrhizal fungus Glomus mosseae. New Phytol 80:135–140
McGee PA, Smith AE (1990) Activity of succinate dehydrogenase in vesicular–arbuscular my-
corrhizal fungi after enzymic digestion from roots of Allium porrum. Mycol Res 94:305–308
Newman EI (1966) A method of estimating the total length of root in a sample. J Appl Ecol
3:139–145
Nishimura R, Hayashi M, Wu G-J, Kouchi H, Imaizumi-Anraku H, Murakami Y, Kawasaki S,
Akao S, Ohmori M, Nagasawa M, Harada K, Kawaguchi M (2002) HAR1 mediates systemic
regulation of symbiotic organ development. Nature 420: 426–429
Saito M (1995) Enzyme activities of the internal hyphae and germinated spores of an arbuscular
mydorrhizal fungus, Gigaspora margarita Becker & Hall. New Phytol 129:425–431
Saito M (2000) Symbiotic exchange of nutrients in arbuscular mycorrhizas: Transport and transfer
of phosphorus. In: Kapulnik Y, Douds DD Jr. (eds) Arbuscular mycorrhizas: physiology and
function. Kluwer, London, pp 85–106
Saito M, Stribley DP, Hepper CM (1993) Succinate dehydrogenase activity of external and internal
hyphae of a vesicular–arbuscular mycorrhizal fungus, Glomus mosseae (Nicol. & Gerd.)
Gerdmann and Trappe during mycorrhizal colonization of roots of leek (Alliu porrum L.), as
revealed by in situ histochemical staining. Mycorrhiza 4:59–62
Senoo K, Solaiman ZM, Tanaka S, Kawaguchi M, Imaizumi-Anraku H, Akao S, Tanaka A, Obata
H (2007) Isolation and characterization of arbuscules from roots of an increased arbuscule-
forming mutant of Lotus japonicus. Ann Bot 100:1599–1603
Smith SE, Read DJ (1997) Vesicular–arbuscular mycorrhizas. In: Mycorrhizal symbiosis. Aca-
demic, London, pp 9–160
194 Z.M. Solaiman

Smith SE, St John BJ, Smith FA, Nicholas DJD (1985) Activity of glutamate synthase and
glutamate dehydrogenase in Trifolium subterraneum L. and Allium cepa L.: effects of mycor-
rhizal function and phosphate nutrition. New Phytol 99: 211–227
Solaiman MZ, Saito M (1997) Use of sugars by intraradical hyphae of arbuscular mycorrhizal
fungi revealed by rediorespirometry. New Phytol 136:533–538
Solaiman MZ, Senoo K, Kawaguchi M, Imaizumi-Anraku H, Akao S, Tanaka A, Obata H (2000)
Characterization of mycorrhizas formed by Glomus sp. on roots of hypernodulating mutants of
Lotus japonicus. J Plant Res 113:443–448Tisserant B, Gianinazzi-Pearson V, Gianinazzi S, Gollotte A (1992) In planta histochemical
staining of fungal alkaline phosphatase activity for analysis of efficient arbuscular mycorrhizal
infections. Mycol Res 97:245–250
11 Isolation of Metabolically Active Arbuscules and Intraradical Hyphae 195

Chapter 12
Interaction with Soil Microorganisms
R. Hampp and M. T. Tarkka
12.1 Introduction
Roots constitute important plant organs for water and nutrient uptake. However,
they also release a wide range of carbon compounds of low molecular weight.
These can amount to between 10 and 20% of total net fixed carbon (Rovira 1991)
and form the basis for an environment rich in diversified microbiological popula-
tions, the rhizosphere (Hiltner 1904). Its specific conditions lead to the selection of
distinct microbial communities (Smalla et al. 2001), where fungi play an important
role (Linderman 1988; Andrade et al. 1997; Frey-Klett et al. 2005; de Boer et al.
2005). This is due to the fact that the fungal hyphae, which emanate from mycor-
rhizas, release a substantial amount of the acquired plant carbon to the soil. The
energy-rich plant compounds promote bacterial growth and survival (Hobbie 1992),
and the soil volume filled with mycorrhizal fungal hyphae is therefore often depicted
as the mycorrhizosphere (Foster and Marks 1967).
The mycorrhizosphere effect leads to the enrichment of microorganisms that
improve plant fitness (Frey-Klett et al. 2005). Some of the mycorrhizosphere
organisms directly influence the development and physiology of the plants through
the production of plant growth regulators (Azcon et al. 1978), by increasing the root
branching rate or root permeability. Others may interact in a more indirect way
that supports plant growth. For example, the interacting organisms may improve
nitrogen or phosphate availability, lead to better survival of the hyphae and the
plants in a contaminated soil, assist the plant resistance against pathogens by
R. Hampp (*)
Institute of Microbiology, Department of Physiological Ecology of Plants,University of Tuebingen,
Auf der Morgenstelle 172076 Tuebingen, Germany
e-mail: [email protected]
T. TarkkaUFZ, Helmholtz-Centre for Environmental Research, Department of Soil Ecology, Theodor-
Lieser-Strasse 4, D-06120 Halle, Germany
A. Varma and A.C. Kharkwal (eds.), Symbiotic Fungi, Soil Biology 18, 197
DOI: 10.1007/978‐3‐540‐95894‐9_12, # Springer‐Verlag Berlin Heidelberg 2009
biological control, or show direct effects on soil quality (Barea et al. 2005; Frey-
Klett et al. 2005).
The most investigated group of microorganisms interacting with mycorrhizal
fungi and plants are the mycorrhizosphere bacteria (de Boer et al. 2005). These
include intrahyphal bacteria in ectomycorrhizal (Bertaux et al. 2003) and intra-spore
bacteria in arbuscular mycorrhizal (Bianciotto et al. 1996) fungi, as well as bacterial
species that colonize the surfaces of fungal hyphae and mycorrhizal roots (Foster
and Marks 1967; Nurmiaho-Lassila et al.1997; de Boer et al. 2005; Artursson et al.
2006). Some of the mycorrhizosphere bacteria, classified as Mycorrhiza Helper
Bacteria (MHB, Garbaye 1994), can promote mycorrhiza formation. These include
a variety of Gram-negative (Gryndler and Vosatka 1996; Founoune et al. 2002) and
Gram-positive (Ames 1989; Abdel-Fattah and Mohamedin 2000; Maier et al. 2004;
Schrey et al. 2005) species.
We have worked on a collection of actinomycetes (Gram-positive) that were
isolated from the rhizosphere of a Norway spruce (Picea abies) stand. One of the
isolates, Streptomyces sp. AcH 505, significantly promoted the mycelial growth and
mycorrhization rate of the symbiotic fungus Amanita muscaria but suppressed the
mycelial extension of the plant pathogens Armillariella obscura and Heterobasi-dion annosum (Maier et al. 2004). This indicates an important application for such
mycorrhization helper bacteria: the simultaneous promotion of mycorrhizal symbi-
osis as well as the suppression of pathogenic fungi. For more information on this
topic see Schrey et al. (2005), Tarkka et al. (2006), Riedlinger et al. (2006), and
Keller et al. (2006).
In this chapter we present some methods which we use to investigate the
interactions between filamentous Gram-positive bacteria from the genus Strepto-myces with mycorrhizal and plant-pathogenic fungi, and plants. In practice we have
investigated the interaction between two to three organisms at once under in vitroconditions. This has enabled us to dissect some mechanisms of action of strepto-
mycetes (reviewed in Tarkka and Hampp 2008).
12.2 Fungal Growth Promotion in Bacterium–Fungus
Co-Cultures: An Indication of Mycorrhiza
Helper Function
Due to the ease in handling, dual cultures on agar media are commonly used to
screen for interactions between fungi and bacteria. A strong correlation exists
between the induction of fungal growth in dual cultures and mycorrhization helper
effect (Garbaye 1994; Frey-Klett et al. 2007).
Three methods are commonly used for co-culturing fungi and bacteria on solid
media. One approach is to grow the bacteria next to the fungus on agar medium,
allowing diffusible molecules to interact with the organisms. Another approach
includes the use of a cellophane membrane (CM) below the fungal material
(Fig. 12.1). This way, fungal growth into the agar is prohibited, i.e., fungal growth
198 R. Hampp, M.T. Tarkka
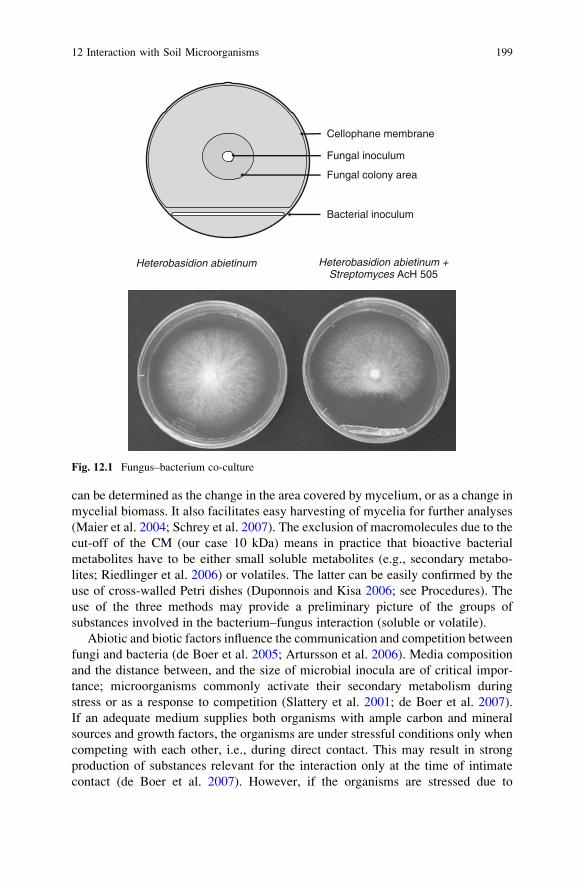
can be determined as the change in the area covered by mycelium, or as a change in
mycelial biomass. It also facilitates easy harvesting of mycelia for further analyses
(Maier et al. 2004; Schrey et al. 2007). The exclusion of macromolecules due to the
cut-off of the CM (our case 10 kDa) means in practice that bioactive bacterial
metabolites have to be either small soluble metabolites (e.g., secondary metabo-
lites; Riedlinger et al. 2006) or volatiles. The latter can be easily confirmed by the
use of cross-walled Petri dishes (Duponnois and Kisa 2006; see Procedures). The
use of the three methods may provide a preliminary picture of the groups of
substances involved in the bacterium–fungus interaction (soluble or volatile).
Abiotic and biotic factors influence the communication and competition between
fungi and bacteria (de Boer et al. 2005; Artursson et al. 2006). Media composition
and the distance between, and the size of microbial inocula are of critical impor-
tance; microorganisms commonly activate their secondary metabolism during
stress or as a response to competition (Slattery et al. 2001; de Boer et al. 2007).
If an adequate medium supplies both organisms with ample carbon and mineral
sources and growth factors, the organisms are under stressful conditions only when
competing with each other, i.e., during direct contact. This may result in strong
production of substances relevant for the interaction only at the time of intimate
contact (de Boer et al. 2007). However, if the organisms are stressed due to
Cellophane membrane
Fungal inoculum
Fungal colony area
Bacterial inoculum
Heterobasidion abietinum Heterobasidion abietinum +Streptomyces AcH 505
Fig. 12.1 Fungus–bacterium co-culture
12 Interaction with Soil Microorganisms 199

suboptimal medium composition, continuous production of at least some secondary
metabolites can be expected. Among others we have observed that changes in
media composition lead to different outcomes in the interactions between organisms.
For example, the mutualistic interaction between Streptomyces AcH 505 and Ama-nita muscaria, changes to an antagonistic one if the organisms are cultivated
on ISP2 medium instead of the MMN medium. AcH 505 grows extremely well
on ISP2 and sporulates much more strongly than on MMN, indicating that the
concentrations of antifungal metabolites dominate on ISP2 but not on MMN. The
fungal response is also related to the growth rate of the mycelium. We and others
have observed that if the growth rate of a fungus is high due to optimal growth
conditions, the growth-promoting influence by a bacterium may no longer be
apparent. In line with this, the strain of Amanita muscaria growing most slowly
on MMN was most responsive to the mycorrhization helper streptomycetes, AcH
505 and AcH 1003 (Schrey et al. 2005). This suggests that bacteria may compensate
for poor growth, but may not increase the maximum growth of faster growing
fungal isolates under optimal growth conditions.
Further crucial factors influencing the bacterium–fungus interactions are the
quality and the extent of bacterial or fungal inocula. Both the bacteria and the
fungi may lose some of their characteristics over time. This includes alterations in
secondary metabolite production in bacteria and decreased mycorrhization capacity
in the fungi. Therefore it is advisable to have a set of glycerol stocks of the bacteria
at �80�C and a good stock of fungal cultures at +4�C. As far as the mycorrhiza
helper bacteria are concerned, a fine balance exists between too small (no effect),
adequate (fungal growth promotion), and excess (no influence or antagonism)
amounts of bacterial inocula. It is thus necessary to inoculate equal amounts of
equally fresh bacteria from the same culture density, holding on to the same
culturing conditions. Growth conditions may also influence the interactions.
Deveau et al. (2007) used 10�C to maximize the reproducibility of Laccariabicolor–Pseudomonas fluorescens dual cultures for analyses of the fungal transcrip-tome. Correctly they argued that instead of artificial temperatures used normally
for dual cultures (around 20–25�C), 10�C is a normal temperature in temperate or
boreal forest soils, and should thus be more commonly used for interaction studies.
12.3 Rapid Fungal Responses to Bacteria and Their
Metabolites: Bacterium–Fungus Suspension Cultures
Detailed information of interaction mechanisms between microbes may be acquired
by the treatment of one microbe with culture supernatant or growth regulator of
another microbe (Melin et al. 1999; Agarwal et al. 2003). The tip regions of fungal
hyphae respond most strongly to interacting organisms (Schrey et al. 2007). As only
the extreme front of the mycelium in solid agar cultures is metabolically active,
harvesting the entire mycelium from solid agar cultures leads to the risk of masking
the active responses occurring in the extending hyphal tips. One option to prevent this
200 R. Hampp, M.T. Tarkka

is to collect the mycelium from as short a distance from the mycelial front as
possible (Deveau et al. 2007). A second option is the use of suspension cultures;
when these are homogenized regularly, the cultures consist entirely of actively
growing hyphal tips. In our opinion the suspension cultures are thus most suitable
for the investigation of rapid fungal responses to organisms and their bioactive
metabolites. The isolation of bioactive metabolites is also much easier from sus-
pension cultures than from solid media (Riedlinger et al. 2006). However, the
fungal responses may differ between submerged cultures and those grown on
solid media.
12.4 Materials
12.4.1 Reagents for Culture
12.4.1.1 CMS Medium
Citric acid 2 mM
MgCl2 � 6H2O 1.25 mM
KCl 10 mM
Na2SO4 2 mM
NaH2PO4 � H2O 10 mM
NH4Cl 100 mM
Glucose 200 mM
MES-Buffer, pH 7.2 200 mM
Trace elements solution (TE) 1% v/v
Agar 2% w/v
12.4.1.2 Trace Elements (TE, in 0.1 N HCl)
FeCl3 � 6H2O 1 mM
MnSO4 � H2O 2.5 mM
CuSO4 � 5H2O 0.2 mM
CaCl2 � 2H2O 10 mM
H3BO3 1 mM
CoCl2 � 6H2O 0.1 mM
ZnCl 0.5 mM
Na2MoO4 � H2O 0.1 mM
12.4.1.3 ISP2 Agar (Shirling and Gottlieb 1966)
Yeast extract 4 g/l
Malt extract 10 g/l
Glucose 4 g/l
12 Interaction with Soil Microorganisms 201

Agar-agar 20 g/l
Distilled water at 1 l
pH 7.3
12.4.1.4 MMN Agar (Molina and Palmer 1982)
CaCl2 � 2H2O 0.05 g/l
NaCl 0.025 g/l
NaH2PO4 � H2O 0.5 g/l
MgSO4 � 7 H2O 0.15 g/l
FeCl3 � 6H2O 1 mg/l
Thiamine hydrochloride 100 mg/lTrace elements (TE) 10 ml/l
pH 6.6
Agar-agar 2% (w/v)
12.4.1.5 Malt Agar (1.5%)
Malt extract 10 g/l
Agar-agar 1.5%
12.4.2 Organisms
12.4.2.1 Fungi
Amanita muscaria strains were isolated from fruiting bodies collected in the Schon-
buch forest near Tubingen, Germany. They were cultivated in the dark at 20�C on
MMNagarwith1%glucose.Heterobasidion strains were obtained from K. Korhonen
(Finish Institute of Forest Research, Finland) and maintained on malt agar.
12.4.2.2 Soil Bacteria (Actinomycetes)
As a source for bacteria we used a spruce stand with well-mycorrhized roots and
extensive fruiting body formation by Amanita muscaria. As described in Maier
et al. (2004), soil samples were taken from the respective ‘‘hyphosphere’’ which was
defined as the fungal hyphae-containing organic layer after removal of the upper-
most undigested litter layer; between 3–8 cm from the surface and at a distance of
�2 m from the next spruce trunk. Five samples from an area covering 1.5 m2 of
surface area were mixed. The soil samples were kept at 60�C for 40 min. Bacteria
were isolated from soil by membrane filtration according to Hirsch & Christensen
(1983). The procedure was as follows:
For growth of bacteria, synthetic CMS medium was used. To suppress the
growth of fungi, the medium contained 100 mg ml�1 each of cycloheximide
202 R. Hampp, M.T. Tarkka

and candicidin. The antibiotics, glucose, magnesium chloride, and TS were ster-
ilized by filtration through a 0.2 mm membrane and added separately to autoclaved
and cooled CMS before the plates were poured. The solidified medium was covered
by a cellulose ester membrane (mesh size 0.3 mm; Millipore). Soil samples (0.5 g)
were suspended in 100 ml sterilized, distilled water and vigorously shaken for
30 min. The membrane surface was inoculated with 200, 100, and 50 ml aliquots.This approach selects for actinomycetes; only these are able to penetrate the
membrane pores in order to grow into the underlying agar. In contrast, growth of
other bacteria is restricted to the membrane surface. The purity of optically distin-
guishable colonies was verified by repeated culture of diluted samples on ISP 2 agar
in the dark at 20�C (Shirling and Gottlieb 1966).
12.5 Procedures
12.5.1 Culture on Solid Media
For testing the effect of bacteria on fungal growth, dual cultures were used. The
fungal inoculum was excised from the actively growing edge of a fungal colony
using the wide end of a Pasteur pipette and transferred to the center of a sterile
cellophane sheet (exclusion limit 10 kDa; Folia, Wendelstein, Germany) on top of
ISP 2 agar and contained in a 9-cm-diameter Petri dish (compare Fig. 12.1;
Maier 2003). Bacterial isolates were applied to the edge of the Petri dish outside
the cellophane layer as a thin line of about 4 cm in length. The distance bet-
ween the inocula was approximately 3.5 cm. In order to provide sufficient gas
exchange, the Petri dishes were not sealed with Parafilm. Contamination was kept
to a minimum by placing the Petri dishes in miniature plant culture chambers at
20�C in darkness. For preliminary screening, two independent trials with four
parallels each were performed. With bacterial isolates which had been shown to
promote or suppress fungal growth, culture experiments were extended for up to 11
weeks (slow growing Amanita muscaria) with three trials each consisting of 20
parallels.
Stock solutions of bioactive secondary metabolites from AcH 505 culture
supernatant, the growth-promoting compound auxofuran and antifungal compound
WS-5995 B (Riedlinger et al. 2006), were prepared by dissolving the substances in
MeOH at concentrations of 50 mM for auxofuran and 30 mM for WS-5995 B.
7-dehydroxyauxofuran, which is liquid at room temperature, was diluted to obtain a
concentration of 50 mM in MeOH. After a short incubation at room temperature,
the stock solutions were vortexed vigorously to ensure that the compounds were
completely dissolved before use. For all substances, concentrations ranging from
150 nM to 150 mM were used to assess their impact on fungal growth.
For the analysis of mycelial growth on solid media, Petri dishes were filled with
35 ml MMNmedium. The compounds were added to 40�C warm medium in 100 ml
12 Interaction with Soil Microorganisms 203
of MeOH. Introduction of specific substances directly into 40�C culture medium
gave results comparable to the results obtained when substances were applied to the
top of the agar. A cellophane sheet was placed on the MMN medium, and four
fungal inocula were positioned equally spaced from the Petri dish margin. The radii
of fungal colonies were determined after 3 and 6 weeks of growth. Fungal growth
was recorded by means of a digital image analysis system (DIAS, Bachofer,
Reutlingen, Germany). The density of the fungal mycelium in DC was determined
as the ratio between the weight and the surface area of the outermost zone of the
circular mycelium (zone width 1 cm).
To harvest the mycelium for biochemical analyses, the outermost area of 1 cm
width was rapidly separated from the older tissue using a sterile scalpel, weighed
and immediately frozen in liquid nitrogen and stored at�80�C. For immediate light
microscopy of the mycelium, a 1 � 1 cm section of the cellophane sheet including
the mycelial front was cut out with a scalpel, placed on a microscope slide, and
covered with a cover slip.
12.5.2 Suspension Cultures
Suspension cultures of Amanita muscaria were started from 8-week old mycelium
growing on MMN agar. The fungal mycelium was finely cut, transferred to MMN
medium and homogenized with an Ultra-Thurrax (Janke and Kunkel, Germany).
The MMN medium was exchanged once a week. Streptomycete cultures were
started by adding three loopfuls of bacterial spores and filaments to 80 ml MMN
medium in a 300 ml Erlenmeyer flask with a metal spiral on the bottom of the vials.
All cultures were incubated in the dark at 20�C on a rotary shaker at 80 rpm. If not
otherwise stated, fungal suspension cultures (5 days after the change of the MMN
medium) were used for the different treatments described below. After 5 days of
incubation, the fungal mycelium is actively growing and most of the nutrients have
been depleted from the culture medium.
To determine the effect of streptomycete culture supernatants on fungal gene
expression, each bacterium was grown until an OD600 of 0.2 in MMN medium.
Fifteen ml of streptomycete suspension were filtered with a 0.22 mm mesh and
added to 45 ml of fungal suspension culture (1/4; v/v). Auxofuran and WS-5995 B
were applied on the mycelium of A. muscaria to test their influence on fungal gene
expression. Prior to substance application to submerged fungal mycelia, the fungal
suspension cultures were washed twice with MMN, and the substances were added
in 100 ml of MeOH to the culture medium. The final concentration of auxofuran was
15 mM, corresponding to a concentration that promoted A. muscaria growth to a
comparable extent as with AcH 505, and that ofWS-5995 Bwas 60 mM, corresponding
to a concentration that significantly retarded A. muscaria growth. A MeOH-treated
fungal suspension culture served as a control. Influence of heat shock on the
mycelia (Riedlinger et al. 2006) was investigated by transferring the fungal suspen-
sion cultures from 20 to 30�C for 3 h. Carbon-based induction of gene expression was
204 R. Hampp, M.T. Tarkka

investigated according to Nehls et al. (1999). MMN medium supplemented with
40 mM glucose was added to mycelia that were carbohydrate-depleted for 1 week.
Bacterium–fungus dual cultures were performed according to Riedlinger et al.
(2006) in magnetically stirred glass fermenters containing modified MMNmedium.
To inoculate a fermenter, the pellet from a 200-ml shake flask preculture of strain
AcH 505 grown for 120 h and the pellet from a 500-ml shake flask preculture of
A. muscaria grown for 1 month were resuspended in 500 ml modified MMN
medium. Fermentation was carried out with an aeration rate of 0.25 v v�1 min�1
and agitation at 100 rpm. At harvest, suspension cultures were filtered through a
100 mm nylon mesh (Seidengazefabrik, Thal, Switzerland). The material was
immediately frozen in liquid nitrogen and stored at �80�C.
12.5.3 Co-Cultures
12.5.3.1 Mycorrhizal Synthesis with Mycorrhization Helper Actinomycetes
We commonly use modified MMN agar media without glucose for the synthesis of
ectomycorrhizas (Schaeffer et al. 1996). Alternatively, we have used a sterile
culture system based on moss peat and perlite that has been adapted from Poole
et al. (2001) and is explained here. Seeds of Norway spruce [Picea abies (L.) Karst]were obtained from the Staatsklenge Nagold (Nagold, Germany). Seedlings
are grown under sterile conditions in Petri dishes for 4 weeks at 22�C (16 hrs
light, 200 mE m�2 s�1) on MMN medium, containing 1% glucose and 0.8% agar.
Ectomycorrhizas were synthesized using a Petri dish method modified from Poole
et al. (2001). Moss peat (Botanical Garden, Tubingen, Germany) and perlite
(Knauf Perlite GmbH, Dortmund, Germany) were mixed in 1:1 ratio, crushed,
moistened with double distilled water (10 g water: 15 g mixture) and autoclaved.
A slit was cut into the side of the Petri dishes and their covers using a hot scalpel.
One part MMN medium (without glucose) was mixed to four parts peat-perlite
mixture and evenly spread onto the Petri dishes. Plants and fungal inocula
(A. muscaria 6, or S. bovinus K3) were positioned according to Poole et al.
(2001). Briefly, plants were laid into the slit, placing the root systems on the
moss-perlite mixture and shoots exposed to the atmosphere. Three fungal inocula,
consisting of 5 mm diameter discs cut from the growing margin of an MMN agar
culture, were placed upside-down along each side of the root at 15 mm intervals, at
a distance of 5 mm from the root.
For bacterial inoculations, 1-week-old AcH 505 or AcH 1003 cultures in MMN
medium were centrifuged (1,500 g, 15 min) and the pellets were resuspended at OD
0.6 in MMN medium without glucose. Two 500-ml aliquots of bacteria were
pipetted between the roots and the fungal plugs. Four-month-old seedlings were
harvested for analysis. For all inoculations, 15 replicates were used, out of which
ten were used for analyses of mycorrhization and the development of seedlings.
12 Interaction with Soil Microorganisms 205

12.5.4 Simple Culture System for the Inoculation of NorwaySpruce Roots with Actinomycetes
We use this highly reproducible culture system to analyze young Norway spruce
seedlings under the influence of actinomycetes and pathogenic fungi. It suits the
analysis well if a mycorrhization helper bacterium has a local (root) or a distal
(shoot) influence on disease development in Norway spruce (Lehr et al. 2007).
Seedlings are grown until 4 weeks as explained before. Cross-walled Petri dishes
are filled from one side with 25 ml MMN medium without glucose, containing 2%
agar. The agar is then covered by Cellophan. The bacteria are pre-cultured on ISP2
agar as described above. About ten colonies are evenly suspended in 1 ml of sterile
distilled water. A 25 ml aliquot of the bacterial suspension is evenly distributed on
the agar. The roots of three seedlings are spread on the Cellophan and covered by
wet filter paper which serves two purposes: it fixes the root and keeps them humid.
The shoots extend into the agar-free second half of the dish. After adding the top
plate, the Petri dishes are secured with a layer of Parafilm (Fig. 12.2). The dishes are
stored vertically and the culture continued at 22�C (16 h light, 200 mE m�2 s�1) for
7 days prior to inoculation with pathogenic fungi.
12.5.5 Impact of Pre-Inoculation with Mycorrhization HelperBacteria on Heterobasidion Root Rot
We have used Heterobasidion annosum as a root pathogen to test how actinomy-
cetes influence disease development in Norway spruce (Lehr et al. 2007).
Fig. 12.2 Culture system to analyze the influence of mycorrhization helper bacteria on plant
pathogens
206 R. Hampp, M.T. Tarkka

H. annosum strains were precultured on malt agar (1.5% malt extract, 1% agar).
Conidiospores were washed off from 2-week-old cultures by pipetting back and
forth with 0.05% Tween solution. Inoculum density was adjusted to 1� 105 conidia
per ml. Seedlings either pre-treated with bacteria or water, as indicated above, were
treated with fungal spores: filter paper on the roots was set aside, 50 ml of conidiasuspension were pipetted directly on the roots, and filter paper was placed on the
roots again. Petri dishes were closed and secured with Parafilm, and the culture was
continued in the upright position.
12.5.6 Impact of Volatiles of Mycorrhization Helper Bacteriaon Heterobasidion Root Rot
Mycorrhization helper bacteria may exert their function by the production of
volatiles (Garbaye 1994), and we have observed that the volatiles of a mycorrhiza
helper bacterium have a positive impact on spruce main root colonization by
H. abietinum. For these experiments, spruce seedlings and fungi were cocultured
in Petri dishes, as explained above. Bacteria, precultivated on HA agar, were cut out
as agar blocks of about 25 mm2, and positioned in the agar-free part of the Petri dish
in the vicinity of the shoot (Fig. 12.3). Communication between bacteria and plant
or fungus was thus only possible by air space.
12.5.7 Physiological Screening of Host Plant Viability
Chlorophyll fluorescence of photosystem II is an indicator of quantum yield of
photosynthesis and can be used as a measure of plant viability (Schreiber 2004). We
used a system provided by Walz, Effeltrich, Germany (Imaging PAM) which
Piece of agar containingbacteria
Cross wall
MMN Agar
Fig. 12.3 Culture system for the analysis of volatile-based signaling by mycorrhization helper
bacteria
12 Interaction with Soil Microorganisms 207
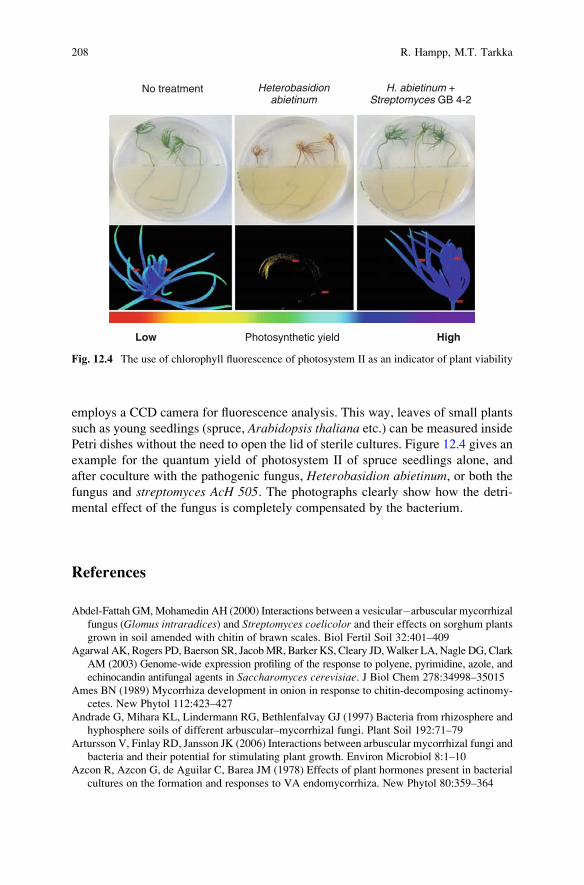
employs a CCD camera for fluorescence analysis. This way, leaves of small plants
such as young seedlings (spruce, Arabidopsis thaliana etc.) can be measured inside
Petri dishes without the need to open the lid of sterile cultures. Figure 12.4 gives an
example for the quantum yield of photosystem II of spruce seedlings alone, and
after coculture with the pathogenic fungus, Heterobasidion abietinum, or both the
fungus and streptomyces AcH 505. The photographs clearly show how the detri-
mental effect of the fungus is completely compensated by the bacterium.
References
Abdel-Fattah GM,Mohamedin AH (2000) Interactions between a vesicular�arbuscular mycorrhizal
fungus (Glomus intraradices) and Streptomyces coelicolor and their effects on sorghum plants
grown in soil amended with chitin of brawn scales. Biol Fertil Soil 32:401–409
Agarwal AK, Rogers PD, Baerson SR, JacobMR, Barker KS, Cleary JD,Walker LA, Nagle DG, Clark
AM (2003) Genome-wide expression profiling of the response to polyene, pyrimidine, azole, and
echinocandin antifungal agents in Saccharomyces cerevisiae. J Biol Chem 278:34998–35015
Ames BN (1989) Mycorrhiza development in onion in response to chitin-decomposing actinomy-
cetes. New Phytol 112:423–427
Andrade G, Mihara KL, Lindermann RG, Bethlenfalvay GJ (1997) Bacteria from rhizosphere and
hyphosphere soils of different arbuscular–mycorrhizal fungi. Plant Soil 192:71–79
Artursson V, Finlay RD, Jansson JK (2006) Interactions between arbuscular mycorrhizal fungi and
bacteria and their potential for stimulating plant growth. Environ Microbiol 8:1–10
Azcon R, Azcon G, de Aguilar C, Barea JM (1978) Effects of plant hormones present in bacterial
cultures on the formation and responses to VA endomycorrhiza. New Phytol 80:359–364
No treatment
Photosynthetic yieldLow High
H. abietinum +Streptomyces GB 4-2
Heterobasidionabietinum
Fig. 12.4 The use of chlorophyll fluorescence of photosystem II as an indicator of plant viability
208 R. Hampp, M.T. Tarkka

Barea JM, Pozo MJ, Azcon R, Azcon-Aguilar C (2005) Microbial co-operation in the rhizosphere.
J Expt Bot 56:1761–1778
Bertaux J, Schmid M, Prevost-Boure NC, Churin JL, Hartmann A, Garbaye J, Frey-Klett P (2003)
In situ identification of intracellular bacteria related to Paenibacillus spp. in the mycelium
of the ectomycorrhizal fungus Laccaria bicolor S238N. Appl Environ Microbiol
69:4243–4248
Bianciotto V, Bandi C, Minerdi D, Sironi M, Tichy HV, Bonfante P (1996) An obligately endosym-
biotic mycorrhizal fungus itself harbors obligately intracellular bacteria. Appl Environ Microbiol
62:3005–3010
De Boer W, Folman LB, Summerbell RC, Boddy L (2005) Living in a fungal world: impact of
fungi on soil bacterial niche development. FEMS Microbiol Rev 29:795–811
De Boer W, Wagenaar AM, Klein Gunnewiek PJ, van Veen JA (2007) In vitro suppression of
fungi caused by combinations of apparently non-antagonistic soil bacteria. FEMS Microbiol
Ecol 59:177–185
Deveau A, Palin B, Delaruelle C, Peter M, Kohler A, Pierrat JC, Sarniguet A, Garbaye J, Martin F,
Frey-Klett P (2007) The mycorrhiza helper Pseudomonas fluorescens BBc6R8 has a specific
priming effect on the growth, morphology and gene expression of the ectomycorrhizal fungus
Laccaria bicolor S238N. New Phytol 175:743–755
Duponnois R, Kisa M (2006) The possible role of trehalose in the mycorrhiza helper effect. Can J
Bot 84:1005–1008
Foster RC, Marks GC (1967) Observations on the mycorrhizas of forest trees. II. The rhizosphere
of Pinus radiata D. Don. Aust J Biol Sci 20:915–926
Founoune H, Duponnois R, Ba AM, Sall S, Branget I, Lorquin J, Neyra M, Chotte JL (2002)
Mycorrhiza Helper Bacteria stimulated ectomycorrhizal symbiosis of Acacia holosericea withPisolithus alba. New Phytol 153:81–89
Frey-Klett P, Chavatte M, Clausse M-L, Courrier S, Le Roux C, Raaijmakers J, Martinotti MG,
Pierrat J-C, Garbaye J (2005) Ectomycorrhizal symbiosis affects functional diversity of
rhizosphere fluorescent pseudomonads. New Phytol 165:317–328
Frey-Klett P, Garbaye J, Tarkka M (2007) The mycorrhiza helper bacteria revisited. New Phytol
176: 22–36
Garbaye J (1994) Mycorrhiza helper bacteria: a new dimension to the mycorrhizal symbiosis. New
Phytol 128:197–210
Gryndler M, Vosatka M (1996) The response of Glomus fistulosum-maize mycorrhiza to treat-
ments with culture fractions from Pseudomonas putida. Mycorrhiza 6:207–211
Hiltner L (1904) Uber neuere Erfahrungen und Probleme auf dem Gebiet der Bodenbakteriologie
und unter besonderer Berucksichtigung der Grundungung und Brache. Arbeiten der Deutschen
Landwirtschaftlichen Gesellschaft 98:59–78
Hirsch CF, Christensen DL (1983) Novel method for selective isolation of Actinomycetes. Appl
Environ Microbiol 46:925–929
Hobbie SE (1992) Effects of plant species on nutrient cycling. Trend Ecol Evol 7:336–339
Keller S, Schneider K, Sussmuth RD (2006) Structure elucidation of auxofuran, a metabolite
involved in stimulating growth of fly agaric, produced by the mycorrhiza helper bacterium
Streptomyces AcH 505. J Antibiot (Tokyo) 59:801–803
Lehr NA, Schrey SD, Bauer R, Hampp R, Tarkka MT (2007) Suppression of plant defense
response by a mycorrhiza helper bacterium. New Phytol 174:892–903
Linderman RG (1988) Mycorrhizal interactions with the rhizosphere microflora — the mycor-
rhizosphere effect. Phytopathology 78:366–371
Maier A (2003) Einfluss bakterieller Stoffwechselprodukte auf Wachstum und Proteom
des Ektomykorrhizapilzes Amanita muscaria. PhD thesis, Faculty of Biology, University of
Tubingen, Germany
Maier A, Riedlinger J, Fiedler H-P, Hampp R (2004) Actinomycetales bacteria from a spruce
stand: characterisation and effects on growth of root symbiotic and plant parasitic soil fungi in
dual culture. Mycol Prog 3:129–136
12 Interaction with Soil Microorganisms 209

Melin P, Schnurer J, Wagner EG (1999) Changes in Aspergillus nidulans gene expression inducedby bafilomycin, a Streptomyces-produced antibiotic. Microbiology 145:1115–1122
Melin P, Schnurer J, Wagner EG (2002) Proteome analysis of Aspergillus nidulans reveals
proteins associated with the response to the antibiotic concanamycin A, produced by Strepto-myces species. Mol Genet Genomics 267:695–702
Molina R, Palmer JG (1982) Isolation, maintenance and pure culture manipulation of ectomycor-
rhizal fungi. In: Schenk NC (ed) Methods and principles of mycorrhizal research. The
American Phytopathological Society, St Paul, MN, pp 115–129
Nurmiaho-Lassila EL, Timonen S, Haahtela K, Sen R (1997) Bacterial colonization pattern of
intact Pinus sylvestrismycorrhizospheres in dry pine forest soil: an electron microscopy study.
Can J Microbiol 43:1017–1035
Nehls U, Ecke M, Hampp R (1999) Sugar- and nitrogen-dependent regulation of an Amanitamuscaria phenylalanine ammonium lyase gene. J Bacteriol 181:1931–1933
Poole EJ, Bending GD, Whipps JM, Read DJ (2001) Bacteria associated with Pinus sylvestris-Lactarius rufus ectomycorrhizas and their effects on mycorrhiza formation in vitro.New Phytol 151:743–751
Riedlinger JM, Schrey SD, Tarkka MT, Hampp R, Kapur M, Fielder HP (2006) Auxofuran, a
novel metabolite that stimulates the growth of fly agaric, is produced by the mycorrhiza helper
bacterium Streptomyces strain AcH 505. Appl Environ Microbiol 72:3550–3557
Rovira AD (1991) Rhizosphere research — 85 years of progress and frustration. In: Kleister DL,
Cregan PB (eds) The rhizosphere and plant growth. Kluwer Academic Publishers, Amsterdam,
pp 3–13
Schaeffer C, Johann P, Nehls U, Hampp R (1996) Evidence for an up-regulation of the host and
down-regulation of the fungal phosphofructokinase activity in ectomycorrhizas of Norway
spruce and fly agaric. New Phytol 134:697–702
Schreiber U (2004) Pulse-amplitude-modulation (PAM) fluorometry and saturation pulse method:
an overview. In: Papageorgiou GC, Govindjee (eds) Chlorophyll a fluorescence: a signature of
photosynthesis. Advances in photosynthesis and respiration, vol 19. Springer, Dordrecht,
pp 279–319
Schrey SD, Schellhammer M, Ecke M, Hampp R, Tarkka MT (2005) Mycorrhiza helper bacterium
Streptomyces AcH 505 induces differential gene expression in the ectomycorrhizal fungus
Amanita muscaria. New Phytol 168:205–216
Schrey SD, Salo V, Raudaskoski M, Hampp R, Nehls U, Tarkka MT (2007) Interaction with
mycorrhiza helper bacterium Streptomyces sp. AcH 505 modifies organisation of actin cyto-
skeleton in the ectomycorrhizal fungus Amanita muscaria (fly agaric). Curr Genet 52:77–85
Shirling EB, Gottlieb D (1966) Methods for characterization of Streptomyces species. Int J Syst
Bacteriol 16:313–340
Slattery M, Rajbhandari I, Wesson K (2001) Competition-mediated antibiotic induction in the
marine bacterium Streptomyces tenjimariensis. Microbial Ecol 41:90–96
Smalla K, Wieland G, Buchner A, Zock A, Parzy J, Kaiser S, Roskot N, Heuer H, Berg G (2001)
Bulk and rhizosphere soil bacterial communities studied by denaturing gradient gel electro-
phoresis: plant-dependent enrichment and seasonal shifts revealed. Appl Environm Microbiol
67:4742–4751
Tarkka MT, Hampp R (2008) Secondary metabolites of soil streptomycetes in biotic interactions.
In: Karlovsky P (ed) Secondary metabolites in soil ecology. Soil Biology, vol 14. Springer,
Heidelberg, pp 107–128
Tarkka MT, Schrey S, Nehls U (2006) The alpha-tubulin gene AmTuba1: a marker for
rapid mycelial growth in the ectomycorrhizal basidiomycete Amanita muscaria. Curr Genet49:294–301
210 R. Hampp, M.T. Tarkka

Chapter 13
Isolation, Cultivation and In PlantaVisualization of Bacterial Endophytes
in Hanging Roots of Banyan Tree
(Ficus bengalensis)
Khyati Pathak, Haresh Keharia, and Amit C. Kharkwal
13.1 Introduction
Endophytic bacteria live in the plant tissue without causing substantive harm to the
host plant. They may either benefit the host or benefits may be reciprocal (Bacon
et al. 2002).
Interaction between plant and beneficial bacteria can have profound effects
on crop health, crop yield and soil fertility (Kloepper et al. 1989). These
microorganisms can improve plant quality in several ways: competition for
habitat by production of antibiotics, induction of plant defense mechanisms,
production of plant growth stimulators, and improving soil quality (Ciccillo
et al. 2002; Glick 1995; Kloepper et al. 1989). Endophytes are a poorly inves-
tigated group of microorganisms that represent an abundant, dependable source
of biologically important and chemically novel bioactive compounds with
potential for exploitation in a pharmaceutical and agricultural fields (Strobel
and Daisy 2003). The use of microbial endophytic flora opens up a new arena of
biotechnological exploitation which requires us to understand the endophytic
flora, their existence, and their response to the environment in which they exist
(Bacon et al. 2002). To better understand the endophytes, it is necessary to
isolate and cultivate these microorganisms.
K. Pathak and H. Keharia (*)
BRD School of Biosciences, Sardar Patel Maidan, Satellite Campus, Vadatal Road, Sardar Patel
University, P.O. Box 39, Vallabh Vidyangar‐388120, Gujarat, Indiae-mail: [email protected]
A.C. KharkwalAmity Institute of Microbial Technology (AIMT), Amity University Uttar Pradesh (AUUP),
Sector 125, Noida ‐ 201 303 (Uttar Pradesh), India
A. Varma and A.C. Kharkwal (eds.), Symbiotic Fungi, Soil Biology 18, 211
DOI: 10.1007/978‐3‐540‐95894‐9_13, # Springer‐Verlag Berlin Heidelberg 2009

13.2 Isolation and Cultivation of Endophytes from Plant Roots
The most important and critical step for working with microbial endophytes is to
isolate them. The procedure should be sensitive enough to recover a maximum
number of endophytes and strong enough to eliminate the epiphytes present on the
root surface.
13.2.1 Selection of Plant Material
Around 30,000 plant species exist on the earth. Since each individual plant is a host
to one or more endophytes, creative and imaginative strategies must be used to
quickly narrow the search for the host plant for bioprospective endophytes (Strobel
and Daisy 2003; Mittermeier et al. 1999). While selecting a plant for investigation
of endophytes capable of producing novel bioactive molecules, the following
criteria need to be considered (Strobel and Daisy 2003):
1. Plants from a unique environmental niche, especially those with an unusual
biology and possessing novel strategies for survival are seriously considered for
study.
2. Plants that have an ethnobotanical history (use by indigenous peoples) that are
related to some specific application of interest are selected for study.
3. Plants that are endemic, that have an unusual longevity, or have occupied a
certain ancient land mass, are appropriate for study.
4. Plants growing in areas of great biodiversity also have the potential for housing
endophytes with great diversity.
It is important to select healthy and disease-free plant material for isolation work, to
prevent the isolation of localized pathogenic endophytic microorganisms. It is
always desirable to select the procedure that allows recovery of several species of
bacteria from the selected plant material.
13.2.2 Isolation of Endophytic Microorganisms
The first step in the isolation of microorganisms residing in plant tissues is surface
sterilizationof explants.To achieve complete surface sterilization, various steps should
be followed; the method varies according to the type of tissue as well as its location.
13.2.2.1 Pre-Washing and Cleaning
Thorough pre-washing of plant material is necessary to remove the adhering soil
particles and dust on the root surfaces in order to reduce the load of surface flora.
212 K. Pathak et al.
Pre-washing can increase the effectiveness of the surface-sterilizing agents. The
root tissue selected for isolation should be disease-free and freshly collected.
Immediately after collection, the sample should be processed for surface steriliza-
tion. Pre-washing can be carried out by vigorous washing with tap water, distilled
water or one of several dilute saline buffers of pH-7.2 (Bacon et al. 2002). Sonica-
tion may also be used to dislodge soil and organic matter from the root tissue before
surface sterilization (Hallmann et al. 2006).
13.2.2.2 Surface Sterilization
Sterilizing agents are the chemicals used to kill the microflora on the surface of
plant material. The most commonly employed surface-sterilizing agents are
sodium hypochlorite, mercuric chloride, ethanol, hydrogen peroxide, and chlor-
mine T (Dong et al. 1994; Gardner et al. 1982; Gagne et al. 1987; McInroy
and Kloepper 1994). Propylene oxide vapor (Sardi et al. 1992) and formaldehyde
(Cao et al. 2002) are less frequently used chemical sterilizing agents. More
effective sterilization can be achieved using a combination of agents or combined
chemical and physical agents. For example, root tissue of Citrus jambhiriwas sterilized by dipping in 90% ethanol and flamed to remove surface micro
flora by Gardner (1982). To achieve effective surface sterilization, nonionic
detergents like Tween 20, Triton X-100, Tween-80 can sometimes be used
along with surface-sterilizing agents, in order to improve penetration of surface
sterilizers to niches and grooves beyond the epidermal cells (Bills 1996; Hallmann
et al. 2006). Concentration of sterilizing agents, combination treatment, and incu-
bation period for sterilization may vary depending on plant as well as tissue
material.
Most common methods used for sterilization include three steps: 70% ethanol
treatment followed by sodium hypochlorite and again 70% ethanol treatment, or
ethanol treatment followed by mercuric chloride and ethanol treatment.
During surface sterilization after following each step it is recommended to wash
the tissue with sterile water to remove and prevent the entry of sterilizing agents
inside the root tissue. Sometimes the sterilizing agents penetrate the internal tissue
of plant and can kill the endophytic flora, resulting in lower recovery of endophytic
flora. So, depending upon the plant species, tissue and age, concentration and
combination of sterilizing agents as well as incubation period needsto be optimized
for each condition in order to achieve maximum recovery of endophytes without
contamination of epiphytes.
The efficiency of surface sterilization can be ascertained by rolling the surface-
sterilized tissue onto the surface of agar-containing media, by dipping the roots into
nutrient broth (Gagne et al. 1987), or by streaking the water collected after washing
the explants with surface-sterilizing agent onto the nutrient agar media (McInroy
and Kloepper 1994).
13 Isolation, Cultivation and In Planta 213

13.2.3 Cultivationof Endophytes
Surface-sterilized root tissue is subjected for isolation procedure. Most commonly
employed procedures are cutting of the surface-sterilized plant tissue and macera-
tion. The root material is cut aseptically into small pieces (7–8 mm) and subjected
for cultivation on nutrient media (Hallmann et al. 1997). Plant secretions such as
latex and wax also contain microflora, so these secretions should be collected
aseptically and streaked onto nutrient agar media to cultivate the endophytic
bacteria. During cultivation the organism can grow fast, and hence limitation of
nutrients can affect the isolation of slow-growing microflora. Maceration is the
method by which the slow- and fast-growing cultures can be isolated. Maceration
requires sterilized mortar and pestle, homogenizer or blender (Parmeela and Johri
2004; Hallmann et al. 2006). Sterile buffer or sterile saline is used during homoge-
nization of plant tissue in order to maintain the integrity of endophytic organisms.
The whole procedure should be performed aseptically to avoid contamination.
However, heat generation during the maceration may kill the endophytes, so care
should be taken while processing to have minimum heat generation. All the
equipment required for maceration should be sterilized properly. If not, there is a
considerable risk of airborne contamination. Certain plant enzymes or toxic mate-
rial released during maceration from plant cells can kill the microorganisms, so to
prevent this it is advised to use polyvinyl pyrrolidone (PVP) or EDTA (Hallmann
et al. 2006).
Most endophytic bacteria can grow on routine laboratory bacterial growth media
in the laboratory, viz. Luria broth, glucose yeast extract agar, tryptic soy agar,
King’s B medium and MacConkey agar which support the growth of a broad range
of bacteria (Balandreau 1983; Bagley and Seidler 1978).
13.3 Protocol for Isolation and Cultivation of Bacterial
Endophytes from Hanging Roots of Banyan Tree
13.3.1 Requirements
1. Sample collection bags
2. Tap water
3. Sterile distilled water
4. Containers for pre-washing and pre-treatment.
5. Sterile containers for each surface-sterilization step and washing steps
6. Labolene – Neutral liquid detergent (Qualigens)
7. 10% Savlon
8. 70% ethanol
9. 0.1% mercuric chloride
214 K. Pathak et al.

10. Sterile forceps
11. Sterile petri dishes
12. Sterile blade
13. Laminar air flow unit
14. BOD incubator
13.3.2 Media for Cultivation
1. Luria agar
2. Potato dextose agar
13.3.3 Method
1. Collection. Collect a disease-free, growing part of the hanging roots of banyan
tree aseptically, and proceed to isolation on the day of collection.
2. Cleaning and pre-washing. Clean the hanging roots by washing vigorously
under tap water to remove dust adhered to the surface of aerial roots.
3. Pre-treatment. The cleaned hanging roots are then subjected to the detergent
treatment. Commercially available neutral liquid detergent Labolene (Quali-
gens) is used to remove hydrophobic substances on the roots surface in
order to improve accessibility of sterilizing agents. Roots are treated with 10%
Labolene for 15 min.
4. Surface sterilization. Surface sterilization of banyan hanging roots requires threesteps:
Pre-treated hanging roots are kept in the commercially available antiseptic liquid
solution of 10% (v/v) Savlon for 15 min. Savlon consists of key components such as
cetrimide and chlorhexidine, these broad-spectrum antiseptics having antibacterial
and fungicidal action. Treatment with Savlon helps to eliminate most of the
bacterial and fungal plant surface flora.
The Savlon-treated roots are then washed with sterile distilled water to remove
the remaining traces of cetrimide and chlorhexidine from the root surface.
The washed roots are then treated with 70% Ethanol solution, twice each for 2 min.
The roots are then immersed in 0.1% HgCl2 (w/v) for 30 s followed by repeated
(at least 6–8 times) washes with sterile distilled water to remove excess of HgCl2from the root surface. The surface-sterilized roots thus obtained are then placed in a
sterile Petri dish and cut about 5 mm from both ends using a sterile surgical blade.
The central portion of the root is then cut into small segments of about 8 mm.
5. Cultivation.
(a) Surface-sterilized small segments of hanging roots of banyan tree are
placed on the surface of sterile Luria agar as well as on sterile potato
dextrose agar plates. The root segments are placed on media, keeping at
13 Isolation, Cultivation and In Planta 215

least 2 cm space between two root segments so as to provide the area for the
bacterial growth from and around the root segments.
(b) The plates are incubated at 30 � 2�C in a BOD incubator and observed
every day for growth.
(c) During incubation, the endophytes from the root tissue migrate outside
towards media and start colonizing.
(d) The bacterial growth thus obtained is then subcultured onto sterile Luria
agar or potato dextrose agar media using a sterile nichrome wire loop to get
isolated colonies.
(e) The isolated colonies thus obtained are repeatedly subcultured on respec-
tive media to ascertain purity and then screened for production of bioactive
compounds.
Remarks. All the steps for surface sterilization should be carried out in aseptic
conditions in a laminar air flow unit; all the containers and glassware required for
surface sterilization should be autoclaved at 15 lbs pressure for 15 min.
13.4 In Planta Visualization/Localization of Endophytes
To study plant-interacting bacteria such as endophytes and their behavior in the
plant system it is necessary to demonstrate their internal colonization ability, the
establishment of endophytic strain in the plant. Isolation procedures are the simplest
way to demonstrate the establishment of microflora in the internal tissue of a plant
and give a rough estimate of the bacterial population density. However, isolation
procedures do not allow an exact localization and often detect only minor naturally
occurring microorganisms. In general, the two types of investigation of bacterial
endophytic behavioral study are those that are concerned with the indigenous
populations, and those that monitor the colonization of an introduced endophyte
(Hallmann et al. 1997).
13.4.1 Vital Staining Method
Various bacterial staining techniques cannot distinguish between living or dead
bacterial cells and moreover most of the stains which are used for bacterial
staining can stain plant cells and cell materials, which makes it difficult to distin-
guish bacterial cells inside the plant tissue. Viable staining techniques overcome
the problems associated with non-cultivable microorganisms and can also be
applied for bacterial detection in situ. Therefore, vital stains might provide a
more realistic tool for enumeration and localization of microbial communities
(Hallmann et al. 1997).
216 K. Pathak et al.
13.4.2 Electron Microscopy
Electron microscopy is a powerful tool for identifying and placing endophytic
bacteria in plant tissue. Scanning electron microscopy (SEM) and transmission
electron microscopy (TEM) have been successfully employed to detect the endo-
phytic bacteria in various plants. For SEM the sample needs to be cut, so the risk of
bacterial contamination from the root surface is always there. In order to avoid such
contamination, the plant tissue with endophytes should be fixed first and then
sectioned. TEM can reduce such contamination because it requires sample fixation
and sectioning. For electron microscopy the processing of tissue is very much
important. Some problems, such as access of fixatives or resins to uncut intercellu-
lar spaces due to heavily suberized and lignified parenchyma cells or to oozing out
of bacteria from the apoplast fluid of cut spaces, create difficulties in detecting
bacteria in the plant tissue (Dong et al. 1994). Preparation of plant tissue for EM
requires much time compared to animal tissue, and requires expertise in sample
preparation, ultra thin sectioning and electron microscopy to differentiate between
plant organelles and bacterial cells.
13.5 Protocol for Detection of Endophytic Bacteria
by Vital Staining
Use of Tetrazolium dyes as vital stain for demonstration of bacteria inside the plant
tissue was introduced by Patriquin and Dobereiner (1978). Bacteria inside the
surface-sterilized hanging root tissues of Banyan tree utilize malic acid as carbon
source and reduce 2,3,5- triphenyl tetrazolium chloride salt (TTC) to form water-
insoluble red-colored formazans. The actively respiring (viable) bacterial cells
inside the plant tissue reduce TTC and deposit formazans as discrete dark red to
purple granules in the cells and these stained bacterial cells can be visualized by
light microscopy.
Acridine orange is a fluorescent cationic dye. It is cell-permeable, and interacts
with DNA and RNA intercalation or electrostatic attraction. It is used to stain
microorganisms in unfixed specimen, for vital staining and differential staining of
DNA and RNA. It is used for the direct counting of endophytes in situ in combination
with epifluorescence microscopy. Sometimes small particles are difficult to distin-
guish from bacteria, so by counterstaining Tetrazolium-treated cells with Acridine
orange one can differentiate bacteria and small particles (Bacon et al. 2002).
13.5.1 Equipment
(a) Incubator
(b) Compound microscope
13 Isolation, Cultivation and In Planta 217

(c) Cryotome Leica
(d) Sterile forcep
(e) Conical Flask (250 ml)
(f) Sterile cotton-plugged sugar tubes
(g) Sterile screw-cap tubes (5 ml).
(h) Glass micro slides
13.5.2 Chemicals and Reagents
(i) 50 mM Potassium phosphate buffer (pH-7)
(j) 2, 3, 5 – triphenyl tetrazolium chloride salts
(k) Malic acid
(l) Conical flask (250 ml)
(m) Sterile cotton-plugged sugar tubes
(n) Sterile screw-cap tubes (5 ml)
(o) Glass micro slides
(p) Surface-sterilized hanging roots of banyan tree
(q) 1% aniline blue
(r) Acridine orange reagent: Dissolve 0.1 g acridine orange in 100 ml of distilled
water and store it at 4�C in the dark, and from the stock prepare working
solution by diluting stock acridine orange with 50 mM of potassium phos-
phate buffer in the ratio of 1:10.
13.5.3 Procedure
1. Take 100 ml 50 mM potassium phosphate buffer (pH-7) and add 0.0625 g malic
acid into that in a conical flask and autoclave it for 15 min at 15 lbs pressure.
2. Take 0.15 g 2, 3, 5- triphenyl tetrazolium chloride (TTC) and add into sterile 50
mM malate potassium phosphate buffer (pH-7) in aseptic condition.
3. Dip surface-sterilized hanging roots of banyan tree into 20 ml of above sterile
TTC solution and incubate overnight at 30 � 2�C in incubator.
4. Take longitudinal or cross sections of TTC-treated roots either by hand or using
cryotome.
5. Place sections on glass microscopic slides and prepare wet mount of the
sections with phosphate buffer, place a glass cover slip and seal the edges
with colorless nail polish or DPX mounting media and examine the sections
under compound microscope at 100� magnification.
6. The bacterial cells stain red to purple (Fig. 13.1).
7. To enhance the TTC-stained tissue, counterstain the TTC-treated sections with
1% Aniline blue for 1 min and then remove the excess of stain and prepare wet
mount and observe it immediately under the microscope.
8. Stain cross-sectional or longitudinal sections of root tissue with working
solution of Acridine orange for 3–5 min at room temperature and allow excess
dye to run off.
218 K. Pathak et al.

9. Rinse the sections with phosphate buffer for 2 min.
10. Prepare wet mount and observe under epifluorescence microscope.
11. Counterstain TTC-treated root sections with acridine orange by previously
described method and mount in phosphate buffer.
12. Observe each microscope field first using epifluorescence illumination and
count all fluorescing bacteria (vital) and without moving the stage switch to
phase contrast count all bacteria stained red to purple. By viewing in epifluor-
escence illumination and phase contrast one can confirm the presence of living
bacteria in the plant root tissue by practice.
13.6 Protocol for Detection of Bacterial Endophytes
by Transmission Electron Microscopy
The following methodology can be followed for fixation of tissue specimen, ultra-
thin sectioning and staining of sections for observing bacterial cells in sections
using TEM (Rensing 2002; Roland 1978).
13.6.1 Requirements
13.6.1.1 For Fixation
(a) 0.1 M sodium phosphate buffer pH-6.8
(b) Commercial 8% glutaraldehyde
Fig. 13.1 Light micrograph of transverse section of hanging roots of Banyan tree treated with
tetrazolium dye, showing the presence of endophytic bacteria (magnification �100). a Arrowpoints at the bacterial cell located at inner side of the wall of root cortical cell. b Fungal hyphae
located inside the root cortical cell
13 Isolation, Cultivation and In Planta 219
(c) 1N sodium hydroxide
(d) Deionized water
(e) Storage glass vials (5 ml)
(f) 10% (W/V) para formaldehyde (10 g of para formaldehyde powder are
dissolved in 100 ml of deionized water by heating to 60–70�C and stirring.
Solution becomes milky white in color; to that, add 2–3 drops of 1N NaOH
until the solution becomes transparent. The solution is cooled before use.
13.6.1.2 Preparation of Combined Glutaraldehyde–Formaldehyde Fixative
0.1 M sodium phosphate buffer pH-6.8 10 ml
Deionized water 4 ml
10% para formaldehyde 4 ml
8% glutaraldehyde 4 ml
Total volume of fixative 22 ml
(g) 2% osmium tetroxide (OSO4) (EM grade osmium tetroxide is available in
either crystal or liquid form. Prepare 2% osmium tetroxide in water in fume
hood. The solution can remain stable for months; store it in dark in tight
container)
(h) Fume hood
(i) Ultramicrotome
(j) Wooden applicator sticks
(k) Uranyl acetate
(l) Acetone
(m) Spurr resin
(n) Rubber casting tray for block preparation
(o) 5% toludine blue
(p) Formvar solution: 0.4–0.6 g of formvar in 100 ml chloroform or dichlor-
omethane. Store in refrigerator
(q) 0.1% NaOH
(r) Sato’s Lead stain
Lead acetate 1.0 g
Lead nitrate 1.0 g
Lead citrate 1.0 g
Sodium citrate 2.0 g
Deionized water (pre-boiled) 82 ml
Mix all chemicals for 2 min, than add 18 ml of 4% NaOH.
Note: All the chemicals required for the EM processing should be of EM grade.
Commercially available 8% glutaraldehyde is colorless; do not use if it appears pale
in color. Spurr resin is toxic so avoid contact with skin.
220 K. Pathak et al.

13.6.2 Procedure
1. Fixation. Clean the roots by thoroughly washing under tap water followed by
distilled water. Cut roots 3–5 mm and transfer the roots into vial containing 3 ml
of formaldehyde-glutaraldehyde fixative. Roots should be completely immersed
in the fixative. If roots are floating in the fixative, degas the vial and incubate
the tissue in fixative for 40–60 min at room temperature. It can be continued upto
2–5 h also. Then store this tissue in refrigerator for 2 h. Decant the fixative from
the vials.
2. Washing with buffer (cold). Wash the root pieces with cold 0.1 M sodium
phosphate buffer pH-6.8 for 10 min. Repeat this step three times.
3. Transfer to 2% osmium tetroxide (OSO4). Incubate the root segments in 2%
OSO4 overnight or for desired time according to material.
4. Buffer wash. Repeat step 2.
5. Water wash. Wash the root pieces with cold deionized water for 2 min. Repeat
this step one more time.
6. 1% Uranyl acetate. Soak the root tissues in cold 1% aqueous uranyl acetate for
30 min.
7. Water wash. Repeat step 5.
8. Dehydration. After fixation the root segments undergo dehydration treatment.
9. Dehydration is carried out by using acetone-water series to remove water from
the root tissue. Roots are treated for each of the following acetone-water solu-
tions in sequence for 20 min:.
(a) Cold 10% acetone
(b) Cold 25% acetone
(c) Cold 50% acetone
(d) Cold 70% acetone
(e) Cold 95% acetone
Henceforth the treatment is given with acetone stabilized at ambient
temperature:
(f) 95% acetone
(g) 100% acetone
(h) 100% acetone
(i) 100% acetone
13.6.2.1 Infiltration with Spurr Resin
Treat dehydrated root tissues in each composition mixture of Spurr resin given
below:
1. 3 volume of Acetone: 1volume of Spurr for 1–2 h
2. 2 volume of Acetone: 2 volume of Spurr for 12 h
13 Isolation, Cultivation and In Planta 221
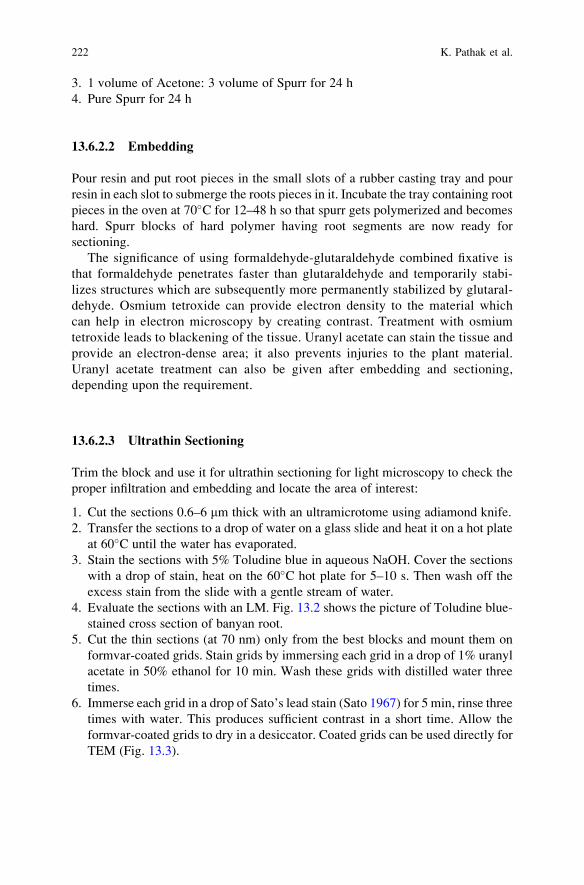
3. 1 volume of Acetone: 3 volume of Spurr for 24 h
4. Pure Spurr for 24 h
13.6.2.2 Embedding
Pour resin and put root pieces in the small slots of a rubber casting tray and pour
resin in each slot to submerge the roots pieces in it. Incubate the tray containing root
pieces in the oven at 70�C for 12–48 h so that spurr gets polymerized and becomes
hard. Spurr blocks of hard polymer having root segments are now ready for
sectioning.
The significance of using formaldehyde-glutaraldehyde combined fixative is
that formaldehyde penetrates faster than glutaraldehyde and temporarily stabi-
lizes structures which are subsequently more permanently stabilized by glutaral-
dehyde. Osmium tetroxide can provide electron density to the material which
can help in electron microscopy by creating contrast. Treatment with osmium
tetroxide leads to blackening of the tissue. Uranyl acetate can stain the tissue and
provide an electron-dense area; it also prevents injuries to the plant material.
Uranyl acetate treatment can also be given after embedding and sectioning,
depending upon the requirement.
13.6.2.3 Ultrathin Sectioning
Trim the block and use it for ultrathin sectioning for light microscopy to check the
proper infiltration and embedding and locate the area of interest:
1. Cut the sections 0.6–6 mm thick with an ultramicrotome using adiamond knife.
2. Transfer the sections to a drop of water on a glass slide and heat it on a hot plate
at 60�C until the water has evaporated.
3. Stain the sections with 5% Toludine blue in aqueous NaOH. Cover the sections
with a drop of stain, heat on the 60�C hot plate for 5–10 s. Then wash off the
excess stain from the slide with a gentle stream of water.
4. Evaluate the sections with an LM. Fig. 13.2 shows the picture of Toludine blue-
stained cross section of banyan root.
5. Cut the thin sections (at 70 nm) only from the best blocks and mount them on
formvar-coated grids. Stain grids by immersing each grid in a drop of 1% uranyl
acetate in 50% ethanol for 10 min. Wash these grids with distilled water three
times.
6. Immerse each grid in a drop of Sato’s lead stain (Sato 1967) for 5 min, rinse three
times with water. This produces sufficient contrast in a short time. Allow the
formvar-coated grids to dry in a desiccator. Coated grids can be used directly for
TEM (Fig. 13.3).
222 K. Pathak et al.
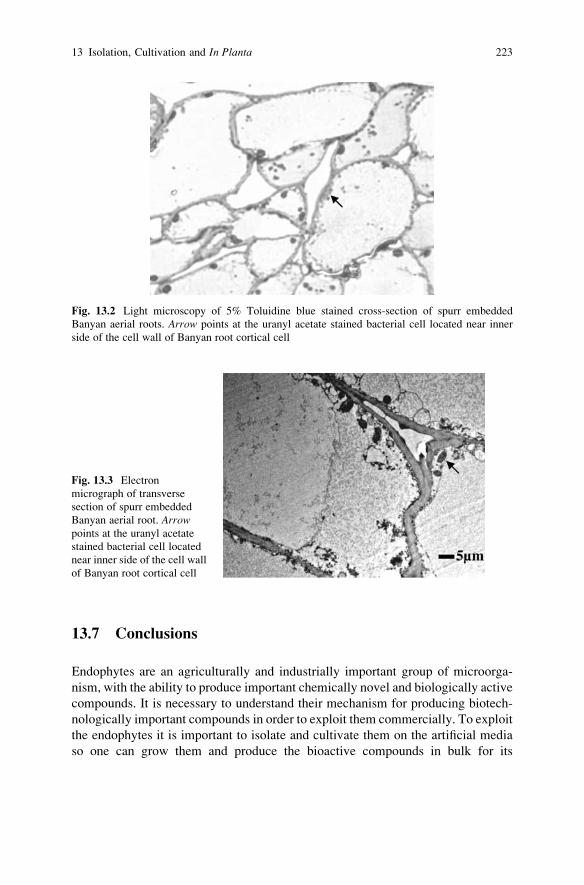
13.7 Conclusions
Endophytes are an agriculturally and industrially important group of microorga-
nism, with the ability to produce important chemically novel and biologically active
compounds. It is necessary to understand their mechanism for producing biotech-
nologically important compounds in order to exploit them commercially. To exploit
the endophytes it is important to isolate and cultivate them on the artificial media
so one can grow them and produce the bioactive compounds in bulk for its
Fig. 13.2 Light microscopy of 5% Toluidine blue stained cross-section of spurr embedded
Banyan aerial roots. Arrow points at the uranyl acetate stained bacterial cell located near inner
side of the cell wall of Banyan root cortical cell
Fig. 13.3 Electron
micrograph of transverse
section of spurr embedded
Banyan aerial root. Arrowpoints at the uranyl acetate
stained bacterial cell located
near inner side of the cell wall
of Banyan root cortical cell
13 Isolation, Cultivation and In Planta 223

industrial usage. These groups of microorganism have generated research interest
because of their various properties, such as the ability to colonize the internal plant
tissue, and their interaction with the host tissue, producing compounds which can
protect the plant from other infectious organisms and from physical stress, provide
help in growth, and maintain plant tissue. To understand the plant-microbe interac-
tion and endophytic behavior, it is important to localize them in plant tissue. In this
chapter, we have tried to cover the complete methodology of isolation, cultivation
and in situ detection of microbes in plant tissues.
Acknowledgments Thanks are due to the Officer In charge, All India Institute of Medical
Sciences, Electron microscopy facility, Anatomy department, New Delhi for providing electron
microscopy facility. HK gratefully acknowledges the financial support for Major research project
entitled ‘‘Purification & characterization of antifungal compounds produced by Banyan
endophytic bacilli’’ sponsored by University Grant Commission (UGC), New Delhi, India and
KP for Project fellowship.
References
Bacon CW, Glenn AE, Hinton DM (2002) Isolation, in planta detection and culture of endophytic
bacteria and fungi. In: Hurst JC, Crawford RL, Knudsen GR, Mclnerney MJ, Stetzenback LD
(eds) Manual of environmental microbiology, 2nd edn. ASM, Washington DC, pp 543–553
Bagley ST, Seidler RJ (1978) Primary Klebsiella identification with MacConkey-inositol carbe-
nicillin agar. Appl Environ Microbiol 36:536–538
Balandreau J (1983) Microbiology of the association. Can J Bot 29:851–859
Bills GF (1996) Isolation and analysis of endophytic fungal communities from woody plants. In:
Redlin SC, Carris LM (eds) Endophytic fungi in grasses and woody plants: Systematics,
ecology, and evolution. APS, St. Paul, MN, pp 31–65
Cao LX, You JL, Zhou SN (2002) Endophytic fungi from Musa acuminate leaves and roots in
south china. World J Microbiol Biotechnol 19:169–171
Ciccillo F, Fiore A, Bevivino A, Dalmistri C, Tabacchioni S, Chiarini L (2002) Effect of two
different application methods for Burkolderia ambifaria Mci 7 on plant growth and rhizo-
spheric bacterial diversity. Environ Microbiol 4:238–245
Dong Z, Canny MJ, McCully Mw, Roboredo MR, Cabadilla CF, Ortega E, Rodes R (1994) A
nitrogen fixing endophyte of sugarcane stems. Plant Physiol 105:1139–1147
Gagne S, Richard C, Rousseau H, Antoun H (1987) Xylem-residing bacteria in alfalfa roots. Can J
Microbiol 33:996–1005
Gardner JM, Feldman AW, Zablotowics RM (1982) Identity and behavior of xylem-residing
bacteria in rough lemon roots of Glorida citrus trees. Appl Environ Microbiol 66:5488–5491
Glick BR (1995) The enhancement of plant growth by free-living bacteria. Can J Microbiol
41:109–117
Hallmann J, Quadt-Hallmann A, Mahaffee WF, Kloepper JW (1997) Bacterial endophytes in
agricultural crops. Can J Microbiol 43:895–914
Hallmann J, Berg G, Schulz B (2006) Isolation procedures for Endophytic microorganisms. In:
Schulz BJE, Boyle CJC, Sieber TN (eds) Microbial root endophytes (Soil biology). Springer,
Heidelberg, pp 300–319
Kloepper JW, Lifshitz R, Zablotowicz RM (1989) Free-living bacterial inocula for enhancing crop
productivity. Trend Biotechnol 7:39–44
224 K. Pathak et al.

McInroy JA, Kloepper JW (1994) Studies on indigenous endophytic bacteria of sweet corn and
cotton. In: O’Gara F, Dowling DN, Boesten B (eds) Molecular ecology of rhizosphere micro-
organisms. Wiley-VCH, Weinheim, pp 19–28
Mittermeier RA, Meyers N, Gil PR, Mittermeier CG (1999) Hotspot: Earth’s biologically richest
and most endangered eco regions. Toppan Printing Co, Tokyo
Parmeela Jhori BN (2004) Phylogenetic analysis of bacterial endophytes showing antagonism
against Rhizobium solani. Curr Sci 87:687–792
Patriquin DG, Dobereiner J (1978) Light microscopy observations of tetrazolium–reducing bacte-
ria in the endorhizosphere of maize and other grasses in Brazil. Can J Microbiol 24:724–742
Rensing KH (2002) Chemical and cryofixation for transmission electron microscopy of gymno-
sperm cambial cells. In: Chattey N (ed) Wood formation in trees. Taylor & Francis, Singapore,
pp 65–81
Roland JC (1978) General preparation and staining of thin sections. In: Hall JL (ed) Electron
microscopy and cytochemistry of plant cells. Elsevier North-Holland Biomedical Press,
Amsterdam, pp 1–41
Sardi P, Sarachhi M, Quaroni S, Petrolini B, Borgonovi GE, Merli S (1992) Isolation of endophytic
streptomyces strains from surface-sterilised roots. Appl Environ Microbiol 58:2691–2693
Sato T (1967) A modified method of lead staining of thin sections. J Electron Microscopy 16:133
Strobel G, Daisy B (2003) Bioprospecting for microbial endophytes and their natural products.
Microbiol Mol Biol Rev 67:491–502
13 Isolation, Cultivation and In Planta 225

Chapter 14
Micro-PIXE Analysis for Localization
and Quantification of Elements in Roots
of Mycorrhizal Metal-Tolerant Plants
Katarina Vogel-Mikus, Paula Pongrac, Primoz Pelicon, Primoz Vavpetic,
Bogdan Povh, Hermann Bothe and Marjana Regvar
14.1 Introduction
Many fundamental processes of plant and fungal physiology are affected or regu-
lated by mineral nutrients (Marschner 1995). The mechanisms of nutrient uptake,
and their roles in plant and fungal metabolism are therefore of great importance for
our understanding of symbiotic interactions and their functioning. In addition, there
is a great demand for methods that can document the responses of plants and fungi
to environmental stresses that can be caused by either factors present in the natural
environment or by anthropogenic pollution. Particle-induced X-ray emission with a
focused proton beam (micro-PIXE) is a powerful tool for these types of studies
(Scheloske et al. 2004; Przybyłowicz et al. 2004; Vogel-Mikus et al. 2007, 2008a, b).
All elements encompassing the list of macro- and micro-nutrients, as well as
elements considered as toxic pollutants, can be measured simultaneously by
micro-PIXE. Maps of element distribution can provide valuable information that
is not possible to obtain using point analyses or linear scans. The localization and
quantification data on toxic elements in plants and fungi that have been gained
using this technique have indicated possible pathways of detoxification mechan-
isms, and can therefore improve our understanding of plant and fungal adaptations
to various environmental conditions. However, tracking element distribution can
K. Vogel-Mikus, P. Pongrac and M. Regvar (*)
Department of Biology, Biotechnical Faculty, University of Ljubljana, Vecna pot 111, SI‐1000Ljubljana, Slovenia
e-mail: [email protected]
P. Pelicon and P. Vavpetic
Jozef Stefan Institute, Jamova 39, 1000 Ljubljana, Slovenia
B. PovhMax-Planck-Institut fur Kernphysik, P.O. Box 103980, 69029 Heidelberg, Germany
H. BotheUniversitat zu Koln, Botanisches Institut, Gyrhofstrasse 15, D-50923 Koln, Germany
A. Varma and A.C. Kharkwal (eds.), Symbiotic Fungi, Soil Biology 18, 227
DOI: 10.1007/978‐3‐540‐95894‐9_14, # Springer‐Verlag Berlin Heidelberg 2009

only be achieved through the appropriate preparation of specimens, making this the
most important step in the analysis (Mesjasz-Przybyłowicz and Przybyłowicz 2002;
Schneider et al. 2002). This chapter is therefore mainly dedicated to micro-PIXE
specimen preparation, which has been developed in our laboratory in collaboration
with colleagues from the Max Planck Institute for Nuclear Physics, Heidelberg.
14.2 Materials and Procedures
14.2.1 Equipment for Sample Preparation
– Thermo-block, for rapid freezing of specimens
– Cryo-microtome
– Freeze-drier
14.2.2 Laboratory Materials
– Scalpels and forceps
– Needles with polished tips
– Aluminium foil for making tissue-freezing medium beds
– Beakers
– Tissue-freezing medium
– Liquid nitrogen
– Propane
– Pioloform in chloroform
– Microscope object-glass
– Aluminium sample holders
– Glue (two-component Araldite)
14.2.3 Specimen Preparation
The aim of the preparation of the biological material is the preservation of the
element distribution as close as possible to its native (in vivo) state. The high-
resolution capability of modern microprobe equipment places stringent demands on
the tissue preparation for intracellular and tissue element-distribution studies. Any
measurement can thus be meaningless and misleading unless changes in tissue
morphology and chemical redistribution have been limited to dimensions that are
smaller than the resolution of the microprobe (Schneider et al. 2002).
Incomplete protocols can cause artefacts that can lead to the removal or redistri-
bution of elements, and hence to errors far exceeding those inherent to a measure-
ment technique. It is generally accepted that only low-temperature methods can
eliminate such artefacts, since it is evident that with chemical preparations some
elements may be added, washed out or redistributed (Schneider et al. 2002;
228 K. Vogel-Mikus et al.

Mesjasz-Przybyłowicz and Przybyłowicz 2002). Therefore, specimen cryo-fixation
is typically followed by specimen sectioning at low temperatures and finally by
freeze-drying (Frey et al. 2000; Schneider et al. 2002; Vogel-Mikus et al. 2008b).
Even though cryo-sectioning is accepted as a routine preparation technique for
animal tissues, the number of studies that have used cryo-sections of fully differ-
entiated plant material for analytical purposes remains small. The primary reasons for
this are technical problems during freezing, due to the poor thermal conductivity of
plant tissues arising from the cellulose cell wall, a unique feature of plant cells, and
to the intercellular spaces filled with gas. Additionally, the alternating sequences of
different materials, e.g., the rigid cell walls, vacuolar ice crystals and gas-filled
intercellular spaces of the plant tissues, tend to result in sample crumbling during
either sectioning or freeze-drying, which makes it particularly difficult to obtain
cryo-sections with well-preserved morphology (Schneider et al. 2002).
The details of the more established cryo-preparation protocols for electron
microscopy cannot be easily adapted here. The sections required for micro-PIXE
analysis have to bemuch thicker (e.g., 60 mm) to obtain sufficient X-ray yield (Vogel-
Mikus et al. 2008b), which in the case of micro-PIXE is acquired from the entire
depth of the specimen. Cryo-fixation must also be as rapid as possible to avoid the
formation of larger ice crystals, which could damage plant and fungal cells. In
addition, nuclear microprobe analyses are performed under vacuum conditions
(10�5 mbar or lower), and therefore the specimens must be dry and immobilized
in their preanalysis functional state (Vogel-Mikus et al. 2007, 2008a, b).
14.2.3.1 Plant Material
Care should be taken regarding the physiological state of the material harvested for
micro-PIXE analysis, and therefore the use only of freshly harvested roots is
recommended, to avoid artificial element redistribution resulting from wilting and
senescence. The roots should be cleansed with tap and distilled water to remove all
of the soil particles. The secondary roots hosting mycorrhizal fungi should be
excised with stainless steel scissors to avoid sample contamination with metals.
14.2.3.2 Specimen Freezing
The freezing of the specimens should be done as rapidly as possible to reduce the
growth of ice crystals. Excised root fragments (cca. 0.5 cm long) are inserted into
stainless steel needles with polished tips (Schneider et al. 2002; Scheloske et al.
2004; Vogel-Mikus et al. 2008b), which are carefully chosen according to the
root diameter, to ensure a tight hold of the root during sectioning (Fig. 14.1).
Alternatively, the excised root fragments can be transferred into aluminium foil
beds (0.5 � 0.5 � 0.5 cm) that are filled with tissue-freezing medium. Afterwards
the specimens are dipped into propane cooled with liquid nitrogen, which provides
a superior cryogen when compared to liquid nitrogen, due to its higher cooling rate.
A specially designed thermo-block is used for this (Fig. 14.1), which should be
14 Micro-PIXE Analysis for Localization and Quantification of Elements 229
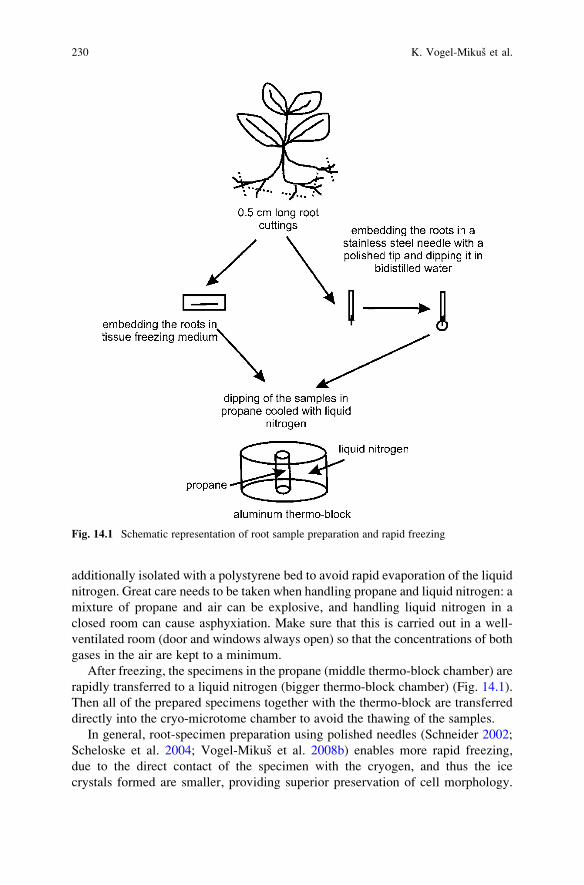
additionally isolated with a polystyrene bed to avoid rapid evaporation of the liquid
nitrogen. Great care needs to be taken when handling propane and liquid nitrogen: a
mixture of propane and air can be explosive, and handling liquid nitrogen in a
closed room can cause asphyxiation. Make sure that this is carried out in a well-
ventilated room (door and windows always open) so that the concentrations of both
gases in the air are kept to a minimum.
After freezing, the specimens in the propane (middle thermo-block chamber) are
rapidly transferred to a liquid nitrogen (bigger thermo-block chamber) (Fig. 14.1).
Then all of the prepared specimens together with the thermo-block are transferred
directly into the cryo-microtome chamber to avoid the thawing of the samples.
In general, root-specimen preparation using polished needles (Schneider 2002;
Scheloske et al. 2004; Vogel-Mikus et al. 2008b) enables more rapid freezing,
due to the direct contact of the specimen with the cryogen, and thus the ice
crystals formed are smaller, providing superior preservation of cell morphology.
Fig. 14.1 Schematic representation of root sample preparation and rapid freezing
230 K. Vogel-Mikus et al.

However, for scans of the specimens with a lateral resolution of 1–3 mm, which
enables element mapping at the tissue level, the embedding of the specimens in
tissue-freezing medium appears to be just as adequate. In addition, embedding the
roots in the medium ensures that the holding of the specimen is more stable, making
the cryo-sectioning easier (Fig. 14.2). Moreover, this way of specimen mounting
can also be applied to longitudinal sections. On the other hand, using cryo-section-
ing with needles is more demanding, because of the loose root support within the
needle which can easily break during sectioning. A substantial improvement to this
protocol can be achieved by dipping the inserted root into bidistilled water in a
vertical position, and afterwards dipping it into a cryogen embedded with a water
droplet, which then freezes. In this way, amorphous ice is formed from the droplet,
which embeds the root and provides support for cryo-sectioning. In addition, a
specially designed adapter is needed to fix the needle with a specimen into the head
of the cryo-microtome (Schneider et al. 2002).
14.2.3.3 Cryo-Sectioning
When cryo-sectioning, it is of vital importance that the cryo-microtome tempera-
ture set-up, the cutting velocity, and the section thickness are optimized for each
particular plant species and tissue in question (Schneider et al. 2002). Only after
optimization of these parameters can promising results be expected. The tempera-
ture of the cryo-microtome head and chamber usually varies between �40�C to
�20�C, depending on the tissue water content. As a general rule, smoother section-
ing of tissues with high water contents can be obtained at lower temperatures. When
ideally frozen, plant tissues resemble amorphous glass, and sections obtained from
Fig. 14.2 Cryo-microtome chamber with a sample embedded in tissue-freezing media
14 Micro-PIXE Analysis for Localization and Quantification of Elements 231
such specimens ensure the best possible level of preservation of tissue morphology,
and thus the most reliable results. In addition, to control the quality of the sections,
a dissecting binocular should be provided with the cryo-microtome. The specimens
should be sectioned using disposable stainless steel cryo-microtome blades, which
are superior to the standard steel or diamond knives (Schneider et al. 2002). The
sections of the specimens are then put on pre-cooled filter paper into specially
designed pre-cooled aluminium beakers with a cover, and kept in liquid nitrogen
for freeze-drying.
14.2.3.4 Freeze-Drying
Freeze-drying is a very sensitive step in the whole procedure, since the samples can
wilt and shrink drastically due to the large amounts of water in plant tissues. The
samples should therefore be freeze-dried at the lowest temperature possible (they
are best put in the freeze-dryer in liquid nitrogen) and at low pressure (10�5 bar).
To ensure the flatness of the sections, they should be laid between two layers
of precooled filter paper and fixed with a pre-cooled heavy object (e.g., a part of
microscope object glass).
14.2.3.5 Mounting of the Samples into Holders
The freeze-dried samples are mounted into aluminium holders that are covered with
a thin foil (cca. 300 nm thick) of Pioloform (SPI Chem) (Fig. 14.3). The foil is
prepared by dissolving 1 g of Pioloform in 75 ml chloroform (Vogel-Mikus et al.
2007), which can be kept in a dark flask for cca. 6 months, with the dissolved
solution then poured into a beaker. The easiest way of making the foils is to dip a
clean microscope object glass into the foil solution for 2 s and then let it dry for
3 min. Then the edges of the foil are scraped with another clean object glass, to
enable the detachment of the foil from the object-glass. The foil is then floated from
the object glass by dipping it into bidistilled water and picking out the foil on a
specially designed aluminium section holder, as schematically represented in
Fig. 14.3. The sections should be carefully put on a holder with forceps and covered
with another holder covered with Pioloform foil, to fix the section into a sandwich
(Vogel-Mikus et al. 2007, 2008b). The sections can also be mounted on foil with
special two-component glue (e.g., Araldite), being sure that the areas of interest for
scanning remain clean.
14.2.4 Micro-PIXE Analysis
Micro-PIXE permits quantitative studies of element distributions, with lateral
resolution of the order of 1 mm for elements from Na to U. Relatively few nuclear
microprobe set-ups for the analysis of biological material exist worldwide because
232 K. Vogel-Mikus et al.

of financial constraints, and they vary in their technical characteristics. The most
common configuration consists of an ion accelerator, object and collimating slits,
ion lens and measuring station. Fig. 14.4 shows a schematic set-up of the nuclear
microprobe at the Jozef Stefan Institute (JSI) (Simcic et al. 2002; Pelicon et al.
2005).
For the analysis of thin biological samples at the nuclear microprobe of the JSI,
high- and low-current modes are applied sequentially to the same sample region of
interest. In the high-current mode used for micro-PIXE analysis, a proton beam
with an energy of 3 MeV with a diameter varying from 1 to 3 mm at ion currents
ranging from 60 to 500 pA is formed, depending on the required lateral resolution.
In the low-energy mode, the object slits are closed to reduce the beam flux to cca.
500 protons per second. The passivated implanted planar silicon detector is posi-
tioned directly in the beam, to obtain the best contrast in scanning transmission ion
Fig. 14.3 Schematic representation of the preparation of Pioloform foil for covering the sample
holders
14 Micro-PIXE Analysis for Localization and Quantification of Elements 233

microscopy (STIM), which is used for the determination of specimen thickness
(Vogel-Mikus et al. 2008b).
The detection of X-ray energies from 1 keV up to 25 keV is provided by a pair
of X-ray detectors. These include a high-purity germanium X-ray detector with an
active area of 95 mm2, a 25-mm-thick beryllium window and a 100-mm-thick
polyimide absorber positioned at an angle of 135� with respect to the beam direc-
tion. Simultaneously, a Si(Li) detector with an area of 10 mm2 and an 8-mm-thick
Be window is installed at the angle of 125� with respect to the beam direction, for
the detection of low-energy X-rays, in the energy range from 0.8 to 4 keV. At the
JSI, the samples are sprayed with low-energy electrons from a hot tungsten filament
during the measurements, to avoid sample charging, thus efficiently avoiding time-
consuming specimen carbon coating.
Precise proton-dose determination is required for quantitative micro-PIXE anal-
ysis. For this reason, an in-beam chopping device is positioned in the beam line
after the last collimation of the beam before it hits the sample. The rotating chopper
is of gold-plated graphite, and periodically intersects the beam with a frequency
of ca. 10 Hz, which makes the method insensitive to beam-intensity fluctuations.
The spectrum of back-scattered protons from the chopper is recorded in parallel
with the PIXE spectra in the list mode. The high-energy part of the spectrum
consists of protons scattered from the Au layer, and it appears as a separate peak,
the area of which is proportional to the proton flux. During the off-line data
processing, the proton dose corresponding to an arbitrary scanning area selection
can be extracted from the list-mode results simultaneously with the PIXE spectra
(Vogel-Mikus et al. 2007, 2008b).
The regions of interest on the samples are preselected by short PIXE mapping in
high-current mode. After the final sample positioning and scan size selection, the
object slits are closed and the STIM maps are measured in the list mode. A partially
depleted planar silicon detector is positioned directly in the beam to obtain the best
contrast for the STIM. This is followed by high-current mode, during which the
PIXE maps of the same region are measured in list mode over a longer period of
Low energySiLi X-Ray detector
STIM detector& Faraday cup(on rotationalfeedthrough)
High energyHpGe X-RayDetector(100 µm polyimideabsorber)
QuadrupoleTriplet OM
Rotating chopper:dose normalization
Scanningcoils
Collimatorslits
Objectslits 3 MeV P+
beam
Fig. 14.4 Schematic diagram of the nuclear microprobe at JSI
234 K. Vogel-Mikus et al.

time, lasting from 1 up to 30 h, depending on the concentration and atomic numbers
of the elements under consideration. As a third and last step, the STIM map is again
measured over the same sample area for a control of sample consistency, thinning,
and possible shrinking.
In combination with the assumed cellulose matrix composition, proton exit
energy measured by STIM is used for determination of sample thickness. The
stopping power of 3 MeV protons in cellulose is 114 keV (mg cm�2)�1. Frozen
hydrated plant tissue is usually sectioned on the cryo-microtome to a thickness of
60 mm. The pass of the proton beam through a freeze-dried tissue sample results in
an energy loss of ca. 120–150 keV. This energy loss corresponds to a cellulose area
density of 1.05–1.31 mg cm�2. Assuming a cellulose bulk density of 1.6 g cm�3,
this gives 6.5–8.1 mm of equivalent bulk cellulose thickness. The heterogeneous
morphology of the sample results in an uneven area density after freeze-drying. To
quantify the element concentrations of a particular morphological structure cor-
rectly, its thickness is extracted in the form of the exit energy from the STIM data,
and it is fed into the trace calculation of the GUPIXWIN code, which is dedicated to
the fitting and quantification of PIXE spectra (Campbell et al. 2000).
The calibration of the PIXE method is usually verified by analysis of the multi-
element standard reference materials NIST SRM 1573a (tomato leaves, homoge-
nized powder, analyzed in a form of a pressed pellet), NIST SRM 1107 (naval
brass B, alloy), and NIST SRM 620 (soda-lime flat glass) (Necemer et al. 2008).
The inter-calibration of PIXE and STIM is usually verified by thin mono-element
metallic foils (Vogel-Mikus et al. 2008b).
An example of a detailed study of the element distribution in mycorrhizal and
nonmycorrhizal Aster tripolium can be found in Scheloske et al. (2004). In addition,
micro-PIXE mapping of the element distribution in arbuscular mycorrhizal roots of
the grass Cynodon dactylon is presented in Weiersbye et al. (1999).
14.3 Example of Micro-PIXE Analysis
For the purpose of this manuscript, a selected sample application in studies of plant/
fungal interactions in a metal-polluted environment is presented. Only a small
amount of plant material (few leaves or roots) is needed for the micro-PIXE analysis,
which is highly appreciated in plant physiology studies and a prerequisite for the
following study with the endangered zinc violets. The data were obtained using a
nuclear microprobe at the Microanalytical Centre of the JSI, Ljubljana, Slovenia.
14.3.1 Sample Preparation and Micro-PIXE Analysis
Zinc violets (Viola lutea ssp. westfalica; for the nomenclature see Hildebrandt et al.
(2006)) were collected at a nonpolluted site (garden, D-50374 Erftstadt-Bliesheim,
Germany) and at a Zn- and Pb-polluted site (D-33165 Blankenrode, Germany), and
14 Micro-PIXE Analysis for Localization and Quantification of Elements 235

transferred to the laboratory. The collected plants were colonized by arbuscular
mycorrhizal fungi with a frequency of F(%) = 31% for the garden material and
F(%) = 42% for the plants from Blankenrode, as determined by the method of
Trouvelot et al. (1986) after staining with Trypan Blue (Philips and Haymann
1970).
The root samples for micro-PIXE analysis were prepared using cryo-fixation in
tissue-freezing medium, cryo-sectioning and freeze-drying, all as described above.
Element maps were generated using a 3 MeV proton micro-beam (Fig. 14.5).
Afterwards, the areas of interest (epidermis, cortex, endodermis, and vascular
tissues) were encircled and their corresponding spectra extracted (Tables 14.1 and
14.2; Fig. 14.6). The element concentrations were calculated on the basis of
a
SM P S
Cl K Ca
Fe
0 High counts
Cu Zn
Fig. 14.5a (continued)
236 K. Vogel-Mikus et al.
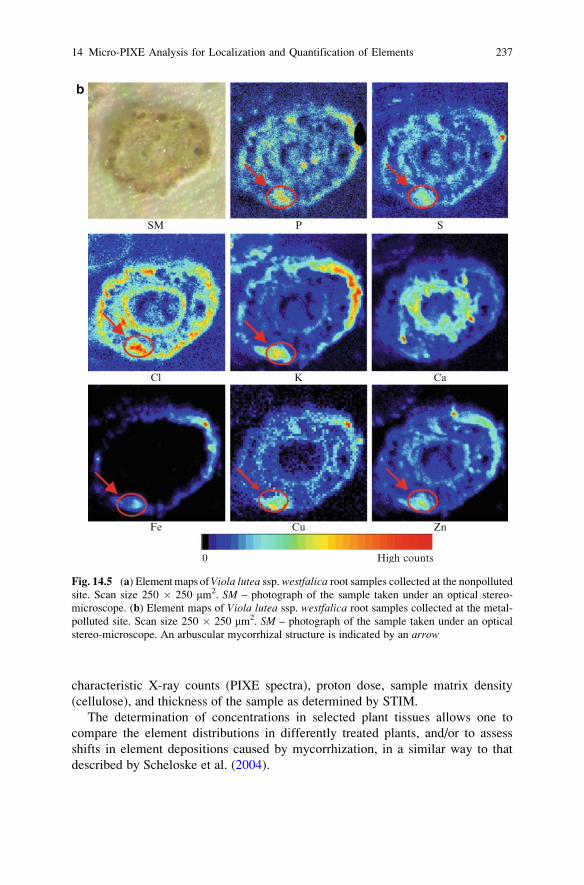
characteristic X-ray counts (PIXE spectra), proton dose, sample matrix density
(cellulose), and thickness of the sample as determined by STIM.
The determination of concentrations in selected plant tissues allows one to
compare the element distributions in differently treated plants, and/or to assess
shifts in element depositions caused by mycorrhization, in a similar way to that
described by Scheloske et al. (2004).
SM
b
P S
Cl K Ca
Fe
0 High counts
Cu Zn
Fig. 14.5 (a) Elementmaps ofViola lutea ssp. westfalica root samples collected at the nonpolluted
site. Scan size 250 � 250 mm2. SM – photograph of the sample taken under an optical stereo-
microscope. (b) Element maps of Viola lutea ssp. westfalica root samples collected at the metal-
polluted site. Scan size 250 � 250 mm2. SM – photograph of the sample taken under an optical
stereo-microscope. An arbuscular mycorrhizal structure is indicated by an arrow
14 Micro-PIXE Analysis for Localization and Quantification of Elements 237
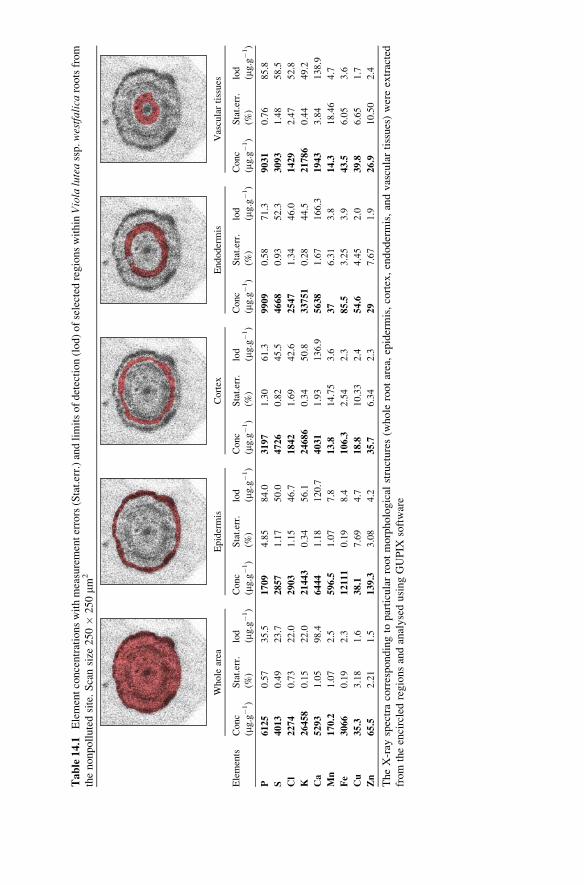
Table14.1
Elementconcentrationswithmeasurementerrors(Stat.err.)andlimitsofdetection(lod)ofselected
regionswithin
Viola
luteassp.westfalicarootsfrom
thenonpollutedsite.Scansize
250�
250mm
2
Whole
area
Epidermis
Cortex
Endodermis
Vasculartissues
Elements
Conc
(mg.g
�1)
Stat.err.
(%)
lod
(mg.g
�1)
Conc
(mg.g
�1)
Stat.err.
(%)
lod
(mg.g
�1)
Conc
(mg.g
�1)
Stat.err.
(%)
lod
(mg.g�1)
Conc
(mg.g
�1)
Stat.err.
(%)
lod
(mg.g
�1)
Conc
(mg.g
�1)
Stat.err.
(%)
lod
(mg.g
�1)
P6125
0.57
35.5
1709
4.85
84.0
3197
1.30
61.3
9909
0.58
71.3
9031
0.76
85.8
S4013
0.49
23.7
2857
1.17
50.0
4726
0.82
45.5
4668
0.93
52.3
3093
1.48
58.5
Cl
2274
0.73
22.0
2903
1.15
46.7
1842
1.69
42.6
2547
1.34
46.0
1429
2.47
52.8
K26458
0.15
22.0
21443
0.34
56.1
24686
0.34
50.8
33751
0.28
44.5
21786
0.44
49.2
Ca
5293
1.05
98.4
6444
1.18
120.7
4031
1.93
136.9
5638
1.67
166.3
1943
3.84
138.9
Mn
170.2
1.07
2.5
596.5
1.07
7.8
13.8
14.75
3.6
37
6.31
3.8
14.3
18.46
4.7
Fe
3066
0.19
2.3
12111
0.19
8.4
106.3
2.54
2.3
85.5
3.25
3.9
43.5
6.05
3.6
Cu
35.3
3.18
1.6
38.1
7.69
4.7
18.8
10.33
2.4
54.6
4.45
2.0
39.8
6.65
1.7
Zn
65.5
2.21
1.5
139.3
3.08
4.2
35.7
6.34
2.3
29
7.67
1.9
26.9
10.50
2.4
TheX-ray
spectracorrespondingto
particularrootmorphological
structures(w
hole
rootarea,epidermis,cortex,endodermis,andvasculartissues)wereextracted
from
theencircledregionsandanalysedusingGUPIX
software

Table14.2
Elementconcentrationswithmeasurementerrors(Stat.err.)andlimitsofdetection(lod)ofselected
regionswithin
Viola
luteassp.westfalicarootsfrom
themetal-pollutedsite.Scansize
250�
250mm
2
Whole
area
Epidermis
Cortex
Endodermis
Vasculartissues
Elements
Conc
(mg.g
�1)
Stat.err.
(%)
lod
(mg.g
�1)
Conc
(mg.g
�1)
Stat.err.
(%)
lod
(mg.g
�1)
Conc
(mg.g
�1)
Stat.err.
(%)
lod
(mg.g
�1)
Conc
(mg.g
�1)
Stat.err.
(%)
lod
(mg.g
�1)
Conc
(mg.g
�1)
Stat.err.
(%)
lod
(mg.g
�1)
P1453
1.72
24.2
1494
4.53
52.1
1275
1.64
35.4
1583
2.36
68.6
1826
1.67
48.3
S1255
1.23
30.2
1582
1.58
47.9
1023
2.27
45.8
1316
2.90
75.2
1073
2.26
40.9
Cl
4342
0.30
14.3
6248
0.39
27.6
2991
0.68
23.7
6124
0.64
41.4
1606
1.40
29.3
K4632
0.27
13.4
9224
0.31
26.4
2492
0.77
22.2
3803
0.95
44.3
1664
1.50
32.5
Ca
8828
0.25
23.9
4601
0.75
51.3
8381
0.41
26.8
18748
0.39
48.6
8116
0.59
31.9
Mn
18.8
4.78
1.7
41.2
5.48
4.1
10
10.94
2.0
10.9
17.23
3.4
0.0
/2.6
Fe
2341
0.14
1.2
7594
0.13
2.3
137.5
1.28
1.6
64.8
3.43
2.9
35
4.58
2.1
Cu
18.8
7.36
2.4
34.1
7.16
4.2
11.2
17.18
3.4
17.1
22.27
7.0
8.6
23.35
3.7
Zn
8801
0.10
2.3
11846
0.15
4.2
6970
0.22
1.7
12031
0.25
7.0
3913
0.44
5.6
Pb
1192
0.64
1.9
1642
0.96
8.8
1231
1.26
5.1
1234
1.91
15.5
214.4
5.00
8.8
TheX-ray
spectracorrespondingtoparticularrootmorphologicalstructures(w
holerootarea,epidermis,cortex,endodermis,andvasculartissues)wereextractedfrom
theencircledregionsandanalysedusingGUPIX
software
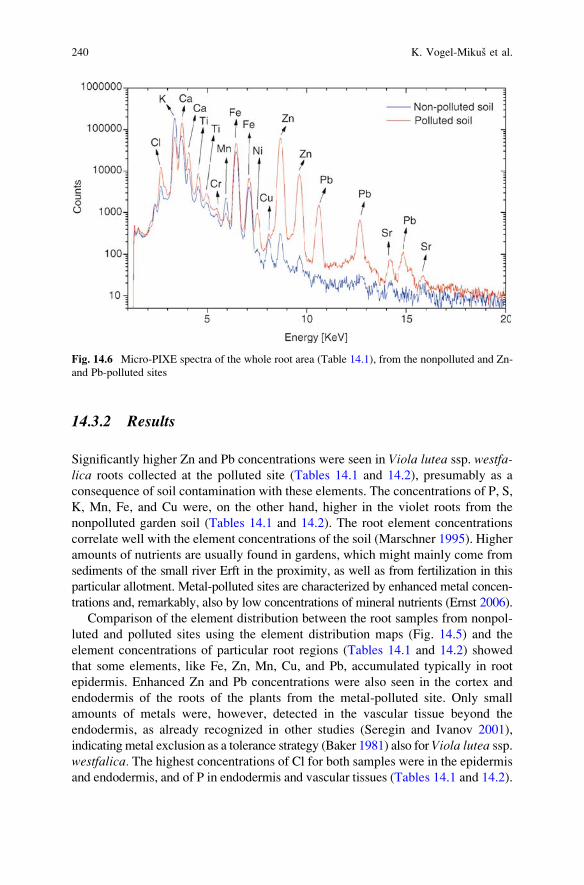
14.3.2 Results
Significantly higher Zn and Pb concentrations were seen in Viola lutea ssp. westfa-lica roots collected at the polluted site (Tables 14.1 and 14.2), presumably as a
consequence of soil contamination with these elements. The concentrations of P, S,
K, Mn, Fe, and Cu were, on the other hand, higher in the violet roots from the
nonpolluted garden soil (Tables 14.1 and 14.2). The root element concentrations
correlate well with the element concentrations of the soil (Marschner 1995). Higher
amounts of nutrients are usually found in gardens, which might mainly come from
sediments of the small river Erft in the proximity, as well as from fertilization in this
particular allotment. Metal-polluted sites are characterized by enhanced metal concen-
trations and, remarkably, also by low concentrations of mineral nutrients (Ernst 2006).
Comparison of the element distribution between the root samples from nonpol-
luted and polluted sites using the element distribution maps (Fig. 14.5) and the
element concentrations of particular root regions (Tables 14.1 and 14.2) showed
that some elements, like Fe, Zn, Mn, Cu, and Pb, accumulated typically in root
epidermis. Enhanced Zn and Pb concentrations were also seen in the cortex and
endodermis of the roots of the plants from the metal-polluted site. Only small
amounts of metals were, however, detected in the vascular tissue beyond the
endodermis, as already recognized in other studies (Seregin and Ivanov 2001),
indicating metal exclusion as a tolerance strategy (Baker 1981) also for Viola lutea ssp.westfalica. The highest concentrations of Cl for both samples were in the epidermis
and endodermis, and of P in endodermis and vascular tissues (Tables 14.1 and 14.2).
Fig. 14.6 Micro-PIXE spectra of the whole root area (Table 14.1), from the nonpolluted and Zn-
and Pb-polluted sites
240 K. Vogel-Mikus et al.

However, the distribution of K was different, with the highest concentration seen in
the cortex and endodermis in the roots of violets collected in the nonpolluted
garden, and in the epidermis in the roots collected at the metal-polluted site (Tables
14.1 and 14.2). Ca was concentrated in the endodermis in the roots from the
polluted site, while in the roots from the nonpolluted soil the Ca concentration
gradually decreased from epidermis to central cylinder (Table 14.1).
PIXE analysis does not allow one to detect arbuscular mycorrhizal fungal
structures in the root cells directly. However, in the root sample collected at the
polluted site, a P-, S-, Cl-, K-, Fe-, Zn-, and Pb-rich structure was seen in the root
cortex (Fig. 14.5b), which could be attributed to an arbuscule of AM fungi. In the
study by Weiersbye et al. (1999) on element maps generated by micro-PIXE,
arbuscules were seen as localized accumulations of P and Fe in and around cortical
cells. These might be linked to the highly efficient P and Fe sequestration mechan-
isms characteristic of AM fungi (Smith and Read 1997), while vesicles usually
accumulate higher Mn, Cu, and Ni than cortical cells (Weiersbye et al. 1999). In
addition, the accumulation of Zn and Pb in AM fungal structures is consistent with
the high metal-binding capacity of AM mycelium (Joner et al. 2000). In line with
this, arbuscular mycorrhizal fungal structures only occur in the outer tissues, where
they might bind heavy metals, whereas they cannot surpass the tight Casparian strip
that is deposited on the walls of the endodermal cells.
14.4 Conclusions
Micro-PIXE is a powerful tool for qualitative and quantitative investigations of
element distributions in plant and fungal tissues, and it also provides especially
attractive element-mapping capabilities. To date, the appropriate morphology preser-
vation of specimens during sample preparation appears to be one of themain obstacles
to obtaining high-resolution qualitative and quantitative elementmapsprimarily on the
cellular, tissue and organ levels. The element localization maps obtained by this
method can contribute significantly to our current knowledge of plant physiology,
stress responses, and the complexity of plant–microbe interactions, as well as having
broad applications in biotechnology.However, a prerequisite for success in this broad-
spectrum interdisciplinary research field is close collaboration between physics,
chemistry, biochemistry, biotechnology, and plant sciences researchers.
References
Baker AJM (1981) Accumulators and excluders — strategies in the response of plants to heavy
metals. J Plant Nutr 3:643–654
Campbell JL, Hopman TL, Maxwell JA, Nejedly Z (2000) The Guelph PIXE software package III:
alternative proton database. Nucl Instrum Methods B 170:193–204
Ernst WHO (2006) Evolution of metal tolerance in higher plants. For Snow Landsc Res 80:251–274
14 Micro-PIXE Analysis for Localization and Quantification of Elements 241

Frey B, Zierold K, Brunner I (2000) Extracellular complexation of Cd in the Hartig net and
cytosolic Zn sequestration in the fungal mantle of Picea abies– Hebeloma cristuliniformeectomycorrhizas. Plant Cell Environ 23:1257–1265
Hildebrandt U, Hoef-Emden K, Backhausen S, Bothe H, Bozek M, Siuta A, Kuta E (2006) The
rare, endemic zinc violets of Central Europe originate from Viola lutea Huds. Plant Syst Evol
257:205–222
Joner E, Briones R, Leyval C (2000) Metal-binding capacity of arbuscular mycorrhizal mycelium.
Plant Soil 226:227–234
Marschner H (1995) Mineral nutrition of higher plants, 2nd edn. Academic, London
Mesjasz-Przybyłowicz J, Przybyłowicz WJ (2002) Micro-PIXE in plant sciences: present status
and perspectives. Nucl Instrum Meth B 189:470–481
Necemer M, Kump P, Scancar J, Jacimovic R, Simcic J, Pelicon P, Budnar M, Jeran Z, Pongrac P,
Regvar M, Vogel-Mikus K (2008) Application of X-ray fluorescence analytical techniques in
phytoremediation and plant biology studies. Spectrochim Acta B 11(63):1240–1247
Philips JM, Haymann DS (1970) Improved procedures for clearing roots and staining parasitic and
vesicular arbuscular mycorrhizal fungi for rapid assessment of infection. Trans Br Mycol Soc
55:158–160
Pelicon P, Simcic J, Jaksic M, Medunic Z, Naab F, McDaniel FD (2005) Spherical chamber-
effective solution for multipurpose nuclear microprobe. Nucl Instrum Methods B 231:53–59
Przybyłowicz WJ, Mesjasz-Przybyłowicz J, Migula P, Turnau K, Nakonieczny M, Augustyniak
M, Głowacka E (2004) Elemental microanalysis in ecophysiology using ion microbeam. Nucl
Instrum Methods B 219–220:57–66
Scheloske S, Maetz M, Schneider T, Hildebrandt U, Bothe H, Povh B (2004) Element distribution
in mycorrhizal and nonmycorrhizal roots of the halophyte Aster tripolium determined by
proton induced X-ray emission. Protoplasma 223:183–189
Schneider T, Scheloske S, Povh B (2002) A method for cryosectioning of plant roots for proton
microprobe analysis. I J PIXE 12:101–107
Seregin IV, Ivanov VB (2001) Physiological aspects of cadmium and lead toxic effects on higher
plants. Russ J Plant Physio 48:523–544
Simcic J, Pelicon P, Budnar M, Smit Z (2002) The performance of the Ljubljana ion microprobe.
Nucl Instrum Methods B 190:283–286
Smith SE, Read DJ (1997) Mycorrhizal Symbiosis, 2nd edn. Academic, London
Trouvelot A, Kough J, Gianinazzi-Pearson V (1986) Mesure du taux de mycorhization VA d’un
systeme radiculaire. Recherche de methodes d’estimation ayant une signification fonction-
nelle. In: Gianinazzi-Pearson V, Gianinazzi S (eds) Physiological and genetical aspects of
mycorrhizae. Institut National de la Recherche Agronomique, Paris, pp 217–221
Vogel-Mikus K, Pongrac P, Kump P, Necemer M, Simcic J, Pelicon J, Budnar M, Povh B, Regvar
M (2007) Localisation and quantification of elements within seeds of Cd/Zn hyperaccumulator
Thlaspi praecox by micro-PIXE. Environ Pollut 147:50–59
Vogel-Mikus K, Regvar M, Mesjasz-Przybyłowicz J, Przybyłowicz W, Simcic J, Pelicon J,
Budnar M (2008a) Spatial distribution of Cd in leaves of metal hyperaccumulating Thlaspipraecox using micro-PIXE. New Phytol. 179:712–721
Vogel-Mikus K, Simcic J, Pelicon J, Budnar M, Kump P, Necemer M, Mesjasz-Przybyłowicz J,
Przybyłowicz W, Regvar M (2008b) Comparison of essential and non-essential element
distribution in leaves of the Cd/Zn hyperaccumulator Thlaspi praecox as revealed by micro-
PIXE. Plant Cell Environ 31(10):1484–1496
Weiersbye IM, Straker CJ, Przybyłowicz J (1999) Micro-PIXe mapping of elemental distribution
in arbuscular mycorrhizal roots of the grass, Cynodon dyctylon, from gold and uranium
tailings. Nucl Instrum Methods B 158:335–343
242 K. Vogel-Mikus et al.
Chapter 15
Functional Genomic of Arbuscular Mycorrhizal
Symbiosis: Why and How Using Proteomics
Eliane Dumas-Gaudot, Ghislaine Recorbet, Franck Robert, Benoit Valot, and
Nardjis Amiour
Abbreviations
AB Amersham biosciences
APS Ammonium persulfate
AM Arbuscular mycorrhiza
CHAPS 3-[(3-cholamidopropyl) dimethyl-ammonio]-1-propanesulfonate
DEPC diethylpyrocarbonate
DTT 1,4-dithio-DL-threitol
2-DE Two-dimensional electrophoresis
ESI Electrospray ionization
ESTs Expressed sequence tags
IEF Isoelectrofocusing
IPGs Strips of immobilized pH gradients
MS Mass spectrometry
MS-MS Tandem mass spectrometry
MALDI-TOF Matrix assisted laser desorption/ionization-time of flight
NCBI National Center for Biotechnology Information
PDA Piperazine diacrylamide
PMSF Phenylmethanesulfonyl fluoride
SDS Sodium dodecyl sulfate
sqf Sufficient quantity for
E. Dumas-Gaudot (*), G. Recorbet and F. Robert
UMR 1088 INRA/CNRS 5184/UB Plante-Microbe-Environnement, INRA/CMSE, BP 86510,
21065 Dijon Cedex, France
e-mail: [email protected]
B. ValotUMR de Genetique Vegetale, IFR 87, Plate-Forme de Proteomique du Moulon, Gif sur Yvette,
France
N. Amiour
Unite de Nutrition Azotee, IJPB, INRA Centre de Versailles, 78026 Versailles Cedex, France
A. Varma and A.C. Kharkwal (eds.), Symbiotic Fungi, Soil Biology 18, 243
DOI: 10.1007/978‐3‐540‐95894‐9_15, # Springer‐Verlag Berlin Heidelberg 2009

TEMED N,N,N0,N0-Tetramethylethylenediamine
Tris Tris-[hydroxymethyl] aminomethane
US DOE US Department of Energy
15.1 Introduction
The achievement of genome sequencing programs launched for numerous organisms,
including those of several plant, bacteria and fungal species (http://www.ncbi.nih.gov/,
http://www.energy.gov/), together with the increase in available ESTs corresponding
to various biological situations of plants, bacterial and fungalmodels, have opened the
way for functional genomic analyses.Among them, proteomics looks very promising,
as it gives a direct access to the gene effectors, i.e., proteins.
Proteomics, according to its first definition by Wilkins et al. (1996), designs
the new strategies aimed at researching global protein expression in different
organisms. Thanks to the great improvements in protein separation methods,
development of mass spectrometry techniques and advances in bioinformatic
tools, it has become more and more popular during the last decade. Proteomics
relies to a major extent on experimental analyses to identify and elucidate
proteins. One of the major experimental methods used in protein identification
is two-dimensional gel electrophoresis (2-DE) coupled with mass spectrometry
(MS). 2-DE/MS systems have the ability to identify a large number of proteins from
a single sample. Studies have shown that 2-DE/MS systems could identify some-
where in the region of thousands of proteins per sample (Harry et al. 2000; Gorg
et al. 2000). Their possible use for revealing protein modifications in response to
root colonisation by arbuscular mycorrhizal (AM) fungi has already been reported
several times (Bestel-Corre et al. 2004a; Canovas et al. 2004; Jorrin et al. 2006).
Surprisingly, to date, for the other well-known symbiosis, i.e., the ectomycor-
rhizal interaction, use appears much more restricted (listed in Canovas et al.
2004). This situation could change very quickly, due to the fact that genomes of
Populus trichocarpa, the first perennial plant to be tackled, and its microcosm-
associated partners are being fully sequenced (Martin et al. 2004). While the
general protocols for successfully performing plant and/or microbe proteomics
have been largely described (Chen et al. 2005; Giavalisco et al. 2003; Grinyer
et al. 2004; Hajheidari et al. 2005; Rose et al. 2004; Saravanan and Rose 2004), the
aim of this chapter will be to address the specific points that have to be considered
when applying a proteomic approach to the study of mycorrhizal symbioses.
AM fungi colonize the vast majority of plant species, yet unlike the ectomycor-
rhizal fungi, are incapable of growth without a symbiotic host. Therefore, a first
challenge will deal with the fact that the fungal partner is an uncultivable micro-
organism. The second relates to the lack of genomic sequences in database, a hitch
that will soon be bypassed (Lammers et al. 2004). The general strategy we are using
routinely in our laboratory is presented on Fig. 15.1.
244 E. Dumas-Gaudot et al.
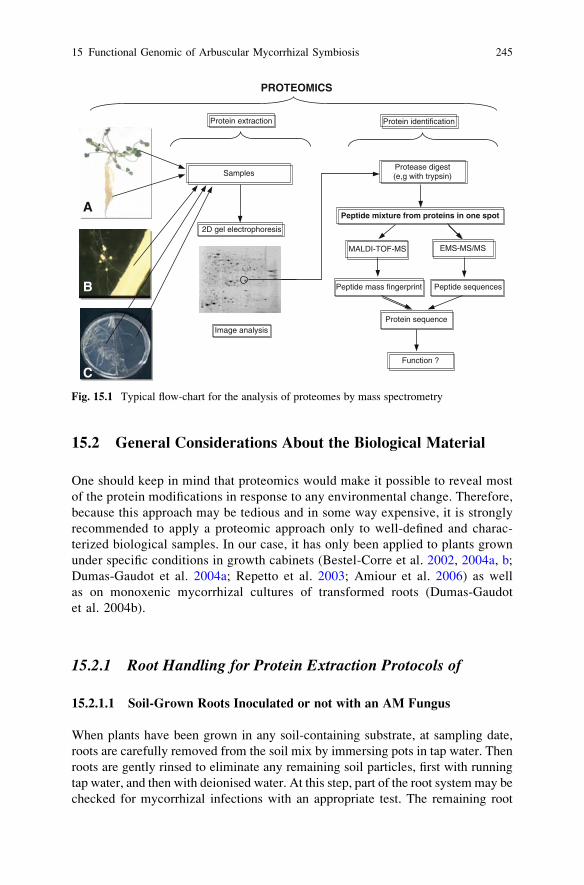
15.2 General Considerations About the Biological Material
One should keep in mind that proteomics would make it possible to reveal most
of the protein modifications in response to any environmental change. Therefore,
because this approach may be tedious and in some way expensive, it is strongly
recommended to apply a proteomic approach only to well-defined and charac-
terized biological samples. In our case, it has only been applied to plants grown
under specific conditions in growth cabinets (Bestel-Corre et al. 2002, 2004a, b;
Dumas-Gaudot et al. 2004a; Repetto et al. 2003; Amiour et al. 2006) as well
as on monoxenic mycorrhizal cultures of transformed roots (Dumas-Gaudot
et al. 2004b).
15.2.1 Root Handling for Protein Extraction Protocols of
15.2.1.1 Soil-Grown Roots Inoculated or not with an AM Fungus
When plants have been grown in any soil-containing substrate, at sampling date,
roots are carefully removed from the soil mix by immersing pots in tap water. Then
roots are gently rinsed to eliminate any remaining soil particles, first with running
tap water, and then with deionised water. At this step, part of the root system may be
checked for mycorrhizal infections with an appropriate test. The remaining root
PROTEOMICS
Protein extraction Protein identification
Samples
2D gel electrophoresis
Image analysisProtein sequence
Peptide sequences
Function ?
Peptide mass fingerprint
MALDI-TOF-MS EMS-MS/MS
Protease digest(e,g with trypsin)
Peptide mixture from proteins in one spotA
B
C
Fig. 15.1 Typical flow-chart for the analysis of proteomes by mass spectrometry
15 Functional Genomic of Arbuscular Mycorrhizal Symbiosis 245

system is weighted, and either immediately frozen in liquid nitrogen and conserved
at �80�C until protein extraction or directly submitted to the selected protein
extraction process.
15.2.1.2 Monoxenic Root-Inducing Transferred-DNA (Ri T-DNA)
Transformed Roots Inoculated or not with an AM Fungus
Glomus intraradices, as well as some other AM fungi (http://emma.agro.ucl.ac.be/
ginco-bel/), can be grown in vitro in dual culture with transformed roots. Of
particular importance is the development of a split-plate system in which a separate
fungal compartment allows a large range of manipulations and observations to be
made on the extraradical mycelium in the absence of other organisms (St-Arnaud
et al. 1996). The growth of mycorrhizal roots is restricted to one compartment
(proximal) containing modified minimal (M) medium in such a way that only the
endosymbiont grows on the second compartment (distal) containing the same
medium lacking sugar. At a selected time, control, AM-inoculated Ri-T-DNA
transformed roots and extraradical fungal material (spores and hyphae) can be
harvested for protein extraction as follows:
1. Select Petri dishes, for their compartment colonization status by the fungus, by
assessment with a magnifying binocular (when hyphae cover over 50% or more
of the distal compartment areas, they can be used for fungal protein extraction).
Usually, five independent samples are prepared from the mix of colonized roots
from n Petri dishes per sample (‘‘n’’ will depend on the plant species). For non-
colonized roots, the root material frommore Petri dishes is generally required for
obtaining an equivalent amount of root tissue dry weight.
2. Separate control, AM-inoculated transformed roots and AM extraradical mate-
rial from the medium. The remaining phytagel can be solved by immersion of
samples in sterile 10 mM sodium citrate buffer (pH 6.0, 4�C) according to Donerand Becard (1991).
3. The AM extraradical material, after phytagel dissolution, can be collected on a
45 mM sieve, washed several times with sterilized deionized water, weighted and
frozen in liquid nitrogen (N2). All samples (roots and mycelium) can be either
lyophilized/stored at �80�C until protein extraction, or directly used for protein
extraction.
15.3 Materials and Apparatus
15.3.1 Products and Buffers for Protein Extraction
Extraction buffer (see Table 15.1)
Tris pH 8 saturated phenols (Biosolve or any other chemical company)
Cold 0.1 M ammonium acetate in methanol (kept at �20�C)
246 E. Dumas-Gaudot et al.
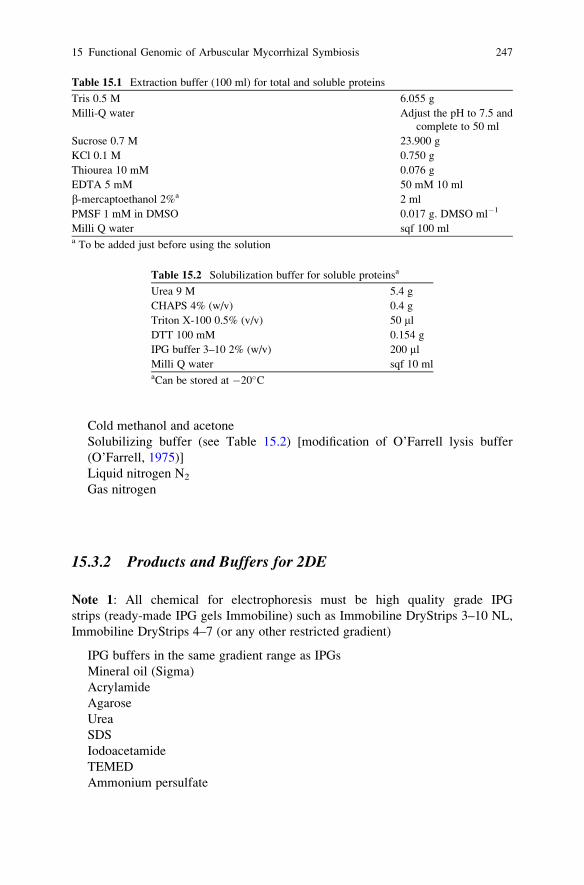
Cold methanol and acetone
Solubilizing buffer (see Table 15.2) [modification of O’Farrell lysis buffer
(O’Farrell, 1975)]
Liquid nitrogen N2
Gas nitrogen
15.3.2 Products and Buffers for 2DE
Note 1: All chemical for electrophoresis must be high quality grade IPG
strips (ready-made IPG gels Immobiline) such as Immobiline DryStrips 3–10 NL,
Immobiline DryStrips 4–7 (or any other restricted gradient)
IPG buffers in the same gradient range as IPGs
Mineral oil (Sigma)
Acrylamide
Agarose
Urea
SDS
Iodoacetamide
TEMED
Ammonium persulfate
Table 15.1 Extraction buffer (100 ml) for total and soluble proteins
Tris 0.5 M 6.055 g
Milli-Q water Adjust the pH to 7.5 and
complete to 50 ml
Sucrose 0.7 M 23.900 g
KCl 0.1 M 0.750 g
Thiourea 10 mM 0.076 g
EDTA 5 mM 50 mM 10 ml
b-mercaptoethanol 2%a 2 ml
PMSF 1 mM in DMSO 0.017 g. DMSO ml�1
Milli Q water sqf 100 mla To be added just before using the solution
Table 15.2 Solubilization buffer for soluble proteinsa
Urea 9 M 5.4 g
CHAPS 4% (w/v) 0.4 g
Triton X-100 0.5% (v/v) 50 mlDTT 100 mM 0.154 g
IPG buffer 3–10 2% (w/v) 200 mlMilli Q water sqf 10 mlaCan be stored at �20�C
15 Functional Genomic of Arbuscular Mycorrhizal Symbiosis 247

Bromophenol blue
CHAPS
DTT
Glycine
15.3.3 Products for Protein Staining
15.3.3.1 For Silver Staining
Ethanol
Acetic acid
Glutaraldehyde
Potassium tetrathionate
Sodium acetate trihydrate
Sodium thiosulphate
Formaldehyde
Potassium carbonate anhydrous
Silver nitrate
HEPES
Milli Q water (resistivity 18,000 Ohms)
15.3.3.2 For Coomassie Blue Staining
Methanol
Coomassie blue G-250
Ammonium sulfate
85% phosphoric acid
15.3.3.3 For Fluorescence Staining
Sypro orange, Sypro red, Sypro ruby, etc.
15.3.4 Equipment
15.3.4.1 Isoelectrofocusing (IEF)
Can be performed with IPG strips on
l Multiphor II horizontal electrophoresis apparatus (Amersham Pharmacia),
IPGphor (GE Healthcare, formerly Pharmacia Biotech/Amersham Company/
Amersham Biosciences) or IEF cell apparatus (Bio-Rad Laboratories)
248 E. Dumas-Gaudot et al.
l IPG strip holdersl Immobiline DryStrip Kitl Reswelling cassette (125 � 260 mm2)l Clampsl Reswelling trayl IEF sample applicator strip (AB)l Parafilm (roll, 50 cm � 15 m)l Milli-Q System (Millipore)l EPS 3,500 XL power supply (3,500 V min)l Multitemp II thermostatic circulator
15.3.4.2 2D-Electrophoresis Apparatus
l They are available from several companies (GE Healthcare, Bio-Rad, etc.).l Hoefer DALT, Ettan DALT, etc.
Note 2: Although several groups have produced good results when using small
systems for 2-DE, we strongly recommend that larger gel separation be performed
and that for preference analytical devices allowing multi-gel separations be chosen.
This will greatly improve both the quality of the protein profiles together with the
reproducibility among batches of experiments.
15.3.4.3 Staining Apparatus
l Hoefer Processor Plus (GE)l Dodeca Stainer (Bio-Rad),
Note 3: Although in theory plastic trays, rotary shaker and classical glass laboratory
equipments will permit the staining of gels, we strongly recommend that the
laboratory be equipped with systems allowing semi-automatic staining of gels
such as the two listed above. We have very satisfying results with the Dodeca
stainer, which has the great advantage of staining 12 gels at the same time with a
unique batch of stain (moreover, some stains can be re-used several times).
15.3.4.4 Scanning System and Image Analysis Software
Automated computer analysis systems are needed for a rigorous qualitative and
quantitative analysis of complex 2-DE protein patterns:
l A flatbed scanning laser densitometer providing high resolution (down to 50 mm)
combined with a high dynamic range (up to 4 OD)
Note 4: The current generation of desktop scanners can also achieve high resolution
(600dpi is equivalent to 42 mm) and a high dynamic range (12bits), but care must be
15 Functional Genomic of Arbuscular Mycorrhizal Symbiosis 249

taken to ensure the linearity of such devices. One can also prepare film images of
radiolabeled 2-DE separations using such devices, but accurate quantitation is
complicated both by the limited dynamic range and the non-linearity of film
response. This problem can be overcome by using phosphorimaging screens
together with a ‘phosphorimaging’ scanner. The major advantages of this approach
compared to conventional autoradiography are: (1) relatively short exposure times
required, (2) high dynamic range, and (3) good linearity of response. The only
disadvantage is the high capital cost of the phosphorimaging screens and the
dedicated imaging device.
l For fluorescently labeled proteins, a dedicated densitometer is required for the
imaging of 2-DE profiles [a convenient and versatile device is the Odyssey
apparatus (Li-Cor)].l All of the current generation of commercial 2-DE analysis software systems
(Melanie II, Bio-Rad Laboratories; BioImage, BioImage Systems; Phoretix,
Phoretix International; Kepler, LSB, etc.) can be used on desktop workstations,
such as Unix, PC or Mac.
Note 5: These systems mean that we can derive qualitative and quantitative
information from individual 2-DE gels, to match the protein separation profiles
from large numbers of 2-DE gels and construct comprehensive databases of quan-
titative protein expression for cells, tissues and whole organisms.
15.3.4.5 Protein Identification Strategies
l The various strategies for protein identification are briefly summarized in
Fig. 15.1. It is obvious that during the two last decades a major breakthrough
in rapid protein identification has been achieved through the use of mass
spectrometry (MS) together with bioinformatics. We are not going to consider
either the different techniques of MS or the various apparatus. This is a domain
in constant evolution, and readers are invited to consult specific reviews
(Aebersold and Mann 2003; Rabilloud 2000a, b; Mann and Wilm 1995; Wilm
et al. 1996; James 1997; Shevchenko et al. 1996; Patterson 1994; Patterson and
Aebershold 1995).l 2-D gel protein database: The final requirement for proteomic technology is that
we must be able to store all the data that are generated in a database that we can
interrogate effectively in the laboratory and also, when possible, make available
to other scientists worldwide. Our best approach at present is to use the World
Wide Web (WWW). In order to provide optimal interconnectivity between the
2-D gel protein database and other databases of related information available via
the WWW, it has been suggested that 2-D gel databases may be constructed
according to a set of fundamental rules. Databases conforming to these rules are
250 E. Dumas-Gaudot et al.

said to be ‘federated 2-D databases’, while many other databases are in agree-
ment with at least some of the rules. A list of the 2-D protein databases can be
viewed at World2Dpage (www.expasy.ch/ch2d/2d-index.html).
15.4 Procedure
Plant cells are rich in compounds that interfere with the 2-DE separation method,
such as salts, organic acids, phenolics, pigments, terpenes, among others. A com-
mon protocol used in our lab for extracting total and soluble proteins from plant
tissues consists in the homogenization of mortar-grounded material in N2 with the
extraction buffer (Table 15.1) and the quick addition of phenol-Tris buffered
(Bestel-Corre et al. 2002). This protocol has several advantages over others (Rose
et al. 2004; Saravanan and Rose 2004; Wang et al. 2003), including its good yield
for protein extraction and high preservation of extracts from endogenous proteases.
Because they have been the subject of specific publications (Valot et al. 2004, 2005,
2006), alternative protocols directed toward organelle and/or membrane proteins
will not be described here.
15.4.1 Extraction of Total and Soluble Proteins
1. Grind the roots in liquid nitrogen. Usually, 1 g (fresh weight) of M. truncatularoots is ground in a cold mortar with N2, but the amount can be adjusted when
required. When the root sample looks like a very thin powder, transfer in a
second mortar to be homogenized with the extraction buffer (Table 15.1) (1/10
w/v of fresh root material).
2. Transfer the resulting mix to centrifuge tubes (take care to choose tubes resistant
to organic solvents).
3. Add immediately an equal volume of Tris pH 8 saturated phenols (Biosolve).
Mix thoroughly for 30 min in a shaker in a cold room.
4. Centrifuge for 30 min at 12,000 g (4�C), re-extract the phenolic phase with
the same volume of the extraction buffer and centrifuge for 30 min at 12,000 g
(4�C).5. Precipitate the proteins overnight at �20�C with five volumes of 0.1 M ammo-
nium acetate in methanol.
6. Next day, collect by swing centrifugation at 16,000 g for 30 min (4�C). Rinse thepellets first with methanol, and second with acetone at �20�C, and dry under
nitrogen gas.
7. Dissolve the pellets 4 h at 20�C in O’Farrell lysis buffer (Table 15.2) and
centrifuge for 30 min at 170,000 g (20�C). Supernatants may be either directly
analyzed or stored at �80�C for further analysis.
15 Functional Genomic of Arbuscular Mycorrhizal Symbiosis 251

Note 6: Steps 1 and 2 are realized in a cold room, while during steps 3 and 4, for
safety reasons, the Tris-saturated phenol is added under a hood.
15.4.2 Combined Extraction of RNA and Proteins
We have developed a protocol in which proteins can be analyzed from a same root
sample as a mRNA population, in order to make simultaneous proteome and
transcriptome profiling possible. This protocol was validated to analyze the early
stages of AM symbiosis (Dumas-Gaudot et al. 2004a). It has the added advantage
that it circumvents the problems inherent to a limited amount of biological material.
15.4.2.1 First Day
1. Take 1 g of roots from plantlets freshly harvested or stored at �80�C.2. Crush the roots in a cold mortar with liquid N2 into a very thin white powder.
3. Pour this material in a N2-cooled tube, wash the mortar with a little liquid N2 to
collect all the root material, and leave the liquid N2 to evaporate without letting
the powder dry.
4. Add 2 ml of NTES buffer (Table 15.3)þ 2ml b-mercaptoethanol per g of roots.
5. Shake with a vortex until a very viscous liquid is obtained.
6. Add 1 volume of phenol pH 4–5/chloroform/isoamylic alcohol (25/24/1), and
shake again with a vortex until a whitish liquid is obtained. Sample four times
1,000 ml in Eppendorf tubes.
7. Centrifuge at 12,000 g for 15 min at 20�C.8. Collect the supernatant (400–500 ml). Avoid taking the intermediary phase, and
keep the phenolic phase on ice for the protein extraction.
9. Repeat steps 6–8 twice.
10. Keep the supernatant (about 200 ml) to proceed to a chloroform extraction of
RNAs, and put aside all the phenolic phases at �20�C.11. Centrifuge 12,000 g for 10–15 min at 20�C.12. Collect the aqueous phase and add 0.05 v acetic acid (1 M) and 0.7 cold ethanol
96% (kept at �20�C).13. Mix carefully and precipitate nucleic acids overnight at �20�C.
Table 15.3 NTES buffer for RNA extraction
Initial concentration Final concentration per ml
NaCl 5 M 150 mM 30 mlEDTA 0.5 M 5 mM 10 mlTris HCL pH 9 1 M 50 mM 50 mlSDS 10% 5% 500 mlDEPC water 410 ml
252 E. Dumas-Gaudot et al.
15.4.2.2 Second Day
1. Centrifuge at 12,000 g for 35 min at 4�C.2. Throw away the supernatant and suspend the pellet in 200 ml DEPC water.
3. Shake the tubes upside down and leave on ice 5 min.
4. Add 1 volume of LiCL (4 M) to precipitate RNAs, mix carefully and leave for
4-5 h in a cold room (4�C).5. Centrifuge 12,000 g for 35 min at 4�C.6. Throw away the supernatant and suspend the pellet in 200 ml DEPC water.
7. Shake the tubes and leave on ice for 10 min.
8. Precipitate RNAs overnight at�20�C with 0.1 volume sodium acetate (3 M) and
3 volumes of cold ethanol 96% (kept at �20�C).
15.4.2.3 Third Day
1. Centrifuge at 12,000 g for 35 min at 4�C.2. Throw away the supernatant and re-suspend the pellet in 200 ml of cold ethanol
75% (kept at �20�C).3. Centrifuge at 12,000 g for 15 min at 4�C.4. Dry the pellet (about 1 h) and suspend in 50 ml of DEPC water (leave about half a
day at 4�C and mix from time to time).
5. Leave overnight at �20�C (may also be kept at �80�C).
15.4.2.4 Fourth Day
Quantify the RNAs with a spectrophotometer and check their quality on an agarose
gel (Sambrook and Russel 2001).
15.4.3 Protein Extraction
1. Pool all the phenolic phases and then complete with phenol up to 10 ml.
2. Homogenize in 10 ml of extraction buffer (Table 15.1) and proceed as previously
described. Proteins can be then analyzed by 2-DE.
Note 7: The NTES buffer may be prepared in advance in Eppendorf tubes, but add
extemporaneously b-mercapto-ethanol (10 ml.10–1 ml NTES buffer).
15.4.4 Measure of Protein Content in Samples
This step is crucial for further 2-DE analysis, as the determination of the amount of
proteins, effectively solubilized and applied to gels, is required to accurately and qua-
ntitatively evaluate protein maps. The protein content of the supernatant is determined
15 Functional Genomic of Arbuscular Mycorrhizal Symbiosis 253
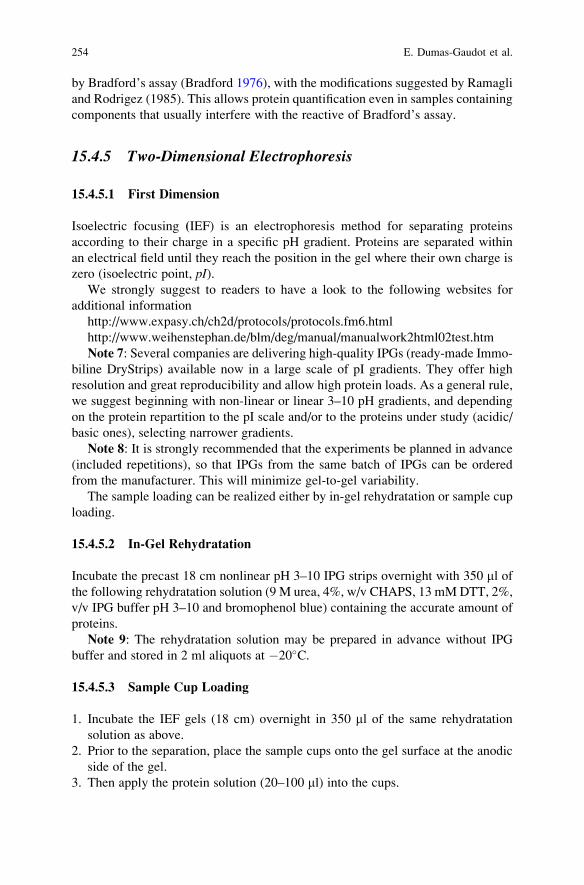
by Bradford’s assay (Bradford 1976), with the modifications suggested by Ramagli
and Rodrigez (1985). This allows protein quantification even in samples containing
components that usually interfere with the reactive of Bradford’s assay.
15.4.5 Two-Dimensional Electrophoresis
15.4.5.1 First Dimension
Isoelectric focusing (IEF) is an electrophoresis method for separating proteins
according to their charge in a specific pH gradient. Proteins are separated within
an electrical field until they reach the position in the gel where their own charge is
zero (isoelectric point, pI).We strongly suggest to readers to have a look to the following websites for
additional information
http://www.expasy.ch/ch2d/protocols/protocols.fm6.html
http://www.weihenstephan.de/blm/deg/manual/manualwork2html02test.htm
Note 7: Several companies are delivering high-quality IPGs (ready-made Immo-
biline DryStrips) available now in a large scale of pI gradients. They offer high
resolution and great reproducibility and allow high protein loads. As a general rule,
we suggest beginning with non-linear or linear 3–10 pH gradients, and depending
on the protein repartition to the pI scale and/or to the proteins under study (acidic/
basic ones), selecting narrower gradients.
Note 8: It is strongly recommended that the experiments be planned in advance
(included repetitions), so that IPGs from the same batch of IPGs can be ordered
from the manufacturer. This will minimize gel-to-gel variability.
The sample loading can be realized either by in-gel rehydratation or sample cup
loading.
15.4.5.2 In-Gel Rehydratation
Incubate the precast 18 cm nonlinear pH 3–10 IPG strips overnight with 350 ml ofthe following rehydratation solution (9 M urea, 4%, w/v CHAPS, 13 mM DTT, 2%,
v/v IPG buffer pH 3–10 and bromophenol blue) containing the accurate amount of
proteins.
Note 9: The rehydratation solution may be prepared in advance without IPG
buffer and stored in 2 ml aliquots at �20�C.
15.4.5.3 Sample Cup Loading
1. Incubate the IEF gels (18 cm) overnight in 350 ml of the same rehydratation
solution as above.
2. Prior to the separation, place the sample cups onto the gel surface at the anodic
side of the gel.
3. Then apply the protein solution (20–100 ml) into the cups.
254 E. Dumas-Gaudot et al.
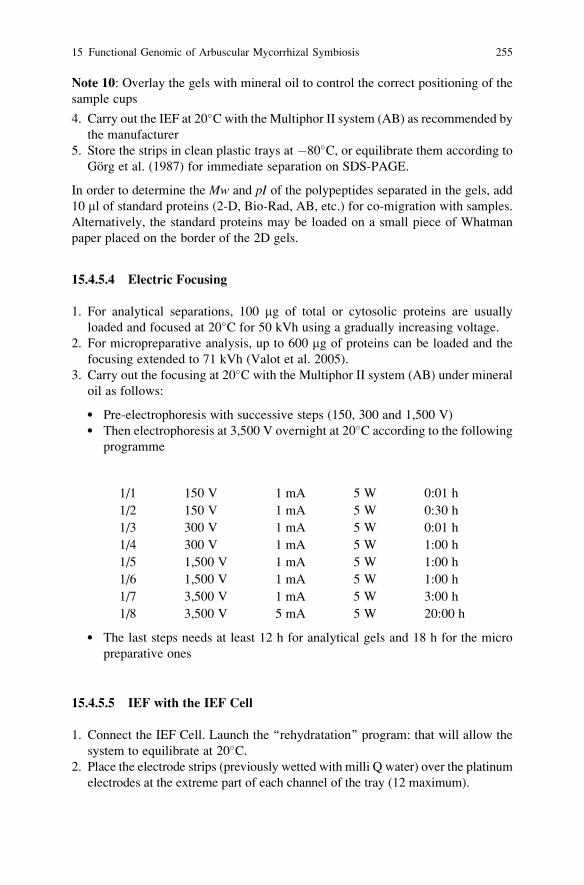
Note 10: Overlay the gels with mineral oil to control the correct positioning of the
sample cups
4. Carry out the IEF at 20�Cwith the Multiphor II system (AB) as recommended by
the manufacturer
5. Store the strips in clean plastic trays at �80�C, or equilibrate them according to
Gorg et al. (1987) for immediate separation on SDS-PAGE.
In order to determine the Mw and pI of the polypeptides separated in the gels, add
10 ml of standard proteins (2-D, Bio-Rad, AB, etc.) for co-migration with samples.
Alternatively, the standard proteins may be loaded on a small piece of Whatman
paper placed on the border of the 2D gels.
15.4.5.4 Electric Focusing
1. For analytical separations, 100 mg of total or cytosolic proteins are usually
loaded and focused at 20�C for 50 kVh using a gradually increasing voltage.
2. For micropreparative analysis, up to 600 mg of proteins can be loaded and the
focusing extended to 71 kVh (Valot et al. 2005).
3. Carry out the focusing at 20�C with the Multiphor II system (AB) under mineral
oil as follows:
l Pre-electrophoresis with successive steps (150, 300 and 1,500 V)l Then electrophoresis at 3,500 V overnight at 20�C according to the following
programme
1/1 150 V 1 mA 5 W 0:01 h
1/2 150 V 1 mA 5 W 0:30 h
1/3 300 V 1 mA 5 W 0:01 h
1/4 300 V 1 mA 5 W 1:00 h
1/5 1,500 V 1 mA 5 W 1:00 h
1/6 1,500 V 1 mA 5 W 1:00 h
1/7 3,500 V 1 mA 5 W 3:00 h
1/8 3,500 V 5 mA 5 W 20:00 h
l The last steps needs at least 12 h for analytical gels and 18 h for the micro
preparative ones
15.4.5.5 IEF with the IEF Cell
1. Connect the IEF Cell. Launch the ‘‘rehydratation’’ program: that will allow the
system to equilibrate at 20�C.2. Place the electrode strips (previously wetted with milli Q water) over the platinum
electrodes at the extreme part of each channel of the tray (12 maximum).
15 Functional Genomic of Arbuscular Mycorrhizal Symbiosis 255
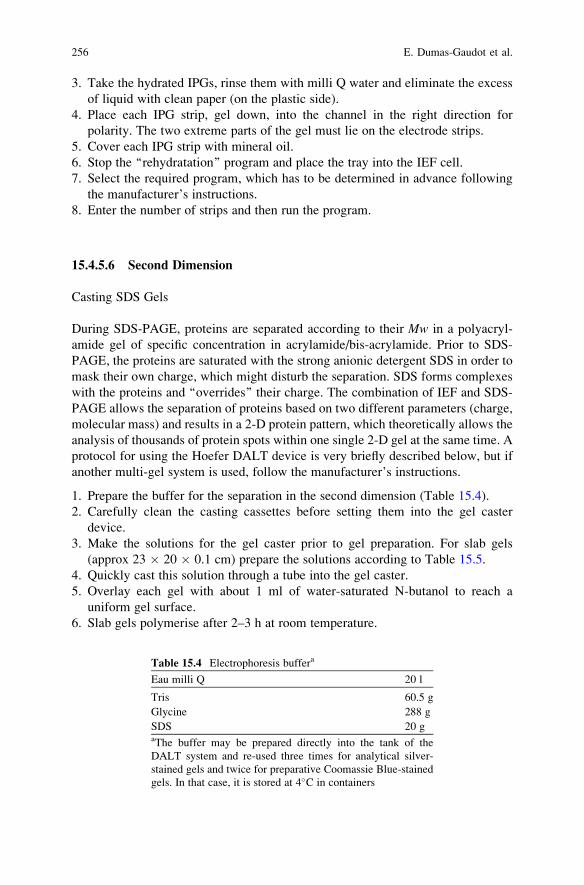
3. Take the hydrated IPGs, rinse them with milli Q water and eliminate the excess
of liquid with clean paper (on the plastic side).
4. Place each IPG strip, gel down, into the channel in the right direction for
polarity. The two extreme parts of the gel must lie on the electrode strips.
5. Cover each IPG strip with mineral oil.
6. Stop the ‘‘rehydratation’’ program and place the tray into the IEF cell.
7. Select the required program, which has to be determined in advance following
the manufacturer’s instructions.
8. Enter the number of strips and then run the program.
15.4.5.6 Second Dimension
Casting SDS Gels
During SDS-PAGE, proteins are separated according to their Mw in a polyacryl-
amide gel of specific concentration in acrylamide/bis-acrylamide. Prior to SDS-
PAGE, the proteins are saturated with the strong anionic detergent SDS in order to
mask their own charge, which might disturb the separation. SDS forms complexes
with the proteins and ‘‘overrides’’ their charge. The combination of IEF and SDS-
PAGE allows the separation of proteins based on two different parameters (charge,
molecular mass) and results in a 2-D protein pattern, which theoretically allows the
analysis of thousands of protein spots within one single 2-D gel at the same time. A
protocol for using the Hoefer DALT device is very briefly described below, but if
another multi-gel system is used, follow the manufacturer’s instructions.
1. Prepare the buffer for the separation in the second dimension (Table 15.4).
2. Carefully clean the casting cassettes before setting them into the gel caster
device.
3. Make the solutions for the gel caster prior to gel preparation. For slab gels
(approx 23 � 20 � 0.1 cm) prepare the solutions according to Table 15.5.
4. Quickly cast this solution through a tube into the gel caster.
5. Overlay each gel with about 1 ml of water-saturated N-butanol to reach a
uniform gel surface.
6. Slab gels polymerise after 2–3 h at room temperature.
Table 15.4 Electrophoresis buffera
Eau milli Q 20 l
Tris 60.5 g
Glycine 288 g
SDS 20 gaThe buffer may be prepared directly into the tank of the
DALT system and re-used three times for analytical silver-
stained gels and twice for preparative Coomassie Blue-stained
gels. In that case, it is stored at 4�C in containers
256 E. Dumas-Gaudot et al.
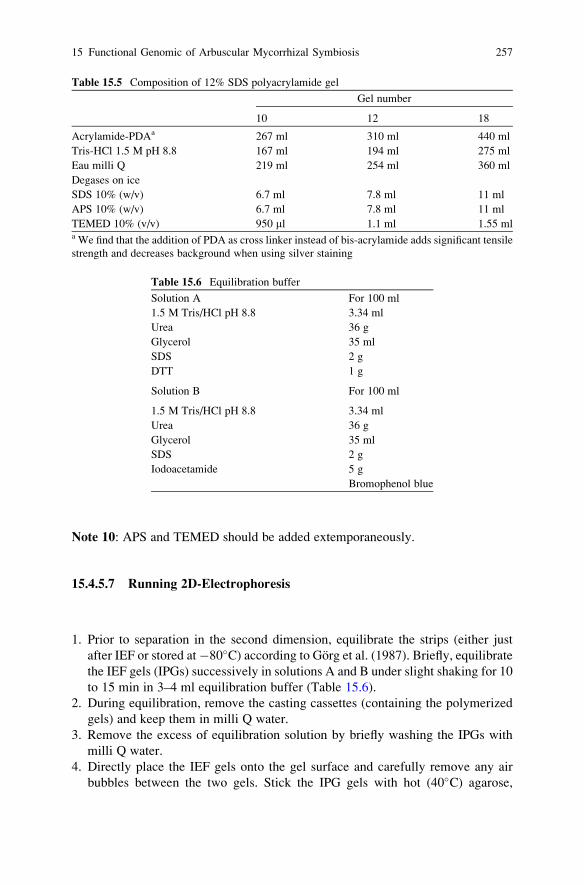
Note 10: APS and TEMED should be added extemporaneously.
15.4.5.7 Running 2D-Electrophoresis
1. Prior to separation in the second dimension, equilibrate the strips (either just
after IEF or stored at�80�C) according to Gorg et al. (1987). Briefly, equilibratethe IEF gels (IPGs) successively in solutions A and B under slight shaking for 10
to 15 min in 3–4 ml equilibration buffer (Table 15.6).
2. During equilibration, remove the casting cassettes (containing the polymerized
gels) and keep them in milli Q water.
3. Remove the excess of equilibration solution by briefly washing the IPGs with
milli Q water.
4. Directly place the IEF gels onto the gel surface and carefully remove any air
bubbles between the two gels. Stick the IPG gels with hot (40�C) agarose,
Table 15.5 Composition of 12% SDS polyacrylamide gel
Gel number
10 12 18
Acrylamide-PDAa 267 ml 310 ml 440 ml
Tris-HCl 1.5 M pH 8.8 167 ml 194 ml 275 ml
Eau milli Q 219 ml 254 ml 360 ml
Degases on ice
SDS 10% (w/v) 6.7 ml 7.8 ml 11 ml
APS 10% (w/v) 6.7 ml 7.8 ml 11 ml
TEMED 10% (v/v) 950 ml 1.1 ml 1.55 mla We find that the addition of PDA as cross linker instead of bis-acrylamide adds significant tensile
strength and decreases background when using silver staining
Table 15.6 Equilibration buffer
Solution A For 100 ml
1.5 M Tris/HCl pH 8.8 3.34 ml
Urea 36 g
Glycerol 35 ml
SDS 2 g
DTT 1 g
Solution B For 100 ml
1.5 M Tris/HCl pH 8.8 3.34 ml
Urea 36 g
Glycerol 35 ml
SDS 2 g
Iodoacetamide 5 g
Bromophenol blue
15 Functional Genomic of Arbuscular Mycorrhizal Symbiosis 257

solubilized in electrophoresis buffer and previously stained with a little bromo-
phenol blue.
5. Place each gel cassette into the tank (Hoefer DALT II system, AB) and fill with
the electrophoresis SDS buffer up to cover the whole gel surface.
6. Run electrophoresis at 10�C for 30 min at 30 V, then 30 min at 60 V and finally
at 100 V overnight until the dye front reaches the bottom of the gels.
15.4.6 Protein Detection
The application of the 2-DE technology to separate, analyze and characterize
proteins of biological samples would not have been possible without the develop-
ment of complementary detection methods. The following non-radioactive stains
can be employed for protein detection: metal stain (zinc/copper), Coomassie blue,
silver and fluorescent dies. Perhaps one of the most popular is the silver-staining
method, which is 100-fold more sensitive than Coomassie Brilliant Blue staining
(Chevalier et al. 2004; Lopez et al. 2000; Rabilloud 2001). However, there can be
some problems using this stain as a quantitative procedure, because it is known to
be non-stoechiometric and prone to saturation and negative staining effects, where
regions of very high protein concentration do not stain and appear as ‘holes’ in the
pattern of stained spots. Moreover, only a few silver-staining methods are compati-
ble with further MS analyses (Rabilloud 2001). Finally, detection methods based on
fluorescent compounds promise to overcome these problems because of their
excellent linearity and high dynamic range (i.e., they can be used over a wide
range of protein concentrations) (Chevalier et al. 2004).
15.4.6.1 Colloidal Coomassie Blue Staining
This stain is not specific, and will also detect non-protein components such as
polysaccharides. Its sensitivity is fairly good, and it is compatible with mass
spectroscopy. We use the protocol of Mathesius et al. (2001), and find it easy to
use and quite sensitive enough. It can detect 36–47 ng of protein.
1. After electrophoresis rinse gels briefly (<1 min) with milli Q water.
2. Stain gels for 18–20 h with Coomassie blue solution (Table 15.7).
3. Wash gels for 1–3 min with 0.1 M Tris-H3PO4 pH 6.5.
4. Rinse gels briefly (<1 min) with 25% methanol.
5. Wash gels for 24–72 h with 20% ammonium sulfate.
6. Repeat this staining procedure one or twice.
7. Store gels in 20% ammonium sulfate. Avoid alcohol-containing solutions.
Note 11: Let this above solution cool, and then add 0.2 g l�1 sodium azide as a
preservative. Store at room temperature. It can be re-used at least four times.
258 E. Dumas-Gaudot et al.
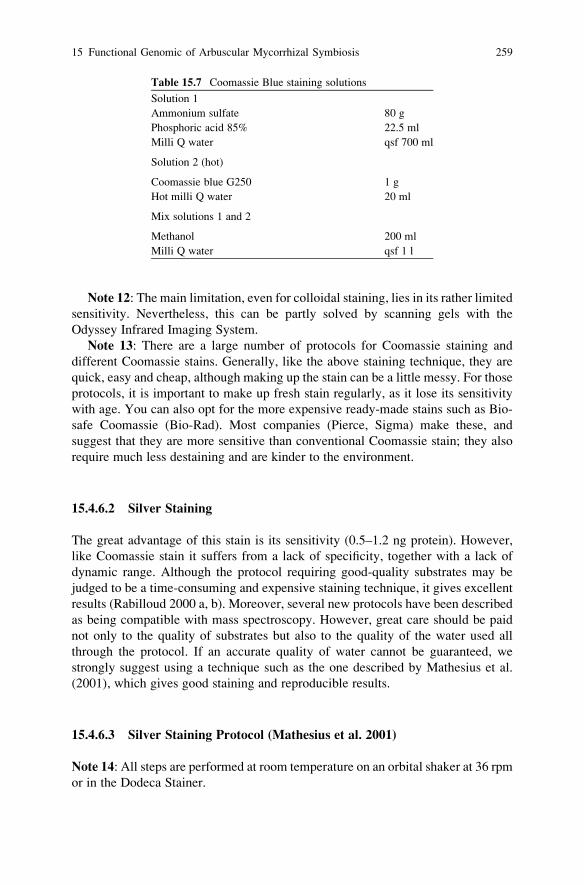
Note 12: The main limitation, even for colloidal staining, lies in its rather limited
sensitivity. Nevertheless, this can be partly solved by scanning gels with the
Odyssey Infrared Imaging System.
Note 13: There are a large number of protocols for Coomassie staining and
different Coomassie stains. Generally, like the above staining technique, they are
quick, easy and cheap, although making up the stain can be a little messy. For those
protocols, it is important to make up fresh stain regularly, as it lose its sensitivity
with age. You can also opt for the more expensive ready-made stains such as Bio-
safe Coomassie (Bio-Rad). Most companies (Pierce, Sigma) make these, and
suggest that they are more sensitive than conventional Coomassie stain; they also
require much less destaining and are kinder to the environment.
15.4.6.2 Silver Staining
The great advantage of this stain is its sensitivity (0.5–1.2 ng protein). However,
like Coomassie stain it suffers from a lack of specificity, together with a lack of
dynamic range. Although the protocol requiring good-quality substrates may be
judged to be a time-consuming and expensive staining technique, it gives excellent
results (Rabilloud 2000 a, b). Moreover, several new protocols have been described
as being compatible with mass spectroscopy. However, great care should be paid
not only to the quality of substrates but also to the quality of the water used all
through the protocol. If an accurate quality of water cannot be guaranteed, we
strongly suggest using a technique such as the one described by Mathesius et al.
(2001), which gives good staining and reproducible results.
15.4.6.3 Silver Staining Protocol (Mathesius et al. 2001)
Note 14: All steps are performed at room temperature on an orbital shaker at 36 rpm
or in the Dodeca Stainer.
Table 15.7 Coomassie Blue staining solutions
Solution 1
Ammonium sulfate 80 g
Phosphoric acid 85% 22.5 ml
Milli Q water qsf 700 ml
Solution 2 (hot)
Coomassie blue G250 1 g
Hot milli Q water 20 ml
Mix solutions 1 and 2
Methanol 200 ml
Milli Q water qsf 1 l
15 Functional Genomic of Arbuscular Mycorrhizal Symbiosis 259

1. At the end of the second dimension run, remove the gels from the casting
cassettes.
2. Soak in ethanol/acetic acid/water (40/10/50) for 3 � 30 min.
3. Soak overnight under hood in the sensitization solution (Table 15.8).
4. Wash six times in milli Q water for 20 min.
5. Incubate into the silver-staining solution (Table 15.9) in the dark.
6. Wash in milli Q water for 10 s.
7. Develop in the developing solution (Table 15.10).
8. When a slight background stain appears, stop by incubation for 30 min in the
stop solution containing 50 g l�1 Tris and 20 ml l�1 acetic acid.
Note 16: To be made fresh 30–45 min before use
15.4.6.4 Silver Staining Protocol Compatible with MS Analysis
1. Fix the gels by soaking in methanol/acetic acid/water (40/10/50) for 30 min.
2. Soak the gel in the sensitization solution, i.e., methanol/sodium thiosulfate/
sodium acetate (30%/0.02%/6.8%) for 30 min.
3. Wash with milli Q water 3 � 5 min.
Table 15.8 Sensitization solution
Ethanol 30%
Sodium acetate trihydrate
(or anhydrous)
68 g l�1 (41 g l�1 anhydrous)
Potassium tetrathionate 2.75 g l�1
Adjust to 990 ml and filter
50% glutaraldehyde 10 ml
Table 15.9 Developing solution
Potassium carbonate anhydrous 30 g l�1
Sodium thiosulphate 11–12 mg l�1
Adjust to 1,000 ml and filter
Formaldehyde 250 ml
Table 15.10 Silver staining solution
Silver nitrate 2 g l�1
HEPES 1.246 g l�1
Adjust to 1,000 ml and filter
Formaldehyde 700 ml
Note 15: to be made 30–45 min before use, keep away from
light
260 E. Dumas-Gaudot et al.

4. Stain the gels with the silver stain (0.25% in water) for a period of 20 min.
5. Wash with milli Q water 2 � 1 min.
6. Add the developing solution, i.e., sodium carbonate: formaldehyde* (2.5/0.04)
in water. (*: to be added extemporaneously)
7. Stop staining by immersing gels in 5% glacial acetic acid.
8. Wash with milli Q water 3 � 5 min.
Note 17: The gels must be scanned, the interesting spots sampled and destained as
soon as possible in order to avoid blocking of proteins that will hamper subsequent
MS analysis (T. Rabilloud, personal communication).
15.4.6.5 Fluorescent Stains (Detect 1–2 ng)
There are many different types of fluorescent stain, and most are easy and relatively
quick to use. Some are fairly cheap and can be used more than once; others, like
SYPRO ruby, are shockingly expensive. These dyes are said to be both selective
and quantitative. That means that unlike silver, the intensity of the protein spot can
be directly correlated to the amount of protein. SYPRO ruby is also said to be more
sensitive than silver staining (Chevalier et al. 2004). Obviously, you will need some
sort of gel viewing system, as these stains can’t be seen with the naked eye. There
are disadvantages of this stain, as once more, with the use of SYPRO ruby,
the sensitivity issue puts the onus onto the MS. Also, we often manually cut out
our spots, and to do this, it is easier if you can see them.
15.4.6.6 Image Analysis
Although there are innumerable methods for creating an image of a gel (including
flatbed scanners, fluoro- and phosphoimagers, and densitometers), the ability to use
data relies on image analysis software packages, such as those listed in Table 15.11.
All these 2-DE imaging systems provide powerful and innovative solutions for
shortening the path from data acquisition to protein information. Spot detection
and matching algorithms facilitate the extraction of statistically valid differences
between groups of 2-D gels, while requiring reduced user intervention and therefore
speeding up analysis time. Their applications integrate filtering, querying, report-
ing, statistical and graphic options so that it becomes easier to view, compare,
analyze and present 2-DE data.
Briefly,
1. Digitise gel images using an appropriate scanner with accurate scan software.
2. Proceed to image analysis following the tutorial instructions of the available
software.
3. The first step consists of detecting and quantifying spots. The user must establish
background thresholds. This is especially critical when trying to identify spots of
low intensity. Many programs then filter the image and raise the contrast to
further highlight the smallest spots.
15 Functional Genomic of Arbuscular Mycorrhizal Symbiosis 261

4. A spot identifier isolates individual spots on the gel, typically by analyzing the
intensities of individual and groups of pixels, and gives them codes. Then, it will
be necessary to identify protein spot patterns between gels (i.e., comparative
analysis).
5. In matching gel images, the program performs automatically what the human
eye does naturally: it looks for pairs of features that have the same or similar
spatial distributions. If there is a doublet in the top right corner near a smeared
singlet in gel 1, the program searches for a similar doublet–singlet combination
in gel 2. This process is then repeated thousands of times until the program has
accounted for all of the spots that it can identify.
6. When comparing several gels, one gel is established as the reference gel, and all
spot combinations on the other gels are compared with it.
7. With analysis software, researchers can examine several gels of the same sample
and average the locations of individual defects, creating a ‘‘perfect’’ gel in the
process. Alternatively, many of the newer programs allow for localized pertur-
bations by keeping the larger picture in mind.
8. When proceeding to comparative analysis, we should be aware that perturba-
tions from an event such as protein phosphorylation or glycosilation, etc. can
adversely affect the comparative process.
9. Ideally, in response to a treatment (AM colonization, any stress, etc.), changes
will occur only in a few spots and other protein expression levels will be
maintained. One might use these proteinaceous standards as landmarks (e.g.,
the housekeeping proteins that maintain a cell’s internal environment).
15.4.6.7 Drying Gels
1. Remove the storage solution from your 2-D gels.
2. Wash the gels with milli Q water until the storage solution has been completely
removed.
Table 15.11 2-DE imaging systems
Analysis package Source Web
Gellab-II 2D Scanalytics www.lmmb.ncifcrf.gov/gellab/
ImageMaster Amersham Pharmacia Biotech www.apbiotech.com
ImageMaster 2D Platinum 6.0 GE Healthcare www.gehealthcare.com
Impressionist Gene Data www.genedata.com
Kepler Large Scale Proteomics www.lsbc.com
Melanie III Geneva Bioinformatics SA www.genebio.com
PDQuest Bio-Rad www.discover.bio-rad.com
Phoretix 2D Phoretix International www.phoretix.com
Progenesis Nonlinear Dynamics www.nonlinear.com
ProteinMine Scimagix www.scimagix.com
Z3 Compugen www.2dgels.com
262 E. Dumas-Gaudot et al.

3. Just before drying 2-D gels, put them in the drying solution (30% ethanol/5%
glycerol/65% milli Q water) for 30–60 min and shake slowly in a rotary shaker.
4. Wet the cellophane papers (2 per gel) in milli Q water for at least 15 min and
then proceed with the drying steps, placing both the cellophane and gel into the
drying plastic frame and clamps, taking care to avoid all air bubbles between the
cellophane papers.
5. Dry gels over night at room temperature.
Note 18: 2-DE gels can be dried between two sheets of cellophane as above. This
will help during the image analysis procedure, since at any time one can refer back
to dry gels. Moreover, dry gels can also be used to sample spots for MS analysis,
assuming all the precautions for avoiding any keratin contamination have been
taken during the whole process. In that case, dried gels can be gently and carefully
washed with ethanol to eliminate any external contamination; then the spots are
picked up and placed to rehydrate in an Eppendorf tube in a small volume of milli Q
water, to help the elimination of cellophane with clean tweezers.
15.4.6.8 Mass Spectrometry Analyses
As already mentioned, our purpose is not to review the different MS strategies.
We will only introduce a few arguments that have to be taken into account when it
is time to choose among the various possibilities of MS. First of all, one should take
into consideration the quantities of data in databases in regard to the AM interaction
studied. If the genomes of two organisms (plant and fungus) are about to be fully
sequenced (as is the case of M. truncatula and G. intraradices), MALDI-TOF
analysis and peptide mass fingerprinting will certainly provide more throughput
and be the least expensive method to perform. In other cases, partial peptide
sequence data will be an extremely powerful adjunct to identify proteins by peptide
mass profiling. Several MS-based approaches can be used, which take advantage of
the ability of the different mass spectrometers (MALDI-TOF-TOF, ESI-MS/MS
triple-quadrupole or ion trap instruments) to induce fragmentation of peptide bonds.
Automated interpretation of ESI-MS/MS fragmentation data may be used to search
sequence databases directly. However, in several cases, de novo sequencing will
require human intervention. A second point to be considered is the proximity of a
proteomic platform and/or the facilities to set up collaboration between mycorrhiza
and mass spectrometer teams. Last but not least, one should consider the number of
protein identifications that have to be performed in a project in respect to the
budget allocated for this item.
15.4.6.9 2DE Spot Sampling for MS Analysis
As this step will strongly depend on the equipment with which MS analyses are
carried out, only very general rules are presented below.
15 Functional Genomic of Arbuscular Mycorrhizal Symbiosis 263

Following extensive washing of a micro preparative gel with water, excise the
spots into small pieces with tips, dry with a speed vac apparatus and store at room
temperature until subsequent MS analysis.
15.4.6.10 Distaining of Colloidal Coomassie Blue Stained Spots
1. Distain each spot in 100 ml of 25 mM ammonium bicarbonate/5% acetonitrile.
Incubate 30 min under agitation then remove the buffer.
2. Add 100 ml of 25 mM ammonium bicarbonate/50% acetonitrile. Incubate 30 min
then remove the buffer.
3. Add 200 ml of acetonitrile 100% and incubate for 10 min.
4. Remove acetonitrile and dry spots under vacuum and heat.
Note 19: Great care should be paid to avoid any keratin and dust contamination.
Therefore, we strongly suggest assigning a place in the lab for this step, and to wear
lab coat, gloves, cuffs and cap to prevent as much as possible skin and hair
contamination.
Note 20: Depending on its staining, if a spot seems to correspond to a very small
amount of protein, one can collect the same spot for more than one gel.
Note 21: A certain number of proteomic platforms are now equipped with robotic
systems for picking and digesting spots. In this latter case, a special type of 96-hole
plastic tray may be required and, therefore, one should take care to follow the
technical rules of the platform before collecting the spots for MS.
15.4.6.11 Bioinformatics Tools
Generally, mass spectrometry apparatus is delivered equipped with its own soft-
ware for querying and assigning protein identities. In addition, a large number of
Internet sites have been established that provide tools for identifying proteins, using
either MALDI peptide mass fingerprinting data (PMF) or LC-ESI-tandem mass
spectrometry data (MS/MS). Table 15.12 lists some of the most frequently used
tools currently available.
15.5 A Case Study Applied to Dissect the Early Stages of
Medicago Truncatula Mycorrhizal Symbiosis: When
Transcriptomics and Proteomics are Working Together
During AM symbiosis, two well-defined key steps are most suitable for proteomic
investigations: the early stages, corresponding to appressorium formation at the root
surface, and the late arbuscule stages, in which the fungus has fully colonized roots
to establish a functional symbiosis. Transcriptomics and proteomics have so far
264 E. Dumas-Gaudot et al.

mainly targeted the late stages of AM symbiosis (Brechenmacher et al. 2004;
Liu et al. 2003; Bestel-Corre et al. 2002, 2004b; Hohnjec et al. 2005), for which
the amount of root material is not limiting. There are very few reports on the
appressorial stage, for which only limited amounts of root material are available,
thus making proteomics a particularly difficult task (Amiour et al. 2006). For both
stages, a simultaneous comparison of gene expression and protein profiles has not
yet been assayed. We report here on the application of a protocol for combined
extraction of mRNAs and proteins to study the early stages of the M. truncatula-Glomus mosseae root interaction.
15.5.1 In Silico Analysis
By comparing G. mosseae-inoculated roots to their respective non-inoculated
control roots, 29 ESTs were found to be over-expressed in the wild genotype cv.
Jemalong J5 in response to inoculation. On the other hand, no over-expression was
observed in the case of the G. mosseae-inoculated mycorrhiza deficient mutant
dmi3 (Mtsym13, TRV25) (Weidmann et al. 2004). To compare mRNA expression
to that of their corresponding proteins, in silico analyses were carried out prior to
proteomic analysis. So far, the international sequencing project on M. truncatulahas generated more than 220,000 ESTs, available online (http://www.tigr.org/tdb/
tgi/mtgi/). For each nucleotide sequence corresponding to an EST previously
reported as being over-expressed in response toG. mosseae inoculation (Weidmann
et al. 2004), the longest open reading frame (ORF) was selected to identify the
corresponding protein. Translation did not always correspond to a single ORF,
since from the 29 ESTs only 15 homologies were translated from a single ORF. The
other homologies were issued from the translation of a cluster of sequences of the
three first ORFs.
Table 15.12 Websites for the tools most frequently used for mass spectrometry analysis
Sites Useful utilities Websites
NCBI Homology search http://www.ncbi.nlm.nih.gov/
ExPASy Proteomic links repository http://www.expasy.org/
Blast/EBI Homology search http://www.ebi.ac.uk/Tools/similarity.
html
Aldente Search databases with PMF
data
http://www.expasy.org/tools/aldente/
PROWL Search databases with PMF
data or a sequence tag
http://prowl.rockefeller.edu/
Mascot Search databases with PMF
and MS/MS data and
sequence tags
http://www.matrixscience.com/
Protein prospector Search databases with PMF
and MS/MS data
http://prospector.ucsf.edu/Phenix
Protein prospector Search databases with
MS/MS data
http://www.phenyx-ms.com/
15 Functional Genomic of Arbuscular Mycorrhizal Symbiosis 265
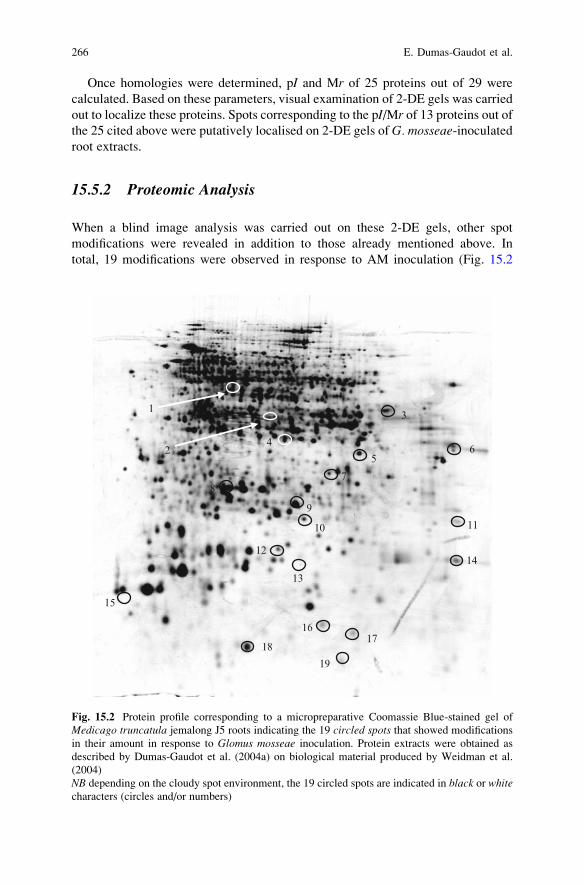
Once homologies were determined, pI and Mr of 25 proteins out of 29 were
calculated. Based on these parameters, visual examination of 2-DE gels was carried
out to localize these proteins. Spots corresponding to the pI/Mr of 13 proteins out ofthe 25 cited above were putatively localised on 2-DE gels of G. mosseae-inoculatedroot extracts.
15.5.2 Proteomic Analysis
When a blind image analysis was carried out on these 2-DE gels, other spot
modifications were revealed in addition to those already mentioned above. In
total, 19 modifications were observed in response to AM inoculation (Fig. 15.2
18
19
17
13
9
7
5
3
4
8
2
1
6
14
16
11
12
10
15
Fig. 15.2 Protein profile corresponding to a micropreparative Coomassie Blue-stained gel of
Medicago truncatula jemalong J5 roots indicating the 19 circled spots that showed modifications
in their amount in response to Glomus mosseae inoculation. Protein extracts were obtained as
described by Dumas-Gaudot et al. (2004a) on biological material produced by Weidman et al.
(2004)
NB depending on the cloudy spot environment, the 19 circled spots are indicated in black or whitecharacters (circles and/or numbers)
266 E. Dumas-Gaudot et al.

and Table 15.13), with seven and 12 spots whose abundance were decreased and
increased in G. mosseae-inoculated roots respectively. All of them were excised
from a micropreparative Coomassie Blue-stained gel and subjected to PMF search
following MALDI-TOF spectrometry. Among the 13 proteins, only 11 spots could
be excised from the gel. Six out of these 11 spots, indicated by asterisks in Table
15.13, gave positive hits after PMF search.
Five ribosomal genes have been previously reported as being over-expressed at
the transcript level, among which four were predicted to encode proteins potentially
located on 2-DE gels after in silico analysis. When these spots were submitted to
PMF search, only spot 11* was confirmed as being a ribosomal protein. None of the
other predicted proteins (spots 3*, 5*, 6* and 7*) could be confirmed. Instead of the
in silico-predicted proteins, a probable peroxidase, a guanine nucleotide binding
protein, a probable peroxidase precursor and a probable GTP-binding protein were
identified (Table 15.13).
Spots 3* and 6*, whose amount increased in response toG.mosseae inoculation,gave hits with a probable peroxidase (MtC40023) and a probable peroxidase
precursor (MtC10717). Since the first publication of Spanu and Bonfante-Fasolo
(1988) several groups have reported an increase of peroxidase activities in response
Table 15.13 Proteins differentially displayed upon Glomus mosseae inoculation of Medicagotruncatula roots
Spota Accession
number
Matched peptide
number
Coverage/score Identification
1 MtC00229 7 48%/3.28e + 003 Alanine aminotransferase
2 MtC50061 6 23%/9.13e + 003 Serine/threonine kinase
3b MtC40023 10 40%/2.13e + 004 Probable peroxidase
4 MtC00294 10 38%/5.29e + 004 Chalcone reductase
5b MtC00498 9 40%/2.37e + 005 Guanine nucleotide binding protein
6b MtC10717 10 34%/8.46e + 004 Probable peroxidase precursor
7b MtC00087 12 71%/2.01e + 006 Probable GTP-binding protein
8 MtC00681 8 25%/3.02e + 004 Glutathione-S-transferase
9b MtC10018 20 70%/1.79e + 005 Probable GST
10 – – – Nd
11b MtC00128 12 41%/1e + 005 40 S ribosomal protein S5
12 – – – Nd
13 – – – Nd
14 – – – Nd
15 – – – Nd
16 – – – Nd
17 – – – Nd
18 – – – Nd
19 – – – NdaNumbers correspond to those in Fig. 1bIndicates proteins which were deduced from in silico analyses of ESTs over-expressed in
response to mycorrhizal inoculation (Weidmann et al. 2004)
Nd no protein identification was obtained after MALDI-TOF analysis and PMF search
15 Functional Genomic of Arbuscular Mycorrhizal Symbiosis 267

to both ecto- and endo- mycorrhizal symbioses (Albrecht et al. 1994; Lambais et al.
2003; Guenoune et al. 2001). Spots 5* and 7* gave a positive hit with MtC00498
and MtC00087 respectively. These clusters correspond to guanine nucleotide
binding like proteins (GTP-binding proteins). GTP proteins are glycoproteins
anchored on the cytoplasm cell membrane acting as mediators in many cellular
processes, including signal transduction, protein transport, growth regulation and
polypeptide chain elongation. While a gene encoding a M. truncatula mitogen-
activated protein (MAP) kinase was previously identified at the transcript level
prior to and during appressorium formation of G. mosseae, the putative in silico-
predicted protein corresponded to the MtC00294 EST cluster encoding a NAD(P)H
Dependent 60-deoxychalocone synthase, also called chalcone reductase. Recently,
such a protein was also identified as being up-regulated inG. intraradices-inoculatedroots of both M. truncatula J5 and dmi3 mutant (Amiour et al. 2006). It appears to
respond to early events of elicitor-mediated signaling. It has now been repeatedly
claimed that some events, including signal perception, signal transduction and
defense gene activation, similar to those found in plant/pathogen interactions,
have occurred in AM symbioses (Dumas-Gaudot et al. 2000; Pozo et al. 2002).
The induction of defense gene expression could result from fungal elicitor recogni-
tion and signal transduction pathway activation. The weak and transient character
of plant defense responses could be a consequence of the low capacity of the fungus
to trigger such a response and/or to induce a plant mechanism that suppresses an
already activated defense response at several levels, allowing fungal growth within
the plant tissue (Dumas-Gaudot et al. 2000; Garcia-Garrido et al. 2000).
Among the spots revealed by the blind proteomic analysis that accumulated in
response to G. mosseae-inoculation, spot 1 matches to an alanine aminotransferase,
an enzyme of the primary metabolism, while spot 2 matches to the MtC50061
cluster, classified in the signal transduction protein category (Journet et al. 2002). In
plants, protein kinases are involved in the adaptation to various changing environ-
mental conditions (Chinnusamy et al. 2004). To date, at least three MAP kinases
have been reported to be up-regulated during early root colonisation of M. trunca-tula (Weidmann et al. 2004; Liu et al. 2003). The increased amount observed in the
present work is therefore in agreement with the previous data gained from tran-
scriptomic investigations. Two glutathione-S-transferase (GST) were identified in
the present work (spots 8 and 9). Up to now, GST expression in mycorrhiza has
mainly been addressed on arbuscule development. Both activation of GST encoding
genes and accumulation of a corresponding protein were reported in fully colonised
root tissues of potato and M. truncatula (Strittmatter et al. 1996; Wulf et al. 2003;
Brechenmacher et al. 2004; Hohnjec et al. 2005; Bestel-Corre et al. 2002). It was
proposed that in mature mycorrhiza, GST expression may be part of a plant defense
reaction or involved in arbuscule degradation (Brechenmacher et al. 2004). To our
knowledge, this is the first report of an accumulation of GST at the very early stages
of the AM symbiosis, i.e., prior to fungal colonization. For the down-regulated spot
9, PMF search gave a hit with the MtC10018 cluster, which belongs to the Tau class
of GSTs. Interestingly, such a protein was previously reported as being also down-
regulated in response to G. intraradices inoculation of both the hyper-mycorrhizal
268 E. Dumas-Gaudot et al.

mutant TR122 and the J5 wild-type line genotypes (Amiour et al. 2006). Plant GSTs
form a large family of catalytic and binding proteins that have long been associated
with stress tolerance, including toxic chemicals, environmental stresses and dis-
eases (Frova 2003). Moreover, for auxin-inducible GSTs, a time-dependent in-
crease in their expression at the transcript level was previously recorded in
M. truncatula roots upon inoculation with G. mosseae (Brechenmacher et al.
2004), suggesting that auxin-inducible GSTs might be developmentally regulated
when roots are colonized by AM fungi. Spots 10 to 19 did not give positive hits
following PMF search, a fact that could be related (1) to the low molecular weight
of some of the proteins resulting in a low number of trypsic digestion peptides, (2)
to insufficient protein amount in each spot, or (3) to the absence of the
corresponding protein in the database.
15.6 Conclusions
While investigating the early stages of theM. truncatula/G.mosseae interaction, wemight have expected, by using a protocol designed for extracting simultaneously
mRNAs and proteins, to increase the correspondence between transcripts and
proteins. In fact, while in silico prediction of transcripts previously reported as
being up-regulated in response to G. mosseae inoculation gives rise to 13/29
proteins potentially detected on 2-DE, only a few results were common at the
transcript and protein level. Such a discrepancy between predictive data and
experimental ones could be related to spot overlapping in 2-DE. Behind one spot
we can have more proteins and the interesting one is not identified because of its
lower number of copies or just because this protein was not detectable with the
staining procedure. Spot overlapping is a phenomenon demonstrated very recently
to occur to a much higher extent than previously envisaged (Campostrini et al.
2005). Moreover, it should be emphasised that transcriptomics based on the con-
struction of a SSH library was more particularly designed to enrich the samples in
rare mRNAs. No such enrichment can be achieved by a classical proteomic
approach, for which it is well-known that, without sub-cellular purifications, only
major proteins can be visualized on classical 2-DE gels. In addition, incorrect
assignment of the start site of the correct frame or (as in our study), where a number
of homologies were derived from a cluster of more than one ORF, may also be
responsible for this lack of correspondence. Post-translational modifications also
alter protein charges, and this phenomenon frequently occurs in signaling events
where cellular changes, including influx of Ca2+ and activation of kinases are
shown in response to plant biotic and abiotic stresses. Breakdowns of the protein
by altering the Mr parameter should also be considered as factors potentially
affecting the 2-DE gel location. Some proteins can be excluded from the analysis
if we consider their 2-DE characteristics. Indeed, while a certain number of the in
silico-predicted proteins could be separated on 3–10 NL IPG strips, some of them
15 Functional Genomic of Arbuscular Mycorrhizal Symbiosis 269
were theoretically excluded following the second dimension. Finally, it is also
well known that membrane proteins are resistant to 2-DE separation (Valot et al.
2004, 2005).
15.7 New Insights
Proteomics interfaces with and complements genomics to provide information on
quantitative protein expression in any biological system. In the particular field of
plant–microorganism interactions (including themycorrhizal symbioses), its potential
is still far from being fully explored. To obtain mycorrhiza-related protein identifica-
tion at a higher throughput, attempts should bemade to definemore precisely both the
mycorrhizal stage under study and the particular cell compartment. In this respect,
recent comparative sub-cellular proteomics directed towards microsomes (Valot et al.
2004, 2005) and plasmalemma (Valot et al. 2006) have proven their usefulness to
identify proteins previously not reported as being expressed in AM symbiosis. Com-
parative proteomics of several other cell compartments such as, for example, the cell
wall (for improving our understandingof the recognition events accompanying thefirst
stage of mycorrhizal infection), or the mitochondrion and/or vacuolar compartments
(for decrypting parts of the regulation events during the mycorrhizal process), need to
be investigated. Recently, we have initiated a comparative root plastid proteomic
approach (Daher et al. 2006). New insights into the complex cellular process accom-
panying the mycorrhizal symbiosis may also be expected from the use of more
sophisticated proteomic strategies, together with the exponential increase of data in
general database. So clearly, more refined proteomic tools that have recently emerged
could be applied to the study of symbioses. Fluorescence-based differential in gel
electrophoresis (DIGE) allows the differential analysis of two samples concomitantly
run within the same gel, circumventing reproducibility problems and image analysis
(Unlu et al. 1997). More revolutionarily, the multidimensional protein identification
(MudPIT), (Whashburn et al. 2001) and isotope-coded affinity tag (ICAT) (Gygi et al.
1999) methods bypass 2-DE by directly analysing proteinmixtures bymass spectrom-
etry. Laser dissection microscopy coupled to MALDI-TOF analyses could also gives
rise to important knowledge in direct relation to the localization of the proteins in any
cell compartment. Likewise, AM fungal proteomics will certainly soon benefit from
the full genome sequencing ofG. intraradices, together with the possible use of MS
apparatus of higher sensitivity such as MALDI-TOF/TOF.
High-throughput microbial proteomics will also improve our understanding of
molecular responses to external stimuli, as it promises to yield information about
cell responses to disease and/or stress processes. A targeted proteomic approach
allowed us a few years ago to identify proteins whose accumulation was modified in
response to cadmium stress in mycorrhizal pea roots. In a more recent investigation,
because of the use of the model plant M. truncatula in symbiosis with G. intrar-adices, we are expecting to get a broader view of the molecular mechanisms
involved in the responses of mycorrhizal plant to cadmium stress (Aloui et al.
2006).
270 E. Dumas-Gaudot et al.
Acknowledgments The authors are grateful to the Burgundy Region for supporting Nardjis
Amiour during her postdoctoral stay in the UMR PME 1088, and for financial support to two
CRB contracts. They also would like to thank S. Weidman and V. Gianinazzi-Pearson for the kind
gift of protein samples from their RNA extractions. A special thank to JM Lamalle for help for
constructing figures, and to Celine Henry (INRA, Jouy-en-Josas, France) who performed mass
spectrometry analyses.
References
Aebersold R, Mann M (2003) Mass spectrometry-based proteomics. Nature 422:198–207
Albrecht C, Laurent P, Lapeyrie F (1994) Eucalyptus root and shoot chitinases, induced followingroot colonization by pathogenic versus ectomycorrhizal fungi, compared on one- and two-
dimensional activity gels. Plant Sci 100:157–164
Aloui A, Aschi-Smiti S, Robert F, Dumas-Gaudot E (2006) Cadmium stress alleviation by
arbuscular mycorrhizal symbiosis: proteomic studies of the mechanisms involved. Abstract,
session ‘‘Mechanisms in stress resistance/tolerance’’, ICOM V, 23–27 July 2006, Granada,
Spain
Amiour N, Recorbet G, Robert F, Gianinazzi S, Dumas-Gaudot E (2006) Mutations in DMI3 and
SUNN modify the appressorium-responsive root proteome in arbusculaer mycorrhiza. Mol
Plant Microbe Interact 19:988–997
Bestel-Corre G, Dumas-Gaudot E, Poinsot V, Dieu M, Dierick JF, van Tuinen D, Remacle J,
Gianinazzi-Pearson V, Gianinazzi S (2002) Proteome analysis and identification of symbiosis-
related proteins from Medicago truncatula Gaertn. by two-dimensional electrophoresis and
mass spectrometry. Electrophoresis 23:122–137
Bestel-Corre G, Dumas-Gaudot E, Gianinazzi S (2004a) Proteomics as a tool to monitor plant–
microbe endosymbioses in the rhizosphere. Mycorrhiza 14:1–10
Bestel-Corre G, Gianinazzi S, Dumas-Gaudot E (2004b) Impact of sewage sludges on Medicagotruncatula symbiotic proteomes. Phytochemistry 65:1651–1659
Bradford MM (1976) A rapid and sensitive method for the quantification of microgram quantities
of protein utilizing the principle of protein-dye binding. Anal Biochem 72:248–254
Brechenmacher L,Weidmann S, van TuinenD, Chatagnier O, Gianinazzi S, Franken P, Gianinazzi-
Pearson V (2004) Expression profiling of up-regulated plant and fungal genes in early and late
stages of Medicago truncatula-Glomus mosseae interactions. Mycorrhiza 14:253–262
Campostrini N, Areces LB, Rappsilber J, Pietrogrande MC, Dondi F, Pastorino F, Ponzoni M,
Righetti PG (2005) Spot overlapping in two-dimensional maps: a serious problem ignored for
much too long. Proteomics 5:2385–2395
Canovas FM, Dumas-Gaudot E, Recorbet G, Jorrin J, Mock HP, Rossignol M (2004) Plant
proteome analysis. Proteomics 4:285–298
Chen J, Harman GE, Comis A, Cheng GW (2005) Proteins related to the biocontrol of Pythiumdamping-off in maize with Trichoderma hardanum Rifai. J Int Plant Biol 47:988–997
Chevalier F, Chevalier F, Rofidal V, Vanova P, Bergoin A, Rossignol M (2004) Proteomic
capacity of recent fluorescent dyes for protein staining. Phytochemistry 65:1499–1506
Chinnusamy V, Schumaker K, Zhu JK (2004) Molecular genetic perspectives on cross-talk and
specificity in abiotic stress signalling in plants. J Expt Bot 55:225–236
Daher Z, Fester T, Schoefs B, Dumas-Gaudot E (2006) Subcellular proteomics of root plastids
in response to Glomus intraradices colonization of Medicago truncatula. Abstract, session‘‘Cell programs (2): proteome to metabolome and isoformone’’, ICOM V, 23–27 July 2006,
Granada, Spain
Doner LW, Becard G (1991) Solubilization of gellan gels by chelation of cations. Biotechnol
Tech 5:25–26
15 Functional Genomic of Arbuscular Mycorrhizal Symbiosis 271
Dumas-Gaudot E, Amiour N, Weidmann S, Bestel-Correl G, Valot B, Lenogue S, Gianinazzi-
Pearson V, Gianinazzi S (2004a) A technical trick for studying proteomics in parallel to
transcriptomics in symbiotic root–fungus interactions. Proteomics 4:451–453
Dumas-Gaudot E, Gollotte A, Cordier C, Gianinazzi S, Gianinazzi-Pearson V (2000) Modulation
of host defense systems. In: Douds D, Kapulnik Y (eds) Arbuscular mycorrhizas: molecular
biology and physiology, Kluwer, New York, pp 173–200
Dumas-Gaudot E, Valot B, Bestel-Corre G, Recorbet G, St-Arnaud M, Fontaine B, Dieu M, Raes
M, Saravanan RS, Gianinazzi S (2004b) Proteomics as a way to identify extra-radicular fungal
proteins from Glomus intraradices-RiT-DNA carrot root mycorrhizas. FEMS Microbiol Ecol
48:401–411
Frova C (2003) The plant glutathione transferase gene family: genomic structure, functions,
expression and evolution. Physiol Plant 119:469–479
Garcia-Garrido JM, Tribak M, Rejon-Palomares A, Ocampo JA, Garcia-Romera I (2000) Hydro-
lytic enzymes and ability of arbuscular mycorrhizal fungi to colonize roots. J Expt Bot
51:1443–1448
Giavalisco P, Nordhoff E, Lehrach H, Gobom J, Klose J (2003) Extraction of proteins from plant
tissues for two-dimensional electrophoresis analysis. Electrophoresis 24:207–216
Gorg A, Obermaier C, Boguth G, Harder A, Scheibe B, Wildgruber R, Weiss W (2000) The
current state of two-dimensional electrophoresis with immobilized pH gradients. Electropho-
resis 21:1037–1053
Gorg A, Postel W, Weser J, Gunther S, Strahler JR, Hanash SM, Somerlot L (1987) Horizontal
two-dimensional electrophoresis with immobilized pH gradients in the first dimension in the
presence of non ionic detergent. Electrophoresis 8:45–51
Grinyer J, McKay M, Nevalainen H, Herbert BR (2004) Fungal proteomics: initial mapping of
biological control strain Trichoderma harzianum. Curr Genet 45:163–169Guenoune D, Galili S, Phillips DA, Volpin H, Chet I, Okon Y, Kapulnik Y (2001) The defense
response elicited by the pathogen Rhizoctonia solani is suppressed by colonization of the AM-
fungus Glomus intraradices. Plant Sci 160:925–932Gygi SP, Rist B, Gerber SA, Turecek F, Gelb MH, Aebersold R (1999) Quantitative analysis of
complex protein mixtures using isotope-coded affinity tags. Nat Biotechnol 17:994–999
Hajheidari M, Abdollahian-Noghabi M, Askari H, Heidari M, Sadeghian SY, Ober ES, Salekdeh
GH (2005) Proteome analysis of sugar beet leaves under drought stress. Proteomics 5:950–960
Harry JL, Wilkins MR, Herbert BR, Packer NH, Gooley AA, Williams KL (2000) Proteomics:
capacity versus utility. Electrophoresis 21:1071–1081
Hohnjec, ViewegMF, Puhler A, Becker A, Kuster H (2005) Overlaps in the transcriptional profiles
ofMedicago truncatula roots inoculated with two different Glomus fungi provide insights intothe genetic program activated during arbuscular mycorrhiza. Plant Physiol 137:1283–1301
James P (1997) Breakthroughs and views of genomes and proteomes. Bioch Biophys Res Com
231:1–6
Jorrin JV, Rubiales D, Dumas-Gaudot E, Recorbet G, Maldonado A, Castillejo MA, Curto M
(2006) Proteomics: a promising approach to study biotic interaction in legumes. A review.
Euphytica 147:37–47
Journet EP, van Tuinen D, Gouzy J, Crespeau H, Carreau V, Farmer MJ, Niebel A, Schiex T,
Jaillon O, Chatagnier O, Godiard L, Micheli F, Kahn D, Gianinazzi-Pearson V, Gamas P
(2002) Exploring root symbiotic programs in the model legume Medicago truncatula using
EST analysis. Nucleic Acid Res 30:5579–5592
Lambais MR, Rios-Ruiz WF, Andrade RM (2003) Antioxidant responses in bean (Phaseolusvulgaris) roots colonized by arbuscular mycorrhizal fungi. New Phytol 160:421–428
Lammers P, Tuskan GA, DiFazio SP, Podila GK, Martin F (2004) Mycorrhizal symbionts of
Populus to be sequenced by the United States Department of Energy? DOE Joint Genome
Institute. Mycorrhiza 14:63
Liu JY, Blaylock LA, Endre G, Cho J, Town CD, VandenBosch KA, Harrison MJ (2003)
Transcript profiling coupled with spatial expression analyses reveals genes involved in distinct
developmental stages of an arbuscular mycorrhizal symbiosis. Plant Cell 15:2106–2123
272 E. Dumas-Gaudot et al.

Lopez MF, Berggren K, Chernokalskaya E, Lazarev A, Robinson M, Patton WF (2000) A compari-
son of silver stain and SYPRO Ruby Protein Gel Stain with respect to protein detection in two-
dimensional gels and identification by peptide mass profiling. Electrophoresis 21:3673–3683
Mann M, Wilm M (1995) Electrospray mass spectrometry for protein characterization. Trends
Biochem Sci 20:219–224
Martin F, Tuskan GA, DiFazio SP, Lammers P, Newcombe G, Podila GK (2004) Symbiotic
sequencing for the Populus mesocosm. New Phytol 161:330–335
Mathesius U, Keijzers G, Natera SHA, Weinman JJ, Djordjevic MA, Rolfe BG (2001) Establish-
ment of a root proteome reference map for the model legume Medicago truncatula using the
expressed sequence tag database for peptide mass fingerprinting. Proteomics 1:1424–1440
O’Farrell PH (1975) High-resolution two-dimensional electrophoresis of proteins. J Biol Chem
250:4007–4021
Patterson SD (1994) From electrophoretically separated protein to identification: strategies for
sequence and mass analysis. Anal Biochem 221:1–15
Patterson SD, Aebersold R (1995) Mass spectrometry approaches for the identification of gel-
separated proteins. Electrophoresis 16:1791–1814
Pozo MJ, Pozo MJ, Slezack-Deschaumes S, Dumas-Gaudot E, Gianinazzi S, Azcon-Aguilar C
(2002) Plant defense responses induced by arbuscular mycorrhizal fungi. In: Gianinazzi S,
Schuepp H, Barea JM, Haselwandter K (eds) Mycorrhizal technology in agriculture: from
genes to bioproducts. Birkhauser Verlag Ag, Basel, pp 103–111
Rabilloud T (2000a) Detecting proteins separated by 2-D gel electrophoresis. Anal Chem 72:
48A–55A
Rabilloud T (2000b) Proteome research: two-dimensional gel electrophoresis and identification
methods. Springer, Berlin
Rabilloud T (2001) Silver staining of 2-D electrophoresis gels. In: Methods in molecular biology.
Humana Press, Totowa, pp 297–305
Ramagli LS, Rodriguez LW (1985) Quantification of microgram amounts of protein in two-
dimensional polyacrylamide gel electrophoresis sample buffer. Electrophoresis 6:559–563
Repetto O, Bestel-Corre G, Dumas-Gaudot E, Berta G, Gianinazzi-Pearson V, Gianinazzi S (2003)
Targeted proteomics to identify cadmium-induced protein modifications in Glomus mosseae-inoculated pea roots. New Phytol 157:555–567
Rose JK, Bashir S, Giovannoni JJ, Jahn MM, Saravanan RS (2004) Tackling the plant proteome:
practical approaches, hurdles and experimental tools. Plant J 39:715–733
Sambrook J, Russel D (2001) Molecular cloning: a laboratory manual, 3rd edn. CSHL Press,
New York
Saravanan RS, Rose JKC (2004) A critical evaluation of sample extraction techniques for
enhanced proteomic analysis of recalcitrant plant tissues. Proteomics 4:2522–2532
Shevchenko A, Jensen ON, Podtelejnikov AV, Sagliocco F, Wilm M, Vorm O, Mortensen P,
Boucherie H, Mann M (1996) Linking genome and proteome by mass spectrometry: large
scale identification of yeast proteins from two-dimensional gels. Proc Natl Acad Sci USA 93:
14440–14445
Spanu P, Bonfante-Fasolo P (1988) Cell-wall-bound peroxidase activity in roots of mycorrhizal
Allium porrum. New Phytol 109:119–124
St-Arnaud M, Hamel C, Vimard B, Caron M, Fortin JA (1996) Enhanced hyphal growth and spore
production of the arbuscular mycorrhizal fungus Glomus intraradices in an in vitro system in
the absence of host roots. Mycol Res 100:328–332
Strittmatter G, Gheysen G, Gianinazzi-Pearson V, Hahn K, Niebel A, Rohde W, Tacke E (1996)
Infections with various types of organisms stimulate transcription from a short promoter
fragment of the potato gst1 gene. Mol Plant Microbe Interact 68:173
Unlu M, Morgan ME, Minden JS (1997) Difference gel electrophoresis: a single gel method for
detecting changes in protein extracts. Electrophoresis 18:2071–2077
Valot B, Dieu M, Recorbet G, Raes M, Gianinazzi S, Dumas-Gaudot E (2005) Identification of
membrane-associated proteins regulated by the arbuscular mycorrhizal symbiosis. Plant Mol
Biol 59:565–580
15 Functional Genomic of Arbuscular Mycorrhizal Symbiosis 273
Valot B, Dumas-Gaudot E, Gianinazzi S (2004) Sub-cellular proteomic analysis of a Medicagotruncatula root microsomal fraction. Phytochemistry 65:1721–1732
Valot B, Negroni L, Zivy M, Gianinazzi S, Dumas-Gaudot E (2006) A mass spectrometric
approach to identify arbuscular mycorrhiza-related proteins in root plasma membrane frac-
tions. Proteomics 6:145–155
Wang W, Scali M, Vignani R, Spadafora A, Sensi E, Mazzuca S, Cresti M (2003) Protein
extraction for two-dimensional electrophoresis from olive leaf, a plant tissue containing high
levels of interfering compounds. Electrophoresis 24:2369–2375
Washburn MP, Wolters D, Yates JR (2001) Large-scale analysis of the yeast proteome by
multidimensional protein identification technology. Nature Biotechnol 19:242–247
Weidmann S, Sanchez L, Descombin J, Chatagnier O, Gianinazzi S, Gianinazzi-Pearson V (2004)
Fungal elicitation of signal transduction-related plant genes precedes mycorrhiza establish-
ment and requires the dmi3 gene in Medicago truncatula. Mol Plant Microbe Interact 17:
1385–1393
Wilkins MR, Sanchez JC, Gooley AA, Appel RD, Humphery-Smith I, Hochstrasser DF, Williams
KL (1996) Progress with proteome projects: why all proteins expressed by a genome should be
identified and how to do it. Biotechnol Genet Eng Rev 13:19–50
Wilm M, Shevchenko A, Houthaeve T, Breit S, Schweigerer L, Fotsis T, Mann M (1996)
Femtomole sequencing of proteins from polyacrylamide gels by nano-electrospray mass
spectrometry. Nature 379:466–469
Wulf A, Manthey K, Doll J, Perlick AM, Linke B, Bekel T, Meyer F, Franken P, Kuster H,
Krajinski F (2003) Transcriptional changes in response to arbuscular mycorrhiza development
in the model plant Medicago truncatula. Mol Plant Microbe Interact 16:306–314
274 E. Dumas-Gaudot et al.
Chapter 16
Using Stable Carbon Isotope Labelling in
Signature Fatty Acids to Track Carbon
Allocation in Arbuscular Mycorrhiza
Pal Axel Olsson
16.1 Introduction
A technique based on stable carbon (C) isotope labelling and subsequent compound
specific isotope ratio mass spectrometry can be used to estimate C flow between
different soil organism groups (Olsson et al. 2005). The C flow from atmosphere to
green biomass can be estimated by traditional techniques and the allocation below
ground into roots and transfer to specific molecules can be determined with
compound-specific isotope ratio mass spectrometry.
In soil and roots different organisms occur closely associated with each other.
It is therefore not always possible to separate soil organisms mechanically from
each other. Above-ground tissues such as plant leaves and fruitbodies of fungi can
be sampled as relatively pure examples of single organisms. In soil, the use of
signature compounds is a great advantage both for the estimation of microbial
biomass and for the study of C flow in the rhizosphere. In particular the neutral lipid
fatty acid 16:1o5 is useful for detecting and estimating C flow to the arbuscular
mycorrhizal (AM) fungi in roots and soil (Olsson et al. 2005). Furthermore, the
C transferred to saprophytic microorganisms can be estimated by use of other fatty
acids (Olsson and Johnson 2005).
By use of lipid analysis the C flow in the rhizosphere can be described according
to the conceptual model proposed in Fig. 16.1. The amount of recently assimilated
C retained in each box in Fig. 16.1 can be estimated, and the total C flow,
represented by the arrows, can be indicated by these measurements. The amount
P.A. Olsson
Department of Plant Ecology and Systematics, Lund University, Ecology Building, SE-223 62,
Lund, Sweden
e‐mail: [email protected]
A. Varma and A.C. Kharkwal (eds.), Symbiotic Fungi, Soil Biology 18, 275
DOI: 10.1007/978‐3‐540‐95894‐9_16, # Springer‐Verlag Berlin Heidelberg 2009

of C respired away from each box can not be determined, but during microbial
growth an added C substrate is normally used to almost 50% for energy production
and the rest is used for biomass components such as storage (for example Sylvia
et al. 1998). At the same time the biomass C in each box can be estimated and be
compared with the recent uptake of plant-assimilated C.
16.2 Microbial Biomass Distribution
Biomass of different groups of organisms in the soil can be determined by use of
biochemical markers and biomass conversion factors obtained from pure cultured
microorganisms or field samples of hyphae and spores. By use of various signature
compounds (Olsson 1999), the relative biomass of saprophytic fungi [ergosterol
and phospholipid fatty acid (PLFA 18:2o6,9)], AM fungi (fatty acid 16:1o5, noergosterol) and bacteria (10 specific PLFAs) can be determined.
Neutral lipids are storage compounds that may comprise around 20% of the
biomass of hyphae, vesicles, and spores of AM fungi (Olsson and Johansen 2000).
The phosphate group of the phospholipids is easily and rapidly released through
enzymatic actions in soil (White et al. 1979) and thus PLFAs reflect the occurrence
of mainly living organisms, and also neutral lipids can be expected to be degraded
rapidly when fungal hyphae senesce.
Consequently, the dynamics of 13C-labelled signature fatty acids can be used to
track carbon flux from plants to intra- and extraradical AM fungal tissues and to
other rhizosphere microorganisms (Olsson et al. 2002; Gavito and Olsson 2003).
Since total 13C incorporation in AM fungal hyphae is correlated to that in the
neutral lipid fatty acid (NLFA) 16:1o5 (Olsson et al. 2005), it is possible to make an
estimate of C uptake in AM fungi by analysing this compound.
Fig. 16.1 Schematic presentation of C pools (boxes) that can be estimated by use of 13C-labelling
and the flow of C between these different pools
276 P.A. Olsson

16.3 13C Labelling
16.3.1 Timing of Measurements
Timing is extremely important in all labelling experiments, particularly for studies
of C allocation, because C is continually respired. However, a large proportion of
AM fungal C is contained in lipids in vesicles inside plant roots and in spores on the
external mycelium where they accumulate and may be stored for long periods
of time. As long as the mycelium is expanding and spores are formed, there
should be a continuous allocation of carbon to long-term storage. In field-labelled
AM fungal mycelium, labelled respiration ceased within seven days after pulse-
labelling (Johnson et al. 2002), indicating that only labelled stored material
remained at that time. We observed a similar level of enrichment in the extraradical
and intraradical mycelia after seven days (Olsson et al. 2005; Olsson and Johnson
2005), indicating that there was enough time for C translocation between different
parts of the mycelium. We also found that recently assimilated C in Plantagolanceolata appeared in the extraradical Am fungal hyphae within a few days and
remained to a large part there for at least 30 days (Olsson and Johnson 2005).
Higher 13C enrichment in lipids of the intraradical mycelia than in plant root lipids
shows that lipid metabolism is more active in the intraradical mycelia than in
the plant (Olsson et al. 2005). Such a difference was particularly evident in the
monoxenic experiments with 13C-glucose.
16.3.2 Labelling in Monoxenic AM Cultures
Monoxenic AM cultures are now well-established as experimental systems for the
investigations of AM fungal biology (Becard and Fortin 1988; Fortin et al. 2002).
Established cultures in 1- or multi-compartmental Petri dishes can be labelled. The
plates are supplied with sterile filtered [13C] D-glucose solution (7 mg glucose per
dish, U-13C6, 99%13C) in a ring, 5 mm outside the initial inoculum plug. Solid MM
medium (Fortin et al. 2002) with only hyphae can be cut out from the plates and
dissolved in 10 mM Na citrate (Doner and Becard 1991) by mixing on a magnetic
stirrer for 1 h at low speed at 20�C to leave extraradical mycelia and spores. The
mycelia are collected on a 25 mm nylon mesh and washed in deionised water in a
glass beaker. Roots are collected with forceps from the plates and washed in 10 mM
Na citrate to remove any remaining solid medium. Using two-compartmental
dishes with established root cultures in solid medium and with a liquid medium
compartment for hyphal growth (Maldonado-Mendoza et al. 2001) is recommended
for various reasons. First of all the mycelium can be subjected to treatments
that do not directly influence the roots (Gavito et al. 2005; Olsson et al. 2006).
16 Using Stable Carbon Isotope Labelling 277
Furthermore, C translocation by mycelium themselves can be estimated and the
sampling is easier when mycelium is growing in liquid medium. Mycelia and roots
are stored at �20�C until analysed for 13C enrichment and fatty acid content and
composition.
16.3.3 Labelling in Pot Experiments
Controlled labelling of experimental pots can be obtained by transferring them to a
greenhouse seedling propagation box (volume around 25 dm2). The transparent lid
of the greenhouse box can be adapted with a fan, a thermometer, and a gas-sampling
tubing connected to an infra-red gas analyser (IRGA) and a small hole with a
septum. The bottom tray and the lid of the box are sealed with paraffin and the
initial CO2 concentration recorded. Labelling is done when the fan is turned on by
injection of, for example, 100 ml of 13CO2 (99%13CO2) with a gas-tight syringe
through the septum. The CO2 concentration inside the box increases usually from
240–270 to 500–1,000 ppm after such an injection. A pulse period of 2–4 h is
usually appropriate. We have observed that assimilation may be very low the first
hour after labelling, and therefore a longer period than 1 h is recommended. It is
best to investigate the assimilation using the IRGA. The lid is removed after the
labelling time.
16.3.4 Labelling in the Field
13C labelling in the field can be done by enclosing a piece of vegetation, or a single
shoot, in a plastic chamber and then injecting the labelled gas. Basically the
labelling in the field works in the same way as for pot cultures. Almost all
incorporation goes via the autotrophic shoots. The chamber may first be emptied
for non-labelled CO2, which can be done by letting the plants themselves empty
CO2 in an enclosed room. Usually carbon dioxide content goes down rapidly after
enclosing in a closed chamber. The initial carbon dioxide, and increase due to
labelling, can be measured using an IRGA coupled to the chamber. Each system is
unique and it is wise to make a pilot study for each type of plant, or plant species.
The fraction of C that moves below ground to the roots may in some cases be small
and a rather high label in roots is needed to be able to track the C further to AM
fungi and rhizosphere bacteria. The initial labelling can be checked by sampling
shoots directly after the pulse period. If the labelling is too small, it is very difficult
to trace the C later on after the chase period. If the initial labelling results in a delta13C value of around 1,000 (corresponding to around 2% 13C, which means around
1% enrichment), there is a good chance of tracing the C further. If it is around delta
100, the chances are small.
278 P.A. Olsson
The weather during field labelling is crucial. Too hot and sunny weather may
cause very high temperature in the labelling chamber, something that many plants
are sensitive to. Too low light intensity may also reduce the assimilation. Further-
more, it is important to do labelling during a period (season) when the plants are
active (if this is not the research question itself).
16.4 Analytical Techniques
16.4.1 Homogenization of Samples
In order to obtain an efficient extraction of lipids from mycelial and root samples it
is recommended to use some way of homogenizing samples. Mycelial samples can
be milled with stainless steel balls by shaking by hand in Teflon tubes, and roots can
be ball-milled (15 s, 300 strokes min�1) in stainless steel beakers. Too harsh milling
may heat samples too much, which can damage the lipids. Another way to homog-
enize mycelium or small amounts of roots is putting them in Eppendorf tubes
together with a few grains of pure sand, and then grinding them with a pestle.
Soil samples are usually not mechanically homogenized before lipid extraction, but
to be sure to extract all lipids from mature spores, ball-milling is recommended
(Olsson and Johansen 2000). There are tungsten beakers available that will not be
damaged by sand particles.
16.4.2 Lipid Analysis
The lipids from mycelia (0.5–1 mg dry mass), roots (15–30 mg), soil (0.5–3 g) or
sand (10 g) are extracted by vortex mixing (1 min) in a one-phase mixture of citrate
buffer, methanol and chloroform (0.8:2:1, v/v/v, pH 4.0) (8). The lipids are fractio-
nated into neutral lipids, glycolipids and phospholipids on pre-packed silica col-
umns by eluting with 1.5 ml chloroform, 6 ml acetone, and 1.5 ml methanol,
respectively. The fatty acid residues in the neutral lipids and the phospholipids,
transformed into free fatty acid methyl esters, are analysed by gas chromatography
using a 50 m HP5 capillary-fused silica column with H2 as carrier gas (Frostegard
et al. 1993). The fatty acids are identified from their retention times relative to that
of the internal standard (fatty acid methyl ester 19:0). These are compared with
those earlier determined by gas chromatography-mass spectrometry.
16.4.3 Signature Fatty Acids
NLFA 16:1o5 is a sensitive signature of AM fungi in both roots and soil (Graham
et al. 1995; Olsson et al. 1995). PLFA 16:1o5 is a constituent of AM fungal
membranes, with rather low specificity as a signature due to relatively low content
16 Using Stable Carbon Isotope Labelling 279

in AM fungi and a high background in soil originating from bacteria (Olsson et al.
1995). NLFA 16:0 is a general NLFA which often increases in concentration in
plant roots following AM colonization due to the high content of storage lipids in
AM fungi (Olsson et al. 1995). NLFA 18:2o6, 9 is present in plant storage lipids. Itis also the dominant fatty acid in most fungi, but occurs at very low levels in AM
fungi (Graham et al. 1995; Olsson and Johansen 2000). PLFAs i15:0, a15:0
and cy19:0 are three bacteria-specific PLFAs that can be used as indicators of
bacterial biomass (Frostegard and Baath 1996). Both the neutral lipid fatty acid
(NLFA) and the phospholipid fatty acid (PLFA) 16:1o5 are effective signatures
for AM fungi (Olsson 1999; van Aarle and Olsson 2003), while other PLFAs
(i15:0, a15:0, i16:0, 10Me16:0, i17:0, a17:0, cy17:0, 10Me17:0, 10Me18:0 and
cy19:0) are effective signatures for rhizosphere bacteria (Frostegard and Baath
1996).
16.4.4 Determination of 13C Enrichment in Crude TissueSamples and Fatty Acids
Freeze-dried mycelia (approx. 20–100 mg) or ball-milled root material (approx.
100 mg) are placed in tin capsules (crude tissue samples) and analysed by continu-
ous-flow isotope ratio mass spectrometry (IRMS) using a stable isotope analyser
interfaced to a solid/liquid preparation module. The 13C/12C ratios of CO2 of the
combusted samples (total C) are determined with a 0.01% precision. Data are
expressed as atom % 13C with reference to a sucrose standard, calibrated against
the Pee Dee Belemite (PDB) standard (the limestone fossil Belemnitella americanafrom the Cretaceous Pee Dee formation in South Carolina, USA; International
Atomic Energy Agency; Dowson and Brooks 2001).
The 13C enrichment in fatty acid methyl esters was determined in the IRMS
interfaced with a gas chromatograph equipped with a split/splitless injector, flame
ionization detector, a high temperature reaction furnace mounted, and a sampler
unit. The chromatographic conditions are as described for the lipid analysis except
that He was used as the carrier gas. The effluent from the capillary column passes
through an Al tube with CuO wires at 860�C, where the fatty acids are converted toCO2. Co-generated water vapour is removed via a Nafion membrane and the
purified CO2 released into the IRMS.
The atom % 13C values are calculated based on atom 13C of the reference CO2
gas, injected three times at the beginning and end of a chromatographic run. The
reference CO2 is standardized with the PDB standard using solid/liquid preparation
module. Integration for each peak needs to be checked and corrected manually. The13C enrichment of fatty acids is calculated after correction for the C added in the
methanolysis step of the fatty acid analysis procedure.
280 P.A. Olsson

16.4.5 Quantification of Transferred Carbon
The correspondence between 13C enrichment in NLFA 16:1o5 and 13C enrichment
in total mycelium, shown by Olsson et al. 2005, suggests that the flow of C from
host plants to fungal mycelia can be calculated from 13C enrichment in NLFA
16:1o5. In this specific study it was found that for every C incorporated into NLFA
16:1o5 in mycelia, 2.7 atoms of C was incorporated into the total mycelium mass.
The flow of C from the host plant to the NLFA 16:1o5 can be calculated from
measurements of NLFA 16:1o5 in the mycelia and its 13C enrichment:
NLFA16:1o5-CðmgÞ � 13C-enrichment in NLFA16:1o5ð%=100Þ¼ C-flow to NLFA16:1o5
Similarly, the flow of total C to the mycelia can be calculated by:
Mycelium biomass-CðmgÞ� total13C-enrichmentð%=100Þ¼ C-flow to mycelium
The flow of plant C to the AM fungal mycelia can be estimated based on measure-
ments of the signature NLFA 16:1o5:
C-flow to mycelium ¼ C-flow to NLFA16:1o5� 2:7
Thus, for every C atom incorporated in NLFA 16:1o5, 2.7 C atoms are incor-
porated into the fungal mycelia. This calculation can be used when pure myceli-
um cannot be extracted, such as from colonised roots or mycelium-containing
soil.
16.5 Sensitivity and Specificity of the Method
Natural abundance of 13C (d13C) is generally around d -30 (corresponds to 1.15%13C) in C3 plants, and the 13C abundance in AM fungi is similar to that of their host
plant (Nakano et al. 1999, 2001; Staddon et al. 1999). Abraham et al. (1998)
provided various substrates to different microorganisms and observed that the 13C
abundance in the fatty acid 16:0 extracted from the microorganisms resembled that
of the substrate. With our method, using a 13C-labelled substrate, we reach a much
higher sensitivity when tracing the C metabolism than by just using the natural
differences in natural 13C abundance between different substrates.
The dominance of the fatty acid 16:1o5 in AM fungi and its rareness in other
fungi (Muller et al. 1994; Stahl and Klug 1996) make it a useful biomarker probably
for all Glomus species (Graham et al. 1995) and also for Scutellospora species
16 Using Stable Carbon Isotope Labelling 281
(Graham et al. 1995; van Aarle and Olsson 2003), but not for Gigaspora species
(Graham et al. 1995). Neutral lipids are important for energy storage, and 16:1o5 isparticularly common in this fraction of AM fungal lipids (Olsson et al. 1995).
Triacylglycerols are the main type of neutral lipids found in AM fungal spores
and vesicles (Beilby and Kidby 1980; Cooper and Losel 1978; Nagy et al. 1980),
although other fractions, e.g. diacylglycerols and free fatty acids, are also important
in Glomus. All of them are, however, dominated by 16:1o5.16:1o5 is suitable for labelling because the amount of this fatty acid is correlated
with total 13C enrichment in hyphae and because this fatty acid represents a
significant portion of the AM fungal biomass, which is consistent with the hypoth-
esis of Bago et al. (2002) that up to 50% of the hyphal volume may be lipid bodies.
That a high proportion of AM fungal biomass is lipids is probably the main reason
for the strong correlation between 13C enrichment in hyphae and in NLFA 16:1o5extracted from the same hyphae.
16.6 Conclusions
In a recent study we investigated the C turnover in mycorrhizal fungi in a pot
experiment (Olsson and Johnson 2005). We used 13C incorporation into signature
fatty acids to study carbon dynamics in an AM fungus in symbiosis with Plantagolanceolata. Most carbon assimilated by intra- and extraradical AM fungal structures
remained 32 days after labelling. Furthermore, 13C enrichment of signature fatty
acids showed a gradual release of carbon from roots to rhizosphere bacteria, but at a
much lower rate than direct transfer of plant assimilates to AM fungi. These
findings indicated that retention of carbon in AM fungal mycelium may contribute
significantly to soil-organic C; and that 13C-labelled fatty acids can be used to track
carbon flux from the atmosphere to the rhizosphere.
The method described here provides an objective way to compare C allocation to
intraradical and extraradical AM hyphae and to track C allocation in plant roots to
fungal symbionts. Plant regulation of C allocation can be followed by this method
after the symbiosis has been established. The regulation of colonization establish-
ment in AM has been well-studied, while the regulation of the C transfer in
established symbiosis has been little studied due to methodological difficulties.
The method may be used to test hypotheses regarding the relative C allocation to
AM fungi under different environmental conditions and to estimate how much
different plant species allocate to the AM symbiosis.
The method may also be used to calculate carbon fixation in AM fungi in field
ecosystems, but this needs further evaluation. The 13C-labelling technique has the
potential to contribute to understanding a significant part of the global carbon cycle.
The rhizosphere dynamics and pH effects studied are of general importance for
interpreting dynamics of all types of grasslands and can also help to understand the
C fixation in different ecosystems and how it is influenced by successions. Today it
is often believed that AM fungi contribute to a great extent to C cycling in any type
282 P.A. Olsson
of grassland. By this technique it is possible to investigate if this is true for all kinds
of grasslands.
References
Abraham W-R, Hesse C, Pelz O (1998) Ratios of carbon isotopes in microbial lipids as an
indicator of substrate usage. Appl Environ Microbiol 64:4202–4209
Bago B, Zipfel W,Williams RM, Jun J, Arreola R, Lammers PJ, Pfeffer PE, Shachar-Hill Y (2002)
Translocation and utilization of fungal storage lipid in the arbuscular mycorrhizal symbiosis.
Plant Physiol 128:108–124
Becard G, Fortin JA (1988) Early events of vesicular–arbuscular mycorrhiza formation on Ri
T-DNA transformed roots. New Phytol 108:211–218
Beilby JP, Kidby DK (1980) Biochemistry of ungerminated and germinated spores of the vesicular–
arbuscular mycorrhizal fungus, Glomus caledonius, changes in neutral and polar lipids. J LipidRes 21:739–750
Cooper KM, Losel DM (1978) Lipid physiology of vesicular–arbuscular mycorrhiza — I. Com-
position of lipids in roots of onion, clover and ryegrass infected with Glomus mosseae. NewPhytol 80:143–151
Dawson TE, Brooks PD (2001) Fundamentals of stable isotope chemistry. In: Unkovich M, Pate J,
McNeill A, Gibbs DJ (eds) Stable isotope techniques in the study of biological processes and
functioning of ecosystems. Kluwer, Dordrecht, pp 1–18
Doner LW, Becard G (1991) Solubilization of gellan gels by chelation of cations. Biotechnol Tech
5:25–28
Fortin JA, Becard G, Declerck S, Dalpe Y, St-Arnaud M, Coughlan AP, Piche Y (2002) Arbus-
cular mycorrhiza on root-organ cultures. Can J Bot 80:1–20
Frostegard A, Baath E (1996) The use of phospholipid fatty acid analysis to estimate bacterial and
fungal biomass in soil. Biol Fertil Soils 22:59–65
Frostegard A, Tunlid A, Baath E (1993) Phospholipid fatty acid composition, biomass and activity
of microbial communities from two soil types experimentally exposed to different heavy
metals. Appl Environ Microbiol 59:3605–3617
Gavito ME, Olsson PA (2003) Allocation of plant carbon to foraging and storage in arbuscular
mycorrhizal fungi. FEMS Microbiol Ecol 45:181–187
Gavito ME, Olsson PA, Rouhier H, Medina-Penafiel A, Jakobsen I, Bago A, Azcon-Aguilar C
(2005) Temperature constraints on the growth and functioning of root organ cultures with
arbuscular mycorrhizal fungi. New Phytol 168:179–188
Graham JH, Hodge NC, Morton JB (1995) Fatty acid methyl ester profiles for characterization of
Glomalean fungi and their endomycorrhizae. Appl Environ Microbiol 61:58–64
Johnson D, Leake JR, Ostle N, Ineson P, Read DJ (2002) In situ 13CO2 pulse-labelling of upland
grassland demonstrates a rapid pathway of carbon flux from arbuscular mycorrhizal mycelia to
the soil. New Phytol 153:327–334
Maldonado-Mendoza IE, Dewbre GR, Harrison MJ (2001) A phosphate transporter gene from the
extra-radical mycelium of an arbuscular mycorrhizal fungus Glomus intraradices is regulatedin response to phosphate in the environment. Mol Plant Microbe Interact 14:1140–1148
Muller MM, Kantola R, Kitunen V (1994) Combining sterol and fatty acid profiles for the
characterization of fungi. Mycol Res 98:593–603
Nagy S, Nordby HE, Nemec S (1980) Composition of lipids in roots of six citrus cultivars infected
with the vesicular arbuscular mycorrhizal fungus Glomus mosseae. New Phytol 85:377–384
Nakano A, Takahashi K, Kimura M (1999) The carbon origin of arbuscular mycorrhizal fungi
estimated from d13C values of individual spores. Mycorrhiza 9:41–47
16 Using Stable Carbon Isotope Labelling 283

Nakano A, Takahashi K, Kimura M (2001) Effect of host shoot clipping on carbon and nitrogen
sources for arbuscular mycorrhizal fungi. Mycorrhiza 10:287–293
Olsson PA (1999) Minireview— Signature fatty acids provide tools for determination of distribu-
tion and interactions of mycorrhizal fungi in soil. FEMS Microbiol Ecol 29:303–310
Olsson PA, Baath E, Jakobsen I, Soderstrom B (1995) The use of phospholipid and neutral lipid
fatty acids to estimate biomass of arbuscular mycorrhizal fungi in soil. Mycol Res 99:623–629
Olsson PA, Gavito ME, Van Aarle IM, Bengtson P, Bengtsson G (2005) Incorporation into
signature fatty acids as an assay for carbon allocation in arbuscular mycorrhiza. Appl Environ
Microbiol 71: 2592–2599
Olsson PA, Hansson MC, Burleigh SH (2006) Effect of P availability on temporal dynamics of
carbon allocation and Glomus intraradices high-affinity P transporter gene induction in
arbuscular mycorrhiza. Appl Environ Microbiol 72:4115–4120
Olsson PA, Johansen A (2000) Lipid and fatty acid composition of hyphae and spores of
arbuscular mycorrhizal fungi at different growth stages. Mycol Res 104:429–434
Olsson PA, Johnson NC (2005) Tracking carbon from the atmosphere to the rhizosphere. Ecol Lett
8:1264–1270
Olsson PA, van Aarle IM, Allaway WG, Ashford AE, Rouhier H (2002) Phosphorus effects on
metabolic processes in monoxenic arbuscular mycorrhiza cultures. Plant Physiol 130:1162–
1171
Staddon PL, Robinson D, Graves JD, Fitter AH (1999) The d13C signature of the external phase of
Glomus mycorrhizal fungus: determination and implications. Soil Biol Bioch 31:1067–1070
Stahl PD, Klug MJ (1996) Characterization and differentiation of filamentous fungi based on fatty
acid composition. Appl Environ Microbiol 62:4136–4146
Sylvia DM, Fuhrmann JJ, Hartel PG, Zuberer DA (1998) Principles and Applications of Soil
Microbiology. Prentice-Hall, Upper Saddle River, NJ
van Aarle IM, Olsson PA (2003) The relation of fungal lipid accumulation to development
of mycelial structures in two arbuscular mycorrhizal fungi. Appl Environ Microbiol 69:
6762–6767
White DC, Davis WM, Nickels JS, King JD, Bobbie RJ (1979) Determination of the sedimentary
microbial biomass by extractible lipid phosphate. Oecologia 40:51–62
284 P.A. Olsson
Chapter 1715N Enrichment Methods to Quantify Two-Way
Nitrogen Transfer Between Plants Linked
by Mychorrhizal Networks
X.H. He, C. Critchley, K. Nara, D. Southworth, and C.S. Bledsoe
17.1 Introduction
Nitrogen (N) movement or transfer from one plant (donor) to another (receiver) is
of fundamental importance in N2-fixing plant-based agricultural and natural eco-
systems (Stern 1993; Chalk 1998; Graham and Vance 2003; Forrester et al. 2006).
Nitrogen transfer is relevant to global concerns about N excess and N limitation in
terrestrial ecosystems (Vitousek et al. 1997; Moffat 1998; Sanchez 2002; Nosengo
2003). Numerous studies over the past three decades have demonstrated that plant-
to-plant N transfer from the donor to the receiver is not restricted to mass flow and
diffusion through soil pathways, and can take place directly through mychorrhizal
hyphae in common mychorrhizal networks (CMNs) that interconnect roots. Such
mycorrhizal-mediated N movement between plants could have practical implica-
tions for plant performance, especially in N-limited habitats (Sprent 2005; Forrester
et al. 2006; Nara 2006). However, recapture of decomposed and exuded plant and
fungal materials by the receiver may occur simultaneously in the soil.
X.H. He (*)
School of Plant Biology, University of Western Australia, Crawley, WA 6009, Australia
e-mail: [email protected], [email protected]
C. CritchleySchool of Integrative Biology, University of Queensland, Brisbane, QLD 4072, Australia
K. NaraAsian Natural Environmental Science Center, University of Tokyo, NishiTokyo, Tokyo 188-0002,
Japan
D. SouthworthDepartment of Biology, Southern Oregon University, Ashland, OR 97520, USA
C.S. BledsoeDepartment of Land, Air and Water Resources, University of California, Davis, CA 95616, USA
A. Varma and A.C. Kharkwal (eds.), Symbiotic Fungi, Soil Biology 18, 285
DOI: 10.1007/978‐3‐540‐95894‐9_17, # Springer‐Verlag Berlin Heidelberg 2009
In many cases, N is transferred from N2-fixing mychorrhizal plants to non-
N2-fixing mychorrhizal plants via a CMN (unidirectional or one-way N transfer)
(Newman 1988; He et al. 2003). In a few cases, N is also transferred from non-
N2-fixing mychorrhizal plants to N2-fixing mychorrhizal plants via a CMN (bidi-
rectional, two-way or net N transfer) (Johansen and Jensen 1996; He et al. 2004,
2005; Moyer-Henry et al. 2006). Thus, the N2-fixing plant is not always warranted
to be the N-donor. Furthermore, limited data show that the net N gains through
CMNs in the recipient may play beneficial roles in affecting their fitness (Newman
1988; Johansen and Jensen 1996; He et al. 2004, 2005; Moyer-Henry et al. 2006).
Understanding the directions and magnitude of N transfer between plants
through CMNs helps clarify the agricultural and ecological importance of CMNs
(He et al. 2005; Hogh-Jensen 2006). Studies are therefore needed to quantify net N
transfer between plants, and to determine whether mychorrhizal hyphae facilitate
N transfer. However, it is experimentally difficult to distinguish N transfer between
the soil and the mychorrhizal pathway. We suggest that the importance of mycor-
rhizas in N transfer may be demonstrated by separation of the root systems of plants
so that only hyphae connect the plants, and there is no root contact. In doing so,
25–37 mm nylon or metal mesh has been used in most studies (Newman 1988;
Johansen and Jensen 1996; He et al. 2003). A polytetrafluoroethylene (PTFE)
hydrophobic membrane has been applied in some studies (Frey et al. 1998).
A narrow air gap between fine meshes separating plants can further prevent interplant
nutrient movement through the soil pathway (Faber et al. 1991). However, 15N could
cross the air gap in hyphae, then leak into the soil and be taken up again as an
indirect step following the direct transfer through hyphae. This sort of 15N move-
ment or translocation could be minimized by severing the hyphae within the air gap
to see if transfer is disrupted and whether the flow, once established, stops.
17.2 Use of 15N Isotopes for Investigating Nitrogen
Transfer Between Plants
Nitrogen has two stable isotopes, 14N and 15N, and four radioactive isotopes, 12N,13N, 16N and 17N. The short half-life time (0.01 s! 10 min) of radioactive isotopes
of N makes them unsuitable for investigating most plant physiological or ecological
processes (Knowles and Blackburn 1993). Of the stable isotopes, 14N is more
abundant, accounting for �99.6337% of atmospheric N; 15N is rare, accounting
for �0.3663% of atmospheric N. Since the ratio of 15N/14N (0.0036765) in the
atmosphere is constant, atmospheric N2 is used as the standard for 15N analysis by
continuous flow isotope ratio mass spectrometer (IRMS) (Mariotti 1983; Knowles
and Blackburn 1993; Unkovich et al. 2001).
Two methods have been used for quantifying N transfer between plants: 15N
enrichment and 15N natural abundance (He et al. 2003; Hogh-Jensen 2006). With
the 15N enrichment or labeling method, an external source of 15N-enriched
286 X.H. He et al.
inorganic chemicals or organic compounds (up to 99.90 atom 15N, %) is applied to
plant tissues, growth media or soils, and the events of N metabolism or N translo-
cation are followed over short-term periods (days to weeks). The 15N labeling
method involves a large enrichment of 15N over background, making measurement
of isotopic effects easy because the difference between the isotopic compositions of
the source and the plant or the soil is large. In the 15N natural abundance or d15Nmethod, plant tissues are analyzed to determine 15N at naturally occurring levels
(d15N values, %). In the d15N method, there is a small enrichment of 15N over
background, making measurement of isotopic effects difficult. The difference
between isotopic compositions of the source and the plant or soil is small, but
does reflect naturally occurring 15N variations over long-term periods (years to
decades) (Hobbie and Hobbie 2006). However, variations of d15N values are often
small (�10%) among AM or EM plant species that have unique physiological
processes in different habitats (Handley and Scrimgeour 1997; Hogberg 1997;
Hobbie and Hobbie 2006). As a consequence, it is hard to demonstrate plant-
to-plant N transfer through CMNs by d15N variations of mychorrhizal plants, at
least at face value, although they may demonstrate the magnitude of 15N fractiona-
tions during N translocation in long-term natural conditions.
17.3 Experimental Design for Investigating Two-Way
Nitrogen Transfer Between Plants
Here we explore the 15N enrichment method to determine two-way N transfer
between plants through mychorrhizal connections and to measure the net benefit
to the partners. With either the N2-fixing or the non-N2-fixing plant as the N-donor,
four reciprocal pairings are created to study two-way plant-to-plant N transfer, and
to distinguish N transfer between the soil and the mychorrhizal pathway
(Table 17.1). First, as a control, the non-nodulated/non-mychorrhizal pair monitors
N transfer in the absence of both hyphal connections and N2 fixation. Second, the
nodulated/non-mychorrhizal pair tests effects of N2 fixation on N transfer in the
absence of hyphal connections. Third, the non-nodulated/mychorrhizal pair deter-
mines effects of hyphal connections on N transfer in the absence of N2-fixation.
Fourth, the nodulated/mychorrhizal pair examines effects of both mychorrhizal and
N2 fixation on N transfer. To minimize mass flow and diffusion through soil
pathways, two perforated Perspex plates (2.5 mm thick) are inserted in the middle
of a 5 l plastic box (300� 12� 150 cm) to divide the box into two chambers with a
5-mm air gap (Fig. 17.1). On one side of the two plates, sheets of 25–37 mm nylon
mesh are inserted on the inner side of the plates to allow only hyphal connections.
To further minimize water movement across the air gap between the two chambers,
high water holding capacity crystals [0.5% (w/w), RainSaver, Hortex Australia Pty.Ltd., NSW, Australia] are incorporated in the potting mix. External 15N may be
added directly to the N-donor side.
17 15N Enrichment Methods to Quantify Two-Way 287

17.3.1 Quantification of Nitrogen Transfer Between Plants
Nitrogen transfer has been quantified in three ways: percentage of Ntransfer
(% Ntransfer, (17.1–17.3)); amount of N transferred (mg plant�1, (17.4); and per-
centage of NDFT (% NDFT, N in the N-receiver derived from transfer, (17.5) and(17.6)) (Ledgard et al. 1985; Giller et al. 1991; Johansen and Jensen 1996).
%Ntransfer ¼ 15Ncontentreceiver � 100=ð15Ncontentreceiverþ15NcontentdonorÞ ð17:1Þ
where
15Ncontentplant ¼ atom%15N excessplant � total Nplant=atom%15 N excesslabeled N
ð17:2Þand
atom% 15N excessplant ¼ atom% 15Nplant after labeling � atom% 15Nplant background
ð17:3Þ
Ntransfer ¼ %Ntransfer � total Ndonor=ð100 � % NtransferÞ ð17:4Þ
%NDFT ¼ Ntransfer � 100=total Nreceiver ð17:5Þ
In addition, % NDFT values can also be calculated as follows (Tomm et al. 1994):
%NDFT ¼ ðatom%15N excessreceiver=atom%15N excessdonorÞ � 100 ð17:6Þ
Equations (17.5) and (17.6) are equal if the 0.3663%15N of atmospheric N2 is
subtracted from the measured atom %15N in (17.5).
Table 17.1 Experimental design for two-way N transfer between N2-fixing and non-N2-fixing
plants grown in two-chambered pots. Enriched 15N compounds are supplied to the growth medium
or the leaves of the N-donor plant. Time period of 15N labeling (days to months) depends on
physiological activity of plants species and experimental purposes
Plant pair name Plant status Treatment
status
N-donor N-receiver Myc Nod
Non-nodulated/non-mycorrhizal pairs N2-fixing Non-N2-fixing � �Non-N2-fixing N2-fixing � �
Nodulated/non-mycorrhizal pairs N2-fixing Non-N2-fixing � +
Non-N2-fixing N2-fixing � +
Non-nodulated/mycorrhizal pairs N2-fixing Non-N2-fixing + �Non-N2-fixing N2-fixing + �
Nodulated/mycorrhizal pairs N2-fixing Non-N2-fixing + +
Non-N2-fixing N2-fixing + +
Myc Mycorrhizal status; Nod Nodulation status
288 X.H. He et al.
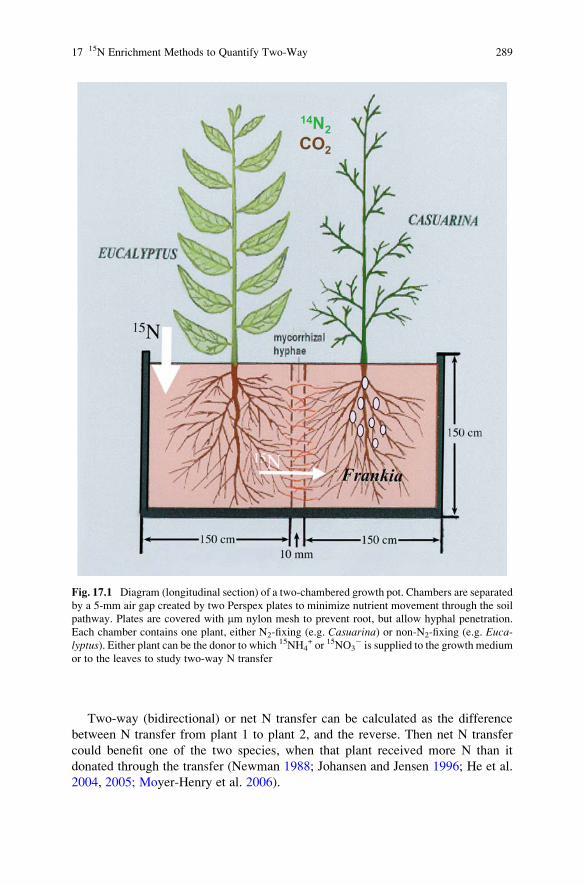
Two-way (bidirectional) or net N transfer can be calculated as the difference
between N transfer from plant 1 to plant 2, and the reverse. Then net N transfer
could benefit one of the two species, when that plant received more N than it
donated through the transfer (Newman 1988; Johansen and Jensen 1996; He et al.
2004, 2005; Moyer-Henry et al. 2006).
Fig. 17.1 Diagram (longitudinal section) of a two-chambered growth pot. Chambers are separated
by a 5-mm air gap created by two Perspex plates to minimize nutrient movement through the soil
pathway. Plates are covered with mm nylon mesh to prevent root, but allow hyphal penetration.
Each chamber contains one plant, either N2-fixing (e.g. Casuarina) or non-N2-fixing (e.g. Euca-lyptus). Either plant can be the donor to which 15NH4
+ or 15NO3� is supplied to the growth medium
or to the leaves to study two-way N transfer
17 15N Enrichment Methods to Quantify Two-Way 289
17.3.1.1 Comments
The 15N enrichment or labeling method has been widely used to investigate N
transfer between plants (Stern 1993; Chalk 1998; He et al. 2003). However, the
addition of 15N to quantify N-transfer has limitations, especially in fertile soils.
Compared to the large volume of soil N, which is available to plants along with the
additional 15N-labeled N, the amount of N transferred from the N-donor to the
N-receiver may be much less than the amount of N taken up from the soil. Also, root
depth and pattern of N uptake of the N-receiver may be dissimilar in mixed species
and single species situations, which may cause the ratio of unlabeled-to-labeled N
to be different in such growth systems. Either can invalidate the assumptions for
estimating N transfer.
Furthermore, the above experimental design and calculations to study two-way
or net N transfer are based on separate, reciprocal, experiments — one where 15N is
applied to plant 1, another where 15N is applied to plant 2. A more accurate
detection of net N transfer would be to use dual isotopes so that concurrent N
transfer could be investigated in a single experiment. Obviously, 15N is not suitable,
since no technique is available to distinguish the side from which the detected 15N
comes. One possible method is to supply the stable isotope of 15N to one plant and
the radioactive isotope of 13N to another, but the short half-life time (10 min) of 13N
may not be suitable for tracing N translocation in long-term plant and/or fungal
biological processes (Knowles and Blackburn 1993).
17.4 Conclusions
Both 15N enrichment and 15N natural abundance have been employed to study N
transfer between plants linked by mychorrhizal networks. By tracing translocation
of external high-enriched 15N from one plant to another over short-term periods
(days to weeks), the above experimental design allows a two-way or net N transfer
through CMNs to be investigated by the 15N enrichment method. Considering that
N movement is crucial in most terrestrial ecosystems (Vitousek et al. 1997; Moffat
1998; Sanchez 2002; Graham and Vance 2003; Nosengo 2003), and that the
potential benefits of N transfer are great, particularly in N-limited environments
(Chalk 1998; Sanchez 2002; Sprent, 2005; Forrester et al. 2006; Nara 2006), more
research is warranted on two-way N transfers mediated by mychorrhizal networks
with different species and under field conditions.
References
Chalk PM (1998) Dynamics of biologically fixed N in legume–cereal rotations: a review. Aust J
Agric Res 49:303–316
Faber BA, Zasoski RJ, Munns DN (1991) A method for measuring hyphal nutrient and water
uptake in mychorrhizal plants. Can J Bot 69:87–94
290 X.H. He et al.

Forrester DI, Bauhus J, Cowie AL, Vanclay JK (2006) Mixed-species plantations of Eucalyptuswith nitrogen-fixing trees: a review. For Ecol Manage 233:211–230
Frey B, Brunner I, Christie P, Wiemken A, Mader P (1998) the use of polytetrafluoroethylene
(PTFE) hydrophobic membranes to study transport of 15N by mycorrhiza hyphae. In: Varma A
(ed) Mycorrhizas manual. Springer, Berlin, pp 151–158
Giller KE, Ormesher J, Awah FM (1991) Nitrogen transfer from Phaseolus bean to intercropped
maize measured using 15N-enrichment and 15N-isotope dilution methods. Soil Biol Biochem
23:339–346
Graham PH, Vance CP (2003) Legumes: importance and constraints to greater use. Plant Physiol
131:872–877
Handley LL, Scrimgeour CM (1997) Terrestrial plant ecology and d15N natural abundance: the
present limits to interpretation for uncultivated systems with original data from a Scottish old
field. Adv Ecol Res 27:134–212
He XH, Critchley C, Bledsoe C (2003) Nitrogen transfer within and between plants through
common mychorrhizal networks (CMNs). Crit Rev Plant Sci 22:531–567
He XH, Critchley C, Ng H, Bledsoe CS (2004) Reciprocal N (15NH4+ or 15NO3
�) transfer betweennon-N2-fixing Eucalyptus maculata and N2-fixing Casuarina cunninghamiana linked by the
ectomychorrhizal fungus Pisolithus sp. New Phytol 163:629–640
He XH, Critchley C, Ng H, Bledsoe CS (2005) Nodulated N2-fixing Casuarina cunninghamiana isthe sink for net N transfer from non-N2-fixing Eucalyptus maculata via an ectomychorrhizal
fungus Pisolithus sp. supplied as ammonium nitrate. New Phytol 167:897–912
Hobbie JE, Hobbie EA (2006) 15N in symbiotic fungi and plants estimates nitrogen and carbon flux
rates in Arctic tundra. Ecology 87:816–822
Hogberg P (1997) 15N natural abundance in soil–plant systems. New Phytol 137:179–203
Hogh-Jensen H (2006) The nitrogen transfer between plants: an important but difficult flux to
quantify. Plant Soil 282:1–5
Johansen A, Jensen ES (1996) Transfer of N and P from intact or decomposing roots of pea to
barley interconnected by an arbuscular mychorrhizal fungus. Soil Biol Biochem 28:73–81
Knowles R, Blackburn TH (1993) Nitrogen isotope techniques. Academic Press, San Diego
Ledgard SF, Freney JR, Simpson JR (1985) Assessing nitrogen transfer from legumes to asso-
ciated grasses. Soil Biol Biochem 17:575–577
Mariotti A (1983) Atmospheric nitrogen is a reliable standard for natural 15N abundance measure-
ments. Nature 303:685–687
Moffat AS (1998) Global nitrogen overload problem grows critical. Science 279:988–989
Moyer-Henry KA, Burton JW, Israel D, Rufty T (2006) Nitrogen transfer between plants: a 15N
natural abundance study with crop and weed species. Plant Soil 282:7–20
Nara K (2006) Ectomychorrhizal networks and seedling establishment during early primary
succession. New Phytol 169:169–178
Newman EI (1988) Mychorrhizal links between plants: their functioning and ecological signifi-
cance. Adv Ecol Res 18:243–271
Nosengo N (2003) Fertilized to death. Nature 425:894–895
Sanchez PA (2002) Soil fertility and hunger in Africa. Science 295:2019–2020
Sprent J (2005) West African legumes: the role of nodulation and nitrogen fixation. New Phytol
167:326–330
SternWR (1993) Nitrogen fixation and transfer in intercropping systems. Field Crop Res 34:335–356
Tomm GO, van Kessel C, Slinkard AE (1994) Bi-directional transfer of nitrogen between alfalfa
and bromegrass: short and long term evidence. Plant Soil 164:77–86
Unkovich M, Pate J, McNeill A, Gibbs DJ (2001) Stable Isotope Techniques in the Study of
Biological Processes and Functioning of Ecosystems. Kluwer, Dordrecht
Vitousek PM, Aber JD, Howarth RW, Likens GE, Matson PA, Schindler DW, Schlesinger WH,
Tilman DG (1997) Human alteration of the global nitrogen cycle: sources and consequences.
Ecol Appl 7:737–750
17 15N Enrichment Methods to Quantify Two-Way 291
Chapter 18
Analyses of Ecophysiological Traits
of Tropical Rain Forest Seedlings Under
Arbuscular Mycorrhization: Implications
in Ecological Restoration
Javier Alvarez-Sanchez, Irene Sanchez-Gallen, and Patricia Guadarrama
18.1 Introduction
Deforestation is one of the greatest problems in terms of environmental deteriora-
tion, especially in tropical rain forests, given the possibility of their disappearance
(Dirzo and Raven 2003).
The causes of deforestation are primarily anthropogenic, including forest exploi-
tation, clearing for crop and livestock use, and the development of urban infrastruc-
ture, among others (Geist and Lambin 2001, 2002). Socio-economic factors such as
land ownership inequality and livestock subsidies have been key factors in land use
and deforestation changes for 50 years in Mexico, as in many other developing
countries (Masera et al. 1997).
The tropical rain forest is losing forest coverage at a rate of 2% annually (Masera
et al. 1997), which has contributed to an increase in carbon emissions and led to
reduced carbon sequestering. This is very important considering that a Mexican rain
forest stores an estimate of 60% of C in soil and constitutes 37% of net primary
production (Hughes et al. 2000).
18.1.1 Fragmentation
Fragmentation is the direct result of the deforestation process, and can increase
population mortalities and reduce reproduction rates (Fahring 2003). Pollinator and
seed disperser populations are reduced and, thus, the presence of some species in
the seedling bank (Benıtez-Malvido and Martınez-Ramos 2003). Light, heat, and
J. Alvarez-Sanchez (*), I. Sanchez-Gallen, and P. Guadarrama
Departamento de Ecologıa y Recursos Naturales, Facultad de Ciencias, Universidad NacionalAutonoma de Mexico. Circuito Exterior, Ciudad Universitaria, 04510 Mexico, D.F
e-mail: [email protected]
A. Varma and A.C. Kharkwal (eds.), Symbiotic Fungi, Soil Biology 18, 293
DOI: 10.1007/978‐3‐540‐95894‐9_18, # Springer‐Verlag Berlin Heidelberg 2009

wind exposure can also be increased, which can cause tree damage or death
(Laurance et al. 2000; Benıtez-Malvido and Martınez-Ramos 2003).
These changes also produce alterations in soil microbiota, of which one of the
most important components are the mycorrhiza-forming fungi and nitrogen-fixing
bacteria. Hart and Reader (2004) observed that the arbuscular mycorrhizal fungi of
the suborder Gigasporineae were significantly less affected by soil disturbance than
Glomineae, considering root colonization and spore density.
18.1.2 Restoration
One of the principal objectives of restoration programs should be the facilitation of
system function reestablishment, maintaining long-term stability. This could re-
quire the restoration of soils using a native microbiotic community (Haselwandter
1997; Requena et al. 2001), especially arbuscular mycorrhizal fungi which allow
soil retention by forming aggregates and retaining organic material. This improves
soil structure and reduces or prevents water and wind erosion, along with their
respective nutrient loss (Jasper 1994; Haselwandter 1997).
Facing rapid rain forest deterioration, restoration ecology practices are extremely
necessary as they allow ecosystem recuperation. Restoration ecology is defined as a
process where the objective is to recuperate one or more ecosystem functions
or attributes. This allows the recuperation of species composition as well as their
interactions and relationships until a close resemblance to the original community is
obtained (SER 2004; Hobbs 2005). Restoration is based on successional models
in order to reconstruct the abiotic environment, and, in turn, helping natural succes-
sion processes and a return to the original system conditions (Suding et al. 2004).
In the tropical rain forest, regeneration and succession occur naturally due to
the life histories of the species, which are adaptive responses to environmental
conditions. Light-demanding species (pioneers) occupy the first successional stages,
grow in high light environments, have rapid growth rates, producemany small fruits,
and can have invasive growth patterns and low herbivore defense capacities. Shade-
tolerant species (late successional) have slower growth rates, produce larger fruits in
smaller quantities, develop more herbivore defense and can form seedling banks
(Martınez-Ramos 1994). Other species traits are shown in Table 18.1.
18.1.3 What is the Role of Arbuscular Mycorrhizal Fungiin Habitat Recovery?
In the last decade, the use of arbuscular mycorrhizal fungi (AMF) as an additional
tool in restoration has been proved to be effective. Maintaining or reestablishing
a native community of these fungi can contribute to the recuperation of some soil
properties (Allen et al. 2003).
294 J. Alvarez-Sanchez et al.
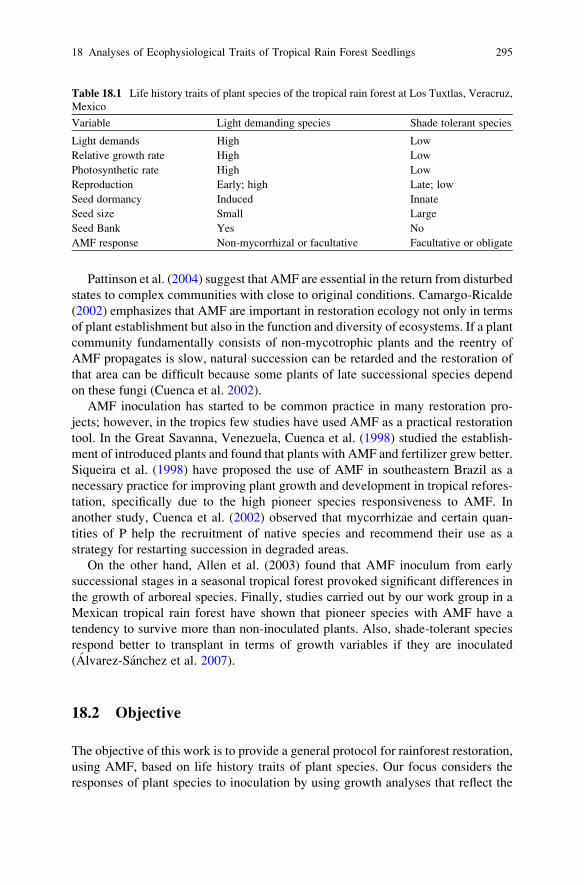
Pattinson et al. (2004) suggest that AMF are essential in the return from disturbed
states to complex communities with close to original conditions. Camargo-Ricalde
(2002) emphasizes that AMF are important in restoration ecology not only in terms
of plant establishment but also in the function and diversity of ecosystems. If a plant
community fundamentally consists of non-mycotrophic plants and the reentry of
AMF propagates is slow, natural succession can be retarded and the restoration of
that area can be difficult because some plants of late successional species depend
on these fungi (Cuenca et al. 2002).
AMF inoculation has started to be common practice in many restoration pro-
jects; however, in the tropics few studies have used AMF as a practical restoration
tool. In the Great Savanna, Venezuela, Cuenca et al. (1998) studied the establish-
ment of introduced plants and found that plants with AMF and fertilizer grew better.
Siqueira et al. (1998) have proposed the use of AMF in southeastern Brazil as a
necessary practice for improving plant growth and development in tropical refores-
tation, specifically due to the high pioneer species responsiveness to AMF. In
another study, Cuenca et al. (2002) observed that mycorrhizae and certain quan-
tities of P help the recruitment of native species and recommend their use as a
strategy for restarting succession in degraded areas.
On the other hand, Allen et al. (2003) found that AMF inoculum from early
successional stages in a seasonal tropical forest provoked significant differences in
the growth of arboreal species. Finally, studies carried out by our work group in a
Mexican tropical rain forest have shown that pioneer species with AMF have a
tendency to survive more than non-inoculated plants. Also, shade-tolerant species
respond better to transplant in terms of growth variables if they are inoculated
(Alvarez-Sanchez et al. 2007).
18.2 Objective
The objective of this work is to provide a general protocol for rainforest restoration,
using AMF, based on life history traits of plant species. Our focus considers the
responses of plant species to inoculation by using growth analyses that reflect the
Table 18.1 Life history traits of plant species of the tropical rain forest at Los Tuxtlas, Veracruz,
Mexico
Variable Light demanding species Shade tolerant species
Light demands High Low
Relative growth rate High Low
Photosynthetic rate High Low
Reproduction Early; high Late; low
Seed dormancy Induced Innate
Seed size Small Large
Seed Bank Yes No
AMF response Non-mycorrhizal or facultative Facultative or obligate
18 Analyses of Ecophysiological Traits of Tropical Rain Forest Seedlings 295
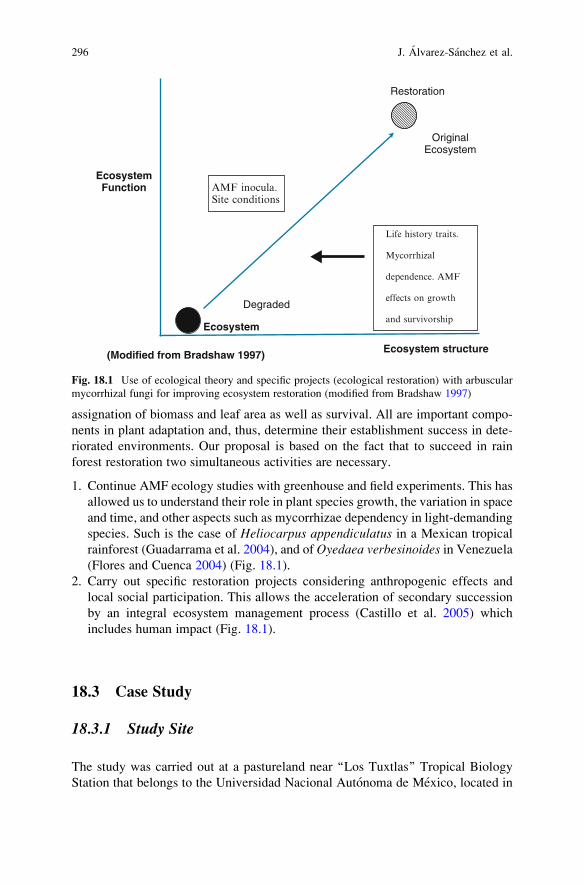
assignation of biomass and leaf area as well as survival. All are important compo-
nents in plant adaptation and, thus, determine their establishment success in dete-
riorated environments. Our proposal is based on the fact that to succeed in rain
forest restoration two simultaneous activities are necessary.
1. Continue AMF ecology studies with greenhouse and field experiments. This has
allowed us to understand their role in plant species growth, the variation in space
and time, and other aspects such as mycorrhizae dependency in light-demanding
species. Such is the case of Heliocarpus appendiculatus in a Mexican tropical
rainforest (Guadarrama et al. 2004), and of Oyedaea verbesinoides in Venezuela(Flores and Cuenca 2004) (Fig. 18.1).
2. Carry out specific restoration projects considering anthropogenic effects and
local social participation. This allows the acceleration of secondary succession
by an integral ecosystem management process (Castillo et al. 2005) which
includes human impact (Fig. 18.1).
18.3 Case Study
18.3.1 Study Site
The study was carried out at a pastureland near ‘‘Los Tuxtlas’’ Tropical Biology
Station that belongs to the Universidad Nacional Autonoma de Mexico, located in
Degraded
Restoration
OriginalEcosystem
Life history traits.
Mycorrhizal
dependence. AMF
effects on growth
and survivorship
AMF inocula.Site conditions
EcosystemFunction
Ecosystem
Ecosystem structure(Modified from Bradshaw 1997)
Fig. 18.1 Use of ecological theory and specific projects (ecological restoration) with arbuscular
mycorrhizal fungi for improving ecosystem restoration (modified from Bradshaw 1997)
296 J. Alvarez-Sanchez et al.

Veracruz State SE, Mexico. The climate is classified as a humid warm tropical type
and has three slightly marked seasons, dry, rainy and nortes, with 4,725.2 mm of
total annual precipitation and 24.3�C of mean annual temperature (Garcıa 1988).
Soils of volcanic origin present few horizons, low concentrations of N, P and K,
Al and Mn toxicity, and Ca and Mg deficiency. The soils have a clayish-crumbly
texture with organic matter accumulations in the upper layers (from 1.64 to
11.11%); pH varies between 5.3 and 6.8. Cationic exchange capacity fluctuates
from 5.2 to 46.9 (Sommers–Cervantes et al. 2003). Original vegetation is a tropical
rainforest, with a mixture of patches in varying successional stages. On the other
hand, pastures used for cattle grazing, remnant and fruit trees characterize defor-
ested land.
18.3.2 Methods
We collected seed from various individuals of each selected species. They were
germinated in the greenhouse and inoculated when they reached a height of about
10 cm.
18.3.2.1 Transplant and Inoculation
To determine the quantity of spores for plant inoculation, ten samples of 100 g of
soil were obtained randomly from the rainforest. These samples were extracted
using the wet sifting and decanting method proposed by Gerdemann and Nicolson
(1963) and modified by Daniels and Skipper (1982). The samples were observed in
a stereoscopic microscope (5�); counting the quantity of spores present in the soil
determined the use of 150 spores per 200 g of soil. The root-dying technique of
Phillips and Hayman (1970) was used to determine the AMF percentage coloniza-
tion, which is important for monitoring the inoculation state at the beginning and
end of the experiment.
Two factors were analyzed: (1) mycorrhization [three levels: tropical rain forest
inoculum (TRF M+), pasture (P M+) and the control without inoculum (M�)], and
(2) type of soil [tropical rain forest (TRF) and pasture (P)]. For each factor we used
five repetitions for each treatment and each species. It is convenient to inoculate at
the beginning of the rainy season, which favors plant growth. After 3 months of
inoculation, we transplanted in two parcels abandoned for 6 months using a random
plot design.
We registered stem height, leaf area, stem, root, leaf, and total dry weight in the
initial harvest in December 2003. In the field, stem height and diameter (DS, 5 cm
from the soil surface) was measured along with survivorship. After 7 months in
the field, the final harvest was carried out. We measured leaf area (LA) (with a
Digital Image Analysis System, version 1.06), dry stem (S), root (R), leaf (L) and
total (TDW) weight (after placing them in an oven for a minimum of 72 h at
18 Analyses of Ecophysiological Traits of Tropical Rain Forest Seedlings 297

70�C). We also calculated root/shoot ratio (R/S), leaf area ratio (LAR), specific leaf
area (SLA), net assimilation rate (NAR) and relative growth rate (RGR) (Hunt
1982):
Dry leaf weight L; g
Dry stem weight S; g
Total dry weight TDW; g
TDW = R + S + L*
Relative growth rate RGR; g g�1 day�1
RGR ¼ lnðTDW2Þ � lnðTDW1Þð ÞT2 � T1
**
Leaf area ratio LAR; cm2 g�1
LAR = LA/TDW ***
Specific leaf area SLA; cm2 g�1; SLA = LA/L
Net assimilation rate NAR; g cm�2 day�1
NAR ¼ TDW2 � TDW1
T2 � T1
� �log LA2 � log LA1
LA2 � LA1
� �****
*R = dry root weight (this measurement was not taken into account in the field
work)
**T1 = initial day, T2 = final day.
***Where LA = leaf area; cm2
****TDW2 and TDW1 correspond to initial total dry weight and final total dry
weight, respectively; T1 = initial day, T2 = final day; LA2 and LA1 correspond to
initial and final leaf area, respectively.
18.3.3 Results
18.3.3.1 Growth Analysis
In this chapter we present only RGR in height and biomass and survival.
In light-demanding species, mean RGRheight varied between 0.0032 and 0.0042
cm cm�1 day�1, while shade-tolerant species varied between 0.0022 and 0.0025 cm
cm�1 day�1 (Fig. 18.2). There were significant differences between species
(p < 0.001), and the interaction soil � AMF � species was also significant
(p < 0.027) where Heliocarpus appendiculatus height, growing without mycor-
rhizae and in tropical rain forest soil, was significantly different from the other
interactions.
298 J. Alvarez-Sanchez et al.

RGRbiomass fluctuated between 0.0093 and 0.0129 g g�1 day�1 for light-demand-
ing species, while for shade-tolerant species t fluctuated from 0.0014 to 0.0059
g g�1day�1 (Fig. 18.3). Significant differences for all factors were registered: soil
(p < 0.002), AMF (p < 0.027), species (p < 0.001). In this case, Heliocarpusdonnellsmithii was the one with the highest growth rate, and all interactions were
significant: soil � AMF (p < 0.001) being the soil from pastureland without AMF
the interaction with the lowest values of RGR based on biomass, soil � species
(p < 0.001), species � AMF (p < 0.001), soil � AMF � species (p < 0.001). The
interaction Ficus yoponensis � TRF soil � M + presented the highest growth rate,
and it was significantly different from all shade-tolerant species growing in
pastureland soil without AMF.
18.3.3.2 Survivorship
Survival percentage rates were between 19 and 51% for light-demanding species;
survivorship curve comparisons are showed in Table 18.2. For shade-tolerant
species survival percentages were between 20 and 33%, and survivorship curve
comparisons are showed in Table 18.3.
18.3.4 Remarks
In general, RGR based on height or biomass, and survivorship values were higher
for pioneer species than for shade-tolerant ones. All species suffered a high
mortality, mainly because of the dry season and the transplanting.
It is very interesting that in most species, the treatment with the highest RGR
response was not highest for survivorship. This probably has to do with the idea of
resource allocation: one individual can not allocate all resources to just one of its
functions, and certain functions always receive more resources. When resources are
allocated to height or biomass, survival is disadvantaged and vice versa.
Most species, independently of their life history traits, clearly improved their
growth or survivorship in tropical rain forest soil compared with pastureland,
which can probably be explained by soil quality. Quality implies a better structure
and a higher AMF diversity, etc. The former result is supported by the hypothesis
that AMF determine aboveground diversity (van der Heijden et al. 1998;
Klironomos et al. 2000; Hart and Klironomos 2002; van der Heijden 2002) and
every forest plant species depends on certain fungi species that are only found in
forest soil.
Grouping species by life history traits was insufficient because some of the
plant species broke with these classifications. We expected low growth rates and
higher response to AMF for shade-tolerant species, but we found that Ficusyoponensis and F. insipida did not respond in that way; whereas we supposed
that pioneer species would have high growth rates and low response to AMF, but
18 Analyses of Ecophysiological Traits of Tropical Rain Forest Seedlings 299
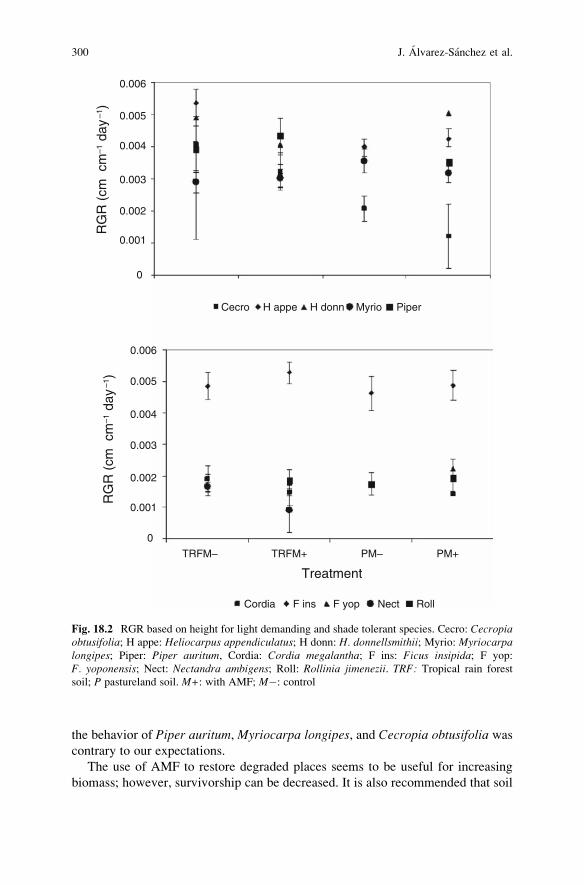
the behavior of Piper auritum, Myriocarpa longipes, and Cecropia obtusifolia was
contrary to our expectations.
The use of AMF to restore degraded places seems to be useful for increasing
biomass; however, survivorship can be decreased. It is also recommended that soil
0.006
0
H appe PiperMyrioH donnCecro
RG
R (
cm c
m–1
day
–1)
0.002
0.003
0.001
0.004
0.005
PM– PM+TRFM+TRFM–
Treatment
RollNectF yopF insCordia
0.001
RG
R (
cm c
m–1
day
–1)
0.006
0.005
0.004
0.003
0.002
0
Fig. 18.2 RGR based on height for light demanding and shade tolerant species. Cecro: Cecropiaobtusifolia; H appe: Heliocarpus appendiculatus; H donn: H. donnellsmithii; Myrio: Myriocarpalongipes; Piper: Piper auritum, Cordia: Cordia megalantha; F ins: Ficus insipida; F yop:
F. yoponensis; Nect: Nectandra ambigens; Roll: Rollinia jimenezii. TRF: Tropical rain forest
soil; P pastureland soil. M+: with AMF; M�: control
300 J. Alvarez-Sanchez et al.

from sites where the study species grow naturally is used. In this study, pioneer
species survived more than shade-tolerant species.
Mycorrhizal inoculation has the potential to help establish seedlings in defor-
ested sites (Onguene and Kuyper 2005). The increase in height growth with AMF
and the mycorrhizal dependence of H. appendiculatus (Guadarrama et al. 2004)
reinforce the evidence that AMF can favor pioneer growth.
0.025
0
0
H. app
RollNectandraF. yop
Treatment
PM– PM+TRFM+TRFM–
F. insCordia
PiperMyrioH. donnCecropia
RG
R (
g g
–1da
y –1
)R
GR
(g
g –1
day
–1)
0.025
0.02
0.015
0.01
0.005
–0.01
–0.005
0.005
0.01
0.015
0.02
Fig. 18.3 RGR based on biomass for light demanding and shade tolerant species. Cecropia:
Cecropia obtusifolia; H. app: Heliocarpus appendiculatus; H. donn: H. donnellsmithii; Myrio:
Myriocarpa longipes; Piper: Piper auritum, Cordia: Cordia megalantha; F. ins: Ficus insipida; F.yop: F. yoponensis; Nectandra: Nectandra ambigens; Roll: Rollinia jimenezii. TRF: tropical rainforest soil; P: pastureland soil. M+: with AMF; M�: control
18 Analyses of Ecophysiological Traits of Tropical Rain Forest Seedlings 301
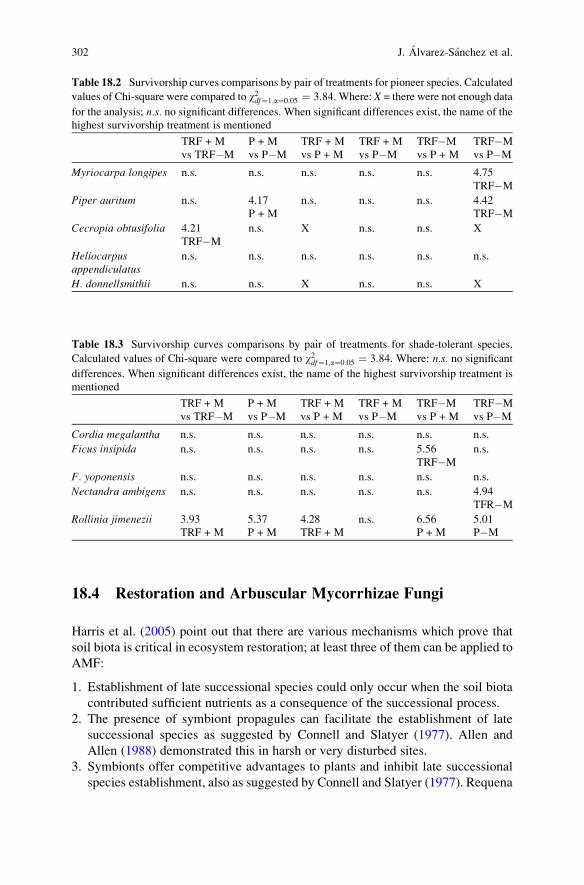
18.4 Restoration and Arbuscular Mycorrhizae Fungi
Harris et al. (2005) point out that there are various mechanisms which prove that
soil biota is critical in ecosystem restoration; at least three of them can be applied to
AMF:
1. Establishment of late successional species could only occur when the soil biota
contributed sufficient nutrients as a consequence of the successional process.
2. The presence of symbiont propagules can facilitate the establishment of late
successional species as suggested by Connell and Slatyer (1977). Allen and
Allen (1988) demonstrated this in harsh or very disturbed sites.
3. Symbionts offer competitive advantages to plants and inhibit late successional
species establishment, also as suggested by Connell and Slatyer (1977). Requena
Table 18.2 Survivorship curves comparisons by pair of treatments for pioneer species. Calculated
values of Chi-square were compared to w2df¼1;a¼0:05 ¼ 3:84. Where: X = there were not enough data
for the analysis; n.s. no significant differences. When significant differences exist, the name of the
highest survivorship treatment is mentioned
TRF + M
vs TRF�M
P + M
vs P�M
TRF + M
vs P + M
TRF + M
vs P�M
TRF�M
vs P + M
TRF�M
vs P�M
Myriocarpa longipes n.s. n.s. n.s. n.s. n.s. 4.75
TRF�M
Piper auritum n.s. 4.17
P + M
n.s. n.s. n.s. 4.42
TRF�M
Cecropia obtusifolia 4.21
TRF�M
n.s. X n.s. n.s. X
Heliocarpusappendiculatus
n.s. n.s. n.s. n.s. n.s. n.s.
H. donnellsmithii n.s. n.s. X n.s. n.s. X
Table 18.3 Survivorship curves comparisons by pair of treatments for shade-tolerant species.
Calculated values of Chi-square were compared to w2df¼1;a¼0:05 ¼ 3:84. Where: n.s. no significant
differences. When significant differences exist, the name of the highest survivorship treatment is
mentioned
TRF + M
vs TRF�M
P + M
vs P�M
TRF + M
vs P + M
TRF + M
vs P�M
TRF�M
vs P + M
TRF�M
vs P�M
Cordia megalantha n.s. n.s. n.s. n.s. n.s. n.s.
Ficus insipida n.s. n.s. n.s. n.s. 5.56
TRF�M
n.s.
F. yoponensis n.s. n.s. n.s. n.s. n.s. n.s.
Nectandra ambigens n.s. n.s. n.s. n.s. n.s. 4.94
TFR�M
Rollinia jimenezii 3.93
TRF + M
5.37
P + M
4.28
TRF + M
n.s. 6.56
P + M
5.01
P�M
302 J. Alvarez-Sanchez et al.

et al. (2001) showed that AMF and nitrogen-fixing bacteria caused what they
called trophic barriers in experiments in semi-arid Mediterranean ecosystems.
The use of AMF in restoration practices should be seen as an element of
ecosystem management. Harris et al. (2005) mentioned that introducing pathogen
spores could promote plant diversity; thus the manipulation of organic material or
physical soil condition, including fertilizer addition, is not sufficient. However,
Maluf de Souza and Ferreira (2004) found that plant community composition and
structure changes can depend on forest age and structure. Lekberg and Koide (2005)
found that mycorrhizal fungi colonization is affected by agricultural practices.
Cuenca and Lovera (1992) demonstrated that AMF-inoculate recuperation aug-
mented the colonization of native plants in reclamation programs in nutrient-poor
areas. However, the response of plant species to AMF inoculate in degraded areas
depends on the cost of maintaining the mutual association, principally of the plant
in accordance with the trade-offs and life history traits. Hart and Reader (2004)
results, where plant biomass and AMF were positively correlated, and Alvarez-
Sanchez et al. (2007) with divergent responses, point in this direction.
However, for a tropical rain forest such as that on the eastern coast of Mexico, it
is possible to make generalizations about native AMF inoculum use as a favorable
response in survival and growth factor is expected.
18.5 Conclusions
Finally, restoration success evaluation depends on long-term monitoring of plant and
AMF community responses. Because of their fragmented landscapes, tropical rain-
forests with high connectivity are appropriate for reforestation programs (Herault et al.
2005). Patterson and Alvarez-Sanchez (unpublished data) have recently discovered
that the restorationwith fragment edges withPleurantodendron lindenii and Pimentadioica is possible and that the use of inoculum from distinct (small or large)
rainforest patches creates a highly complex interaction plant-inoculum.
Acknowledgements This study includes results financed by DGAPA Project IN205599 and
SEMARNAT-CONACYT 2002-c01-668. We thank Oswaldo Nunez, Diego Olivera, Alejandro
Astudillo and Gabriela Santibanez for their support in greenhouse and field experiments. We
especially thank Audra Patterson for her valuable comments.
References
Allen EB, Allen M (1988) Facilitation of succession by the nonmycotrophic colonizer Salsola kalion a harsh site: effects of mycorrhizal fungi. Am J Bot 75:257–266
Allen EB, Allen MF, Egerton-Warburton L, Corkidi L, Gomez-Pompa A (2003) Impacts of early- and
late-seralmycorrhizae during restoration in seasonal tropical forest,Mexico. EcolAppl 13:1701–1717
18 Analyses of Ecophysiological Traits of Tropical Rain Forest Seedlings 303

Alvarez-Sanchez J, Guadarrama P, Sanchez-Gallen I, Olivera D (2007) Restauracion de ambientes
deteriorados derivados de la selva humeda: el uso de los hongos micorrizogenos arbusculares.
Bol Soc Bot Mex 80(Suppl.):59–68
Benıtez-Malvido J, Martınez-Ramos M (2003) Impact of forest fragmentation on understory plant
species richness in Amazonia. Conserv Biol 17:389–400
Bradshaw A (1997) Restoration of mined lands: using natural processes. Ecol Eng 8:255–269
Camargo-Ricalde SL (2002) Dispersal, distribution and establishment of arbuscular mycorrhizal
fungi: a review. Bol Soc Bot Mex 71:33–44
Castillo A, Magana MA, Pujadas A, Martınez L, Godınez C (2005) Understanding rural people
interaction with ecosystems: a case study in a tropical dry forest of Mexico. Ecosystems 8:
630–643
Connell JH, Slatyer RO (1977) Mechanisms of succession in natural communities and their role in
community stability and organization. Am Nat 111:1119–1144
Cuenca G, Lovera M (1992) Vesicular-arbuscular mycorrhizae in disturbed and revegetated sites
from la Gran Sabana, Venezuela. Can J Bot 70:73–79
Cuenca G, de Andrade Z, Escalante G (1998) Arbuscular mycorrhizae in the rehabilitation of
fragile degraded tropical lands. Biol Fertil Soil 26:107–111
Cuenca G, de Andrade Z, Lovera M, Fajardo L, Meneses E, Marquez M, Machuca R (2002) El uso
de arbustos nativos micorrizados para la rehabilitacion de areas degradadas de la Gran Sabana,
estado Bolıvar, Venezuela. Interciencia 27:165–172
Daniels HBA, Skipper HD (1982) Methods for the recovery and quantitative estimation of
propagules from soil. In: Schenck NC (ed) Methods and principles of mycorrhiza research.
American Society for Phytopathology, St. Paul, Minnesota, pp 29–37
Dirzo R, Raven P (2003) Global state of biodiversity and loss. Ann Rev Environ Resource 28:
137–167
Fahring L (2003) Effects of habitat fragmentation on biodiversity. Ann Rev Ecol Evol Syst
34:487–515
Flores C, Cuenca G (2004) Crecimiento y dependencia micorrızica de la especie pionera y
polenectarıfera Oyedaea verbesinoides (Tara Amarilla), Asteraceae. Interciencia 29(11):
632–637
Garcıa MC (1988) Lanscape ecological approach for forest conservation. A case in Los Tuxtlas,
Veracruz, Mexico. Graduate Thesis. International Institute for Aerospace Survey and Earth
Sciences (ITC), Enschede, Netherlands
Geist HJ, Lambin E (2001) What drives tropical deforestation? A meta-analysis of proximate and
underlying causes of deforestation based on sub national case study evidence, LUCC report
series No. 4. CIACO Printshop, Belgium.
Geist HJ, Lambin E (2002) Proximate causes and underlying driving forces a nonrenewable
resource. Science 177:762–765
Gerdemann JW, Nicolson TH (1963) Spores of mycorrhizal Endogone species extracted from soil
by wet sieving and decanting. Trans Br Myc Soc 46:235–244
Guadarrama P, Alvarez-Sanchez FJ, Estrada-Torres A (2004) Phosphorus dependence in seedlings
of a tropical pioneer tree: The role of arbuscular mycorrhizae. J Plant Nut 27:1–6
Harris JA, Grogan P, Hobbs RJ (2005) Restoration ecology and the role of soil biodiversity. In:
Bardgett RD, Usher MB, Hopkins DW (eds) Biological diversity and function in soils. Cam-
bridge University Press, Cambridge, pp 319–342
Hart MM, Klironomos JN (2002) Diversity of Arbuscular Micorrhizal fungi and Ecosystem
functioning. In: Van der Heijden MGA, Sanders IR (eds) Mycorhizal ecology. Springer,
Berlin, pp 225–242
Hart MM, Reader RJ (2004) Do arbuscular mycorrhizal fungi recover from soil disturbance
differently? Trop Ecol 45:97–111
Haselwandter K (1997) Soil micro-organisms, mycorrhiza and restoration ecology. In: Urbanska
KM, Webb NR, Edwards PJ (eds) Restoration ecology and sustainable development, Cam-
bridge University Press, Cambridge, pp 65–80
304 J. Alvarez-Sanchez et al.

Herault B, Honnay O, Thoen D (2005) Evaluation of the ecological restoration potential of plant
communities in Norway spruce plantations using a life-trait-based approach. J Appl Ecol
42:536–545
Hobbs RJ (2005) The future of restoration ecology: Challenges and opportunities. Res Ecol
13:239–241
Hughes RF, Kauffman JB, Jaramillo V (2000) Ecosystem-scale impacts of deforestation and land
use in a tropical region of Mexico. Ecol Appl 10:515–527
Hunt R (1982) Plant growth analysis. Natural Environment Research Council, London
Jasper DA (1994) Management of mycorrhizae in revegetation. In: Robson AD, Abbott LJ,
Malajczuk N (eds) Management of mycorrhizas in agriculture, horticulture and forestry.
Kluwer, Dordrecht, pp 211–220
Klironomos JN, McCune J, Hart M, Neville J (2000) The influence of arbuscular mycorrhizae on
the relationship between plant diversity and productivity. Ecol Lett 3:137–41
Laurance WF, Delamonica P, Laurance S, Basconcelos H, Lovejoy T (2000) Rainforest fragmen-
tation kills big trees. Nature 428:171–175
Lekberg Y, Koide RT (2005) Is plant performance limited by abundance of arbuscular mycorrhizal
fungi? A meta-analysis of studies published between 1988 and 2003. New Phytol 168:189–204
Maluf de Souza F, Ferreira BJL (2004) Restoration of seasonal semi deciduous forests in Brazil:
influence of age and restoration design on forest structure. For Ecol Man 191:185–200
Martınez-Ramos M (1994) Regeneracion natural y diversidad de especies arboreas en selvas
humedas. Bol Soc Bot Mex 54:179–224
Masera OR, Ordonez MJ, Dirzo R (1997) Carbon emissions from Mexican forests: current
situation and long-term scenarios. Climatic Change 35:265–295
Onguene NA, Kuyper TW (2005) Growth response of three native timber species to soils with
different arbuscular mycorrhizal inoculum potentials in South Cameroon: Indigenous inocu-
lum and effect of addition of grass inoculum. Forest Ecol Manag 210:283–290
Pattinson GS, Hammil KA, Sutton BG, Mcgee PA (2004) Growth and survival of seedlings of
native plants in an impoverished and highly disturbed soil following inoculation with arbus-
cular mycorrhizal fungi. Mycorrhiza 14:339–346
Phillips JM, Hayman DS (1970) Improved procedures for clearing roots staining parasitic and
vesicular-arbuscular mycorrhizal fungi for rapid assessment of infection. Trans Brit Myc Soc
55:159–161
Requena N, Perez-Solis E, Azcon-Aguilar C, Jeffries P, Barea JM (2001) Management of indige-
nous plant-microbe symbioses aids restoration of desertified ecosystems. Appl Env Microbiol
67:495–498
SER Society for Ecological Restoration International Science & Policy Working Group (2004)
The SER Primer on Ecological Restoration. http://www.ser.org. Cited 22 Dec 2008
Siqueira JO, Carneiro MAC, Curi N, da Silva RSC, Davide AC (1998) Mycorrhizal colonization
and mycotrophic growth of native woody species as related to successional groups in South-
eastern Brazil. Forest Ecol Manag 107:241–252
Sommer-Cervantes I, Flores-Delgadillo L, Gutierrez-Ruiz M (2003) Caracterizacion de los suelos
de la Estacion de Biologıa Tropical Los Tuxtlas. In: Alvarez-Sanchez FJ, Naranjo-Garcıa E
(eds) Ecologıa del suelo en la selva tropical humeda de Mexico. Instituto de Ecologıa, A. C.,
Mexico, pp 17–67
Suding KN, Gross KL, Houseman GR (2004) Alternative states and positive feedbacks in
restoration ecology. Trend Ecol Evol 19:46–53
van der Heijden MGA (2002) Arbuscular Mycorrhizal Fungi as a determinant of plant diversity: In
search for underlying mechanisms and general principals. In: van der Heijden MGA, Sanders
IR (eds) Mycorhizal ecology. Springer, Berlin
van der Heijden MGA, Klironomos JN, Ursic M, Moutoglis P, Streitwolf-Engel R, Boller T,
Wiemken A, Sanders IR (1998) Mycorrhizal fungal diversity determines plant biodiversity,
ecosystem variability and productivity. Nature 396:69–72
18 Analyses of Ecophysiological Traits of Tropical Rain Forest Seedlings 305

Chapter 19
Techniques for Arbuscular Mycorrhiza
Inoculum Reduction
Isabel Brito, Mario de Carvalho, and Michael J Goss
19.1 Introduction
It is well-established that arbuscular mycorrhizal (AM) fungi can play a significant
role in sustainable crop production and environmental conservation. With the
increasing awareness of the ecological significance of mycorrhizas and their diver-
sity, research needs to be directed away from simple records of their occurrence or
casual speculation of their function (Smith and Read 1997). Rather, the need is for
empirical studies and investigations of the quantitative aspects of the distribution of
different types and their contribution to the function of ecosystems.
There is no such thing as a fungal effect or a plant effect, but there is an
interaction between both symbionts. This results from the AM fungi and plant
community size and structure, soil and climatic conditions, and the interplay
between all these factors (Kahiluoto et al. 2000). Consequently, it is readily
understood that it is the problems associated with methodology that limit our
understanding of the functioning and effects of AM fungi within field communities.
Given the ubiquitous presence of AM fungi, a major constraint on the evaluation
of the activity of AM colonization has been the need to account for the indigenous
soil native inoculum. This has to be controlled (i.e. reduced or eliminated) if we are
to obtain a true control treatment for analysis of AM in natural substrates. There are
various procedures possible for achieving such an objective, and the purpose of this
chapter is to provide details of a number of techniques and present some evaluation
of their advantages and disadvantages.
Although there have been a large number of experiments to investigate the
effectiveness of different sterilization procedures for reducing pathogenic soil
I. Brito (*) and M. de Carvalho
Universidade de Evora, ICAM, Apartado 94, 7002 ‐ 554 Evora, Portugal
e-mail: [email protected]
M.J. GossKemptville College, University of Guelph, Kemptville, Ontario K0G 1J0, Canada
A. Varma and A.C. Kharkwal (eds.), Symbiotic Fungi, Soil Biology 18, 307
DOI: 10.1007/978‐3‐540‐95894‐9_19, # Springer‐Verlag Berlin Heidelberg 2009

fungi, little information is available on their impact on beneficial organisms such as
AM fungi. Furthermore, some of the techniques have been shown to affect physical
and chemical soil characteristics as well as eliminate soil microorganisms that can
interfere with the development of mycorrhizas, and this creates difficulties in the
interpretation of results simply in terms of possible mycorrhizal activity.
An important subject is the differentiation of methods that involve sterilization
from those focused on indigenous inoculum reduction. Soil sterilization aims to
destroy or eliminate microbial cells while maintaining the existing chemical and
physical characteristics of the soil (Wolf and Skipper 1994). Consequently, it is
often used for experiments focused on specific AM fungi, or to establish a negative
control in some other types of study. In contrast, the purpose of inoculum reduction
techniques is to create a perturbation that will interfere with mycorrhizal formation,
although not necessarily eliminating any component group within the inoculum.
Such an approach allows the establishment of different degrees of mycorrhizal
formation between treatments and the study of relative effects.
Frequently the basic techniques used to achieve complete sterilization or just an
inoculum reduction may be similar, but the desired outcome is accomplished by
adjustments of the dosage or intensity of the treatment. The ultimate choice of
methodology for establishing an adequate non-mycorrhizal control depends on the
design of the particular experiments, the facilities available and the amount of soil
requiring treatment.
19.2 Solarization
Solarization is the process of heating soil by covering the land with clear plastic. It
is used mainly for control of weeds and plant diseases in regions receiving high
levels of solar radiation. In the appropriate climatic regions, a layer of clear plastic
film is generally applied to the soil prior to planting and is left in place for 4–6
weeks during the hottest part of the year. Because solarization is a hydrothermal
process, its success also depends on appropriate levels of moisture to achieve
maximum heat transfer.
Schreiner et al. (2001) reported an increase in the average daily soil temperature
of 6–10�C and a maximum daily temperature between 10 and 16�C at 5–20 cm
depth. Al-Momani et al. (1988) reported that solarization led to the complete
elimination of endomycorrhizal fungi at 10 and 20 cm soil depths, whereas Afek
et al. (1991) reported mycorrhizal colonization of cotton roots still occurred after
soil solarization.
Bendavid-Val et al. (1997) recognized the uncertainty around whether AM fungi
can or cannot survive solarization treatments and developed an extensive study on
the subject. Field experiments were carried out in loamy sand and a silt soil. In both
cases the presence of indigenous AM fungal populations was investigated using
the most probable number (MPN) method. Indigenous fungal populations were
reduced to zero after 2 or 4 weeks of solarization treatments; however the Glomus
308 I. Brito et al.

intraradices introduced into the field was not affected, probably due to its toleranceof changing environmental conditions. The dramatic reduction in the number of
infective propagules of sensitive species was found to be more pronounced in the
upper soil layers then in lower ones. In both experiments, plants (wheat, onion and
carrot) sown on solarized plots were colonized within 5 or 6 weeks after emergence.
The authors suggested that some of the AM inoculum potential in the soil was in the
form of hyphae and was thus particularly sensitive to the high temperatures
developed during the solarization treatments; a longer time was required for the
few remaining propagules (many as spores) to colonize plant roots. They also
concluded that the effect of solarization varied according to AM fungal species,
inoculum form, density and host crop together with the duration of solarization.
Schreiner et al. (2001) monitored the infectivity of AM fungi before and after solari-
zation of two fields using a greenhouse bioassay with Sorghum bicolour. Infectivitywas greatly reduced in solarized plots 8 months after solarization (over winter) in
both years tested. Results were similar for greenhouse or in-field bioassays. These
authors concluded that solarization indirectly reduced AM fungi in soil by restrict-
ing the weed populations that maintained infective propagules over winter.
As with other forms of soil heating, solarization results in complex changes in
soil physical, chemical and biological properties. Availability of many mineral
nutrients is increased following solarization, particularly those mainly associated
with organic matter, such as NH4+and NO3
�. Amounts of these ions can vary
considerably depending on the aeration of the soil, which is a function of the soil
physical properties and moisture content, as well as the presence of nitrifying
microorganisms. Extractable P, K, Ca and Mg may be present in greater concentra-
tion after solarization (Stapleton 1990), together with Cu, but Zn may decrease
(Baptista et al. 2006).
The increase in soluble mineral nutrients and the various different effects on AM
colonization dependent on AM fungal species and soil conditions combine to make
solarization a tool that needs very careful consideration before use in mycorrhizal
research. When AM fungi are re-inoculated after solarization, colonization rates
can be 20% higher (Afek et al. 1991; Nair et al. 1990).
19.3 Steam Sterilization
Autoclaving is widely used to sterilize soil samples, as the equipment is readily
available in most microbiology research and teaching laboratories. Soil is auto-
claved at 121�C at 1.1 atm for a minimum of 20–30 min. The length of time has to
be increased when large amounts of soil are used, but treatment of big volumes at
one time should be avoided, and the soil separated into several smaller volume
containers to establish an effective distribution of the heat. For the same reasons
the soil should not be packed or compressed onto containers, but left unconsolidated
to allow the steam to permeate. Cotton material bags perfectly satisfy this
requirement. Soil should be air-dried or with a water content of less than about
19 Techniques for Arbuscular Mycorrhiza Inoculum Reduction 309
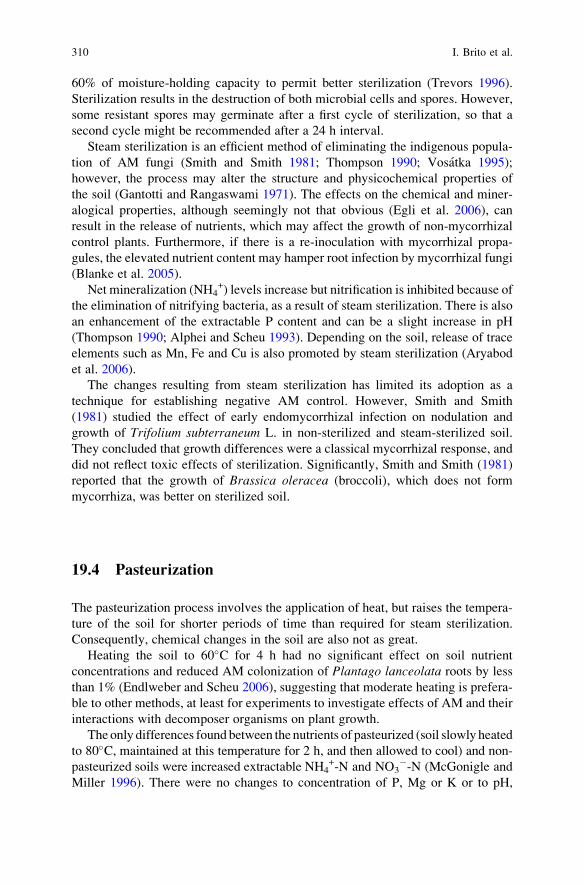
60% of moisture-holding capacity to permit better sterilization (Trevors 1996).
Sterilization results in the destruction of both microbial cells and spores. However,
some resistant spores may germinate after a first cycle of sterilization, so that a
second cycle might be recommended after a 24 h interval.
Steam sterilization is an efficient method of eliminating the indigenous popula-
tion of AM fungi (Smith and Smith 1981; Thompson 1990; Vosatka 1995);
however, the process may alter the structure and physicochemical properties of
the soil (Gantotti and Rangaswami 1971). The effects on the chemical and miner-
alogical properties, although seemingly not that obvious (Egli et al. 2006), can
result in the release of nutrients, which may affect the growth of non-mycorrhizal
control plants. Furthermore, if there is a re-inoculation with mycorrhizal propa-
gules, the elevated nutrient content may hamper root infection by mycorrhizal fungi
(Blanke et al. 2005).
Net mineralization (NH4+) levels increase but nitrification is inhibited because of
the elimination of nitrifying bacteria, as a result of steam sterilization. There is also
an enhancement of the extractable P content and can be a slight increase in pH
(Thompson 1990; Alphei and Scheu 1993). Depending on the soil, release of trace
elements such as Mn, Fe and Cu is also promoted by steam sterilization (Aryabod
et al. 2006).
The changes resulting from steam sterilization has limited its adoption as a
technique for establishing negative AM control. However, Smith and Smith
(1981) studied the effect of early endomycorrhizal infection on nodulation and
growth of Trifolium subterraneum L. in non-sterilized and steam-sterilized soil.
They concluded that growth differences were a classical mycorrhizal response, and
did not reflect toxic effects of sterilization. Significantly, Smith and Smith (1981)
reported that the growth of Brassica oleracea (broccoli), which does not form
mycorrhiza, was better on sterilized soil.
19.4 Pasteurization
The pasteurization process involves the application of heat, but raises the tempera-
ture of the soil for shorter periods of time than required for steam sterilization.
Consequently, chemical changes in the soil are also not as great.
Heating the soil to 60�C for 4 h had no significant effect on soil nutrient
concentrations and reduced AM colonization of Plantago lanceolata roots by less
than 1% (Endlweber and Scheu 2006), suggesting that moderate heating is prefera-
ble to other methods, at least for experiments to investigate effects of AM and their
interactions with decomposer organisms on plant growth.
The only differences found between the nutrients of pasteurized (soil slowly heated
to 80�C, maintained at this temperature for 2 h, and then allowed to cool) and non-
pasteurized soils were increased extractable NH4+-N and NO3
�-N (McGonigle and
Miller 1996). There were no changes to concentration of P, Mg or K or to pH,
310 I. Brito et al.
but arbuscules in roots were reduced to trace numbers. Scagel (2004) reported only
trace AM colonization of Brodiaea ‘‘Queen Fabiola’’ in pasteurized soil.
19.5 Gamma (g)-Irradiation
A number of studies have suggested that g-irradiation is highly effective as a
biocide and preferable to other methods of treating soil, because it can have less
of an impact on soil chemical and physical properties, including little effect on
particle size or aggregate stability (Bowen and Rovira 1961; McLaren 1969). The
advantage of g-radiation over other similar techniques is that it does not induce
sample radioactivity, making handling safe; on the other hand, it requires special
equipment not readily available in most laboratories.
Generally the greater the size or complexity of an organism the more susceptible
to radiation it is: fungi seem to be more sensitive than bacteria (McLaren 1969). The
larger the sample, the more likely that a variable dose may be delivered due to
internal shielding from irradiation (Yardin et al. 2000). An irradiation source
strength of 3 kGy, smaller than the 10 kGy usually recommended, may be enough
to eliminate AM fungi infectivity, and have little impact on soil conditions (Kahiluoto
et al. 2000; Thompson 1990). However, radiation requirements depend upon the soil
type, moisture content and former management (Powlson and Jenkinson 1976;
Parekh et al. 2005).
As a consequence of soil g-irradiation, short-term increases in temperature and nut-
rient release can occur (Yardin et al. 2000). More NH4+-N, organic N, small amounts
of Mn, soluble C and exchangeable S and P has been reported after g-irradiation ofsoil (Alphei and Scheu 1993; McLaren 1969, Thompson 1990). NO3
�-N generally
declines after g-irradiation, but pH variation showed no consistent trends
(McNamara et al. 2003). The release of soil-bound residues is not modified by
g-irradiation compared with autoclaving (Nakagawa and Andrea 1997).
One of the clear advantages of g-irradiation is that it is highly effective at steriliza-tion and leaves no chemical contamination post-treatment, and re-inoculation experi-
ments can take advantage of this. Of particular interest is the potential for g-irradiationto be used as a tool for selectively manipulating biodiversity in soils while causing
minimal disruption (McNamara et al. 2003). Comparing AM-inoculated and non-
inoculated plants in partially sterilized soil at 10 kGy g-irradiation, Thompson
(1990) unreservedly recommended the method for use in nutritional studies.
19.6 Chemicals
Various gaseous chemicals (ethylene oxide, propylene oxide, chloroforms) have
been used to fumigate soil. Methyl bromide (CH3Br), an extremely poisonous gas,
appears to be especially toxic to AM fungi and many researchers have used it as a
fumigant to eradicate AM fungi from experimental soils (Plenchette et al. 1983;
19 Techniques for Arbuscular Mycorrhiza Inoculum Reduction 311

Thompson 1990; Vosatka 1995); however, toxic effects of inorganic bromide
residues in the soil and phytoxicity symptoms resulting from Br concentrations in
plant tissue may occur (Alphei and Scheu 1993; Thompson 1990). Use of methyl
bromide is being banned due to its adverse effect on the ozone layer and is
scheduled to be phased out in the second decade of the new century (Bell 2000).
Ethylene oxide (C2H4O) is a colorless, flammable gas at room temperature and
pressure. To sterilize soil, it is introduced under reduced pressure to containers
holding the soil in pots or trays. Changes in the soil physical and chemical proper-
ties seem to be minor (Rose and Bailey 1952).
Propylene oxide (C3H6O) is a colorless, extremely flammable liquid that can
alkylate functional groups of proteins. In a comparison of propylene-oxide-treated
soil with untreated material, Alphei and Scheu (1993) reported a marked increase in
the CO2 release throughout the experiment and smaller mineral nitrogen content,
indicating immobilization of N for microbial growth.
Both ethylene and propylene oxide can increase soil pH during fumigation and
produce residues that hinder plant growth (Trevors 1996).
Chloroform (CHCl3) is highly volatile and has been used to fumigate soils for
the estimation of microbial biomass. Chloroform fumigation can defaunate the soil,
not necessarily eliminating microbial populations completely (Alphei and Scheu
1993). Endlweber and Scheu (2006) reported a massive reduction in AM coloniza-
tion of Plantago lanceolata roots by more than 99% in plants from chloroform
treated soil, but there was also an effect on plant growth and nutrient concentrations
within plant tissue.
Other fungicidal chemicals can also be used to prevent the development of AM.
Mostly these chemicals adversely affect AM fungi (Manjunath and Bagyaraj 1984;
Salem et al. 2003) although the degree of toxicity varies with the active ingredient,
the application rate (Habte and Manjunath 1992) and specific AM fungal isolate
(Schreiner and Bethlenfalvay 1997). The disadvantages of using fungicides to
create an indigenous inoculum-free soil relate to the fungicide residues left in the
soil that might be toxic to re-inoculated microbes or to the plants. According to
Kahiluoto et al. (2000) Benomyl (carbendazin) incorporation in the soil, besides
being most effective in suppressing AM fungi, is the most appropriate method
currently available for creating a non-mycorrhizal control for AM fungi community
in the field, irrespective of soil type and management history since Benomyl
treatment showed no ecologically significant effects on soil pH or K, Ca and Mg
contents or phyto-toxicity agents like Al, Fe, Cu or Mn in the experiments they
performed.
The use of formaldehyde to suppress AM fungi was tested by Covacevich and
Echeverria (2003) and they concluded that the concentration range of 1,67 to 5%
(formaldehyde-water) effectively eliminated indigenous mycorrhizal colonization
without restricting plant growth and allowed the development of inoculated AM
isolates.
An extensive review made by Menge (1982), on the effects of many other
fumigants and fungicides specifically on AM fungi, is highly recommended despite
the passage of time since it was published.
312 I. Brito et al.

19.7 Soil Disturbance
The direct effects of soil disturbance on mycorrhization are related to physical
disruption of the soil hyphal network and to the mixing of surface residues within
the soil profile, affecting the effectiveness of AM symbiosis.
When host plants are present and the soil is not disturbed, hyphae from colonized
roots and mycelia network are the main source of inoculum, they are more rapid and
efficient at initiating colonization (Martins and Read 1997) than are spores. Spores
are considered to be ‘‘long-term’’ propagules (Kabir 2005), mainly because it would
take longer for spores to germinate and for the hypha to make contact with roots as
opposed to runner hyphae infection from well-developed extra-radical mycelium
(Klironomos and Hart 2002). Evans and Miller (1990) demonstrated that disruption
of the hyphal network was directly responsible for much of the effect of soil
disturbance on mycorrhizal colonization, leading to differences in AM colonization
of almost 50% in pot trials and Brito et al. (2006), under field conditions, reported
20% differences in AM colonization of wheat.
In addition, deep ploughing (to more than 15 cm) hinders subsequent mycorrhiza
formation by reducing propagule density in the rooting zone (Kabir et al. 1998).
Abbott and Robson (1991) observed that no-tilled soil had more spores in the top
8 cm whereas tilled soils had more spores in the 8–15 cm depth.
Fairchild and Miller (1988) developed a ‘‘Cycles Technique’’ to study the
differences in AM colonization and P absorption in disturbed and undisturbed
soil. Air-dried soil was sieved (5 or 4 mm), packed into the pots to a natural bulk
density of approximate 1,2 g cm�3 and sown with the desired plant. Three weeks
after emergence, plant shoots were excised and measured. Half of the pots were
then taken, the soil removed as two layers and passed separately through a 4 mm
sieve. All root material separated on the sieve was cut into 2 cm-long segments and
mixed into the soil of the appropriate layer. Soil was repacked in the pots
and arranged in the same two layers. In the other half of the pots the soil remained
undisturbed. The pots were reseeded and a new cycle initiated. The authors argued
that the possible microbial flush of N (mineralization) in the soil caused by
disturbance ought to be negligible compared with the relatively large concentra-
tions of N (100 mg g�1) added to the soil at the start of the experiment and further
insist, this small amount of N will mainly be released in the initial phase of the
experiment. The effect of soil disturbance on AM infection could be mediated
through changes in soil physical properties; however, bulk density measurements
were unable to discern any significant differences between the two soil treatments.
Using this technique, and after three or four cycles of disturbance, greater
colonization rates are observed consistently in plants coming from undisturbed
soil pots (Goss and de Varennes 2002; McGonigle et al. 2003; Antunes et al. 2006;
Brito et al. 2006).
A number of advantages are associated with this technique, namely that it does
not make use of any toxic compounds, causes little nutrient release, exploits the
naturally occurring inoculum and allows a common history of inoculum and host
plant throughout the successive cycles.
19 Techniques for Arbuscular Mycorrhiza Inoculum Reduction 313

19.8 Crop Rotation
Although most crops are dependent upon mycorrhizal fungi, roots of some crops
such as, for example, the ones belonging to the Chenopodiaceae and Brassicaceae
families, do not formmycorrhiza. When such crops are used in rotation, they tend to
lead to a reduction in mycorrhizal propagules. Arihara and Karasawa (2000) studied
the effects of fallow and the previous cultivation of sunflower, maize, soybean,
potato, sugar beet and canola (oilseed rape) on AM colonization of maize, and
found that shoot weight and grain yield of maize were much greater in the plots
following sunflower, maize, soybean and potato than those after canola or sugar
beet (non-mycorhizal crops) or fallow. The cultivation of a non-AM host such as
sugar beet or canola reduces the mycorrhizal propagules and consequently AM
colonization of the following crop (Arihara and Karasawa 2000; Gollner et al.
2004) even with no alteration to the availability of P in the soil induced by the
previous crop (Karasawa et al. 2001).
Reduction of AM propagules is also associated with the practice of bare-fallow.
Because AM fungi are strictly biotrophic, their survival depends on the presence of
host plants. Harinikumar and Bagyaraj (1988) reported that leaving the land fallow
decreased the mycorrhizal propagules in 40%, while growing a non-mycorrhizal
host reduced it by 13%.
19.9 Other Methods
Ozone, possessing strong oxidative and germicidal properties, has a very short
half-life of minutes or less in soil and decomposes to simple diatomic oxygen.
Takayama et al. (2006) developed an ozonation technology based on the generation
of electrical discharges by applying high voltage to soil placed between two
electrodes. Soil treatments of 20 g O3 m�3 for 10 min almost killed Fusariumoxysporum and with a 20 min treatment over 80% of the soil bacteria were
eliminated.
Although not directly interfering with the AM inoculum the use of isogenic
myc� mutants of AM hosts as a non-mycorrhizal control may be useful to avoid
disruptive soil treatments and the safety and environmental problems caused by
most of the chemicals. The use of myc� mutants was investigated by Kahiluoto
et al. (2000), but problems with AM dependence, compatibility with indigenous
AM fungi communities and agricultural relevance, due to the limited selection of
myc� mutants available, are difficult to overcome. AM mutants currently available
have all been isolated from pre-existing nod� pools. As a result these mutants have
modified genes that play a role in both mycorrhiza formation and nodulation. Given
the fact that nodulation is essentially restricted to one plant family, whereas AM are
widespread, a significant number of mycorrhiza-specific genes must exist (Marsh
314 I. Brito et al.
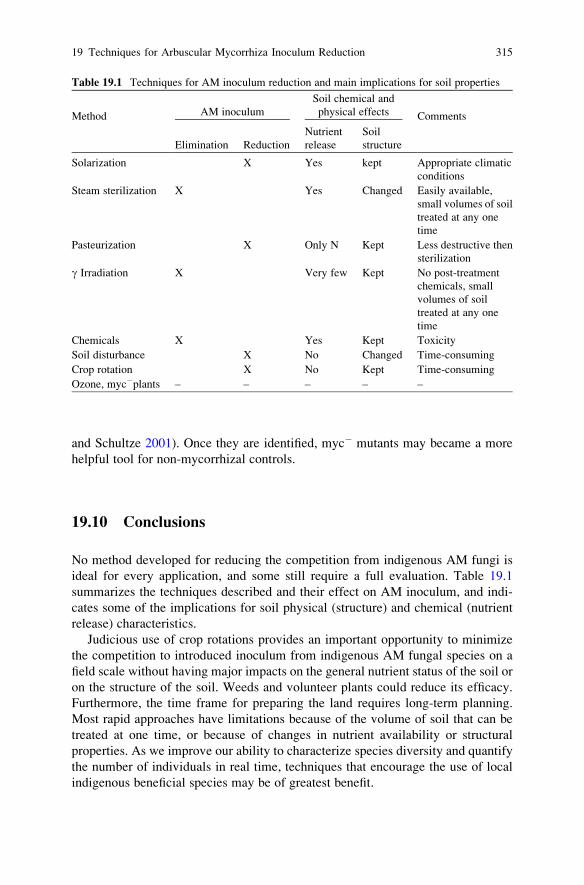
and Schultze 2001). Once they are identified, myc� mutants may became a more
helpful tool for non-mycorrhizal controls.
19.10 Conclusions
No method developed for reducing the competition from indigenous AM fungi is
ideal for every application, and some still require a full evaluation. Table 19.1
summarizes the techniques described and their effect on AM inoculum, and indi-
cates some of the implications for soil physical (structure) and chemical (nutrient
release) characteristics.
Judicious use of crop rotations provides an important opportunity to minimize
the competition to introduced inoculum from indigenous AM fungal species on a
field scale without having major impacts on the general nutrient status of the soil or
on the structure of the soil. Weeds and volunteer plants could reduce its efficacy.
Furthermore, the time frame for preparing the land requires long-term planning.
Most rapid approaches have limitations because of the volume of soil that can be
treated at one time, or because of changes in nutrient availability or structural
properties. As we improve our ability to characterize species diversity and quantify
the number of individuals in real time, techniques that encourage the use of local
indigenous beneficial species may be of greatest benefit.
Table 19.1 Techniques for AM inoculum reduction and main implications for soil properties
Method AM inoculum
Soil chemical and
physical effects Comments
Elimination Reduction
Nutrient
release
Soil
structure
Solarization X Yes kept Appropriate climatic
conditions
Steam sterilization X Yes Changed Easily available,
small volumes of soil
treated at any one
time
Pasteurization X Only N Kept Less destructive then
sterilization
g Irradiation X Very few Kept No post-treatment
chemicals, small
volumes of soil
treated at any one
time
Chemicals X Yes Kept Toxicity
Soil disturbance X No Changed Time-consuming
Crop rotation X No Kept Time-consuming
Ozone, myc�plants – – – – –
19 Techniques for Arbuscular Mycorrhiza Inoculum Reduction 315

References
Abbott LK, Robson AD (1991) Field management of VA mycorrhizal fungi. In: Keister DL,
Gregan PB (eds) The rhizosphere and plant growth. Kluwer, Netherlands, pp 355–362
Afek U, Menge JA, Johnson ELV (1991) Interaction among mycorrhizae, soil solarization,
metalaxyl, and plants in the field. Plant Dis 75:665–672
Al-Momani A, Abugarbiah W, Saleh H (1988) The effect of soil solarization on endomycorrhizal
fungi (Glomus mosseae) and Fusarium fungi. Dirasat 15:85–95
Alphei J, Scheu S (1993) Effects of biocidal treatments on biological and nutritional properties of a
mull-structured woodland soil. Geoderma 56:435–448
Antunes PM, Deaville D, Goss MJ (2006) Effect of two AMF life strategies on the tripartite
symbiosis with Bradyrhizobium japonicum and soybean. Mycorrhiza 16:167–173
Arihara J, Karasawa T (2000) Effect of previous crops on arbuscular mycorrhizal formation and
growth of succeeding maize. Soil Sci Plant Nutr 46:43–51
Aryabod S, Fotovat A, Lakzian A, Haghnia G (2006) The Effect of Soil Sterilization on Zn, Cu, Fe,
and Mn Uptake by Maize. Abs 961b, 18th World Congress of Soil Science, Philadelphia, PA,
USA
Baptista MJ, Souza RB, Pereira W, Carijo AO, Vidal MC, Charchar JM (2006) Solarizacao do solo
e biofumigacao no cultivo protegido do tomate. Hortic Bras 4:47–52
Bell CH (2000) Fumigation in the 21st century. Crop Prot 19:563–569
Bendavid-Val R, Babinowitch HD, Katan J, Kapulnik Y (1997) Viability of VA-mycorrhizal fungi
following soil solarization and fumigation. Plant Soil 195:185–193
Blanke V, Renker C, Wagner M, Fullner K, Held M, Kuhn AJ, Buscot F (2005) Nitrogen supply
affects arbuscular mycorrhizal colonization of Artemisia vulgaris L. in a phosphate-polluted
field site. New Phytol 166:981–992
Bowen GD, Rovira AD (1961) Plant growth in irradiated soil. Nature 191:936–937
Brito I, Carvalho M, van Tuinen D, Goss MJ (2006) Effects of soil management on arbuscular
mycorrhizal fungi in autumn-sown crops inMediterranean climates. In: Horn R, Fleige H, Peth S,
Peng X (eds) Soil Management for sustainability, Advances in geoecology 38. Catena Verlag
GmbH, Germany, pp 149–156
Covacevich F, Echeverria HE (2003) Utilizacion de formaldehido para la erradicacion de hongos
micorrıticos arbusculares de muestras de suelo. Ciencia del Suelo 21:9–17
Egli M, Mirabella A, Kagi B, Tomasone G, Clorio G (2006) Influence of steam sterilization on soil
chemical characteristics, trace metals and clay mineralogy. Geoderma 131:123–142
Endlweber K, Scheu S (2006) Establishing arbuscular mycorrhiza-free soil: a comparison of six
methods and their effects on nutrient mobilization. Appl Soil Ecol 34:276–279
Evans DG, Miller MH (1990) The role of the external mycelial network in the effect of
soil disturbance upon vesicular–arbuscular mycorrhizal colonization of maize. New Phytol
114:65–71
Fairchild GL, Miller MH (1988) Vesicular–arbuscular mycorrhizas and the soil-disturbance-
induced reduction of nutrient absorption in maize. II. Development of the effect. New Phytol
110:75–84
Gantotti BV, Rangaswami G (1971) Improvements in the physical properties of soil under
the influence of the rhizosphere microflora of four different plant species. Plant Soil 35:
347–356
Gollner M, Friedel JK, Freyer B (2004) Influence of different agricultural practices on the
arbuscular mycorrhiza in organic farming systems. In: Baar J, Josten E (eds) Applied Plant
Research, WUR, Netherlands: Role of mycorrhiza in sustainable land management. COST
8.38 Meeting, 26–27 February 2004, Vught, Netherlands
Goss MJ, de Varennes A (2002) Soil disturbance reduces the efficacy of mycorrhizal associations
for early soybean growth and N2 fixation. Soil Biol Bioch 34:1167–1173
316 I. Brito et al.

Habte M, Manjunath A (1992) Initial and residual toxicity of soil-applied thiram on the vesicular–
arbuscular mycorrhizal symbiosis. Mycorrhiza 2:25–31
Harinikumar KM, Bagyaraj DJ (1988) Effect of crop rotation on native vesicular–arbuscular
mycorrhizal propagules in soil. Plant Soil 110:77–80
Kabir Z (2005) Tillage or no-tillage: Impact on mycorrhizae. Can J Plant Sci 85:23–29
Kabir Z, O‘Halloran IP, Widden P, Hamel C (1998) Vertical distribution of arbuscular mycorrhi-
zal fungi under corn (Zea mays L.) in no-till and conventional tillage systems. Mycorrhiza
8:53–55
Kahiluoto H, Ketoja E, Vestberg M (2000) Creation of a non-mycorrhizal control for a biossay of
AM effectiveness. Mycorrhiza 9:241–258
Karasawa T, Kasahara Y, Takebe M (2001) Variable response of growth and arbuscular mycor-
rhizal colonization of maize plants to preceding crops in various types of soils. Biol Fertil Soils
33:286–293
Klironomos JN, Hart MM (2002) Colonization of roots by arbuscular mycorrhizal fungi using
different sources of inoculum. Mycorrhiza 12:181–184
Manjunath A, Bagyaraj DJ (1984) Effects of fungicides on mycorrhizal colonization and growth of
onion. Plant Soil 80:147–150
Marsh JF, Schultze M (2001) Analysis of arbuscular mycorrhizas using symbiosis-defective plant
mutants. New Phytol 150:525–532
Martins MA, Read DJ (1997) The effects of disturbance on the external mycelium of arbuscular
mycorrhizal fungi on plant growth. Pesqui Agropecu Bras 32:1183–1189
McGonigle TP, Miller MH (1996) Development of fungi below ground in association with plants
growing in disturbed and undisturbed soils. Soil Biol Biochem 28:263–269
McGonigle TP, Yano K, Shinhama T (2003) Mycorrhizal phosphorus enhancement of plants in
undisturbed soil differs from phosphorus uptake stimulation by arbuscular mycorrhizae over
non-mycorrhizal controls. Biol Fertil Soil 37:268–273
McLaren AD (1969) Radiation as a technique in soil biology and biochemistry. Soil Biol Bioch
1:63–73
McNamara NP, Black HIJ, Beresford NA, Parekh NR (2003) Effects of acute gamma irradiation
on chemical, physical and biological properties of soils. Appl Soil Ecol 24:117–132
Menge JA (1982) Effect of soil fumigants and fungicides on vesicular–arbuscular fungi. Phytopa-
thology 72:1125–1132
Nair SK, Peethambaran CK, Geetha D, Nayar K, Wilson KI (1990) Effect of soil solarization on
nodulation, infection by mycorrizal fungi and yield of cowpea. Plant Soil 125:153–154
Nakagawa LE, Andrea MM (1997) Liberacao de resıduos ligados de atrazina de solos por meio de
esterilizacao por autoclavagem e radiacao gama. Rev Bras Cienc Solo 21:707–710
Parekh NR, Potter ED, Poskitt JS, Dodd BA, Beresford NA (2005) Detection of irradiation-
induced changes on the activity and diversity of soil microbial communities: the effect of
soil type. Radioprotection 40:S939–S944
Plenchette C, Fortin JA, Furlan V (1983) Growth response of several plants species to mycorrhiza
in a soil of moderate P fertility. I. Mycorrhizal dependency under field conditions. Plant Soil
70:199–209
Powlson DS, Jenkinson DS (1976) The effects of biocidal treatments on metabolism in soil. II.
Gamma irradiation, autoclaving, air-drying and fumigation. Soil Biol Bioch 8:179–188
Rose RE, Bailey RW (1952) Ethylene oxide for soil sterilisation. Nature 169:716
Salem SF, Dobolyi C, Helyes L, Pck Z, Dimcny J (2003) Side-effect of benomyl and captan on
arbuscular mycorrhiza formation in tomato. Acta Hort 613:243–246
Scagel CF (2004) Soil pasteurization and mycorrhizal inoculation alters flower production and
corm composition of Brodiaea laxa. ‘Queen Fabiola’. Hort Sci 39:1432–1437
Schreiner RP, Ivors KL, Pinkerton JN (2001) Soil solarization reduces arbuscular mycorrhizal
fungi as a consequence of weed suppression. Mycorrhiza 11:273–277
Schreiner RP, Bethlenfalvay GJ (1997) Mycorrhizae, biocides, and biocontrol. 3. Effects of three
different fungicides on developmental stages of three AM fungi. Biol Fertil Soils 24:18–26
19 Techniques for Arbuscular Mycorrhiza Inoculum Reduction 317
Smith SE, Read DJ (1997) Mycorrhizal Symbiosis. Academic, London
Smith FA, Smith SE (1981) Mycorrhizal Infection and Growth of Trifolium subterraneum: Use ofsterilized soil as a control treatment. New Phytol 88:299–309
Stapleton JJ (1990) Thermal inactivation of crop pests and pathogens and other soil changes
caused by solarization. In: International Conference of Soil Solarization, Ammam. Proceed-
ings. DAO, Rome, pp 37–47
Takayama M, Ebihara K, Stryczewska H, Ikegami T, GyoutokuY, Kubo K, Tachibana M (2006)
Ozone generation by dielectric barrier discharge for soil sterilization. Thin Solid Films
506–507:396–399
Thompson JP (1990) Soil sterilization methods to show VA-mycorrhizae aid P and Zn nutrition of
wheat in vertisols. Soil Biol Bioch 22:229–240
Trevors JT (1996) Sterilization and inhibition of microbial activity in soil. J Microbiol Methods
26:53–59
Vosatka M (1995) Influence of inoculation with arbuscular mycorrhizal fungi on the growth and
mycorrhizal infection of transplanted onion. Agric Ecosyst Environ 53:151–159
Wolf DC, Skipper HD (1994) Soil sterilization. In: Weaver RW, Angle JS, Bottomley PS,
Bezdicek D, Smith S, Tabatabai A, Wollum A, Mickelson SH (eds) Methods of soil analysis,
Part 2 — Microbiological and biochemical properties. Soil Society of America Inc. pp 41–51
Yardin MR, Kennedy IR, Thies JE (2000) Development of high-quality carrier materials for field
delivery of key microorganisms used as bio-fertilisers and bio-pesticides. Radiat Phys Chem
57:565–568
318 I. Brito et al.

Chapter 20
Best Production Practice of Arbuscular
Mycorrhizal Inoculum
Falko Feldmann, Imke Hutter, and Carolin Schneider
20.1 Introduction
The application of quality assessment standards to arbuscular mycorrhizal inocu-
lum (AM) mainly requires that the product is ‘fit for purpose’. The product must
meet or exceed the customer’s requirements. It is the customer who sets ‘‘quality
standards’’ in terms of his expectations. Customers may define different quality
characteristics for mycorrhizal inoculum: formulation, handling, weight, safety,
functionality or others. Socio-Economic Impact Analysis and adequate Environ-
mental Risk Assessments carried out along with Life Cycle Assessment are mea-
sures for energy, material flows and impact estimates associated with all stages of
a product from inoculum producer to the customer. Finally, the Cost-Benefit
Analysis Process (on the basis of the Business Ethics Assessment) involves mone-
tary calculations of initial and ongoing expenses vs expected return (Compare
Feldmann 2007).
All these instruments should be common practice in a company producing
inoculum for national or international market. Only the application of all instru-
ments of concurrent quality control procedures results in a traceable and reliable
supply chain with the consequence of reliability of the whole product chain as basis
for sustainability. This pre-requisite prevents the customer from buying some
expensive, non-effective instead of high-quality AM inoculum.
The basis for production of high-quality AM inoculum is the understanding of
biological principles of the population biology of AM fungi (AMF). But we shall
not go into too much detail when documenting this biological basis, the working
hypotheses or the procedures chosen. In this chapter we describe how to design an
F. Feldmann (*)
Julius-Kuhn-Institut, Messeweg 11/12, 38104 Braunschweig, Germany
e-mail: [email protected]
I. Hutter and C. Schneider
Institut fur Pflanzenkultur, Solkau 2, D-29465 Schnega
A. Varma and A.C. Kharkwal (eds.), Symbiotic Fungi, Soil Biology 18, 319
DOI: 10.1007/978‐3‐540‐95894‐9_20, # Springer‐Verlag Berlin Heidelberg 2009

inoculum of an AMF generalist and how to produce it on a large scale (>8 � 109
spores per year).
20.2 Working Hypotheses (Following Feldmann 1998)
l AMF are phenotypically highly variable due to their multicaryotic and hetero-
caryotic spores.l Hosts temporarily canalize functional genotypes depending on environmental
and endogen plant factors.l Under uniform conditions AMF spore multiplication results in widely reprodu-
cible effectiveness only for maximally three multiplication cycles.
20.3 Basic Assumptions for the Inoculum Production
(Following Feldmann and Grotkass 2002)
l A plant does not aim for colonisation by mycorrhizal fungi. It depends on the
host and fungus genotypes, on their coherence and on favourable environmental
conditions to develop a mycorrhiza (Allen 1991). This offers the possibility of
choosing a large amount of suitable host/fungus combinations for inoculum
production. The relevant taxonomic units for specific phenomenon are plant
variety and fungal strain.l The process of colonisation by mycorrhizal fungi means stress for the host and
the AM symbiosis is a parasitism-mutualism continuum. This can easily be
observed after inoculation of young seedlings expressing growth depression.
Following the stress theory of Stocker (1947) this can be overcompensated after
the ‘‘alarm phase’’, resulting in a desired host response (e.g. better growth),
and can be stabilised by product exchanges (e.g. carbohydrates vs water and
nutrients) with concurrent mutualism. In inoculum production we prefer and
force the host plants to allocate as much carbohydrate as possible to the fungus.
We balance the developing parasitism-mutualism continuum (Johnson et al.
1997; compare Feldmann, 1998b) by nutrients and irrigation to favour fungal
sporulation.l Ecological characteristics of AM inoculum can be designed by pre-adaption
processes (Feldmann and Grotkass 2002). This offers the possibility of replacing
expensive, time-consuming screenings of isolates with a short shelf life.
Biological basics to be considered are the problem of the ecological niche of
AMF and hosts, limiting factors of plant growth and phenotypic plasticity of both.
320 F. Feldmann et al.
l Phenotypical characteristics of inoculum are often expressed on the basis of
fungal population composition (Feldmann 1998). This requires stepwise multi-
plication cycles during up-scaling procedure, concurrent quality control and
advanced mixing techniques which take into account the phenotypic variation
of mycorrhizal fungi.
On the basis of these working hypotheses, four steps are demonstrated:
1. In the planning phase, the requirements of the inoculum production are outlined.
2. In the analytical phase, the tuning of inoculum is described, and the immanent
functional variability of inoculum is tested.
3. In the adaption phase, how to extend the abilities of inoculum is defined.
4. Finally, the up-scaling phase of inoculum production is described
This chapter will be completed by describing concurrent quality control proce-
dures.
20.3.1 The Planning Phase: Define what you Need
The aims which an inoculum should meet, which organisms are involved and the
purpose of the product dominate the planning phase, and result in a biological data
sheet. Following our experience, the design of an inoculum for very general use is
possible, but requires much more attention, knowledge and experience than a more
limited design. Nevertheless, the commercial exploitation of a generalist’s inocu-
lum is much more attractive than restricted inocula. As an example, we describe
the planning phase for an inoculum to be used in ornamentals in greenhouses
(as previously developed for German gardeners; see Feldmann et al. 1999).
The Biological Data Sheet (BDA) should contain specifications about host and
fungus (Table 20.1). Details concerning the desired target plants are fixed. The
evaluation of this commercial BDA should lead to discussion of desired inoculum
characteristics including desired carrier materials, formulations and acceptable
pricing (maximum price). In our example it was vital that the fungus should
colonize a range of different ornamental plant species within 2 weeks (between
potting the first and second time) and developing growth responses within 8 weeks
after the second potting (before sale to the customer). This inoculum had to tolerate
high dosages of fertilizer. Furthermore, the price had to be very low because the
user was not the one to expect the benefit, but buying interest was based on added
value regarding inner quality of plants.
At this point you have to decide on a starter inoculum. The more detailed the
knowledge available on the isolates, the easier it is to select AMF from one’s own
gene bank, or from an in situ conservation area (Feldmann and Grotkass 2002), to
isolate fungi or to buy them.
20 Best Production Practice of Arbuscular Mycorrhizal Inoculum 321

Table 20.1 Biological data sheet for inoculum design and planning
Parameter Macrosymbiont (Host) Microsymbiont (AMF)
Species, varieties/strains Heliotropium arborescenscv. ‘‘Marine’’, Bidensferulifolia cv.
‘‘Goldmarie’’,
Brachycomeiberidifolia;Chrysanthemum cv.
‘‘Maja Bofinger’’,
Lobelia erinus cv.‘‘Cobalt Blue’’, Lantanacamara cv. ‘‘Feston
Rose’’, Sutera cordatacv. ‘‘Snowflake’’,
Sanvitalia procumbenscv. ‘‘Gold Braid’’,
Pelargonium cv.‘‘Butterfly’’,
‘‘Leuchtkaskade’’,
‘‘Grand Prix’’, Verbena xhybrida cv.‘‘Imagination’’ and
‘‘Romance’’
Glomus etunicatum
Range of intended use Ornamental greenhouses;
mycorrhization from January to March
Desired mycorrhizal effect Shortening of the ‘‘standing period’’ of ornamentals in
greenhouses, earlier flowering and therefore earlier sale
Longer flowering under balcony conditions Underlying
effect: quicker growth
Care requirements after
installed (water weekly,
water once, plant
protection etc.)
Temperature: 14–21�C; fertilizer: max. 2 g/l � week of NPP
18/12/18; use of diverse pesticides, sprayed and in the
irrigation water
Natural occurrence (where,
how common)
Not relevant Cosmopolitan, not in
sterilized substrates
Habitat preferences Warm, moderate Very variable
Strategy type/successional
stage (stress-tolerator,
competitor, weedy/
colonizer, etc.)
r- and k-strategists r-strategist; strain selected
for rapid colonisation;
generalist
Potential ecological main
factors under natural
conditions
– High tolerance to high
fertilizer concentrations
Associated species No No
Material provided by/
collected as/from
Plants available from
production companies
Gene bank
Propagation Cuttings DIPP with two steps
(medium scale)
To be adapted to pH 5.0
(continued )
322 F. Feldmann et al.
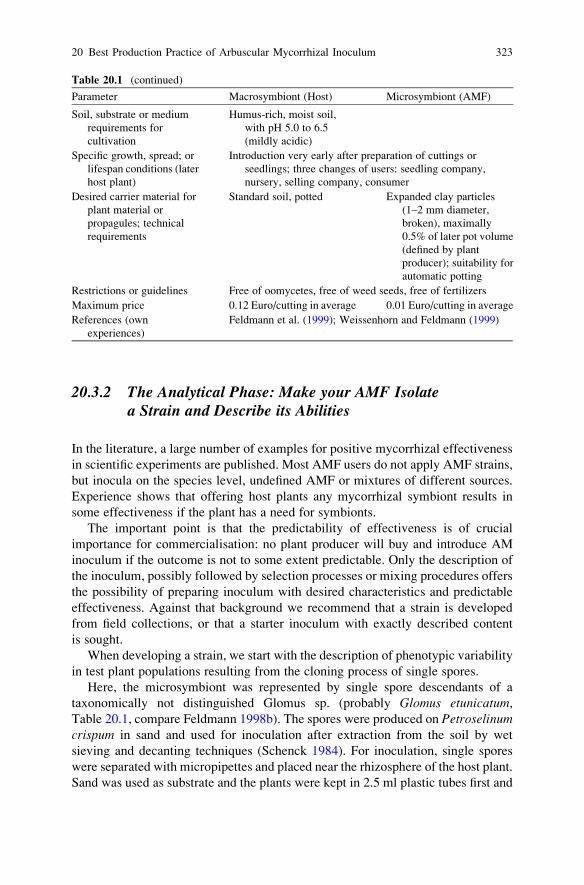
20.3.2 The Analytical Phase: Make your AMF Isolatea Strain and Describe its Abilities
In the literature, a large number of examples for positive mycorrhizal effectiveness
in scientific experiments are published. Most AMF users do not apply AMF strains,
but inocula on the species level, undefined AMF or mixtures of different sources.
Experience shows that offering host plants any mycorrhizal symbiont results in
some effectiveness if the plant has a need for symbionts.
The important point is that the predictability of effectiveness is of crucial
importance for commercialisation: no plant producer will buy and introduce AM
inoculum if the outcome is not to some extent predictable. Only the description of
the inoculum, possibly followed by selection processes or mixing procedures offers
the possibility of preparing inoculum with desired characteristics and predictable
effectiveness. Against that background we recommend that a strain is developed
from field collections, or that a starter inoculum with exactly described content
is sought.
When developing a strain, we start with the description of phenotypic variability
in test plant populations resulting from the cloning process of single spores.
Here, the microsymbiont was represented by single spore descendants of a
taxonomically not distinguished Glomus sp. (probably Glomus etunicatum,Table 20.1, compare Feldmann 1998b). The spores were produced on Petroselinumcrispum in sand and used for inoculation after extraction from the soil by wet
sieving and decanting techniques (Schenck 1984). For inoculation, single spores
were separated with micropipettes and placed near the rhizosphere of the host plant.
Sand was used as substrate and the plants were kept in 2.5 ml plastic tubes first and
Table 20.1 (continued)
Parameter Macrosymbiont (Host) Microsymbiont (AMF)
Soil, substrate or medium
requirements for
cultivation
Humus-rich, moist soil,
with pH 5.0 to 6.5
(mildly acidic)
Specific growth, spread; or
lifespan conditions (later
host plant)
Introduction very early after preparation of cuttings or
seedlings; three changes of users: seedling company,
nursery, selling company, consumer
Desired carrier material for
plant material or
propagules; technical
requirements
Standard soil, potted Expanded clay particles
(1–2 mm diameter,
broken), maximally
0.5% of later pot volume
(defined by plant
producer); suitability for
automatic potting
Restrictions or guidelines Free of oomycetes, free of weed seeds, free of fertilizers
Maximum price 0.12 Euro/cutting in average 0.01 Euro/cutting in average
References (own
experiences)
Feldmann et al. (1999); Weissenhorn and Feldmann (1999)
20 Best Production Practice of Arbuscular Mycorrhizal Inoculum 323
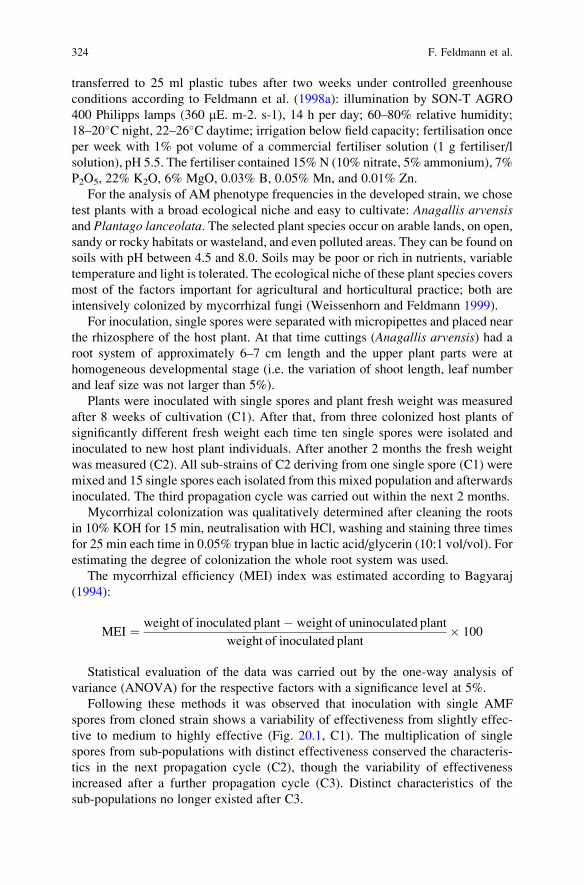
transferred to 25 ml plastic tubes after two weeks under controlled greenhouse
conditions according to Feldmann et al. (1998a): illumination by SON-T AGRO
400 Philipps lamps (360 mE. m-2. s-1), 14 h per day; 60–80% relative humidity;
18–20�C night, 22–26�C daytime; irrigation below field capacity; fertilisation once
per week with 1% pot volume of a commercial fertiliser solution (1 g fertiliser/l
solution), pH 5.5. The fertiliser contained 15%N (10% nitrate, 5% ammonium), 7%
P2O5, 22% K2O, 6% MgO, 0.03% B, 0.05% Mn, and 0.01% Zn.
For the analysis of AM phenotype frequencies in the developed strain, we chose
test plants with a broad ecological niche and easy to cultivate: Anagallis arvensisand Plantago lanceolata. The selected plant species occur on arable lands, on open,sandy or rocky habitats or wasteland, and even polluted areas. They can be found on
soils with pH between 4.5 and 8.0. Soils may be poor or rich in nutrients, variable
temperature and light is tolerated. The ecological niche of these plant species covers
most of the factors important for agricultural and horticultural practice; both are
intensively colonized by mycorrhizal fungi (Weissenhorn and Feldmann 1999).
For inoculation, single spores were separated with micropipettes and placed near
the rhizosphere of the host plant. At that time cuttings (Anagallis arvensis) had a
root system of approximately 6–7 cm length and the upper plant parts were at
homogeneous developmental stage (i.e. the variation of shoot length, leaf number
and leaf size was not larger than 5%).
Plants were inoculated with single spores and plant fresh weight was measured
after 8 weeks of cultivation (C1). After that, from three colonized host plants of
significantly different fresh weight each time ten single spores were isolated and
inoculated to new host plant individuals. After another 2 months the fresh weight
was measured (C2). All sub-strains of C2 deriving from one single spore (C1) were
mixed and 15 single spores each isolated from this mixed population and afterwards
inoculated. The third propagation cycle was carried out within the next 2 months.
Mycorrhizal colonization was qualitatively determined after cleaning the roots
in 10% KOH for 15 min, neutralisation with HCl, washing and staining three times
for 25 min each time in 0.05% trypan blue in lactic acid/glycerin (10:1 vol/vol). For
estimating the degree of colonization the whole root system was used.
The mycorrhizal efficiency (MEI) index was estimated according to Bagyaraj
(1994):
MEI ¼ weight of inoculated plant� weight of uninoculated plant
weight of inoculated plant� 100
Statistical evaluation of the data was carried out by the one-way analysis of
variance (ANOVA) for the respective factors with a significance level at 5%.
Following these methods it was observed that inoculation with single AMF
spores from cloned strain shows a variability of effectiveness from slightly effec-
tive to medium to highly effective (Fig. 20.1, C1). The multiplication of single
spores from sub-populations with distinct effectiveness conserved the characteris-
tics in the next propagation cycle (C2), though the variability of effectiveness
increased after a further propagation cycle (C3). Distinct characteristics of the
sub-populations no longer existed after C3.
324 F. Feldmann et al.

The reproducible response of the clonal host under standard conditions caused
by AMF descendants of single spore isolates verified the existence of genotypic
differences in the initial spore population. The slight variability of effectiveness
during the first propagation process reflects the still-existing variability of the plant
material and experimental errors. If the variability of effectiveness observed in C1
had been the result of phenotypic plasticity of only one fungal genotype, the same
variability would have had to occur in C2.
After the second propagation cycle the distinct characteristics of the genotypes
start to become modified because there is an increase of variability in effectiveness
in C3 (Fig. 20.1). The basic mechanism for the enhanced variability in effectiveness
of genotypes still remains unclear. Host gene/AMF gene adaptations are as possible
as high mutation rates of the fungus.
For practical application, the findings are of special importance: if genetically
fixed characteristics of AMF spores are stable for only one or two propagation
cycles, AMF inoculum production should not be based on past inoculum charge
but on fresh spore material from stock cultures. This complicates up-scaling in
inoculum production, because slight differences, as shown for the effectiveness of
C3 (Fig. 20.1), can create considerable changes in effectiveness of an inoculum
produced by this method (Feldmann et al. 1999).
Based on this system a wide range of parameters can be tested: velocity of
colonization, salt content, and heavy metal stress (Feldmann and Grotkass 2002).
Phenotypic variability exists in every case and we recently described, using quanti-
tative molecular genetical methods, which percentage of the variability might be
genetically fixed and heritable.
AMF multiplication cycles
Pla
nt f
resh
wei
ght
[mg]
0
10
20
30
40
50
60
70
Con C1 C2 C3
without AMF
Fig. 20.1 Mycorrhizal effectiveness of AMF single-spore descendants (Glomus sp.) on the
biomass of Anagallis arvensis. See distinct sub-population characteristics in C2 and overlapping
effectiveness in C3
20 Best Production Practice of Arbuscular Mycorrhizal Inoculum 325
20.3.3 The Adaption Phase: Direction Instead of Screenings
The best sub-strains of C2 for adaption of inoculum to lower soil pH (or P-content
stressors such as drought, salt or heavy metals and others) are chosen (Fig. 20.2b).
Ten cuttings of Anagallis arvensis per treatment in three parallel repetitions are
grown until they develop a considerable root system (conditions as above). Before
inoculation the soil is infiltered with nutrient solution of changed pH (pH 4.5, 5.0,
5.5, 6.0, 6.5, 7.0, 7.5, 8.0) until the run-off has the same pH as the infiltrated
solution. For inoculation approximately 100 spores are transferred into the substrate
near the roots of Anagallis arvensis. After 21 days the plants are carefully extractedfrom substrate, the roots washed to remove old spores and planted to a larger pot
(50 ml) with fresh substrate. The time period may be chosen following your
requirements. Here it is short because of the need to select ‘‘rapid’’ genotypes in
addition to pH-tolerant ones. The plants remain in that pot for approximately
another 4 weeks until sporulation of the fungus. Plants are harvested, shoot fresh-
weight determined and mycorrhizal status of roots analysed.
An analogous experiment with different phosphate concentrations in the sub-
strate at pH 5.5 was carried out (5 ppm, 15 ppm, 30 ppm, 60 ppm, 90 ppm, and
120 ppm) and has already been published (Feldmann and Grotkass 2002).
At extreme soil pH the colonization of the host plants initially may be low
(Fig. 20.2a). But the percentage of spores within the tested inoculum able to
colonize under extreme conditions can be enhanced by separate propagation and
by later mixing in the freshly produced spores. Consequently, the effectiveness of
the tuned inoculum is enhanced under extreme conditions, in comparison with the
initial start inoculum. This is a further indication for the existence of different
genotypes within a strain and an important step on the way to directing the
inoculum production process successfully.
Under variable environmental conditions probably the physiological status of
the host is the main factor that expresses dependency of or independency of
mycorrhizal fungi. Therefore, the directed inoculum production process (DIPP)
will be especially successful if the relationship between later target plants and
desired target mycorrhizal effect is clearly defined before the inoculum production
starts.
In summary, there is a possibility of influencing the genotype composition of an
AMF population by directed processing of the inoculum production. Abiotic
environmental factors can be used to select and canalize AMF genotypes. But the
chosen plant species with its specific mycorrhizal dependency seems to have
special importance for the result of the process as well. Finally, it has to be pointed
out that inoculum adaptation to stressors (salt, heavy metals) lasts only one to two
multiplication cycles (Feldmann and Grotkass 2002).
326 F. Feldmann et al.

20.3.4 The Up-Scaling Phase: One Further Step Only
As mentioned above, strain or inoculum characteristics are stable minimally one,
normally two or — depending on the desired effect — three multiplication cycles.
Mass production of AMF means the production of up to several thousands
of litres of inoculum containing approximately 80,000 infection units per litre.
pH 4.5 pH 5.0 pH 5.5 pH 6.0 pH 7.0 pH 8.0
0
20
40
60
80
100
C1
AMF multiplication cycles
Col
onis
ed h
ost p
lant
s [%
]
C2 C3 C4
a
pH 4.5 pH 5.0 pH 5.5 pH 6.0 pH 7.0 pH 8.0
0
20
40
60
C1
AMF multiplication cycles
Myc
orrh
izal
effe
ctiv
enes
s [M
EI]
C4C3C2
b
Fig. 20.2 Root colonization ability (a) and mycorrhizal effectiveness (b) of AMF populations
(Glomus sp. GK 12 on Anagallis arvensis) with technically modified genotype composition
(Selection factor ‘‘soil-pH’’, details see text). Bars: SD
20 Best Production Practice of Arbuscular Mycorrhizal Inoculum 327
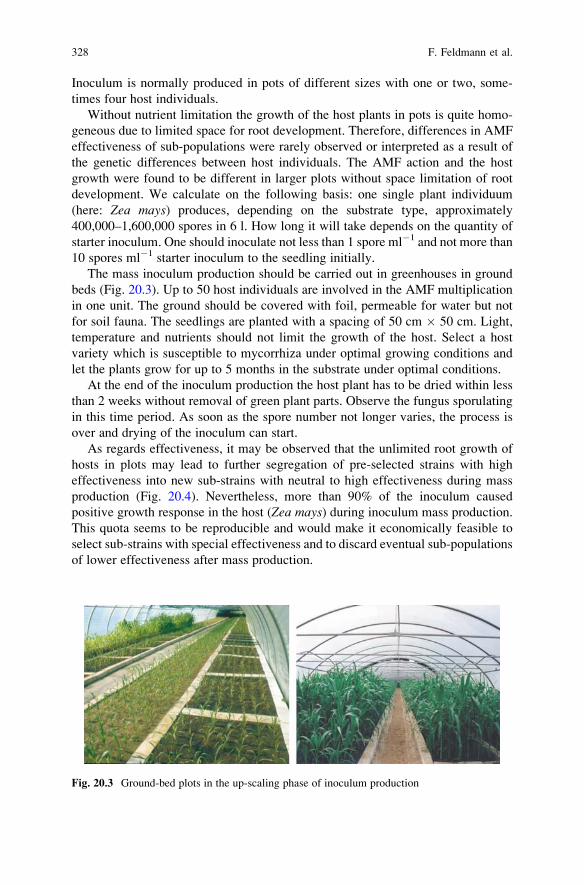
Inoculum is normally produced in pots of different sizes with one or two, some-
times four host individuals.
Without nutrient limitation the growth of the host plants in pots is quite homo-
geneous due to limited space for root development. Therefore, differences in AMF
effectiveness of sub-populations were rarely observed or interpreted as a result of
the genetic differences between host individuals. The AMF action and the host
growth were found to be different in larger plots without space limitation of root
development. We calculate on the following basis: one single plant individuum
(here: Zea mays) produces, depending on the substrate type, approximately
400,000–1,600,000 spores in 6 l. How long it will take depends on the quantity of
starter inoculum. One should inoculate not less than 1 spore ml�1 and not more than
10 spores ml�1 starter inoculum to the seedling initially.
The mass inoculum production should be carried out in greenhouses in ground
beds (Fig. 20.3). Up to 50 host individuals are involved in the AMF multiplication
in one unit. The ground should be covered with foil, permeable for water but not
for soil fauna. The seedlings are planted with a spacing of 50 cm � 50 cm. Light,
temperature and nutrients should not limit the growth of the host. Select a host
variety which is susceptible to mycorrhiza under optimal growing conditions and
let the plants grow for up to 5 months in the substrate under optimal conditions.
At the end of the inoculum production the host plant has to be dried within less
than 2 weeks without removal of green plant parts. Observe the fungus sporulating
in this time period. As soon as the spore number not longer varies, the process is
over and drying of the inoculum can start.
As regards effectiveness, it may be observed that the unlimited root growth of
hosts in plots may lead to further segregation of pre-selected strains with high
effectiveness into new sub-strains with neutral to high effectiveness during mass
production (Fig. 20.4). Nevertheless, more than 90% of the inoculum caused
positive growth response in the host (Zea mays) during inoculum mass production.
This quota seems to be reproducible and would make it economically feasible to
select sub-strains with special effectiveness and to discard eventual sub-populations
of lower effectiveness after mass production.
Fig. 20.3 Ground-bed plots in the up-scaling phase of inoculum production
328 F. Feldmann et al.

20.3.4.1 Concurrent Quality Control: You Should know what is Going on
Samples are taken every 3 to 4 weeks to measure the principal components in
relation to the developing symbiosis. Soil nutrient analysis is carried out by
commercial labs, faunistic and microbiological analysis by molecular genetic
analysis (DNA multiscan). The Most Probable Number of infective propagules is
measured only at the end of the production according to Feldmann and Idczak
(1994).
All results are analysed together in a multi-variety plot to investigate whether
negative interrelationships developed (Fig. 20.5). Based on this analysis, modifica-
tions to the system are processed. Be aware that we are not speaking about the final
quality control procedure for the inoculum before being released on the market
(compare von Alten et al. 2002), but process control of the production process.
20.3.4.2 Testing the Inoculum in Practice: Did it Achieve the Desired Effects?
The inoculum was introduced to the plant production process under practical
conditions. Later plants were sold or studied until their death caused by the end
of the growing season at their growing site (balconies, gardens). Mycorrhizal plants
were for preference sold on average 5 days earlier (Fig. 20.6). This effect was
observed in ten of 15 plant cultivars tested, reflecting the achievement of the desired
effects (better flowering or better growth). The effect was measured as a multi-
factorial trait by the customer. Out of a mixed plant population in a plant shop
customers selected plants without knowing that AMF were used. If they preferred
AM plants the desired effect was called ‘‘realised’’ (Fig. 20.7).
AMF inoculation
Fre
sh w
eigh
t/50
pla
nts
[g]
6000
7000
8000
9000
10000
11000
12000
13000
14000
Without With
Fig. 20.4 Variability of effectiveness of an AMF strain (Glomus sp.) during inoculum mass
production in plots with 50 host individuals (Zea mays)
20 Best Production Practice of Arbuscular Mycorrhizal Inoculum 329

Fig. 20.5 Principal component factoring of growth conditions
Fig. 20.6 Preferential sale of mycorrhizal vs. non-mycorrhizal plants: the action was made
economic sense, and the desired effect was achieved after selling 75% of the plants in a shorter
time period (Figure from Feldmann et al. 1999)
330 F. Feldmann et al.

To demonstrate the impact of Directed Inoculum Production Process (DIPP)
many experiments with the same AMF strain but different host species, different
inoculum quantities, environmental conditions, scales and effects were designed. In
practice, a threshold value of MEI > 30 must be exceeded to create the interest of a
potential customer in mycorrhizal technology. The positive outcome of an inoculation
was called ‘‘predicted’’ if that MEI value was clearly passed under the commercial
conditions of plant producers.
DIPP was introduced to the plant production and optimized in the company IFP
starting in 1996. Defining ‘‘predictability of AMF effectiveness’’ as quantitative
Fig. 20.7 Effectiveness of directed AMF inoculum in practice: black columns show the time
period until the AM plants were preferentially sold to customers out of a plant population mixed
with non-mycorrhizal individuals. (Figure from Feldmann et al. 1999)
Table 20.2 Increase of predictability of mycorrhizal effectiveness with directed inoculum pro-duction process (DIPP). ‘‘Constant environments’’ are greenhouse or growth chamber conditions;
field or garden experiments were carried out under ‘‘variable environments’’
Inoculum production Experiments [n] Predicted success [% experiments]
Environment Environment
Constant Variable Constant (%) Variable (%)
With DIPP 16 35 87.5% 68.6
Without DIPP 59 41 52.5% 36.6
20 Best Production Practice of Arbuscular Mycorrhizal Inoculum 331

value for the frequency of expected host growth response to symbiosis we can
compare experiments before and after the introduction of DIPP. The results
(Table 20.2) showed that predictability could be clearly increased. DIPP is a
promising way of providing guaranteed thresholds of effectiveness.
20.4 Conclusions
All over the world there are efforts to include arbuscular mycorrhizal technology in
processes of plant production. Benefits caused by arbuscular mycorrhizal fungi
(AMF) are used in the weaning stage of in vitro cultivated plants. Inoculation of
seeds, seedlings, cuttings or completely developed plants (Chang 1994) is recom-
mended. The introduction of AMF to target plants is carried out under greenhouse
conditions (Miller et al. 1986), in nurseries (Nemec 1987) and in the field (Thompson
1994). One single AMF species can be inoculated to dicotelidons, monocotelidons
and ferns (e.g. Feldmann 1998a). Furthermore, the same AMF species can be used
in humid tropics (Sieverding 1991) and in temperate climates (Baltruschat 1993).
In spite of such a spectrum of different environmental and cultivation conditions,
there is one unique expectation in the case of AMF inoculation: the developing
symbioses have to work successfully, must provide advantages to the target plant
and fulfil the customer’s requirements. ‘‘Symbiontal effectiveness’’ is a multifacto-
rial phenomenon. Host and fungal genotype both together influenced by abiotic and
biotic environmental conditions express the phenotype of the specific, relevant
symbiosis. ‘‘Positive effectiveness’’ in agricultural or horticultural sense is judged
as a ‘‘positive response’’ of the host when considering plant growth, yield or stress
tolerance.
There are several possibilities of influencinge the phenotype expression of the
symbioses in practice, e.g. deciding the time of inoculation with respect to the
developmental stage of the host, quantifying the inoculum potential or changing
the culture conditions.
Nevertheless, before introduction of DIPP there was only a low predictability of
the quantitative aspect of an effect (i.e. the effectiveness) a mycorrhizal symbiosis
might have in practice. In fact, AMF effectiveness following artificial inoculation
ranged from positive to negative (Varma and Schuepp 1994) in a mutualism-
parasitism continuum (Johnson et al. 1997).
To deal with that problem, screening processes for AMF strains (Dodd and
Thomson 1994) in order to find the ‘‘best’’ mycorrhizal strain (e.g. Baltruschat
1993) or effective AMF mixtures (e.g. Sieverding 1991) have been developed. The
results of all those efforts were disillusioning. The predictability of AMF effective-
ness remained too low for the sustainable use of AMF in commercial horticultural
and agricultural practice, especially in moderate climates. Industrial interest in the
use of AMF in plant-production processes still bears no relation to the potential of
the technology (compare Feldmann 1998a).
332 F. Feldmann et al.

At present, there are two fundamental questions to be answered for understand-
ing the basis of mycorrhizal effectiveness:
(a) The ‘‘mycorrhizal dependency’’ of a host is genetically fixed (Azcon and
Ocampo 1981) and the degree of mycorrhizal dependency is expressed at the
level of an individuum, as a gradient within the host?s ecological niche and
relevant environmental conditions (Feldmann 1998a). But are we able to predict
mycorrhizal dependency under specific conditions? Predicted success of the symbiosis
is still based on practical experiences and not on the knowledge of the basic
mechanisms for host dependency. Only if we learn to describe the limiting factors
of host growth in much more detail will predictability of effectiveness be enhanced
even more.
(b) AMF inoculum was thought to be genetically homogeneous in a wide range,
because of the mitotic reproduction of spores. Ignoring that, the initial inoculum
multiplication was often processed using a multispore start inoculum. The assumed
genetic homogeneity of AMF inoculum was the basis for all screening projects on
AMF strains. But the genetic homogeneity of an AMF strain does obviously not
exist: recent experiments on the variability of mycorrhizal phenotypes demon-
strated that the mutualism-parasitism continuum of mycorrhizal effectiveness is
even found within one single strain of an AMF containing only single spore
descendants (Feldmann et al. 1998; Feldmann 1998b).
In those experiments it remained unclear whether the mutualism-parasitism
continuum was based on the action of different AMF genotypes or showed genetic
differences between individual host seedlings, i.e. the reaction norm of the host
population to a genetically homogeneous AMF strain. It was of special importance
to clarify whether different genotypes occur within an AMF strain and whether their
action results in changes in mycorrhizal effectiveness.
In the results shown in this report and in earlier studies (Feldmann and Grotkass
2002) we focussed on the second question. We assumed that spores or AMF
infection units are able to colonize a host root-system without respect to their
later effectiveness (Feldmann 1998b) and that more than one infection unit of the
AMF population will be successful in infecting the roots. To prove the hypothesis
of different genotypes within an AMF population we therefore worked with distinct
fungal units, with single spores.
In our definition a ‘‘genotype’’ is a functional one, reacting to a given environ-
ment in a reproducible, predictable way for one propagation cycle of the spores as a
minimum. That means that the phenotypic characteristic of a symbiosis arising
from the inoculation of single spores must be reproduced when descendants of these
spores are inoculated to homogeneous plant material in a subsequent experiment.
A functional description of a genotype does not of course describe the actual
genetic differences between AMF units on the DNA level but is focussed on active
functional genes for specific interactions. Nevertheless, the chosen way reflects
genotypes as targets for eco-factor actions and therefore gives a strict orientation for
practice of mycorrhizal technology.
We here present a procedure for handling potential genetic differences of an
inoculum by directing the variability of effectiveness via the technical modification
20 Best Production Practice of Arbuscular Mycorrhizal Inoculum 333

of abiotic and biotic selection factors during the inoculum production process. This
procedure, called the directed inoculum production process (DIPP), increased the
predictability of the qualitative and quantitative output of the symbioses. DIPP
might serve as a prototype for process optimizations which finally lead to the
achievement of AMF inoculum with predictable characteristics.
Producing AMF inoculum is no longer a ‘‘black box’’ process. Defining an AMF
‘‘genotype’’ we focussed on phenotypic effects which were pronounced in the hosts
by single-spore inoculation, and could be reproduced after replication of single
spore descendants (compare Tommerup 1988, who defined the AMF species level
as AMF genotype). Nevertheless, the stability of the characteristics was very low,
indicating that there might be a mechanism involved which can change the strain
characteristics rapidly to a certain extent. To us, such changes do not occur
spontaneously but are triggered by abiotic or biotic ecofactors including the host
itself. If we assume that gene/gene interactions of host and fungus establish
and perform a symbiosis (Krishna et al. 1985; Lackie et al. 1988; Gallotte et al.
1993), and if we accept that the quantitative effects of the symbiosis depend on
polygenic characters of the host, any increasing or decreasing variability of the host
phenotype may be due to a large amount of mycorrhiza-induced changes to the host
physiology.
Of special importance is the multinuclear character of AMF spores (Peterson and
Bonfante 1994; Genre and Bonfante 1997; Lingua et al. 1999). We still do not know
how many and which nuclei of an AMF spore are active, how they are activated
and what influence the heterocaryosis within a spore would have on the effects
observed. Does caryogamy exist? Does a population biological process exist
favouring the selection of specially adapted nuclei within the population of single
spore descendants of an AMF strain? Are strain characteristics mixed under the
control of the host? Due to the relative stability of AMF effectiveness after one
propagation cycle there is no arbitrary exchange of information between spores of a
spore population colonizing a host during this process but a competition between
genotypes being controlled by the host or not.
This hypothesis means that a 100% predictability of mycorrhizal effectiveness
cannot be achieved. This information is necessary for the selection of target areas,
target effects, target plants, and design of inoculum.
The directed inoculum production process presented here integrates many
aspects resulting from the practical extrapolation of theoretical hypothesis, and is
already leading to more than 85% predictability under commercial conditions. That
means that we solved a general problem to an extent which probably reaches the
biological limitations of the system. In future we will turn to technical applications
of DIPP, e.g. in bioreactors and in vitro techniques. But clarifying the basis of
mycorrhizal dependency of host plant species (compare Tewari et al. 1993;
Boyetchko and Tewari 1995) will be of special importance for the economically
successful application of mycorrhizal technology in agriculture and horticulture in
the future.
334 F. Feldmann et al.
References
Allen M (1991) The ecology of mycorrhizae. Cambridge University Press, Cambridge, UK, p 180
Alten H, Blal B, Dodd JC, Feldmann F, Vosatka M (2002) Quality control of arbuscular
mycorrhizal fungi inoculum in Europe. In: Gianinazzi H, Schuepp H, Barea JM,
Haselwandter K (eds) Mycorrhiza technology in agriculture: from genes to bioproducts.
Birkhauser, Switzerland, pp 281–296
Azcon R, Ocampo JA (1981) Factors affecting the vesicular arbuscular infection and mycorrhizal
dependency of thirteen wheat cultivars. New Phytol 87:677–685
Bagyaraj DJ (1994) Vesicular–arbuscular mycorrhiza: Application in Agriculture. In: Norris JR,
Read DJ, Varma AK (eds) Techniques for the study of mycorrhiza. Academic, London,
pp 819–833
Baltruschat H (1993) Zur okosystemaren Bedeutung der VA-Mykorrhiza in Agrarokosystemen
und Moglichkeiten der praktischen Nutzung dieser Symbiose. Habilitation in the FB 17 of the
University of Giessen, Germany
Boyetchko SM, Tewari JP (1995) Susceptibility of barley cultivars to vesicular–arbuscular
mycorrhizal fungi. Can J Plant Sci 75:269–275
Chang DCN (1994) What is the potential for management of VAM in horticulture? In: Robson
AD, Abott LK, Malajczuk N (eds) Management of mycorrhizas in agriculture, horticulture and
forestry. Kluwer, Dordrecht, pp 187–190
Dodd JC, Thomson BD (1994) The screening and selection of inoculant arbuscular mycorrhizal
and ectomycorrhizal fungi. In: Robson AD, Abott LK, Malajczuk N (eds) Management of
mycorrhizas in agriculture, horticulture and forestry. Book Kluwer, Dordrecht, pp 149–158
Feldmann F, Idczak E (1994) Inoculum production of VA-mycorrhizal fungi. In: Norris JR, Read
DJ, Varma AK (eds) Techniques for mycorrhizal research. Academic, San Diego, pp 799–817
Feldmann F (1998a) Symbiontentechnologie in der Praxis: Arbuskulare Mykorrhiza im Garten-
bau. Thalacker-Medien, Braunschweig, Germany
Feldmann F (1998b) The strain-inherent variability of arbuscular mycorrhizal effectiveness: II.
Effectiveness of single spores. Symbiosis 25:131–143
Feldmann F (2007) The concept of best agricultural practice. Personally published, ISBN: 978-
3-00-021432-5, pp 42
Feldmann F, Grotkass C (2002) Directed inoculum production — shall we be able to design AMF
populations to achieve predictable symbiotic effectiveness? In: Gianinazzi H, Schuepp H,
Barea JM, Haselwandter K (eds) Mycorrhiza technology in agriculture: from genes to biopro-
ducts. Birkhauser, Switzerland, pp 261–279
Feldmann F, Kruse W, Boyle C, Lieberei R (1998) The strain-inherent variability of arbuscular
mycorrhizal effectiveness: I. Development of a test system using Petroselinum crispum as
Host. Symbiosis 25:115–129
Feldmann F, Hutter I, Niemann P, Weritz J, Grotkass C, Boyle C (1999) Einbindung der Mykor-
rhizatechnologie in die Heil- und Zierpflanzenproduktion sowie den Endverkauf. Mitt Biol
Bundesanst 363:6–38.
Genre A, Bonfante P (1997) A mycorrhizal fungus changes microtubule orientation in tobacco
root cells. Protoplasma 199:30–38
Gallotte A, Gianinazzi Pearson V, Giovanetti M, Sbrana C, Avio L, Gianinazzi S (1993) Cellular
localization and cytochemical probing of resistance reactions to arbuscular mycorrhizal fungi
a ‘‘locus a’’ myc negative mutant of Pisum sativum L. Planta (Heidelberg) 191:112–122
Johnson NC, Graham JH, Smith FA (1997) Functioning and mycorrhizal associations along the
mutualism-parasitism continuum. New Phytol 135:575–586
Krishna KR, Shetty KG, Dart PJ, Andrews DJ (1985) Genotype-dependent variation in mycorrhi-
zal colonization and response to inoculation of pearl millet (Pennisetum americanum). PlantSoil 86:113–126
20 Best Production Practice of Arbuscular Mycorrhizal Inoculum 335

Lackie SM, Bowley SR, Peterson RL (1988) Comparison of colonization among half-sib families
of Medicago sativa L. by Glomus versiforme (Daniels and Trappe) Berch. New Phytol
108:477–482
Lingua G, Sgorbati S, Citterio A, Fusconi A, Trotta A, Gnavi E, Berta G (1999) Arbuscular
mycorrhizal colonization delays nucleus senescence in leek root cortical cells. New Phytol
141:161–169
Miller JC, Rajzpakse S, Garber RK (1986) VAM in vegetable crops. Hortic Sci 21:974–984
Nemec S (1987) VAM in horticultural systems. In: Safir SR (ed) Ecophysiology of VAM plants.
CRC Press, Boca Raton, pp 193–221
Peterson RL, Bonfante P (1994) Comparative structure of vesicular–arbuscular mycorrhizas and
ectomycorrhizas. Plant Soil 159:79–88
Schenck N.C. (1984). Methods and principles of mycorrhizal research. Am Phytopathol Soc, St.
Paul, Minnesota, p 244
Sieverding E. (1991). Vesicular-arbuscular mycorrhiza management in tropical ecosystems.
Deutsche Gesellschaft fur Technische Zusammenarbeit, Eschborn
Stocker O (1947) Probleme der pflanzlichen Durreresistenz. Naturwissenschaften 34:362–371
Tewari L, Johri BN, Tandon SM (1993) Host genotype dependency and growth enhancing ability
of VA-mycorrhizal fungi for Eleusine coracana (finger millet). World J Microbiol Biotechnol
9:191–195
Thompson JP (1994) What is the potential for management of mycorrhizas in agriculture? In:
Robson AD, Abott LK, Malajczuk N (eds) Management of mycorrhizas in agriculture,
horticulture and forestry. Kluwer, Dordrecht, pp 191–200
Tommerup IC (1988) Long-term preservation by L-drying and storage of vesicular arbuscular
mycorrhizal fungi. Trans Br Mycol Soc 90:585–592
Varma A, Schuepp H (1994) Infectivity and effectiveness of Glomus intraradices on micropro-
pagated plants. Mycorrhiza 5:29–37
Weissenhorn I, Feldmann F (1999) Perspektiven der Nutzung der arbuskularen Mykorrhiza
im niederlandischen Gartenbau unter Glas. Mitteilungen der Biologischen Bundesanstalt
363:65–73
336 F. Feldmann et al.

Chapter 21
The Use of AMF and PGPR Inoculants Singly
and Combined to Promote Microplant
Establishment, Growth and Health
Mauritz Vestberg and Alan C. Cassells
21.1 Introduction
Micropropagation is an alternative to seed and vegetative propagation for the
production of planting material (Hartman et al. 2001; Cassells 2005). Micropropa-
gation is often cited as the most successful example of a laboratory technique that
has become an important commercial industry (Sahay and Varma 2000). Tissue
culture or laboratory-based methods of propagation involve higher capital, recur-
rent and labour costs than conventional propagation methods. Labour, for example,
has been estimated at approximately 60% of the total cost of production of the
micropropagules. Consequently, the competitiveness of micropropagation is im-
proved if production is located in a low labour cost economy. Alternatively or
additionally, the competitiveness of micropropagation can be further increased by
automation of the labour-intensive stages. Nevertheless, micropropagation can only
compete directly on price with expensive seed and higher value vegetative propa-
gules. Micropropagation can become more competitive in its niche markets by
reducing production losses and by adding value to micropropagules, e.g. guarantee-
ing freedom from specified pathogens, having novel genotypes and by establishing
and growing on the microplants before selling them as liners or finished plants
(Cassells 2005). Value can also be added potentially by exploiting the benefits of
biological inoculants to protect the plants at establishment, thereby reducing pro-
duction losses and promoting the growth of the microplants. Additionally, if the
M. Vestberg (*)
MTT Agrifood Research Finland, Plant Production Research Laukaa, Antinniementie1, FI-41330
Vihtavuori, Finland
e-mail: [email protected]
L. CassellsDepartment of Zoology, Ecology and Plant Science, National University of Ireland Cork, Ireland
A. Varma and A.C. Kharkwal (eds.), Symbiotic Fungi, Soil Biology 18, 337
DOI: 10.1007/978‐3‐540‐95894‐9_21, # Springer‐Verlag Berlin Heidelberg 2009
benefits of inoculant are carried forward to improve the field performance of the
microplants this should command a higher selling price.
Malfunctional stomata and thin cuticles where the deposition of cuticular wax
has been impaired have been proposed as contributing to poor establishment of
microplants through failure of these systems to control water relations in the
microplant, leading to desiccation of the tissues (Davies and Santamaria 2000).
Stage 3 of micropropagation (Cassells and Gahan 2006) is used to prepare the
microplants for weaning (termed in vitro weaning), which involves strategies to
induce functionality in leaf and root function (Debergh et al. 2000). This problem,
which may be covert, conventionally has been addressed by establishing the plants
in a fogged or misted tunnel with shading to prevent photobleaching (see below).
Sensitivity of the poorly developed photosystems of microplants to high ambient
light intensity has been addressed by shading of the establishment bench. It is
possible that PGPR and/or AMF inoculants added in Stage 3 may improve micro-
plant establishment and early post-establishment growth.
Another problem encountered at micropropagule establishment is that the asepti-
cally produced tissues, which may be ‘soft’, i.e. hypolignified and ‘juvenile’, may
have poorly developed constitutive pest and disease resistance akin to seedlings
which, when combined with the absence of a protective rhizosphere flora and adverse
reaction to some pesticides (Werbrouck and Debergh 1996), makes them susceptible
to pests and pathogens (Williamson et al. 1997). This problem may be compounded
when poor physiological quality results in a growth check while the autotrophic state
and stomatal and root functionality are achieved (Davies and Santamaria 2000).
Limited energy reserves in the micropropagules (Van Huylenbroeck et al. 1998) may
also restrict the expression of inducible defences (Strange 2003).
Micropropagules are produced in a biological vacuum in sterile laboratory
conditions in the absence of microorganisms (Vestberg et al. 2002). However,
upon transplanting to a growing medium for weaning, they will immediately be
exposed to various kinds of microorganisms. These include pathogens and faculta-
tive pathogens that cause damping-off of the unprotected microplants (Williamson
et al. 1997). The weaning substrates are usually devoid of beneficial microorgan-
isms. Adding such microorganisms to the weaning substrate may therefore protect
the micropropagules against biotic and abiotic stress. Microorganisms such as
arbuscular mycorrhizal fungi (AMF), plant growth-promoting rhizobacteria
(PGPR), Rhizobium, Frankia, biocontrol fungi and bacteria, etc. have been studied
in this respect. All these organisms have their own mode of action, which has to be
taken into account when using them.
Several reviews have been written on the potential use of microorganims for
creating the beneficial rhizosphere in microplants (Vestberg and Estaun 1994;
Varma and Schuepp 1995; Lovato et al. 1996; Azcon-Aguilar and Barea 1997;
Budi et al. 1998; Rai 2001; Vestberg et al. 2002). Here, the potential of biological
inoculants to achieve an incremental improvement in microplant establishment and
to add value to micropropagules by improving post-establishment growth and
health, including pest and disease resistance, is discussed. Much of the evidence
for the beneficial effects of AMF and PGPR inoculants comes from their use in seed
338 M. Vestberg and A.C. Cassells

and vegetative propagation and it is hypothesised that, in addition to addressing the
above problems which are unique to microplants, results obtained with conventi-
onal propagules can, in principle, be extrapolated to micropropagules. It is appre-
ciated that for biological inoculants to be commercially attractive they should offer
at least a 4-fold return on the inoculum cost (Fravel et al. 1999). For a recent review
on the commercialisation of biological control inoculants see Fravel (2005).
21.2 Mode of Action and Safety of Inoculants
Many microorganisms have been investigated for their potential to directly control
pests and diseases of plants, and for their ability to form beneficial associations with
plants promoting growth and increasing pest and disease resistance based on
priming (‘biopriming’) of plant resistance mechanisms (Bloemberg and Lugtenberg
2001; Conrath et al. 2002; Nowak and Shulaev 2003). While many microorganisms
are known to form beneficial associations with plants, those that have been
investigated most include the mycorrhizal fungi, and the plant growth-promoting
and nitrogen-fixing rhizobacteria (Bashan 1998). Here, discussion will be restricted
to arbuscular mycorrhizal and non-nitrogen-fixing rhizobacteria, specifically to
Pseudomonas and Bacillus species, as these are seen to have potential to address
the general problems associated with weaning and post-establishment growth of
micropropagules. From an applied perspective, it should be noted that in spite of the
large number of journal articles on biocontrol inoculants, very few have advanced
to the stage of being formally approved in the US for commercial use (Fravel 2005).
The EPA-approved microorganisms include the fungal species Aspergillus flavus(2 isolates), Candida oleophila (1 isolate), Coniothyrium minitans (1 isolate),Gliocladium (2 species; 2 isolates), Trichoderma harzianum (3 isolates) for direct
pathogen control and bacterial species Agrobacterium radiobacter (2 isolates),
Ampelomyces quisqualis (1 isolate), Bacillus (3 species; 6 isolates), Pseudomonas(5 species, 5 isolates), Streptomyces griseoviridis (1 isolate) (Fravel 2005).
21.2.1 Arbuscular Mycorrhizal Fungi
The AMF, belonging taxonomically to the phylum Glomeromycota (Schußler et al.
2001), form a symbiotic relationship with more than 80% of plant species living on
land. Symbiosis plays an equally important role in natural ecosystems and in
agroecosystems. Mycorrhizae have been characterized as an ecosystem service to
humanity. In a narrow sense, symbiosis means a mutualistic relationship between
AMF fungus and host. Benefits attributed to a functional AMF symbiosis include
increased plant growth due to improved nutrient uptake, especially phosphorus (P),
(Marschner and Dell 1994) and water (Al-Karaki and Clark 1998; Auge et al. 2004;
George et al. 1992), alleviation of biotic (Linderman 2000) and abiotic (Barea et al.
1993) stress, and improved soil aggregation (Miller and Jastrow, 1990; Rillig and
21 The Use of AMF and PGPR Inoculants Singly 339

Mummey 2006). AMF may also interact with plant hormonal systems (Allen et al.
1980; Duan et al. 1996). Thus, AMF have three main ways of function as improvers
of nutrient and water uptake (often erroneously termed biofertilizers), as biocontrol
agents and as bioregulators (Lovato et al. 1996). In addition to increasing the
absorptive surface area of their host plant root systems, the hyphae of AMF provide
an increased area for interactions with other soil microorganisms, and an important
pathway for the translocation of energy-rich plant assimilates to the soil (Johansson
et al. 2004). Since plant roots in most ecosystems are mycorrhizal the rhizosphere
concept has been widened to include also the fungal structures around plant roots,
resulting in the concept ‘‘mycorrhizosphere’’ (Johansson et al. 2004; Rambelli
1973). The zone surrounding individual mycorrhizal hyphae is called the
‘‘hyphosphere’’.
For the beneficial effects, the plant must however also pay a price. Between 10
and 20% of the net photosynthates are required for formation, maintenance and
function of mycorrhizal structures (Jakobsen and Rosendahl 1990). A large amount
of this carbon eventually ends up in soil, which strongly affects microbial interac-
tions in the rhizosphere (Johansson et al. 2004). A presymbiotic and a symbiotic
phase can be recognised in the AMF symbiosis. The former phase can further be
developed into three steps including spore germination, host recognition and host
colonisation (Giovannetti 1997). The presymbiotic phase can also be characterized
as a parasitic phase, although this term is not always accepted in the mycorrhizal
society. Mycorrhizal associations have generally been classified as mutualisms, but
an increasing number of studies show that this is not always the case. Upon closer
analysis, there appears to be a continuum of plant responses to mycorrhizal colo-
nisation ranging from positive (mutualism) to neutral (commensalism) and negative
(parasitism) (Smith and Smith 1996; Johnson et al. 1997). Negative impacts of
AMF on plant growth have been shown, for example, at high soil P (Abbott and
Robson 1984; Liu et al. 2000), in peaty substrates (Linderman and Davis 2003;
Vestberg et al. 2000), with cultivars of low relative mycorrhizal dependency
(Declerck et al. 1995) and in micropropagation systems (Azcon-Aguilar et al.
1994; Uosukainen and Vestberg 1994).
21.2.2 Plant Growth Promoting Rhizobacteria (PGPR)
As first defined, the PGPR are bacteria, which either promote plant growth or
control plant disease (Kloepper and Schroth 1978). Those which have been most
extensively investigated for beneficial effects on seedlings and vegetative propa-
gules are principally Pseudomonas (Ramamoorthy et al. 2001) and Bacillus species(Kloepper et al. 2004). Many isolates have been selected for their ability to produce
iron-chelating siderophores, and/or antibiotics, and/or to a lesser extent, plant
growth regulators (Handelsman and Stabb 1996; Walling 2001). Feeding on root
exudates, the PGPR produce siderophores and antibiotics to protect their niche,
thereby antagonising pathogens and/or excluding pathogens from the rhizoplane
340 M. Vestberg and A.C. Cassells

(Walsh et al. 2001). Control of minor or subliminal root pathogens (Suslow and
Schroth 1982), as reported when systemic fungicides were introduced, may also
result in yield increases, i.e. may be the expression of the ‘plant growth promotion’
effects. Other PGPR have been shown to produce plant growth regulators, which
affect plant growth (Schroth and Hancock 1982; Arshad and Frankenberger 1998;
Bloemberg and Lugtenberg 2001) or reduce the inhibitory effects of ethylene on
root growth (Glick et al. 1998). Some PGPR are nitrogen-fixing, e.g. Psuedomonasputida GR12–2 (Lifshitz et al. 1986), whereas most, like AMF, are involved in
nutrient cycling in the rhizosphere and exercise a general ‘biofertilizer’ effect
(Bashan 1998).
Some PGPR are known to induce systemic resistance (ISR – see systemic
acquired resistance (SAR); van Loon et al. 1998; Heil and Bostock 2002). Such
plants are considered to have their defences primed such that, on subsequent
infection, they are rapidly up-regulated compared with an non-inoculated, non-
primed plant (Kuc 2001). The determinants of ISR induction in Pseudomonas spp.include lipopolysaccharides, siderophores and either salicyclic acid or jasmonic
acid (Ramamoorthy et al. 2001; Kloepper et al. 2004). It is interesting to note here
that Bacillus spp. commonly both promote plant growth and induce systemic
resistance, whereas ISR is not as frequently associated with growth promotion by
Pseudomonas spp. (Kloepper et al. 2004).PGPR inoculants developed for use in the seed and vegetative propagations
sectors have also been used by micropropagators (e.g. Duffy et al. 1999; Sharma
and Nowak 1998; Barka et al. 2000; Cordier et al. 2000; Sturz et al. 2000; Srinath
et al. 2003; Vestberg et al. 2002; Vestberg et al. 2004; Mia et al. 2005; Rodriquez-
Romero et al. 2005; Tahmatsidou et al. 2006). Unlike the reported plant genotype –
AMF isolate specificity reported (Mark and Cassells 1996, see above), PGPR
appear to exhibit less host specificity but, like AMF inoculants, which are strongly
influenced by the substrate in which the plants are established and grown, similar
problems may be anticipated for some micropropagule growing systems (Hoitink
and Boehm 1999; Krause et al. 2001). Microplants are generally established in
greenhouses in hydroponics or artificial substrates. Such substrates may include
peat-based formulations where available, or peat substitutes such as coir. This is in
contrast with conventional propagules, which are commonly planted into intensively
cultivated soils with a depleted microflora (generally low competition favours
inoculants) at one extreme, and into highly fertile soils (containing antagonists
and competitors of the inoculant) at the other extreme (Hoitink and Boehm 1999).
In contrast to AMF, PGPR are less sensitive to substrate phosphate concentration.
Safety guidelines for the evaluation of inoculant have been established (Cook
et al. 1996). Of paramount concern is the risk to users and consumers reflected in
the withdrawal of Pseudomonas (Burkholderia) cepacia, which is associated with
a human health risk (Parke and Gurian-Sherman 2001). Unlike AMF inoculants,
PGPR pose potentially greater human health risks because of their relatedness to
human (and animal) pathogenic bacteria and the ease with which bacteria exchange
genes. Another concern is associated with the release of non-native organisms into
21 The Use of AMF and PGPR Inoculants Singly 341

a new quarantine zone; this however has not prevented the commercialisation of
European PGPR inoculants in North America (Fravel 2005) and vice versa.
21.3 Selection, Production and Formulation of Inoculants
Some, on ecological grounds, have suggested that microorganisms should be sought
in pathogen-suppressive soils, or at least from soils and environments similar to
those in which the inoculant will be used (Cook and Baker 1983). However,
economic constraints may influence the methods used to select potential inoculants
as inoculum producers seek to reduce costs by seeking ‘universal’ strains which
have wide soil and environmental tolerance (Schisler and Slininger 1997; Fravel
2005). In general, AMF inoculants show high host genotype-environment sensitivity,
whereas PGPR inoculants have a broad host range and wide environmental tolerance.
21.3.1 Arbuscular Mycorrhizal Fungi
Many species of AMF can infect a wide range of plant hosts. In early studies AMF
were therefore regarded non-specific also in terms of symbiotic functionality. In the
1970s and 1980s research with AMF was much focussed on finding some super
strains capable of increasing plant biomass under any environmental and soil
conditions (Vosatka and Dodd 2002). However, studies done during the last decade
have shown a high degree of AMF/host genotype and environmental specificity. It
is now recommended that AMF strains intended for commercial use should be
selected from the environments similar to those of their intended use. In an experi-
ment at the English Channel tunnel, this principle was demonstrated by Dodd et al.
(2002) who showed the superior effects of inoculation with native AMF on the
growth of Elymus pycnantus in comparison with commercially produced non-
mycorrhizal plants.
For screening and producing AMF inoculum, the first basic requirement is to
have a large collection of characterized AMF. This is very laborious since special
care has to be taken to keep the strains uncontaminated with environmental micro-
organisms. Inoculum quality control is still one of the biggest bottlenecks in AMF
utilisation. Prediction of symbiotic effectiveness in terms of increased growth or
stress tolerance of the host is another obstacle to the successful commercial use of
AMF. Feldmann and Grotkass (2002) discussed this problem in connexion with a
directed inoculum production process (DIPP). They claim that in practice the
Mycorrhizal Effectivity Index (MEI, Bagyaraj 1994) should exceed 30% for creat-
ing an interest in potential customers. The challenges of mycorrhiza technology are
treated in more detail by Vosatka et al. (2008).
342 M. Vestberg and A.C. Cassells
21.3.2 Plant Growth-Promoting Rhizobacteria
In most cases, the potential of a PGPR isolate to control a pathogen has been based
on inhibition of the pathogen in in vitro co-cultivation tests, i.e. on testing for
antibiotic production (Han et al. 2000). Screening for growth promotion by inocu-
lation of plants, e.g. in vitro (Cassells 2000) and in vivo (Cordier et al. 2000), have
also been described. Methods have also been described for screening for ISR (Han
et al. 2000). Table 21.1 summarises the methods used to characterise inoculants and
plant responses. However, such isolates may not give economic control under field
conditions, particularly when introduced into soils of high fertility, such as land
converted to organic production, where they may not be able to achieve the critical
population density (Hoitink and Boehm 1999). In general, it is essential that
inoculants are tested in greenhouses or in the field production system in which
they are to be used to determine the host genotype–inoculant–pathogen isolate–
environment interaction, that is, to confirm their reliability (Fravel 2005). In the
case of application to micropropagules, they should be tested in the establishment
growth substrate (Krause et al. 2001).
PGPR are readily cultivable on a large scale in fermenters using established
technology (Eyal et al. 1997). The facilities are widely available on a contract basis.
Media details are in the public domain. Inoculum formulation may be based on
imbibing a carrier such as talc or methylcellulose with washed cells to achieve a
target density expressed as cfu/g of product. The carrier is then air-dried to set
moisture content, milled to a fine powder and stored under dry conditions in a
coldroom. More complex formulations are discussed in Burges (1998); Harris and
Adkins (1999); Walling (2001); Bashan et al. (2002).
A critical commercial issue is stability where inoculum must survive at point of
sale, survive shipment generally under ambient conditions, survive intermediate
storage and at point of use, being exposed to a wide range of temperatures along the
chain. It has been argued that while Pseudonomas species are quick colonisers of
roots, Bacillus species have the advantage of having heat-resistant spores, which
give good product shelf life. Current release of new isolates and sales of Bacillusinoculants would tend to support this view (Kloepper et al. 2004).
Product quality is major cause of concern to both producers and users of
biocontrol inoculants and it is essential that producers have an adequate quality
control system (Jenkins and Grzywacz 2000). In the case of PGPR inoculants,
product cfu/g can be determined by plate counts following serial dilutions, and
purity may be determined by examination of colony morphology. However, con-
firming the identity of the microorganism(s) in a formulation and inoculant persis-
tence in the growth substrate may be more problematic. This can be done using
molecular methods but at considerable cost (Stead et al. 2000). Emerging techni-
ques such as MALDI-TOF mass spectrometry of intact bacteria may offer rapid
identification with limited preparation and consumable costs (Cassells and Doyle
2006; Tahmatsidou et al. 2006).
21 The Use of AMF and PGPR Inoculants Singly 343

Table21.1
ThecharacterizationofPGPRandplantresponsesto
inoculantsandactivators.TheexpressionofISRandSARischaracterisedbythedetection
ofthegenes
PDF1.2andPR1,respectively.Unless
theseproteinsortheirrespectivemRNAsorother
selectivemarker
genearedetected(H
ammond-K
osack
andParker
2003;ReymondandFarmer
1998),theexpressionoftheresponse
should
bereferred
toas
increaseddisease
protection
Character
Expression
Testmethod
Reference
Pathogen
antagonism
Inhibitionofpathogen
growth
PGPRspotted
atthreepointsona
culture
plate
andsprayed
with
pathogen
spores,inhibition
zones
measured
van
Weeset
al.(1999)
Plantgrowth
promotion
Stimulationofplantgrowth
Measurementofplantheight/
biomass
Srinathet
al.(2003)
InductionofISR
Increaseddisease
protection
Rootinoculation/challengeof
seedlings
Han
etal.(2000);van
Weeset
al.(2000)
Inoculationofdetached
leaves
with
PGPRfollowed
bysprayingof
leaves
withpathogen
spores
Zhanget
al.(2002)
DetectionofPDF1.2
(defensin)by
RNAgel
blotanalysis
Spoel
etal.(2003)
InductionofSAR
Increaseddisease
protection
Foliar
inoculationwithnecrotising
pathogen/challengeinoculation
withsecondpathogen
Van
Weeset
al.(2000)
DetectionofPR1byRNAgel
blot
analysis
Spoel
etal.(2003)
Primingofplantdefences
Increaseddisease
protection
Spraying/drenchingofplantswith
elicitororplantactivator
followed
bypathogen
challenge
Cohen
(2002)
Floatingofleaves
onplant
activator/challengeinoculation
withpathogen
Tonet
al.(2002)
344 M. Vestberg and A.C. Cassells

21.4 Use of Inoculants in Micropropagation
21.4.1 Arbuscular Mycorrhizal Fungi
AM fungi have successfully been used for improving the establishment and growth
of microplants. As is the case for plants propagated from seeds or cuttings, a range
of factors affect the success of AMF inoculation in micropropagation systems.
These factors include timing of inoculation, properties of weaning and later sub-
strates, physiological state of micropropagules and host/AMF combinations. More-
over, in the last few years it has become evident that higher benefits from
inoculation can be obtained through combinations of AMF with other beneficial
soil organisms such as plant growth-promoting rhizobacteria (PGPRs) or biocontrol
fungi (Gianinazzi et al. 2003; Vestberg et al. 2004).
21.4.1.1 In Vitro Vs In Vivo Inoculation
Microplants can be inoculated with AMF both at the in vitro and post vitrum phase
of the micropropagation cycle. Sometimes an even later timing of inoculation is
necessary to avoid negative effects in microplants, which have a prolonged phase of
photoheterotrophic growth (Vestberg et al. 2002).
Pioneer work concerning in vitro AMF colonisation in root organ cultures
originates from the early 1960s (Mosse 1962). At that time the presence of
Pseudomonas was considered necessary for ensuring colonisation, but later on
bacteria-free cultures were established (Phillips 1971). After these early studies
the technique has been much improved. AMF growth in root organ cultures has
been found to be influenced by, for example, CO2 (Becard et al. 1992; Gianinazzi-
Pearson et al. 1989), plant flavonoids (Chabot et al. 1992) and root exudates
(Gianinazzi-Pearson et al. 1989). AMF spore production in vitro of G. intraradiceswas further greatly increased by St-Arnaud et al. (1996) in a two-compartment
system. They counted up to 15,000 mostly viable spores per agar plate in a sugar-
free compartment. The potential of this technique not only for research purposes
but also for large-scale inoculum production is obvious (St-Arnaud et al. 1996). In
the 2000s AMF in vitro monoxenic culture has been further developed. An interna-
tional in vitro collection of AMF has also been established (GINCO, http://emma.
agro.ucl.ac.be/ginco-bel/index.php). Several species of Glomus can now be pro-
duced and maintained in vitro in monoxenic culture. Such purified AMF strains
provide excellent possibilities for genetic, taxonomical, molecular biological,
physiological, etc. studies of AMF. The potential benefits of using aseptically
produced AMF inoculum for improving the growth of micropropagated banana
were demonstrated by Declerck et al. (2002).
AMF have been successfully introduced not only into root organ cultures but
also into the in vitro multiplication phase of micropropagation (Pons et al. 1983;
Ravolanirina et al. 1989). However, the specific techniques involved here are
21 The Use of AMF and PGPR Inoculants Singly 345

difficult to apply for mass production of micropropagated plants (Lovato et al.
1996; Vestberg and Estaun 1994). In addition, the extra benefit of an in vitro AMF
inoculation does not exceed that of an early post vitrum inoculation (Ravolanirina
et al. 1989; Branzanti et al. 1992). Another possibility is to use AMF in autotrophic
culture systems (Cassells 2000). Autotrophic culture has the advantage that it is
sugar-free and is carried out in simple mineral nutrient solutions, including low-
phosphate formulations (Vestberg et al. 2002). These conditions favour mycorrhizal
symbiosis.
Because weaning substrates normally lack indigenous AMF, in vivo inoculation
done at the weaning stage has been shown to decrease weaning stress and increase
early shoot growth in a large number of micropropagated horticultural high-value
crops. These include for example Annona cherimola (Azcon-Aguilar et al. 1994),
globe artichoke (Gianinazzi et al. 2003) banana (Jaizme-Vega et al. 1998; Yano-
Melo et al. 1999), cassava (Azcon-Aguilar et al. 1997), coffee (Vaast et al. 1996),
garlic (Lubraco et al. 2000), grapevine (Schubert et al. 1990) hortensia (Varma and
Schuepp 1994a) Leuceana leucosephala (Puthur et al. 1998), peach and pear
(Rapparini et al. 1994), potato (Vosatka and Gryndler 2000; Yao et al. 2002), and
strawberry (Vestberg 1992; Vestberg et al. 2004; Sharma and Adholeya 2004).
However, AMF utilization in microplants is not always a straightforward process
because of the great variety of micropropagated plants with different growth
requirements. Vestberg et al. (2002) divide the microplants into two groups includ-
ing those that are ‘‘easy’’ to acclimatize and those that are ‘‘difficult’’ to acclimatize.
These concepts agree well with the degree of photoautotrophy at the early weaning
stage. Strawberry is an example of a plant having a early start of photoautotrophy at
weaning including also fast formation of new roots. According to Vestberg et al.
(2002) certain cultivars of apple belong to the other extreme with slowly developing
autophototrophy. AMF utilization proved non-problematic in strawberry but much
more complicated in apple.
In some cases, AMF have not increased weaning survival but rather decreased it.
This phenomenon has been observed when studying several host/AMF combina-
tions. Uosukainen and Vestberg (1994) observed strongly decreased growth of
weaning survival of apple microcuttings with one AMF strain out of three, but all
strains improved subsequent growth. Similar results were obtained by Varma and
Schuepp (1994b) who observed species and cultivar-specific results in three micro-
propagated plant species. The effects ranged from mutualistic (hortensia), through
neutral (strawberry ‘Avanta’, raspberry Zeva I’) to negative (strawberry ‘Elsanta’,
raspberry ‘Himboqueen’). However, when the plants were transplanted into the
field AMF-inoculated plants were healthier and inoculated strawberry produced
more runners than uninoculated ones. Keller et al. (1997), working with two clones
of the in vitro-propagated legume Baptisia tinctoria, found strongly decreased
weaning survival in one clone but slightly increased plant survival in the other
after AMF inoculation, but no such results were obtained following Rhizobiuminoculation. Balla et al. (1998) observed decreased growth of peach at early
weaning, indicating a carbon drain effect, but after 5 months positive growth effects
due to AMF were also observed.
346 M. Vestberg and A.C. Cassells
21.4.1.2 Impact of Growing Medium
The growing media chosen for weaning and subsequent growth of micropropagated
plants are important not only for establishment and growth of the microplants but
also for the effectiveness of the mycorrhizal symbiosis. The amount of extractable
P in the growing medium has a great impact on growth responses in microplants
following inoculation (Vaast et al. 1996; Shashikala et al. 1999). However, physical
properties of the growing medium also affect results obtained by mycorrhizal
inoculation. Growers favour peat-based growing media although a trend towards
larger use of renewable materials is evident. Incompatibility between peat and
AMF, sometimes even inhibitory effects on AMF, has been observed in several
studies (Calvet et al. 1992; Estaun et al. 1994; Vestberg et al. 2000), but the nature
of this phenomenon is still not fully understood. Certain peat grades seem to be
more incompatible with AMF than others (Biermann and Linderman 1983; Calvet
et al. 1992; Linderman and Davis 2003). Often it has been found that AMF
colonisation can develop to acceptable levels in peat-based mixes but in mineral
soil the mycorrhizal symbiosis functions better, resulting in higher growth. (Schubert
et al. 1990; Vestberg et al. 2000; Vidal et al. 1992).
The incompatibility between peat and AMF is arguably the biggest bottleneck
for the large-scale utilization of AMF in horticultural substrates. The reasons
behind this phenomenon are still not defined. However, it is a known fact that
most peat types have a very low anion exchange capacity, which easily results in
high levels of extractable P in peaty substrates. The most important organic con-
stituents of peat are lipids (sometimes called also bitumen), such as resins and
waxes; humic substances, such as humines, fulvic and humic acids; and carbohy-
drates, such as pectins, hemicelluloses and cellulose. One or several of these
components may have a negative impact on AMF. On the other hand, AMF have
also been shown to be stimulated by humic substances (Gryndler et al. 2005). The
reason for the peat/AMF incompatibility may be in the rich microbial communities
of the peat. Some of these microorganisms have even been developed for use in
plant disease control (Tahvonen and Lahdenpera 1988). A multidisciplinary
approach including biologists and chemists is needed to further elucidate this
problem in utilization of mycorrhizae.
21.4.1.3 Effect Against Pathogens and Pests
AMF not only have an impact on nutrient uptake of microplants but also have the
potential to protect plants against biotic stress caused by nematodes and soil-borne
pathogens. This phenomenon is likely to be of greater importance in micropropaga-
tion systems than in other plant propagation systems. Microplants are susceptible to
pathogens because of their poor cuticular and root development and consequent
need to be maintained within a high humidity environment. The application of
AMF therefore offers not only an opportunity to reduce fertiliser inputs but also a
possibility of reducing the use of pesticides (Hooker et al. 1994a).
21 The Use of AMF and PGPR Inoculants Singly 347

Most studies concerning the use of AMF for controlling soil-borne disease in
microplants have been done with pathogens belonging to the genus Phytophthora.AMF have shown promising biocontrol properties against strawberry red core
disease caused by P. fragariae (Mark and Cassells 1996; Norman et al. 1996;
Norman and Hooker 2000). In micropropagated pineapple, AMF prevented growth
depressions caused by P. cinnamomi (Guillemin et al. 1994). In Prunus aviumG. mosseae had a protective effect against P. cinnamomi in one clone, but
G. intraradices had no such effect (Cordier et al. 1996). Similar results were
obtained by Yao et al. (2002) according to whom the control effect of AMF against
Rhizoctonia solani in potato was dependent on both AMF strain and potato cultivar.
Strawberry crown rot caused by P. cactorum rot was partly controlled by AMF in
one study (Vestberg et al. 2004), but the disease was increased in another study
(Vestberg et al. 1994). Two species of Glomus reduced both internal and external
symptoms of the Panama disease (caused by Fusarium oxysporum f. sp. cubense) inmicropropagated banana (Jaizme-Vega et al. 1998).
The mechanisms behind the protection against soil-borne fungal pathogens are
summarized by Azcon-Aguilar et al. (2002). They say that the AMF-induced
protection is probably a consequence of several interacting mechanisms and that
the relative contribution of different mechanisms is directly related to the AMF/
plant genotype combination and to the environmental conditions. Six possible
mechanisms are identified (Azcon-Aguilar et al. 2002): (1) improvement of plant
nutrient status/damage compensation, (2) competition for host photosynthates and
colonisation sites, (3) changes in the anatomy and architecture of the root system,
(4) microbial changes in the rhizosphere, (5) activation of local plant defence
mechanisms, and (6) systemic effects of AMF colonisation, i.e. induced systemic
resistance (ISR)
AMF have also been shown to protect plants against soil-borne nematodes
(Hooker et al. 1994b; Linderman 1994; Pinochet et al. 1996; Elsen et al. 2003).
In banana, G. mosseae suppressed root galling and nematode build-up in the roots
of Melodogyne incognita (Jaizme-Vega et al. 1997). Numbers of Pratylenchusbrachyurus nematodes per g of root were significantly decreased in mycorrhizal
pinapple microplants when the pathogen was introduced at planting out or 1 month
later. Both G. intraradices and G. mosseae suppressed build-up of P. vulnus in a
pear rootstock (Lopez et al. 1997). In a dixenic root organ culture including both the
AMF Glomus intraradices and the burrowing nematode Radopholos similes, Elsenet al. (2001) demonstrated that AMF suppressed the R. similis population by almost
50% and thus increased protection of the root against the nematode. The mecha-
nisms causing reduction in nematode numbers due to mycorrhizal inoculation is
still uncertain. Factors such as improved nutrient status, microbial changes in the
rhizosphere, competition for penetration sites and nutrients, biochemical changes in
the plant and anatomical changes in the roots have been proposed as possible
mechanisms (Linderman 1994). In connection with their study in dixenic roots
where many of the above alternatives can be ignored, Elsen et al. (2001) discussed
whether the effect of AMF on nematode numbers is connected to that of newly
348 M. Vestberg and A.C. Cassells

formed plant products such as symbiosis-related proteins which can also be
involved in plant defence at the site of infection.
In contrast to the above studies, nematode numbers have been reported to
increase due to AMF inoculation in some other studies. Calvet et al. (1995)
observed increased growth of micropropagated quince rootstock after inoculation
with G. intraradices and the nematode P. vulnus although a twofold increase in
final nematode populations was recovered from plants with combined inoculations
of pathogen and symbiont. They concluded that mycorrhizal rootstocks had
increased tolerance to the presence of nematodes despite the increased total num-
bers of nematodes. Studying the impact of co-inoculation with the AMFG.mosseaeand the nematode P. vulnus on growth and nematode populations in plum root-
stocks Camprubi et al. (1993) observed a considerably higher final nematode
population in the mycorrhizal cultivar Marianna than in non-mycorrhizal ‘Mar-
ianna’. However, shoot dry weights were higher in the majority of the AMF-
inoculated plants after both growing seasons.
21.4.2 Plant Growth-Promoting Rhizobacteria
Inoculation of conventional non-aseptic seed and vegetative propagules faces
competition from environmental microorganisms (Hoitink and Boehm 1999).
Consequently, in an attempt to ensure colonization with the inoculant the tissues
or growth substrate is ‘inundated’ with the inoculant, i.e. the inoculant is for-
mulated at high cfu (colony forming units). There is much research reported in
the literature on the use of bacterial inoculants as seed coatings and in formulations
for application to seed, to plant roots, to tubers as dips, in powder form for inclusion
in the potting compost or in the planting hole, or for watering onto the soil (Fravel
2005).
Inoculants for micropropagules are, generally, similarly applied (Sharma and
Nowak 1998; Duffy et al. 1999; Barka et al. 2000; Cordier et al. 2000; Sturz et al.
2000; Vestberg et al. 2002; Srinath et al. 2003; Vestberg et al. 2004; Mia et al. 2005;
Rodriquez-Romero et al. 2005; Tahmatsidou et al. 2006); the difference is that, in
the case of micropropagules, the inoculant does not have to compete with or
displace propagule resident microorganisms. Ideally, this aspect should be
exploited by applying the inoculum directly to the micropropagules before it is
planted in the substrate. In addition, as microplants are aseptic, gnotobiotic cultures
may be established by inoculation in vitro with PGPR (Cassells 2000) at relatively
low cfu (see benefits of in vitro inoculation with AMF (Cassells et al. 1996)). To
avoid the risk of the PGPR inoculant overrunning the micropropagules and becom-
ing vitropathogens (Cassells and Doyle 2006), inoculation is recommended under
autotrophic culture conditions where sucrose and other organic components are
removed from the medium (Cassells 2000). Inoculation is carried out in Stage 3
(preparation of micropropagules for return to the open environment). PGPR growth
and root colonization in vitro depends on the leakage of nutrients from the roots.
21 The Use of AMF and PGPR Inoculants Singly 349

21.5 Holistic Strategies for the Use of Inoculants
Often, inoculants fail to reproduce in commercial production the beneficial results
obtained in greenhouse microcosm experiments (Gurr and Wratten 2000). This
has led to the evaluation of a range of strategies for the deployment of inoculants.
These vary from the use of mixed formulations of inoculants, e.g. AMF or PGPR
formulations containing two or more AMF species or isolates or PGPR species
(Yan et al. 2002; Mia et al. 2005; Domenech et al. 2006) or isolates (Bora et al.
2004); combinations of AMF and PGPR (Rodriquez-Romero et al. 2005); multi-
ple combinations of AMF and PGPR (Vestberg et al. 2004); combinations of
AMF, PGPR and Trichoderma harzianum (Srinath et al. 2003); AMF, PGPR and
other bacteria (Bashan 1998); AMF, PGPR and nitrogen-fixing rhizobacteria, with
stimulants of AMF spore germination and plant colonization, plant stimulants and
fertilizers (Handelsman and Stabb 1996). The results of the use of multiple/com-
bined inoculants have been variable. Either the inoculants, or some combinations
thereof, may interact positively (Vestberg et al. 2004; Domenech et al. 2006) or
show no additive effects (Tahmatsidou et al. 2006), or sometimes the plants may
suffer from biological overload and show reduced yield (Cordier et al. 2000).
Another alternative strategy to the use of single inoculants, which approaches
the use of complex mixtures of inoculants, has been the attempt to establish a
‘beneficial microflora’. This may be through the use of relatively specific soil
adjuvants, e.g. chitin, which is a substrate for lytic enzyme-producing microorgan-
isms (including the widely used Trichoderma inoculants) (Rafferty et al. 2003) or
the use of compost, green manure and other organic amendments (Hoitink and
Boehm 1999; Rafferty and Cassells 2003). The concept of the beneficial microflora
is the essence of the buffered microflora characteristic of traditional farming
systems (Altieri 1995) and aspired to by farmers converting to organic farming,
which results in pathogen-suppressive soils (Cook and Baker 1983).
The main emphasis in the use of biocontrol inoculants has been for the control of
soil-borne pathogens, which are relatively unaffected by foliar fungicides (Handels-
man and Stabb 1996). Indeed, the market niche for inoculants has expanded with
the withdrawal of the soil sterilant methyl bromide (Ristaino and Thomas 1997;
USDA 2000; Tahmatsidou et al. 2006). The withdrawal of methyl bromide is but
one aspect of the general debate on the sustainability of intensive agriculture/
horticulture. On energy, food safety and environmental pollution grounds there is
increasing pressure to adopt more sustainable, environmentally friendly production
methods (Chrispeels and Sadava 2003). The fungicide industry has responded by
developing synthetic ‘plant activators’ (Strange 2003; Agrios 2004). Commercial
plant activators include reactive oxygen species, analogues of the SAR (systemic
acquired resistance) signalling-compounds salicylic acid and of ISR-signalling
compounds jasmonic acid and ethylene (for reviews see Oostendorp et al. 2001;
Gozzo 2003). For reviews on fungal and bacterial elicitors of plant defence
responses, and for the signalling pathways involved see: Gatz (1997); Chang and
350 M. Vestberg and A.C. Cassells

Shockey (1999); Pieterse and van Loon (1999); Clarke et al. (2000); Kunkel and
Brooks (2002); Strange (2003); Laloi et al. (2004).
The use of AMF and/or PGPR to prime the plant’s ISR/SAR response, sequen-
tially with the use of plant activators and elicitors of SAR, may offer an effective
strategy for controlling both soil-borne and foliar diseases of plants (see Fig. 21.1).
Preliminary evaluation of this hypothesis has indicated that PGPR or AMF com-
bined with foliar spraying with an elicitor can be used to control late blight of potato
caused by Phytophthora infestans (O’Herlihy et al. 2001).
PGPR/AMFPGPR/AMF
Microplantin vitro
Microplantin vitro
BioprimedHaulm
BioprimedRoots
BioprimedHaulm
Bioprimed Roots
1.Inoculation in vitro (top) orin vivo (bottom) withPGPR/AMF inoculants(s)to establish a ‘beneficialrhizosphere
2. Enhancement of the‘beneficial rhizosphere’
3. Bioprimed stem and leaves
4. Chemical activationof plant defences
5. Protectionagainstairborne andsoilbornepests anddiseases
Fig. 21.1 An illustration of the proposed strategy for holistic biocontrol of plant pests and
diseases of the root system and above-ground parts of the plant. Step 1 involves inoculation with
selected PGPR and/or AMF, with the objective of introducing pathogen antagonism, plant growth
promotion and induction of ISR (see text for selection criteria, also Table 21.1). This may be
carried out in autotrophic culture in vitro, or at establishment of the microplants. Step 2 may
involve soil inoculation with additional microorganisms such as Trichoderma and free-living
nitrogen-fixing bacteria and/or the addition of soil amendment such as chitin to promote the
Step 1 inoculants and other pathogen antagonists. Step 3 ‘Biopriming’ is the consequence of
inoculation with ISR-inducing inoculants. Prime plant defences are expressed on pathogen or
pest attack more strongly than non-primed defences. Step 4 Activation of (primed) plant defences
involves spraying with ‘chemical activators’; the term in the broad sense includes elicitors and
signalling compounds such as nitric oxide, reactive oxygen species, salicylic acid, jasmonic acids
and ethylene and their analogues (Cohen 2002). Broad spectrum defence responses may be
expressed following spraying with inducers of both SAR and ISR (Ton et al. 2003), but it has
been argued that enhancement of the defence response appropriate to the specific pathogen may
give better control (Kunkel and Brooks 2002). The efficiency of the spray application may be
improved when based on forecast of the disease specific risk(s). Some treatment may result in
increased susceptibility to non-target pests and diseases (Thaler et al. 1999)
21 The Use of AMF and PGPR Inoculants Singly 351
21.6 Conclusions
In view of the high cost of micropropagation, there is a need to improve the quality
and disease resistance of microplants to ensure 100% establishment, rapid growing
on and improved resistance to pests and diseases, especially damping-off diseases.
There is evidence from the literature (see above) of the beneficial effects of
inoculants for both growth promotion and improved disease resistance, but not all
inoculants or more complex formulations of inoculants have been shown to be
positive (e.g. see Vestberg et al. 2004).
Given the high cost of micropropagules, they are usually grown on in intensive
propagation systems. There has been much concern about the use of pesticides in
intensive greenhouse production and there is the universal concern about the
sustainability of agriculture, problems of chemical residues in produce and the
environmental impact of pesticides. This poses the challenge as to whether
biological strategies can reduce pesticide usage or, indeed, substitute for pesticides.
Holistic biocontrol strategies, involving the use of inoculants to protect against soil-
borne diseases and to promote plant growth and bioprime the plants defences,
combined with the use of plant activators, ideally natural elicitors, to activate the
primed defences for the control of haulm diseases, have been proposed (O’Herlihy
et al. 2003). These strategies require the development of methods for screening
potential inoculants for the traditional traits of pathogen suppression, for growth
promotion and for their ability to prime plant defences. Also, it will be necessary to
screen plant activators for their ability to augment primed defence response (Table
21.1). In the latter regard, it is important to recognise that salicylate and its
analogues, signal specific components of the biotic stress response, i.e. SAR
proteins, whereas optimisation of the defence response may require elicitation of
a broader response (McDowell and Dangl 2000; Conrath et al. 2002).
The combination of adding value to the micropropagules by improving estab-
lishment and to the plants derived from them by influencing ontogenetic develop-
ment (Duffy and Cassells 1999) and by improving disease resistance has to be offset
against the cost of the inoculants and saving in the cost of pesticides and, possibly,
fertilizers. It remains to be determined which isolates or combination of isolates,
and which plant activators, will provide these benefits and whether pathogen- and
genotype-independent strategies can be developed to enable access to a large
market for the products.
References
Abbott LK, Robson AD (1984) The effect of VA mycorrhizae on plant growth. In: Powell CL,
Bagyaraj DJ (eds) VA mycorrhizae. CRC Press, Boca Raton, pp 113–130
Agrios GN (2004) Plant pathology, 5th edn. Wiley, New York
Al-Karaki GN, Clark RB (1998) Growth, mineral nutrition, and water use by mycorrhizal wheat
under water stress. J Plant Nutr 21:263–276
352 M. Vestberg and A.C. Cassells
Allen MF, Moore TS Jr, Christensen M (1980) Phytohormone changes in Bouteloua gracilisinfected by vesicular–arbuscular mycorrhizae. I. Cytokinin increases in the host plant. Can J
Bot 58:371–374
Altieri MA (1995) Agroecology: the science of sustainable agriculture. Westview Press, Boulder
Arshad M, Frankenberger WT (1998) Plant growth promoting substances in the rhizosphere:
microbial production and function. Adv Agron 62:45–151
Auge RM, Sylvia DM, Park S, Buttery BR, Saxton AM, Moore JL, Cho K (2004) Partitioning
mycorrhizal influence on water relations of Phaseolus vulgaris into soil and plant components.
Can J Bot 82:503–514
Azcon-Aguilar C, Barea JM (1997) Applying mycorrhiza biotechnology to horticulture: signifi-
cance and potentials. Sci hortic 68:1–24
Azcon-Aguilar C, Cantos M, Troncoso A, Barea JM (1997) Beneficial effect of arbuscular
mycorrhizas on acclimatization of micropropagated cassava plantlets. Sci Hortic 72:63–71
Azcon-Aguilar C, Encina CL, Azcon R, Barea JM (1994) Effect of arbuscular mycorrhiza on the
growth and development of micropropagated Annona cherimola plants. Agric Sci Finland
3:281–288
Azcon-Aguilar C, Jaizme-Vega MC, Calvet C (2002) The contribution of arbuscular mycorrhizal
fungi to the control of soil-borne plant pathogens. In: Gianinazzi S, Schuepp H, Barea JM,
Haselwandter K (eds) Mycorrhizal technology in agriculture. Birkhauser Verlag, Basel, pp
187–197
Bagyaraj DJ (1994) Vesicular–arbuscular mycorrhiza: Application in agriculture. In: Norris JR,
Read DJ, Varma AK (eds) Techniques for the study of mycorrhiza. Academic, London, pp
819–833
Balla I, Vertesy J, Biro B, Voros I (1998) Survival and growth of micropropagated peach
inoculated with endomycorrhizal strains. Acta Hortic 477:115–121
Barea JM, Azcon R, Azcon-Aguilar C (1993) Mycorrhiza and crops. Adv Plant Pathol 9:167–189
Barka EA, Belarbi A, Hachet C, Nowak J, Audran J-C (2000) Enhancement of in vitro growth andresistance to gray mould of Vitis vinifera co-cultured with plant growth-promoting rhizobac-
teria. FEMS Microbiol Lett 186:91–95
Bashan Y (1998) Inoculants of plant growth-promoting bacteria for use in agriculture. Biotechnol
Adv 16:729–770
Bashan Y, Hernandez J-P, Leyva LA, Bacilio M (2002) Alginate microbeads as inoculant carriers
for plant growth-promoting bacteria. Biol Fertil Soils 35:359–368
Becard G, Douds DD, Pfeffer PE (1992) Extensive in vitro hyphal growth of vesicular–arbuscularmycorrhizal fungi in the presence of CO2. Appl Environ Microbiol 58:821–825
Biermann B, Linderman RG (1983) Effect of container plant growth medium and fertilizer
phosphorus on establishment and host growth response to vesicular–arbuscular mycorrhizae.
J Am Soc Hort Sci 108:962–971
Bloemberg GV, Lugtenberg BJJ (2001) Molecular basis of plant growth promotion and biocontrol
by rhizobacteria. Curr Opin Plant Biol 4:343–350
Bora T, Ozaktan H, Gore E, Aslan E (2004) Biological control of Fusarium oxysporum f. sp.
melonis by wettable powder formulations of two strains of Pseudomonas putida. J Phytopathol152:471–475
Branzanti B, Ganinazzi-Pearson V, Gianinazzi S (1992) Influence of phosphate fertilization on the
growth and nutrient status of micropropagated apple infected with endomycorrhizal fungi
during the weaning stage. Agronomie 12:841–845
Budi SW, Cordier C, Trouvelot A, Gianinazzi-Pearson C, Gianinazzi S (1998) Arbuscular
mycorrhiza as a way of promoting sustainable growth of micropropagated plants. Acta Hortic
457:71–77
Burges HD (1998) Formulation of Microbial Biopesticides. Kluwer, Dordrecht
Calvet C, Estaun V, Camprubi A (1992) Germination, early mycelial growth and infectivity of a
vesicular–arbuscular mycorrhizal fungus in organic substrates. Symbiosis 14:405–441
21 The Use of AMF and PGPR Inoculants Singly 353
Calvet C, Pinochet J, Camprubı A, Fernandez C (1995) Increased tolerance to the root lesion
nematode Pratylenchus vulnus in mycorrhizal micropropagated BA-29 quince rootstock.
Mycorrhiza 5:253–258
Camprubi A, Pinochet J, Calvet C, Estaun V (1993) Effects of the root-lesion nematode Praty-lenchus vulnus and the vesicular–arbuscular mycorrhizal fungus Glomus mosseae on the
growth of three plum rootstocks. Plant Soil 153:223–229
Cassells AC (2000) Aseptic microhydroponics: a strategy to advance plant development. Acta
Hortic 530:187–194
Cassells AC (2005) Principles of Micropropagation. In: Murch SJ, Saxena PK (eds) Journey of a
single cell to a plant. Science Publishers, Enfield NH, pp 287–308
Cassells AC, Doyle BM (2006) Pathogen and Biological Contamination Management. In: Loyola-
Vargas VM, Vazquez-Flota F (eds) Plant cell protocols (2nd edn). Humana Press, Totowa NJ,
pp. 35–50
Cassells AC, Gahan PB (2006) Dictionary of plant tissue culture. Haworth Press, New York
Cassells AC, Mark GL, Periappuram C (1996) Establishment of arbuscular mycorrhizal fungi in
autotrophic strawberry culture in vitro: Comparison with inoculation of microplants in vivo.Agronomie 16:625–632
Chabot S, Bel-Rhlid R, Chenevert R, Piche Y (1992) Hyphal growth promotion in vitro of the VAmycorrhizal fungus, Gigaspora margarita Becker & Hall, by the activity of structurally
specific flavonoid compounds under CO2-enriched conditions. New Phytol 122:461–467
Chang C, Shockey JA (1999) The ethylene-response pathway: signal perception to gene regula-
tion. Curr Opin Plant Biol 2:352–358
Chrispeels MJ, Sadava DE (2003) Plants, genes and crop biotechnology (2nd edn). Jones &
Bartlett, Boston
Clarke JD, Volko SM, Ledford H, Ausubel FM, Dong X (2000) Roles of salicylic acid, jasmonic
acid, and ethylene in cpr-induced resistance in Arabidopsis. Plant Cell 12:2175–2190Cohen YR (2002) b-aminobutyric acid-induced resistance against plant pathogens. Plant Dis
86:448–457
Conrath U, Pieterse CMJ, Mauch-Mani B (2002) Priming in plant-pathogen interactions. Trends
Plant Sci 7:210–216
Cook RJ, Baker KF (1983) The nature and practice of biological control of plant pathogens. APS,
St Paul, MN
Cook RJ, Bruckart WL, Coulson JR, Goettel MS, Humber RA, Lumsden RD, Maddox JV,
McManus ML, Moore L, Meyer SF, Quimby Jr PC, Stack JP, Vaughn JL (1996) Safety of
microorganisms intended for pest and plant disease control: a framework for scientific evalua-
tion. Biol Control 7:333–351
Cordier C, Lemoine MC, Lemanceau P, Gianinazzi-Pearson V and Gianinazzi S (2000)
The beneficial rhizosphere: a necessary strategy for microplant production. Acta Hortic
530:259–268
Cordier C, Trouvelot A, Gianinazzi S, Gianinazzi-Pearson V (1996) Arbuscular mycorrhiza
technology applied to micropropagated Prunus avium and to protection against Phytophthoracinnamomi. Agronomie 16:679–688
Davies WJ, Santamaria JM (2000) Physiological markers for microplant shoot and root quality.
Acta Hortic 530:363–375
Debergh PC, Topoonyanont N, Van Huylenbroeck J, Moreira da Silva H, Oyaert E (2000)
Preparation of microplants for ex vitro establishment. Acta Hortic 530:269–275
Declerck S, Plenchette C, Strullu DG (1995) Mycorrhizal dependency of banana (Musa acuminataAAA group) cultivar. Plant Soil 176:183–187
Declerck S, Risede J-M, Delvaux B (2002) Greenhouse response of micropropagated bananas
inoculated with in vitro monoxenically produced arbuscular mycorrhizal fungi. Sci Hortic
93:301–309
354 M. Vestberg and A.C. Cassells
Dodd JC, Dougall TA, Clapp JP, Jeffries P (2002) The role of arbuscular mycorrhizal fungi in
plant community establishment at Samphire Hoe, Kent, UK — the reclamation platform
created during the building of the Channel tunnel between France and the UK. Biodiv Conserv
11:39–58
Domenech J, Reddy MS, Kloepper JW, Ramos B, Gutierrez-Manero J (2006) Combined applica-
tion of the biological product LS213 with Bacillus, Pseudomonas or Chryseobacterium for
growth promotion and biological control of soil-borne diseases in pepper and tomato. Biocon-
trol 51:245–258
Duan X, Neuman DS, Reiber JM, Green CD, Sacton AM, Auge RM (1996) Mycorrhizal influence
on hydraulic and hormonal factors implicated in the control of stomatal conductance during
drought. J Expt Bot 47:1541–1550
Duffy EM, Cassells AC (1999) The effect of inoculation of potato (Solanum tuberosum L.)
microplants with arbuscular mycorrhizal fungi on tuber yield and tuber size distribution.
App Soil Ecol 15:137–144
Duffy EM, Hurley EM, Cassells AC (1999) Weaning performance of potato microplants following
bacterization and mycorrhization. Potato Res 42:521–527
Elsen A, Declerck S, De Waele (2001) Effects of Glomus intraradices on the reproduction of the
burrowing nematode (Radopholus similes) in dixenic culture. Mycorrhiza 11:49–51
Elsen A, Baimey H, Swennen R, De Waele D (2003) Relative mycorrhizal dependency and
mycorrhiza–nematode interaction in banana cultivars (Musa spp.) differing in nematode
susceptibility. Plant Soil 256:303–313
Estaun V, Calvet C, Camprubi A (1994) Arbuscular mycorrhizae and growth enhancement of
micropropagated Prunus rootstock in different soilless potting mixes. Agric Sci Finl 3:263–267
Eyal J, Baker CP, Reeder JD, Devane WE, Lumsden RD (1997) Large-scale production of
chlamydospores of Gliocladium virens strain GL-21 in submerged culture. J Ind Microbiol
Biotechnol 19:163–168
Feldmann F, Grotkass C (2002) Directed inoculum production — shall we be able to design
populations of arbuscular mycorrhizal fungi to achieve predictable symbiotic effectiveness? In:
Gianinazzi S, Schuepp H, Barea JM, Haselwandter K (eds) Mycorrhizal technology in agricul-
ture. Birkhauser Verlag, Basel, pp 261–279
Fravel DR (2005) Commercialization and implementation of biocontrol. Annu Rev Phytopathol
43:337–359
Fravel DR, Rhodes DJ, Larkin RP (1999) Production and commercialisation of biocontrol
products. In: Albajes R, Gullino ML, van Lenteren Y, Elad Y (eds) Integrated pest and disease
control in greenhouse crops. Kluwer, Dordrecht
Gatz C (1997) Chemical control of gene expression. Annu Rev Plant Physiol Plant Mol Biol
48:89–108
George E, Haussler K.-U, Vetterlein D, Gorgus E, Marschner H (1992) Water and nutrient
translocation by hyphae of Glomus mosseae. Can J Bot 70:2130–2137
Gianinazzi S, Oubaha L, Chahbandar M, Blal B, Lemoine M-C (2003) Biotization of microplants
for improved performance. Acta Hort 625:165–172
Gianinazzi-Pearson V, Branzanti B, Gianinazzi S (1989) In vitro enhancement of spore germina-
tion and early hyphal growth of a vesicular–arbuscular fungus by host root exudates and plant
flavonoids. Symbiosis 7:243–255
Glick BR, Penrose DM, Li J (1998) A model for the lowering of plant ethylene concentrations by
plant growth-promoting bacteria. J Theor Biol 190:63–68
Giovannetti M (1997) Host signals dictating growth direction, morphogenesis and differenciation in
arbuscular mycorrhizal symbionts. In: Schwemmler W, Muller NE, Schenck HEA (eds) Eukar-
yotism and symbiosis. Intertaxonomic combination versus symbiotic adaptation. Springer,
Berlin, pp 405–411
Gozzo F (2003) Systemic acquired resistance in crop protection: from nature to a chemical
approach. J Agric Food Chem 51:4487–4503
21 The Use of AMF and PGPR Inoculants Singly 355
Gryndler M, Hrselova H, Sudova R, Gryndlerova H, Rezacova V, Merhautova V (2005) Hyphal
growth and mycorrhiza formation by the arbuscular mycorrhizal fungus Glomus claroideumBEG23 is stimulated by humic substances. Mycorrhiza 15:483–488
Guillemin JP, Gianinazzi S, Gianinazzi-Pearson V, Marchal J (1994) Contributions of endomy-
corrhizas to biological protection of micropropagated pineapple (Ananas comosus (L.) Merr)
against Phytophthora cinnamomi Rands. Agric Sci Finl 3:241–251Gurr G, Wratten SD (2000) Biological control; measures of success. Kluwer, Dordrecht
Hammond-Kosack KE, Parker JE (2003). Deciphering plant–pathogen communication: fresh
perspectives from molecular resistance breeding. Curr Opin Biotechnol 14:177–193
Han DY, Coplin DL, Bauer WD, Hoitink HA (2000) A rapid assay for screening rhizosphere
microorganisms for their ability to induce systemic resistance. Phytopathology 90:327–332
Handelsman J, Stabb EV (1996) Biocontrol of soil borne pathogens. Plant Cell 8:1855–1869
Harris AR, Adkins PG (1999) Versatility of fungal and bacterial isolates for biological control of
damping-off disease caused by Rhizoctonia and Pythium spp. Biol Control 15:166–176
Hartman HT, Kester D, Davies F, Geneve R (2001) Hartman and Kester’s plant propagation:
principles and practice. Pearson Prentice Hall, Upper Saddle River, NJ
Heil M, Bostock RM (2002) Induced systemic resistance (ISR) against pathogens in the context of
induced plant defences. Ann Bot 89:503–512
Hoitink HAJ, Boehm MJ (1999) Biocontrol within the context of soil communities: a substrate-
dependent phenomenon. Annu Rev Phytopathol 37:427–446
Hooker JE, Gianinazzi S, Vestberg M, Barea JM, Atkinson D (1994a) The application of
arbuscular mycorrhizal fungi to micropropagation systems: an opportunity to reduce chemical
inputs. Agric Sci Finl 3:227–232
Hooker JE, Jaizme-Vega MC, Atkinson D (1994b) Biocontrol of plant pathogens using arbuscular
mycorrhizal fungi. In: Gianinazzi S, Schuepp H (eds) Arbuscular mycorrhizas on sustainable
agriculture and natural ecosystems. Birkhauser Verlag, Basel, pp 191–200
Jaizme-Vega MC, Sosa-Hernandez B, Hernandez-Hernandez JM (1998) Interaction of arbuscular
mycorrhizal fungi and the soil pathogen Fusarium oxysporum f.sp. cubense on the first stages
of micropropagated Grande Naine banana. Acta Hortic 490:285–295
Jaizme-Vega MC, Tenoury P, Pinochet J, Jaumot M (1997) Interactions between the root-kinot
nematode Meloidogyne incognita and Glomus mosseae in banana. Plant Soil 196:27–35
Jakobsen I, Rosendahl L (1990) Carbon flow into soil and external hyphae from roots of
mycorrhizal cucumber plants. New Phytol 115:77–83
Jenkins NE, Grzywacz D (2000) Quality control of fungal and viral biocontrol agents — assurance
of product performance. Biocontrol Sci Technol 10:753–777
Johansson JF, Paul LR, Finlay RD (2004) Microbial interactions in the mycorrhizosphere and their
significance for sustainable agriculture. FEMS Microbiol Ecol 48:1–13
Johnson NC, Graham JH, Smith FA (1997) Functioning of mycorrhizal associations along the
mutualism–parasitism continuum. New Phytol 135:575–585
Keller M, Barros FCF, Feldmann (1997) Growth response of in vitro propagated Babtisia tinctoriaplantlets to microbial inoculation. Angew Bot 6:140–151
Kloepper JW, Ryu C-M, Zhang S (2004) Induced resistance and promotion of plant growth by
Bacillus spp. Phytopathology 94:1259–1266
Kloepper JW, Schroth NM (1978) Plant growth promoting rhizobacteria on radishes. In: Proceed-
ings of IVth International Conference on Plant Pathogenic Bacteria, vol. 2. INRA, Angers.
Gilbert-Clary, Tours, pp 879–882
Krause MS, Madden LV, Hoitink HAJ (2001) Effect of potting mix microbial carrying capacity on
biological control of Rhizoctonia damping-off of radish and rhizoctonia crown and root rot of
Poinsettia. Phytopathology 91:1116–1123
Kuc J (2001) Concepts and direction of induced systemic resistance in plants and its application.
Eur J Plant Pathol 107:7–12
Kunkel BN, Brooks DM (2002) Cross talk between signalling pathways in pathogen defense. Curr
Opin Plant Biol 5:325–331
356 M. Vestberg and A.C. Cassells
Laloi C, Apel K, Danon A (2004) Reactive oxygen signalling: the latest news. Curr Opin Plant
Biol 7:323–328
Lifshitz R, Kloepper JW, Scher F, Tipping EM, Laliberte M (1986) Nitrogen-fixing Pseudomonasisolated from the roots of plants grown in the Canadian High Arctic. Appl Environ Microbiol
51:251–255
Linderman RG (1994) Role of VAM fungi in biocontrol. In: Pfleger FL, Linderman RG (eds)
Mycorrhizae and plant health, The American Phytopathological Society, St. Paul, MN, pp 1–25
Linderman RG (2000) Effects of mycorrhizas on plant tolerance to diseases. In: Kapulnik Y,
Douds DD Jr (eds) Arbuscular mycorrhizas: physiology and function. Kluwer, Dordrecht, pp
345–365
Linderman RG, Davis EA (2003) Soil amendment with different peat mosses affects mycorrhizae
of onion. Hortic Tech 13:285–289
Liu A, Hamel C, Hamilton RI, Ma BL, Smith DL (2000) Acquisition of Cu, Zn, Mn, and Fe by
mycorrhizal maize (Zea mays L.) grown in soil at different P and micronutrient levels.
Mycorrhiza 9:331–336
Lopez A, Pinochet J, Fernandez C, Calvet C, Camprubi A (1997) Growth response of OHF-333
pear rootstock to arbuscular mycorrhizal fungi, phosphorus nutrition and Pratylenchus vulnusinfection. Fundam Appl Nemat 20:87–93
Lovato PE, Gianinazzi-Pearson V, Trouvelot A, Gianinazzi S (1996) The state of the art of
mycorrhizas and micropropagation. Adv Hortic Sci 10:46–52
Lubraco G, Schubert A, Previati A (2000) Micropropagation and mycorrhization of Allium
sativum. Acta Hortic 530:339–343Mark GL, Cassells AC (1996) Genotype-dependence in the interaction between Glomus fistulosum,
Phytophthora fragariae and the wild strawberry (Fragaria vesca). Plant Soil 185:233–239Marschner H, Dell B (1994) Nutrient uptake in mycorrhizal symbiosis. Plant Soil 159:89–102
McDowell JM, Dangl JL (2000) Signal transduction in the plant immune response. Trends
Biochem Sci 25:79–82
Mia MAB, Shamsuddin ZH, Wahab Z, Marziah M (2005) High-yielding and quality banana
production through plant growth-promoting rhizobacterial inoculation. Fruits 60:179–185
Miller RM, Jastrow JD (1990) Hierarchy of root and mycorrhizal fungal interactions with soil
aggregation. Soil Biol Bioch 22:579–584
Mosse B (1962) The establishment of mycorrhizal infection under aseptic conditions. J Gen
Microbiol 27:509–520
Norman JR, Atkinson D, Hooker JE (1996) Arbuscular mycorrhizal fungal-induced alteration in
root architecture in strawberry and induced resistance to the root pathogen Phytophthorafragariae. Plant Soil 185:191–198
Norman JR, Hooker JE (2000) Sporulation of Phytophthora fragariae shows greater stimulation
by exudates of non-mycorrhizal than by mycorrhizal strawberry roots. Mycol Res 104:1069–
1073
Nowak J, Shulaev V (2003) Priming for transplant stress in in vitro propagation. In Vitro Cell
Devel Biol 39:107–124
O’Herlihy EA, Duffy EM, Cassells AC (2003) The effects of arbuscular mycorrhizal fungi band
chitosan sprays on yield and late blight resistance in potato crops from microplants. Folio
Geobot 38:201–208
Oostendorp M, KunzW, Dietrich B, Staub T (2001) Induced disease resistance by chemicals. Eur J
Plant Pathol 107:19–28
Parke JL, Gurian-Sherman D (2001) Diversity of Burkholderia cepacia complex and implications
for risk assessment of biological control strains. Annu Rev Phytopathol 39:225–258
Phillips JM (1971) The establishment of mycorrhizal infection under aseptic conditions. Roth Exp
St Rep for 1970:88
Pieterse CMJ, van Loon LC (1999) Salicylic acid-independent plant defence pathways. Trends
Plant Sci 4:52–58
21 The Use of AMF and PGPR Inoculants Singly 357
Pinochet J, Calvet C, Camprubi A, Fernandez C (1996) Interactions between migratory endopara-
sitic nematodes and arbuscular mycorrhizal fungi in perennial crops: a review. Plant Soil
185:183–190
Pons F, Gianinazzi-Pearson V, Gianinazzi S, Navatel JC (1983) Studies of VA mycorrhizae invitro: mycorrhizal synthesis of axenically propagated wild cherry (Prunus avium L.) plants.
Plant Soil 71:217–221
Puthur JT, Prasad KVSK, Sharmila P, Pardha Saradhi P (1998) Vesicular arbuscular mycorrhizal
fungi improves establishment of micropropagated Leucaena leucocephala plantlets. Plant CellTiss Org Cult 53:41–47
Rafferty SM, Cassells AC (2003) Biofunctional composts and biotization. Acta Hortic 631:
243–251
Rafferty SM, Murphy JG, Cassells AC (2003) Lytic enzyme activity in peat is increased by
substrate amendment with chitin: implications for control of Phytophthora fragariae in
Fragaria vesca. Folio Geobot 38:139–144
Rai MK (2001) Current advances in mycorrhization in micropropagation. In Vitro Cell Dev
BioPlant 37:158–167
Ramamoorthy V, Viswanathan R, Ragucherander T, Prakasam V, Samiyappan R (2001) Induction
of systemic resistance by plant growth promoting rhizobacteria in crop plants against pests and
diseases. Crop Protect 20:1–11
Rambelli A (1973) The rhizosphere of mycorrhizae. In: Marks GL, Koslowski TT (eds) Ectomy-
corrhizae. Academic, New York, pp 299–343
Rapparini F, Baraldi R, Bertazza G, Branzanti B, Predieri S (1994) Vesicular–arbuscular mycor-
rhizal inoculation of micropropagated fruit trees. J Hortic Sci 69:1101–1109
Ravolanirina F, Gianinazzi S, Trouvelot A, Carre M (1989) Production of endomycorrhizal
explants of micropropagated grapevine rootstocks. Agric Ecosyst Environ 29:323–327
Reymond P, Farmer EE (1998) Jasmonate and salicylate as global signals for defense gene
expression. Curr Opin Plant Biol 1:404–411
Rillig MC, Mummey DL (2006) Mycorrhizas and soil structure. New Phytol 171:41–53
Ristaino JB, Thomas W (1997) Agriculture, methyl bromide and the ozone hole. Plant Dis
81:964–977
Rodriquez-Romero AS, Guerra MSP, Jaizme-Vega MC (2005) Effect of arbuscular mycorrhizal
fungi and rhizobacteria on banana growth and nutrition. Agron Sustain Dev 25:395–399
Sahay NS, Varma A (2000) A biological approach towards increasing the rates of survival of
micropropagated plants. Curr Sci 78:126–129
Schisler DA, Slininger PJ (1997) Microbial selection strategies that that enhance the likelihood of
developing commercial biological control products. J Ind Microbiol Biotechnol 19:172–179
Schroth MN, Hancock JG (1982) Disease-suppressive soil and root-colonizing bacteria. Science
216:1376–1381
Schubert A, Mazzitelli M, Ariusso O, Eynard I (1990) Effects of vesicular-arbuscular mycorrhizal
fungi on micropropagated grapevines: influence of endophyte strain, P fertilization and growth
medium. Vitis 29:5–13
Schußler A, Schwarzott D, Walker C (2001) A new fungal phylum, theGlomeromycota: phylogenyand evolution. Mycol Res 105:1413–1421
Sharma VK, Nowak J (1998) Enhancement of verticillium wilt resistance in tomato transplants by
in vitro co-culture of seedlings with a plant growth promoting rhizobacterium (Pseudomonassp. Strain PsJN). Can J Microbiol 44:528–536
Sharma MP, Adholeya A (2004) Effect of arbuscular mycorrhizal fungi and phosphorus fertiliza-
tion on the post vitro growth and yield of micropropagated strawberry grown in a sandy loam
soil. Can J Bot 82:322–328
Shashikala BN, Reddy BJD, Bagyaraj (1999) Response of micropropagated banana plantlets to
Glomus mosseae at varied levels of fertilizer phosphorus. Ind J Exp Biol 37:499–502
Smith FA, Smith SE (1996) Mutualism and parasitism: diversity in function and structure in the
‘‘arbuscular’’ (VA) mycorrhizal symbiosis. Adv Bot Res 22:1–43
358 M. Vestberg and A.C. Cassells
Spoel SN, Koorneef A, Claessens SMC, Korzelius JP, Van Pelt JA, Mueller MJ, Buchala AJ,
Metraux J-P, Brown R, Kazan K, van Loon LC, Dong X, Pieterse CMJ (2003) NPR1 modulates
cross-talk between salicylate- and jasmonate-dependent defense pathways through a novel
function in the cytosol. Plant Cell 15:760–770
Srinath J, Bagyaraj DJ, Satyanarayana BN (2003) Enhanced growth and nutrition of micropropa-
gated Ficus benjamina to Glomus mossae co-inoculated with Trichoderma harzianum and
Bacillus coagulans. World J Microbiol Biotechnol 69:69–72
St-Arnaud M, Hamel C, Vimard B, Caron M, Fortin JA (1996) Enhanced hyphal growth and spore
production of the arbuscular mycorrhizal fungus Glomus intraradices in an in vitro system in
the absence of host roots. Mycol Res 100:328–332
Stead DE, Elphinstone JG, Weller S, Smith N, Hennessy J (2000) Modern methods for character-
ising, identify and detecting bacteria associated with plants. Acta Hortic 530:45–60
Strange RN (2003) Introduction to plant pathology. Wiley, New York
Sturz AV, Christie BR, Nowak J (2000) Bacterial endophytes: potential role in developing
sustainable systems of crop production. Crit Revs Plant Sci 19:1–30
Suslow TV, Schroth MN (1982) Role of deleterious rhizobacteria as minor pathogens in reducing
crop growth. Phytopathology 72:111–115
Tahmatsidou V, O’Sullivan J, Cassells AC, Voyiatzis D, Paroussi G (2006) Comparison of AMF
and PGPR inoculants for the suppression of Verticillium wilt of strawberry (Fragaria x vescacv. Selva). Appl Soil Ecol 32:316–324
Tahvonen T, Lahdenpera M (1988) Biological control of Botrytis cinerea and Rhizoctonia solaniin lettuce by Streptomyces sp. Ann Agric Fenn 27: 107–116
Thaler JS, Fidantsef AL, Duffey SS, Bostock RM (1999) Trade-offs in plant defense against
pathogens and herbivores: a feld demonstration of chemical elicitors of induced resistance.
J Chem Ecol 25:1597–1609
Ton J, Van Pelt JA, Van Loon LC, Pieterse CMJ (2002) Differential effectiveness of salicylate-
dependent and jasmonate/ethylene-dependent induced resistance in Arabidopsis. Mol Plant
Microbe Interact 15:27–34
Uosukainen M, Vestberg M (1994) Effect of inoculation with arbuscular mycorrhizas on rooting,
weaning and subsequent growth of micropropagated Malus (L.) Moench. Agric Sci Finl 3:
269–279
USDA (2000) Economic implications of the methyl bromide phase-out. Agric Info Bull 756 (AIB-
756) February 2000
Vaast P, Zasoski RJ, Bledsoe CS (1996) Effects of vesicular-arbuscular mycorrhizal inoculation at
different soil P availabilities on growth and nutrient uptake of in vitro propagated coffee
(Coffea arabica L.) plants. Mycorrhiza 6:493–497
Van Huylenbroeck JM, Piqueras A, Debergh PC (1998) Photosynthesis and carbon metabolism in
leaves formed prior and during ex vitro acclimatization and growth of microplants. Phyton
(Austria) 37:283–290
Van Loon LC, Bakker PAHM, Pieterse CJM (1998) Systemic resistance induced by rhizobacteria.
Annu Rev Phytopathol 36:453–483
VanWees SCM, Luijendijk M, Smoorenburg I, van Loon LC, Pieterse CJM (1999) Rhizobacteria-
mediated induced systemic resistance (ISR) in Arabidopsis is not associated with a direct effecton expression of known defense-related genes but stimulates the expression of the jasmonate-
inducible gene Atvsp upon challenge. Plant Mol Biol 41:537–549
Van Wees SCM, de Swart EAM, van Pelt JA, van Loon LC, Pieterse CMJ (2000) Enhancement of
induced disease resistance by simultaneous activation of salicylate- and jasmonate-dependent
defense pathways in Arabidopsis thaliana. Proc Natl Acad Sci USA 97:8711–8716
Varma A, Schuepp H (1994a) Positive influence of arbuscular mycorrhizal fungus on in vitroraised hortensia plantlets. Angew Bot 68:108–115
Varma A, Schuepp H (1994b) Infectivity and effectiveness of Glomus intraradices (in italics!!!) on
micropropagated plants. Mycorrhiza 5:29–37
21 The Use of AMF and PGPR Inoculants Singly 359
Varma A, Schuepp H (1995) Mycorrhization of the commercially important micropropagated
plants. Crit Rev Biotechnol 15:313–328
Vestberg M (1992) The effect of vesicular-arbuscular mycorrhizal inoculation on the growth and
root colonization of ten strawberry cultivars. Agric Sci Finl 1:527–535
Vestberg M, Estaun V (1994) Micropropagated plants, an opportunity to positively manage
mycorrhizal activities. In: Gianinazzi S, Schuepp H (eds) Impact of arbuscular mycorrhizas
on sustainable agriculture and natural ecosystems. Birkhauser Verlag, Basel, pp 217–225
Vestberg M, Cassells AC, Schubert A, Cordier C, Gianinazzi S (2002) Arbuscular mycorrhizal
fungi and micropropagation of high value crops. In: Gianinazzi S, Schuepp H, Barea JM,
Haselwandter K (eds) Mycorrhizal technology in agriculture. Birkauser Verlag, Basel, pp
223–233
Vestberg M, Kukkonen S, Neuvonen E-L, Uosukainen M (2000) Mycorrhizal inoculation of
micropropagated strawberry — case studies on mineral soil and a mined peat bog. Acta Hortic
530:297–304
Vestberg M, Kukkonen S, Saari K, Parikka P, Huttunen J, Tainio L, Devos N, Weekers F, Kevers
C, Thonart P, Lemoine M-C, Cordier C, Alabouvette C, Gianinazzi S (2004) Microbial
inoculation for improving the growth and health of micropropagated strawberry. Appl Soil
Ecol 27:243–258
Vestberg M, Palmujoki H, Parikka P, Uosukainen M (1994) Effect of arbuscular mycorrhizas on
crown rot (Phytophthora cactorum) in micropropagated strawberry plants. Agric Sci Finl
3:289–295
Vidal MT, Azcon-Aguilar C, Barea JM (1992) Mycorrhizal inoculation enhances growth and
development of micropropagated plants of avocado. Hort Sci 27:785–787
Vosatka M, Albrechtova J, Patten R (2008) The international market development for mycorrhizal
technology. In: Varma A (ed) Mycorrhiza: state of the art, genetics and molecular biology,
eco-function, biotechnology, eco-physiology, structure and systematics (3rd edn). Springer,
Heidelberg, pp 419–438
Vosatka M, Dodd JC (2002) Ecological considerations for successful application of arbuscular
mycorrhizal fungi inoculation. In: Gianinazzi S, Schuepp H, Barea JM, Haselwandter K (eds)
Mycorrhizal technology in agriculture. Birkhauser Verlag, Basel, pp 235–247
Vosatka M, Gryndler M (2000) Response of micropropagated potatoes transplanted to peat media
to post-vitro inoculation with arbuscular mycorrhizal fungi and soil bacteria. Appl Soil Ecol
15:145–152
Walling LL (2001) Induced resistance: from the basic to the applied. Trends Plant Sci 6:445–447
Walsh UF, Morrissey JP, O’Gara F (2001) Pseudomonas for biocontrol of phytopathogens: from
functional genomics to commercial exploitation. Curr Opin Biotechnol 12:289–295
Werbrouck SPO, Debergh PC (1996) Imidazole fungicides and paclobutrazol enhance cytokinin
induced adventitious shoot proliferation in Araceae. Plant Growth Reg 15:87–93
Williamson B, Cooke DEL, Duncan JM, Leifert C, Breese WA, Shattock RC (1997) Fungal
infections of micropropagated plants at weaning. In: Cassells AC (ed) Pathogen and contami-
nation management in micropropagation. Kluwer, Dordrecht, pp 309–320
Yan Z, Reddy MS, Ryu C-M, McInroy JA, Wilson M, Kloepper JW (2002) Induced systemic
protection against tomato late blight elicited by plant growth-promoting rhizobacteria. Phyto-
pathology 92:1329–1333
Yano-Melo AM, Saggin Junior OJ, Lima-Filho JM, Melo NF, Maia LC (1999) Effect of arbuscular
mycorrhizal fungi on the acclimatization of micropropagated banana plantlets. Mycorrhiza
9:119–123
Yao MK, Tweddell RJ, Desilets H (2002) Effect of two vesicular–arbuscular mycorrhizal fungi
on the growth of micropropagated potato plantlets and on the extent of disease caused by
Rhizoctonia solani. Mycorrhiza 12:235–242
Zhang S, Reddy MS, Kloepper JW (2002) Development of assays for assessing induced systemic
resistance by plant growth-promoting rhizobacteria against blue mould of tobacco. Biol
Control 23:79–86
360 M. Vestberg and A.C. Cassells

Chapter 22
Co-Culture of Linum album Cells
and Piriformospora indica for Improved
Production of Phytopharmaceuticals
A. Baldi, A. Jain, N. Gupta, A.K. Srivastava, and V.S. Bisaria
22.1 Introduction
It is estimated that there are about 250,000 species of higher plants, but six times as
many species of fungi. The interaction between plants and fungi is very complex
and may be very specific to a given combination of plant and fungus (Grayer and
Kokubun 2001). The association of fungus and part of any vascular plant is called a
mycorrhiza. Mycorrhiza, the nutritional symbiosis between fungi and plants, has
been found in 85% of higher plant genera (Chauhan et al. 2006). In these associa-
tions, the plant benefits from more efficient water and mineral (nitrogen and
phosphorus) uptake and also through resistance against some pathogens. The
fungus benefits through carbon source (sugar) which is translocated to the roots
by the plants (Das et al. 2006). The most common and prevalent association with a
plant is by arbuscular mycorrhizal fungi. These fungi belong to the order Glomer-
ales (Morton and Benny 1990), which include all species capable of living symbi-
otically with plants. But these fungi are not able to grow in pure cultures without
living host roots. Understanding this inability is one of the most challenging goals
because the field of studying these symbiotic relationships, their mechanisms and
effects still remains unexplored. The cultivation of root-organ cultures with AM
fungi aseptically was developed as an alternative system to study the symbiosis in
detail (Becard and Fortin 1988). But a new vista for scientists working on the study
of plant-microbe interaction has opened up with the advent of Piriformosporaindica, ‘‘fungus of the millennium’’ (Kumari et al. 2005). This fungus mimics
A. Baldi, A. Jain, N. Gupta, A.K. Srivastava, and V.S. Bisaria (*)
Department of Biochemical Engineering and Biotechnology, Indian Institute of Technology
Delhi, Hauz Khas, New Delhi 110 016
e-mail: [email protected]
A. Varma and A.C. Kharkwal (eds.), Symbiotic Fungi, Soil Biology 18, 361
DOI: 10.1007/978‐3‐540‐95894‐9_22, # Springer‐Verlag Berlin Heidelberg 2009

the capabilities of a typical AM fungus and is also axenically cultivable. This is also
a potential candidate to serve as biofertilizer, bioprotector, bioregulator, and bio-
herbicide, and an excellent source for the hardening of tissue culture-raised plants
(Chauhan et al. 2006).
In addition to essential primary metabolites, plants produce a wide variety of
secondary metabolites. Plant secondary metabolites can be defined as compounds
that have no recognized role in the fundamental life processes in the plants that
synthesize them, but have an important role in the interaction of the plants with their
environment. Almost 100,000 secondary metabolites have been discovered from
the plant kingdom but the structures of only half of them have been fully elucidated
(Verpoorte 1998; Dixon 2001). An extensive array of secondary metabolites have
also been produced by plant cell suspension cultures as an alternative strategy, but
to date their limited commercial exploitation has been a major concern. This is
because only small amounts of these compounds are found in whole plants and
cell culture systems. A combined application of biotic elicitation along with other
yield-enhancement strategies can develop techniques for large-scale production of
commercially important compounds by plant cell cultures.
Piriformospora indica, an endophyte, isolated from the soil of Rajasthan (India),
has been reported to show growth-promotional and secondary metabolite-enhancer
activities with diverse medicinal and economically important plants such as Bacopamoniera (Sahay and Varma 1999, 2000), Azadirachta indica (Singh et al. 2002,
2003), Withania somnifera, Spilanthes calva (Rai et al. 2001), Tridex procumbans,Abrus procatorius (Kumari et al. 2004), Adhatoda vasica (Rai and Varma 2005)
and Chlorophytum borivilianum (Chauhan et al. 2006). All of these reports are on
tissue culture-raised or field-grown plants. Therefore, for enhanced production of
phytopharmaceuticals it is worthwhile to study the interaction between symbiotic
fungi like Piriformospora indica and the plant cells in a co-culture system.
Podophyllotoxin is the most important aryltetralin lignan pharmaceutically due
to its cytotoxic and antiviral properties along with its use in treatment of genital
warts (Imbert 1998). It is used as a raw material for synthesis of cytostatics such as
etoposide, teniposide and etopophos. Currently, podophyllotoxin is extracted from
the roots of Podophyllum hexandrum and P. peltatum plants. Supply of this lignan
by the conventional solvent extraction method has its limitations, due to the
endangered status of P. hexandrum and uneconomical chemical synthesis (Van
Uden 1992). For these reasons, production of podophyllotoxin by biotechnological
means remains a favored goal for researchers. Very low content of podophyllotoxin
has been reported in cell cultures of Podophyllum species (Chattopadhyay et al.
2001, 2002a, b, 2003a–c, Farakya et al. 2004). On the other hand, cell cultures of
Linum spp. have been reported to produce podophyllotoxin with higher productivity
in comparison with cell cultures of other plants (Baldi et al. 2007). Biosynthesis of
these lignans via the phenylpropanoid pathway involves a bridge reaction of
primary and secondary metabolism, i.e. conversion of phenylalanine to cinnamic
acid by deamination. This reaction, catalyzed by the phenylalanine ammonia lyase
(PAL) enzyme, has been reported as a rate-limiting step of lignan biosynthesis
(Nicholas et al. 1994). So measurement of PAL enzyme activity has been an
362 A. Baldi et al.
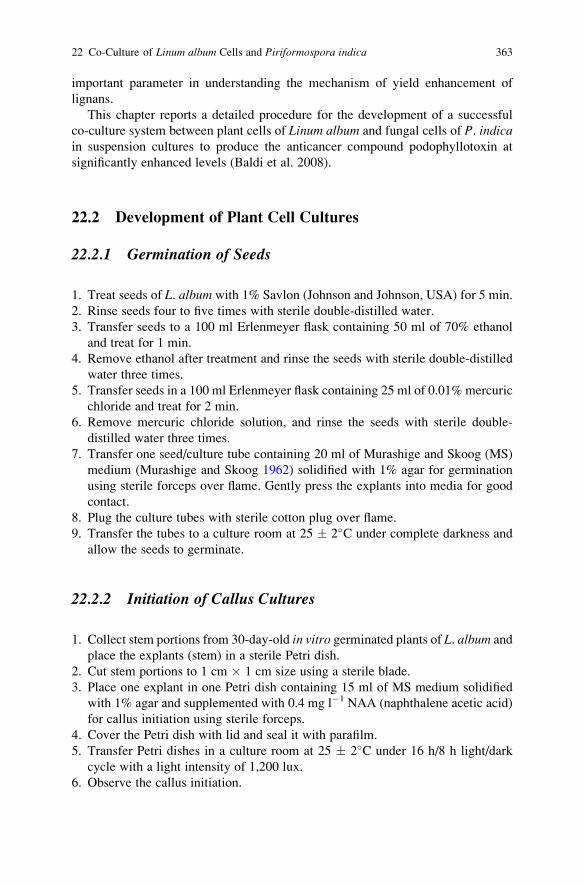
important parameter in understanding the mechanism of yield enhancement of
lignans.
This chapter reports a detailed procedure for the development of a successful
co-culture system between plant cells of Linum album and fungal cells of P. indicain suspension cultures to produce the anticancer compound podophyllotoxin at
significantly enhanced levels (Baldi et al. 2008).
22.2 Development of Plant Cell Cultures
22.2.1 Germination of Seeds
1. Treat seeds of L. album with 1% Savlon (Johnson and Johnson, USA) for 5 min.
2. Rinse seeds four to five times with sterile double-distilled water.
3. Transfer seeds to a 100 ml Erlenmeyer flask containing 50 ml of 70% ethanol
and treat for 1 min.
4. Remove ethanol after treatment and rinse the seeds with sterile double-distilled
water three times.
5. Transfer seeds in a 100 ml Erlenmeyer flask containing 25 ml of 0.01% mercuric
chloride and treat for 2 min.
6. Remove mercuric chloride solution, and rinse the seeds with sterile double-
distilled water three times.
7. Transfer one seed/culture tube containing 20 ml of Murashige and Skoog (MS)
medium (Murashige and Skoog 1962) solidified with 1% agar for germination
using sterile forceps over flame. Gently press the explants into media for good
contact.
8. Plug the culture tubes with sterile cotton plug over flame.
9. Transfer the tubes to a culture room at 25 � 2�C under complete darkness and
allow the seeds to germinate.
22.2.2 Initiation of Callus Cultures
1. Collect stem portions from 30-day-old in vitro germinated plants of L. album and
place the explants (stem) in a sterile Petri dish.
2. Cut stem portions to 1 cm � 1 cm size using a sterile blade.
3. Place one explant in one Petri dish containing 15 ml of MS medium solidified
with 1% agar and supplemented with 0.4 mg l�1 NAA (naphthalene acetic acid)
for callus initiation using sterile forceps.
4. Cover the Petri dish with lid and seal it with parafilm.
5. Transfer Petri dishes in a culture room at 25 � 2�C under 16 h/8 h light/dark
cycle with a light intensity of 1,200 lux.
6. Observe the callus initiation.
22 Co-Culture of Linum album Cells and Piriformospora indica 363
22.2.3 Initiation of Suspension Cultures
22.2.3.1 Inoculum Preparation
1. Transfer fresh and friable cells (20-day-old) from callus culture (5 g l�1 on dry
cell weight basis) in to 250 ml Erlenmeyer flask containing 50 ml MS media
containing 0.4 mg l�1 NAA with the help of sterile spatula over flame.
2. Plug the culture tubes with sterile cotton plug over flame.
3. Place inoculated flasks on a gyratory shaker rotating at 125 rpm in a culture room
at 25 � 2�C under 16 h/8 h light/dark cycle with a light intensity of 1,200 lux.
4. Allow the cells to grow in suspension culture for 12 days.
5. Centrifuge the grown cells in sterile centrifuge tubes at 5,000 rpm for 10 min.
6. Decant the spent media and use cells to inoculate suspension cultures for
elicitation set-up.
22.2.3.2 Development of Suspension Culture
1. Transfer these cells (5 g l�1 on dry cell weight basis) in to 250 ml Erlenmeyer
flask containing 50 ml MS media containing 0.4 mg l�1 NAA with the help of
sterile spatula over flame.
2. Place inoculated flasks on a gyratory shaker rotating at 125 rpm in a culture room
at 25� 2�C under 16 h/8 h light/dark cycle with a light intensity of 1,200 lux and
allow the cells to grow for 12 days.
22.3 Development of Fungal Culture
22.3.1 Maintenance of Piriformospora indica
1. Transfer inoculum disk of arbuscular myccorhiza-like fungus, Piriformosporaindica, to a sterile Petri dish containing 20 ml MYPG media of following
composition:
Malt extract: 3 g l�1
Yeast extract: 3 g l�1
Peptone: 5 g l�1
Glucose: 10 g l�1
Agar: 20 g l�1
pH: 6.2
2. Incubate the inoculated Petri dish in an incubator at 25 � 2�C.
364 A. Baldi et al.

3. Subculture the fungus on the same medium every month for maintenance of
the culture.
22.3.2 Initiation of Fungal Culture
22.3.2.1 Inoculum Preparation
1. Transfer 5-day-old fungal inoculum (3 � 1 cm squares of grown fungi) from
solid MYPG media plates into a 250 ml Erlenmeyer flask containing 50 ml Hill
and Kaefer’s medium (Hill and Kaefer 2001).
2. Place inoculated flasks on incubator shaker rotating at 200 rpm and maintain at
30 � 2�C.3. Allow cells to grow in suspension culture for 5 days.
4. Centrifuge the grown cells in sterile centrifuge tubes at 5,000 rpm for 10 min.
5. Decant the spent media and use cells to initiate suspension cultures of P. indica.
Preparation of Hill and Kaefer Medium
1. The components of Hill and Kaefer medium are divided into two parts: A and B
(Compositions are given in Tables 22.1 and 22.2).
(a) The concentrations of various components mentioned in part A and part B
are the final concentrations of components after mixing part A and part B.
(b) Prepare FeCl3 and FeSO4·7H2O solutions in 1 N H2SO4.
(c) Separately prepare the stock solutions of all vitamins in distilled water.
Bring the pH of solution to 12.5 in order to solubilize them except Nicotin-
amide.
2. Autoclave both stock solutions separately. After adding both the solutions, bring
pH to 6.5 by adding required amount of autoclaved 2 M NaOH under aseptic
conditions.
3. Store all the stocks at 4�C except vitamins.
4. Store stock solution of vitamins at �20�C.
22.3.2.2 Development of Fungal Culture for Co-Culture Setup
1. Transfer these fungal cells (0.6 g l�1 on dry cell weight basis) to a 250 ml
Erlenmeyer flask containing 50 ml Hill and Kaefer’s medium aseptically with
the help of a sterile spatula over flame.
22 Co-Culture of Linum album Cells and Piriformospora indica 365
2. Place inoculated flasks on a gyratory shaker rotating at 200 rpm on an incubator
shaker at 30 � 2�C.3. Allow cells to grow for 5 days in suspension cultures.
4. Centrifuge the grown cells in sterile centrifuge tubes at 5,000 rpm for 10 min.
5. Decant the spent media and crush fungal cells with the help of a sterile magnetic
bead, rotating for 15 min at 100 rpm on a magnetic stirrer under aseptic
conditions.
Table 22.1 The composition of part A of Hill and Kaefer Medium (2001)
Components Concentration (ml l�1)
Peptone 1.0 g l�1
Yeast extract 0.1 g l�1
Casamino acid hydrolysate 0.1 g l�1
Macro elements stock solution (A) 50.0
Micro elements stock solution (B) 2.5
Biotin (0.05%) 1.0
p-Amino benzoic acid (0.1%) 1.0
Nicotinamide (0.5%) 1.0
Pyridoxal phosphate (0.1%) 1.0
Riboflavin (0.25%) 1.0
(a) Macro elements stock solution
Concentration (g l�1)
NaNO3 120.0
KCl 10.4
MgSO4·7H2O 10.4
KH2PO4 30.4
(b) Micro elements stock solution
ZnSO4·7H2O 22.0
H3BO3 11.0
MnCl2·4H2O 5.0
CoCl2·6H2O 1.6
CuSO4·5H2O 1.6
(NH4)6Mo7O27·4H2O 1.1
Na2EDTA 5.0
Table 22.2 The composition of part B of Hill and Kaefer Medium (2001)
Components Concentration (ml l�1)
Glucose 20.0 g l�1
CaCl2 (0.1 M) 1.0
FeCl3 (0.1 M) 1.0
FeSO4·7H2O (0.5%) 2.5
366 A. Baldi et al.
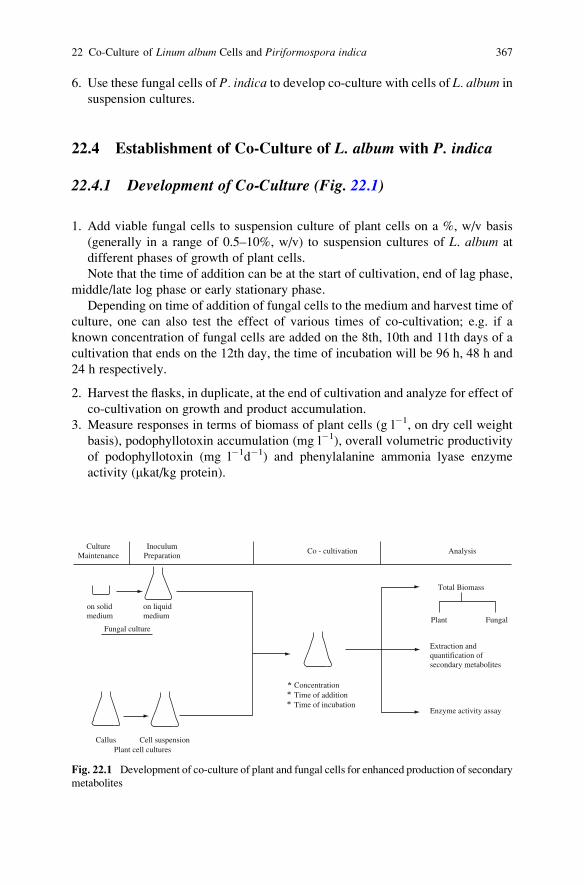
6. Use these fungal cells of P. indica to develop co-culture with cells of L. album in
suspension cultures.
22.4 Establishment of Co-Culture of L. album with P. indica
22.4.1 Development of Co-Culture (Fig. 22.1)
1. Add viable fungal cells to suspension culture of plant cells on a %, w/v basis
(generally in a range of 0.5–10%, w/v) to suspension cultures of L. album at
different phases of growth of plant cells.
Note that the time of addition can be at the start of cultivation, end of lag phase,
middle/late log phase or early stationary phase.
Depending on time of addition of fungal cells to the medium and harvest time of
culture, one can also test the effect of various times of co-cultivation; e.g. if a
known concentration of fungal cells are added on the 8th, 10th and 11th days of a
cultivation that ends on the 12th day, the time of incubation will be 96 h, 48 h and
24 h respectively.
2. Harvest the flasks, in duplicate, at the end of cultivation and analyze for effect of
co-cultivation on growth and product accumulation.
3. Measure responses in terms of biomass of plant cells (g l�1, on dry cell weight
basis), podophyllotoxin accumulation (mg l�1), overall volumetric productivity
of podophyllotoxin (mg l�1d�1) and phenylalanine ammonia lyase enzyme
activity (mkat/kg protein).
on solidmedium
on liquidmedium
InoculumPreparation
Co - cultivation Analysis
Total Biomass
Plant Fungal
Extraction andquantification ofsecondary metabolites
Enzyme activity assay
CultureMaintenance
Fungal culture
Callus Cell suspensionPlant cell cultures
ConcentrationTime of additionTime of incubation
Fig. 22.1 Development of co-culture of plant and fungal cells for enhanced production of secondary
metabolites
22 Co-Culture of Linum album Cells and Piriformospora indica 367

22.5 Analysis
22.5.1 Growth in Terms of Dry Cell Weight
1. Harvest individual flasks, in duplicate, at the end of cultivation.
2. Filter the cell suspension through Whatman No. 1 filter paper on a Buchner
funnel under slight vacuum.
3. Wash the cells with double-distilled water.
4. Drain fully under vacuum.
5. Transfer the cells to pre-weighed Petri dish. Dry cells at 25 � 2�C to a constant
weight (approx. 48 h).
6. Reweigh the cells with Petri plate.
7. Calculate biomass produced/50 ml media by subtracting weight of empty Petri
dish from total weight of Petri dish and dried cells. Express the weight of cell
biomass as g l�1 dry cell weight.
(Note that this biomass concentration represents the cumulative biomass of plant
cells and fungal cells grown during a particular co-cultivation set-up)
22.5.2 Determination of Fungal and Plant Biomass
22.5.2.1 Determination of Fungal and Plant Biomass
1. Subject 1 g of dried biomass samples (plant + fungal) for acid hydrolysis and
subsequent colorimetric analysis, as described in subsequent sections, in order to
estimate concentration of fungal biomass in terms of chitin.
2. Determine plant biomass produced in co-culture experiments by subtracting the
fungal biomass from total biomass produced in respective co-culture set-ups.
22.5.2.2 Acid Hydrolysis for Chitin Estimation
1. Digest a known amount of dried fungal/(plant + fungal) biomass from each
sample with 50 ml of 5 M sulfuric acid under agitation at 100 rpm for 15 min.
2. Centrifuge it at 5,000 rpm for 40 min and discard the supernatant.
3. Rinse the biomass with distilled water twice.
4. Incubate the cells with 10 ml of 10 N HCl at 25 � 2�C for 16 h.
5. Make up the volume to 100 ml with double-distilled water.
6. Autoclave each sample at 15 psig and 121�C for 2 h for hydrolysis.
7. Neutralize hydrolysate to pH 7 using 10 M NaOH and 0.5 M NaOH.
8. Subject this hydrolysate for estimation of chitin using MBTH (3-methyl-2-
benzothiazolone hydrazone hydrochloride).
368 A. Baldi et al.
22.5.2.3 Colorimetric Assay for Chitin Estimation
(Smith and Gilkerson 1979)
1. Suspend 1 g of dried and powdered fungal biomass in 100 ml of double distilled
water to get a stock solution of 10 g l�1 concentration.
2. Prepare standard suspensions of fungal biomass in the concentration range of
(0.15–1.5 g l�1 on dry cell weight basis).
3. Hydrolyze these fungal biomass samples with sulfuric acid as described in
earlier section.
4. Add 2 ml of 2.5% sodium nitrite to 1 ml of acid hydrolyzed fungal or total
biomass sample.
5. Add 500 ml of 0.5 M HCl to the reaction mixture.
6. Vortex reaction mixture to liberate excess NaNO2 and incubate at 25� 2�C for
15 min.
7. Then add 1 ml of 0.25%, w/v MBTH to this and vortex again.
8. Incubate the reaction mixture in water bath at 65�C for 60 min.
9. Add 1 ml of freshly prepared FeCl3 (0.5%, w/v).
10. Measure absorbance of the final mixture (intense blue color) at 650 nm after
15 min.
11. Plot standard curve between different concentrations of fungal biomass
(0.15–1.5 g l�1 on dry cell weight basis) and respective A650 values.
12. Estimate fungal biomass from the absorbance value of the respective sample
from the standard curves.
22.5.3 Extraction and Estimation of Podophyllotoxin
1. Suspend accurately weighed dried and powdered cells (100 mg) in 5 ml of
methanol in 10 ml glass tube.
2. To release intracellular product, sonicate cells at 4–6�C for 15 min and allow it
for complete extraction for 24 h.
3. Centrifuge the extract at 5,000 rpm for 10 min and collect the supernatant.
4. Allow methanol to evaporate at 25 � 2�C (approx. 12–18 h).
5. Re-dissolve this extract in known volume of HPLC grade methanol and filter it
through 0.22 mm filter.
6. Quantify podophyllotoxin in each sample on HPLC under following conditions:
Column: Nova Pak RP-C18 column (Waters, USA)
Packing: 250 � 4.6 mm
Mobile phase: 0.01% phosphoric acid in water: acetonitrile (72:28%, v/v)
Flow rate: 0.8 ml min�1
Column temperature: 30�CDetection: Diode array detector at 290 nm
Standard: Commercially available podophyllotoxin (Sigma, USA)
22 Co-Culture of Linum album Cells and Piriformospora indica 369

22.5.4 Phenylalanine Ammonia Lyase (PAL) EnzymeExtraction and Assay
1. Freeze fresh weight of plant cells (1 g) and homogenize using liquid nitrogen in a
precooled mortar and pestle at 4�C.2. Add 3 mL of borate buffer (0.1 M, pH 8) containing 5% glycerol and 50 mM
b-mercaptoethanol to powdered cells.
3. Ultrasonicate samples at 4�C for 1 min.
4. Centrifuge the homogenate at 10,000 rpm for 30 min at 4�C and collect the
supernatant.
5. For activity assay, add 1 ml of 50 mM phenylalanine to 0.5 ml of supernatant and
allow to incubate at 40�C for 60 min.
6. Stop the reaction by addition of 0.2 mL 6 N HCl.
7. Extract the reaction mixture by addition of 4 ml toluene and vortex for 15 s.
8. Centrifuge enzyme extract at 1,000 rpm for 10 min to separate the phases.
9. Analyze the toluene phase for the trans-cinnamic acid recovered against a
toluene blank at 290 nm.
10.Express PAL enzyme activity as mkat (mmoles of cinnamic acid formed per
second) per kg protein. Total protein estimation based on the principle of
protein-dye binding can be determined using bovine serum albumin as standard
(Bradford, 1976).
22.6 Conclusions
Plant cell culture-based technologies with intervention of arbuscular mycorrhiza-
like fungi such fungi can provide a suitable alternative for large-scale production of
important secondary metabolites at a commercial level. In this regard, Piriformos-pora indica can be used as a very promising tool, as significant enhancement in
plant cell biomass and podophyllotoxin productivity has been observed. Podophyl-
lotoxin accumulation and PAL enzyme activity were found to be directly asso-
ciated, as maximum lignan production resulted from maximum increment of
enzyme activity in the present case study.
Note: Intellectual property rights of the present work by the authors are covered
under Indian patent application no. 1266/DEL/2007 entitled ‘‘A process for en-
hanced production of bioactive compounds’’
References
Baldi A, Bisaria VS, Srivastava AK (2007) Biotechnological approaches for production of some
plant based chemotherapeutics. In: Kayser O, QuaxWJ (eds) Medicinal plant biotechnology—
from basic research to industrial applications, Wiley-VCH Verlag, Weinheim, pp 117–156
370 A. Baldi et al.

Baldi A, Jain A, Gupta N, Srivastava, AK, Bisaria, VS (2008) Co-culture of arbuscular
mycorrhiza- like fungi (Piriformospora indica and Sebacina vermifera) with plant cells of
Linum album for enhanced production of podophyllotoxins: a first report. Biotechnol Lett,
30(9):1671–1677.
Becard G, Fontin JA (1988) Early events of vesicular arbuscular mycorrhiza formation on Ri-T
DNA transformed roots. New Phytol 108:211–218
Bradford M (1976) A rapid and sensitive method for the quantitation of microgram quantities of
protein utilizing the principle of protein-dye binding. Anal Biochem 72:248–254
Chattopadhyay S, Srivastava AK, Bhojwani SS, Bisaria VS (2001) Development of suspension
culture of Podophyllum hexandrum for the production of podophyllotoxin. Biotechnol Lett
23:2063–2066
Chattopadhyay S, Srivastava AK, Bhojwani SS, Bisaria VS (2002a) Production of podophyllo-
toxin by plant cell cultures of Podophyllum hexandrum in bioreactor. J Biosci Bioeng
93:215–220
Chattopadhyay S, Srivastava AK, Bisaria VS (2002b) Optimization of culture parameters for
production of podophyllotoxin in suspension culture of Podophyllum hexandrum. Appl
Biochem Biotechnol 102/103:381–393
Chattopadhyay S, Bisaria VS, Bhojwani SS, Srivastava AK (2003a) Enhanced production of
podophyllotoxin by fed-batch cultivation of Podophyllum hexandrum. Can J Chem Eng
81:1–8
Chattopadhyay S, Bisaria VS, Srivastava AK (2003b) Enhanced production of podophyllotoxin
by Podophyllum hexandrum using in situ cell retention bioreactor. Biotechnol Prog 19:
1026–1028
Chattopadhyay S, Mehra RS, Srivastava AK, Bhojwani SS, Bisaria VS (2003c) Effect of major
nutrients on podophyllotoxin production in Podophyllum hexandrum suspension cultures. Appl
Microbiol Biotechnol 60:541–546
Chauhan AK, Das A, Kharkwal AC, Varma A (2006) Impact of micro-organisms on environment
and health. In: Chauhan AK, Varma A (eds) Microbiology series—Microbes: health and
environment. I.K. International Publishing House Pvt. Ltd., New Delhi, pp 1–12
Das A, Prasad R, Bhatnagar K, Lavekar GS, Varma A (2006) Impact of micro-organisms on
environment and health. In: Chauhan AK, Varma A (eds) Microbiology series – microbes,
health and environment. I.K. International Publishing House Pvt. Ltd., New Delhi, pp 13–64
Dixon RA (2001) Natural products and plant disease resistance. Nature 411:843–847
Farakya S, Bisaria VS, Srivastava AK (2004) Biotechnological aspects of the production of the
anticancer drug podophyllotoxin. Appl Microbiol Biotech 65:504–519
Grayer RJ, Kokubun T (2001) Plant–fungal interactions: the search of phytoalexins and other
antifungal compounds from higher plants. Phytochemistry 56:253–263
Hill TW, Kaefer E (2001) Improved protocols for Aspergillusminimal medium: trace element and
minimal medium salt stock solutions. Fungal Genet Newsl 48:20–21
Imbert F (1998) Discovery of podophyllotoxins. Biochimie 80:207–222
Kumari R, Pham GH, Prasad R, Sachdev M, Srivastava A, Yadav V, Verma PK, Sharma S, Malla
R, Singh A, Maurya AK, Prakash S, Pareek A, Rexer K-H, Kost G, Garg AP, Oelmueller,
Sharma MC, Varma A (2005) Piriformospora indica: Fungus of the millennium. In: Podila
GK, Varma A (eds) Basic research and applications of mycorrhizae. I.K. International Pub-
lishing House Pvt. Ltd., New Delhi, pp 259–296
Kumari R, Pham GH, Sachdev M, Garg AP, Varma A (2004) Symbiotic fungi for eco-friendly
environment: a perspective. Nat Prod Rad 3:396–400
Morton JB, Benny GL (1990) Revised classification of arbuscular mycorrhizal fungi (Zygomy-
cetes): a new order, Glomales, two new suborders, Glomineae and Gigasporineae, with an
emendation of Glomaceae. Mycotexon 37:471–491
Murashige T, Skoog F (1962) A revised medium for rapid growth and bioassay of tobacco tissue
cultures. Physiol Plant 15:473–497
22 Co-Culture of Linum album Cells and Piriformospora indica 371

Nicholas JB, John OW, Meromit A, Hassar TN (1994) Quantitative relationship between phenyl-
alanine ammonia-lyase levels and phenylpropanoid accumulation in transgenic tobacco
identifies a rate-determining step in natural product synthesis. Plant Biol 91:7608–7612
Rai MK, Singh AN, Arya D, Varma A (2001) Positive growth responses of the medicinal plants
Withania somnifera and Spilanthes calva to inoculation by Piriformospora indica in a field
trial. Mycorrhizae 11:123–128
Rai MK, Varma A (2005) Arbuscular mycorrhizae-like biotechnological potential of Piriformos-pora indica, which promotes the growth of Adhatoda vasica. Electron J Biotechnol ISSN
8:107–112
Sahay NS, Varma A (1999) Piriformospora indica: a new biological hardening tool for micro-
propagated plants. FEMS Microbiol Lett 181:297–302
Sahay NS, Varma A (2000) Biological approach towards increasing the survival rates of micro-
propagated plants. Curr Sci 78:126–129
Singh AN, Singh AR, Kumari M, Rai MK, Varma A (2003) Biotechnology importance of
Piriformospora indica – a novel symbiotic mycorrhiza-like fungus: An overview. Indian J
Biotechnol 2:65–75
Singh AN, Singh AR, Varma A (2002) Piriformospora indica— in vitro raised leguminous plants:
A new dimension in establishment and phyto-promotion. Indian J Biotechnol 1:372–376
Van Uden W (1992) The production of podophyllotoxin and related cytotoxic lignans by plant cell
cultures. Ph.D. Thesis, University of Groningen, Groningen, The Netherlands
Verpoorte R (1998) Exploration of nature’s chemodiversity: the role of secondary metabolites as
leads in drug development. Drug Dev Trends 3:232–238
372 A. Baldi et al.

Chapter 23
Fungal Elicitors for Enhanced Production
of Secondary Metabolites in Plant Cell
Suspension Cultures
A. Baldi, A.K. Srivastava, and V.S. Bisaria
23.1 Introduction
Plant cell culture systems are viable alternatives for the production of secondary
metabolites that are of commercial importance in food and pharmaceutical indus-
tries. However, relatively very few cultures synthesize these compounds over
extended periods in amounts comparable to those found in whole plants. Various
strategies have been employed to increase the production of secondary metabolites
in cell cultures as well as in hairy root cultures for commercial exploitation. These
include manipulation of culture media (hormonal and nutrient stress) and environ-
mental conditions (temperature, pH and osmotic stress), precursor addition, elicita-
tion and combination of these strategies. Nowadays, genetic manipulation of
biosynthetic pathways by metabolic engineering has also become a powerful
technique for enhanced production of desired metabolites.
The recent developments in elicitation of cell cultures have opened a new avenue
for the production of these compounds. Secondary metabolite synthesis and accu-
mulation in cell cultures can be triggered by the application of elicitors to the
culture medium. Elicitors can be defined as signalling molecules triggering the
formation of secondary metabolites in cell cultures by inducing plant defence,
hypersensitive response and/or pathogenesis related proteins. Depending on the
origin, elicitors can be classified in two classes: biotic and abiotic. Elicitors of
biological origin are called biotic elicitors. These include polysaccharides, proteins,
glycoproteins or cell-wall fragments derived from fungi, bacteria and even plants.
A. Baldi, A.K. Srivastava, and V.S. Bisaria (*)
Department of Biochemical Engineering and Biotechnology, Indian Institute of Technology,
New Delhi, India
e-mail: [email protected]
A. Varma and A.C. Kharkwal (eds.), Symbiotic Fungi, Soil Biology 18, 373
DOI: 10.1007/978‐3‐540‐95894‐9_23, # Springer‐Verlag Berlin Heidelberg 2009

Among these, fungal elicitors have been most widely studied for enhancement of
synthesis of commercially important compounds from plant cell cultures. Elicitors
of non-biological origin are called abiotic elicitors, which include metal ions, UV
light and chemically defined compounds. Recently, the term ‘abiotic stress’ is also
being used for abiotic elicitors.
Many studies have shown that both biotic elicitors and abiotic stresses enhance
secondary metabolite synthesis in plant cell cultures. However, no elicitor has been
found to have a general effect on many culture systems, and no system has been
found to respond to all elicitors. So it is necessary to screen various elicitors for a
particular system for production of a desired compound. Moreover, the concentra-
tion of elicitors, and the incubation time required for maximum elicitation, differ
with the kind of elicitor and the culture system. Therefore, screening is a must to
arrive at a suitable elicitor, and to determine its concentration and contact time for
maximal response in terms of secondary metabolite accumulation. Another impor-
tant aspect is the time of addition of a elicitor to the culture. Optimal induction
occurs when the elicitors are added to cultures at late exponential or early stationary
phase of plant cell growth. So the effect of any elicitor for maximum response
depends on the age of culture, concentration of elicitor and incubation time with the
elicitor. Keeping this in view, there has been a strong need for the discovery of
useful elicitors and for novel screening methods that would allow substances having
elicitation capability to be rapidly and easily screened.
In most of the studies done to date to enhance the synthesis of commercially
important plant-derived compounds by the addition of fungal elicitors to cell
cultures, pathogenic fungi have been used. Fungi, which mainly induce hypersen-
sitive response in plant cells, result in activation of plant defence pathways and
thereby increase phytoalexin production. Another significant plant–fungi interac-
tion reported is the symbiotic relationship between arbuscular myccorhizal fungi
and plant cells/organs. But due to the inability of these symbiotic fungi to grow in a
synthetic media, it has not been possible to study their effect for elicitation, if any.
With the discovery of Piriformospora indica (Varma and Franken 1997), a novel
endophytic axenically cultivable fungus, which mimics the capability of arbuscular
myccorhizal fungi, a new era has opened for enhanced production of plant-based
secondary metabolites in cell cultures by elicitation with this fungus.
Podophyllotoxin is one of the most promising secondary metabolites from
medicinal plant research, due to its pronounced cytotoxic activity. It is currently
being used for the synthesis of anticancer drugs such as etoposide, teniposide, and
etopophos, which are used for the treatment of testicular and lung cancers and
certain leukemias (Stahelin and Wartburg 1991; Imbert 1998). The isolation of
podophyllotoxin from the rhizomes of Podophyllum peltatum and P. hexandrum(Berberidaceae) plants is not a very ideal production system. The P. hexandrumrhizomes may contain ca. 4% of podophyllotoxin on a dry weight basis, while
P. peltatum contains still lower amounts of it. The supply of this compound has
become increasingly limited due to intensive collection, lack of cultivation, long
juvenile phase and poor reproduction capabilities (van Uden 1992). The species
P. hexandrum is also listed in Appendix II of CITES (Convention for International
Trade in Endangered Species). This appendix lists species that are not necessarily
374 A. Baldi et al.
threatened now with extinction, but which may become so unless trade is closely
controlled (World Conservation Monitoring Centre 2001).
The chemical synthesis of podophyllotoxin is possible (Hadimani et al. 1996),
but largely hampered by the complicated stereochemical ring closure necessary to
attain this compound. Synthetic production therefore only yields restricted quan-
tities at high cost.
This supply problem forms the drive for a large number of scientists to search for
alternative sources of podophyllotoxin. An ideal resource would be a fast-growing
and easy to cultivate plant cell or organ culture with a high lignan content. Tissue
cultures of Podophyllum species turned out to be quite recalcitrant or low-yielding
(Chattopadhyay et al. 2001, 2002a, b, 2003a–c; Farakya et al. 2004); therefore, in
recent years tissue culture of Iranian flax, Linum album, has become an attractive
alternative. These cell cultures have been reported to produce lignans with highest
productivity (Baldi et al. 2007). This chapter provides details for enhanced produc-
tion of podophyllotoxin in cell suspension cultures of Linum album by elicitation
with culture filtrate and cell extract of P. indica.
23.2 Development of Plant Cell Cultures
23.2.1 Germination of Seeds
1. Treat seeds of L. album with 1% Savlon (Johnson and Johnson, USA) for 5 min.
2. Rinse seeds with sterile double distilled water four to five times.
3. Transfer seeds into a 100 ml Erlenmeyer flask containing 50 ml of 70% ethanol,
and treat for 1 min.
4. Remove ethanol after treatment, and rinse the seeds with sterile double distilled
water thrice.
5. Transfer seeds in a 100 ml Erlenmeyer flask containing 25 ml of 0.01% mercuric
chloride, and treat for 2 min.
6. Remove mercuric chloride solution, and rinse the seeds with sterile double
distilled water thrice.
7. Transfer one seed/culture tube containing 20 ml of Murashige and Skoog (MS)
medium (Murashige and Skoog 1962) solidified with 1% agar for germination
using a sterile forceps over flame. Gently press the explants into the media for
good contact.
8. Plug the culture tubes with a sterile cotton plug over flame.
9. Transfer the tubes into a culture room at 25� 2�C under complete darkness, and
allow the seeds to germinate.
23.2.2 Initiation of Callus Cultures
1. Collect stem portions from 30-day-old in vitro germinated plants of L. album,and place the explants (stem) in a sterile Petri dish.
2. Cut stem portions to 1 cm � 1 cm size with the help of sterile blade.
23 Fungal Elicitors for Enhanced Production 375
3. Place one explant in one Petri dish containing 15 ml of MS medium (Murashige
and Skoog 1962) solidified with 1% agar and supplemented with 0.4 mg l�1
NAA (naphthalene acetic acid) for callus initiation using a sterile forceps.
4. Cover the petri dish with lid and seal it with parafilm.
5. Transfer Petri dishes in a culture room at 25 � 2�C under 16 h/8 h light/dark
cycle with a light intensity of 1,200 lux.
6. Observe the callus initiation.
23.2.3 Initiation of Suspension Cultures
23.2.3.1 Inoculum Preparation
1. Transfer fresh and friable cells (20 days old) from callus culture (5 g l�1 on dry
cell weight basis) into a 250 ml Erlenmeyer flask containing 50 ml MS media
containing 0.4 mg l�1 NAA with the help of sterile spatula over flame.
2. Plug the culture tubes with sterile cotton plug over flame.
3. Place inoculated flasks on a gyratory shaker rotating at 125 rpm in a culture room
at 25 � 2�C under 16 h/8 h light/dark cycle with a light intensity of 1,200 lux.
4. Allow the cells to grow in suspension culture for 12 days.
5. Centrifuge the grown cells in sterile centrifuge tubes at 5,000 rpm for 10 min.
6. Decant the spent media and use cells to inoculate suspension cultures for
elicitation setup.
23.2.3.2 Development of Suspension Culture
1. Transfer these cells (5 g l�1 on dry cell weight basis) into a 250 ml Erlenmeyer
flask containing 50 ml MS media containing 0.4 mg l�1 NAA with the help of
sterile spatula over flame.
2. Place inoculated flasks on a gyratory shaker rotating at 125 rpm in a culture room
at 25� 2�C under 16 h/8 h light/dark cycle with a light intensity of 1,200 lux and
allow the cells to grow for 12 days.
23.3 Development of Elicitors
23.3.1 Preparation of Elicitors
1. Transfer cells of arbuscular myccorhiza like fungus, Piriformospora indica, toa 250 ml Erlenemeyer flask containing 50 ml of MYPG media of following
composition:
376 A. Baldi et al.
Malt extract: 3 g l�1
Yeast extract: 3 g l�1
Peptone: 5 g l�1
Glucose: 10 g l�1
(pH: 6.2)
2. Incubate the inoculated flasks on an incubator shaker, rotating at 200 rpm, at
25 � 2�C in 16 h/8 h light/dark cycle, and allow the cells to grow till the end of
the log phase (6 days).
3. Collect the culture broth by passing the fungal culture through a Whatman No. 1
filter paper.
4. Centrifuge the culture broth at 5,000 rpm for 15 min and remove fungal cells, if
any.
5. Farakya et al. (2005) suggested the following technique for preparation of fungal
elicitors.
(a) Divide the culture broth into two portions. Use one portion after passing it
through 0.22 mm filter and designate it as ‘filtered culture broth’.
(b) Autoclave another portion of culture broth at 15 psig and 121�C for 20 min
and designate it as ‘autoclaved culture broth’.
(c) Wash the fungal mat several times with sterile double distilled water and
allow it to dry at 40 � 2�C in a hot air oven to constant weight.
(d) Crush the dry cells in a mortar pestle.
(e) Suspend 10 g of dry cell powder in 100 ml of double distilled water (pH
5.7) and autoclave it at 15 psig and 121�C for 20 min for hydrolysis.
(f) Centrifuge the hydrolysate at 5,000 rpm for 10 min
(g) Collect the supernatant and designate it as ‘cell extract’.
(h) Store the fungal elicitor preparations at 4�C till further use.
Methodology for preparation of fungal elicitors is represented as Fig. 23.1.
23.3.2 Addition of Elicitors
1. Add all three fungal elicitors separately on v/v basis (generally in a range of
1–10%, v/v) to suspension cultures of L. album at different phases of growth
with the help of sterile pipette.
(Note that the time of addition can be at the start of cultivation, end of lag phase,
middle and/or late log phase or early stationary phase. Depending on the time of
addition of elicitor to the medium and harvest time of culture, one can test the effect
of various times of incubation also, e.g. if the elicitor is added on the 8th and 10th
days of a cultivation that ends on the 12th day, the times of incubation will be 96
and 48 h respectively.)
2. Harvest the flasks, in duplicate, at the end of cultivation, and analyse for the
effect of fungal elicitors on growth and product accumulation.
3. Measure the responses in terms of biomass (g l�1, on dry cell weight basis),
podophyllotoxin accumulation (mg l�1) and overall volumetric productivity of
podophyllotoxin (mg l�1d�1).
23 Fungal Elicitors for Enhanced Production 377

23.4 Analysis
23.4.1 Growth in Terms of Dry Cell Weight
1. Harvest individual flasks, in duplicate, at the end of cultivation.
2. Filter the cell suspension through Whatman No. 1 filter paper on a Buchner
funnel under slight vacuum.
3. Wash the cells with double distilled water.
4. Drain fully under vacuum.
5. Transfer the cells to a pre-weighed Petri dish. Dry cells at 25� 2�C to a constant
weight (approx. 48 h).
6. Reweigh the cells with a Petri plate.
7. Calculate biomass produced/50 ml media by subtracting weight of the empty
Petri dish from total weight of Petri dish and dried cells. Express the weight of
cell biomass as g l�1 dry cell weight.
Fungal cultures
Grow till late log phase
Filter through Whatman No. 1 filter paper
Filter through 0.22 µmembrane
Filtered culturebroth
Cell extract
Store at 4°C till further use
Media Filtrate Fungal biomass
Centrifuge and collect the supernatant Wash several times withsterile distilled water
Autoclave it Dry at 40°C to constantweight and powder it
Suspend in sterile distilledwater @ 100 g/L and
autoclave
Autoclaved culturebroth
Centrifuge it and collect thesupernatant
Fig. 23.1 Preparation of fungal elicitors
378 A. Baldi et al.

23.4.2 Extraction and Estimation of Podophyllotoxin
1. Suspend accurately weighed dried and powdered cells (100 mg) in 5 ml of
methanol in 10 ml glass tube.
2. To release intracellular product, sonicate cells at 4–6�C for 15 min and allow
complete extraction for 24 h.
3. Centrifuge the extract at 5,000 rpm for 10 min and collect the supernatant.
4. Allow methanol to evaporate at 25 � 2�C (approx. 12–18 h).
5. Re-dissolve this extract in a known volume of HPLC grade methanol and filter it
through 0.22 mm filter.
6. Quantify podophyllotoxin in each sample on HPLC under following conditions:
Column: Nova Pak RP-C18 column (Waters, USA)
Packing: 250 � 4.6 mm
Mobile phase: 0.01% phosphoric acid in water: acetonitrile (72:28%, v/v)
Flow rate: 0.8 ml min�1
Column temperature: 30�CDetection: Diode array detector at 290 nm
Standard: Commercially available podophyllotoxin (Sigma, USA)
23.5 Conclusions
For elicitation studies in plant cell cultures, it is necessary to screen various elicitors
and optimize their concentration and time of incubation. P. indica has been found toenhance podophyllotoxin in plant cell cultures by several-fold. This can provide a
valuable technique in commercial production of plant-derived secondary metabo-
lites.
References
Baldi A, Bisaria VS, Srivastava AK (2007) Biotechnological approaches for production of some
plant based chemotherapeutics. In: Kayser O, QuaxWJ (eds) Medicinal plant biotechnology—
From basic research to industrial applications, Wiley-VCH Verlag, Weinheim, pp 117–156
Chattopadhyay S, Srivastava AK, Bhojwani SS, Bisaria VS (2001) Development of suspension
culture of Podophyllum hexandrum for the production of podophyllotoxin. Biotechnol Lett
23:2063–2066
Chattopadhyay S, Srivastava AK, Bhojwani SS, Bisaria VS (2002a) Production of podophyllo-
toxin by plant cell cultures of Podophyllum hexandrum in bioreactor. J Biosci Bioeng 93:
215–220
Chattopadhyay S, Srivastava AK, Bisaria VS (2002b) Optimization of culture parameters
for production of podophyllotoxin in suspension culture of Podophyllum hexandrum. ApplBiochem Biotechnol 102/103:381–393
23 Fungal Elicitors for Enhanced Production 379
Chattopadhyay S, Bisaria VS, Bhojwani SS, Srivastava AK (2003a) Enhanced production of
podophyllotoxin by fed-batch cultivation of Podophyllum hexandrum. Can J Chem Eng
81:1–8
Chattopadhyay S, Bisaria VS, Srivastava AK (2003b) Enhanced production of podophyllotoxin by
Podophyllum hexandrum using in situ cell retention bioreactor. Biotechnol Prog 19:1026–1028Chattopadhyay S, Mehra RS, Srivastava AK, Bhojwani SS, Bisaria VS (2003c) Effect of major
nutrients on podophyllotoxin production in Podophyllum hexandrum suspension cultures. Appl
Microbiol Biotechnol 60:541–546
Farakya S, Bisaria VS, Srivastava AK (2004) Biotechnological aspects of the production of the
anticancer drug podophyllotoxin. Appl Microbiol Biotechol 65:504–519
Farkya S, Julka A, Mehra R, DattaV, Srivastava AK, Bisaria VS (2005) Enhanced production of
secondary metabolites by biotic elicitors in plant cell suspension cultures. Presented at 5th Asia
Pacific Biochemical Engineering Conference, May 15–19, 2005, Jeju Island, Korea
Hadimani SB, Tanpure RP, Bhat SV (1996) Asymmetric total synthesis of (-) Podophyllotoxin.
Tetrahedron Lett 37: 4791–4794
Imbert F (1998) Discovery of podophyllotoxins. Biochimie 80:207–222
Murashige T, Skoog F (1962) A revised medium for rapid growth and bioassay of tobacco tissue
cultures. Physiol Plant 15:473–497
Stahelin HF, Wartburg AV (1991) The chemical and biological route from podophyllotoxin
glucoside to etoposide. Cancer Res 51:5–15
Van Uden W (1992) The production of podophyllotoxin and related cytotoxic lignans by plant cell
cultures. Ph.D. Thesis, University of Groningen, Groningen, The Netherlands
Varma A, Franken P (1997) European Patent Office, Munich, Germany, Patent No. 97121440.8-
2105, Nov 1998
World Conservation Monitoring Centre (2001) Checklist of CITES species: a reference to the
appendices to the Convention on international trade in endangered species of wild fauna and
flora, CITES Secretariat/World Conservation Monitoring Centre, Chatelaine-Geneve
380 A. Baldi et al.

Chapter 24
Auxin Production by Symbiotic Fungi:
Bioassay and HPLC-MS Analysis
Anke Sirrenberg, Richard Splivallo, Astrid Ratzinger, Katharina Pawlowski,
and Petr Karlovsky
Abbreviations
ESI Electrospray ionization
HPLC High performance liquid chromatography
IAA Indole-3-acetic acid
MS Mass spectrometry
MSK Murashige and Skoog
NAA a-naphthalene acetic acidPTFE Polytetrafluorethylene
24.1 Introduction
Many soil bacteria and fungi, including many ectomycorrhizal fungi, produce
indole-3-acetic acid (IAA) or similar derivatives, collectively termed auxins
(Gruen 1959; Ek et al. 1983; Barker and Tagu 2000). IAA is a plant hormone
responsible for the regulation of cell elongation; directed growth and apical domi-
nance (see Taiz and Zeiger 2006). In a specific concentration range which may vary
for different plant species, externally applied auxin increases root branching and
hairy root formation, with concurrent reduction of main root length.
Auxin secreted by a fungus into the soil in the vicinity of plant roots may thus
increase the overall root surface, improving the chance for the fungus to establish
A. Sirrenberg (*), R. Splivallo, A. Ratzinger and P. Karlovsky
Department of Crop Sciences, Molecular Phytopathology and Mycotoxin Research Unit, Georg-
August-Universitat Gottingen, Grisebachstr. 6, Gottingen, Germany
e-mail: [email protected]
K. PawlowskiDepartment of Botany, Stockholm University, 10691 Stockholm, Sweden
A. Varma and A.C. Kharkwal (eds.), Symbiotic Fungi, Soil Biology 18, 381
DOI: 10.1007/978‐3‐540‐95894‐9_24, # Springer‐Verlag Berlin Heidelberg 2009

physical contact with a potential host. Apart from this mechanistic aspect, the
secretion of auxin by plant symbionts and pathogens constitutes a chemical signal
conditioning the plant for the interaction (Spaepen et al. 2007). The modification of
plant root architecture by plant-associated microbes producing auxin may lead to
the improvement of the water and mineral uptake capacity of the plant, and as such
has a potential of improving the yield of cultivated plants.
Here we present a simple bioassay which can be conducted in any laboratory
with basic microbiological equipment, and which may give a first hint as to whether
a mycorrhizal or endophytic fungus produces auxin. We also present a detailed
protocol for IAA determination by HPLC-MS. Part of the procedure has been
published in Sirrenberg et al. (2007).
Arabidopsis thaliana is recommended as a test plant for the bioassay, although it
is non mycorrhizal. A. thaliana seedlings are very suitable for in vitro tests in Petri
dishes because they are small and the roots are very sensitive to auxin. Additionally,
many mutants are available, including mutants impaired in auxin uptake or percep-
tion. Other plants have also been successfully tested, including Lotus japonicus(Fig. 24.2), Medicago truncatula (A. Sirrenberg, unpublished data) and Cistusincanus (R. Splivallo, unpublished data).
24.2 Equipment and Laboratory Material
24.2.1 Equipment
For bioassays:
l Laminar flow bench or clean area for sterile workl Pipettes 20–200 mll Growth chamber (or greenhouse with stable conditions)l Autoclave
For HPLC-MS analysis:
l Rotary evaporator or SpeedVac vacuum concentratorl Round-bottom flasksl Rotary incubator (optional)l Homogenizer or blender to grind the agar for IAA extractionl HPLC-ESI-MS system, e.g.:
l Autosampler ProStar 430, Varian, Germanyl Binary pump system (ProStar 210, Varian, Germany)l Column ovenl Reversed-phase column (Polaris C18-A, 150� 2 mm; 5 m, Varian, Germany)
and a compatible guard columnl Triple-quadrupole mass spectrometer with electrospray ionization interface
(Varian 1200 L LC/MS, Varian, Germany)
382 A. Sirrenberg et al.
24.2.2 Laboratory Material
l Arabidopsis thaliana seeds (wild type and/or mutants) or seeds of mycorrhizal
plantsl Murashige and Skoog medium with vitamins (e.g. Duchefa, The Netherlands)l Cultures of fungi to be testedl Malt extract (optional)l Sucrosel Agar or Phytagel (Sigma-Aldrich, St Louis, MO, USA)l Petri dishes (preferably square, 10 cm � 10 cm)l Autoclaved calibrated cylinder or sterile plastic tube (50 ml)l Ethanoll Indole-3-acetic acid (IAA)l Deuterated indole-3-acetic acid (D5-IAA for HPLC-ESI/MS analysis)l Filter paper discs (e.g. antibiotic assay discs, Ø 9 mm)l Sterile aluminum foil (approx. 3 cm � 4 cm)l Tweezersl Sterile demineralized waterl Sterile filter paper (e.g. 6 cm diameter)l Sterile toothpicksl 0.1% sterile water agar (optional)l Scalpel (optional)l Spatula (optional)l Ethyl acetate (for the diffusion bioassay see Sect. 24.4.5)l Methanol, water, acetonitrile, acetic acid (for HPLC/MS analysis)
24.3 Interaction on the Same Medium: Piriformospora/Arabidopsis
24.3.1 Preparation of Slope Agar Plates
Prepare 1/2 MSK liquid medium by dissolving 2.2 g l�1 Murashige and Skoog
medium with vitamins and 15 g of sucrose in 800 ml of demineralised water.
Adjust pH to 5.8. Adjust volume to 1,000 ml. Add 15 g agar or 3 g phytagel and
autoclave.
Pour 40 ml of the autoclaved medium into a square Petri dish. Create a slope by
carefully lifting the plate at one end and sliding the lid underneath (see Fig. 24.1).
The rim of the lid should be placed at the middle of the Petri dish.
Remark: Choosing the gelling agent: Medium prepared with Phytagel is transpar-
ent and allows better observation of root development and colonization, even micro-
scopical observation at low magnitude through the bottom of the closed Petri dish.
24 Auxin Production by Symbiotic Fungi 383

Fig. 24.1 Step-by-step guide to IAA determination
Bioassay preparation (24.3.1, 24.4.1). Inoculate fungus (the black larger dots) (24.3.2, 24.4.2).Add seeds of test plants (24.3.3, 24.4.3). Grow plants (24.3.4, 24.4.4). Observe morphological
changes of the roots (24.3.5). Bioassay with synthetic IAA or culture filtrates on the filter discs
(white circles) (24.4.5). Collect agar with a scalpel for IAA quantification (24.4.6). Extract IAA
with ethyl acetate (24.4.7). Quantify IAA by HPLC-MS (24.4.8)
384 A. Sirrenberg et al.

In addition, roots may be harvested from phytagel without damage by dissolving
the solid medium in three volumes of 100 mM sodium citrate buffer pH 6.
Remark: If buffering the pH of the medium is required, remember that an acidic
medium will facilitate IAA uptake in the seedlings better than a neutral one,
because of passive diffusion of of the protonated IAAH through the cell walls
(Yang et al. 2006).
Remark: In mycorrhizal research, lower sucrose concentrations are often
recommended to improve the colonization of the root by the fungus. We have
tested sucrose concentrations in a range between 0.5 and 2%, and obtained similar
results with regard to root branching of A. thaliana inoculated with Piriformosporaindica.
Remark: Round Petri dishes (Ø 9.0 cm) can be used instead of square ones, but
the development of the roots can then only be clearly observed in the middle of the
plates, especially in the controls where the roots tend to be longer.
24.3.2 Inoculation of the Fungus
Place mycelial plugs from the growing margin of a colony below the seeds, as
indicated in Fig. 24.1.
24.3.3 Adding Arabidopsis Seeds to the Petri Dish
Sterilize seeds as follows:
l 70% ethanol, 1 minl 20 min in 1% sodium hypochloridel Rinse three times with sterile water
Transfer sterilized seeds to a sterile wetted filter paper in a round Petri dish and if
needed stratify them (2 days at 4�C) to synchronize germination (may be necessary
especially for some mutants of A. thaliana).To transfer seeds onto the agar, take them one by one with the tip of a sterile
toothpick and gently place them at the surface of the agar, as illustrated in Fig. 24.1.
Alternatively, suspend sterilized seeds in 0.1% sterile water agar and pipette seeds
one by one onto the rim of the agar slope.
Remark:We recommend a maximum of 10 seeds of A. thaliana per Petri dish ifprecise microscopic observations need to be made on root branching and root
length. The bioassay can be followed up and the root branching quantified until
the rooting system becomes too entangled to distinguish primary from secondary
roots. This time period depends on the fungus; for truffles (e.g. Tuber melano-sporum or T. borchii) we were able to monitor root development of A. thaliana in
this system for 15 days.
24 Auxin Production by Symbiotic Fungi 385

Fig. 24.2 Effect of living mycelium of P. indica and externally applied auxin on A. thalianaa Bushy root growth of A. thaliana inoculated with P. indica (8 weeks). Even plants at a distance
of some cm of the mycelium show increased root branching. b Control plants with normal
(elongated) roots. c Increased root branching in Lotus japonicus inoculated with P. indica; dcontrol (8 weeks). e Externally applied auxin induces bushy root phenotype in A. thalina, 250 mgIAA per filter disc (5 weeks); f 1 mM NAA in the medium (2 weeks). Scale bar denotes 1 cm
386 A. Sirrenberg et al.

24.3.4 Growth Conditions
We recommend 20�C, 120 mmol m�2 s�1, 16 h light.
A yellow plastic shield may be used to protect auxins from light degradation
during plant growth (Stasinopoulos and Hangarter 1990).
24.3.5 Evaluation of Roots
Branching: observe under a binocular and count secondary and tertiary roots.
Root length: acquire an image of the Petri dishes by using a scanner or camera,
measure root length. Root hairs: take pictures under a binocular, measure root hair
length. Software such as the freeware Image J (available at http://rsb.info.nih.gov/ij/)
may be used for determining root hair length and root length from digital images.
24.4 Interaction on Two Different Media: Truffles/Arabidopsis
Some mycorrhizal fungi are difficult to grow under laboratory conditions, and may
require specific medium formulation. If no or poor growth is achieved with the
fungus on MSK-medium, an alternative ‘‘dual-culture’’ bioassay can be used to test
the strain for the production of IAA.
24.4.1 Preparation of Dual Bioassay Plates
Square Petri dishes (10 � 10 cm2) are first filled with 50 ml of the fungal medium.
Keep the Petri dishes horizontally in a sterile bench until the medium solidifies.
Then remove half of the medium with a scalpel and spatula (see Fig. 24.1), and add
25 ml of melted MSK-agar (or another plant medium) to fill the space where the
fungal medium has been removed (see the illustration in Fig. 24.3a).
24.4.2 Inoculation of the Fungus
Inoculate the fungus in the middle of the fungal medium, and if growth or IAA
exudation is very slow, allow it to grow in the dark before plant seeds are added for
24 Auxin Production by Symbiotic Fungi 387
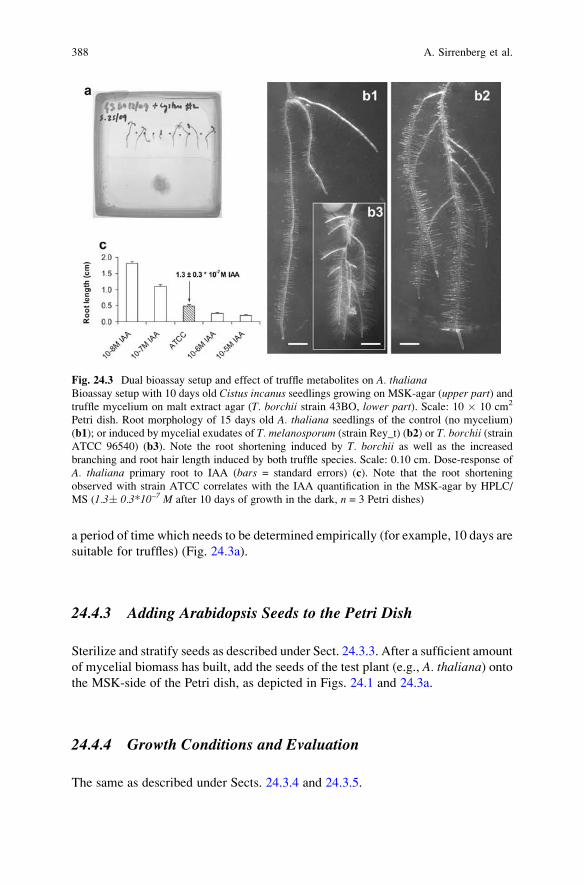
a period of time which needs to be determined empirically (for example, 10 days are
suitable for truffles) (Fig. 24.3a).
24.4.3 Adding Arabidopsis Seeds to the Petri Dish
Sterilize and stratify seeds as described under Sect. 24.3.3. After a sufficient amount
of mycelial biomass has built, add the seeds of the test plant (e.g., A. thaliana) ontothe MSK-side of the Petri dish, as depicted in Figs. 24.1 and 24.3a.
24.4.4 Growth Conditions and Evaluation
The same as described under Sects. 24.3.4 and 24.3.5.
Fig. 24.3 Dual bioassay setup and effect of truffle metabolites on A. thalianaBioassay setup with 10 days old Cistus incanus seedlings growing on MSK-agar (upper part) andtruffle mycelium on malt extract agar (T. borchii strain 43BO, lower part). Scale: 10 � 10 cm2
Petri dish. Root morphology of 15 days old A. thaliana seedlings of the control (no mycelium)
(b1); or induced by mycelial exudates of T. melanosporum (strain Rey_t) (b2) or T. borchii (strainATCC 96540) (b3). Note the root shortening induced by T. borchii as well as the increased
branching and root hair length induced by both truffle species. Scale: 0.10 cm. Dose-response of
A. thaliana primary root to IAA (bars = standard errors) (c). Note that the root shortening
observed with strain ATCC correlates with the IAA quantification in the MSK-agar by HPLC/
MS (1.3� 0.3*10–7 M after 10 days of growth in the dark, n = 3 Petri dishes)
388 A. Sirrenberg et al.

24.4.5 Estimation of the IAA Amount Produced by the Fungus
Establish a dose response of A. thaliana to synthetic IAA as described below.
Prepare IAA standard solutions in ethanol, e.g. 1 mM, 10 mM, 100 mM. Apply
45 ml of the solution per filter disc (FD). Place the FDs on aluminum foil in a
cleanbench, and allow the solvent to evaporate completely (this may take a few
hours). Prepare FDs with pure solvent (ethanol) for the control Petri dishes.
Place the FD on the agar as indicated in Fig. 24.1 (2 FDs per Petri dish), add the
seeds of the test plants as described earlier and grow the plants for ten to 15 days.
Compare the morphological changes to the rooting system induced by the fungus to
changes caused by known IAA amounts.
Remark: Alternatively, auxin may be added directly to the medium. In this case,
a stock solution in ethanol is prepared, and a suitable volume is added to the
medium after autoclaving when the medium has cooled down to a temperature of
about 60�C. Mix by swinging the bottle gently. Instead of IAA, the more stable
derivative a-naphtalene acetic acid (NAA) may be used (Fig. 24.2f), but care must
be taken when working with auxin deficient mutants. NAA may enter the roots by
diffusion, circumventing carrier mechanisms (Delbarre et al. 1996).
Remark: Fungal culture filtrate may also be used directly or after extraction
with ethyl acetate to test the presence of IAA. In the case of Piriformospora,inoculate an appropriate medium, e.g. 100 ml M+ (4 g l�1 yeast extract, 10 g l�1
malt extract, 4 g l�1 glucose, 20 g l�1), with 20 mycelial plugs from the growing
margin of a colony on solid medium. Mock-inoculate control flasks with plugs from
solid medium without fungus. Be sure to use medium prepared the same day and
stored under the same conditions for fungal cultures and controls. In a first experi-
ment, cultures should be harvested at different time points, e.g. once a week (at least
one fungal culture and one control), until the timepoint of maximal IAA concentra-
tion is known. Separate mycelium from medium by filtration through filter paper.
Take 15 ml of the culture supernatant and of sterile medium as a control. Sterilize 5
ml by sterile filtration, apply to filter paper discs as described above (in experiments
with culture filtrate of Piriformospora indica, 135 ml per disc were effective).
Adjust the remaining 10 ml of medium to pH 3 with acetic acid, and extract with
equal volume of ethyl acetate. Evaporate the organic phase to dryness under
vacuum or nitrogen stream. Resolve the residue in 200 ml of ethyl acetate, applyto filter paper discs (45 mL on one disc) and repeat the bioassay.
Remark: The bioassays described above should not be considered as a proof
that a fungus produces IAA, because other substances may cause similar effects, or
inhibiting substances may interfere with the effect of IAA. It rather provides a quick
indication that a fungus produces IAA or metabolite(s) with similar effects.
24.4.6 IAA Quantification in Agar Plates
Slope agar plates or dual bioassay plates are prepared as described above. Three
Petri dishes are inoculated with the fungus (Piriformospora or truffle) as described
24 Auxin Production by Symbiotic Fungi 389

in Fig. 24.1, and three control plates are mock-inoculated with plugs taken from the
same medium that served to pre-cultivate the fungus. The fungus is allowed to grow
under the same conditions as with the bioassay described earlier. After the desired
time, the agar zone where the plants were normally growing (�10 g agar: determine
the exact weight) is harvested with a scalpel as depicted in Fig. 24.1 and stored in a
50 ml Falcon tube at �20�C until further extraction.
24.4.7 Extraction of the Agar Plates for IAA Determination
l Avoid direct light to prevent IAA degradation.l To each agar sample add 7.0 ml water/methanol mixture (1:1) containing the
desired amount of internal standard (e.g. 250 ng deuterated IAA). Homogenize/
crush with a blender.l Add 50 ml 100% acetic acid (fuming).l Add 7.0 ml ethyl acetate and vortex for 30 s followed by centrifugation at 4,500
rcf for 10 min.l Remove upper phase (ethyl acetate), transfer to a new centrifuge tube (or 15 ml
Falcon tube) and remove the solvent under vacuum at 40�C.l Redissolve the residue in 1.0 ml water/methanol containing 7.0 mM acetic acid,
filter through a 0.2 mm PTFE filter into a dark HPLC vial.
Remark: Alternatively, IAA concentration can be determined in liquid
cultures described under 24.4.5. Add internal standard D5-IAA (we used 250 ng
of D5-IAA for 100 ml of liquid culture) to the culture filtrate and to the control.
Adjust to pH 3 with acetic acid. Extract twice with an equal volume of ethyl acetate,
using a separating funnel. The separation of the two phases may be accelerated
by centrifugation (3,200g, 10 min, 10�C). Collect organic phases, evaporate to
dryness (SpeedVac or vacuum evaporator), redissolve in 1.0 ml water : methanol
1: 1 with 7 mM acetic acid, filter through a 0.2 mm PTFE filter into dark HPLC vials.
24.4.8 HPLC-ESI-MS/MS Determination of IAA
24.4.8.1 HPLC Conditons
Ten microliters of the HPLC sample are injected onto a RP-18 column and eluted
isocratically with methanol/water/acetonitrile (50: 47.5: 2.5) containing 7 mM
acetic acid at a flow rate of 0.2 ml min�1.
24.4.8.2 ESI-MS/MS System and Conditions
l Triple-quadrupole mass spectrometer (Varian 1200 L LC/MS, Varian, Germany)
with electrospray ionization source
390 A. Sirrenberg et al.
l Drying gas (nitrogen) pressure: 18 psi (pounds per square inch, equivalent to 124
kPa) at 250�C, nebulizing gas (air): 50 psi (345 kPa)l Pressure of collision gas (argon): 1.4 mTorrl Needle voltage: �4400 Vl Shield voltage: �600 Vl Capillary voltage: �40 Vl The mass spectrometer was operated with negative Electrospray ionization in
multiple reaction monitoring mode.l Mass transition for IAA: m/z 173.9/ m/z 130.0 (collision energy (CE) 9.0 eV)l Mass transition for D5-IAA: m/z 178.8/ m/z 134.0 (CE 11.5 eV)
A calibration curve of the ratio of peak areas of unlabeled standards to peak area
of deuterium labeled IAA was used for quantification.
Remark: Because IAA occurs in common media components, extracts of media
in which no fungus had been cultured should always be analyzed as negative
controls.
If any IAA is found in the pure medium, its concentration has to be subtracted
from the IAA concentrations in culture filtrates of the fungus. Obviously, the use of
media which do not contain detectable amounts of IAA is preferable.
24.5 Examples of IAA Production by Fungi
24.5.1 Piriformospora indica
Piriformospora indica is an endophytic fungus which increases plant growth in
many plants of different families (Varma et al. 1999). In contrast to arbuscular
mycorrhizal fungi, P. indica grows well on artificial media, and it is also able to
colonize cruciferous plants including A. thaliana. In many interactions increased
shoot growth was accompanied by increased root biomass. The mechanism by
which this beneficial effect is achieved has long been debated. In our bioassay,
A. thaliana inoculated with P. indica showed increased root branching and reducedmain root length (‘‘bushy roots’’), whereas the roots of uninoculated plants reached
the bottom of the Petri dish after 2 weeks (Figs. 24.2a, b). Similarly enhanced root
branching was observed after inoculation of the mycorrhizal plant Lotus japonicuswith P. indica (Figs. 24.2c, d). The phenotype resembled very much typical auxin
effects. Therefore we compared the effect of pure externally applied auxin in
different concentrations (Figs. 24.2e, f, for details see Sirrenberg et al. 2007) with
the effect of P. indica culture filtrates and its ethyl acetate extracts. The pure culturefiltrate as well as the extracts inhibited main root length while increasing root
branching. The IAA content in the culture filtrate was determined by HPLC-MS
and GC-MS to be 1.36 +/� 0.36 mM (after 4 weeks of growth in M+ medium at
23�C on a rotary shaker (Sirrenberg et al. 2007).
24 Auxin Production by Symbiotic Fungi 391

24.5.2 Truffles
Truffles are symbiotic fungi forming ectomycorrhizae with trees (e.g., oaks, hazels)
and some shrubs (e.g., Cistus). Production of IAA by ectomycorrhizal fungi is well-
known, and IAA, probably with other signal molecules, might drive the ectomycor-
rhiza genesis (Barker and Tagu 2000). Using the bioassay described in Fig. 24.3a,
we demonstrated that the exudates of two truffle species (Tuber borchii and
T. melanosporum) modify the root architecture of Arabidopsis thaliana (i.e., root
shortening, increased branching and root hair length: see Figs. 24.3b1–b3). IAA
was quantified by HPLC-MS directly from the MS agar zone of the bioassay
(Fig. 24.3a). The mycelium of T. borchii (strain ATCC 96540) produced 1.3
� 0.3 *10�7 M IAA after 10 days of growth in the dark (about ten times more
than was found in control Petri dishes containing no fungus). After establishing a
dose response of A. thaliana root length to synthetic IAA, we concluded that the
IAA exudated by T. borchii fully accounts for the root shortening of A. thalianaseedlings (Fig. 24.3c).
References
Barker SJ, Tagu D (2000) The roles of auxins and cytokinins in mycorrhizal symbioses. J Plant
Growth Regul 19:144–154
Ek M, Ljungquist PO, Stenstrom E (1983) Indole-3-acetic acid production by mycorrhizal fungi
determined by gas chromatography-mass spectrometry. New Phytol 94:401–407
Gruen HE (1959) Auxins and fungi. Annu Rev Plant Physiol 10:405–440
Delbarre A, Muller P, Imhoff V, Guern J (1996) Comparison of mechanisms controlling uptake
and accumulation of 2,4-dichlorophenoxy acetic acid, naphtalene-1-acetic acid, and indol-3-
acetic acid in suspension-cultured tobacco cells. Planta 198:532–541
Sirrenberg A, Gobel C, Grond S, Czempinski N, Ratzinger A, Karlovsky P, Santos P, Feussner I,
Pawlowski K (2007) Piriformospora indica affects plant growth by auxin production. Physiol
Plant 131:581–589
Spaepen S, Vanderleyden J, Remans R (2007) Indole-3-acetic acid in microbial and microorgan-
ism-plant signaling. FEMS Microbiol Rev 31:425–448
Stasinopoulos TC, Hangarter RP (1990) Preventing photochemistry in culture media by long-pass
light filters alters growth of cultured tissues. Plant Physiol 93:1365–1369
Taiz L, Zeiger E (2006) Plant physiology. Sinauer Associates, Sunderland, MA
Yang Y, Zimmer UZ, Taylor CG, Schachtmann DP, Nielsen E (2006) High-affinity auxin
transport by the AUX1 influx carrier protein. Curr Biol 16:1123–1127
Varma A, Verma S, Sudha, Sahay N, Butehorn B, Franken P (1999) Piriformospora indica, acultivable plant-growth-promoting root endophyte. Appl Environ Microbiol 65:2741–2744
392 A. Sirrenberg et al.

Chapter 25
Siderophores of Mycorrhizal Fungi: Detection,
Isolation and Identification
K. Haselwandter and G. Winkelmann
25.1 Introduction
Iron is an essential element for almost all forms of life. In an aerobic environment,
iron in aqueous solution exists in the form of Fe(H2O)63+ and precipitates as an
oxide–hydroxide polymer. With a solubility product of KS = 10�38 M for Fe (OH)3,
the maximum concentration of free ferric iron in aqueous solution is 10�17 M at pH 7.
This renders iron unavailable for organisms in sufficient quantities, unless they
produce a solubilization system. Under iron-limiting conditions most bacteria and
fungi excrete siderophores as chelating agents which form soluble complexes with
Fe (III) with very high formation constants, thus solubilizing ferric iron. Properties
and functions of microbial siderophores have been compiled earlier in a compre-
hensive handbook on microbial iron chelates (Winkelmann 1991). The reader is
also referred to recent reviews on: (1) the biosynthesis of siderophores and the
identification of membrane transporters (Winkelmann 2001; Haas 2003), (2) the
ecological significance of fungal siderophores (Winkelmann 2006), and (3) side-
rophores of symbiotic fungi (Haselwandter 2008; Johnson 2008; Haselwandter and
Winkelmann 2007).
This chapter is designed as a collection of common fungal siderophore structures
and useful methods for the identification and characterization of siderophores, and
to be complementary to Haselwandter and Winkelmann 1998. Hence, for bioassays
and most of the chemical assays, for example, the 1998 publication should be
consulted. For elucidating the potential of mycorrhizal fungi to release sidero-
phores, they have to be grown in a nutrient medium adequate not only for fungal
K. Haselwandter (*)
Institut fur Mikrobiologie, Universitat Innsbruck, Technikerstrasse 25, A-6020 Innsbruck, Austria
e-mail: [email protected]
G. Winkelmann
Institut fur Mikrobiologie und Biotechnologie, Universitat Tubingen, Auf der Morgenstelle 28,
D-72076 Tubingen, Germany
A. Varma and A.C. Kharkwal (eds.), Symbiotic Fungi, Soil Biology 18, 393
DOI: 10.1007/978‐3‐540‐95894‐9_25, # Springer‐Verlag Berlin Heidelberg 2009

growth but, most importantly, for maximum siderophore release into the nutrient
medium. As the nutrient requirements of mycorrhizal fungi vary strongly, it is
not attempted to list here the composition of different nutrient media suitable
for cultivation of mycorrhizal fungi. Instead, standard literature ought to be con-
sulted, and the composition of the nutrient medium modified for maximum side-
rophore production, which can be enhanced by, for example, the addition of specific
presursors for their biosynthesis.
Siderophore production, in general, is stimulated by lowering the external
concentration of ferric iron. Under some circumstances, not only omission of any
iron compound, but also deferration of the nutrient medium may be required. This
can be achieved by adding an excess of ChelexR 100 to the nutrient medium, and
shaking for 15 min followed by filtration in order to remove the ChelexR 100 prior
to the sterilization of the nutrient medium.
25.2 Isolation of Hydroxamate Siderophores
from Fungal Culture Filtrates
When hydroxamate siderophores are expected to occur in the culture filtrate, ferric
chloride or ferrous sulfate can be added to obtain the ferric hydroxamate com-
plexes, the latter under stirring for aeration. The amount of ferric salts added is
critical, and has to be judged from the color formation. However, a surplus of ferric
iron or resulting hydroxides are removed during the following adsorption procedure
on AmberliteR XAD-2 or -16 which adsorbs a variety of lipophilic compounds
and most of the ferric hydroxamates. Alternative methods employ an extraction of
ferric hydroxamate siderophores with organic solvents, using chloroform, ether or
benzylalcohol. Most ferric hydroxamates from aqueous culture filtrates can be
adsorbed to AmberliteR -2 or -16 by using either a batch or a column procedure.
The XAD-column procedure is performed as follows:
Wash the XAD material extensively first with methanol and then with water
before use. Let the culture filtrate slowly percolate through the XAD column.
Loading of the column can be visually followed by an increasing orange-brown
color of the XAD material. To remove residual culture medium and surplus ferric
hydroxides, wash with two volumes of distilled water. The adsorbed ferric hydro-
xamates are then desorbed with one or two volumes of methanol.
Separation and identification of fungal siderophores requires the application of
various analytical methods which are discussed in this chapter in greater detail.
In general, we observe two main groups of peptidic ferrichromes; those having
N-acetyl side chains varying only in the amino acid residues of the hexa- or
heptapeptide ring (Fig. 25.1), and those having a common ferrichrysin peptide
ring but varying in the N-acyl side chains, such as ferrirubin, ferrirhodin or ferri-
chrome A (Fig. 25.2). The ester-containing coprogens and fusarinines represent the
other group of hydroxamate siderophores (Fig. 25.3). The rhizoferrins (Fig. 25.4)
do not belong to the hydroxamates, but are citrate-containing siderophores
394 K. Haselwandter and G. Winkelmann
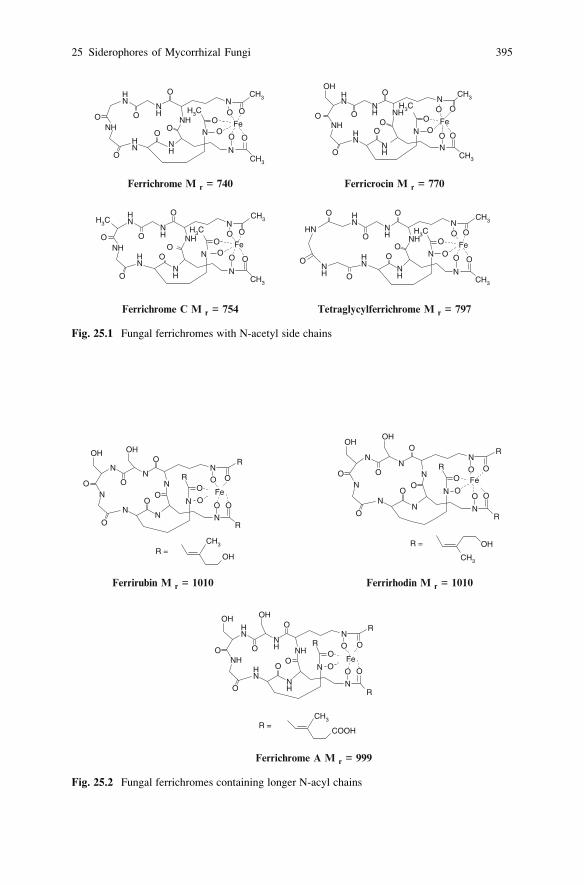
Ferrichrome M r = 740 Ferricrocin M r = 770
H3CO
NH
NH
ONH
ONO O
NH
O
O NH
NCH3
O OO
NH
O
CH3
FeN O O
O
H3C
O
OO
NNH
NH
ONH
ON
NH
O
O NH
NCH3
O
NH
O
CH3
OH
FeO
Ferrichrome C M r = 754 Tetraglycylferrichrome M r = 797
H3CO
NH
NH
ONH
ONO O
NH O
O
NH
NCH3
O O
O
NH
O
CH3
FeN O
HN
O
H3C
O
NH
NH
ONH
ONO O
NH
O
O NH
NCH3
O O
O
NH
O
CH3
FeN O
H3C
Fig. 25.1 Fungal ferrichromes with N-acetyl side chains
Ferrirubin M r = 1010 Ferrirhodin M r = 1010
Ferrichrome A M r = 999
OR
OO
O
OO
NN
N
ON
ON
N
O
O N
NR
O
N
O
OHR
OH
OH
CH3
Fe
R =
OR
OO
O
OO
NN
N
ON
ON
N
O
O N
NR
O
N
O
OHR
OH
Fe
CH3
OHR =
OR
OO
O
OO
NNH
NH
ONH
ON
NH
O
O NH
NR
O
NH
O
OHR
OH
COOH
CH3
Fe
R =
Fig. 25.2 Fungal ferrichromes containing longer N-acyl chains
25 Siderophores of Mycorrhizal Fungi 395
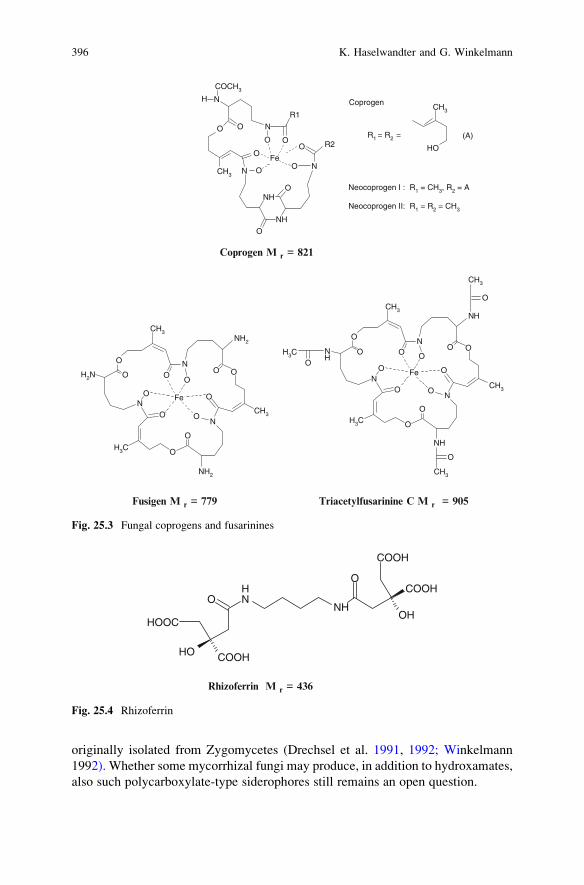
originally isolated from Zygomycetes (Drechsel et al. 1991, 1992; Winkelmann
1992). Whether some mycorrhizal fungi may produce, in addition to hydroxamates,
also such polycarboxylate-type siderophores still remains an open question.
OH
CH3
NH
O O N
O
N
O
N
NH
CH3
O
OO
O
O
O
COCH3
NH
R2
R1
Fe
R1 = R2 =
Coprogen
Neocoprogen I : R1 = CH3, R2 = A
(A)
Neocoprogen II: R1 = R2 = CH3
Coprogen M r = 821
NH2
OO
CH3
N
O
O
NO
CH3
NO
OH3C
O
O
OH2N
O
O
NH2
Fe
O
NH
OO
CH3N
O
O
NO
CH3
NO
OH3C
O
O
ONH
O
O
NH
H3C
CH3
O
O
CH3
Fe
Fusigen M r = 779 Triacetylfusarinine C M r = 905
Fig. 25.3 Fungal coprogens and fusarinines
HO
NH
NHOH
COOH
COOHO
O
COOH
HOOC
Rhizoferrin M r = 436
Fig. 25.4 Rhizoferrin
396 K. Haselwandter and G. Winkelmann
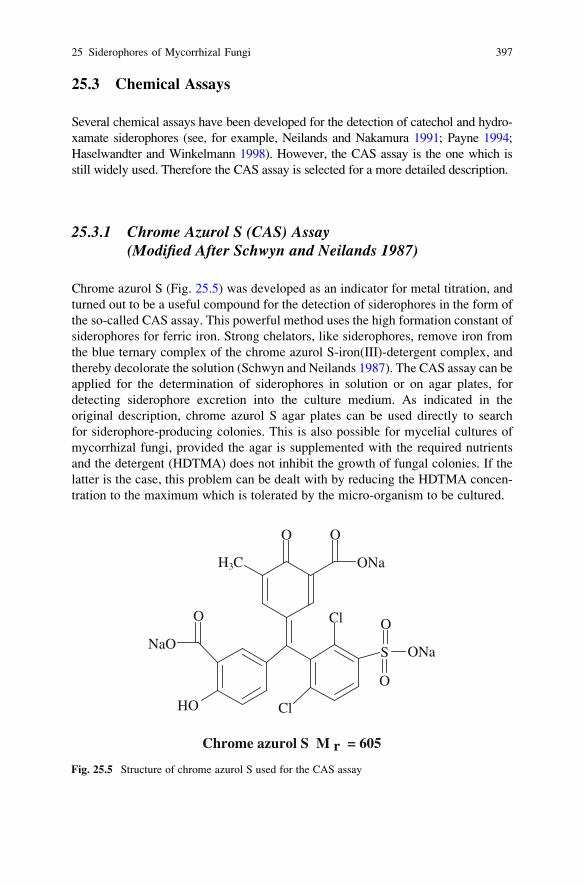
25.3 Chemical Assays
Several chemical assays have been developed for the detection of catechol and hydro-
xamate siderophores (see, for example, Neilands and Nakamura 1991; Payne 1994;
Haselwandter and Winkelmann 1998). However, the CAS assay is the one which is
still widely used. Therefore the CAS assay is selected for a more detailed description.
25.3.1 Chrome Azurol S (CAS) Assay(Modified After Schwyn and Neilands 1987)
Chrome azurol S (Fig. 25.5) was developed as an indicator for metal titration, and
turned out to be a useful compound for the detection of siderophores in the form of
the so-called CAS assay. This powerful method uses the high formation constant of
siderophores for ferric iron. Strong chelators, like siderophores, remove iron from
the blue ternary complex of the chrome azurol S-iron(III)-detergent complex, and
thereby decolorate the solution (Schwyn and Neilands 1987). The CAS assay can be
applied for the determination of siderophores in solution or on agar plates, for
detecting siderophore excretion into the culture medium. As indicated in the
original description, chrome azurol S agar plates can be used directly to search
for siderophore-producing colonies. This is also possible for mycelial cultures of
mycorrhizal fungi, provided the agar is supplemented with the required nutrients
and the detergent (HDTMA) does not inhibit the growth of fungal colonies. If the
latter is the case, this problem can be dealt with by reducing the HDTMA concen-
tration to the maximum which is tolerated by the micro-organism to be cultured.
O O
ONaH3C
Cl
S ONa
O
O
ClHO
O
NaO
Chrome azurol S M r = 605
Fig. 25.5 Structure of chrome azurol S used for the CAS assay
25 Siderophores of Mycorrhizal Fungi 397
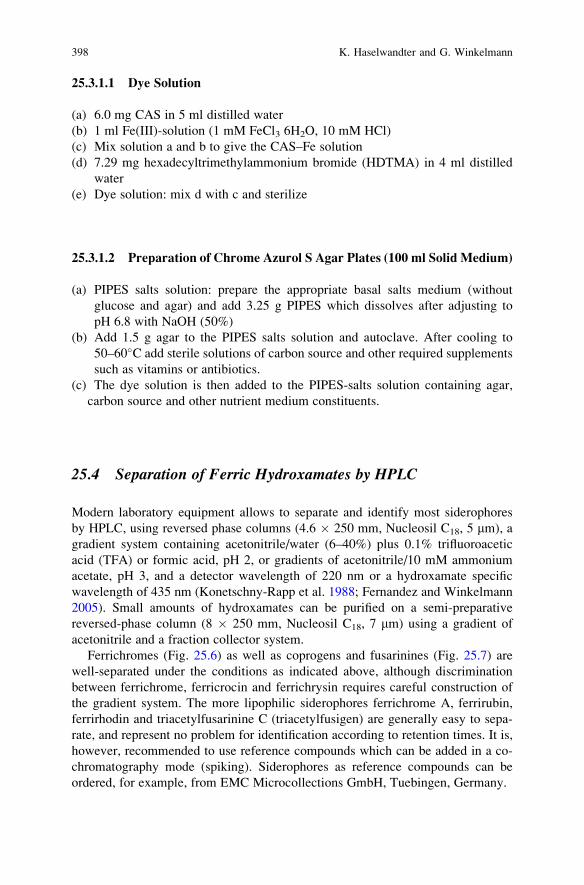
25.3.1.1 Dye Solution
(a) 6.0 mg CAS in 5 ml distilled water
(b) 1 ml Fe(III)-solution (1 mM FeCl3 6H2O, 10 mM HCl)
(c) Mix solution a and b to give the CAS–Fe solution
(d) 7.29 mg hexadecyltrimethylammonium bromide (HDTMA) in 4 ml distilled
water
(e) Dye solution: mix d with c and sterilize
25.3.1.2 Preparation of Chrome Azurol S Agar Plates (100 ml Solid Medium)
(a) PIPES salts solution: prepare the appropriate basal salts medium (without
glucose and agar) and add 3.25 g PIPES which dissolves after adjusting to
pH 6.8 with NaOH (50%)
(b) Add 1.5 g agar to the PIPES salts solution and autoclave. After cooling to
50–60�C add sterile solutions of carbon source and other required supplements
such as vitamins or antibiotics.
(c) The dye solution is then added to the PIPES-salts solution containing agar,
carbon source and other nutrient medium constituents.
25.4 Separation of Ferric Hydroxamates by HPLC
Modern laboratory equipment allows to separate and identify most siderophores
by HPLC, using reversed phase columns (4.6 � 250 mm, Nucleosil C18, 5 mm), a
gradient system containing acetonitrile/water (6–40%) plus 0.1% trifluoroacetic
acid (TFA) or formic acid, pH 2, or gradients of acetonitrile/10 mM ammonium
acetate, pH 3, and a detector wavelength of 220 nm or a hydroxamate specific
wavelength of 435 nm (Konetschny-Rapp et al. 1988; Fernandez and Winkelmann
2005). Small amounts of hydroxamates can be purified on a semi-preparative
reversed-phase column (8 � 250 mm, Nucleosil C18, 7 mm) using a gradient of
acetonitrile and a fraction collector system.
Ferrichromes (Fig. 25.6) as well as coprogens and fusarinines (Fig. 25.7) are
well-separated under the conditions as indicated above, although discrimination
between ferrichrome, ferricrocin and ferrichrysin requires careful construction of
the gradient system. The more lipophilic siderophores ferrichrome A, ferrirubin,
ferrirhodin and triacetylfusarinine C (triacetylfusigen) are generally easy to sepa-
rate, and represent no problem for identification according to retention times. It is,
however, recommended to use reference compounds which can be added in a co-
chromatography mode (spiking). Siderophores as reference compounds can be
ordered, for example, from EMC Microcollections GmbH, Tuebingen, Germany.
398 K. Haselwandter and G. Winkelmann

25.5 Mass Spectrometry
After purification by HPLC, hydroxamate siderophores can be identified by fast
atom bombardment (FAB) mass spectrometry or by ion spray mass spectrometry.
According to the authors’ experience, a Sciex API III triple quadrupole mass
spectrometer with 2,400 Da mass range equipped with an ion spray source
(Sciex, Toronto, Canada), for example, works well for the determination of molec-
ular mass equivalents (MH+, MNa+, MK+). This method was used previously, for
example, by Reissbrodt et al. (1990) and Drechsel et al. (1991). Most useful are
Fourier transform ion cyclotron resonance–electrospray ionization–mass spectra
(FTICR-ESI-MS; e.g., 4.7 T APEX II FTICR Bruker-Daltonics) for the identifica-
tion of novel or yet unknown siderophores.
25.5.1 Gas Chromatography: Mass Spectrometry
The constituents of siderophores are determined after acid hydrolysis and derivati-
zation on basis of GC-MS experiments. This approach is successfully used to
identify the amino acids and organic acids which constitute most of the hydro-
xamate siderophores. It is often required to reduce the N-OH group of N5-OH-
ornithine by using a reductive hydrolysis with HJ.
25.6 NMR Spectroscopy
1H NMR and 13C NMR spectra are finally required to elucidate the chemical
structure of isolated siderophores. Detailed descriptions of spectroscopic
identification of fungal siderophores are given in Jalal and van der Helm (1991).
Fig. 25.6 HPLC chromatogram of ferrichromes
25 Siderophores of Mycorrhizal Fungi 399
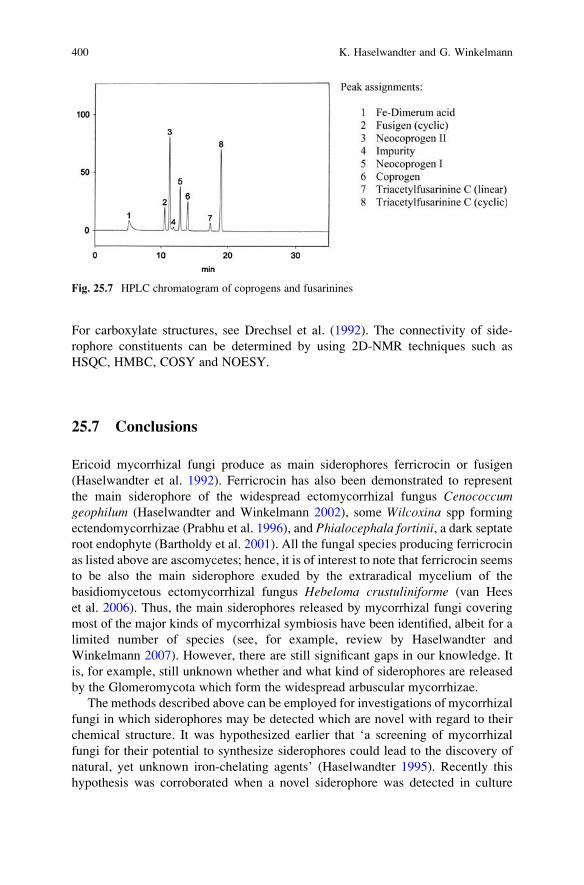
For carboxylate structures, see Drechsel et al. (1992). The connectivity of side-
rophore constituents can be determined by using 2D-NMR techniques such as
HSQC, HMBC, COSY and NOESY.
25.7 Conclusions
Ericoid mycorrhizal fungi produce as main siderophores ferricrocin or fusigen
(Haselwandter et al. 1992). Ferricrocin has also been demonstrated to represent
the main siderophore of the widespread ectomycorrhizal fungus Cenococcumgeophilum (Haselwandter and Winkelmann 2002), some Wilcoxina spp forming
ectendomycorrhizae (Prabhu et al. 1996), and Phialocephala fortinii, a dark septateroot endophyte (Bartholdy et al. 2001). All the fungal species producing ferricrocin
as listed above are ascomycetes; hence, it is of interest to note that ferricrocin seems
to be also the main siderophore exuded by the extraradical mycelium of the
basidiomycetous ectomycorrhizal fungus Hebeloma crustuliniforme (van Hees
et al. 2006). Thus, the main siderophores released by mycorrhizal fungi covering
most of the major kinds of mycorrhizal symbiosis have been identified, albeit for a
limited number of species (see, for example, review by Haselwandter and
Winkelmann 2007). However, there are still significant gaps in our knowledge. It
is, for example, still unknown whether and what kind of siderophores are released
by the Glomeromycota which form the widespread arbuscular mycorrhizae.
The methods described above can be employed for investigations of mycorrhizal
fungi in which siderophores may be detected which are novel with regard to their
chemical structure. It was hypothesized earlier that ‘a screening of mycorrhizal
fungi for their potential to synthesize siderophores could lead to the discovery of
natural, yet unknown iron-chelating agents’ (Haselwandter 1995). Recently this
hypothesis was corroborated when a novel siderophore was detected in culture
Fig. 25.7 HPLC chromatogram of coprogens and fusarinines
400 K. Haselwandter and G. Winkelmann
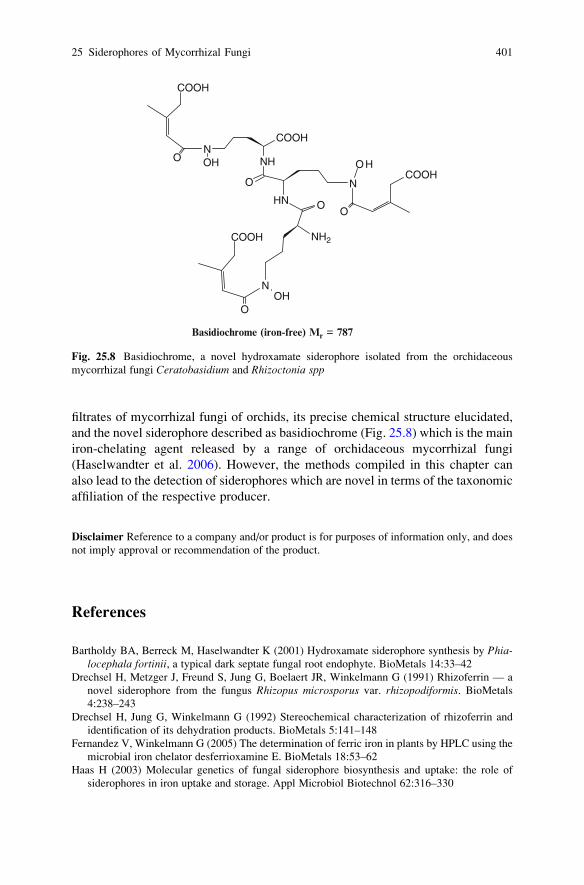
filtrates of mycorrhizal fungi of orchids, its precise chemical structure elucidated,
and the novel siderophore described as basidiochrome (Fig. 25.8) which is the main
iron-chelating agent released by a range of orchidaceous mycorrhizal fungi
(Haselwandter et al. 2006). However, the methods compiled in this chapter can
also lead to the detection of siderophores which are novel in terms of the taxonomic
affiliation of the respective producer.
Disclaimer Reference to a company and/or product is for purposes of information only, and does
not imply approval or recommendation of the product.
References
Bartholdy BA, Berreck M, Haselwandter K (2001) Hydroxamate siderophore synthesis by Phia-locephala fortinii, a typical dark septate fungal root endophyte. BioMetals 14:33–42
Drechsel H, Metzger J, Freund S, Jung G, Boelaert JR, Winkelmann G (1991) Rhizoferrin — a
novel siderophore from the fungus Rhizopus microsporus var. rhizopodiformis. BioMetals
4:238–243
Drechsel H, Jung G, Winkelmann G (1992) Stereochemical characterization of rhizoferrin and
identification of its dehydration products. BioMetals 5:141–148
Fernandez V, Winkelmann G (2005) The determination of ferric iron in plants by HPLC using the
microbial iron chelator desferrioxamine E. BioMetals 18:53–62
Haas H (2003) Molecular genetics of fungal siderophore biosynthesis and uptake: the role of
siderophores in iron uptake and storage. Appl Microbiol Biotechnol 62:316–330
NH2
N
OOH
COOH
OHN
COOH
NH
N
O
O HCOOH
O
NO OH
COOH
Basidiochrome (iron-free) Mr = 787
Fig. 25.8 Basidiochrome, a novel hydroxamate siderophore isolated from the orchidaceous
mycorrhizal fungi Ceratobasidium and Rhizoctonia spp
25 Siderophores of Mycorrhizal Fungi 401
Haselwandter K (2008) Structure and function of siderophores produced by mycorrhizal fungi.
Mineral Mag 72:61–64
Haselwandter K (1995) Mycorrhizal fungi: Siderophore production. Crit Rev Biotechnol 15:
287–291
Haselwandter K, Dobernig B, Beck W, Jung G, Cansier A, Winkelmann G (1992) Isolation and
identification of hydroxamate siderophores of ericoid mycorrhizal fungi. BioMetals 5:51–56
Haselwandter K, Passler V, Reiter S, Schmid DG, Nicholson G, Hentschel P, Albert K,
Winkelmann G (2006) Basidiochrome — a novel siderophore of the orchidaceous myccor-
rhizal fungi Ceratobasidium and Rhizoctonia spp. BioMetals 19:335–343
Haselwandter K, Winkelmann G (1998) Identification and characterization of siderophores of
mycorrhizal fungi. In: Varma A (ed) Mycorrhiza manual. Springer, Heidelberg, pp 243–254
Haselwandter K, Winkelmann G (2002) Ferricrocin — an ectomycorrhizal siderophore of Cen-ococcum geophilum. BioMetals 15:73–77
Haselwandter K, Winkelmann G (2007) Siderophores of symbiotic fungi. In: Chincholkar SB,
Varma A (eds) Microbial siderophores. Soil biology series, vol 12. Springer, Berlin, pp 91–103
Jalal MAF, van der Helm D (1991) Isolation and spectroscopic identification of fungal side-
rophores. In: Winkelmann G (ed). Handbook of microbial iron chelates. CRC, Boca Raton,
pp 235–269
Johnson L (2008) Iron and siderophores in fungal-host interactions. Mycol Res 112:170–183
Konetschny-Rapp S, Huschka H, Winkelmann G, Jung G (1988) High-performance liquid chro-
matography of siderophores from fungi. BioMetals 1:9–17
Neilands JB, Nakamura K (1991) Detection, determination, isolation, characterization and regu-
lation of microbial iron chelates. In: Winkelmann G (ed) Handbook of microbial iron chelates.
CRC Press, Boca Raton, pp 1–14
Payne SM (1994) Detection, isolation, and characterization of siderophores. Methods Enzymol
235:329–344
Prabhu V, Biolchini PF, Boyer GL (1996) Detection and identification of ferricrocin produced by
ectendomycorrhizal fungi in the genus Wilcoxina. BioMetals 9:229–234
Reissbrodt R, Rabsch W, Chapeaurouge A, Jung G, Winkelmann G (1990) Isolation and identifi-
cation of ferrioxamine G and E in Hafnia alvei. BioMetals 3:54–60
Schwyn B, Neilands JB (1987) Universal chemical assay for the detection and determination of
siderophores. Anal Biochem 160:47–56
van Hees PAW, Rosling A, Essen S, Godbold DL, Jones DL, Finlay RD (2006) Oxalate and
ferricrocin exudation by the extrametrical mycelium of an ectomycorrhizal fungus in symbio-
sis with Pinus sylvestris. New Phytol 169:367–378
Winkelmann G (1991) Handbook of microbial iron chelates. CRC Press, Boca Raton, FL
Winkelmann G (1992) Structures and functions of fungal siderophores containing hydroxamate
and complexone type iron binding ligands. Mycol Res 96:529–534
Winkelmann G (2001) Siderophore transport in fungi. In: Winkelmann G (ed.) Microbial Trans-
port Systems. Wiley-VCH, Weinheim, pp 463–479
Winkelmann G (2006) Ecology of siderophores with special reference to the fungi. BioMetals
20:379–392
402 K. Haselwandter and G. Winkelmann
Chapter 26
Biology and Molecular Approaches in Genetic
Improvement of Cultivated Button Mushroom
(Agaricus Bisporus)
E. Mohammadi Goltapeh, Y.R. Danesh, Shwet Kamal, and Ajit Varma
26.1 General Biology
26.1.1 Morphology and Life Cycle
Practically all the cultivated species of mushrooms (including Agaricus bisporus)belong to a subdivision of fungal kingdom designated as Basidiomycota. A. bis-porus is placed in the order Agaricales of Basidiomycota, and are characterized by
carrying sexual spores externally on a structure called basidium (pl. basidia).
The vegetative phase of A. bisporus is mainly underground and made up of
filaments called hyphae, which branch in all directions and constitute the mycelium.
The reproductive phase is above ground and constitutes the fruiting body. Fruiting
bodies may attain varied shapes in mushroom. However, the most common type of
fruiting body, met mainly in Agaricales and to a lesser extent in other groups, is an
umbrella type, consisting of Pileus (pl. pilei) or cap, supported by a stipe (stalk).
The fruiting body of A. bisporus (Fig. 26.1) also consists of a pileus (cap) supportedby a central stipe (stalk). The basidia are borne in a palisade-like layer called the
hymenium on the lower surface of pileus, known as hymenophore. The hymeno-
phore appear in the forms of gills or lamellae, which are radiating plates with
hymenium covering the two faces.
E.M. Goltapeh (*)
Department of Plant Pathology, School of Agriculture, Tarbiat Modaress University, P.O. Box:
14115‐336, Tehran, Irane-mail: [email protected], [email protected]
Y.R. DaneshFaculty of Agriculture, Department of Plant Protection, Urmia University, Urmia, Iran
S. Kamal and A. Varma
Amity Institute of Microbial Technology Amity University Uttar Pradesh Sector 125, NOIDA-
201303 UP, India
A. Varma and A.C. Kharkwal (eds.), Symbiotic Fungi, Soil Biology 18, 403
DOI: 10.1007/978‐3‐540‐95894‐9_26, # Springer‐Verlag Berlin Heidelberg 2009
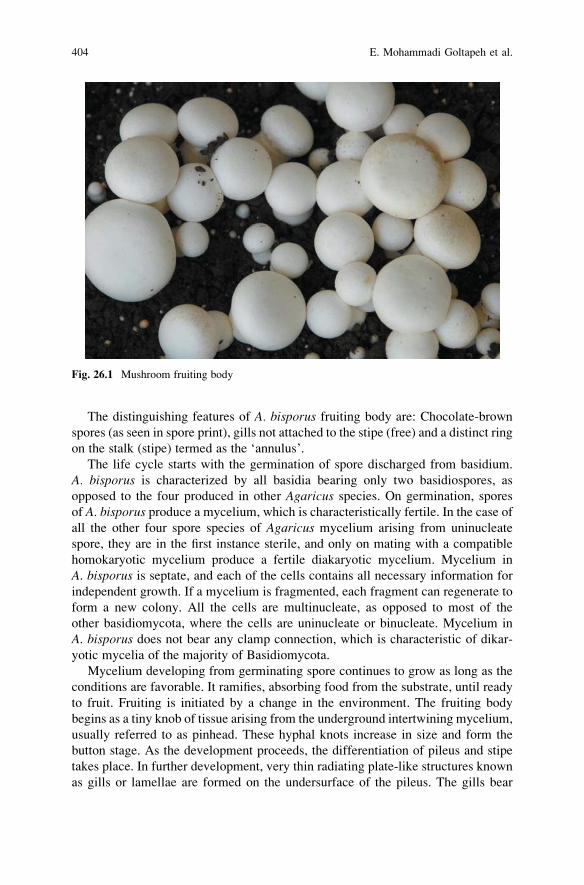
The distinguishing features of A. bisporus fruiting body are: Chocolate-brown
spores (as seen in spore print), gills not attached to the stipe (free) and a distinct ring
on the stalk (stipe) termed as the ‘annulus’.
The life cycle starts with the germination of spore discharged from basidium.
A. bisporus is characterized by all basidia bearing only two basidiospores, as
opposed to the four produced in other Agaricus species. On germination, spores
of A. bisporus produce a mycelium, which is characteristically fertile. In the case of
all the other four spore species of Agaricus mycelium arising from uninucleate
spore, they are in the first instance sterile, and only on mating with a compatible
homokaryotic mycelium produce a fertile diakaryotic mycelium. Mycelium in
A. bisporus is septate, and each of the cells contains all necessary information for
independent growth. If a mycelium is fragmented, each fragment can regenerate to
form a new colony. All the cells are multinucleate, as opposed to most of the
other basidiomycota, where the cells are uninucleate or binucleate. Mycelium in
A. bisporus does not bear any clamp connection, which is characteristic of dikar-
yotic mycelia of the majority of Basidiomycota.
Mycelium developing from germinating spore continues to grow as long as the
conditions are favorable. It ramifies, absorbing food from the substrate, until ready
to fruit. Fruiting is initiated by a change in the environment. The fruiting body
begins as a tiny knob of tissue arising from the underground intertwining mycelium,
usually referred to as pinhead. These hyphal knots increase in size and form the
button stage. As the development proceeds, the differentiation of pileus and stipe
takes place. In further development, very thin radiating plate-like structures known
as gills or lamellae are formed on the undersurface of the pileus. The gills bear
Fig. 26.1 Mushroom fruiting body
404 E. Mohammadi Goltapeh et al.

spores and are covered by a structure called veil. Veil extends from the margin of
the cap to the stalk.
On further development, the veil breaks, exposing the gills and allowing the
spores to deposit on the surface below. The broken portion of the veil forms a ring
on the stalk which is called annulus. A section of the gill (Fig. 26.2) under the
microscope shows that the center of the gills is made up of bundles or of mycelial
threads known as trama. Towards the outside of the trama, the cells form a thin
layer of short cells called the sub-hymenium. The sub-hymenium gives rise to long
club-shaped cells, which are at right angles to the surface of gills and are known as
basidia. Basidia in A. bisporus have two spine-like projections, the sterigmata, on
which basidiospores are borne. Interpersed in the basidia are many sterile cells
known as cystidia. The two together constitute the hymenium.
There is a constant and progressive reduction in the number of nuclei per cell
from the base of the stipe upwards, ultimately reduced to two in the young basidia.
These two nuclei later fuse in the basidium, and the diploid nucleus is formed. The
diploid nucleus undergoes meiosis, giving rise to four haploid nuclei. In A. bisporusthese migrate in pairs to the two basidiospores, in contrast to most other mush-
rooms, where a single nucleus passes on to each of the four basidiospores, and on
discharge starts the cycle again.
26.1.2 Taxonomy and Nomenclature
The genus Agaricus belongs to family Agaricaceae in the order Agaricales of
Basidiomycota. The family Agaricaceae is characterized by having a central
stipe, pileus ordinarily readily separable from the stipe, lamellae free or nearly so
and easily separable, spore deposits in some shades of chocolate color to blackish,
and partial veil present, leaving more or less distinct annulus on the stipe. The genus
Agaricus in addition, to the above family characteristics, possesses fibrillose cuticle
on the pileus, with fibrils more or less radially arranged and at times broken into
squamules (Smith 1978).
Fig. 26.2 Section of gills and hymenium showing the basidium and basidiospores of Agaricusbisporus
26 Biology and Molecular Approaches in Genetic Improvement 405
There is no taxonomic monograph on the genus, and no consensus on the
number of species (Elliott 1985a). Singer (1975) recognized 35 species worldwide.
However, other workers (Elliott 1985a) have put the number of species from 40 to
100. Three groups are generally recognized within the genus; two major groups,
Rubescentes and Flavescentes have been differentiated on the basis of color
reaction of the broken or cut flesh. In Rubescentes, the cut flesh turns more or
less red, and in Flavescentes the cap turns more or less yellow when touched. There
is a third minor group, also containing species with delicate fruiting bodies (Elliott
1985a).
Though there are a number of edible species in the genus, commercially
cultivated species are only two — A. bisporus and A. bitorquis. Both of these
belong to the Rubescentes group. As stated previously, of the two, the major volume
of production is in A. bisporus only; A. bitorquis only came into commercial
cultivation only during the 1970s and has only been cultivated to a minor extent.
The production of A. bisporus, referred to earlier, constitutes about 37% of total
world production of all cultivated species. It has been intensively investigated in all
its aspects, cultivation having started in the West over three centuries back.
The nomenclature of A. bisporus has been changing. The cultivated white buttonmushroom was referred to as Psalliota campestris in earlier books. However,
subsequently it was transferred to genus Agaricus for taxonomic reasons and
appeared as Agaricus campestris, and was so till recent times. Subsequently, the
mushroom in commercial cultivation was found distinct from A. campestris in a
number of characteristics, especially two-spored basidia. Lange (Smith 1978;
Hayes 1978) described the two-spored species as Psalliota hortensis Lange, but
this was renamed A. bisporus (Lange) Singer by the International Botanical Con-
gress at Paris in 1954. In some publications (Smith 1978) it has been referred to as
A. bisporus (Lange) Imbach, based on Imbach’s description, which is current in
American literature. In Europe and most other countries the name A. bisporus(Lange) Singer based on Singer’s description is adopted. A. campestris, the com-
mon field mushroom, is also very popular with mushroom-eaters.
Hayes (1978) has reproduced Singer’s description. The salient points are given below:
A. bisporus (Lange) Sing. Lilloa 22: 431 (1951). Pileus: pure white to strami-
neous, or brown, almost naked to finely and almost to quite appressedly squamulose
(finely scaly), dry, with thick projecting margins, the latter some times fibrillate-
serrate or crenate, convex then convex with flattened center or becoming entirely
flat in old specimens, mostly 35–100 mm wide. Lamellae: whitish, then a beautiful
pink, finally concolorous with spore print, close to crowded, narrow or moderately
broad, free, edge fimbriate.
Spore print: ‘Sepia’, close to ‘mummy brown’.
Stipe: White or whitish, annulated, solid in age becoming hollow, equal or
slightly tapering upwards or with a slight bulb at the base, 30–120 � 10–18 mm.
Basal white rhizomorph often very distinct of variable diameter, veil superior.
406 E. Mohammadi Goltapeh et al.

Context (flesh): white when fresh, becoming red by auto oxidation, pinkish on
exposure.
Odor: at first very pleasant and weak, eventually slightly acidulous or flesh.
Basidia: 20–28 � 6.7–7.7 m, one-, two- or three-spored, almost all or the
majority two-spored. Basidiospores 6.3–8.5 � 5.5–6.8 m, short-ellipsoid, smooth,
without a distinct germ-pore, brown.
Wild races are found on soil rich in nitrogen, spontaneously in hot beds, green
houses, near manure or road sides, among scattered horse manure, in gardens and
parks, etc. Fruiting from May to early November in northern temperate zone.
Natural geographical area probably all over the northern hemisphere, outside the
tropics and the Arctic.
Singer (1961) distinguishes three varieties of the species, namely: (1) var.
bisporus, the type variety with a brown pileus but only rarely cultivated, (2) var.
avellaneus (Lange) Sing. with a pale brown pileus that corresponds to the ‘Brown’
variety in cultivation, and (3) var. albidus (Lange) Sing., with a white pileus in
youth which becomes cream as it matures and corresponds to the cream-colored
varieties of cultivation.
It is commonly accepted, however, that all of the white strains now in cultivation
were originally selected from natural color mutations and by a continuous process
of selection. A wide range of strains are now available with different growth
characteristics.
Some taxonomists are of the opinion that the correct name of the white button
mush room is Agaricus brunnescens Peck on a priority basis. However, in view of
the widespread usage of A. bisporus, the changeover has not been effected (Kapoor1989).
In view of widespread commercial cultivation of the species, efforts have
been made over the years to develop new strains with desirable characteristics.
To augment these efforts, the A. bisporus recovery programme (ARP) (now
named as Agaricus Resource Programme) was founded by Dr. Rick Kerrigan of
Sylvan Research, USA 1988 (Rai and Ahlawat 2002). More than 206 A. bisporusstrains, including the wild ones, are available with ARP. These were collected from
spawn companies and research institutes all over the world, and have been identi-
fied using isozyme marker techniques. They are an excellent source of genetic
variability. As a part of this effort, Callac et al. (1993) reported a tetrasporic variety
from the Sonoran desert of California. These authors described a new variety of
A. bisporus named as A. bisporus var. burnettii. This differs from the earlier variety
designated as var. bisporus, in the sense that most of the basidia of this variety are
tetrasporic, while the var. bisporus had 81% bisporic, 18% trisporic and 1%
tetrasporic basidia; var. burnettii had 85% tetrasporic, 14% trisporic and 1%
bisporic basidia. The tetrasporic variety holds promise for simplifying the process
of homokaryon isolation, particularly for application in a hybrid breeding
programme.
26 Biology and Molecular Approaches in Genetic Improvement 407
26.1.3 Nutritional Requirements
A. bisporus being a heterotrophic organism, like all other saprophytic fungi,
depends for its nutrition and subsequent metabolism on carbon compounds that
have already been produced by green plants. In addition to the carbon compounds
(often sugars), nitrogen compounds (either in organic or inorganic forms), essential
mineral nutrients (calcium, magnesium, potassium, phosphorus, sulfur, copper,
iron, etc.), vitamins (thiamine and biotin), and growth factors are essential for
successful growth of the mushroom. Hence, a thorough knowledge of nutrition is
essential for successful commercial cultivation procedures. Wood and Fermor
(1985) have provided an exhaustive review of the nutritional requirements of
A. bisporus both in pure culture and in commercial growth substrates. The salient
points are presented below.
26.1.3.1 Carbon
Investigations on carbon nutrition in pure culture for both mycelial growth and
fruiting have been carried out and reviewed by a number of workers (Wood and
Fermor 1985). The results obtained have led to the conclusion that in general,
glucose, fructose and xylose are good carbon sources, and other sugars and organic
acids less good. The ability to degrade and utilize various higher molecular weight
carbohydrate polymers, particularly those found in green plants, has also been
investigated. Starch, glycogen, mulin, xylan, cellulose (filter paper) and pectin are
utilized to varying degrees. Utilization and degradation of cellulose and hemicellu-
lose have also been investigated, and found to provide good growth (Hayes 1978;
Wood and Fermor 1985; Mohammadi Goltapeh and Pourjam 2005).
Studies concerning the nutrition of A. bisporus in composted wheat straw have
demonstrated a preference for utilizing the lignin and protein fractions of compost,
but cellulose and hemicellulose fractions could also be utilized (Wood and Fermor
1985). It has also been shown that supplementation of compost with lipid- and
protein-rich materials such as various seed meals, oil or defatted seeds leads to
increased crop production (Hayes 1978; Wood and Fermor 1985; Mohammadi
Goltapeh and Pourjam 2005).
26.1.3.2 Nitrogen
A. bisporus, like all other fungi, requires a nitrogen source. Suitable nitrogen sour-
ces include urea, a range of ammonium salts and many amino acids — asparagine,
alanine and glycine are especially good sources (Hayes 1978). Various types of
protein are efficiently utilized by A. bisporus (Wood and Fermor 1985). The
nitrogen sources available to A. bisporus in the compost are lignin–nitrogen fraction
408 E. Mohammadi Goltapeh et al.
of compost and microbial protein synthesized during the composting process
(Wood and Fermor 1985).
26.1.3.3 Essential Elements
Four macronutrients — magnesium, phosphorus, potassium and sulfur — and five
micronutrients — boron, iron, manganese, molybdenum and zinc — are required
for optimummycelial growth of A. bisporus. However, in A. bisporus, in addition tothe above, calcium is also required and has been shown to fulfill an important
physiological role in the medium (Hayes 1978; Wood and Fermor 1985). Tradi-
tional horse manure compost at spawning and wheat straw can provide for all
mineral nutrients, and in a properly formulated compost, none is likely to act as
a limiting factor.
26.1.3.4 Vitamins and Growth Factors
Biotin and thiamine have been shown to be required for mycelial growth (Hayes
1978). However, microbial flora in the compost produce B-complex vitamins, and
composts (both horse manure and synthetic) would not be vitamin-deficient
(Wood and Fermor 1985). Growth-promoting activity has been shown with the
addition of indole acetic acid, esters of oleic and linoleic acid and amino acids —
phenylalanine, methionine and proline (Hayes 1978).
26.1.3.5 Role of Microbial Biomass
Microbial activity converts the components of straw and manure into mushroom
compost. The total count of these micro-organisms (both living and dead) in com-
posts has been termed microbial biomass. Various workers have suggested a role
for this biomass in the nutrition of A. bisporus. Wood and Fermor (1985) have
reviewed these studies. Biomass could also act as a concentrated source of nitrogen
and minerals.
26.1.4 Environmental Requirements
Environmental parameters have a definite role to play in commercial production of
A. bisporus. At every stage in the production process, starting with composting, the
environment has to be carefully manipulated and controlled. In seasonal or cottage-
scale cultivation, a favorable environment prevailing during the season is exploited
and obtained by manipulation of growing conditions. However, in highly controlled
conditions, a precise environment is simulated for crop-raising, and in some farms
26 Biology and Molecular Approaches in Genetic Improvement 409

computerization has been introduced to automatically maintain and control the
environmental parameters in the cropping room and in bulk chambers.
26.1.4.1 Temperature
An optimum temperature is essential for growth and reproduction of any living
organism, including the mushroom. In most of the cultivated types of mushrooms
(including A. bisporus), the optimum temperature for vegetative growth is different
from that required for fruiting (sexual phase). The optimum temperature for myce-
lial growth in A. bisporus is in the range of 23–25�C (air temperature). Limited
mycelial growth takes place at temperatures �3 and �30�C. However, for fruiting,temperatures are in the range of 15–17�C. At temperatures �20� and �14�C,growth in the developing buttons is slowed.
26.1.4.2 pH
Though vegetative growth is possible over an extended range of 3.5–9.0, optimum
pH is around 6.0. A pH of 6.8–7.2 is considered ideal for fruiting, which is
maintained in compost and casing for commercial cultivation.
26.1.4.3 Light
Light does not play any role in vegetative growth or fruiting of A. bisporus.However, exposure of even smaller periods of light in off-white strains results in
browning of the mushroom (Kapoor 1989).
26.1.4.4 Moisture
Moisture content of the substrate and relative humidity of atmosphere in the crop
room are of prime importance in growth and reproduction of A. bisporus as in otherfungi. Fifty-five to 65 percent of water in the substrate has been found to be
appropriate for initiating fruiting in A. bisporus (Manchere 1980). Flegg found
that the best growth occurred when the water content of the compost ranged
between 55% and 70% (Flegg and Wood 1985).
26.1.4.5 Relative Humidity
Relative humidity of the atmosphere in the crop room plays a vital role during
growth and reproduction of A. bisporus, especially during pinhead formation.
410 E. Mohammadi Goltapeh et al.

RH levels of 85% and 95% have been found to be optimum during initiation and
development of fruiting bodies and cropping, respectively.
26.1.4.6 Aeration
Relative concentration of oxygen and carbon dioxide, and presence or absence of
toxic gases in the atmosphere, affects the growth and fruiting in A. bisporus. Inconsequence, the role of aeration assumes great importance, and is to be carefully
controlled at various stages. Growth in pure culture is not affected at oxygen
concentrations ranging from 21% to �0.6% (Hayes 1978).
The influence of carbon dioxide has been investigated, and mycelial growth is
reduced at about 2% and is totally inhibited at 32%. Initiation of fruiting occurs,
preferentially at a concentration ranging from 0.03% to 0.1%, and 0.5% to 1.0% is
high enough to inhibit the premordia formation (Kaul 1978; Flegg andWood 1985).
26.1.5 Sexuality and Breeding
The nature of sexuality and breeding strategies adopted in edible mushrooms has
been comprehensively dealt with in an earlier publication (Kaul 2002). An attempt
will be made here to present in brief the situation in A. bisporus, with special focus
on the molecular techniques used in genetic improvement of the crop.
The yield and quality of mushrooms produced by commercial growers is mainly
determined by two factors: (1) the genetic make-up of the strain, and (2) the
environmental condition in which the strain is grown. The genotype of the strain
has a big role to play in the quality and quantity of mushrooms obtained, and any
improvement is welcome. The goal of the mushroom breeder is the assembling of
the best combination of genes into one individual stock for production of mush-
rooms of high quality. To achieve this, it is necessary to have a basic understanding
of the sexuality of individual species and possible breeding strategies.
The life cycle, pattern of sexuality and sexual mechanism are three parameters of
sexual behavior in A. bisporus. The life cycle in A. bisporus differs from nuclear
phases of a typical basidiomycota in having a heterokaryotic (dikaryotic phase)
originating directly from germinating spore. The majority of the basidia are bis-
pored, having two compatible nuclei each, which on germination give rise to
heterokaryotic dikaryon directly without plasmogamy (union of homokaryotic
mycelia). In rare cases the basidia are four-spored, where spore gives rise to
homokaryotic mycelia. Dikaryon in A. bisporus is multinucleic, unlike most other
edible mushrooms. As in other basidiomycota, dikaryon is the predominant phase,
leading to the production of fruiting bodies. Subsequently, the transient diploid
phase is initiated by karyogamy (union of nuclei) in basidia. This is immediately
followed by meiosis, resulting in four nuclei in the basidium. These, unlike those in
other edible mushrooms, are transferred to two spores in pairs in A. bisporus.
26 Biology and Molecular Approaches in Genetic Improvement 411

Two basic patterns of sexuality recognized in Basidiomycota are: (1) homothal-
lism, where mycelium from a single germinated spore is self-fertile, and (2)
heterothallism, where a single basidiospore germinates to give rise to monokaryon,
which must fuse to produce a fertile mycelium. However, the pattern in A. bisporushas been designated as secondary homothallic. In this pattern, though single spores
are fertile, each spore has two compatible nuclei. Heterothallism here is concealed
by the two-spored nature of basidia.
Patterns of sexuality are in general controlled by two mechanisms: (1) the
distribution of four post-meiotic nuclei to the basidiospores, and (2) genetic factors
of a mating system known as the incompatibility system, which may be either
unifactorial or bifactorial. In A. bisporus in most cases two spores receive two
nuclei: each of these forms a basidium which is of a different mating type and which
has unifactorial control.
26.1.5.1 Genetic Improvement
The main hurdle in serious scientific work on the cultivated mushroom has been the
mystery about the life-cycle of fungi. Discovery of the aseptic technique and
subsequent understanding of the life cycle opened up the possibilities of improve-
ment in mushroom crops. The first germ-free spawn was made in 1894 at Pasteur
Institute, Paris, and Duggar perfected the method in USA in 1905 (Singer 1961).
Though cultivation of A. bisporus is over three centuries old, still very little has
been achieved in respect of improved strains. Even the appearance of the white
strain in A. bisporus was a result of spontaneous mutation in a population of cream
fruiting bodies. The cultivation technology has been thoroughly investigated, and
taken to the level of computerization on large-scale commercial farms. However,
the breeding programme has not advanced much. This has been mainly because of
incomplete knowledge of the sexuality of this mushroom. This was elucidated only
about two decades back, and Elliott (1985b) has traced the historical development
in the understanding of sexuality in A. bisporus. A. bisporus was classified in the
secondary homothallic group, with an unusually complex breeding system.
A. bisporus lacks two of the diagnostic features of Basidiomycota. Firstly, it has
two-spored basidia rather than four-spored ones on its gills, and secondly its
vegetative mycelium lacks clamp connection. The fertility of single spore (binucle-
ate) isolate is because many spores receive nuclei from basidium which are of
different mating types. Horgen (1992) is of the opinion that there appears to be a
controlled biological mechanism which ensures that the basidiospores contain
nuclei of a compatible mating type. The formation of two binucleate spores on
each basidium is the normal pattern of development in this species, but occasionally
(about 20%) a basidium may bear three or four spores. The latter receive only
a single nucleus and are infertile. Secondary homothallism of A. bisporus where asingle spore is fertile due to having two compatible nuclei has also been substan-
tiated by genetic analysis conducted by Raper et al. (1972).
412 E. Mohammadi Goltapeh et al.

The fertile heterokaryotic mycelium that normally develops from the germinated
basidiospore in A. bisporus is morphologically indistinguishable from the excep-
tionally occurring self-sterile homokaryotic mycelium. The cells of both mycelia
are multikaryotic. The cells also lack clamp connections, which are a feature of
fertile heterokaryotic mycelium in most other species. The creation of a fertile
heterokaryon by crossing two compatible self-sterile homokaryons can therefore be
detected only through the tedious process of a test for fruiting. This fact, together
with the extreme mechanical difficulty of isolating the rare self sterile, cross fertile
homokaryons, has presented serious problems in breeding in A. bisporus. Theavailable systems for strain improvement in A. bisporus are: selection, breeding
and gene transformation (Sodhi et al. 1997). Selection was the only course followed
for obtaining improved strains prior to 1970.
26.1.5.2 Selection
The selection procedure in A. bisporus (as in other edible mushrooms) has been
utilized either in introduction and screening of new cultures from foreign countries,
or in screening the existing commercial strains. The three procedures usually
followed are tissue culture, multispore, or single spore.
Tissue culture taken from the stem or cap of a mushroom has been the oldest
method of raising cultures from the wild type. Tissue culture raised from pheno-
typically healthy looking fruiting bodies for strain improvement has been suggested
by some authors for improvement. However, the method has not been found to be of
much promise in A. bisporus (Yadav et al. 2002).
In the multispore method, a spore print is obtained from a suitable fruiting body and
mass of spores germinated together. Elliott (1985b) states that most commercial strains in
A. bisporus prior to the release of hybrids were obtained by this method. However,
other authors are of the opinion that multispore culturing does not generate signifi-
cant variability in terms of genetic improvement (Mehta and Bhandal 1994).
The single-spore selection method is based on the premise that about 70% of
spores produced in A. bisporus are fertile, and that selection can be practiced among
these fertile spores. It has been widely followed for developing superior cultivars in
A. bisporus. Isolation is a time-consuming process, but the selection of superior
strains out of single-spore isolates is the most acceptable method in A. bisporus(Sodhi et al. 1997). However, other authors maintain that the method has perhaps
a short-term role in strain improvement in A. bisporus, and only limited gains for
genetic improvement are expected (Elliott 1985b; Mehta and Bhandal 1994).
26.1.5.3 Hybridization
Subsequent to elucidation of the sexual cycle by Miller (1971) and Elliott (1972),
efforts have been made to obtain improved stocks of A. bisporus by hybridization. Itinvolves mating (anastomosis) of self-sterile and compatible homokaryotic lines.
26 Biology and Molecular Approaches in Genetic Improvement 413
Commercial successful hybrid spawn was achieved first in the Netherlands when
Fritsche (Elliott 1985b) released such spawn under codes U1 and U3 in 1981. These
hybrids were the result of a breeding programme to combine the desirable qualities
of the off-white and pure white spawn types. The strains are highly productive, with
better size, and have dominated commercial markets ever since. Another hybrid
obtained with this procedure has been from Taiwan (Elliott 1985b). Other hybrids
available are Amycel 208 and NCH-102, from USA and India respectively (Yadav
et al. 2002).
The steps involved in the breeding programme of A. bisporus are as follows:
1. Selection of parent fruit bodies with desired characteristics and collection of
spore print (parents with different characteristics are selected).
2. Single spore isolation. Spore prints obtained are serially diluted and finally
plated. The single spores are located under microscope and transferred to plates
with a suitable medium.
3. Testing of single spore isolates for homokaryotic nature. The majority of single
spores are heterokaryotic, with a small minority being homokaryotic. Tradition-
ally, the criteria of colony morphology (appressed type), slow mycelial growth
and non-fruiting were used for identification of homokaryons. The procedure is
quite cumbersome. However, modern tools of molecular biology — isozyme
(allozyme) analysis, electrophoresis, restriction fragment length polymorphism
(RFLP) and randomly amplified polymorphic DNA (RAPD) — are now avail-
able for homokaryon isolation in A. bisporus. With a combination of isozyme
analysis, RFLPs and RAPDs, the identification of homokaryons is now a routine
process in the A. bisporus breeding programme (Loftus et al. 1995).
4. Selection for homokaryons has also been made easy with the discovery of
tetrasporic variety var. burnettii (mentioned earlier). The majority of basidia
(85%) in the variety having four spores, isolation of homokaryons is easy.
5. Homokaryons thus selected are crossed in various combinations to locate com-
patible single-spore isolation, and in the success of such a cross-hybrid
follows. . .6. Identification of hybrid. The recognition of hybrids again poses a major problem
in A. bisporus, unlike many in other edible mushrooms, as no clamp connections
are formed. Identification was traditionally made by the microscopic observation
that compatible homokaryons show heavier growth in the zone of confrontation.
A fruiting test was necessary for confirmation. However, molecular markers are
now mainly utilized for identification of hybrids.
7. Grow out tests of the hybrids developed in this way, for expression of the desiredcharacteristics of the parents.
26.1.5.4 Molecular Markers
Alozyme (isozyme) markers. The first genetic test for homokaryons and hybrids
which became available to the breeder was isozyme analysis. Isozymes are different
414 E. Mohammadi Goltapeh et al.

forms of the same enzyme, differing in electrophoretic mobility as a result of allelic
differences in a single gene. In isozyme analysis, mycelium is ground up and the
cellular extract is run on electrophoretic gel. With the use of an enzyme-specific
strain, homokaryons can be distinguished from heterokaryons. Staining gives
characteristic banding patterns, and strains with different banding patterns can be
crossed: hybrids are recognized by novel banding patterns (Elliott 1985b). More
than a dozen isozyme markers have so far been identified in A. bisporus (Rai andAhalawat 2002).
Auxotrophic markers. Auxotrophs are strains which have additional nutritional
requirements for growth, and are the result of nutritional changes in individual
genes (Elliott 1985b). These can be used to make hybrids. If a cross is made which
is deficient for amino acid praline and capable of making methionine is mated with
a strain deficient for methionine but capable of making praline, a hybrid will be
produced which is capable of growth on a medium lacking both these amino acids,
and can be easily recognized. Unfortunately, auxotrophs are not easily available
due to the masking effect of multikaryotic nature of A. bisporus cells. Elliott
(1985b) states that this procedure will not have an important role in any hybridiza-
tion programme.
Resistance markers. In this, a strain resistant to a fungicide can be intermated
with another strain resistant to another fungicide, and their hybrid can be identified
by growing the intermated culture on a medium containing both fungicides. Several
fungicide-resistant mutants of A. bisporus have been produced using UV muta-
genesis, and are being evaluated for their insensitivity to fungicides during cropping
(Elliott 1985b).
RFLP markers (restriction fragment length polymorphism). In the mid 1980s,
more powerful DNA-based techniques became available, and RFLP is one of them.
RFLP markers show heritable differences in the length of DNA fragments which
are generated when DNA is digested by a restriction endonuclease. If the DNAs of
different strains are cut with the same restriction enzyme, any natural variation or
polymorphism in the position of the site at which the enzyme cuts will result in
DNA fragments which differ in length. DNA fragments generated by restriction
endonucleases are separated by gel electrophoresis, and made single-stranded by
their transfer onto a nitrocellulose-based membrane for hybridization (Rai and
Ahlawat 2002). These can be visualized using labeled DNA probes (Challen et al.
1991; Clutterbuck 1994). RFLP markers have been used both for identification of
homokaryons and confirmation of their hybrids in A. bisporus (Yadav et al. 2002).
RFLP analysis measures genetic differences at the most fundamental level in an
organism — the DNA. Some of the limitations in the use of these markers are the
high recurring cost and the requirement for a large quantity of pure DNA (5–10 mg).RAPD markers (randomly amplified polymorphic DNA). Another method in
widespread use to-day is RAPD analysis. RAPD is basically based on the amplifi-
cation of random DNA segments by polymerase chain reaction. The polymerase
chain reaction (PCR) is the pioneering technique for in vitro amplification of
nucleic acids. The PCR produces greater than 106-fold amplification of a target
DNA sequence in 1–2 h (Keller and Manak 1993). The requirement for a small
26 Biology and Molecular Approaches in Genetic Improvement 415

quantity of DNA, fast speed and ability to handle multiple numbers of samples at a
time, makes this technique more user-friendly than RFLP. RAPD markers have
been utilized for homokaryon identification and confirmation of hybrids generated
by crossing two compatible homokaryons. However, RAPD analysis is considered
less robust than RFLP analysis — RFLP results being more consistent and repro-
ducible from laboratory to laboratory (Loftus 1995).
RAPD and RFLD DNA marker systems are the means by which DNA finger-
prints are made. DNA fingerprints are also made for patent applications, and being
unique to an individual mushroom strain, they protect the strains from theft by
competing spawn companies.
26.1.5.5 Genetic Engineering
Genetic engineering, also referred to as transformation, is the technology that
permits the transfer of specific genes within and between species in a way that is
both precise and simple. It involves the isolation, cloning, sequencing and insertion
of desirable gene(s) into the genome of a target organism to obtain expression of the
desirable trait. The birth of recombinant DNA technology or genetic engineering
occurred in the 1970s when a group of scientists succeeded in splicing viral and
bacterial DNAs in test tube (Romaine 2002).
The method is based on the ability to cut DNA molecules precisely into specific
pieces, and to recombine those pieces to produce new combinations. The procedure
depends on the existence of restriction enzymes that break DNA at sites where
specific nucleotide sequences occur. Any two fragments produced by the same
restriction enzymes can be joined with one another in this way, using a sealing
enzyme called ligase (Raven et al. 1986). Transfer of genes is affected through
vector, electroporation or ballistic gun system.
Vector transformation is the preferred route, and if it fails then other methods are
used. In the ballistic gun method, small fragments of DNA with desired genes are
coated on a tungsten chip and bombarded onto any tissue of mushroom with very
high speed.
In vector-mediated transformation, plasmids are used. Plasmid is a small frag-
ment of DNA that exists free in the cytoplasm of a bacterium and can be integrated
into and then replicated with a chromosome. These are common in bacteria but rare
in Eukaryotes. Bacterial plasmid (Ti) associated with the crown gall bacterium
Agrobacterium tumefaciens has been found useful in inserting foreign gene into
plants and has subsequently been used in fungi too. Significant advances in the
development of transgenic crop plants have been made. We have ‘golden rice’
where a gene from daffodil has been introduced to make the rice rich in beta
carotene, and Bt cotton where insect-resistant genes have been imported from
Bacillus thuringensis bacterium.
With the discovery in 1995 that A. tumefaciens can also operate in yeast fungi,
ways were opened for its use as a vector in filamentons fungi. Since then, a lot of
416 E. Mohammadi Goltapeh et al.

work on genetic manipulation of A. bisporus and other mushroom species has been
done through this vector. Romaine (2002) has provided a review of these efforts. He
also outlined the steps in the Agrobacterium-mediated gene transfer method. These
are:
1. Gill tissue is taken from mushroom with intact veils.
2. This is cut into 2–5 mm pieces.
3. The tissue pieces are vacuum infiltrated with a suspension of Agrobacteriumcarrying an antibiotic (hygromycin)-resistant gene.
(a) The tissue pieces are placed on a medium amended with hygromycin.
(b) Within several weeks the mushroom cells which received the resistance
gene grow into visible culture.
Though transformation attempts have been successful in many species, e.g., Copri-nus sp. and Schizophyllum commune, no significant success has been achieved in
A. bisporus so far (Sodhi et al. 1997; Rai and Ahlawat 2002 and Mehta and Bhandal
1994). Efforts are, however, ongoing, and a long list of desirable clonable genes
from A. bisporus and possible useful genes from other sources for incorporation in
A. bisporus have been identified (Sodhi et al. 1997). Challen et al. (2000) have
reported preliminary success in transformation of a number of edible mushrooms—
Agrocybe aegerita, A. bisporus, Lentinus edodes, Pleurotus ostreatus and Volvar-iella volvacea. Though Agrobacterium tumefaciens-mediated transformation was
successful in A. bisporus, yet further refinement is needed before transgenic strains
can be developed.
Sodhi et al. (1999) have also constructed genomic libraries for A. bisporus.A genomic library is a set of recombinant clones which represent the complete
DNA present in an individual organism, and its construction is a step toward
mushroom strain improvement.
Loftus et al. (1995) maintained that the potential of genetically engineered
mushroom is immense, and is readily apparent in three main areas: virus resistance,
improved shelf life, and improved compost utilization.
26.1.5.6 Mutation Breeding
Mutagenesis is attempted to create new variability for the selection and hybridiza-
tion programme. A natural mutant was responsible for isolation of the white strain
of A. bisporus from the cream strain in 1927, which is in widespread commercial
culture (Kumar 1997). Though success in obtaining higher penicillin yielding
strains of Penicillium has been achieved by cycles of mutation and selection, no
such success has been achieved in A. bisporus. Mutagenesis may have value in
production of markers for identification of hybrids (Elliott 1985b).
26 Biology and Molecular Approaches in Genetic Improvement 417
26.1.5.7 Protoplasting
Protoplasts are created when the cell wall is digested away from mushroom
mycelium, leaving ‘naked cells’. Protoplasts can be plated out and cell walls
regenerate. If a heterokaryon is protoplasted, a proportion of the mycelial colonies
from the regenerated protoplasts will possess one nucleus, giving rise to homo-
karyons. Protoplasts are thus useful as a tool for isolating homokaryons in
A. bisporus.Protoplasts are also useful in genetic engineering experiments, whereby DNA
can be introduced into the cell without the constraints provided by the cell barrier.
Protoplast technology involves the following sequential steps (Yadav et al. 2002):
1. Isolation of protoplasts using cell wall digestive enzyme.
2. Fusion of protoplasts with polyethylene glycol and CaCl2.
3. Regeneration and evaluation of somatic hybrids.
The fusion of protoplasts can also be achieved using the electrofusion technique.
There has been no significant achievement in the improvement of A. bisporusstrains by this method either.
Amycel Strains
A number of laboratories involved in the production of improved strains are making
use of new technology. Amycel/Spawnmate biotechnological group research
laboratories in Watsonville, CA, USA, has a major programme in strain improve-
ment, and Loftus et al. (1995) have described in detail the technologies in use,
achievements made and emerging technologies of the future. Systematic breeding
of new mushroom cultivars through a combination of molecular breeding techni-
ques, specific traits identified in wild A. bisporus and backcrossing strategy (similar
to that used in plant breeding) is being attempted by Amycel.
Loftus (1995) concludes that future commercial mushroom spawns will be
created through a range of new technologies (which include genetic engineering);
novel strains protected through patents will be available to growers, and the days of
dominance of the off-white hybrid strains are numbered.
26.2 Trouble Shooting
l Morphologically, A. bisporus resembles many poisonous mushrooms such as
Amanita. Hence the identification of wild collections must be done by an expert,
or otherwise the strains should be obtained from an authentic source.
418 E. Mohammadi Goltapeh et al.

l The cultivation of the mushroom is generally been done on composted wheat
straw, so the formulation must be done in such a way that the carbon:nitrogen
ratio is set at 35:1 at the start of the composting process, and the final C:N ratio
must reach 18:1 after the microbial succession. Poor production or disease and
pest infestations are generally the results of an improper C:N ratio at the end of
the composting. Hence if the C:N ratio is higher than 18:1 at the end of the
composting, the substrate should be composted for a few more days until it
reaches 18:1.l The fungal mycelium is very sensitive to ammonia, which is a byproduct of the
composting process. Presence of even small amounts of ammonia may result in
poor mycelial growth and reduced yield of the mushroom. To avoid such
conditions, the presence of ammonia must be checked at the end of the compost-
ing process, either by smelling or by ammonia checking strips, and if even small
traces of ammonia are detected, the compost must be reconditioned to release the
traces of ammonia.l Environmental requirements also affect the production of the mushrooms;
hence, the pH of compost must be adjusted near to 7.0 with the use of gypsum.
The temperature is another environmental consideration for the good yield of the
mushroom; hence, the optimum temperatures for mycelial growth and fruiting
must be maintained properly. The requirements of oxygen of the fungus during
mycelial run and fruit body formation are different. The mushrooms require a
high concentration of CO2 during the mycelial run phase, while during fruiting a
high concentration of oxygen is required to switch over from the vegetative to
the reproductive phase of the fungus. As the mushroom contains 90% water, and
this water is taken from compost/casing at the time of fruiting, hence the
moisture content of the compost beds must be maintained close to 65% by
regular water spray and maintaining relative humidity in the cropping rooms.l Breeding new varieties in A. bisporus is a difficult task, because it is secondarily
homothallic in nature, producing homokaryons as well as heterokaryons. Hence,
before selection of the single-spore isolate for hybrid breeding, it is a must to
ascertain the homokaryotic nature using molecular markers, and also the proba-
ble hybrids must be confirmed by DNA markers as well as fruiting trials.l The hybrids produced in this way are always prone to segregate for traits; hence,
the hybrid strains must be maintained vegetatively to maintain their hybrid
nature, and also the culture medium must be alternated between poor and rich
nutrient levels to maintain the vigor of the strain.
References
Callac P, Billette C, Imbernon M, Kerrigan R (1993) Morphological, genetic and interfertility
analyses reveal a novel tetrasporic variety of Agaricus bisporus from the Sonoran Desert of
California. Mycologia 85:335–351
Challen MP, Rao BG, Elliott TJ (1991) Molecular biology of edible fungi. Mush Sci 14:227–232
26 Biology and Molecular Approaches in Genetic Improvement 419

Challen MP, Gregory KE, Sreenivasaprasad S, Rogers CC, Cutler SB, Diaper DC, Elliott TJ,
Foster GD (2000) Transformation technologies for mushrooms. In: Van Griensven LJLD
(ed) Science and cultivation of edible fungi. Proceedings of the 15th International Congress
on the Science and Cultivation of Edible Fungi, Maastricht. AA Balkema, Rotterdam,
pp 165–172
Clutterbuck AJ (1994) Genetics of fungi. In: Gow NAR, Gadd GM (eds) The growing fungus.
Chapman and Hall, London, p 239
Elliott TJ (1972) Sex and the single spore. Mush Sci 8:1–8
Elliott TJ (1985a) The general biology of the mushroom. In: Flegg PB, Spencer DM, Wood DA
(eds) The biology and technology of the cultivated mushroom. Wiley, New York,
pp 111–128
Elliott TJ (1985b) The genetics and breeding of species of Agaricus. In: Flegg PB, Spencer DM,
Wood DA (eds) The biology and technology of the cultivated mushroom. Wiley, New York,
pp 111–128
Flegg PB, Wood DA (1985) Growth and fruiting. In: Flegg PB, Spencer DM, Wood DA (eds) The
biology and technology of the cultivated mushroom. Wiley, New York, pp 141–177
Hayes WA (1978) Biological nature. In: Chang ST, Hayes WA (eds) The biology and cultivation
of edible mushrooms. Academic, New York, pp 191–197
Horgen PA (1992) The application of biotechnology to the button mushroom- Agaricus bisporus.In: Kinghorn JR, Turner G (eds) Applied Molecular Genetics of Filamentous Fungi. Academic
and Professional, Glasgow, pp 191–200
Kapoor JN (1989) Mushroom cultivation. Indian Council of Agricultural Research, New Delhi,
pp 89
Kaul KN (1978) Prospects of large scale cultivation of paddy straw mushroom in Uttar Pradesh.
Ind Mush Sci 1:305–310
Kaul TN (1987) Casing. Ind Mush Sci 1: 147–164
Kaul TN (2002) Biology and Conservation of Mushrooms. Oxford Publishers Company, New
Delhi, pp 253
Keller GH, Manak MM (1993) DNA probes. Background, applications, procedures. Stockton
Press, New York, p 29
Kumar S (1997) Traditional techniques of breeding in mushrooms. In: Rai RD, Dhar BL, Verma
RN (eds) Advances in mushroom biology and production. Nirmal Vijay Printers, New Delhi,
pp 39–58
Loftus MG (1995) Breeding new strains of mushrooms. Mush News 43:6–14
Loftus MG, Stephen CL, Erik JL (1995) Mushroom molecular breeding. In: Elliott TJ (ed) Science
and cultivation of edible fungi. AA Balkema, Rotterdam, pp 3–9
Manchere G (1980) Conditions essential for controlled fruiting of Macromycetes — a review.
Trans Brit Mycol Soc 75:255–270
Mehta KB, Bhandal MS (1994) Genetic improvement in white button mushroom Agaricusbisporus. In: Nair MC, Gokulapalan C, Das L (eds) Advances in mushroom biotechnology.
Scientific Publishers, Jodhpur, pp 70–77
Miller RE (1971) Evidence of sexuality in the cultivated mushroom Agaricus bisporus. Mycologia
63:630–634
Mohammadi Goltapeh E, Pourjam E (2005) Principles of Mushroom Cultivation. Tarbiat Modares
University Press, Tehran, p 626
Rai RD, Ahlawat OP (2002) Edible fungi: biotechnological approach. In: Applied mycology and
biotechnology. Agriculture and food production, vol 2. Elsevier, Rotterdam, pp 87–121
Raper CA, Raper JR, Miller RE (1972) Genetic analysis of the life-cycle of Agricus bisporus.Mycologia 64:1088–1117
Raven PH, Evert RE, Eichhorn SE (1986) Biology of plants, 4th edn. Worth Publishers, New York,
p 775
Romaine PC (2002) Gene transfer technology for mushrooms: the power and potential for
significant crop improvement. Mush News 50:4–14
420 E. Mohammadi Goltapeh et al.

Singer R (1961) Mushrooms and truffles. Interscience Publishers, New York, pp 272
Singer R (1975) The Agaricales in modern taxonomy, 3rd Ed. Cramer, Vaduz, Weinheim, Koeltz
Scientific Books, FRG
Smith AH (1978) Morphology and classification. In: Chang ST, Hayes WA (eds) The biology and
cultivation of edible mushrooms. Academic, New York, pp 3–34
Sodhi HS, Challen MP, Elliott TJ, Wood DA, Thurston CF (1999) The construction of Agaricusbisporus genomic libraries. Mush Res 8:1–7
Sodhi HS, Elliott TJ, Wood DA (1997) Genetics and genetic manipulation of Agaricus bisporus.In: Rai RD, Dhar BL, Verma RN (eds) Advances in mushroom biology and production. Nirmal
Vijay Printers, New Delhi, pp 514–525
Wood DA, Fermor TR (1985) Nutrition of Agaricus bisporus. In: Flegg PB, Spencer DM, Wood
DA (eds) The biology and technology of the cultivated mushroom.Wiley, New York, pp 43–61
Yadav MC, Verma RN, Upadhyay RC, Singh SK (2002) Breeding of cultivated mushrooms:
traditional methods and modern approaches. In: Verma RN, Vijay B (eds) Recent advances
in the cultivation technology of the edible mushroom. NRC Mushroom, Solan, India
pp 35–56
26 Biology and Molecular Approaches in Genetic Improvement 421
Index
AA. bisporus var. burnettii, 407Acaulospora, 19Actinobacteria, 171
Actinomycetes, 12, 17
Addition of elicitors, 377
Adhatoda vasica, 23Agaricales, 403
Agaricus bisporus, 403Agaricus bitorquis, 406Agaricus campestris, 406Aglaophyton major, 3Agriculture, 141
Agrobacterium rhizogenes, 144Agrobacterium tumefaciens, 416Agrocybe aegerita, 417Aldenic acids, 6
Alkaline phosphatase, 180, 193
Allorhizobium, 5
Alnus, 6Amanita muscaria, 198, 204AMF inoculation, 245
in vitro, 245in vivo, 246
Ammonium hydroxide, 136
Amount of N transferred, 288
Amplification, 170
Anabaena, 16Analysis, 378–379
Anamorphic, 160
Anastomosis, 51, 413
Anastomosis frequency, 52
Annealing, 178
Annotation, 163
Anthoceros, 15Apogeotropic roots, 17
Arabidopsis, 383–391A. thaliana, 382, 383, 392
Arbuscular interface, 194
Arbuscular mycorrhiza (AM), 3, 4, 19,
123, 160, 400
Arbuscular mycorrhizal fungi (AMF), 41,
51, 160, 236, 294, 319, 338, 339
arbuscule, 241
metal-binding capacity, 241
vesicles, 241
Arbuscular mycorrhizal inoculum,
319–334
Arbuscular mycorrhizal networks, 51–62
Arbuscular mycorrhizal–plant (AM–P) in
vitro culture system, 113–116
Arbuscular mycorrhizal symbiosis,
243–271
Arbuscular trunks, 191
Arbuscules, 3, 189
Arbutoid mycorrhizae, 20
Archaeospora, 19Armillariella obscura, 198Ascolichens, 15
Ascomycetes, 400
Ascomycota, 15
Autofluorescence, 123–139
source, 136
Auxin, 381–392
Auxofuran, 203
Auxotrophs, 415
423

Azadirachta indica, 23Azolla, 16Azorhizobium, 5A. caulinodans, 5
Azotobacter, 147
BBacillus, 149, 339Back solution, 67
Bacopa moniera, 23Bacterial community structure, 147
Bacterial inocula, 200
Bacterium-fungus interaction, 199
Bacteroids, 9–11
Bait plants, 44, 45
Ball-milling, 279
Barrier filters, 128
Basidiochrome, 401
Basidiolichens, 15
Basidiomycete, 159
Basidiomycetous, 400
Basidiomycota, 15, 160
Beneficial microflora, 350
Beneficial rhizosphere, 338
Betulaceae, 19
Bioactive secondary metabolites, 203
Bioassay, 381–392
Bioassay conditions, 45
Biocontrol, 143
of P. nicotianae, 146Biofilms, 148
Biogeochemical cycles, 159
Biological control, 141, 339
Biological data sheet (BDA), 321
Biomass conversion, 276
Bioprotectants, 3
Bioprotection, 141
Blassia, 15Bradyrhizobiaceae, 5
Bradyrhizobium, 5Burkholderia, 148
CCalcofluor white M2R ‘‘new’’ (CFW), 136
Calibration, 75–76
Callus cultures, 363
Capsular polysaccharides (CPS), 7
Carbon dioxide, 278
Carbon flux, 282
Casuarina, 6cDNA, 32
Cenococcum geophilum, 40013C-enrichment, 281
Ceratobasidium, 401C-flow, 281
Cfu, 343
Chemotaxy, 142, 144–146
Chitin, 136
Chloroform (CHCl3), 312
Chlorophyll fluorescence, 207
Chlorophytum borivilianum, 23Chrome azurol S, 397
Chrome azurol S (CAS) assay, 397–398
Cistus incanus, 382, 388Clathroid, 163
Clavibacter, 147CMS medium, 201
Cocktail, 66
Co-Culture of L. album with P. indica, 367Colonisation, 320
Commensalisms, 1
Common mychorrhizal networks (CMNS),
286, 290
Compost, 409
Conclusions, 379
Coprogens, 394, 396
Coralloid root, 17
Cortical layers, 160
Crop rotation, 314
Cryo-fixation, 229
Cryopreservation, 169
Cryoprotectants, 169
Cryo-sectioning, 231–232
temperature, 231
C translocation, 278
Cultivation, 214
Culture collections, 169–170
Cyanobacteria, 13, 14, 15
Cytological, 162
DDactylorhiza majalis, 21Dactylorhiza purpurella, 21Damping-off, 352
424 Index

Dark septate root endophyte, 400
Defense pathways, 143
Deferration, 394
Deforestation, 293
Development of elicitors, 376–378
Development of plant cell cultures, 375–376
Diazotroph, 5
Dichotomous, 161
Dichroic mirrors, 128
Dikaryon, 411
Dimethyl sulfoxide, 180
Directed inoculum production process(DIPP), 326, 331, 334
Discomycetes, 170
Disinfected, 163
Distance, 7915N, 287
Dolipore septum, 20
Dual cultures, 203
Dye blobs, 180
EEcological niche, 324
Ecophysiological, 293
Ect-endomycorrhizae, 21, 400
Ectomycorrhiza, 3, 4, 19, 160, 205, 392
Ectomycorrhizal, 381
Ectomycorrhizal fungus, 400
Ectoparasites, 1
Ectosymbionts, 1
Ectosymbiosis, 1
Ectotrophic, 4
Electrochemical potential difference, 67
Electrophoresis, 178
Element distribution, 227
ELF-97, 89
Elicitors, 350
Embedding, 222
Emission spectra, 128–129
Endobacterium, 150
Endocytobiotic, 13
Endocytosis, 9
Endomitosis, 10
Endomycorrhiza, 19, 21
Endophytes, 6, 17, 23, 24
Endophytic bacteria, 211
Endosymbionts, 1
Endosymbiosis, 1
Entrophospora, 19Enumeration of fungi, 165–166
Environmental conditions, 45
Environmental sampling, 34
Enzyme assays, 43
Enzyme digestion method, 90
Enzyme labelled fluorescence (ELF), 89
Enzymic digestion, 190
Epifluorescence microscopy, 127
Ergosterol, 276
Ericoid mycorrhizal fungi, 400
Ethylene oxide (C2H4O), 311
Exciter filters, 128
Exonuclease, 180
Exosymbiosis, 1
Extracellular polysaccharides (EPS),
7, 148
Extraction and estimation of
podophyllotoxin, 379
Extraradical fungal material, 246
Extraradical mycelium (ERM), 51, 101
Exudations, 159
FFagaceae, 19
FAME analysis, 150
Faraday cage, 70
Fatty acid methyl esters, 280
Ferrichromes, 394, 399
Ferricrocin, 400
Fertilizer addition, 47
Fick’s law, 68
Filter cubes, 127
Fixation, 219–220
Flavonoids, 6
Flow cytometry, 137
Fluorescence labels, 180
Formaldehyde, 312
Formaldehyde solution, 191
Fragmentation, 293
Frankia, 1, 12Fruiting bodies, 160
Fungal and plant biomass, 368–369
Fungal culture, 364–367
Fungal identification, 160–162
Fungal linkages, 52
Index 425
Fungal suspension cultures, 204
Fungicides, 312
Fusarinines, 394, 400
Fusarium, 23F. oxysporum, 146
Fusigen, 400
GGamma (g) irradiation, 311Gas chromatography–mass spectrometry,
399
Geosiphon, 19G. pyriforme, 13
Gerdemannia, 19Germinated spores, 46
Germination of seeds, 263, 375
Gigaspora, 19, 148, 282Glassmilk, 178
Glomeromycota, 2, 35, 400
Glomus, 19, 281, 323, 345G. intraradices, 143G. mosseae, 56, 143
%-2 glucans, 7
Grassland, 283
Growing medium, 347
Growth in terms of dry cell weight, 378
HHalf-closed arbuscular mycorrhizal–plant
(HAM–P) in vitro culture system,
111–113
Hanging roots of banyan tree, 214–216
Hartig’s net, 19, 20, 160
Hebeloma crustuliniforme, 400Herbaria, 170
Herbarium, 162–164
Heterobasidion, 202H. abietinum, 208H. annosum, 198, 206
Heterocysts, 12, 15, 16
Heterokaryotic, 164, 320, 334, 411
Histochemical staining, 190
Homokaryotic, 413
Homothallism, 412
HPLC, 398
HPLC-MS, 381–392
Hydathodes, 6
Hydrophobic coating, 73
Hydroxamate siderophores, 394
Hydroxyapatite, 178
Hymenomycetes, 160
Hymenophore, 165, 403
Hyphae in soil, 42, 47
Hyphal compatibility, 55
Hyphal density, 58
Hyphal incompatibility, 62
Hyphosphere, 150
IImaging chambers, 54
Indole-3-acetic acid (IAA), 381–392
Induced systemic resistance (ISR), 348
Infection thread, 8, 9
Infiltration with spurr resin, 221–222
Infra-red gas analyser (IRGA), 278
Initiation of callus cultures, 375, 376
Initiation of suspension cultures, 376
Inoculation
AMF, 342
bacteria, 349
combined, 350
Inoculum, 200, 307
Inoculum production, 321
Inomycetes, 198
In planta visualization, 216–217
In situ RT-PCR, 97
Intraradical hyphae, 189
Introduction, 373–275
In vitro, 101–120, 144In vivo, 134Ion flux, 69
Isoamyl alcohol, 178
Isolation, 189
Isotope ratio mass spectrometry (IRMS),
280
Isotopic tracer, 101
Isozyme, 414
ISP2 agar, 201
LLabelling, 116–120, 278
Laccaria bicolor, 200Lambda-scan, 128
Lectins, 7
426 Index
Leghemoglobin, 11
Lentinus edodes, 417Levamisol, 92
Lichen, 15
Lipopolysaccharides (LPS), 11
Loculomycetes, 170
Lotus japonicus, 192, 382, 386, 391Lyophilization, 169
MMain limitation, 87
Malt agar, 202
Management practices, 45, 47
Mass spectrometry (MS), 244, 381, 399
Maximum parsimony principle, 183
Medicago truncatula, 382Medium, 162
Medium composition, 200
Mesorhizobium, 5
Metabolic activity, 192–193
Methyl bromide (CH3Br), 311
Methylobacterium, 149Microaerobic, 11
Microaerophile, 12
Microbial protein, 409
Microchambers, 53
Microfibrili, 7
Micro-PIXE, 227
calibration, 235
element concentrations, 235
proton beam, 233
proton-dose determination, 234
regions of interest, 234
sample thickness, 235
scanning transmission ion microscopy,
233–234
Si(Li) detector, 234
specimen preparation, 228–232
X-ray counts, 237
X-ray energies, 234
Microplant establishment, 338
Micropropagation, 337
microplants, 337
micropropagules, 337
weaning, 339
Microscope, 90
epi-fluorescent, 90
Microsporocarps, 167
Microsymbiont, 5, 323
Minimum (M) medium, 103
Mitospores, 169
MMN agar, 202
Modified Strullu-Romand, 103
Monokaryotic, 164
Monoxenic, 102
Monoxenic AM cultures, 277
Morphological characteristics, 43
Multikaryotic, 320, 413
Multipartite symbiotic interaction, 160
Mutagenesis, 417
Mutant, 192
Mutualism, 1, 3
Mutualistic, 2
Mycelial viability, 52
Mycelium, 93
extraradical, 93
intraradical, 93
myc–mutants, 314
Mycobiont, 15
Mycorrhiza, 3, 4, 17, 23, 286
Mycorrhiza bioassays, 42, 44, 46, 47
Mycorrhiza helper bacteria, 198
Mycorrhizal, 159, 382
Mycorrhizal colonization, 324
Mycorrhizal dependency, 41, 340
Mycorrhizal function, 41–43
Mycorrhizal fungi, 89, 321, 393
Mycorrhizal networks interconnections, 60
Mycorrhizal root exudates, 146
Mycorrhizosphere, 164–169, 197
Myrsinaceae, 6
N15N, 286, 287, 290
Natural ecosystems, 41, 46
Nematodes, 34815N enrichment, 286, 287, 290
Neoprene caps, 163
Nernst’s equation, 68
Net radial ion flux, 69
Neutral lipid fatty acid (NLFA), 275
Neutral lipids, 276
N in the N-receiver derived from transfer,
288
Index 427
Nitrate net uptake, 83
Nitrogen (N), 285
NLFA 16:15, 279, 28115N natural abundance, 286, 290
NO3� availability, 85
Nonself incompatibility, 56
Nostoc punctiforme, 13Notothylas, 15% Ntransfer, 288
Nuclear magnetic resonance (NMR)
spectroscopy, 399–400
Nuclei, 55
Nucleotides, 180
OOomycete, 142Orchidaceous mycorrhizal fungi, 401
Ozone, 314
PPaenibacillus, 149Palynology, 168
Paraglomus, 19Parasitism, 1
Pasteurization, 310
Pasteur pipette, 167
Pathogens, 143, 340
PBS, 92
PCR-DGGE, 147
PCR target, 178–179
Pectinases, 8
Penicillium, 417Peribacteroid membrane, 10
Petroselinum crispum, 323PEX extraction, 173
Phalloid, 163
Phenetics, 183
Phenolic, 136
Phenylalanine ammonia lyase (PAL)
enzyme assay, 370
Phialocephala fortinii, 400Phosphatase, 89
acid, 89
activity, 90
alkaline, 89
inhibitor, 92
Phospholipid fatty acid (PLFA), 276
Phospholipids, 279
Phosphorus, 101
Photoluminescence, 130
Phycobiont, 15
Phylobacteriaceae, 5
Phylogenetic, 162
Phylogenetic placement, 183–184
Phylogenetic trees, 182
Phylograms, 183
Physical interactions, 148
Phytophthora nicotianae, 142Pinaceae, 19
Pinus pinaster, 83Piriformospora, 383–387, 389P. indica, 21, 23, 24, 160, 364, 365, 385,
386, 389, 391
Plant activators, 352
Plantago lanceolata, 277Plant cell culture, 363, 364
Plant growth-promoting rhizobacteria
(PGPR), 340–342, 345
Plant hormone, 381
Plant-microbe interactions, 3
Pleurotus ostreatus, 417Podophyllotoxin, 369
Polyacrylamide gel, 180
Polyamines, 179
Polyethylene glycol, 178
Polygalactouronases, 8
Polygenomic extractions, 178
Polymerase chain reaction, 162
Polyploid, 8
Potassium net uptake, 83
Predicting mycorrhiza formation, 45
Preparation of combined glutaraldehyde-
formaldehyde fixative, 220
Preparation of elicitors, 376–378
Preservation, 169–170
Primary fluorescence, 130 (AU: Coded as
Primary fluorescence. Vease
autofluorescence in chapter 8)
Primers, 178
Primordium, 9
Proline, 145
Propylene oxide (C3H6O), 312
Protein identification strategies, 250–251
Proteobacteria, 5
428 Index

Proteomics, 244
Protoplasmic continuity, 52
Protoplasting, 418
Protoplasts, 168
Psalliota campestris, 406Psalliota hortensis, 406Pseudomonas, 339
Pseudomonas, 147P. fluorescens, 200
Pulse-labelling, 277
Pyrenomycetes, 170
Pythium, 149
RRandom amplified polymorphic DNA,
415–416
RAPDs, 414
Reagents for culture, 201–202
Recombinant DNA technology, 416
References, 379–380
Restoration, 294, 295
Restriction fragment length polymorphism
(RFLP), 414–416
Reverse complemented, 182
Reversed phase columns, 398
Reverse transcription, 32
Rhicadhesin, 7
Rhizobia, 1, 5–10
Rhizobiaceae, 5
Rhizobium, 3–5, 7R. japonicum, 4R. leguminosarum, 4, 6R. lupinii, 4
Rhizobium–legume complex, 15
Rhizoctonia, 21, 401Rhizoferrins, 394, 396
Rhizopogon roseolus, 83Rhizosphere, 3, 6, 147, 160, 197, 275, 323
Rhizosphere bacteria, 278, 280
Rhizotron, 167
RNA extraction, 32
Root architecture, 382, 392
Root branching, 381, 385, 386, 391
Root exudates, 2, 46, 142
Root exudation, 145
Root handling, 245–246
Root length, 43
Root necrosis, 150
Root-organ cultures (ROC), 105–109
Rubiaceae, 6
SSalicaceae, 19
Sample preparation, 125–127
intraradical fungal structures, 126
root sections, 125
spores, 127
whole roots, 125
Saprophytic soil microorganisms, 164 (AU:
Found as saprobic soil microorganisms in
text, coded as Saprophytic soil
microorganisms. Please confirm which is
correct)
Schizophyllum commune, 417Sclerotization, 169
Scutellospora, 19, 281Seasonal and spatial variations, 46
Secondary fluorescence, 130
Separation of ferric hydroxamates, 398–399
Sequencing, 180–181
Sequencing of DNA, 162
Sesbania rostrata, 5Siderophores, 393
Single nucleotide polymorphisms, 181
Sinorhizobium, 5Small variations, 81
Soil aggregation, 41, 159
Soil dilution, 165–166
Soil disturbance, 313
Soil infectivity, 42
Soil-organic C, 282
Solarization, 308
Spermidine, 179
Spilanthes calva, 23Spore prints, 162
Spores, 149, 160
Sporophores, 160, 164–166
Stable carbon (C) isotope, 275
Stable or radio-isotopic tracer, 117
Stable voltage, 80
Stachydrines, 6
Starter inoculum, 321
Steam sterilization, 310
Sterigmata, 405
Index 429

Streptomyces, 198
Streptomycete cultures, 204
Substomatal chambers, 6
Substratum, 160
Succinate dehydrogenase (SDH), 134, 193
activity, 52
Suppressive soils, 342
Surface sterilization, 213
Suspension cultures, 201, 204, 364
Symbionts, 302
Symbiosis, 1
Symbiosome, 9, 10
Systematics, 162
Systemic, 144
Systemic acquired resistance (SAR), 350
TTaq polymerase, 178
Teleomorphic, 160
Template, 180
Tetramethylene sulfone, 180
Tetrazolium, 134
nitroblue, NBT, 134
Thermocycler, 179
Tillage practice, 47
Time response, 79
Tissue freezing medium, 229
Transcriptomics and proteomics are
working together, 264–269
Transmission electron microscopy,
219–223
Transport, 101–120
Trichoderma, 147Triton X-100, 180
Tropical rain forest, 293
Truffle, 385, 387–392
Trypan blue, 135
Tuber borchii, 385, 388, 392Tuber melanosporum, 385, 388, 392Tween 20, 180
Two-dimensional experimental system, 51
Two-dimensional gel electrophoresis, 244
Two-way or net N transfer, 286, 289, 290
UUltra thin sectioning, 222–223
Undisturbed layer, 78
VVegetative compatibility tests, 56
Vegetative propagation, 337
Viola lutea ssp. westfalica, 235Vital Staining, 216
Volatiles, 207
Volvariella volvacea, 417
WWet–sieving, 167–168
Wilcoxina, 400Withania somnifera, 23
XXad-column, 394
Xanthogenate (PEX), 173
ZZinc violets, 235
Zoospore, 142
Zygomycetes, 396
430 Index