symmetry and roughness in archaeology archaeological evidences from the lower paleolithic for the...
TRANSCRIPT

Symmetry and roughness in archaeology
Archaeological evidences from the Lower Paleolithic for the development of the
human capability to produce symmetric and smooth-edged shapes
David Avnir, Na’ama Goren-Inbar, Avshalom Karasik,
Idit Saragusti, Ilan Sharon, Uzy Smilansky
Financial support: National Foundation for Joint Research Projects between Natural Sciences and Archaeology
The Weizmann Institute of Science
Why symmetry and roughness?
The Lower Paleolithic:
- A very long, nearly stagnant period, highly homogeneous, both chronologically and geographically.
- The changes over time and the variations over space during this period, minor as these may be, are highly significant and informative for studies of past human behaviors and their cognitive abilities.

A handaxe
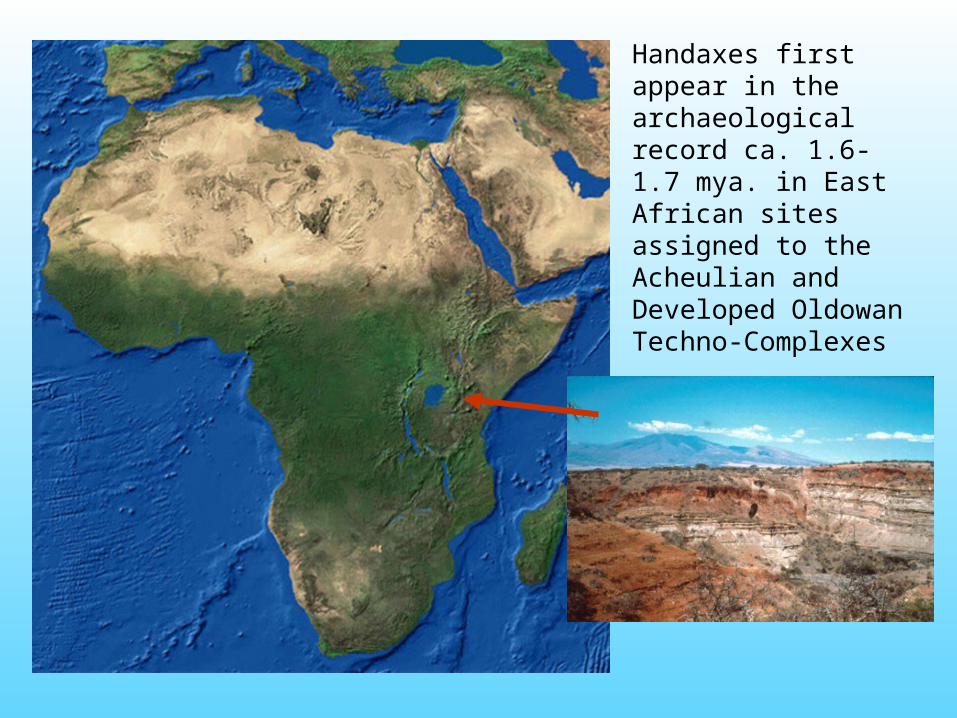
Handaxes first appear in the archaeological record ca. 1.6-1.7 mya. in East African sites assigned to the Acheulian and Developed Oldowan Techno-Complexes


Homo erectus (or Homo ergaster)
Homo heidelbergensis
Archaic Homo sapiens
Handaxes can be found over a vast geographical area.
Handaxes were produced during a very long period of time.
Handaxes were produced by various hominid types.

The working hypotheses
The degree of symmetry of handaxe shapes increased over time
The degree of roughness of handaxe shapes decreased over time
These chronological changes emerged from, and are thus manifestations of,
developments in the technical and cognitive abilities of those who produced the
handaxes

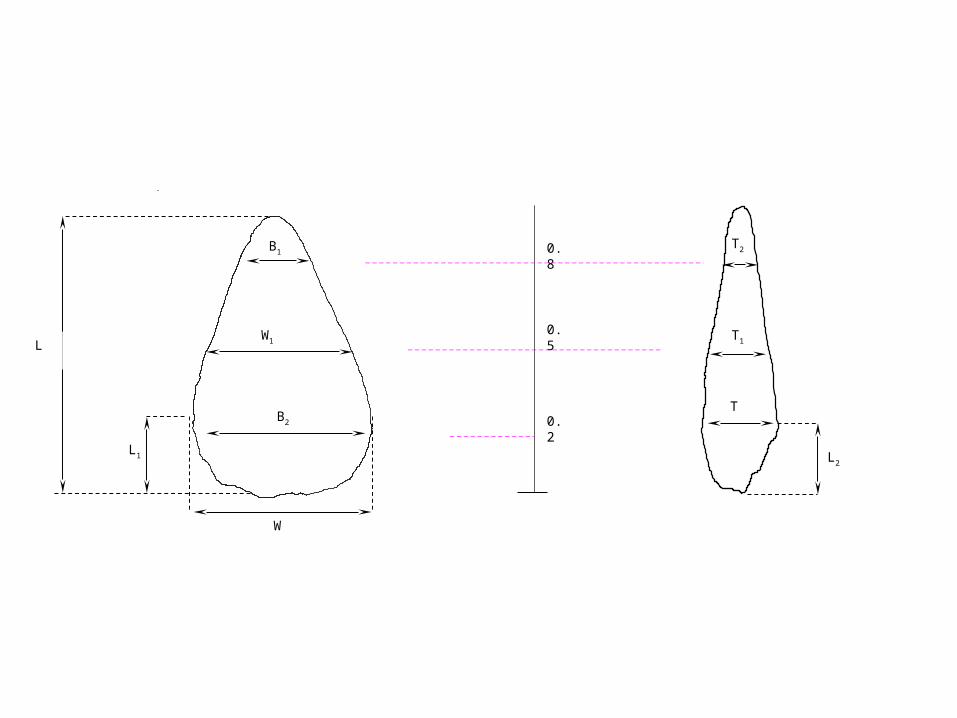
B1
0.8
0.5
0.2
B1
W1
B2
W
L
L1
T
T2
L2
T1

Mirror symmetry/ bilateral symmetry/ reflection symmetry:
A configuration is bilaterally symmetric, if one side of it is the exact reflection of the other
side, with respect to a plane (in three-dimensional configurations) or an axis (in two-
dimensional configurations), which are therefore termed the ‘reflection plane’ or the
‘reflection axis’, respectively.
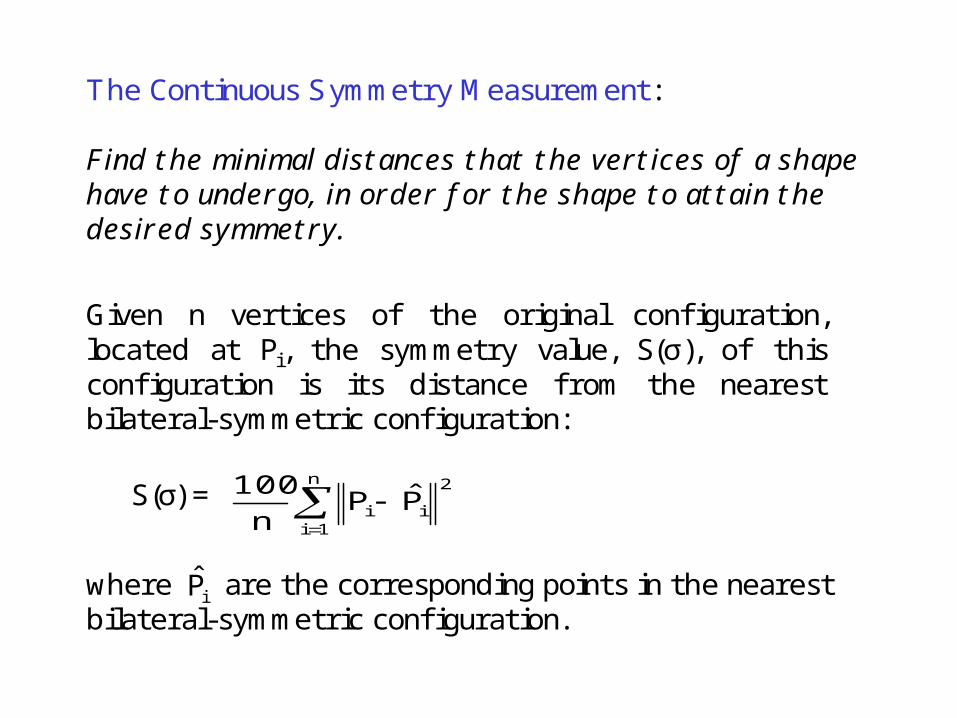
The Continuous Symmetry Measurement:
Find the minimal distances that the vertices of a shape have to undergo, in order f or the shape to attain the desired symmetry.
Given n vertices of the original confi guration, located at Pi, the symmetry value, S(σ), of this confi guration is its distance f rom the nearest bilateral-symmetric confi guration:
S(σ) =
n
1i
2
ii P̂Pn
100
where are the corresponding points in the nearest bilateral-symmetric confi guration.
iP̂
Size normalization
Symmetry transform
2P
0P
1P
0'P
2'P1'P
0̂P
2̂P1̂P
0̂P
0'P
2'P2̂P 1'P
1̂P
(a) (b) (c)
(d)
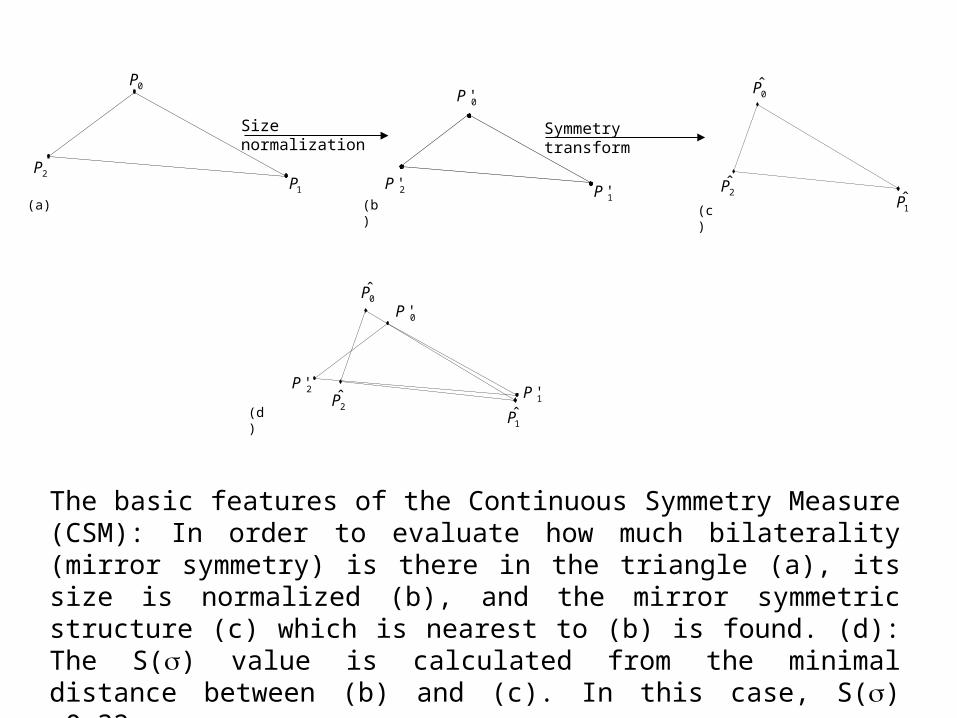
The basic features of the Continuous Symmetry Measure (CSM): In order to evaluate how much bilaterality (mirror symmetry) is there in the triangle (a), its size is normalized (b), and the mirror symmetric structure (c) which is nearest to (b) is found. (d): The S() value is calculated from the minimal distance between (b) and (c). In this case, S() =0.32
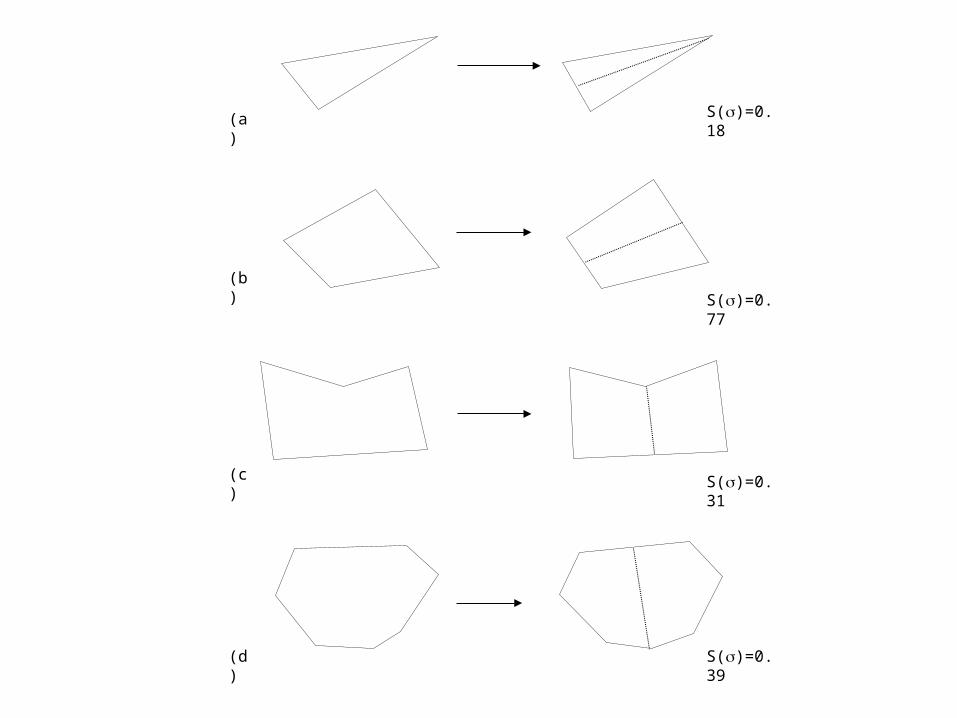
S()=0.39(d)
S()=0.31(c)
(a) S()=0.18
S()=0.77
(b)

X
Y
X
Y
X
Y
X
Y
0
100
60 1600
100
60 160
2P~
1P̂
1P~
1P
2P 2P
2P~
11 PP~
2P̂
1P̂
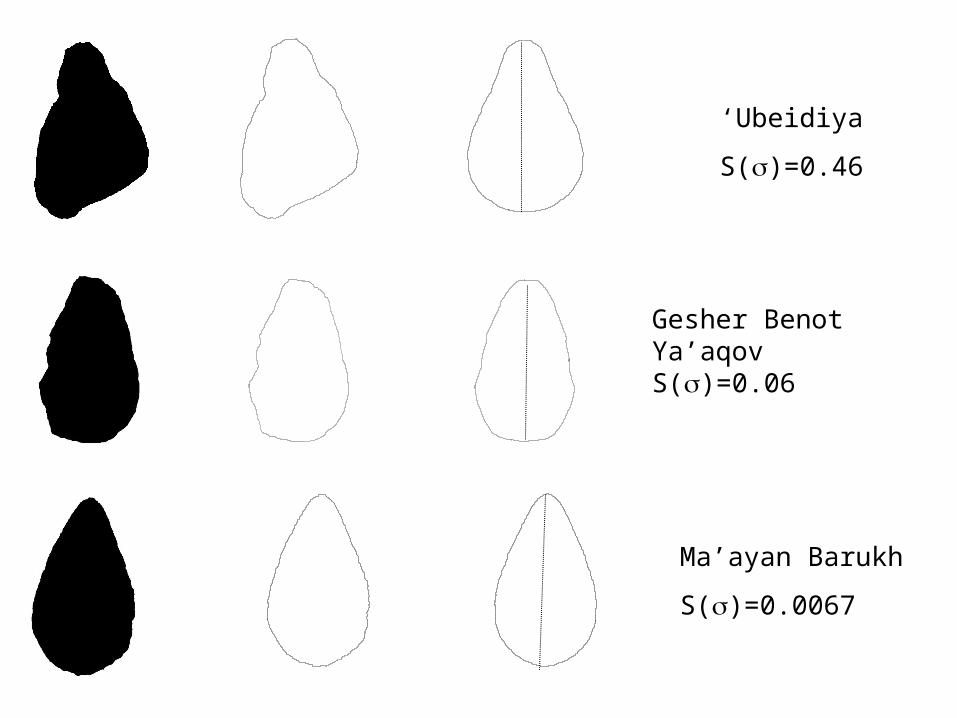
‘Ubeidiya
S()=0.46
Gesher Benot Ya’aqovS()=0.06
Ma’ayan Barukh
S()=0.0067
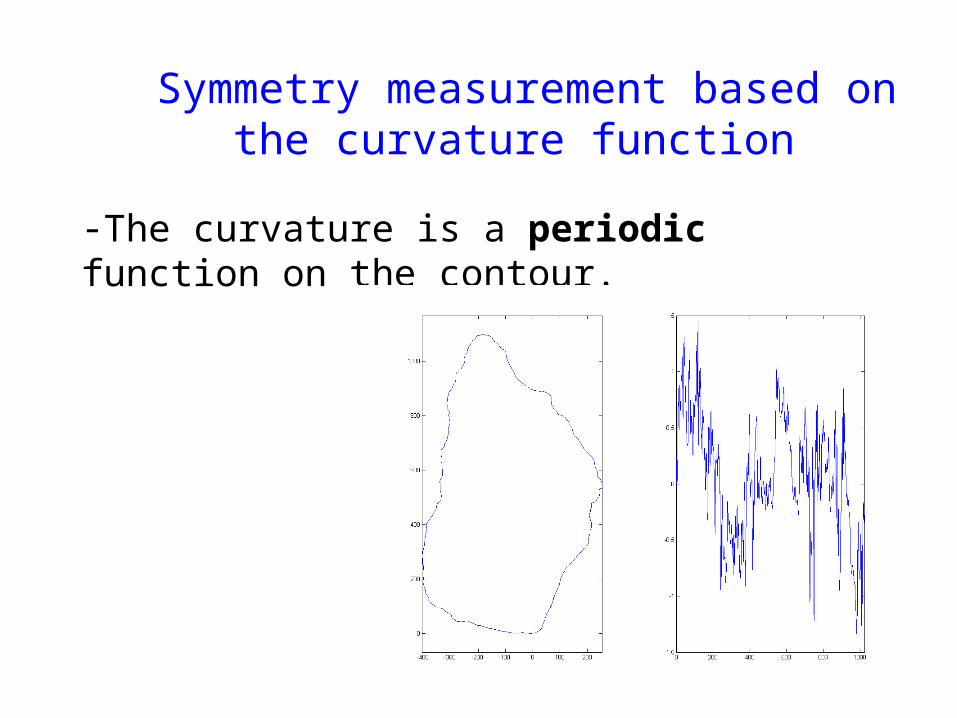
Symmetry measurement based on the curvature function
-The curvature is a periodic function on the contour.

-In order to measure the degree of symmetry of the contour, we seek the point on the contour in which the difference between the curvature function to its right and to its left is the minimal one.
- The symmetry value, S(σ), is calculated as the distance between the rightward and the leftward functions.
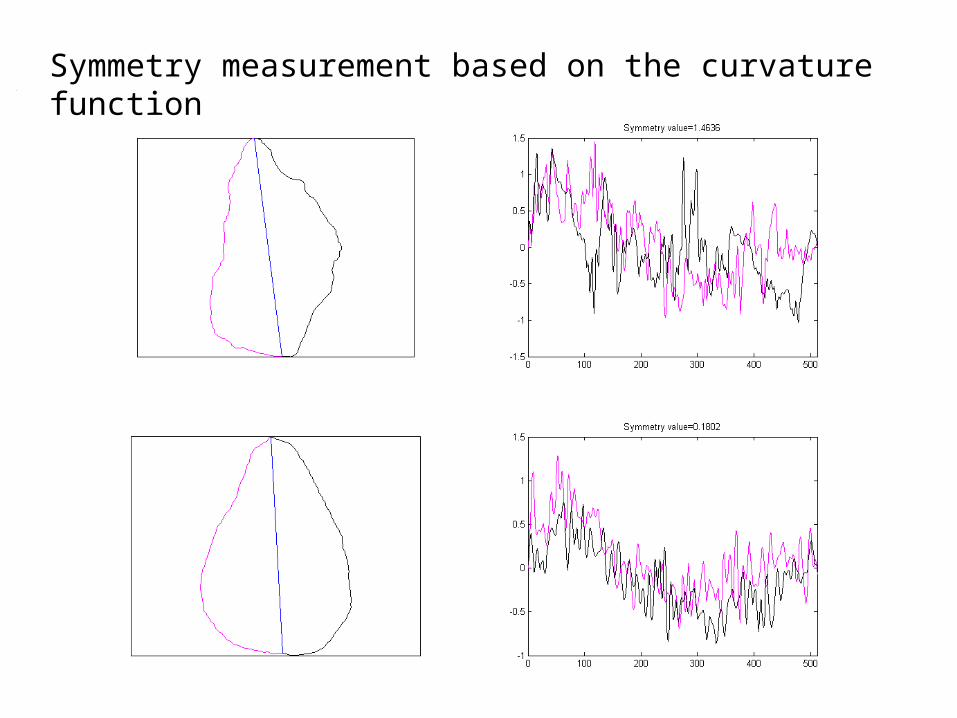
Symmetry measurement based on the curvature function
Roughness measurement
Roughness:
a measure of the variations in corners, edges and faces.
a measure of directional changes in the object’s surface (in three dimensions) or contour (in two dimensions).
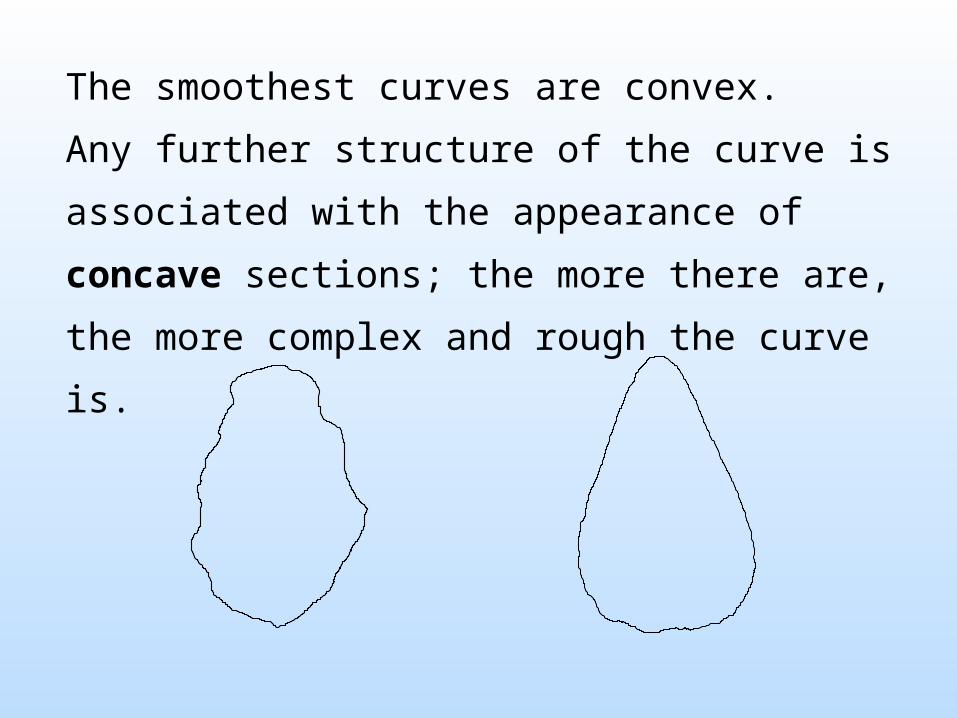
The smoothest curves are convex.
Any further structure of the curve is
associated with the appearance of concave
sections; the more there are, the more
complex and rough the curve is.
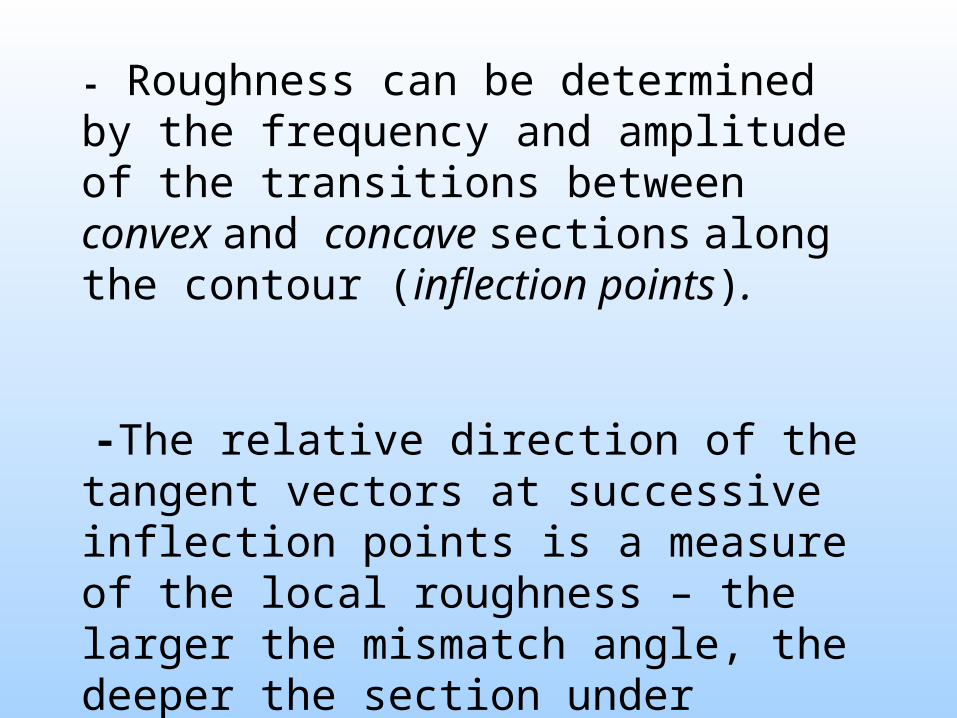
- Roughness can be determined by the frequency and amplitude of the transitions between convex and concave sections along the contour (inflection points).
-The relative direction of the tangent vectors at successive inflection points is a measure of the local roughness – the larger the mismatch angle, the deeper the section under consideration.

S1
S3
S2
Inflection points (S1, S2, S3), in a convex section (S1, S2)
and in a concave section (S2, S3).

The concavity is defined as the sum of mismatch angles over all the concave sections of the contour:
dssksignskconcavity )(1)(2
1
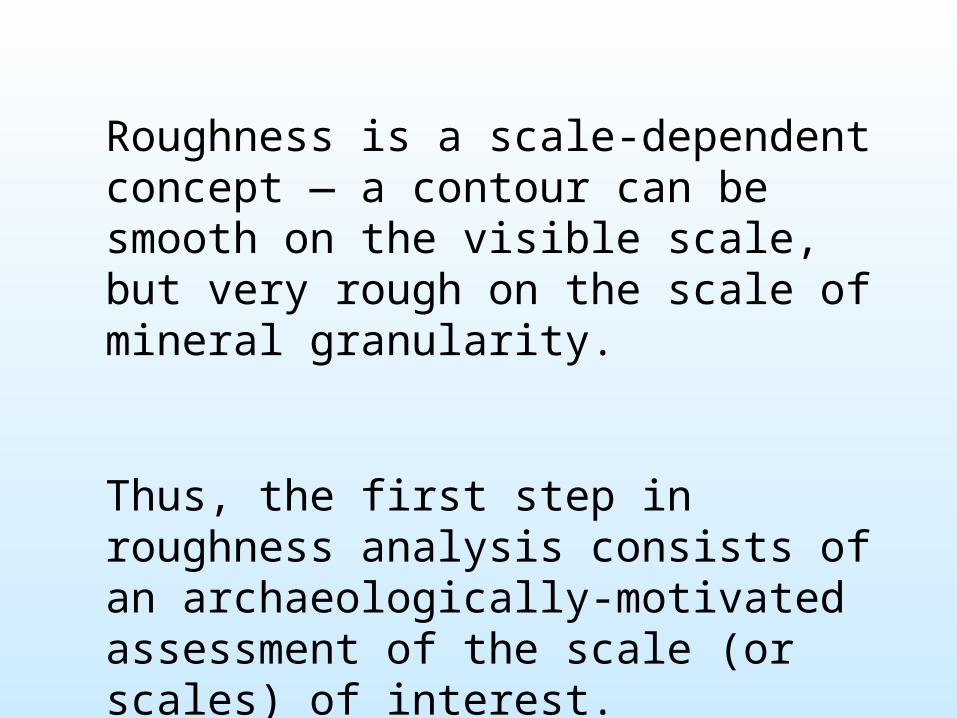
Roughness is a scale-dependent concept — a contour can be smooth on the visible scale, but very rough on the scale of mineral granularity.
Thus, the first step in roughness analysis consists of an archaeologically-motivated assessment of the scale (or scales) of interest.
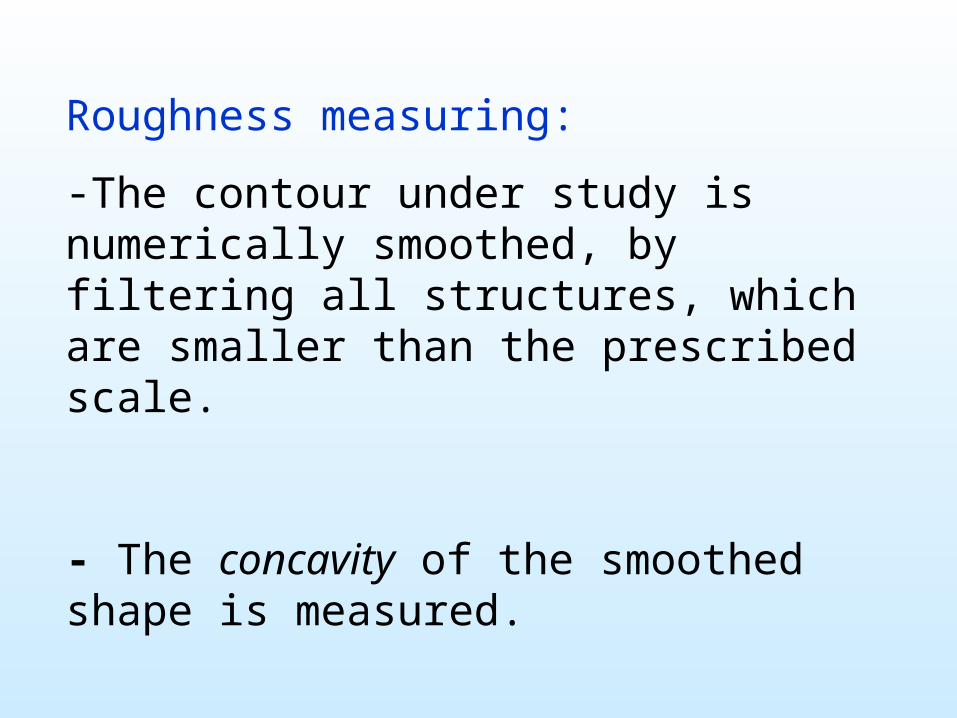
Roughness measuring:
-The contour under study is numerically smoothed, by filtering all structures, which are smaller than the prescribed scale.
- The concavity of the smoothed shape is measured.
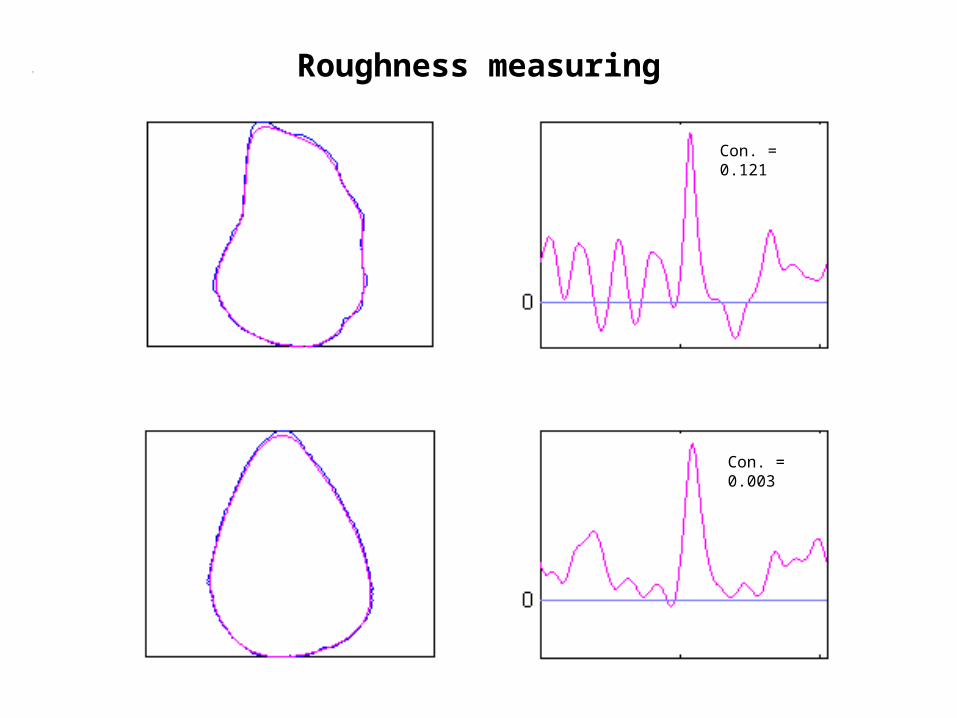
Con. = 0.121
Con. = 0.003
Roughness measuring
Data Acquisition:
All the methods require that the contour to be analyzed be represented by a set of
coordinate points. These sets are achieved by the following process:
1. The objects to be analyzed (handaxes) are laid on a light box, either on one of their faces (for their plan-view contours) or on their side (for the side-view contours).
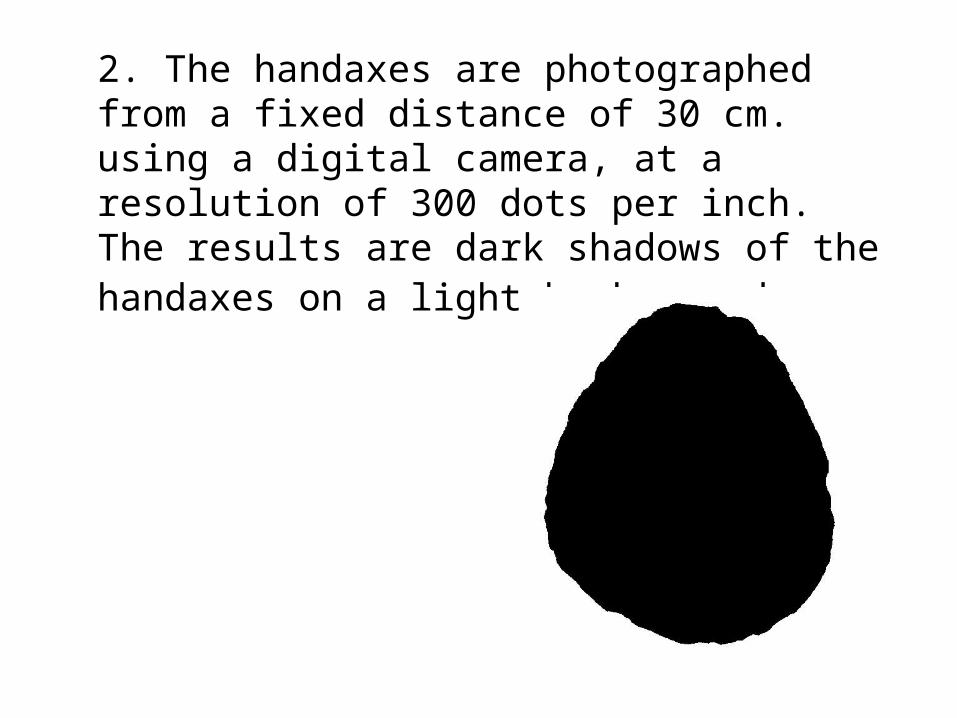
2. The handaxes are photographed from a fixed distance of 30 cm. using a digital camera, at a resolution of 300 dots per inch. The results are dark shadows of the handaxes on a light background.
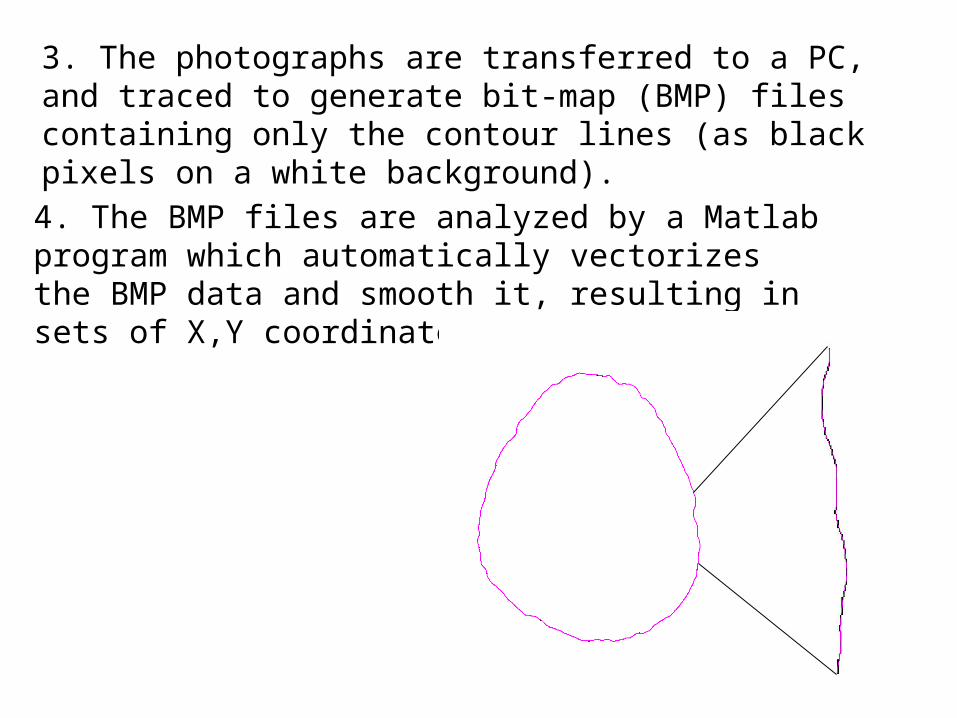
3. The photographs are transferred to a PC, and traced to generate bit-map (BMP) files containing only the contour lines (as black pixels on a white background).4. The BMP files are analyzed by a Matlab program which automatically vectorizes the BMP data and smooth it, resulting in sets of X,Y coordinates.

The studied samples in chronological order, from the earliest to the latest:
‘Ubediya (UB) (n=45) => Gesher Benot Ya’aqov (GBY) (n=96)=> Ma’ayan Barukh (MB) (n=50)=> Tabun bed 90 (T90) (n=45) => Tabun Layer E (Te) (n=79).


%
Degree of symmetry
Frequency distribution of the symmetry values, plan-view contours.
Means and ranges of the symmetry values, plan-view contours.
0
10
20
30
40
50
60
70
80
90
Symmetry value
%
UB
GBY
MB
T90
Te
to 0
.05
0.05
-0.1
0
0.10
-0.1
5
0.50
-0.5
5
0.45
-0.5
0
0.15
-0.2
0
0.35
-0.4
0
0.30
-0.3
5
0.20
-0.2
5
0.25
-0.3
0
0.60
-0.6
5
0.65
-0.7
0
0.71
-0.7
5
0.55
-0.6
0
0.40
-0.4
5
Deg
ree o
f sym
metr
y
0.00
0.10
0.20
0.30
0.40
0.50
0.60
0.70
0.80
Sym
met
ry v
alue
UB GBY MB T90 Te
Time
UB
GBY
MB
T90
Te

One-way analysis of variance for the degree of symmetry of the plan-view contours: F = 18.045; < 0.01% i.e. statistically significant (at the 0.05 level) differences between the five studied samples.
Results of pair-wise multiple comparisons test between the five samples (Tamhane’s T2 post-hoc test). Mean differences (column minus row).
* The mean difference is significant at the 0.05 level.
GBY MB T90 Te
- -0.107*
- 0.006 0.019
-
UB
UB -0.090* -0.084* -0.071*
GBY 0.090* -0.017*
MB 0.107* 0.017* 0.023* 0.036*
T90 0.084* -0.006 -0.023* - 0.013
Te 0.071* -0.019 -0.036* -0.013 -
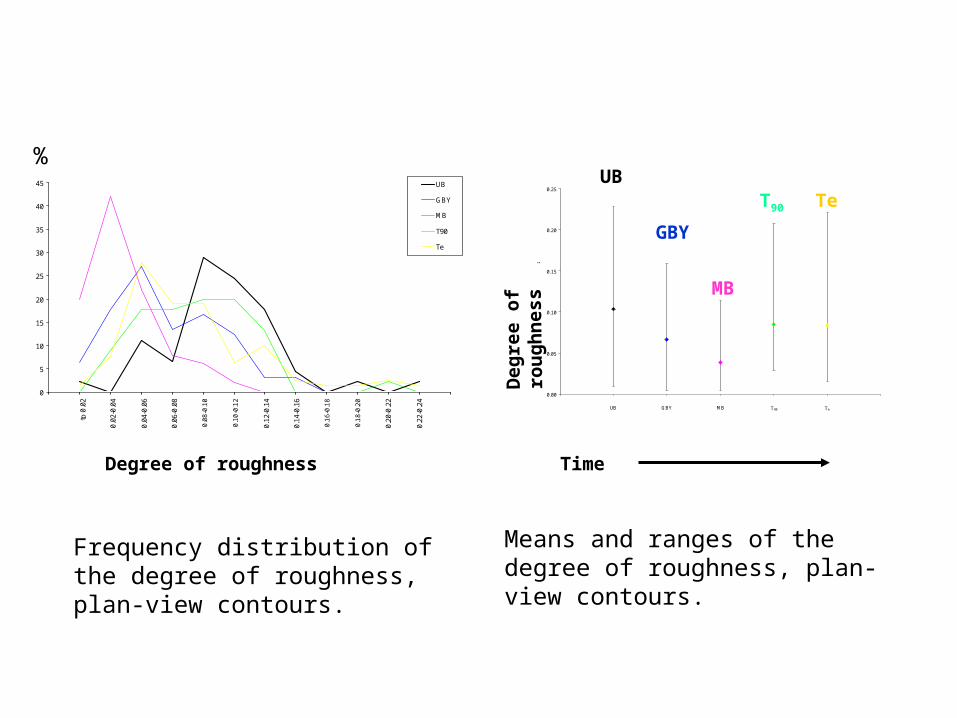
Frequency distribution of the degree of roughness, plan-view contours.
Means and ranges of the degree of roughness, plan-view contours.
0
5
10
15
20
25
30
35
40
45
Degree of roughness
% UB
GBY
MB
T90
Te
to 0
.02
0.02
-0.0
4
0.04
-0.0
6
0.22
-0.2
4
0.20
-0.2
2
0.06
-0.0
8
0.14
-0.1
6
0.12
-0.1
4
0.0
8-0
.10
0.1
0-0
.12
0.1
8-0
.20
0.1
6-0
.18
%
Degree of roughness
0.00
0.05
0.10
0.15
0.20
0.25
De
gre
e o
f ro
ug
hn
es
s
UB GBY MB T90 Te
Deg
ree o
f ro
ug
hn
ess
Time
UB
GBY
MB
T90 Te
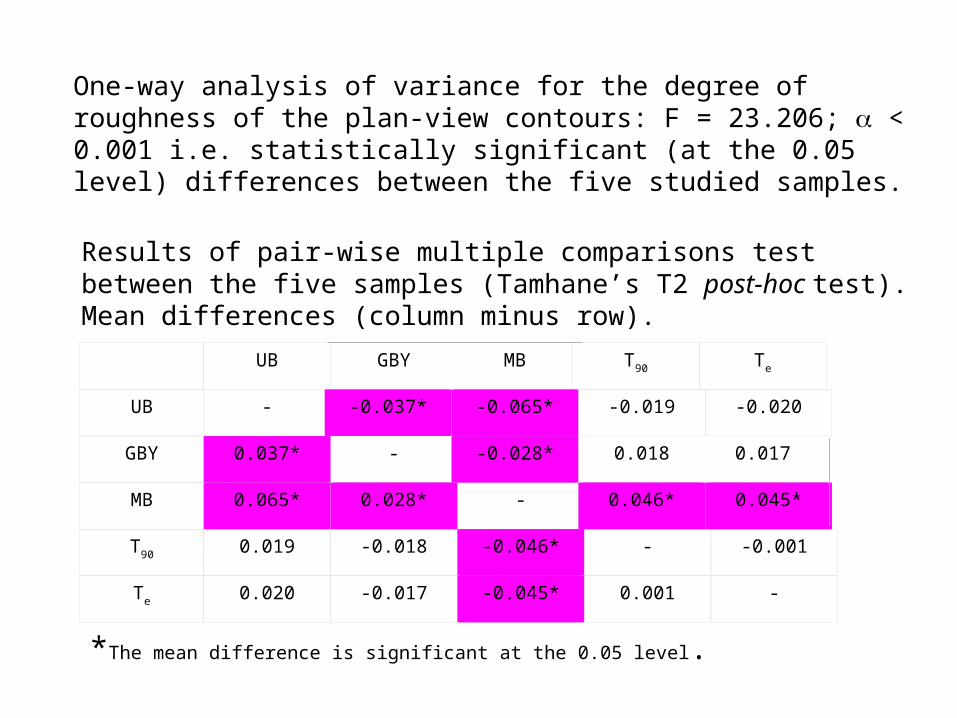
One-way analysis of variance for the degree of roughness of the plan-view contours: F = 23.206; < 0.001 i.e. statistically significant (at the 0.05 level) differences between the five studied samples.
Results of pair-wise multiple comparisons test between the five samples (Tamhane’s T2 post-hoc test). Mean differences (column minus row).
*The mean difference is significant at the 0.05 level.
GBY MB
-
- 0.018 0.017
-
UB T90 Te
UB -0.037* -0.065* -0.019 -0.020
GBY 0.037* -0.028*
MB 0.065* 0.028* 0.046* 0.045*
T90 0.019 -0.018 -0.046* - -0.001
Te 0.020 -0.017 -0.045* 0.001 -
- The symmetry and roughness values generally tend to decrease over time, i.e. handaxes generally become more symmetric and less rough.
- These trends are seen only among the UB, GBY and MB samples, while the two Tabun samples, exhibiting higher values than could be expected, considering their assumed ages, deviate from these general trends.
- The spread of the values generally decreases over time. Here again, the two Tabun samples deviate from this general trend.
Why is it interesting at all?
- What factors can account for these phenomena?
-What changed through this period of time, that might explain the observed trends?
-How can those cases that deviate from these trends be explained?
- Why increasing symmetry and decreasing roughness?
What is the evolutionary meaning of these changes?
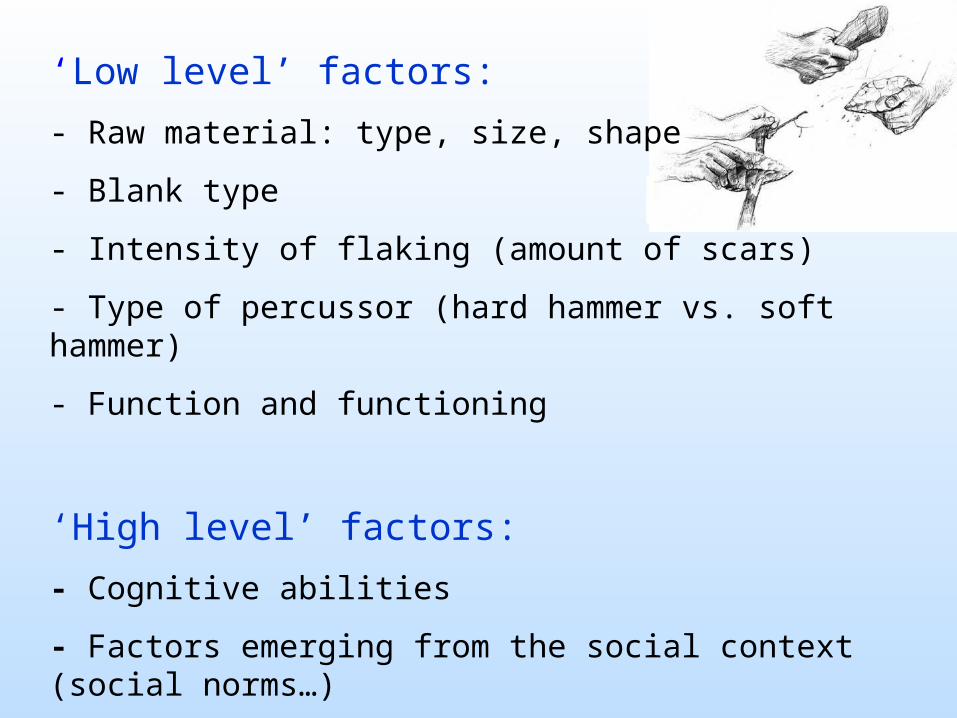
‘Low level’ factors:
- Raw material: type, size, shape
- Blank type
- Intensity of flaking (amount of scars)
- Type of percussor (hard hammer vs. soft hammer)
- Function and functioning
‘High level’ factors:
- Cognitive abilities
- Factors emerging from the social context (social norms…)

Pearson’s correlation coefficient
Sig.(2-tailed)
UB (N=43) -0.008 0.958
GBY (N=94) Quantity of retouch 0.060 0.566
MB (N=50) to -0.217 0.130
T90 (N=45) Symmetry plan-view -0.020 0.897
Te (N=79) 0.077 0.497
Site Tested variables
Entire sample (N=311) -0.027 0.636

Conclusions:
- None of the tested ‘low level’ factors can be clearly pinpointed as a necessary or sufficient condition for producing highly symmetric and smoothed-edges handaxes.
- None of these variables can be used to explain the observed variability in the degrees of symmetry and roughness.
- Although some of the tested variables must have imposed some constraints on the shapes of the handaxes, in most cases the producers of these artifacts could potentially overcome these constraints or avoid them altogether. Occasionally, this might have required additional investment of time and energy.

- Had highly symmetric and smoothed-edges handaxes been equally desired, and the cognitive and technical abilities of imposing these properties been the same, the ‘low-level’ factors did not present any severe, unavoidable restrictions.
Therefore-
The final shapes of the studied handaxes represent, above all, their producers’
priorities and mental abilities.

Artifacts have long been considered as a highly valuable source of information for studying the evolution, and thus the construction, of the modern mind.

-The ability to perceive bilateral symmetry is not uniquely human (mate selection…).
- Some animals are known to construct complex and symmetric patterns, like the honeycomb. These, however, do not require an idea, or a concept of symmetry, because they are considered a direct consequence of rules followed in a rote fashion or of a motor pattern.

Non-human primates do not produce symmetry (in nature) and are probably incapable of doing so, as evidenced by studies of ape art in captivity.The ability to consciously produce symmetry is uniquely human.
When did this ability evolved, and what kind of abilities are required to consciously produce symmetric shape?
- No clear evidence for the ability to impose symmetry from the earliest industries, between ca. 2.5 mya, and ca. 1.5 mya.
- From ca. 1.5 mya. onwards, the archaeological evidence indicates that this ability increased.
Looking from the ‘minimum necessary competence’ perspective, i.e. the minimal cognitive abilities required for the production of specific artifacts, the current data certainly indicates that the abilities for producing symmetric and smooth shapes increased throughout the Lower Paleolithic.

Possible explanation – the main development is in the ability of fine motor-control.
- By the time of the earliest Oldowan Techno-Complex, hominids already had a high ability of fine motor control as indicated by the finely retouched flake tools.
- This implies that no constraints were imposed by this ability on the production of Oldowan artifacts, i.e., early artifacts are often crude because of (other) cognitive limitations, and any subsequent developments in stone-tool production were mainly the result of cognitive developments.

What kind of cognitive abilities are required to produce highly symmetric artifacts, and what can we infer from these abilities about the evolution of the human mind in general?

Early handaxes (‘Ubeidiya)
– ‘global’ and two-dimensional symmetry: “…one lateral edge has been trimmed to copy the other. But the inverted copy is not a precise duplicate. It reproduces the qualitative characteristics of the shape, but it is not a quantitative duplicate” (Wynn, 2000).
The spatial perception-cognition abilities required to produce such symmetry:
the ability to reverse a configuration around a midline. Reversal of order is a topological notion — topologically, ABC and CBA are the same order, only reversed, i.e. ABC/CBA is symmetry.

Late handaxes (Ma’ayan Barukh):
- Congruent symmetry - the mirrored sides are quantitative duplicates of each other
- Three-dimensional symmetry: some of the handaxes have a virtual infinity of symmetric cross-sections (longitudinal and transversal).
The spatial perception-cognition abilities required to produce such symmetries:
-Visual projection, i.e. the understanding and coordination of multiple points of view.
-Mental rotation“During trimming, the modification of the surface to regularize the
shape of the cross section from one point of view could not be allowed to ruin other cross sections, most of which could not be directly observed. These unobservable cross sections must have been purely mental constructs” (Wynn, 1989) .
-The concept of “Euclidean” space, i.e. a notion of spatial quantity.

Can we say something more general about the level of intelligent of the handaxes
producers?
Two schools of mind theories:
The ‘holistic’ school:
- The mind is a holistic structure, which constitutes, or consists of a general-purpose intelligence.
- Although this intelligence is applied in many different ways to various behaviors, there is an underlying consistency across the various behaviors.
- This general intelligence may be built, according to some models, hierarchically, from several superimposed ‘layers’, each of which is achieved at a different developmental stage.
- Each of these ’layers’ is composed of an entire series of associated cognitive abilities, which are assumed to coalesce together once that cognitive stage is achieved

The 'modular' school:
- The mind is constructed in a modular manner, from several distinct, domain-specific modules, faculties or ‘intelligences’.
- Each of these modules is dedicated to a specific kind of mental task.
Generally, the more specialized a claimed module or intelligence is, the narrower the range of behaviors that it will be manifested in, hence reducing the chances of inferring it from the archaeological record, unless it is directly related to tool behavior.
And vice versa – the more generalized an intelligence is claimed to be the wider the range of behaviors it will be manifested in, some of which may leave identifiable traces in the record.
Therefore -
cognitive inferences drawn on artifacts
are heavily dependent upon the
specific mind theory adopted in such
studies
?

What can we conclude from the results?
-The data presented in the current study suggests a gradual development of the ability to produce symmetric shapes (and not a ‘punctuated-equilibrium’ process).
- Whatever cognitive abilities are inferred from the archaeological data, these have probably evolved gradually throughout a very long period of time.

The timing of such cognitive developments is a crucial question, mainly due to its possible implications as for the identity of the relevant hominid species participating in such a process:
- Late development - archaic Homo sapiens and/or Homo heidelbergensis .
- Early development (at least ca. 750,000 years ago, the age of GBY) - Homo erectus (or Homo ergaster) as the probable candidate.
- In any case, it implies that these abilities were shared among all the species to have diverged from whoever the candidate is to have possessed such cognitive abilities.
The ‘handicap principle’
The evolutionary meaning
Plans for the future:
Analyze additional assemblages
Quantitative study of the question of standardization
Additional study of the cognitive questions….

The end