synthesis and photophysics of purine-capped q-cds nanocrystallites
TRANSCRIPT

Synthesis and photophysics of purine-capped Q-CdSnanocrystallites
Anil Kumar* and Shipra Mital
Department of Chemistry, Indian Institute of Technology Roorkee, Roorkee-247667, India.E-mail: [email protected]; Fax: �(0091)1332-73560; Tel: �(0091)1332-85799
Received 1st July 2002, Accepted 27th August 2002First published as an Advance Article on the web 9th September 2002
Purine-capped Q-CdS has been synthesised in aqueousbasic medium in the presence of excess Cd2�. XRD analysissuggests the presence of CdS is in both its cubic andwurtzite structural forms along with Cd(OH)2. IR andNMR studies indicate core CdS binds purine throughH-bonding interaction involving the OH of Cd(OH)2 andN(9) of purine. A further uptake of purine occurs throughprotonated N(7). The amount of purine controls the sizeof the clusters in a dynamic equilibrium. These clustersexhibit size-dependent electronic properties. Purine bindsto the deep defects involved in non-radiative transitionand enhances the bandgap emission. Emission decays ina complex process and consists of three distinct timedomains in the sub-nanosecond and nanosecond range.Relaxation kinetics of the charge carriers monitored as afunction of emission energy reveal a distribution of trapsto varying depths on the surface of the particles. Theseparticles were highly photoactive. Their illuminationresults in the production of smaller particles. Thermolysisof these colloids induces the growth of particles byremoving the weakly bound purine.
Introduction
Semiconductor nanocrystals exhibit a wide range of size-dependent electronic properties that have fascinating scientificand technological applications in diverse disciplines.1–9 A smalldimension of these crystallites result in a regular change in thedensity of electronic energy levels as a function of their size.These changes may cause a variation in the fundamental prop-erties viz. absorption, emission and electrical behavior of thesematerials. Besides, the small size of these clusters provides largeexternal and internal surfaces, which can be exploited to bringstructural transformations and to manipulate their catalyticbehaviour. The passivation of semiconductor surfaces byinorganics 10–18 and organics 19–24 has been widely investigated tocontrol their size, size-distribution and electronic properties,and to produce a redispersable photocatalyst without a stabil-iser. Inorganic systems described previously are Cd(OH)2–
coated CdS,10,11 CdS–Ag2S,12 CdS–HgS,13 CdS–CdSe,14 Ag2S–AgI,15 CdSe–ZnSe,16 CdS–ZnS 17,18 etc. Inorganic crystalsembedded in organic molecules have been synthesized in orderto enhance their solubility, photocatalytic activity and for themodification of their electronic properties.
Recently, the ease of coupling of biological moleculesthrough their chelation with metal ions of semiconductors hasbeen considered to be very promising for the restriction of thesize of cluster, control of their electronic properties 20,21,23,24 andfor fluorescence imaging characteristics.25 The transformationof the Cd2� ion into CdS by the bacteria Klebsiella pneumoniaeplays an important role in overcoming the toxic effect in thebacterium’s local environment and also for their protectionfrom destructive UV-A radiation. Biological labeling of nano-crystals has been considered to be superior to the use of existingflourophores because of their tunable optical characteristicsand easy diagnostics.25 Lately, polynucleotides have been used
as stabilisers in a number of studies to understand the role ofinterfaces. These solutes may bind Cd2� through different sitesof nucleic acid. In order to analyse the role of these bindingsites, in the present work, we have examined the stabilisation ofQ-CdS by purine. Steady-state and time-resolved emission,absorption, IR, NMR and XRD techniques have been usedto characterize these materials. Their photocatalytic activityhas been analysed by performing redox reactions at theirinterface.
Materials and methods
Reagents
Cadmium perchlorate, indole, indigo (Aldrich); purine (Sigma);sodium hydroxide, perchloric acid (Merck); hydrochloric acid(Qualigens); N2 (purity >99.9%) were of analytical grade andwere used without further purification.
Equipment
Electronic spectra were recorded on a Shimadzu UV-2100Sspectrophotometer. Emission spectra were measured on aShimadzu RF-5301PC spectrofluorophotometer. Steady-statephotolysis was carried out on an Oriel photolysis assemblyequipped with 200 W Hg (Xe) arc lamp, suitable solutionand glass cut filters. Electron microscopy was performed by aPhilips CM-10 TEM equipped with a 35 mm camera by scan-ning the grid with an accelerating voltage of 100 kV. Samplesfor electron microscopy were prepared by applying a small dropof CdS on a carbon coated copper G-200 grid. The fluorescencelifetimes were measured on an IBH-5000 single photon counterusing a picosecond Ti-sapphire mode locked laser as an exci-tation source and Hamamatsu photomultiplier as a detector.Solid samples of purine-capped Q-CdS, prepared by removingwater on a Buchi R-114 Rotavapor at 35 �C, were used forrecording IR and NMR spectra and XRD pattern. IR spectrawere recorded on a Perkin-Elmer Spectrum-2000 FTIR usingKBr and polyethylene as media in mid-IR and far-IR range,respectively. 1H NMR spectra were measured in DMSO on aBruker DPX-300 MHz NMR spectrometer. X-Ray diffractionpatterns were recorded on a Philips APD-10 diffractometerusing Cu-Kα radiation.
Methodology
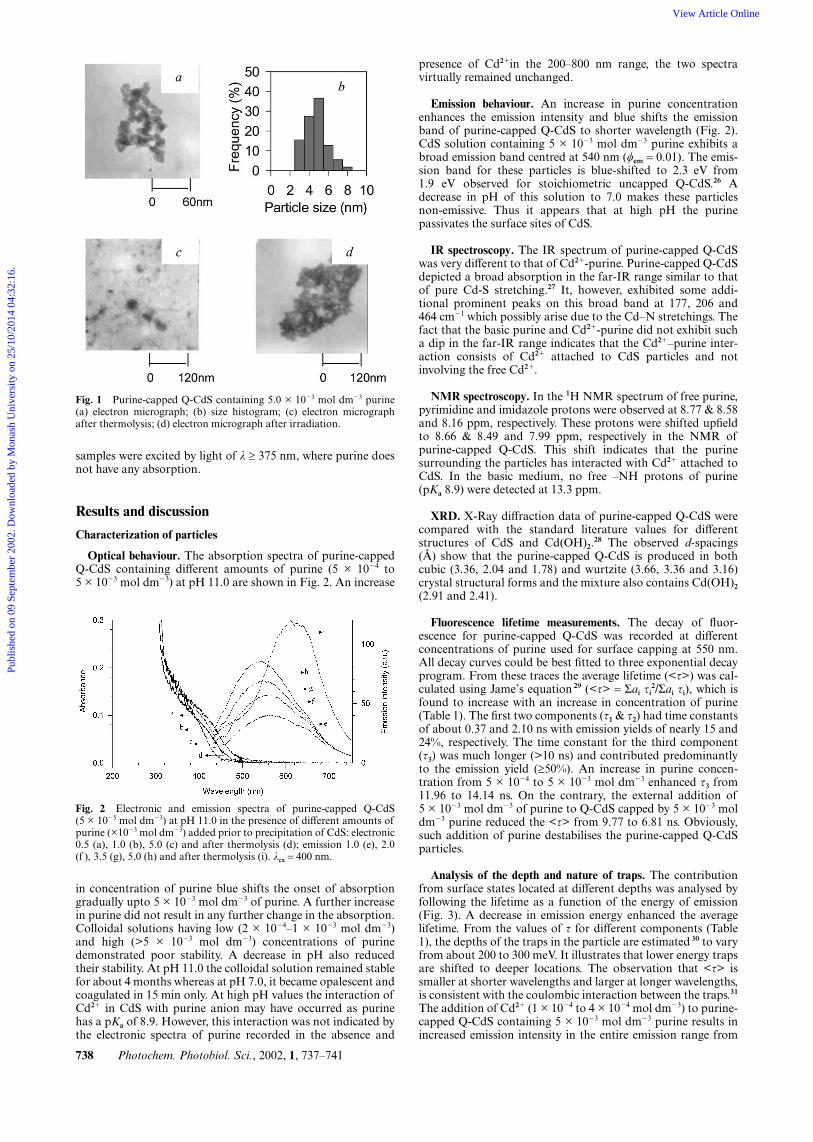
Purine capped Q-CdS was synthesized by using the followingmethod—100 µl of 0.1 mol dm�3 Cd(ClO4)2 solution was addedto 100 ml aqueous solution containing varied concentrationsof purine at pH 11.0. Q-CdS was precipitated by injection ofSH� to the degassed mixture. The resulting solution contained5 × 10�5 mol dm�3 each of excess Cd2� and CdS capped withdifferent concentrations of purine. The electron micrographalong with its histogram for a typical 5 × 10�3 mol dm�3 purineare shown in Figs. 1a and b. These particles had a relativelybroad size distribution (2–9 nm) with an average particle size ofabout 5 nm. A decrease in concentration of purine resulted inan increase in the size of particles. In emission experiments all
DOI: 10.1039/b206301h Photochem. Photobiol. Sci., 2002, 1, 737–741 737
This journal is © The Royal Society of Chemistry and Owner Societies 2002
Publ
ishe
d on
09
Sept
embe
r 20
02. D
ownl
oade
d by
Mon
ash
Uni
vers
ity o
n 25
/10/
2014
04:
32:1
6.
View Article Online / Journal Homepage / Table of Contents for this issue
samples were excited by light of λ ≥ 375 nm, where purine doesnot have any absorption.
Results and discussion
Characterization of particles
Optical behaviour. The absorption spectra of purine-cappedQ-CdS containing different amounts of purine (5 × 10�4 to5 × 10�3 mol dm�3) at pH 11.0 are shown in Fig. 2. An increase
in concentration of purine blue shifts the onset of absorptiongradually upto 5 × 10�3 mol dm�3 of purine. A further increasein purine did not result in any further change in the absorption.Colloidal solutions having low (2 × 10�4–1 × 10�3 mol dm�3)and high (>5 × 10�3 mol dm�3) concentrations of purinedemonstrated poor stability. A decrease in pH also reducedtheir stability. At pH 11.0 the colloidal solution remained stablefor about 4 months whereas at pH 7.0, it became opalescent andcoagulated in 15 min only. At high pH values the interaction ofCd2� in CdS with purine anion may have occurred as purinehas a pKa of 8.9. However, this interaction was not indicated bythe electronic spectra of purine recorded in the absence and
Fig. 1 Purine-capped Q-CdS containing 5.0 × 10�3 mol dm�3 purine(a) electron micrograph; (b) size histogram; (c) electron micrographafter thermolysis; (d) electron micrograph after irradiation.
Fig. 2 Electronic and emission spectra of purine-capped Q-CdS(5 × 10�5 mol dm�3) at pH 11.0 in the presence of different amounts ofpurine (×10�3 mol dm�3) added prior to precipitation of CdS: electronic0.5 (a), 1.0 (b), 5.0 (c) and after thermolysis (d); emission 1.0 (e), 2.0(f ), 3.5 (g), 5.0 (h) and after thermolysis (i). λcx = 400 nm.
presence of Cd2�in the 200–800 nm range, the two spectravirtually remained unchanged.
Emission behaviour. An increase in purine concentrationenhances the emission intensity and blue shifts the emissionband of purine-capped Q-CdS to shorter wavelength (Fig. 2).CdS solution containing 5 × 10�3 mol dm�3 purine exhibits abroad emission band centred at 540 nm (�em = 0.01). The emis-sion band for these particles is blue-shifted to 2.3 eV from1.9 eV observed for stoichiometric uncapped Q-CdS.26 Adecrease in pH of this solution to 7.0 makes these particlesnon-emissive. Thus it appears that at high pH the purinepassivates the surface sites of CdS.
IR spectroscopy. The IR spectrum of purine-capped Q-CdSwas very different to that of Cd2�-purine. Purine-capped Q-CdSdepicted a broad absorption in the far-IR range similar to thatof pure Cd-S stretching.27 It, however, exhibited some addi-tional prominent peaks on this broad band at 177, 206 and464 cm�1 which possibly arise due to the Cd–N stretchings. Thefact that the basic purine and Cd2�-purine did not exhibit sucha dip in the far-IR range indicates that the Cd2�–purine inter-action consists of Cd2� attached to CdS particles and notinvolving the free Cd2�.
NMR spectroscopy. In the 1H NMR spectrum of free purine,pyrimidine and imidazole protons were observed at 8.77 & 8.58and 8.16 ppm, respectively. These protons were shifted upfieldto 8.66 & 8.49 and 7.99 ppm, respectively in the NMR ofpurine-capped Q-CdS. This shift indicates that the purinesurrounding the particles has interacted with Cd2� attached toCdS. In the basic medium, no free –NH protons of purine(pKa 8.9) were detected at 13.3 ppm.
XRD. X-Ray diffraction data of purine-capped Q-CdS werecompared with the standard literature values for differentstructures of CdS and Cd(OH)2.
28 The observed d-spacings(Å) show that the purine-capped Q-CdS is produced in bothcubic (3.36, 2.04 and 1.78) and wurtzite (3.66, 3.36 and 3.16)crystal structural forms and the mixture also contains Cd(OH)2
(2.91 and 2.41).
Fluorescence lifetime measurements. The decay of fluor-escence for purine-capped Q-CdS was recorded at differentconcentrations of purine used for surface capping at 550 nm.All decay curves could be best fitted to three exponential decayprogram. From these traces the average lifetime (<τ>) was cal-culated using Jame’s equation 29 (<τ> = Σai τi
2/Σai τi), which isfound to increase with an increase in concentration of purine(Table 1). The first two components (τ1 & τ2) had time constantsof about 0.37 and 2.10 ns with emission yields of nearly 15 and24%, respectively. The time constant for the third component(τ3) was much longer (>10 ns) and contributed predominantlyto the emission yield (≥50%). An increase in purine concen-tration from 5 × 10�4 to 5 × 10�3 mol dm�3 enhanced τ3 from11.96 to 14.14 ns. On the contrary, the external addition of5 × 10�3 mol dm�3 of purine to Q-CdS capped by 5 × 10�3 moldm�3 purine reduced the <τ> from 9.77 to 6.81 ns. Obviously,such addition of purine destabilises the purine-capped Q-CdSparticles.
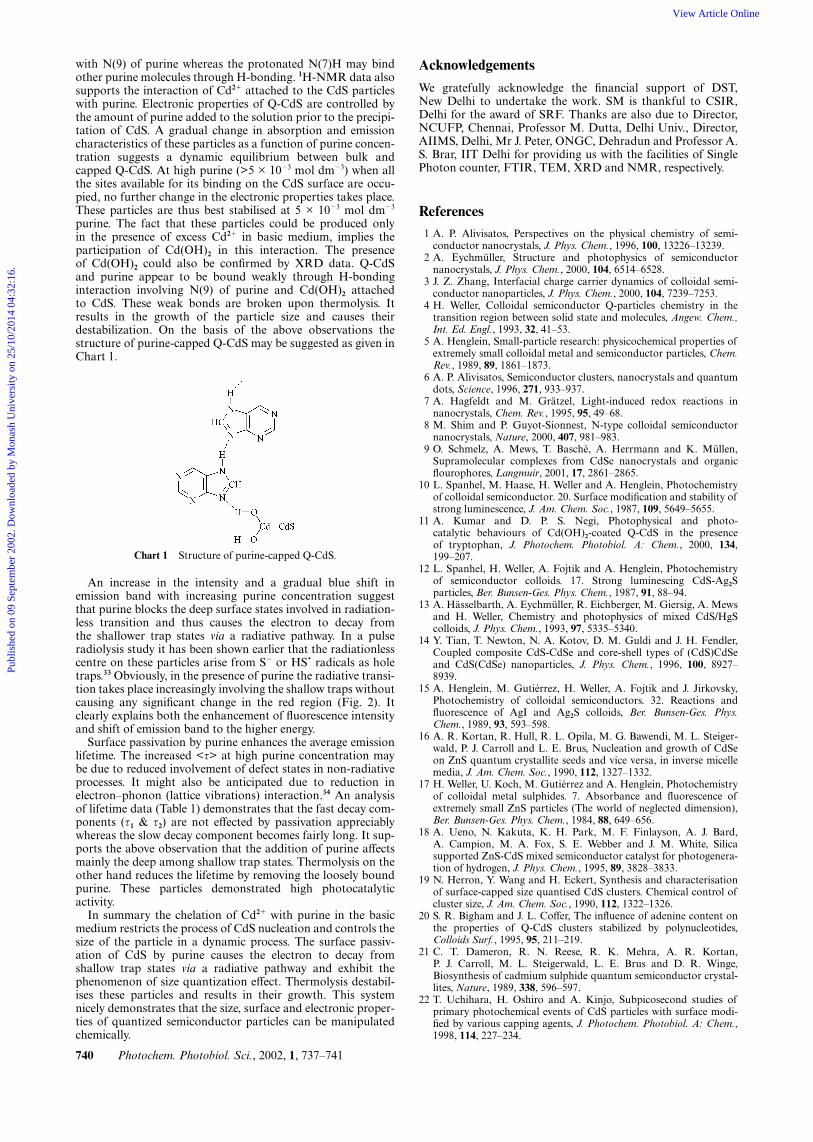
Analysis of the depth and nature of traps. The contributionfrom surface states located at different depths was analysed byfollowing the lifetime as a function of the energy of emission(Fig. 3). A decrease in emission energy enhanced the averagelifetime. From the values of τ for different components (Table1), the depths of the traps in the particle are estimated 30 to varyfrom about 200 to 300 meV. It illustrates that lower energy trapsare shifted to deeper locations. The observation that <τ> issmaller at shorter wavelengths and larger at longer wavelengths,is consistent with the coulombic interaction between the traps.31
The addition of Cd2� (1 × 10�4 to 4 × 10�4 mol dm�3) to purine-capped Q-CdS containing 5 × 10�3 mol dm�3 purine results inincreased emission intensity in the entire emission range from
738 Photochem. Photobiol. Sci., 2002, 1, 737–741
Publ
ishe
d on
09
Sept
embe
r 20
02. D
ownl
oade
d by
Mon
ash
Uni
vers
ity o
n 25
/10/
2014
04:
32:1
6.
View Article Online
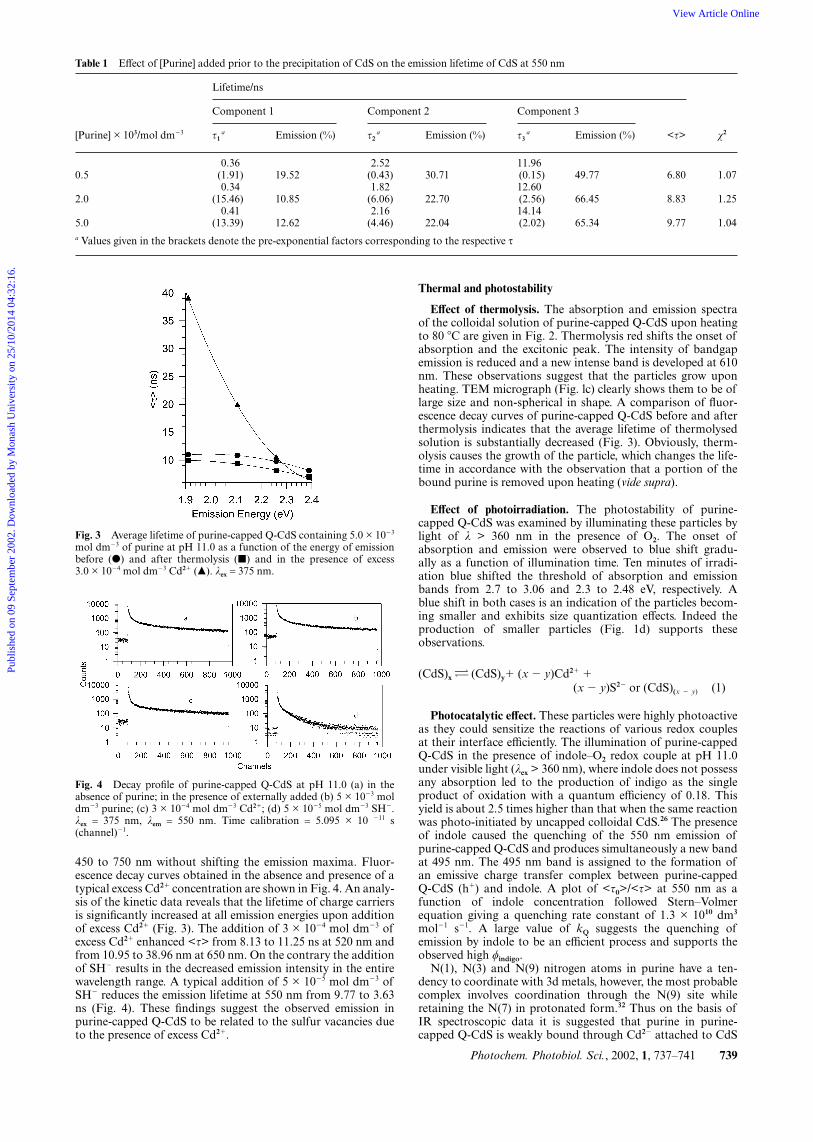
Table 1 Effect of [Purine] added prior to the precipitation of CdS on the emission lifetime of CdS at 550 nm
[Purine] × 103/mol dm�3
Lifetime/ns
χ2
Component 1 Component 2 Component 3
<τ>τ1a Emission (%) τ2
a Emission (%) τ3a Emission (%)
0.36 2.52 11.96 0.5 (1.91) 19.52 (0.43) 30.71 (0.15) 49.77 6.80 1.07 0.34 1.82 12.60 2.0 (15.46) 10.85 (6.06) 22.70 (2.56) 66.45 8.83 1.25 0.41 2.16 14.14 5.0 (13.39) 12.62 (4.46) 22.04 (2.02) 65.34 9.77 1.04a Values given in the brackets denote the pre-exponential factors corresponding to the respective τ
450 to 750 nm without shifting the emission maxima. Fluor-escence decay curves obtained in the absence and presence of atypical excess Cd2� concentration are shown in Fig. 4. An analy-sis of the kinetic data reveals that the lifetime of charge carriersis significantly increased at all emission energies upon additionof excess Cd2� (Fig. 3). The addition of 3 × 10�4 mol dm�3 ofexcess Cd2� enhanced <τ> from 8.13 to 11.25 ns at 520 nm andfrom 10.95 to 38.96 nm at 650 nm. On the contrary the additionof SH� results in the decreased emission intensity in the entirewavelength range. A typical addition of 5 × 10�5 mol dm�3 ofSH� reduces the emission lifetime at 550 nm from 9.77 to 3.63ns (Fig. 4). These findings suggest the observed emission inpurine-capped Q-CdS to be related to the sulfur vacancies dueto the presence of excess Cd2�.
Fig. 3 Average lifetime of purine-capped Q-CdS containing 5.0 × 10�3
mol dm�3 of purine at pH 11.0 as a function of the energy of emissionbefore (�) and after thermolysis (�) and in the presence of excess3.0 × 10�4 mol dm�3 Cd2� (�). λex = 375 nm.
Fig. 4 Decay profile of purine-capped Q-CdS at pH 11.0 (a) in theabsence of purine; in the presence of externally added (b) 5 × 10�3 moldm�3 purine; (c) 3 × 10�4 mol dm�3 Cd2�; (d) 5 × 10�5 mol dm�3 SH�.λex = 375 nm, λem = 550 nm. Time calibration = 5.095 × 10 �11 s(channel)�1.
Thermal and photostability
Effect of thermolysis. The absorption and emission spectraof the colloidal solution of purine-capped Q-CdS upon heatingto 80 �C are given in Fig. 2. Thermolysis red shifts the onset ofabsorption and the excitonic peak. The intensity of bandgapemission is reduced and a new intense band is developed at 610nm. These observations suggest that the particles grow uponheating. TEM micrograph (Fig. lc) clearly shows them to be oflarge size and non-spherical in shape. A comparison of fluor-escence decay curves of purine-capped Q-CdS before and afterthermolysis indicates that the average lifetime of thermolysedsolution is substantially decreased (Fig. 3). Obviously, therm-olysis causes the growth of the particle, which changes the life-time in accordance with the observation that a portion of thebound purine is removed upon heating (vide supra).
Effect of photoirradiation. The photostability of purine-capped Q-CdS was examined by illuminating these particles bylight of λ > 360 nm in the presence of O2. The onset ofabsorption and emission were observed to blue shift gradu-ally as a function of illumination time. Ten minutes of irradi-ation blue shifted the threshold of absorption and emissionbands from 2.7 to 3.06 and 2.3 to 2.48 eV, respectively. Ablue shift in both cases is an indication of the particles becom-ing smaller and exhibits size quantization effects. Indeed theproduction of smaller particles (Fig. 1d) supports theseobservations.
Photocatalytic effect. These particles were highly photoactiveas they could sensitize the reactions of various redox couplesat their interface efficiently. The illumination of purine-cappedQ-CdS in the presence of indole–O2 redox couple at pH 11.0under visible light (λex > 360 nm), where indole does not possessany absorption led to the production of indigo as the singleproduct of oxidation with a quantum efficiency of 0.18. Thisyield is about 2.5 times higher than that when the same reactionwas photo-initiated by uncapped colloidal CdS.26 The presenceof indole caused the quenching of the 550 nm emission ofpurine-capped Q-CdS and produces simultaneously a new bandat 495 nm. The 495 nm band is assigned to the formation ofan emissive charge transfer complex between purine-cappedQ-CdS (h�) and indole. A plot of <τ0>/<τ> at 550 nm as afunction of indole concentration followed Stern–Volmerequation giving a quenching rate constant of 1.3 × 10¹⁰ dm3
mol�1 s�1. A large value of kQ suggests the quenching ofemission by indole to be an efficient process and supports theobserved high �indigo.
N(1), N(3) and N(9) nitrogen atoms in purine have a ten-dency to coordinate with 3d metals, however, the most probablecomplex involves coordination through the N(9) site whileretaining the N(7) in protonated form.32 Thus on the basis ofIR spectroscopic data it is suggested that purine in purine-capped Q-CdS is weakly bound through Cd2� attached to CdS
(CdS)x (CdS)y� (x � y)Cd2� �(x � y)S2� or (CdS)(x � y) (1)
Photochem. Photobiol. Sci., 2002, 1, 737–741 739
Publ
ishe
d on
09
Sept
embe
r 20
02. D
ownl
oade
d by
Mon
ash
Uni
vers
ity o
n 25
/10/
2014
04:
32:1
6.
View Article Online
with N(9) of purine whereas the protonated N(7)H may bindother purine molecules through H-bonding. 1H-NMR data alsosupports the interaction of Cd2� attached to the CdS particleswith purine. Electronic properties of Q-CdS are controlled bythe amount of purine added to the solution prior to the precipi-tation of CdS. A gradual change in absorption and emissioncharacteristics of these particles as a function of purine concen-tration suggests a dynamic equilibrium between bulk andcapped Q-CdS. At high purine (>5 × 10�3 mol dm�3) when allthe sites available for its binding on the CdS surface are occu-pied, no further change in the electronic properties takes place.These particles are thus best stabilised at 5 × 10�3 mol dm�3
purine. The fact that these particles could be produced onlyin the presence of excess Cd2� in basic medium, implies theparticipation of Cd(OH)2 in this interaction. The presenceof Cd(OH)2 could also be confirmed by XRD data. Q-CdSand purine appear to be bound weakly through H-bondinginteraction involving N(9) of purine and Cd(OH)2 attachedto CdS. These weak bonds are broken upon thermolysis. Itresults in the growth of the particle size and causes theirdestabilization. On the basis of the above observations thestructure of purine-capped Q-CdS may be suggested as given inChart 1.
An increase in the intensity and a gradual blue shift inemission band with increasing purine concentration suggestthat purine blocks the deep surface states involved in radiation-less transition and thus causes the electron to decay fromthe shallower trap states via a radiative pathway. In a pulseradiolysis study it has been shown earlier that the radiationlesscentre on these particles arise from S� or HS� radicals as holetraps.33 Obviously, in the presence of purine the radiative transi-tion takes place increasingly involving the shallow traps withoutcausing any significant change in the red region (Fig. 2). Itclearly explains both the enhancement of fluorescence intensityand shift of emission band to the higher energy.
Surface passivation by purine enhances the average emissionlifetime. The increased <τ> at high purine concentration maybe due to reduced involvement of defect states in non-radiativeprocesses. It might also be anticipated due to reduction inelectron–phonon (lattice vibrations) interaction.34 An analysisof lifetime data (Table 1) demonstrates that the fast decay com-ponents (τ1 & τ2) are not effected by passivation appreciablywhereas the slow decay component becomes fairly long. It sup-ports the above observation that the addition of purine affectsmainly the deep among shallow trap states. Thermolysis on theother hand reduces the lifetime by removing the loosely boundpurine. These particles demonstrated high photocatalyticactivity.
In summary the chelation of Cd2� with purine in the basicmedium restricts the process of CdS nucleation and controls thesize of the particle in a dynamic process. The surface passiv-ation of CdS by purine causes the electron to decay fromshallow trap states via a radiative pathway and exhibit thephenomenon of size quantization effect. Thermolysis destabil-ises these particles and results in their growth. This systemnicely demonstrates that the size, surface and electronic proper-ties of quantized semiconductor particles can be manipulatedchemically.
Chart 1 Structure of purine-capped Q-CdS.
Acknowledgements
We gratefully acknowledge the financial support of DST,New Delhi to undertake the work. SM is thankful to CSIR,Delhi for the award of SRF. Thanks are also due to Director,NCUFP, Chennai, Professor M. Dutta, Delhi Univ., Director,AIIMS, Delhi, Mr J. Peter, ONGC, Dehradun and Professor A.S. Brar, IIT Delhi for providing us with the facilities of SinglePhoton counter, FTIR, TEM, XRD and NMR, respectively.
References1 A. P. Alivisatos, Perspectives on the physical chemistry of semi-
conductor nanocrystals, J. Phys. Chem., 1996, 100, 13226–13239.2 A. Eychmüller, Structure and photophysics of semiconductor
nanocrystals, J. Phys. Chem., 2000, 104, 6514–6528.3 J. Z. Zhang, Interfacial charge carrier dynamics of colloidal semi-
conductor nanoparticles, J. Phys. Chem., 2000, 104, 7239–7253.4 H. Weller, Colloidal semiconductor Q-particles chemistry in the
transition region between solid state and molecules, Angew. Chem.,Int. Ed. Engl., 1993, 32, 41–53.
5 A. Henglein, Small-particle research: physicochemical properties ofextremely small colloidal metal and semiconductor particles, Chem.Rev., 1989, 89, 1861–1873.
6 A. P. Alivisatos, Semiconductor clusters, nanocrystals and quantumdots, Science, 1996, 271, 933–937.
7 A. Hagfeldt and M. Grätzel, Light-induced redox reactions innanocrystals, Chem. Rev., 1995, 95, 49–68.
8 M. Shim and P. Guyot-Sionnest, N-type colloidal semiconductornanocrystals, Nature, 2000, 407, 981–983.
9 O. Schmelz, A. Mews, T. Basché, A. Herrmann and K. Müllen,Supramolecular complexes from CdSe nanocrystals and organicflourophores, Langmuir, 2001, 17, 2861–2865.
10 L. Spanhel, M. Haase, H. Weller and A. Henglein, Photochemistryof colloidal semiconductor. 20. Surface modification and stability ofstrong luminescence, J. Am. Chem. Soc., 1987, 109, 5649–5655.
11 A. Kumar and D. P. S. Negi, Photophysical and photo-catalytic behaviours of Cd(OH)2-coated Q-CdS in the presenceof tryptophan, J. Photochem. Photobiol. A: Chem., 2000, 134,199–207.
12 L. Spanhel, H. Weller, A. Fojtik and A. Henglein, Photochemistryof semiconductor colloids. 17. Strong luminescing CdS-Ag2Sparticles, Ber. Bunsen-Ges. Phys. Chem., 1987, 91, 88–94.
13 A. Hässelbarth, A. Eychmüller, R. Eichberger, M. Giersig, A. Mewsand H. Weller, Chemistry and photophysics of mixed CdS/HgScolloids, J. Phys. Chem., 1993, 97, 5335–5340.
14 Y. Tian, T. Newton, N. A. Kotov, D. M. Guldi and J. H. Fendler,Coupled composite CdS-CdSe and core-shell types of (CdS)CdSeand CdS(CdSe) nanoparticles, J. Phys. Chem., 1996, 100, 8927–8939.
15 A. Henglein, M. Gutiérrez, H. Weller, A. Fojtik and J. Jirkovsky,Photochemistry of colloidal semiconductors. 32. Reactions andfluorescence of AgI and Ag2S colloids, Ber. Bunsen-Ges. Phys.Chem., 1989, 93, 593–598.
16 A. R. Kortan, R. Hull, R. L. Opila, M. G. Bawendi, M. L. Steiger-wald, P. J. Carroll and L. E. Brus, Nucleation and growth of CdSeon ZnS quantum crystallite seeds and vice versa, in inverse micellemedia, J. Am. Chem. Soc., 1990, 112, 1327–1332.
17 H. Weller, U. Koch, M. Gutiérrez and A. Henglein, Photochemistryof colloidal metal sulphides. 7. Absorbance and fluorescence ofextremely small ZnS particles (The world of neglected dimension),Ber. Bunsen-Ges. Phys. Chem., 1984, 88, 649–656.
18 A. Ueno, N. Kakuta, K. H. Park, M. F. Finlayson, A. J. Bard,A. Campion, M. A. Fox, S. E. Webber and J. M. White, Silicasupported ZnS-CdS mixed semiconductor catalyst for photogenera-tion of hydrogen, J. Phys. Chem., 1995, 89, 3828–3833.
19 N. Herron, Y. Wang and H. Eckert, Synthesis and characterisationof surface-capped size quantised CdS clusters. Chemical control ofcluster size, J. Am. Chem. Soc., 1990, 112, 1322–1326.
20 S. R. Bigham and J. L. Coffer, The influence of adenine content onthe properties of Q-CdS clusters stabilized by polynucleotides,Colloids Surf., 1995, 95, 211–219.
21 C. T. Dameron, R. N. Reese, R. K. Mehra, A. R. Kortan,P. J. Carroll, M. L. Steigerwald, L. E. Brus and D. R. Winge,Biosynthesis of cadmium sulphide quantum semiconductor crystal-lites, Nature, 1989, 338, 596–597.
22 T. Uchihara, H. Oshiro and A. Kinjo, Subpicosecond studies ofprimary photochemical events of CdS particles with surface modi-fied by various capping agents, J. Photochem. Photobiol. A: Chem.,1998, 114, 227–234.
740 Photochem. Photobiol. Sci., 2002, 1, 737–741
Publ
ishe
d on
09
Sept
embe
r 20
02. D
ownl
oade
d by
Mon
ash
Uni
vers
ity o
n 25
/10/
2014
04:
32:1
6.
View Article Online

23 P. R. Smith, J. D. Holmes, D. J. Richardson, D. A. Russell andJ. R. Sodeau, Photophysical and photochemical characterisation ofbacterial semiconductor cadmium sulfide particles, J. Chem. Soc.,Faraday Trans., 1998, 94, 1235–1241.
24 L. Xin and J. L. Coffer, Effect of pressure on the photoluminescenceof polynucleotide-stabilized cadmium sulfide nanocrystals, Chem.Mater., 1999, 11, 2326–2330.
25 M. Bruchez Jr., M. Moronne, P. Gin, S. Weiss and A. P. Alivisatos,Semiconductor nanocrystals as fluorescent biological labels,Science, 1998, 281, 2013–2015.
26 A. Kumar and S. Kumar, Enhancement of luminescence of colloidalCdS in the presence of indoles–study of CdS-sensitized reactions ofindole, J. Photochem. Photobiol. A: Chem., 1994, 83, 251–256.
27 Infrared Spectra of Inorganic Compounds, ed. R. A. Nyquist andR. O. Kagel, Academic press, New York and London, 1971, p. 253.
28 Powder Diffraction File Search Manual for Frequently EncounteredPhases, ed. W. F. Mc Clune, Pennsylvania, USA, 1978 .
29 D. R. James, Y.-S. Liu, P. de Mayo and W. R. Ware, Distributionsof fluorescence lifetimes: consequences for the photophysics of
molecules adsorbed on surfaces, Chem. Phys. Lett., 1985, 120,460–465.
30 A. Eychmüller, A. Hässelbarth, L. Katsikas and H. Weller,Fluorescence mechanism of highly monodisperse Q-sized CdScolloids, J. Lumin., 1991, 48 & 49, 745–749.
31 N. Chestnoy, T. D. Harris, R. Hull and L. E. Brus, Luminescenceand photophysics of CdS semiconductor clusters: the natureof the emitting electronic state, J. Phys. Chem., 1986, 90, 3393–3399.
32 A. N. Speca, C. M. Mikulski, F. J. Iaconianni, L. L. Pytlewskiand N. M. Karayannis, Purine complexes with divalent 3d metalchlorides, Inorg. Chim. Acta, 1980, 46, 235–241.
33 A. Kumar, A. Henglein and H. Weller, Photochemistry of colloidalsemiconductors. 25. Quenching of CdS fluorescence by excesspositive holes, J. Phys. Chem., 1988, 92, 2587–2591.
34 F. Wu, J. Z. Zhang, R. Kho and R. K. Mehra, Radiative andnonradiative lifetimes of band edge states and deep trap states ofCdS nanoparticles determined by time-correlated single photoncounting, Chem. Phys. Lett., 2000, 330, 237–242.
Photochem. Photobiol. Sci., 2002, 1, 737–741 741
Publ
ishe
d on
09
Sept
embe
r 20
02. D
ownl
oade
d by
Mon
ash
Uni
vers
ity o
n 25
/10/
2014
04:
32:1
6.
View Article Online