synthesis and use of silica materials as supports for …
TRANSCRIPT

i
SYNTHESIS AND USE OF SILICA MATERIALS AS SUPPORTS
FOR THE FISCHER-TROPSCH REACTION
Emma Magdeline Mokoena
A thesis submitted to the Faculty of Science, University of the Witwatersrand,
Johannesburg, in fulfilment of the requirements for the degree of Doctor of
Philosophy.
Johannesburg, 2005

i
Declaration
I declare that this thesis is my own, unaided work. It is being submitted for the
degree of Doctor of Philosophy in the University of the Witwatersrand,
Johannesburg. It has not been submitted before for any degree or examination in
any other university.
day of 2005

ii
Abstract
The objective of the study was to prepare novel silica materials and then use
them as supports/binders for the Fisher-Tropsch (F-T) reaction. Hence the thesis
is divided into two parts - (i) the synthesis of silica materials (ii) use of silica
materials as supports.
PART I
The studies that were carried out in this thesis evaluated the effect of templates
and synthesis conditions on the nano- and microstructure and properties of silica
materials that are obtained by the sol-gel method.
The studies with DL-tartaric acid and citric acid as templates revealed that
synthesis conditions (temperature, NH4OH concentration, water/ethanol
concentration, time before NH4OH addition, static versus stirred conditions,
stirring rate and solvent) all have an effect on the microstructure of the silica and
influence the formation of particular silica morphologies.
DL-tartaric acid produced longer and more uniform tubes when compared to citric
acid. Tubes that are formed by DL-tartaric acid are hollow and open ended;
however the ones formed in citric acid are a mixture of filled and hollow but
closed tubes. Hollow spheres are exclusively formed when citric acid is used
under certain conditions while only filled spheres are formed when DL-tartaric
iii
acid is used. The surface areas of the silicas formed from DL-tartaric acid are
lower that the surface areas obtained for materials produced by citric acid. The
nitrogen adsorption-desorption isotherms of silica materials obtained from both
templates showed that the materials were mesoporous with some microporosity
present in them.
Studies with mucic and tartronic acids as templates also showed that the
template as well as the synthesis conditions (such as solvent, temperature and
stirring) affect the resulting silica morphology. Mucic acid produced silica
materials with high surface areas, mesopores and a morphology that reveals
fragmented tubes. Tartronic acid produced hollow tube materials with low surface
areas and a combination of micro- and mesopores. The yield of the tubes was
higher at lower temperatures for both templates.
When sugars (e.g. glucose) were used only spherical particles were obtained
and some sugars gave particle sizes that are smaller than the ones that are
normally obtained by the sol-gel method.
PART II
Catalysts (Fe/Cu/K) supported on a range of silica materials with different
morphologies (hollow nanotubes, hollow spheres, Stöber/closed spheres) were
evaluated in the Fischer-Tropsch reaction (8 bar, 250 °C, 400 h-1 GHSV). The
supported iron catalysts modified the physico-chemical properties and activity of

iv
the catalysts but not the catalyst selectivity. A Ruhrchemie catalyst (known F-T
catalyst standard) was also evaluated under the same reaction conditions as the
new catalysts for comparison purposes.
The Ruhrchemie catalyst was found to be the most active catalyst followed by
the catalyst supported on nanotubes, Stöber spheres and hollow spheres
respectively. Catalysts containing 18% silica showed the best activity compared
to the 9% and 27% silica catalysts.
The product distribution and WGS activity were largely influenced by the
potassium that is present in the samples and not the support type.
Mössbauer spectroscopy showed that some active catalysts contained χ' –
Fe2.5C and some superparamagnetic iron oxides or carbides while other catalysts
also contained α – Fe and Fe3O4 in addition to χ' – Fe2.5C and some
superparamagnetic iron oxides or carbides species. This finding supports the
hypothesis that carbide formation is a requirement for active F-T catalysts. It also
suggests that metallic iron is necessary for carbiding to occur, hence the need for
a reduction pre-treatment.

v
To my husband Wilfred
and my daughter Boitumelo,
for your unconditional love and support

vi
Acknowledgements
The work presented in this thesis would not have been possible without the
assistance of a number of people and institutions. I would like to express my
gratitude to the following:
Prof. N.J. Coville, my supervisor for his guidance and enthusiasm about catalysis
and chemistry in general which he was also able to impress on me.
Prof. A.K. Datye, for allowing me to spend time with his research group at the
University of New Mexico in the USA and whose interest and knowledge in the
field of Fischer-Tropsch catalysis was invaluable.
B. Chassoulas, for designing and constructing the electronic circuitry and for
helping me solve the equipment problems that invariably cropped up.
The members of the physics workshop and S. Ganon and B. Fairbrother (the
glassblowers) for manufacturing the various pieces of equipment required.
My colleagues in the Wits catalysis group, for showing me how to use the
characterisation equipment and for creating a conducive environment for doing
research.

vii
Prof. M. Witcomb, C. Lalkhan and A. Seema of the WITS Electron Microscope
Unit and H Pham of UNM (University of New Mexico) for all their assistance with
the microscopy work.
T. Motjope and L. Lodya of the Materials Characterisation group at Sasol
Technology, for their assistance with Mössbauer spectroscopy.
Dr A. Debeila for helping me get started on the F-T reactor system.
K. Chiloane, the chemistry honours student, for performing some of the sol-gel
work with mucic and tartronic acids.
L. Daniels, K. Banda, A. Pointeer, A. Morgan, E. Valoyi and D. Moloto of the
WITS chemistry department for their assistance in various ways.
The University, Sasol, THRIP, NRF and the WITS catalysis group for their
generous funding.
The Almighty God for granting me the strength to face each day and his daily
blessings that befell me throughout the duration of the study.
viii
Publications and Presentations arising from this Work
Poster Presentation:
TEM and SEM Studies of Silica Used in Supporting Iron Catalysts for the
Fischer-Tropsch Reaction, CATSA, Wigwam Hotel, Rustenburg, 1999.
Oral Presentations:
1. Use of Citric and DL-Tartaric Acids in the Synthesis of Silica Materials
Obtained by the Sol-Gel Method, CATSA/SACI: Conference on Catalysis
and Inorganic Chemistry, Bakgatla Resort, Pilanesburg, 2001.
2. Silica Nanotube Synthesis via DL-Tartaric Acid Templates, 15th
International Congress on Electron Microscopy, Durban, 2002.
3. Silica with Various Morphologies Used as Supports for the Iron Fischer-
Tropsch Catalyst, CATSA, Protea Hotel President, Cape Town, 2002.
4. Silica Tubes and Spheres as Supports for Fe Fischer-Tropsch Catalysts,
The 19th Meeting of the North American Catalysis Society, Philadelphia,
USA, May 22 – 25, 2005. (Oral presentation by Neil J. Coville).
Publications
1. A Systematic Study of the Use of DL-Tartaric Acid in the Synthesis of
Silica Materials Obtained by the Sol-Gel Method, E.M. Mokoena, A.K.
Datye and N.J. Coville, J. Sol-Gel Sci. Tech., 28, 307 - 317, 2003.

ix
2. Synthesis and Study of Ammonium Oxalate Sol-gel Templated Silica Gels,
Keneiloe Khoabane, Emma M. Mokoena and Neil J. Coville, Microporous
and Mesoporous Materials, 83, 67 – 65, 2005.

x
Table of Contents
Declaration……………………………………………………………………….………i
Abstract……………………………………………………………………………..……ii
Dedication…………………………………………………………………….....………v
Acknowledgements…………………………………………………………………….vi
Publications and Presentations arising from this Work…………………………....viii
Table of Contents………………………………………………………………………x
List of Tables…………………………………………………………………………..xvi
List of Figures…………………………………………………………………..……..xix
List of Abbreviations and Symbols……………..……………..……………..……..xxv
PART І: Synthesis of Silica Materials by the Sol-Gel Method...............................1
Chapter One:
The Synthesis of Inorganic Materials by Sol-Gel Processing: A
Review…………...…..............................................................................................2
1.1 Introduction
1.1.1 Terminology…………………………………………...………………...3
1.1.2 Principles of the Sol-Gel Process……………………………..….......5
1.1.3 History of the Sol-Gel Process………………………………...….......6
1.1.4 Advantages of the Sol-Gel Process……………………….………….9
xi
1.2 Sol-Gel Chemistry………………………………………………….…………..9
1.3 Role of Templates in the Sol-gel Synthesis………………………………..13
1.4 Sol-Gel Synthesized Oxide Supports…………………………………….…15
1.4.1 Silica………………………………………………………………..…..15
1.4.2 Alumina………………………………………………………………...17
1.4.3 Other Sol-Gel Generated Simple Oxides…………………………..18
1.5 Conclusions……………………………………………………………………20
1.5 References………………………………………………………………….....22
Chapter Two:
A Systematic Study of the Use of DL-Tartaric Acid in the Synthesis of Silica
Materials Obtained by the Sol-Gel Method………………………………………...28
2.1 Introduction…………………………………………………………………….28
2.2 Experimental…………………………………………………………………..31
2.2.1 Preparation…………………………………………………………….31
2.2.2 Characterization………………………………………………………35
2.3 Results………………………………………………………………………...36
2.4 Discussion…………………………………………………………………….55
2.5 Conclusions…………………………………………………………………..59
2.6 References…………………………………………………………………...61
Chapter Three:
A Systematic Study of the Use of Citric Acid in the Synthesis of Silica

xii
Materials Obtained by the Sol-Gel Method………………………………………..64
3.1 Introduction……………………………………………………………………64
3.2 Experimental………………………………………………………………….66
3.2.1 Preparation…………………………………………………………...66
3.2.2 Characterization……………………………………………………..72
3.3 Results and Discussion…………………………………………………….72
3.4 Conclusions………………………………………………………………….92
3.5 References…………………………………………………………………..93
Chapter Four:
Templates Containing COOH and/or OH Groups for the Preparation of Silica
Materials……………………………………………………………………………..95
4.1 Introduction………………………………………………………………….95
4.2 Experimental………………………………………………………………..98
4.2.1 Preparation………………………………………………………….98
4.2.2 Characterisation…………………………………………………….98
4.3 Use of Mucic and Tartronic Acids as Templates………………………..99
4.3.1 Solvent Effects……………………………………………………...99
4.3.2 Temperature Effects……………………………………………...103
4.3.3 Stirring vs Non-stirring Conditions………………………………107
4.3.4 Surface Area and Pore Analysis………………………………...110
4.3.5 Thermal analysis………………………………………………….120
4.4 Use of Sugars as Templates…………………………………………….122

xiii
4.5 Conclusions……………………………………………………………….128
4.6 References………………………………………………………………..129
PART II: The Application of Novel Silica Materials in the Fischer-Tropsch
Synthesis…………………………………………………………………………131
Chapter Five:
The Fischer-Tropsch Synthesis: An Overview……………………………….132
5.1 Introduction………………………………………………………………132
5.2 The Fischer-Tropsch Synthesis………………………………………..133
5.3 Process Reactors………………………………………………………..136
5.4 Fischer-Tropsch Catalysts……………………………………………...138
5.4.1 Iron………………………………………………………………...139
5.4.2 Cobalt……………………………………………………………..141
5.4.3 Ruthenium………………………………………………………..142
5.4.4 Nickel……………………………………………………………..142
5.4.5 Other F-T Catalysts……………………………………………..143
5.5 Promoter Effects…………………………………………………………143
5.5.1 Potassium………………………………………………………..145
5.5.2 Copper……………………………………………………………148
5.6 Support Effects…………………………………………………………..150
5.7 Fischer-Tropsch Mechanism and Kinetics…………………………....154
5.8 Aims of This Study……………………………………………………....159

xiv
5.9 References…………………………………………………………….…161
Chapter Six:
Experimental Method……………………………………………………………170
6.1 Introduction……………………………………………………………….170
6.2 Materials and Chemicals Used…………………………………………171
6.2.1 Support……………………………………………………………171
6.2.2 Metals……………………………………………………………..171
6.2.3 Gases……………………………………………………………..171
6.3 Catalyst Preparation……………………………………………………..172
6.4 Reactor System…………………………………………………………..174
6.5 Fischer-Tropsch Synthesis……………………………………………..177
6.5.1 Product Analysis…………………………………………………177
6.5.2 Mass Balance Calculations……………………………………..180
6.6 Catalyst Characterisation……………………………………………….184
6.6.1 BET Surface Area Measurement………………………………184
6.6.2 Temperature Programmed Reduction (TPR)………………...184
6.6.3 Transmission Electron Microscopy…………………………….185
6.6.5 Mössbauer Spectoscopy………………………………………..185
6.7 References……………………………………………………………….186
Chapter Seven:
Silica With Various Morphologies as a Binder/Support for iron Fischer-
xv
Tropsch Catalysts………………………………………………………...........187
7.1 Introduction……………………………………………………………...187
7.2 Experimental Procedure……………………………………………….190
7.2.1 Catalyst Synthesis……………………………………………...190
7.2.2 Catalyst Characterization……………………………………..191
7.2.3 Catalyst Evaluation…………………………………………….192
7.3 Results and Discussion……………………………………………….192
7.3.1 BET Surface Area Analysis…………………………………..192
7.3.2 Temperature Programmed Reduction (TPR) Study……….196
7.3.3 Transmission Electron Microscopy (TEM) Study…………..202
7.3.4 Reactor Study………………………………………………….209
7.3.5 Mössbauer Spectroscopy…………………………………….217
7.4 Conclusions……………………………………………………………221
7.5 References…………………………………………………………….222
Chapter Eight:
Conclusions……………………………………………………………….…..226
Appendix………………………………………………………………………234

xvi
List of Tables
Table 1.1. Elements used to date in the sol-gel process. p.8
Table 1.2. Some of the alkoxides used in sol-gel synthesis. p.12
Table 2.1. Effect of temperature on the morphology of silica. p.36
Table 2.2. Effect of varying %NH3 to water in NH4OH. p.40
Table 2.3. Effect of H2O/EtOH dilution. p.42
Table 2.4. Effect of varying time before the addition of NH4OH. p.45
Table 2.5. Effect of adding NH4OH under both static and stirring conditions
(rapid addition). p.47
Table 2.6. Effect of diffusion on the amount of tubes that form. p.48
Table 2.7. Effect of solvent on structure and number of tubes formed. p.49
Table 2.8. Effect of template on surface area. p.50
Table 3.1. Effect of temperature on the morphology of silica. p.73
Table 3.2. Effect of varying % NH3 to water in NH4OH. p.76
Table 3.3. Effect of H2O/EtOH dilution. p.79
Table 3.4. Effect of varying time before the addition of NH4OH. p.81
Table 3.5. Effect of adding NH4OH under both static and stirring conditions
(rapid addition). p.85
Table 3.6. Effect of stirring rate on the amount of tubes that form. p.85
Table 3.7. Effect of solvent on structure and number of tubes formed. p.87
Table 4.1. Effect of solvent on the particle size and structure of silica at 25
°C. p.100
xvii
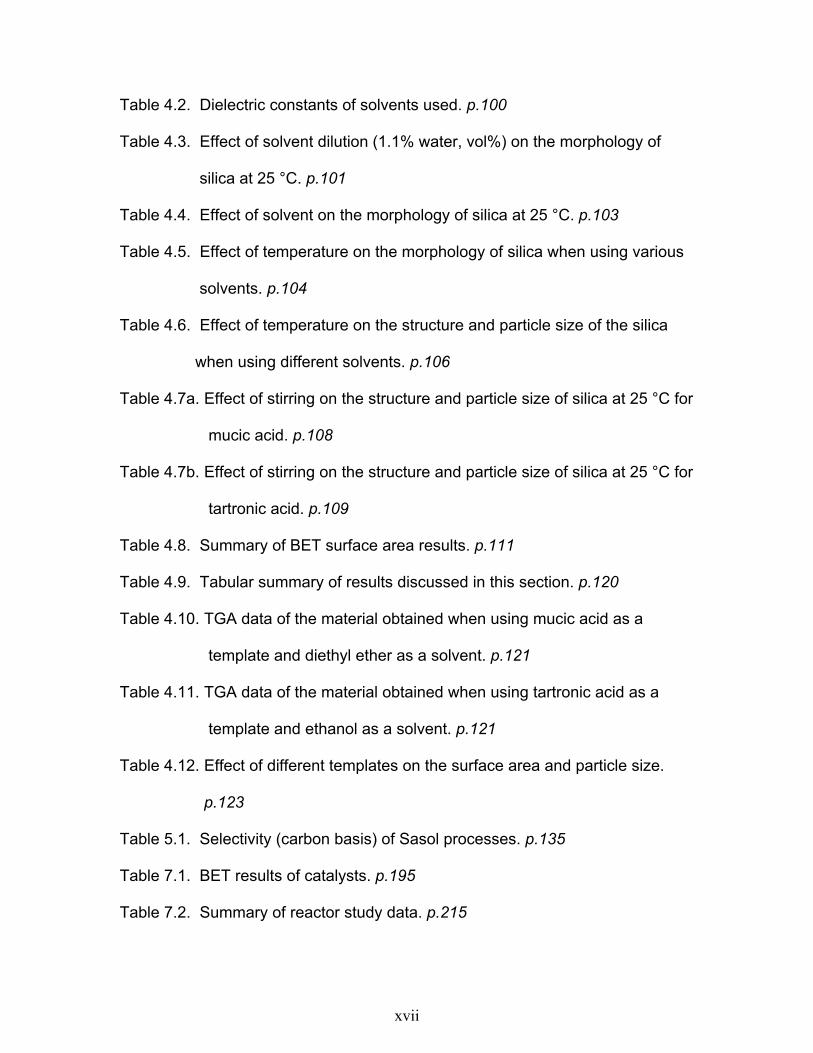
Table 4.2. Dielectric constants of solvents used. p.100
Table 4.3. Effect of solvent dilution (1.1% water, vol%) on the morphology of
silica at 25 °C. p.101
Table 4.4. Effect of solvent on the morphology of silica at 25 °C. p.103
Table 4.5. Effect of temperature on the morphology of silica when using various
solvents. p.104
Table 4.6. Effect of temperature on the structure and particle size of the silica
when using different solvents. p.106
Table 4.7a. Effect of stirring on the structure and particle size of silica at 25 °C for
mucic acid. p.108
Table 4.7b. Effect of stirring on the structure and particle size of silica at 25 °C for
tartronic acid. p.109
Table 4.8. Summary of BET surface area results. p.111
Table 4.9. Tabular summary of results discussed in this section. p.120
Table 4.10. TGA data of the material obtained when using mucic acid as a
template and diethyl ether as a solvent. p.121
Table 4.11. TGA data of the material obtained when using tartronic acid as a
template and ethanol as a solvent. p.121
Table 4.12. Effect of different templates on the surface area and particle size.
p.123
Table 5.1. Selectivity (carbon basis) of Sasol processes. p.135
Table 7.1. BET results of catalysts. p.195
Table 7.2. Summary of reactor study data. p.215

xviii
Table 7.3. Hyperfine interaction parameters of the Fe based catalysts. p.220
Table 8.1. Summary of types of silicas and properties that can be obtained by
using different templates and synthesis conditions. p.230
xix
List of Figures
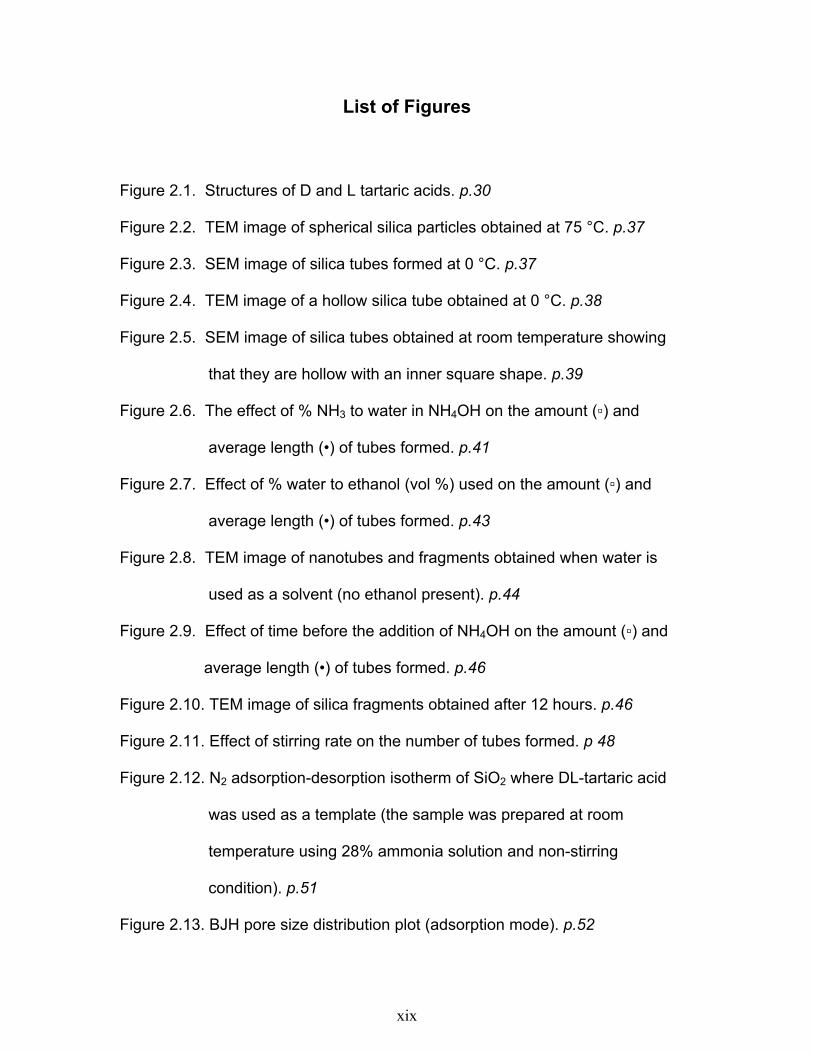
Figure 2.1. Structures of D and L tartaric acids. p.30
Figure 2.2. TEM image of spherical silica particles obtained at 75 °C. p.37
Figure 2.3. SEM image of silica tubes formed at 0 °C. p.37
Figure 2.4. TEM image of a hollow silica tube obtained at 0 °C. p.38
Figure 2.5. SEM image of silica tubes obtained at room temperature showing
that they are hollow with an inner square shape. p.39
Figure 2.6. The effect of % NH3 to water in NH4OH on the amount (▫) and
average length (•) of tubes formed. p.41
Figure 2.7. Effect of % water to ethanol (vol %) used on the amount (▫) and
average length (•) of tubes formed. p.43
Figure 2.8. TEM image of nanotubes and fragments obtained when water is
used as a solvent (no ethanol present). p.44
Figure 2.9. Effect of time before the addition of NH4OH on the amount (▫) and
average length (•) of tubes formed. p.46
Figure 2.10. TEM image of silica fragments obtained after 12 hours. p.46
Figure 2.11. Effect of stirring rate on the number of tubes formed. p 48
Figure 2.12. N2 adsorption-desorption isotherm of SiO2 where DL-tartaric acid
was used as a template (the sample was prepared at room
temperature using 28% ammonia solution and non-stirring
condition). p.51
Figure 2.13. BJH pore size distribution plot (adsorption mode). p.52

xx
Figure 2.14. TGA curve of the uncalcined silica material (room temperature, 28%
ammonia solution and non-stirring). p.53
Figure 2.15. Powder XRD pattern of silica nanotubes (room temperature, 28%
ammonia solution and non-stirring). p.54
Figure 2.16. IR spectrum of a silica material (recorded in KBr) obtained at room
temperature. p.55
Figure 3.1. Chemical structure of citric acid. p.66
Figure 3.2. Synthesis of citric acid templated silica materials by the sol-gel
method. p.71
Figure 3.3. TEM image of hollow spheres obtained at 75 °C. p.74
Figure 3.4. TEM image of tubes obtained at 0 °C. p.74
Figure 3.5. The effect of % NH3 to water in NH4OH on the amount (▫) and
average length (•) of tubes formed. p.77
Figure 3.6. TEM image of the mixture of hollow and filled spheres obtained when
16% NH3 (aq) concentration is used. p.78
Figure 3.7. TEM image of spherical particles (filled) obtained when 5% of water
is used. p.80
Figure 3.8. Effect of time before the addition of NH4OH on the amount (∆) and
average length (•) of tubes formed. p.82
Figure 3.9. TEM image of a hollow tube obtained after 6 hours. p.83
Figure 3.10. TEM image of silica fragments obtained after 12 hours. p.84
Figure 3.11. Effect of stirring rate on the number of tubes formed. p.86

xxi
Figure 3.12. N2 adsorption-desorption isotherm of SiO2 (ethanol/water, 0 °C).
p.88
Figure 3.13. BJH pore size distribution plot (adsorption mode). p.89
Figure 3.14. TGA curve of silica obtained at 0 °C. p.90
Figure 4.1. Structures of all templates used. p.97
Figure 4.2. TEM image of SiO2 obtained at 0 °C when ethanol is used as a
solvent. p.107
Figure 4.3. Nitrogen adsorption-desorption isotherm of SiO2 synthesised from
mucic acid (diethyl ether, 25 °C). p.112
Figure 4.4. BJH pore size distribution for SiO2 synthesised from mucic acid
(diethyl ether, 25 °C), desorption mode. p.113
Figure 4.5. Nitrogen adsorption-desorption isotherm of SiO2 synthesised from
mucic acid (diethyl ether, 75 °C). p.114
Figure 4.6. BJH pore size distribution for SiO2 synthesised from mucic acid
(diethyl ether, 75 °C), desorption mode. p.115
Figure 4.7. Nitrogen adsorption-desorption isotherm of SiO2 formed from
tartronic acid (ethanol, 25 °C). p.116
Figure 4.8. BJH pore size distribution for SiO2 synthesised from tartronic acid
(ethanol, 25 °C). p.117
Figure 4.9. Nitrogen adsorption-desorption isotherm of SiO2 formed from
tartronic acid, ethanol, 75 °C). p.118
Figure 4.10. BJH pore size distribution plot for SiO2 synthesised from tartronic
acid (ethanol, 75 °C), adsorption mode. p.119
xxii
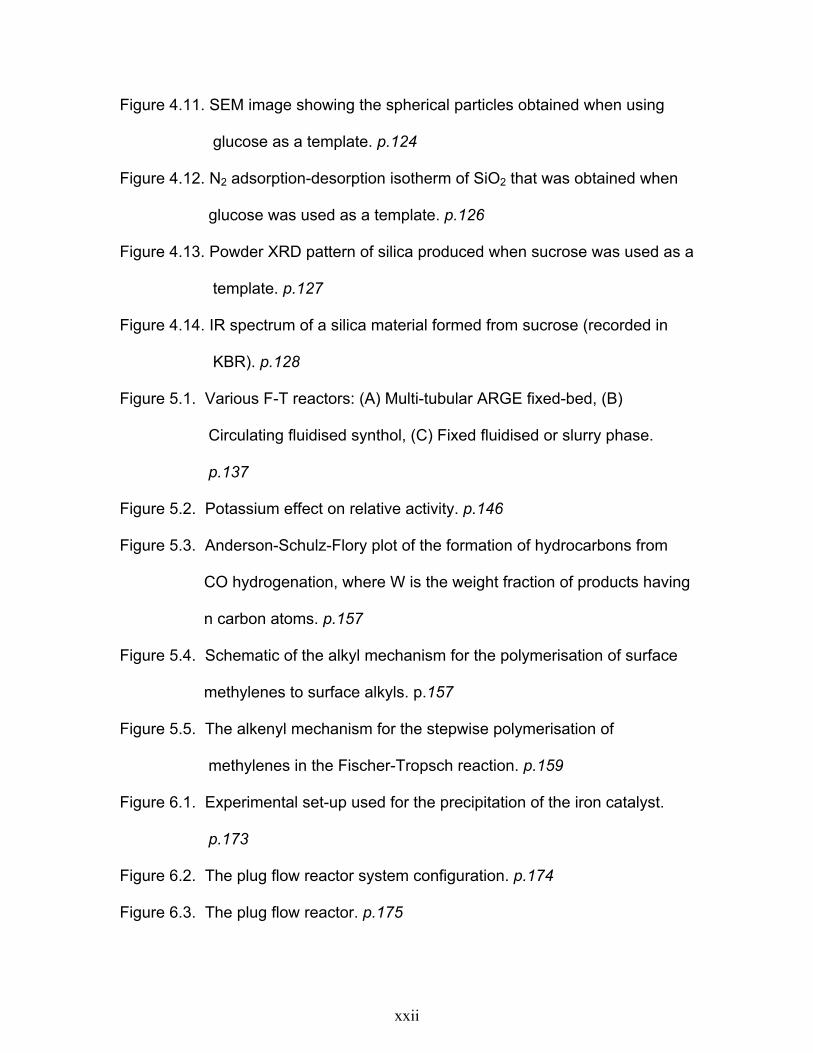
Figure 4.11. SEM image showing the spherical particles obtained when using
glucose as a template. p.124
Figure 4.12. N2 adsorption-desorption isotherm of SiO2 that was obtained when
glucose was used as a template. p.126
Figure 4.13. Powder XRD pattern of silica produced when sucrose was used as a
template. p.127
Figure 4.14. IR spectrum of a silica material formed from sucrose (recorded in
KBR). p.128
Figure 5.1. Various F-T reactors: (A) Multi-tubular ARGE fixed-bed, (B)
Circulating fluidised synthol, (C) Fixed fluidised or slurry phase.
p.137
Figure 5.2. Potassium effect on relative activity. p.146
Figure 5.3. Anderson-Schulz-Flory plot of the formation of hydrocarbons from
CO hydrogenation, where W is the weight fraction of products having
n carbon atoms. p.157
Figure 5.4. Schematic of the alkyl mechanism for the polymerisation of surface
methylenes to surface alkyls. p.157
Figure 5.5. The alkenyl mechanism for the stepwise polymerisation of
methylenes in the Fischer-Tropsch reaction. p.159
Figure 6.1. Experimental set-up used for the precipitation of the iron catalyst.
p.173
Figure 6.2. The plug flow reactor system configuration. p.174
Figure 6.3. The plug flow reactor. p.175

xxiii
Figure 6.4. A typical spectrum using a TCD and a Carbosieve IIS column. p.179
Figure 6.5. The hydrocarbon separation using a Porapak Q column. p.179
Figure 6.6. The separation obtained using BP1 Megabore capillary column.
p.180
Figure 7.1. The proposed structure of a) 9% SiO2, b) 18% SiO2, c) 27% SiO2
catalysts. p.194
Figure 7.2. TPR profiles of catalysts a) Ruhrchemies, b) Nanotubes, c) Hollow
spheres, d) Stöber spheres. p.200
Figure 7.3. TPR profile of copper supported on silica. p.201
Figure 7.4. TEM images of the 18Ru catalyst. p.204
Figure 7.5. Low and high magnification TEM images of the 18Nano catalyst.
p.205
Figure 7.6. TEM images of the 18Holo catalyst. p.206
Figure 7.7. TEM images of the 18Stob catalyst. p.206
Figure 7.8. TEM image of a 9Ruhr catalyst. p.207
Figure 7.9. TEM images of the 9Nano catalyst. p.207
Figure 7.10. a) TEM image of a 9Holo catalyst, b) TEM image showing some
broken hollow spheres. p.208
Figure 7.11. Low and high magnification TEM images of the 9Stob catalyst.
p.208
Figure 7.12. Effect of support type and content on catalyst activity and stability: a)
9% SiO2, b) 18% SiO2, c) 27% SiO2. p.212
Figure 7.13. Selectivities of catalysts. p. 216

xxiv
Figure 7.14. Olefin to paraffin ratios of catalysts. p.216

xxv
List of Abbreviations and Symbols
PART I
AN - Nucleophilic addition
aq - Aqueous
BET - Brunaer, Emmett and Teller
°C - Degrees celcius
BJH - Barret, Joyner and Halenda
EtOH - Ethanol
Fig. - Figure
H2O - Water
IR - Infrared
KV - Kilovolts
K - Kelvin
N - Coordination number
NH4OH - Ammonium hydroxide
NH3 - Ammonia
nm - Nanometer
Pa - Pascals
SN - Nucleophilic substitution
SEM - Scanning Electron Microscopy
SiO2 Silica

xxvi
TBOT - Tetrabutylorthotitanate
TEOS - Tetraethylorthosilicate
TEM - Transmission Electron Microscopy
TGA - Thermogravimetric Analysis
µm - Micrometer
Vol % - Volume percent
XRD - X-ray diffraction
Z - Oxidation state
PART II
α - Alpha
ASF - Anderson, Schulz and Flory
AC2,cal - Area of the C2 hydrocarbon in the calibration gas
AHC,i - Area of the ith hydrocarbon
Ar - Argon
Arin - Area of the argon peak in the feed
Arout - Area of the argon peak in the product
BHF - Hyperfine magnetic field
BET - Brunaer, Emmett and Teller
CFB - Circulating Fluidised Bed
CH2 - Methylene
CO - Carbon monoxide

xxvii
CO2 - Carbon dioxide
COin - Area of the CO peak in the feed
COout - Area of the CO peak in the product
Cu - Copper
Χ’-Fe2.5C - Chi carbide
ε'-Fe2.2C - Epsilon prime carbide
Fin - Gas flow rate into the reactor (ml/s)
Fout - Gas flow rate out of the reactor (ml/s)
Fe - Iron
FFB - Fixed Fluidised Bed
FID - Flame Ionisation Detector
Fig. - Figure
F-T - Fischer-Tropsch
FTS - Fischer-Tropsch synthesis
G.C - Gas chromatograph
GHSV - Gas hourly space velocity
h - Hour
H2 - Hydrogen
HTFT - High Temperature Fischer-Tropsch
IS - Isomeric shift
K - Potassium
KNO3 - Potassium nitrate
LTFT - Low Temperature Fischer-Tropsch

xxviii
mi - Mass of component i
Mi - Moles of type i hydrocarbons
ml - Mililiters
nm - Nanometer
PFR - Plug Flow Reactor
PSD - Pore size distribution
QS - Quadruple splitting
rCO - Specific activity (mmol CO reacted /g /s)
rp - Rate of chain propagation
rt - Rate of chain termination
Rfi - Response factor of the ith hydrocarbon
S - Mass fraction of component i
SAS - Sasol Advanced Synthol
SEM - Scanning Electron Microscopy
SiO2 - Silica
SSBR - Sasol Slurry Bed Reactor
TCD - Thermal Conductivity Detector
TEM - Transmission Electron Microscopy
TFBR - Tubular Fixed Bed Reactor
TPR - Temperature Programmed Reduction
µm - Micrometre
µS - microSiemen
UHP - Ultra High Purity

xxix
Wn - Weight fraction of product having n atoms
WGS - Water-gas-shift
XC2,cal - Mole fraction of the C2 hydrocarbon in the calibration
gas
XHC,i - Mole fraction of the ith hydrocarbon

1
PART I
SYNTHESIS OF SILICA MATERIALS BY THE SOL-GEL
METHOD

2
CHAPTER ONE
THE SYNTHESIS OF INORGANIC MATERIALS BY
SOL-GEL PROCESSING: A REVIEW
1.1 Introduction
The creation of powerful new materials for innovative applications is one of
the big scientific and technical challenges of our day. The sol-gel route,
because it controls the variables involved in solid synthesis, can be
considered as an extremely useful way of preparing these advanced
materials. Therefore identifying and controlling the early stages of the sol-gel
reaction process is vital to understanding many advanced material
developments and applications.
This portion of the thesis provides a short review of the preparation of
inorganic materials (from molecular precursors) using the sol-gel technique.
Following a general introduction to the background of sol-gel chemistry, the
synthesis and applications of sol-gel chemistry, the role of templates in sol-gel
synthesis, and the synthesis of sol-gel oxide supports with potential use in
catalysis is then described.

3
1.1.1 Terminology1
Prior to a discussion of the use of the sol-gel technique to synthesize
inorganic materials, some terms used in the sol-gel literature are described
below.
A colloid is defined as a suspension in which the dispersed phase is so small
(~1 – 1000 nm) that gravitational forces are negligible and interactions are
dominated by short-range forces, such as van der Waals attraction as well as
surface charges. A sol is a colloidal suspension of solid particles in a liquid. A
gel consists of continuous solid and fluid phases of colloidal dimensions. In
the sol-gel process, the precursors for the preparation of a colloid consist of a
metal or metalloid element surrounded by various ligands (appendages not
including another metal or metalloid atom). For example, a common precursor
used to synthesize aluminium oxide is an organic compound such as
Al(OC4H9)3. The latter is an example of an alkoxide, the class of precursors
most widely used in sol-gel studies.
Metal alkoxides are members of the family of metalorganic compounds, which
have an organic ligand attached to a metal or metalloid atom. The most
thoroughly studied example is tetraethylorthosilicate (TEOS), Si(OC2H5)4.
Organometallic compounds are defined as having direct metal-carbon bonds,
not metal-oxygen-carbon linkages as in metal alkoxides; thus alkoxides are
not true organometallic compounds, although this usage is frequently found in
the literature.
4
A polymer is an enormous molecule (also called a macromolecule) formed
from hundreds of units called monomers. A monomer is capable of forming at
least two bonds. An oligomer is a molecule of intermediate size – much larger
than a monomer, but smaller than a polymer.
If a monomer can make more than two bonds, then there is no limit on the
size of the 3-D molecule that can be formed from the monomer. If one
molecule reaches macroscopic dimensions and extends throughout the
solution, the substance formed is a gel. Thus, a gel is a substance that
contains a continuous solid skeleton enclosing a continuous liquid phase, both
of colloidal dimensions. The continuity of the structure gives elasticity to the
gel. Continuity means that one could travel through the solid phase from one
side of the sample to the other without having to enter the liquid; conversely,
one could make the same trip entirely within the liquid phase. If the smallest
dimension of the gel is greater than a few millimetres, the object formed is
generally called a monolith.
The term aging is applied to the process of change in structure and properties
after gelation. Drying by evaporation under normal conditions gives rise to
capillary pressure that causes shrinkage of the gel network. The resulting
dried gel, called a xerogel, is often reduced in volume by a factor of 5 to 10
compared to the original wet gel. If the wet gel is placed in an autoclave and
dried under supercritical conditions, there is no interface between liquid and
vapour, so there is no capillary pressure and relatively little shrinkage. This
process is called supercritical drying and the product produced is called an
5
aerogel. The gels may indeed be mostly air, having volume fractions of solid
as low as ~1 %. They are the lowest density materials known.
Xerogels and aerogels are useful in the preparation of dense ceramics, but
they are also interesting in themselves because their high porosity and
surface area make them useful as catalytic substrates, filters and so on. Most
gels are amorphous (i.e. non-crystalline), even after drying, but many
crystallize when heated at high temperatures or calcined. It is found that the
dried gel contains many labile sites that offer opportunities for new chemical
reactions.
1.1.2 Principles of the Sol-Gel Process
The sol-gel process involves the formation of a sol followed by the formation
of a gel. The gel is then dried to remove the organic solvents and leave a
porous network. The sol-gel approach to material synthesis is based on the
preparation of hydrolysable molecular precursors, mostly metal or semi-metal
alkoxides e.g. (Si(OR)4) due to their high reactivity.
Hydrolysis and polycondensation reactions lead to the formation of oxo-
polymers or metal oxides.1 The mild conditions used in the sol-gel process
allow the introduction of organic molecules inside an inorganic network.2,3
These fundamental chemical processes are influenced by several parameters
which, once they are understood for a particular chemical system, allow the
control of the homogeneity (or controlled heterogeneity) of the nano- and
micro- structure of the derived material.4

6
‘Design’ of sol-gel materials therefore is possible, in a simplified sense, by
variation of the chemical composition of the molecular building blocks and by
variation of the nano- and micro-structure. Both influence the properties of the
final material to a very high degree.
In general, the sol-gel process offers significant control over specific surface
area, porosity, pore volume and pore size distribution of the material.
1.1.3 History of the Sol Gel Process
The first metal alkoxide was prepared from SiCl4 and ethanol by Ebelmen5 (in
1845) who found that the compound gelled on exposure to the atmosphere.
This metal alkoxide was called silicon tetraethoxide (also variously known as
tetraethoxysilane, tetraethylorthosilicate or TEOS)
The discovery of the exceptional tendency of organosilicon compounds to
form siloxane polymers containing organic side groups (silicones) caused an
explosion of activity in the 1930’s (almost a century later) that established a
chemical and physical basis for understanding the processes of hydrolysis
and condensation.1 The process of supercritical drying to produce aerogels
was invented by Kistler6 in 1932 who was interested in demonstrating the
existence of the solid skeleton of the gel, and in studying the structure. The
rediscovery of aerogels took place in the 1960’s. In 1968 Nicolaon and
Teichner7 proposed a new method for the preparation of silica aerogels by
carrying out the sol-gel transition in the very solvent which was removed at
supercritical conditions. This method allowed fast processing of the reactants
7
(a few hours), compared with the technique proposed by Kistler6 (several
weeks). This method was later extended to the preparation of other single-
and multi-component inorganic oxides.8 Hence, this method can be
considered as one of the most important advances in sol-gel science.9
As far as xerogel powders are concerned, the vital breakthrough in the late
1960’s was the demonstration that the process could be used to control the
shape and size of solid particles; in particular, high-density spherical particles
with narrow controlled size ranges could be achieved. One example of this
was demonstrated by Stöber10 and co-workers in 1968 when they synthesized
monodispersed spherical particles with uniform sizes (0.05 – 2 µm) by the sol-
gel method.
Silica gels are the oldest and most closely studied gels, but as Table 1.1
shows, there are now many systems that can be gelled from suitable sols,
including almost half of the periodic table.

8
Table 1.1. Elements used to date in the sol-gel process1
Li Y Cr B N
Na La Fe Al P
K Nd Co In As
Cs Th Ni C Sb
Mg U Pd Si O
Ca Ti Au Ge S
Sr Zr Zn Sn F
Ba Hf Cd Pb
Hierarchial structures that incorporate inorganic-organic materials to form
mesoscopic structures have been designed and synthesized in recent years.
Morphological control as well as the handling and texture of mesoporous
materials are extremely important for many applications. Mesoporous silicate
materials with a variety of morphologies have been synthesized for many
applications.11-19
Recently, there have been reports of mesoporous materials with various
particle shapes such as fibers, spheres, ropes, discoids, toroids, hollow tubes,
hollow spheres and dodecahedra.19-28 The templates that have been used to
date are surfactants, organogelators, hydroxy carboxylic acids, as well as
porous or fibrous materials such as carbon nanotubes and membranes.

9
1.1.4 Advantages of the Sol-Gel Process
One of the main advantages of the sol-gel process is that it allows careful
control of the size and morphology of clusters/particles in the sol or gel during
the early processing stages, so that high quality end products (in the form of
powders, films or coatings) can be developed to fulfil specific demands.29,30
The mild reaction conditions allow the incorporation of organic moieties into
inorganic networks. These organic-inorganic hybrid materials are particularly
useful because components with different combinations of properties can be
blended together.
The general properties of materials synthesized by the sol-gel method are
high purity, better homogeneity, controlled porosity combined with the ability
to form large surface area materials at low temperatures, possibility of
preparing multi-component systems with broad ranges of compositions and
good dispersion of minor components.9
1.2 Sol-Gel Chemistry
Considering the key role of sol-gel reactions in the preparation of organic-
inorganic hybrid materials, it is difficult to understand their preparation without
the basic knowledge of the sol-gel process.31 Over the past four decades
numerous studies have been carried out in the field of sol-gel chemistry, and
great progress has been made in presenting a reaction mechanism consistent
with the data.1
The three-step mechanism to describe the sol-gel process is as follows:32

10
Step 1: Hydrolysis of a metal or semi-metal alkoxide to form a hydroxylated
product and the corresponding alcohol.
Hydrolysis:
M(OR)4 + xH2O → M(OH)4 + xROH (1.1)
M = Si, Ti, Al, Zr, etc
R = Alkyl group
This mechanism is highly dependent on pH and can be catalysed under acidic
or basic conditions.
Step 2: Condensation between an unhydrolyzed alkoxide group and a
hydroxyl group or between two hydroxyls eliminates the solvent (water and
alcohol) and forms a colloidal mixture called the sol.
Condensation:
M OH + RO M M O M + ROH
(2.1)
M OH + HO M M O M + H2O
(2.2)
Step 3: Polycondensation between these colloidal sols as well as additional
networking eventually results in the generation of a porous three-dimensional
network.

11
Polycondensation:
x( M O M ) ( M O M )x
(3.1)
Both hydrolysis and condensation occur by nucleophilic substitution (SN)
mechanisms that involve three steps: nucleophilic addition (AN), proton
transfer within the transition state, and removal of the protonated species as
either alcohol or water.
The sol-gel process generally starts with alcoholic or other low molecular
weight organic solutions of monomeric metal or semi-metal alkoxide
precursors M(OR)n and water. M represents a network-forming element such
as Si, Al, Ti, B, etc. Table 1.2 shows some of the alkoxides that have been
used in the sol-gel synthesis.

12
Table 1.2. Some of the alkoxides used in sol-gel synthesis34
Element Alkoxide Element Alkoxide
Aluminium Al(O-isoC3H7)3 Phosphorus P(O-C4H9)3
Al(O-secC4H9)3 Silicon Si(O-CH3)4
Barium Ba(O-C3H7)2 Si(O-C2H5)4
Boron B(O-CH3)3 Sodium Na(O-C4H9)
Calcium Ca(O-C2H5)2 Titanium Ti(O-C2H5)4
Ti(O-C4H9)4
Ti(O-C5H7)4
Germanium Ge(O-C2H5)4 Yttrium Y(O-C2H5)3
Iron Fe(O-C3H7)3 Zirconium Zr(O-isoC3H7)4
Niobium Nb(O-C2H5)4 Zr(O-C4H9)4
Generally, both the hydrolysis and condensation reactions occur
simultaneously once the hydrolysis reaction has been initiated. The
thermodynamics of these reactions are governed by the strength of the
entering nucleophile, the electrophilicity of the metal, and the partial charge
and stability of the leaving group.
As can be seen in eqs. 1.1, 2.1 and 2.2, both hydrolysis and condensation
steps generate low molecular weight by-products such as alcohol and water.
The small molecules must be removed from the system, and such removal
would lead in the limit, to a tetrahedral SiO2 network if the species M were
silicon. The removal of these by-products also contributes to the high
shrinkage that occurs during the classical sol-gel process.33
13
For non-silicate metal alkoxides e.g. aluminium alkoxide, generally no catalyst
is needed for the hydrolysis and condensation reactions. The reactions are
very rapid. In the case of silicon based metal alkoxides, the hydrolysis and
condensation reactions typically proceed with either an acid or base as
catalyst. Therefore, the structure and or morphology of the resulting network
strongly depends on the nature of the catalyst and the pH of the reaction.31
1.3 Role of templates in the sol-gel synthesis
Since the sol-gel method has emerged as a versatile way of obtaining new
types of materials with controlled microstructures which can be ‘tailored’
chemically under low temperatures. Many synthetic routes and strategies
have been developed to yield a wide diversity of materials with various
frameworks, chemical compositions and pore structures. So far, most of these
materials were synthesized by combining template technology with the sol-gel
method.
The template technology uses template agents such as organic molecules
(e.g. surfactants, organogelators, and hydroxycarboxylic acids, etc), inorganic
or organometallic molecules, polymers or solid particles, to intercross or
arrange with the material’s major components by the way of co-operation or
self-assembly to form a new organic-inorganic system. Porous nano-
structured materials are then achieved by the elimination of templates by
calcination or extraction.35,36

14
Since Kresge et al37 of Mobil Corporation developed a class of mesoporous
materials of the M41S family with narrow pore size distributions by utilizing
ionic surfactants as structure-directing agents, more explorations and studies
have been done on the many aspects of template technology such as
synthesis process, synthesis mechanism,38 template agent’s roles and the
resulting material structures and properties.39,40 Hence the templated sol-gel
method appears to be a new way of tailoring porous structures.
In the surfactant templating route to mesoporous materials, pore diameters
can be controlled by changing the alkyl chain length of the surfactant,41-43 or
by adding auxiliary hydrocarbons,41,44 or by adjusting the initial pH of the
synthesis mixture.45 Whereas in the non-surfactant templating route the
material’s pore diameters can be controlled by varying the template
concentration. (But the control ability of pore diameter by template content is
limited, in that the template molecules will crystallize from the gel at high
template content46)
The template-directed sol-gel method cannot just be used to control the pore
diameter of the materials but it can also be used to give wide-ranging
materials with various external shapes and internal structures. For example, in
the case where surfactants are used to prepare mesoporous materials such
as MCM41, surfactant assemblies act as templates for hexagonally packed
mesopores. As for synthesis of tubular materials, various organic and
inorganic templates have been used associated with the sol-gel synthesis. For
example, hollow tubes of amorphous silica have been prepared by using the

15
external surface of self-assembled phospholipids fibers,47 organic gel
filaments,48 viroid cylinders,49 anodic alumina nano array,50 and cylindrical
assemblies of surfactant.51 All the templates for the silica tube described, are
however specialized molecules or arrays that are costly. Thus the studies that
were carried out by Nakamura and Matsui23 to prepare silica tubes by using
simple organic acids such as D,L-tartaric acid seem to be a more attractive
option to use when preparing tubular materials.
1.4 Sol-Gel Synthesized Oxide Supports
Performance in many catalytic systems is not only known to be influenced by
the inherent catalytic activity of the active phase, but also by the textural and
physico-chemical properties of the support. The inherent preparative
advantages offered by the sol-gel method have prompted its use for
synthesizing many oxidic catalytic supports notably silica and alumina.
1.4.1 Silica
High purity silica is used in a variety of industrial applications. It is used as a
catalytic support, a filler, in fused silica wares, in optical glasses and as a
waveguide.34 Silica gels are also used as thermal and accoustic insulators.
One of the methods of obtaining pure silica is by the controlled hydrolysis of
silicon alkoxides.52-55
The discovery of the exceptional tendency of organosilicon compounds to
form siloxane polymers containing organic side groups (silicones) caused an
explosion of activity in the 1930’s that established a chemical and physical

16
basis for understanding the processes of hydrolysis and condensation1. The
+4 oxidation state of silicon (z = 4) is the only important oxidation state in the
chemistry of silicon in naturally occurring systems55 and the coordination
number of silicon, (N), is most often 4. Compared to aluminium and the
transition metals, silicon is generally less electropositive.56 This renders silicon
comparatively less susceptible to nucleophilic attack.1 Si-C bonds are thus
hydrolytically stable and allow an easy anchoring of functional organic
groups.4 Also, since N = z, coordination expansion does not spontaneously
occur in silicon alkoxides on reacting with nucleophilic reagents.1 These
factors make the kinetics of hydrolysis and condensation considerably slower
than that observed for alumina or transition metal alkoxide systems.1
Consequently, hydrolysis and condensation reactions in silicon-based
alkoxide systems are usually facilitated by acid or base catalysis. For common
silicon alkoxides, the hydrolysis rate is high under an acidic environment
relative to that of condensation. Acid catalysis, therefore, promotes the
development of more linear or polymer-like molecules in the initial stages of
the reaction. On the other hand, base catalysis results in a higher
condensation rate.31 Thus this environment tends to produce more of a
dense-cluster growth leading to silica with dense, colloidal particulate
structures.1, 33, 57,58
Silica can be used as a metal catalyst support (e.g. in the Fischer-Tropsch
reaction) and several research groups continue to express interest in the
preparation of amorphous silica prepared by the sol-gel method.59-61 Silica is

17
also active in some oxidation reactions such as methanol oxidation,62
methane to formaldehyde oxidation63 and ammoxidation.64 The main
advantages of sol-gel prepared silica are compositional homogeneity and low
processing temperatures. Normally the alkoxide is dissolved in alcohol and
hydrolyzed by the addition of water under acidic, neutral or basic conditions,
yielding SiO2 as the final product.
1.4.2 Alumina65
Alumina is widely used in various industries as a support, catalyst and
sorbent. Its role as a support in catalysis is enhanced since it can be obtained
with a wide range of surface area values. In particular, an alumina-based
oxide support with high surface area (at 1000 ºC), is used in automobile
exhaust gas purification catalysts.66 Combustion catalysts used at high
temperature require an even more thermo-stable support. Many experiments
have been performed to improve the thermo-stability of alumina-based
supports. The addition of barium oxide or lanthanum oxide has proven to be
extremely effective in improving the thermo-stability of the support. Silica-
doped aluminas have also been reported to show high surface area.67 Very
often, however, these additives change not only the thermo-stabilities but also
other properties associated with the original support.
Developing a synthesis procedure for high surface area alumina with no
additive is certainly an approach to the production of a more effective
catalyst.67 Aluminas prepared from various aluminium salts are generally
contaminated with residual ions such as alkaline cations or acid residues.

18
Aluminium alkoxide has been used as an uncontaminated starting material to
obtain pure alumina of high surface area because the alkoxide is easily
purified by distillation. Conventionally, alumina synthesis by hydrolysis of the
alkoxide has been carried out in solvents such as water, common alcohols or
hydrocarbons such as benzene. Since Yoldas33 developed the sol-gel
technique, preparation conditions for the formation of monolithic alumina gel
have been extensively studied by regulating reaction conditions such as
temperature, concentration, pH, solvent, drying method etc.1
1.4.3 Other Sol-Gel Generated Simple Oxides
Most literature references to the applications of the sol-gel method for catalyst
preparation have been reported for silica or alumina-based catalytic systems.
Occasionally though, the synthesis of other simple oxidic catalysts by the sol-
gel route have been reported. Some examples are listed below.
Lopez et al.68 discussed the importance of preparing MgO samples with
different degrees of surface hydroxylation in order to obtain a better
understanding of the behaviour (activity, selectivity and deactivation) of metal
catalysts dispersed on these supports. For that purpose, they prepared MgO
starting from magnesium ethoxide using a series of different catalysing agents
and polycondensation reactions. The control of pH and the thermal treatment
allowed preparation of magnesia with controlled levels of surface –OH groups.
Nishiwaki et al.69 prepared TiO2 (anatase) from titanium isopropoxide in propyl
alcohol. Solids were obtained by slowly pouring a Ti(OC3H7)3 solution into

19
distilled water with vigorous stirring. These materials were dried and calcined
at 420 ºC in air. Depending on the concentrations of the solutions, the particle
sizes could be varied from 4 to 40 nm. The study revealed that the smaller the
particle size, the greater the surface area of the sample. The effect was
explained on the grounds of charge imbalance at surface species, Ti(1)-O-
Ti(2), where Ti(1) and Ti(2) represent Ti atoms in different environments. The
smaller the particle size, the higher the number of titanium atoms with low
coordination numbers that were present at the surface.
Carturan et al.70 proposed a sol-gel method to prepare catalysts by coating
glass microspheres with inorganic oxides obtained from alkoxide solutions.
Glass spheres (0.04 - 0.08 mm of diameter) were wetted with alcoholic
solutions of several selected alkoxides including Zr(OPr)4 and Fe(OEt)3. The
damp material was exposed to moisture to hydrolyse the alkoxide and then
dried by slow solvent evaporation followed by heating at 400 ºC. The final
product maintained the spherical geometry of the initial carrier and, when
using dilute alkoxide solutions, the single glass pearls did not collapse to
aggregates. The specific surface area was between 200 and 300 m2/g. In this
way, a cheap support, glass, can be used to disperse active oxide catalysts.
The method is also interesting from the point of view of the design of catalytic
reactors, leading to catalysts with good mechanical properties and avoiding
diffusion problems which can appear when dealing with bulk gel materials.
Mixed-metal alkoxide systems are also of great interest because of their
potential chemical and physical properties.31 For example the petroleum

20
industry uses metallo-silicates as catalysts for cracking processes, for the
alkylation of benzene with propylene and ethylene, and adsorbents. These
alkoxide systems can be prepared by the sol-gel process. Kolesnikov et al.71
synthesized various metallo-silicates such as aluminium silicate and zirconium
silicate and these materials were tested for cumene conversion. Increase in
catalytic activity, by up to a factor of 2, were recorded.
Mixed oxides of the type SiO2-AlPO4, SiO2-Al2O3-AlPO4 and SiO2-Al2O3 were
obtained by Wijzen et al.72 via hydrolysis of tetraethylorthosilicate (TEOS) in
the presence of aqueous solutions of aluminium salts and/or phosphoric acid.
The solids were characterised and showed high values of both their BET
surface area and pore volume and a good thermal re-crystallisation stability.
Similarly, titania-silica sonogels (gels prepared by ultrasonic mixing) of very
high surface area (800 m2/g) have been prepared by Bernal and co-workers73
using TEOS and tetrabutyl orthotitanate (TBOT).
1.5 Conclusions
The sol-gel method is a fascinating new method for the generation of new
materials. This is because the main advantage of the sol-gel process is that it
allows careful control of the size and morphology of clusters/particles in the
sol or gel during the early process stage, so that high quality end products (in
the form of powders, films or coatings) can be developed to fulfil specific
demands. The template-directed sol-gel method makes the sol-gel method
even more versatile because wide-ranging materials with various external
shapes and internal structures can be synthesized. The inherent preparative

21
advantages offered by the sol-gel method have prompted its use for
synthesizing many oxidic catalytic supports notably silica and alumina.

22
1.5 References
1. C.J Brinker and G. Scherer, Sol-Gel Science: The Physics and
Chemistry of Sol-Gel Processing, (Academic Press, London, 1990).
2. C. Sanchez, F. Robot and B. Lebeau, J. Mater. Chem., 9, 35, (1999).
3. G.L. Wilkes, B. Orler and H.H. Huang, Polym. Prep., 26, 300, (1985);
(b) G-S. Sur and J.E. Mark, Eur. Polym. J, 21, 1051, (1985); (c) H.
Schmidt, A. Kaiser, H. Patzelt and H. Sholze, J. Phys., 43, 275, (1982).
4. U. Schubert, J. Chem. Soc., Dalton Trans, 3343, (1996).
5. M. Ebelmen, Ann. Chim. Phys., 15, 319, (1845).
6. S.S. Kistler, J. Phys. Chem., 36, 52, (1932).
7. G.A. Nicolaon and S.J. Teichner, Bull. Soc. Chim. France, 1906,
(1968).
8. S.J. Teichner, G.A. Nicolaon, M.A. Vicarini and G.E.E. Gardes, Adv.
Coll. Sci., 5, 245, (1976).
9. M.A. Cauqui and J.M. Rodríquez-Izquierdo, J. Non-Cryst. Solids,
147,148, 725, (1992).
10. W. Stober, A. Fink and E. Bohn, J. Coll. Int. Sci., 26, 62, (1968).
11. P.T. Tanev, Y. Liang and T.J.Pinnavaia, J. Am. Chem. Soc., 119, 8616,
(1997).
12. P.T. Tanev and T.J. Pinnavaia, Science, 271, 1267, (1996).
13. S.H. Tolbert, T.E. Schäffer, J. Feng, P.K. Hansma and G.D. Stucky,
Chem. Mater., 9, 1962, (1997).
14. Q. Huo, D. Zhao, J. Feng, K. Weston, S.K. Buratto, G.D. Stucky, S.
Schächt and F. Schüth, Adv. Mater., 9, 974, (1997).

23
15. P. Yang, T. Deng, D. Zhao, P. Feng, D.J. Pine, B.F. Chmelka, G.M.
Whitesides and G.D. Stucky, Science, 282, 2244, (1998).
16. S.S. Kim, W. Zhang and T.J. Pinnavaia, Science, 1998, 282, 1302,
(1998).
17. Q. Huo, J. Feng, F. Schüth and G.D. Stucky, Chem. Mater., 9, 14,
(1997).
18. S.M. Yang, H. Yang, N. Coombs, I. Sokolov, C.T. Kresge and G.A.
Ozin, Adv. Mater., 11, 52, (1999).
19. P.J. Bruinsma, A.Y. Kim, J. Liu and S. Baskaran, Chem. Mater., 9,
2507, (1997).
20. S.S. Park, C.H. Lee, J.H. Cheon and D.H. Park, J. Mater. Chem., 11,
Advance Article, (2001).
21. (a) M. Trau, N. Yao, E. Kim, Y. Xia, G.M. Whitesides and I.A. Aksay,
Nature, 390, 674, (1997). (b) H. Yang, N. Coombs and G.A. Ozin, Adv.
Mater., 9, 811, (1997).
22. S. Oliver, A. Kuperman, N. Coombs, A. Lough and G.A. Ozin, Nature,
1995, 378, 47, (1995).
23. H. Nakamura and Y. Matsui, J. Am. Chem. Soc., 117, 2651, (1995); (b)
H. Nakamura and Y. Matsui, Adv. Mater., 7, 871, (1995).
24. L. Wang, S. Tomura, F. Ohashi, M. Maeda, M. Suzuki and K. Inukai, J.
Mater. Chem., 11, 1465, (2001).
25. Y. Zhang, Y. Bando, K. Wada and K. Kurashima, J. Mater. Sci. Lett.,
18, 1911, (1999).
26. L. Sudheendra and A.R. Raju, Bull. Mater. Sci., 22, 1025, (1999).

24
27. F. Miyaji, S.A. Davis, J.P.H. Charmant and S. Mann, Chem. Mater., 11,
3021, (1999).
28. C.E. Fowler, D. Khushalani and S. Mann, J. Mater. Chem., 11, 1968,
(2001).
29. M.Z. Hu, J.T. Zielke, C.H. Byers, J.S. Lin and M.T. Harris, J. Mater. Sci.
Lett., 35, 1957, (2000).
30. L.L. Hench and J.K. West, Chem. Rev., 90, 33, (1990).
31. J. Wen and G.L. Wilkes, Chem. Mater., 1996, 8, 1667.
32. C.M. Ingersol and F.V. Bright, Chemtech, 1997, January, 26.
33. B.E. Yoldas, J. Mater. Sci., 1986, 21, 1086.
34. R.H. Hoppener, and H.K. Bowen., Adv. Ceram. Mat., 1988, 3(6), 595.
35. A. Ayral, C. Balzer, T. Dabadie, et al., Catal. Today, 25, 219, (1995).
36. N.K. Raman and C.J. Brinker, J. Membr. Sci., 105, 273, (1995).
37. C.T. Kresge, M.E. Leonowicz, W.J. Roth, J.C Vartuli and J.S. Beck,
Nature, 359, 710, (1992).
38. G. Bellussi, C. Perego, A. Carati, et al., Stud. Surf. Sci. Catal., A84, 85,
(1994).
39. J.C. Vartuli, K.D. Schmitt, C.T. Kresge, et al., Chem. Mater., 6(12),
2317, (1994).
40. B.Z. Sophie and L.O. Mario, Catal. Rev. Sci. Eng., 40(3), 329, (1998).
41. J.S. Beck, J.C Vartuli, W.J. Roth, M.E. Leonowicz, C.T. Kresge, K.D.
Schmitt, C.T.W. Chu, D.H. Olson, E.W. Sheppard, S.B. McCullen, J.B.
Higgins and J.L. Schlenker, J. Am. Chem. Soc., 114, 10834, (1992).
42. S. Namba, A. Machizuki and M. Kito, Chem. Lett., 569, (1998).
43. P.T. Tanev and T.J. Pinnavaia, Science, 267, 865, (1995).

25
44. D. Zhao, Q. Huo, J. Feng B.F. Chemelka and G.D. Stucky, J. Am.
Chem. Soc., 120, 6024, (1998).
45. A. Wang and T. Kabe, Chem. Commun., 2067, (1999).
46. Y. Wei, D. Jin, T. Ding, W.H. Shih, X. Liu, S.Z.D. Cheng and Q. Fu,
Adv. Mater., 3, 313, (1998).
47. S. Baral and S. Schoen, Chem. Mater., 5, 145, (1992).
48. Y. Ono, K. Nakashima, M. Sano, Y. Kanckiyo, K. Inoue, J. Iiojo and S.
Shinkai, Chem. Commun., 1477, (1989).
49. W. Shenton, T. Douglas, M. Young, G. Stubbs and S. Mann, Adv.
Mater., 11, 253, (1999).
50. M. Zhang, Y. Bando and K. Wada, J. Mater., Res., 15, 387, (2000).
51. M. Harada and M. Adachi, Adv. Mater., 12, 839, (2000).
52. E.J. Brinker, K.D. Keeffer, D.W. Schaefer, and C.S. Ashley, J Non.
Cryst. Solids, 1982, 48, 47.
53. N. Toghe, G.S. Moore and J.D. Mackenzie, J. Non.Cryst. Solids, 1984,
63, 95.
54. M.A Butler, P.F. James and J.D Jackson, J. Mater. Sci., 1996, 31,
1675.
55. S.R. Kumar, P.K. Pillai and K.G.K. Warrier, Polyhedron, 1998, 17(10),
1699.
56. J. Livage, M. Henry and C. Sanchez, Sol-Gel Chemistry of Transtion
Metal Oxides, Progress in solid state chemistry (Plenum Press, 1989).
57. K.D. Keefer, Mater. Res. Soc. Symp. Proc., 1984, 32, 15.
58. D.W. Schaefer, J.P. Wilcoxon, K.D. Keefer, B.C. Bunker, R.K. Pearson,
I.M. Thomas and D.E. Miller, AIP Conf. Proc., 1987, 154, 63.

26
59. C. Sanchez and J. Livage, New J. Chem., 1990, 14, 513.
60. D. Ulrich, J. Non-Cryst. Solids, 1988, 100(1-30), 174.
61. P.A. Haas, Chem. Engr. Prog. 1989, April.
62. L. Cairati and F. Trifirò. J. Catal., 1983, 80, 25.
63. G.N. Kastanas, G.A. Tsigdinos and J. Schwank, Appl. Catal., 1988, 44,
83.
64. J.N. Amor, J. Catal., 1981, 20, 72.
65. V.I. Okafor, Synthesis, Characterisation and Evaluation of a Diverse
Range of Heterogeneous Catalysts, PhD Thesis, University of the
Witwatersrand, Johannesburg, 1998.
66. W.S. Briggs, in: Alumina Chemicals: Science and Technology
Handbook, ed. L.D. Hart, (The American Ceramic Society, Westerville,
Ohio, 1990).
67. B. Bequin, E. Garbowski and M. Primet, J. Catal., 1991, 127, 595.
68. T. López, I. García-Cruz and R. Gómez, J. Catal., 1991, 127, 75.
69. K. Nishiwaki, N. Kakuta and A. Ueno, J. Catal. 1989, 118, 498.
70. G. Carturan, G. Francchin, V. Gottardi and G. Navazio, J. Non-Cryst.
Solids, 1984, 63, 274.
71. I.M. Kolesnikov, A.V. Yuablonky, S.I. Kolesnikov, A. Busenna and M.Y.
Kiljanov, Preparation of Catalysts VI, eds. G. Poncelet, J. Martens, B.
Delmon, P.A. Jacobs and P. Grange, (Elsevier, Amsterdam, 1995).
72. F. Wijzen, A. Rulmont and B. Koch, Preparation of Catalysts VI, eds. G.
Poncelet, J. Martens, B. Delmon, P.A. Jacobs and P. Grange,
(Elsevier, Amsterdam, 1995).

27
73. S. Bernal, J.J. Calvino, M.A. Cauqui, J.M. Rodríguez-Izquierdo and H.
Vidal, Preparation of Catalysts VI, eds. G. Poncelet, J. Martens, B.
Delmon, P.A. Jacobs and P. Grange, (Elsevier, Amsterdam, 1995).

28
CHAPTER TWO
A SYSTEMATIC STUDY OF THE USE OF DL-
TARTARIC ACID IN THE SYNTHESIS OF SILICA
MATERIALS OBTAINED BY THE SOL-GEL METHOD1
2.1 Introduction
The synthesis of novel porous materials has recently attracted much attention
because of the potential applications of these materials in catalysis,
separation science, and nanotechnology.2 The sol-gel process has so far
been one of the most attractive ways of synthesizing these porous materials
because of the mild synthesis conditions required.3
Silica oxide nanotube materials are normally prepared by sol-gel processing in
the presence of a template. The kinds of templates that have been used so far
include porous or fibrous materials e.g. carbon nanotubes,4-6 nanoporous
membranes,7-9 and organic molecules.10-18
1Published in Journal of Sol-Gel Science and Technology, 28, 307-317, 2003
* Since this work was published a related paper by Miyaji et al20 has appeared on the use of
DL-tartaric acid as a template.
29
Porous or fibrous materials are used in the “direct” template method, where
they act as guides to the formation of nanotubes. In contrast organic
molecules also can act to bring about self-assembly between inorganic
precursors and organic templates and offer an alternative method in the
formation of inorganic nanotube materials. A detailed mechanism for the
formation of silica nanotubes in the presence of laurylamine hydrochloride as
template provides a useful model for envisaging the growth processes
involved in tube formation19 (see Appendix 1). So far organic templates that
have been used for silica nanotube formation are long chain surfactants,10-11
organogelators12-14 and organic hydroxycarboxylic acids.15-18
Nakamura and Matsui reported on the synthesis of silica materials with
different morphologies (tubes, spheres) using tartaric acid15 and citric acid16
as templates. The reactions were performed in an
ethanol/water/tetraethylorthosilicate (TEOS)/NH4OH reaction system under
static conditions. The authors obtained hollow silica nanotubes when using
DL-tartaric acid and worm-like structures when using citric acid. Recently
Wang et al.17 reported that citric acid could also be used to prepare silica
nanotubes. Wang et al. found that rapid addition of aqueous ammonia under
static conditions gave only uniform micrometer sized rods while slow addition
of aqueous ammonia under stirring conditions gave nanotubes. Hence it
appears that synthetic conditions play a key role in influencing the formation of
particular forms of silica. However, a detailed evaluation of the synthetic
parameters required to control the silica morphologies was not given. The
30
preparation of single silica nanotubes is still a major challenge as compared to
the synthesis of porous materials with integrated structures.
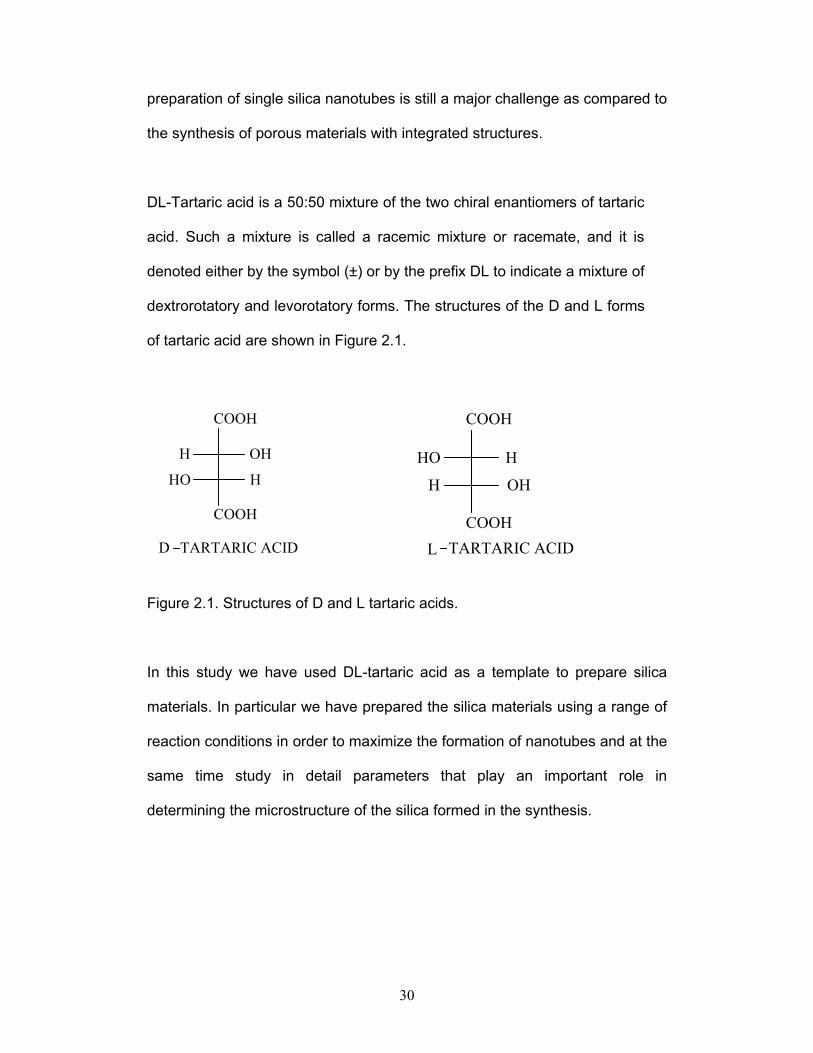
DL-Tartaric acid is a 50:50 mixture of the two chiral enantiomers of tartaric
acid. Such a mixture is called a racemic mixture or racemate, and it is
denoted either by the symbol (±) or by the prefix DL to indicate a mixture of
dextrorotatory and levorotatory forms. The structures of the D and L forms
of tartaric acid are shown in Figure 2.1.
Figure 2.1. Structures of D and L tartaric acids.
In this study we have used DL-tartaric acid as a template to prepare silica
materials. In particular we have prepared the silica materials using a range of
reaction conditions in order to maximize the formation of nanotubes and at the
same time study in detail parameters that play an important role in
determining the microstructure of the silica formed in the synthesis.
COOH
COOH
OH
H
H
D TARTARIC ACID
HO
COOH
COOH
H
OHH
L TARTARIC ACID
HO

31
2.2 Experimental
2.2.1 Preparation
Ethanol (Saarchem, 99.9%), water, tetraethylorthosilicate (TEOS), (Aldrich,
98%), DL-tartaric acid (Sigma, 98%), and ammonium hydroxide (Fluka, 98%)
were used as chemical sources. The synthesis procedure followed a standard
approach. The parameters that were varied during the silica synthesis were a)
temperature, b) NH4OH concentration, c) water/ethanol concentration, d) time
before NH4OH addition, e) static versus stirred conditions, f) stirring rate and
g) solvent. Both the yield and product morphology were determined after each
reaction.
a) Synthesis procedure when varying temperature
The synthesis when varying temperature was as follows:
• 0.26 g of template (DL-tartaric acid) was dissolved in 0.6 ml of water
and then 50 ml of ethanol was added.
• The mixture was then heated to 75 ºC or cooled to 0 ºC or left at room
temperature (depending on the synthesis temperature to be used).
• 7.3 g TEOS was then added to the mixture at either 0 ºC, 25ºC or
75ºC.
• The solution was left to stand at the synthesis temperature for 30
minutes to form a sol.
• Finally 20 ml of NH4OH (28% aqueous solution) that was at room
temperature was added to a sol that was at synthesis temperature to
form a gel.

32
• After 15 – 20 minutes at the reaction temperature the reaction was
observed to be complete.
• The gel was then aged at room temperature for 2 hours, and then dried
in an oven at 110 ºC.
• The products were calcined under static air at 600 ºC for 4 hours.
b) Synthesis procedure when varying the concentration of NH4OH
(The synthesis was carried out at room temperature and all the other
parameters were kept constant except the concentration of NH4OH)
• 0.26 g of DL-tartaric acid was dissolved in 0.6 ml of water and then 50
ml of ethanol was added.
• 7.3 g TEOS was then added to the mixture.
• The solution was left to stand for 30 minutes to form a sol.
• Finally 20 ml of NH4OH (7%, 16%, 25%, 28% or 33% aqueous
solution) was added to the sol to form a gel.
• After 15 – 20 minutes the reaction was observed to be complete.
• The gel was then aged at room temperature for 2 hours and then dried
in an oven at 110 ºC.
• The products were calcined under static air at 600 ºC for 4 hours.
c) Synthesis procedure when varying water/ethanol concentration
(The synthesis was carried out at room temperature and all the other
parameters were kept constant except the water/ethanol concentration)
• 0.26 g of DL-tartaric acid was dissolved in 0.6 – 5 ml of water and then
50 ml of ethanol was added.

33
• 7.3 g TEOS was then added to the mixture.
• The solution was left to stand for 30 minutes to form a sol.
• Finally 20 ml of NH4OH (28% aqueous solution) was added to the sol
to form a gel.
• After 15 – 20 minutes the reaction was observed to be complete.
• The gel was then aged at room temperature for 2 hours and then dried
in an oven at 110 ºC.
• The products were calcined under static air at 600 ºC for 4 hours.
d) Synthesis procedure when varying time before NH4OH addition
(The synthesis was carried out at room temperature and all the other
parameters were kept constant except time taken before NH4OH addition)
• 0.26 g DL-tartaric acid was dissolved in 0.6 ml of water and then 50 ml
of ethanol was added.
• 7.3 g TEOS was then added to the mixture.
• The solution was left to stand for 15 minutes to 24 hours to form a sol.
• Finally 20 ml of NH4OH (28% aqueous solution) was added to the sol
to form the gel.
• After 15 – 20 minutes the reaction was observed to be complete.
• The gel was then aged at room temperature for 2 hours and then dried
in an oven at 110 ºC.
• The products were calcined under static air at 600 ºC for 4 hours.
e) Synthesis procedure for static versus stirred conditions
(The synthesis was carried out at room temperature)

34
• 0.26 g of DL-tartaric acid was dissolved in 0.6 ml of water and then 50
ml of ethanol was added. The mixture was stirred with a magnetic
stirrer and a stirring rate of about 300 rpm.
• 7.3 g TEOS was then added to the stirred mixture.
• The solution was left to stand for 30 minutes while stirring to form a sol.
• Finally 20 ml of NH4OH (28% aqueous solution) was added to the sol
to form a gel.
• After 15 – 20 minutes the reaction was observed to be complete.
• The stirring was stopped and the gel was aged at room temperature for
2 hours and then dried in an oven at 110 ºC.
• The products were calcined under static air at 600 ºC for 4 hours.
For the non-stirring condition the synthesis procedure was the same except
that the stirrer was not used.
f) Synthesis procedure when varying the stirring rate
The synthesis procedure when varying the stirring rate was the same as
above. All the other parameters were kept constant, but the stirring rate was
varied between 100 and 1200 rpm.
g) Synthesis procedure when varying the solvent
The procedure was the same as used for the non-stirring condition but here
the solvent was changed. The solvents used were ethanol, water, mixture
of ethanol and water, methanol and iso-propanol.

35
2.2.2 Characterization
Transmission electron microscopy (TEM) images were observed with JEOL-
100S and JEOL-2010 electron microscopes. A JEOL JSM 840 scanning
electron microscope (SEM) was utilised to obtain scanning electron
micrographs of the samples. Samples for TEM analysis were prepared by
sonicating about 1 mg material into 1 ml ethanol for at least 4 minutes. A few
drops of the suspension were added to a Cu grid coated with a carbon film.
After approximately one minute, excess liquid was removed by touching one
edge of the grid to a Whatman filter paper. Samples for SEM analysis were
coated with a gold-palladium coating. BET surface areas and BJH pore size
distributions were determined by nitrogen physisorption at 77 K using a
Micromeritics ASAP 2010 instrument. (Degassing of the samples to 0.1 Pa at
393 K preceded every measurement. Specific adsorption pore volumes were
calculated by the Barret-Joyner-Halenda (BJH) method21 that is assumed to
cover the cumulative adsorption pore volume of pores in the range 1.7 to 300
nm in diameter. Assessment of micropore volume was made from t-plot
constructions using the Harkins-Jura correlation.22) Thermogravimetric
analysis was performed on a Perkin Elmer, Thermogravimetic Analyser Pyris
1 (TGA) with a heating rate of 10º per minute. X-ray powder diffraction
measurements were carried out on a Philips PW1820 instrument with a
graphite monochromator using CuKα radiation generated at 40 KV and 20
mA.

36
2.3 Results
Table 2.1 shows the effect of varying temperature on the structure of the
silica. The table shows that synthesis at 0 ºC gives a higher yield of tubes
compared to reactions performed at higher temperature. At 75 ºC only
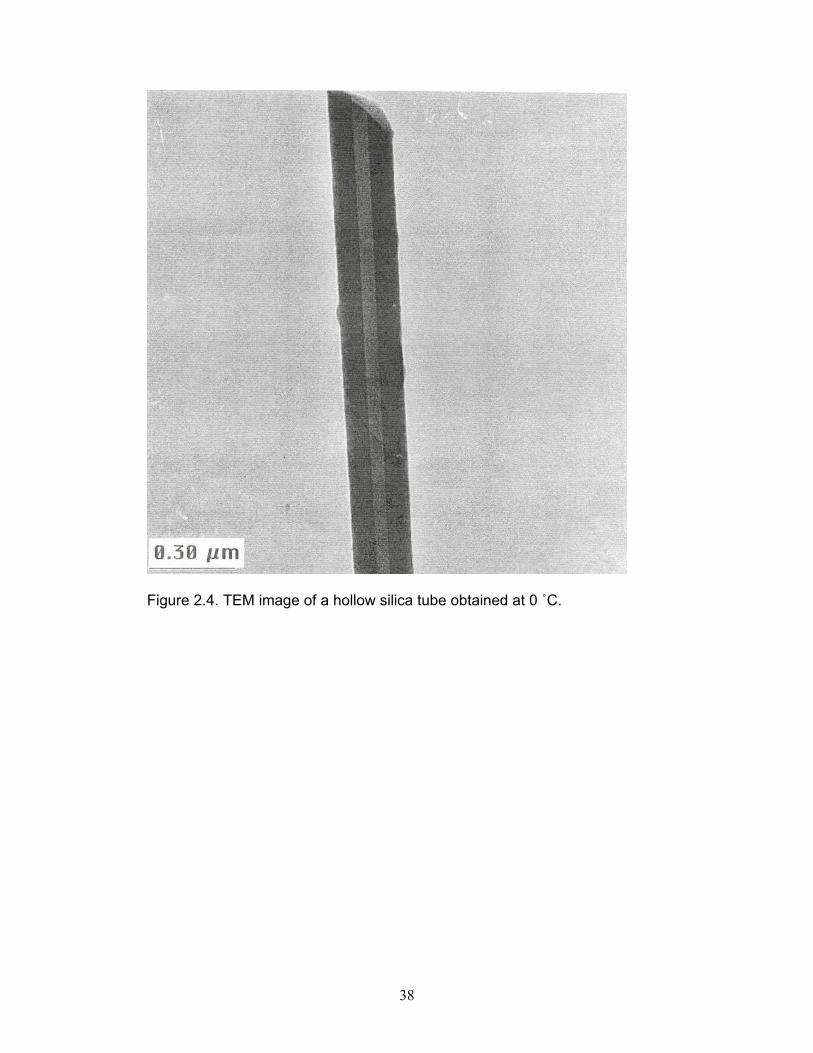
spherical particles are obtained (Fig. 2.2) while long hollow tubes (100 – 250
table µm) were obtained at 0 ºC (Figs. 2.3, 2.4 and 2.5). The spheres formed
at 75 ºC are much smaller than the ones formed at room temperature and 0
ºC. The tubes formed at 25 ºC are also hollow with an inner square shape. A
white arrow in Figure 2.5 points at an inner square shape.
Table 2.1. Effect of temperature on the morphology of silica
Temperature [ºC] Particle size [µm]a Structureb
0 L: 100 – 250
D: 0.2 – 0.6
S: 0.1 – 0.3
Tubes (95%) + Spheres (5%)
25 L: 15 – 120
D: 0.3 – 0.5
S: 0.4 – 0.6
Tubes (75%) + Spheres (25%)
75 S: 0.01 – 0.02 Spheres
aL = length of tube, D = outer diameter of tube, S = diameter of sphere
b% in brackets gives an estimate of the amount of material formed as determined by TEM

37
Figure 2.2. TEM image of spherical silica particles obtained at 75 °C.
Figure 2.3. SEM image of silica tubes formed at 0 ˚C.
10 nm
38
Figure 2.4. TEM image of a hollow silica tube obtained at 0 ˚C.

39
Figure 2.5. SEM image of silica tubes obtained at room temperature showing
that they are hollow with an inner square shape (see arrow).
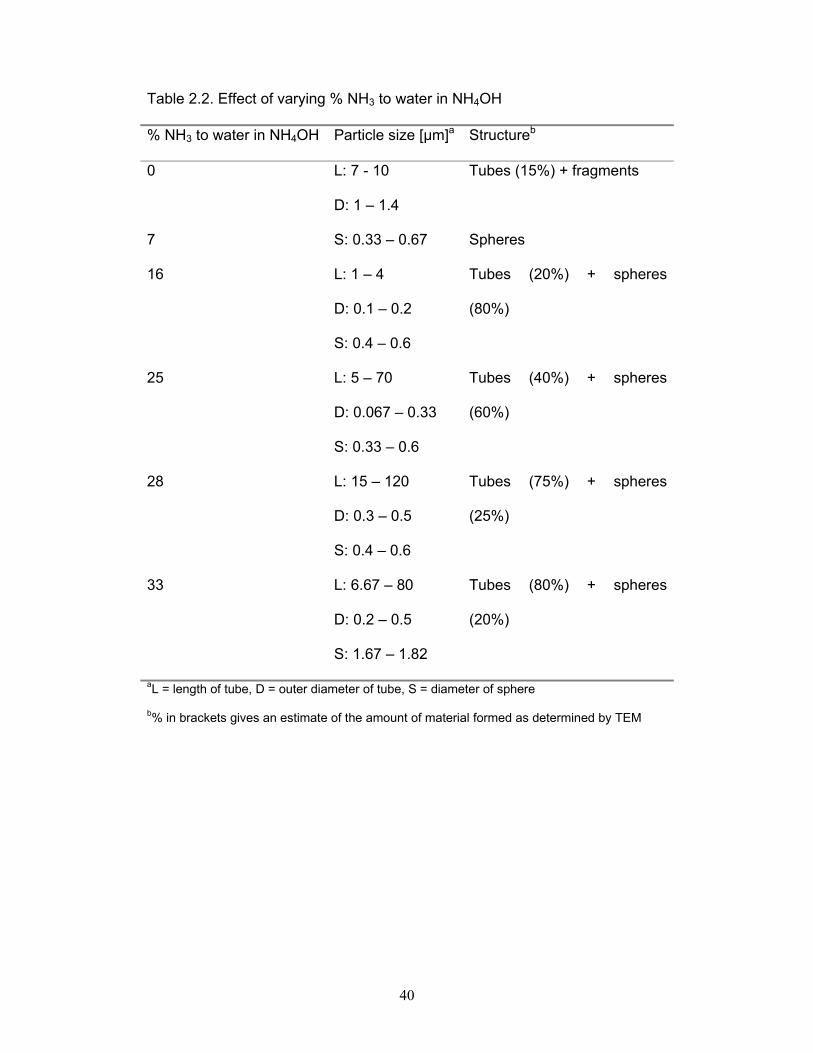
Table 2.2 and Figure 2.6 show that the yield and length of the silica tubes
increase as the percentage of NH3 to water in NH4OH is increased. The
widths of the tubes and spheres are about the same (~ 0.4 µm) when 28%
aqueous ammonia solution is used. Table 2.2 shows that tube formation is
detected when the NH3 (aq) concentration >16%. When NH4OH is not added
to the reaction, the tubes that form are shorter than the ones obtained when
NH3 (aq) exceeds 25% and take a very long time to form.
40
Table 2.2. Effect of varying % NH3 to water in NH4OH
% NH3 to water in NH4OH Particle size [µm]a Structureb
0 L: 7 - 10
D: 1 – 1.4
Tubes (15%) + fragments
7 S: 0.33 – 0.67 Spheres
16 L: 1 – 4
D: 0.1 – 0.2
S: 0.4 – 0.6
Tubes (20%) + spheres
(80%)
25 L: 5 – 70
D: 0.067 – 0.33
S: 0.33 – 0.6
Tubes (40%) + spheres
(60%)
28 L: 15 – 120
D: 0.3 – 0.5
S: 0.4 – 0.6
Tubes (75%) + spheres
(25%)
33 L: 6.67 – 80
D: 0.2 – 0.5
S: 1.67 – 1.82
Tubes (80%) + spheres
(20%)
aL = length of tube, D = outer diameter of tube, S = diameter of sphere
b% in brackets gives an estimate of the amount of material formed as determined by TEM

41
-5 0 5 10 15 20 25 30 35
0
20
40
60
80 Number of tubes (%) Average length
% NH3
Num
ber o
f tub
es (%
)
-10
0
10
20
30
40
50
60
70
80
Average Length (µm
)
Figure 2.6. The effect of % NH3 to water in NH4OH on the amount (▫) and
average length (●) of tubes formed.
Table 2.3 and Figure 2.7 show that the formation of the tubes is sensitive to
the amount of water present during the reaction. Tubes form only when the
percentage of water is < 5 % (vol %). Spherical particles become smaller as
more water is used. When the concentration of water is 1.1% the tubes
formed are the longest. The TEM images show that when water is the only
solvent used the structure of the silica consists of nanotubes and silica
fragments instead of nanotubes and spherical particles (Fig. 2.8). When
ethanol is the only solvent used about 60% of silica is found in tubular form.

42
Table 2.3. Effect of H2O/EtOH dilution
% H2O (vol
%)
Particle size [µm]a Structureb
0 L: 50 – 100
D: 0.40 - 0.60
S: 0.35 – 0.40
Tubes (60%) + spheres (40%)
1.1 L: 15 – 120
D: 0.3 – 0.5
S: 0.4 – 0.6
Tubes (75%) + spheres (25%)
3 L: 50 – 90
D: 0.25 – 0.30
S: 0.33 – 0.35
Tubes (60%) + spheres (40%)
5 L: 2.5 – 25
D: 0.05 – 0.07
S: 0.25 – 0.5
Tubes (50%) + spheres (50%)
10 S: 0.2 – 0.6
Spheres
100 L: 50 – 70
D: 1 – 1.25
Fragments + tubes (15%)
aL = length of tube, D = outer diameter of tube, S = diameter of sphere
b% in brackets gives an estimate of the amount of material formed as determined by TEM

43
0 2 4 6 8 10-10
0
10
20
30
40
50
60
70
80 Number of tubes (%) Average length
% H2O
Num
ber o
f tub
es (%
)
0
20
40
60
80
Average Length (µm
)
Figure 2.7. Effect of % water to ethanol (vol %) used on the amount (▫) and
average length (●) of tubes formed.

44
Figure 2.8. TEM image of nanotubes and fragments obtained when water is
used as a solvent (no ethanol present).
Table 2.4 and Figure 2.9 show that the time taken before adding ammonium
hydroxide to gel the solution has an effect on the yield and length of the tubes
formed. The yield of tubes decreases as more time is taken before adding
ammonium hydroxide but the length of tubes increases as the time is
increased. After 12 hours silica fragments start to form instead of tubes (Fig.
2.10).
5 µm

45
Table 2.4. Effect of varying time before the addition of NH4OH
Time [hrs] Particle size [µm]a Structureb
0.25 L: 20 – 100
D: 0.2 – 0.6
S: 0.4 – 0.5
Tubes (85%) + spheres (15%)
0.5 L: 15 – 120
D: 0.3 – 0.5
S: 0.4 – 0.6
Tubes (80%) + spheres (20%)
1.5 L: 30 – 200
D: 0.33 – 0.67
S: 0.33 – 0.45
Tubes (70%) + spheres (30%)
6 L: 30 - 220
D: 0.5 – 0.8
S: 0.2 – 0.5
Tubes (10%) + Fragments
12 - Fragments
24 - Fragments
aL = length of tube, D = outer diameter of tube, S = diameter of sphere
b% in brackets gives an estimate of the amount of material formed as determined by TEM

46
0 2 4 60
10
20
30
40
50
60
70
80
90
Number of tubes (%) Average length
Time (h)
Num
ber o
f tub
es (%
)
60
70
80
90
100
110
120
Average length (µm
)
Figure 2.9. Effect of time before the addition of NH4OH on the amount (▫) and
average length (●) of tubes formed.
Figure 2.10. TEM image of silica fragments obtained after 12 hours.
1 10 µm

47
Table 2.5 shows that stirring influences the formation and amount of tubes
formed. More tubes are formed under stirred conditions and the tubes are also
longer than the ones formed under non-stirred conditions. Table 2.6 and
Figure 2.11 show that the yield of tubes increases as the stirring rate
increases and the yield is at a maximum at 300 rpm and thereafter the yield
decreases until no tubes are formed at all with stirring rates of 1200 rpm.
Table 2.5. Effect of adding NH4OH under both static and stirring conditions
(rapid addition)
Non-stirring Stirring
Sample Particle sizea
[µm]
Structureb Particle sizea
[µm]
Structureb
15 min L: 7 – 60
D: 0.5 – 0.7
Tubes (85%)
L: 16 – 95
D: 0.25 – 0.5
Tubes (96%)
aL = length of tube, D = outer diameter of tube, S = diameter of sphere
b% in brackets gives an estimate of the amount of material formed as determined by TEM

48
Table 2.6. Effect of diffusion on the amount of tubes that form
Stirring rate Tubes formed (%)
0 80
100 85
300 95
600 40
1000 5
1200 0
0 200 400 600 800 1000 1200
0
20
40
60
80
100
Num
ber o
f tub
es (%
)
Stirring rate (rpm)
Figure 2.11. Effect of stirring rate on the number of tubes formed.

49
The solvent also plays a role in the formation of nanotubes and this is shown
in Table 2.7. A high yield of tubes (75%) is obtained when ethanol/water
(1.1%) solvent is used. When ethanol is used 60% of the silica material is in
tubular form whereas when water is used the silica structure consists of
mainly fragments and a small amount of tubes (15%). Spherical particles are
obtained when methanol and iso-propanol are used.
Table 2.7. Effect of solvent on structure and number of tubes formed
Solvent Particle size (µm)a Structureb
Ethanol L: 50 - 100
D: 0.4 – 0.6
S: 0.35 – 0.40
Tubes (60%) + spheres (40%)
H2O/EtOH L: 15 - 120
D: 0.3 – 0.5
S: 0.4 – 0.5
Tubes (75%) + spheres (25%)
Water L: 50 – 70
D: 1 – 1.25
Fragments + tubes (15%)
Methanol S: 0.3 – 0.5 Spheres
Iso-propanol S: 0.2 – 0.4 Spheres
aL = length of tube, D = outer diameter of tube, S = diameter of sphere
b% in brackets gives an estimate of the amount of material formed as determined by TEM

50
Table 2.8 shows that the template used during the synthesis influences the
BET surface areas of the silica. Only spherical particles are formed when D
and L tartaric acids are separately used. DL-tartaric acid gave both spheres
and nanotubes depending on the synthesis conditions. The surface areas for
the silica that was formed from the D or L tartaric acids are lower than the one
obtained from DL-tartaric acid.
Table 2.8: Effect of template on surface area
Template BET SA (m2/g)
Calcination at 600 °C
DL-Tartaric acid 24.8
D-Tartaric acid 10.9
L-Tartaric acid 13.5
The nitrogen adsorption-desorption isotherm of SiO2 synthesised from DL-
tartaric acid (room temperature, 28% ammonia and non-stirring) shows a
Type IV isotherm with a H3 type-like hysteresis loop, indicating the existence
of narrow slit-like pores (tubular mesoporosity and microporosity) in the
material (Figure 2.12). However; the desorption appears below the adsorption
curve. This unusual phenomenon is attributed to the low surface area of the
tartaric acid sample that leads to problems in accurately measuring voids.
This type of problem has also been reported previously e.g. for microporous
materials such as zeolites23 or for samples with large average pore sizes (~
132 nm). This proposal of micropores contributing to the unusual behaviour is

51
supported by the t-plot diagram which shows that the microporous volume
contributes over 50% to the total pore volume. The BJH pore size distribution
reveals pores that range from 1.7 – 3.1 nm in diameter (Figure 2.13).
0.0 0.2 0.4 0.6 0.8 1.0
0
2
4
6
8
10
12
Volu
me
Adso
rbed
(cm
3 /g) S
TP
Relative Pressure (P/Po)
Adsorption Desorption
Figure 2.12. N2 adsorption-desorption isotherm of SiO2 where DL-tartaric acid
was used as a template (the sample was prepared at room temperature using
28% ammonia solution and non-stirring condition).

52
Figure 2.13. BJH pore size distribution plot (adsorption mode).
The TGA curve for the silica sample shows that the silica materials produced
are moderately stable. Figure 2.14 shows that at 121 °C about 12% of the
weight is lost, mainly due to the loss of the moisture in the sample. A further
10% in mass is lost at 255 °C and this is due to the loss of the template in the
sample. Finally at 900 ºC ~ 22% of the weight is lost.

53
0 200 400 600 800 100075
80
85
90
95
100
Wei
ght (
%)
Temperature [°C]
-1.2
-1.0
-0.8
-0.6
-0.4
-0.2
0.0
0.2
D
erav
ativ
e %
Wei
ght (
%/m
in)
255
121
Figure 2.14. TGA curve of the uncalcined silica material (room temperature,
28% ammonia solution and non-stirring).
Powder XRD diffraction patterns for all the silica materials obtained show that
only one broad peak appears at about 23 – 24º, indicating that the silica
framework is amorphous (see Fig. 2.15).

54
Figure 2.15. Powder XRD pattern of silica nanotubes (room temperature, 28%
ammonia solution and non-stirring).
The IR spectra of the silica materials was recorded (see Figure 2.16). A broad
band around 3396 cm-1 is caused by the O-H stretching vibration mode of the
adsorbed water molecules, whose bending vibration mode is responsible for
the band recorded at 1631 cm-1. The intense peak at 1100 cm-1 is due to the
Si-O-R stretching vibration (υ1) of ethoxy groups directly bonded to silicon
while the peaks at 804 and 415 cm-1 are caused by the SiOH bending bands
υ2 and υ3 modes respectively. These absorption bands of the calcined silica
material (Fig. 2.16) are typical for silica derived from TEOS as reported in the
literature.24,25

55
Figure 2.16. IR spectrum of a silica material (recorded in KBr) obtained at
room temperature.
2.4 Discussion
Silica tubes with a range of morphologies have been synthesised in the last
decade. Generally, factors that influence the formation of silica materials with
various shapes and sizes have not been described in detail in the literature. It
has been proposed that the well-defined shapes observed can be initiated by
topological defects in seed molecules26-27 and that the shape and that the
length of mesoporous silica products depends strongly on the silica supply
and on the self-assembly of the silica at the template/silica source interface28.
Our studies with DL-tartaric acid as template reveal that synthesis conditions
(temperature, NH4OH concentration, water/ethanol concentration, time before
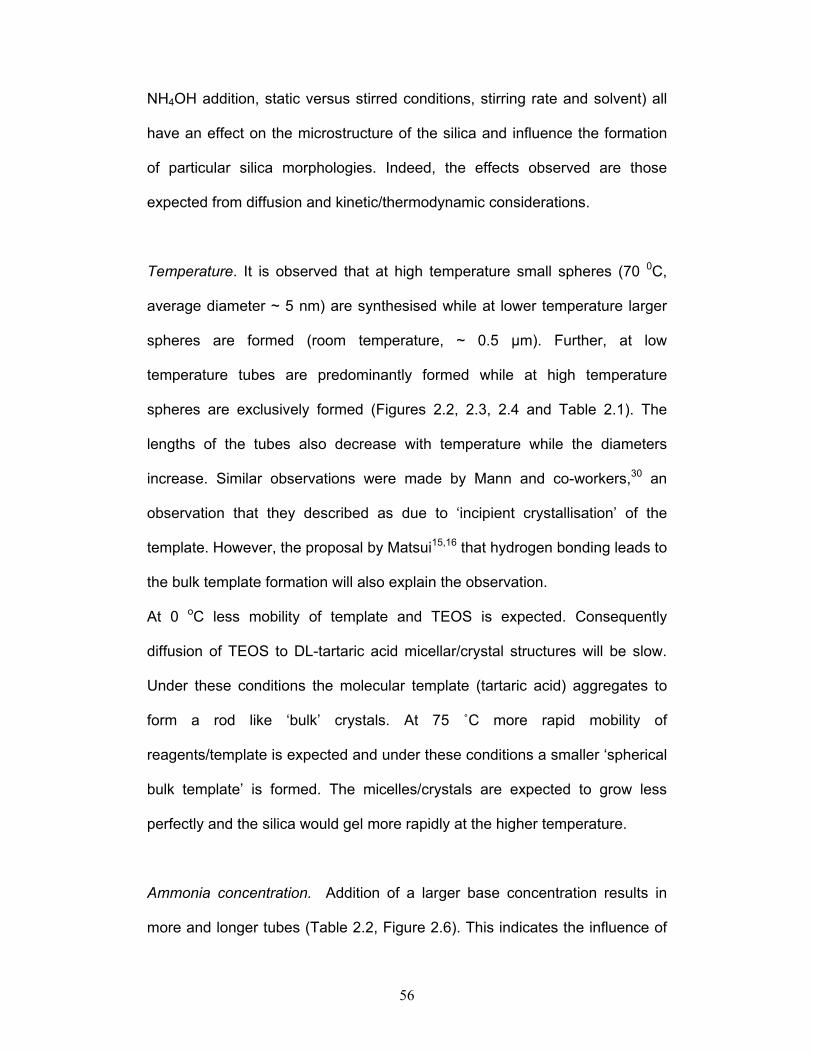
56
NH4OH addition, static versus stirred conditions, stirring rate and solvent) all
have an effect on the microstructure of the silica and influence the formation
of particular silica morphologies. Indeed, the effects observed are those
expected from diffusion and kinetic/thermodynamic considerations.
Temperature. It is observed that at high temperature small spheres (70 0C,
average diameter ~ 5 nm) are synthesised while at lower temperature larger
spheres are formed (room temperature, ~ 0.5 µm). Further, at low
temperature tubes are predominantly formed while at high temperature
spheres are exclusively formed (Figures 2.2, 2.3, 2.4 and Table 2.1). The
lengths of the tubes also decrease with temperature while the diameters
increase. Similar observations were made by Mann and co-workers,30 an
observation that they described as due to ‘incipient crystallisation’ of the
template. However, the proposal by Matsui15,16 that hydrogen bonding leads to
the bulk template formation will also explain the observation.
At 0 oC less mobility of template and TEOS is expected. Consequently
diffusion of TEOS to DL-tartaric acid micellar/crystal structures will be slow.
Under these conditions the molecular template (tartaric acid) aggregates to
form a rod like ‘bulk’ crystals. At 75 ˚C more rapid mobility of
reagents/template is expected and under these conditions a smaller ‘spherical
bulk template’ is formed. The micelles/crystals are expected to grow less
perfectly and the silica would gel more rapidly at the higher temperature.
Ammonia concentration. Addition of a larger base concentration results in
more and longer tubes (Table 2.2, Figure 2.6). This indicates the influence of

57
the base on the ‘bulk template’ formation. This is similarly reflected by the
addition of water to the reactant solution. As water is added to the solution,
the pH decreases (ammonia is diluted) and the quantity and length of the
tubes decreases (Table 2.3). Combined with this effect is the influence of the
solvent on tube/sphere formation. Use of different solvents reveals that tubes
are formed in very few instances (Table 2.7).
NH4OH addition: ageing effects. When the time prior to ammonium hydroxide
addition is increased, the synthesis of the silica has more time to self
assemble around the template prior to gelation. The outcome of this is the
formation of longer, more uniform tubes with wider walls. Interestingly, if
extended times are used before base addition (> 6 hours) the silica that has
formed appears to be fragmented i.e. the silica produced appears to have
broken down or to have re-dissolved. This occurs presumably because the
silica framework that initially forms before NH4OH is added has not completely
hydrolysed or condensed (i.e. has not completely formed Si-O-Si bonds). The
underlying silica structure is hence ‘chemically’ active. This result reveals the
importance of obtaining appropriate condensation reactions in forming the
silica structure.
Stirring rate. The effect of stirring could have two outcomes; break-up of the
assembled crystal/template or increase of TEOS diffusion to the template. The
data in table 2.5 reveal that the latter effect dominates. However, beyond a
stirring rate of 400 rpm, tube formation decreases (Figure 2.11). The interplay

58
between these two effects is thus subtle and will have to be determined for
every system.
Other templates. It was reported that only the DL form of tartaric acid was
active in the synthesis of silica tubes.15 Numerous attempts were made to use
the D and L forms of tartaric acid with a wide range of reaction conditions but
all attempts only produced amorphous materials. This implies that the ‘bulk’
template structure is an intrinsic property of the molecular template (relates to
inter molecular H- bonding etc.) and that the conditions employed do not
permit the structure to form in the ethanol/water solutions used. That the ‘bulk’
template for the different tartaric acid isomers is different is also revealed by
the surface area measurements of the spherical silica’s produced by the
different tartaric acids. The surface areas for the silica formed from the D or L
tartaric acids are lower than the areas obtained from DL-tartaric acid.
Silica characterisation. Removal of the template yields a hollow tube with an
inner square shape, a typical example is shown in Figure 2.4 (outer diameter
= 0.2 µm; inner diameter = 0.05 µm). It is worth noting that pore volume
measurements indicate that a typical silica tube containing material shows
Type IV adsorption isotherm characteristics with a H3 type-like hysteresis
loop. This indicates the existence of narrow slit-like pores (tubular
mesoporosity and microporosity) in the material (Figure 2.12) and a material
showing mesopores and micropores. The BJH pore size distribution reveals
pores that range from 1.7 – 3.1 nm (Figure 2.13). The peak at 1.7 nm is due to
the micropores that are present in the silica and the peaks at 2.5 and 3.1 nm

59
are due to the mesopores that occur within the silica nanotube walls and the
tube cavities respectively. The powder XRD data reveals that the silicas
produced are amorphous (Figure 2.15). The IR spectra of the calcined silica
materials (Fig. 2.16) is typical for silica derived from TEOS as reported in the
literature.24,25
Mechanism of formation. Our study reveals that the morphology of the final
silica materials depends on both the template molecule and on the silica
supply and the self-assembly of the silica and/or template. This latter effect is
influenced by the synthesis conditions in a predictable way.
In line with studies by others29 our data are consistent with the following
i) Formation of rod-like micelles or ‘crystallised’ template molecules by
a slow aggregation process. At higher temperatures rod-like
structures do not form,
ii) interaction of the template with the TEOS,
iii) condensation/hydrolysis of the TEOS. Partial hydrolysis appears to
yield a ‘poorly’ gelated material that breaks down readily in the
presence of base.
Our data do not establish whether a coil like growth of the silica occurs in the
reaction29 (refer to Appendix 2 for coil-like growth).
2.5 Conclusions
This study has shown that the template together with the synthesis conditions
influence the formation of particular silica morphologies. Of all the synthesis
conditions investigated, temperature, stirring, reaction time and solvent have

60
the largest effect on the structure. These factors have a direct bearing on
template formation. The formation of tubes is more enhanced at lower
temperatures than elevated ones and this can be due to the fact that at a
lower temperature molecules (reagents, template) diffuse more slowly and
thus have enough time to self-assemble.
Pore size measurements indicate the existence of mesopores and some
micropores in the formed silica materials. The powder XRD data reveals that
the silicas produced are amorphous. The IR spectra of the calcined silica
materials are typical for silica derived from TEOS as reported in the literature.
TGA data shows that the silica materials obtained are thermally stable.
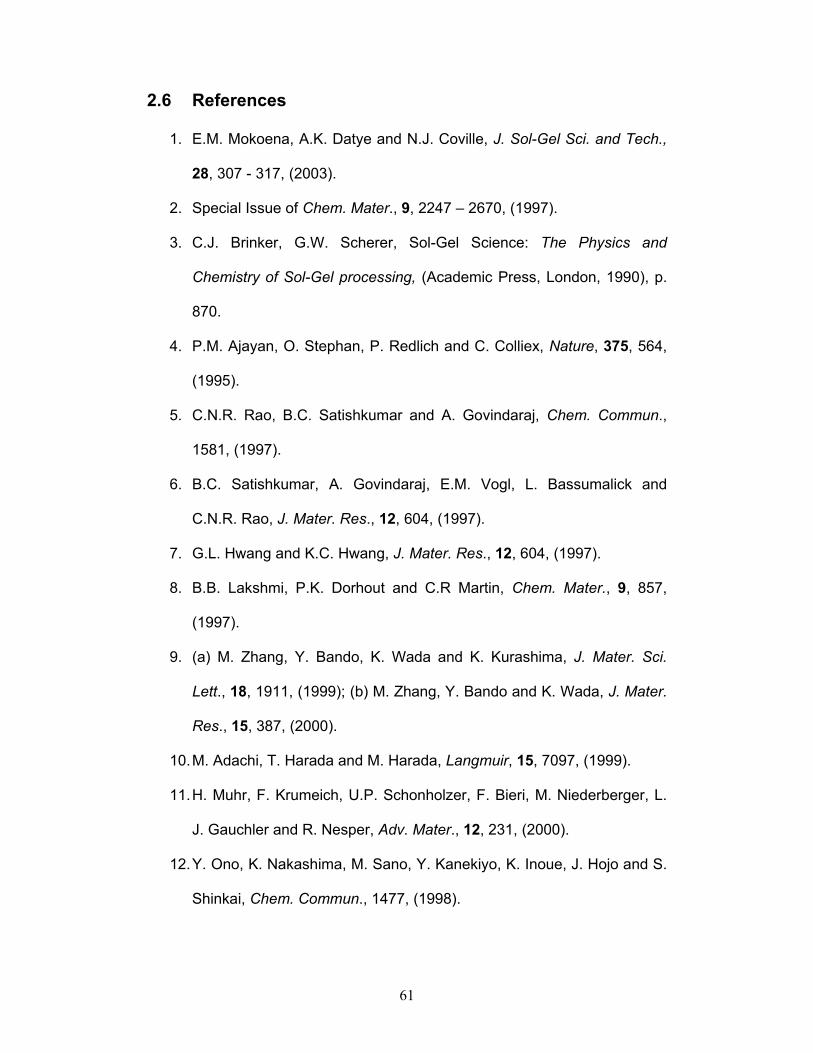
61
2.6 References
1. E.M. Mokoena, A.K. Datye and N.J. Coville, J. Sol-Gel Sci. and Tech.,
28, 307 - 317, (2003).
2. Special Issue of Chem. Mater., 9, 2247 – 2670, (1997).
3. C.J. Brinker, G.W. Scherer, Sol-Gel Science: The Physics and
Chemistry of Sol-Gel processing, (Academic Press, London, 1990), p.
870.
4. P.M. Ajayan, O. Stephan, P. Redlich and C. Colliex, Nature, 375, 564,
(1995).
5. C.N.R. Rao, B.C. Satishkumar and A. Govindaraj, Chem. Commun.,
1581, (1997).
6. B.C. Satishkumar, A. Govindaraj, E.M. Vogl, L. Bassumalick and
C.N.R. Rao, J. Mater. Res., 12, 604, (1997).
7. G.L. Hwang and K.C. Hwang, J. Mater. Res., 12, 604, (1997).
8. B.B. Lakshmi, P.K. Dorhout and C.R Martin, Chem. Mater., 9, 857,
(1997).
9. (a) M. Zhang, Y. Bando, K. Wada and K. Kurashima, J. Mater. Sci.
Lett., 18, 1911, (1999); (b) M. Zhang, Y. Bando and K. Wada, J. Mater.
Res., 15, 387, (2000).
10. M. Adachi, T. Harada and M. Harada, Langmuir, 15, 7097, (1999).
11. H. Muhr, F. Krumeich, U.P. Schonholzer, F. Bieri, M. Niederberger, L.
J. Gauchler and R. Nesper, Adv. Mater., 12, 231, (2000).
12. Y. Ono, K. Nakashima, M. Sano, Y. Kanekiyo, K. Inoue, J. Hojo and S.
Shinkai, Chem. Commun., 1477, (1998).

62
13. S. Kobayashi, K. Janabusa, N. Hamasaki, M.Kimura and H. Shirai,
Chem. Mater., 12, 1523, (2000).
14. G.M. Clavier, J.L. Pozzo, H. Bouas-Laurent, C. Roux and C. Sanchez,
J. Mater. Chem., 10, 1725, (2000).
15. H. Nakamura and Y. Matsui, J. Am. Chem. Soc., 117, 2651, (1995).
16. H. Nakamura and Y. Matsui, Adv. Mater., 7, 871, (1995).
17. L. Wang, S. Tomura, F. Ohashi, M. Maeda, M. Suzuki and K. Inukai, J.
Mater. Chem., 11, 1465, (2001).
18. L. Sudheendra and A.R. Raju, Bull. Mater. Sci., 22, 1025, (1999).
19. M. Adachi, T. Harada, and M. Harada, Langmuir, 16, 2376, (2000).
20. F. Miyaji, Y. Watanabe and Y. Suyama, Materials Research Bulletin,
38, 1669, (2003).
21. E.P. Barret, L.G. Joyner and P.P. Halenda, J. Am. Chem. Soc., 73,
373, (1951).
22. W.D. Harkins and G. Jura, J. Chem. Phys., 11, 431, (1943).
23. E.G. Derouane, The Magazine of Catalysis, CATTECH, 6(1), 11-13,
(2002).
24. D.L. Wood and E.M. Rabinovich, Appl. Spectrosc., 43, 263, (1989).
25. H. Izutsu, F. Mizukami, Y. Kiyozuma and K. Maeda, J. Mater. Chem.,
7(8), 1519 – 1525, (1997).
26. H. Yang, G.A Ozin and C.T Kresge, Adv. Mater., 10, 883, (1998).
27. I. Sokolov, H. Yang, G.A. Ozin and C.T. Kresge, Adv. Mater., 11, 636,
(1999).
28. S.M. Yang, H. Yang, N. Coombs, I. Sokolov, C.T. Kresge and G.A.
Ozin, Adv. Mater., 11, 52, (1999).

63
29. F. Kleitz, F. Marlow, G.D. Stucky and F. Schüth, Chem. Mater., 13,
3587, (2001).
30. F. Miyaji, S.A. Davis, J.P.H. Charmant, and S. Mann, Chem. Mater.,
11, 3021, (1999).

64
CHAPTER THREE
A SYSTEMATIC STUDY OF THE USE OF CITRIC ACID
IN THE SYNTHESIS OF SILICA MATERIALS
OBTAINED BY THE SOL-GEL METHOD*
3.1 Introduction
The template-directed sol-gel synthesis of organized inorganic matter offers a
new and wide-ranging approach to the making of useful materials with
controlled architecture and porosity across a range of length scales.1 Organic
templates with extended long-range structures, such as block copolymer
lyotropic mesophases,2,3 colloidal crystals,4,5 and bacterial superstructures6
have been used to prepare monolithic forms of porous silica. In contrast, the
direct synthesis of discrete inorganic architectures necessitates the use of
dispersed organic supramolecular structures with commensurate
dimensionality; for example, hollow fibers of amorphous silica have been
prepared by template-directed processes using the external surface of self-
assembled phospholipid fibers,7 viroid cylinders,8 or organic-gel filaments.9
* To be submitted for publication

65
The use of such specialized molecules, however, has the potential drawback
that the costs associated with the scale-up are likely to be highly prohibitive.
Thus, the report by Nakamura and Matsui10 on the formation of silica tubes
from ethanol/water/NH4OH/tetraethylorthosilicate (TEOS) mixtures that
contained small amounts of a simple organic acid (for example, racemic dl-
tartaric acid), is particularly interesting. Recently Wang et al.11 reported that
citric acid (another simple organic acid) could also be used to prepare silica
nanotubes. Wang et al. found that rapid addition of aqueous ammonia under
static conditions gave only uniform micrometer sized rods while slow addition
of aqueous ammonia under stirring conditions gave nanotubes. Hence it
appears that synthetic conditions play a key role in influencing the formation of
particular forms of silica. However, a detailed evaluation of the synthetic
parameters required to control the silica morphologies was not given. The
preparation of single silica nanotubes is still a major challenge as compared to
the synthesis of porous materials with integrated structures.
In this study we have used citric acid as a template to prepare silica materials.
The chemical structure of citric acid is shown in Figure 3.1. In particular we
have prepared the silica materials using a range of reaction conditions in
order to maximize the formation of nanotubes and at the same time study in
detail parameters that play an important role in determining the microstructure
of other forms of silica generated in the synthesis. A comparison between the
use of tartaric and citric acids has been made.
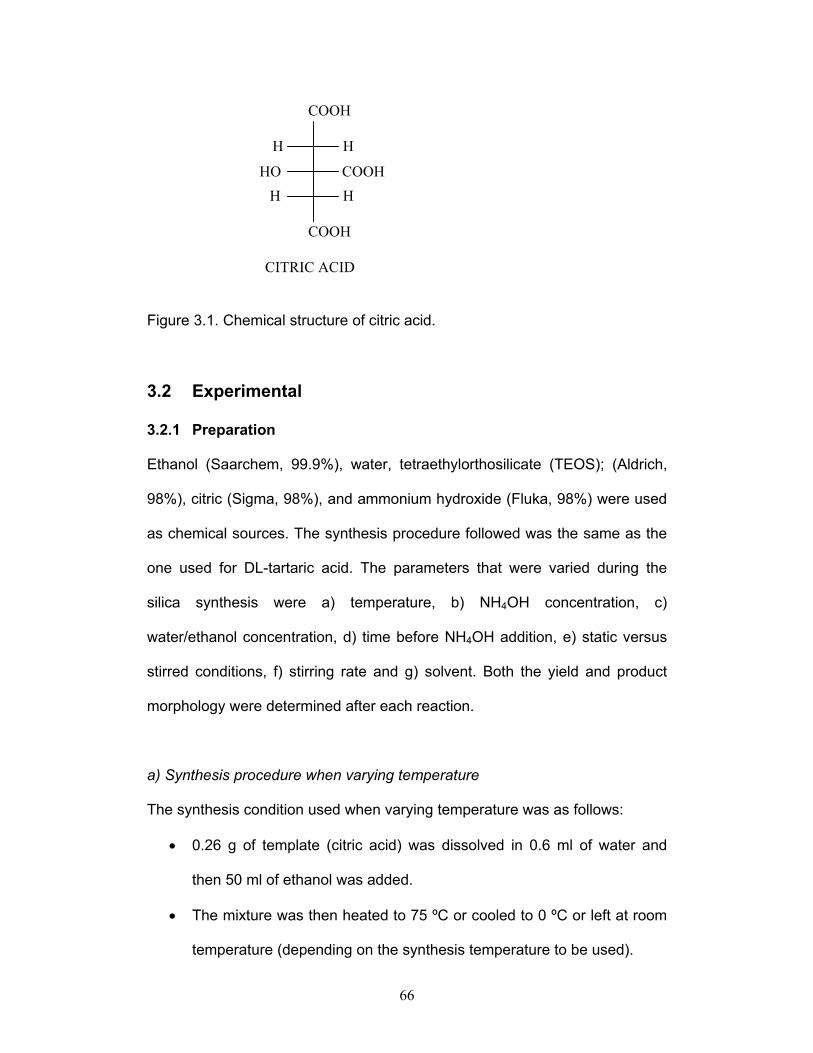
66
Figure 3.1. Chemical structure of citric acid.
3.2 Experimental
3.2.1 Preparation
Ethanol (Saarchem, 99.9%), water, tetraethylorthosilicate (TEOS); (Aldrich,
98%), citric (Sigma, 98%), and ammonium hydroxide (Fluka, 98%) were used
as chemical sources. The synthesis procedure followed was the same as the
one used for DL-tartaric acid. The parameters that were varied during the
silica synthesis were a) temperature, b) NH4OH concentration, c)
water/ethanol concentration, d) time before NH4OH addition, e) static versus
stirred conditions, f) stirring rate and g) solvent. Both the yield and product
morphology were determined after each reaction.
a) Synthesis procedure when varying temperature
The synthesis condition used when varying temperature was as follows:
• 0.26 g of template (citric acid) was dissolved in 0.6 ml of water and
then 50 ml of ethanol was added.
• The mixture was then heated to 75 ºC or cooled to 0 ºC or left at room
temperature (depending on the synthesis temperature to be used).
COOH
COOH
H
COOHH
H
H
CITRIC ACID
HO

67
• 7.3 g TEOS was then added to the mixture at either 0 ºC, 25ºC or
75ºC.
• The solution was left to stand at the synthesis temperature for 30
minutes to form a sol.
• Finally 20 ml of NH4OH (28% aqueous solution) that was at room
temperature was added to the sol that was at synthesis temperature to
form a gel.
• After 15 – 20 minutes at the reaction temperature the reaction was
observed to be complete.
• The gel was then aged at room temperature for 2 hours, and then dried
in an oven at 110 ºC.
• The products were calcined under static air at 600 ºC for 4 hours.
b) Synthesis procedure when varying the concentration of NH4OH
(The synthesis was carried out at room temperature and all the other
parameters were kept constant except the concentration of NH4OH)
• 0.26 g of citric acid was dissolved in 0.6 ml of water and then 50 ml of
ethanol was added.
• 7.3 g TEOS was then added to the mixture.
• The solution was left to stand for 30 minutes to form a sol.
• Finally 20 ml of NH4OH (7%, 16%, 25%, 28% or 33% aqueous
solution) was added to the sol to form a gel.
• After 15 – 20 minutes the reaction was observed to be complete.
• The gel was then aged at room temperature for 2 hours and then dried
in an oven at 110 ºC.

68
• The products were calcined under static air at 600 ºC for 4 hours.
c) Synthesis procedure when varying water/ethanol concentration
(The synthesis was carried out at room temperature and all the other
parameters were kept constant except the water/ethanol concentration)
• 0.26 g of citric acid was dissolved in 0.6 – 5 ml of water and then 50 ml
of ethanol was added.
• 7.3 g TEOS was then added to the mixture.
• The solution was left to stand for 30 minutes to form a sol.
• Finally 20 ml of NH4OH (28% aqueous solution) was added to the sol
to form a gel.
• After 15 – 20 minutes the reaction was observed to be complete.
• The gel was then aged at room temperature for 2 hours and then dried
in an oven at 110 ºC.
• The products were calcined under static air at 600 ºC for 4 hours.
d) Synthesis procedure when varying time before NH4OH addition
(The synthesis was carried out at room temperature and all the other
parameters were kept constant except time taken before NH4OH addition)
• 0.26 g citric acid was dissolved in 0.6 ml of water and then 50 ml of
ethanol was added.
• 7.3 g TEOS was then added to the mixture.
• The solution was left to stand for 15 minutes to 24 hours to form a sol.
• Finally 20 ml of NH4OH (28% aqueous solution) was added to the sol
to form a gel.
• After 15 – 20 minutes the reaction was observed to be complete.

69
• The gel was then aged at room temperature for 2 hours and then dried
in the oven at 110 ºC.
• The products were calcined under static air at 600 ºC for 4 hours.
e) Synthesis procedure for static versus stirred conditions
(The synthesis was carried out at room temperature)
• 0.26 g of citric acid was dissolved in 0.6 ml of water and then 50 ml of
ethanol was added. The mixture was stirred with a magnetic stirrer and
a stirring rate of about 300 rpm.
• 7.3 g TEOS was then added to the stirred mixture.
• The solution was left to stand for 30 minutes while stirring to form a sol.
• Finally 20 ml of NH4OH (28% aqueous solution) was added to the sol
to form a gel.
• After 15 – 20 minutes the reaction was observed to be complete.
• The stirring was stopped and the gel was aged at room temperature for
2 hours and then dried in the oven at 110 ºC.
• The products were calcined under static air at 600 ºC for 4 hours.
For the non-stirring condition the synthesis procedure was the same except
that the stirrer was not used.
f) Synthesis procedure when varying the stirring rate
The synthesis procedure when varying the stirring rate was the same as that
described above. All the other parameters were kept constant, but the stirring
rate was varied between 100 and 300 rpm.

70
g) Synthesis procedure when varying the solvent
The procedure was the same as used for the non-stirred reaction
but here the solvent was changed. The solvents used were
ethanol, water, mixture of ethanol and water, methanol and iso-
propanol.

71
Figure 3.2. Synthesis of citric acid templated silica materials by the sol-gel
method.
CITRIC
ACID
WATER +
SOLVENT
TEOS
MIXTURE
LEFT TO STAND (15 MIN – 24 HOURS)
SILICA SOL NH4OH
GEL
AGED (2 HRS)
DRIED (110 ºC)
15 - 20 MIN
CALCINED (600 ºC)

72
3.2.2 Characterization
Transmission electron microscopy (TEM) images were observed with JEOL-
100S and JEOL-2010 electron microscopes. A JEOL JSM 840 scanning
electron microscope (SEM) was utilised to obtain scanning electron
micrographs of the samples. Samples for TEM analysis were prepared by
sonicating about 1 mg material into 1 ml ethanol for at least 4 minutes. A few
drops of the suspension were added to a Cu grid coated with a carbon film.
After approximately one minute, excess liquid was removed by touching one
edge of the grid to a Whatman filter paper. Samples for SEM analysis were
coated with a gold palladium coating. BET surface areas and BJH pore size
distributions were determined by nitrogen physisorption at 77 K using a
Micromeritics ASAP 2010 instrument. (Degassing of the samples to 0.1 Pa at
393 K preceded every measurement. Specific adsorption pore volumes were
calculated by the Barret-Joyner-Halenda (BJH) method12 that is assumed to
cover the cumulative adsorption pore volume of pores in the range 1.7 to 300
nm in diameter. Assessment of micropore volume was made from t-plot
constructions using the Harkins-Jura correlation13). Thermogravimetric
analysis was performed on a Perkin Elmer, Thermogravimetic Analyser Pyris
1 (TGA) with a heating rate of 10º per minute.
3.3 Results and Discussion
Table 3.1 shows that the effect of varying temperature on the structure of the
silica. The table shows that synthesis at 0 ºC gives a higher yield of
nanotubes compared to reactions performed at higher temperatures. At 75 ºC
only hollow spherical particles are obtained (Figure 3.3). The spheres formed

73
at 75 ºC are hollow and the ones formed at room temperature and 0°C are
filled. The formation of tubes (Figure 3.4) is more enhanced at lower
temperatures than elevated ones. At lower temperatures less mobility of
template and TEOS is expected and consequently diffusion of TEOS to citric
acid micellar structures will be slow. This appears to be beneficial to tube
formation. Under these conditions the molecular template (citric acid)
aggregates to form a rod like ‘bulk’ template. At 75 ˚C more rapid mobility of
reagents/template is expected and under these conditions a smaller ‘spherical
bulk template’ is formed. The micelles/crystals are expected to grow less
perfectly and the silica would gel more rapidly at the higher temperature.
Table 3.1. Effect of temperature on the morphology of silica
Temperature [ºC] Particle size [µm]a Structureb
0 L: 0.75 – 2.5
D: 0.016 – 0 025
S: 0.010 – 0.015
Tubes (97%) + filled spheres
(3%)
25 L: 1.67 – 2.67
D: 0.33 – 0.45
S: 0.30 – 0.50
Tubes (75%) + filled spheres
(25%)
75 S: 0.166 – 0.20 Hollow spheres
aL = length of tube, D = outer diameter of tube, S = diameter of sphere
b% in brackets gives an estimate of the amount of material formed as determined by TEM

74
Figure 3.3. TEM image of hollow spheres obtained at 75 °C.
Figure 3.4. TEM image of tubes obtained at 0 °C.
1 µm
2 3 µm

75
Table 3.2 and Figure 3.5 show that the yield and length of the nanotubes
increase as the percentage of ammonia is increased. This indicates the
influence of the base on ‘bulk template’ formation. The average widths of the
tubes and spheres are about the same (~ 0.4 µm) when 28 and 33% aqueous
ammonia solutions are used. Table 3.2 shows that tube formation is detected
when the NH3 (aq) concentration > 25%. When NH4OH is not added to the
reaction, the tubes that form are longer and take a very long time to form, so
NH4OH acts to enhance the synthesis of nanotubes. Both hollow and filled
spheres are obtained at 16% NH3 (aq) concentration (Figure 3.6).
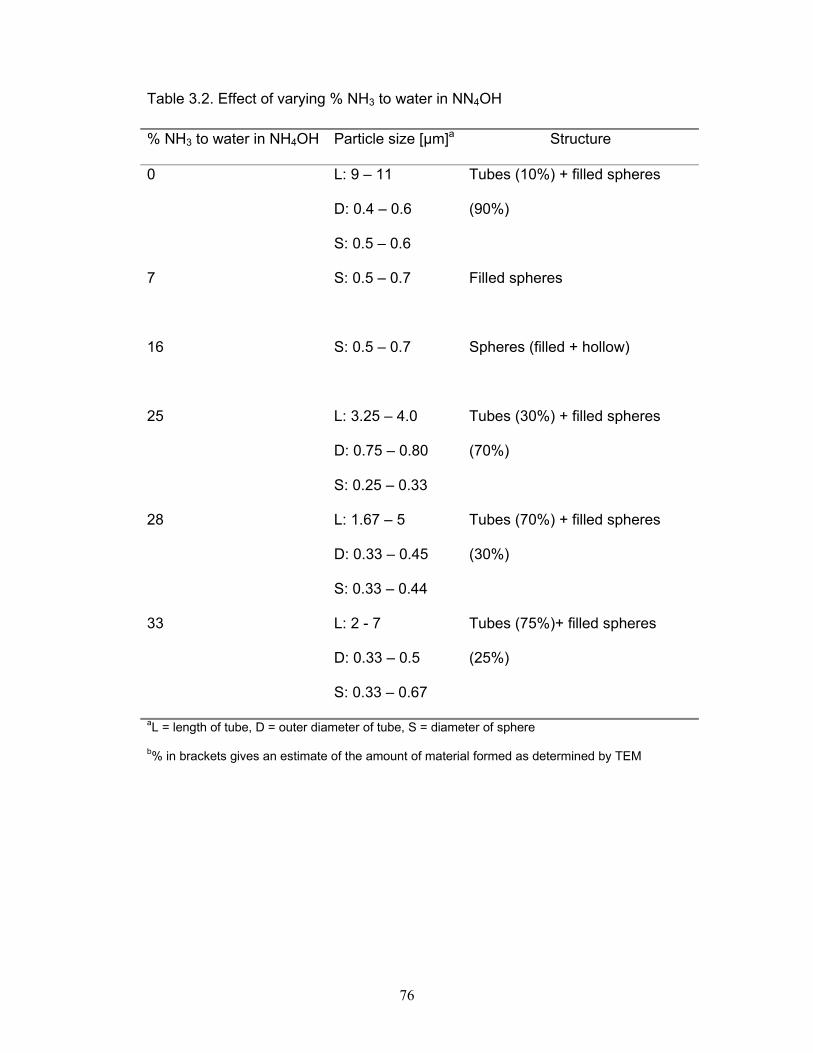
76
Table 3.2. Effect of varying % NH3 to water in NN4OH
% NH3 to water in NH4OH Particle size [µm]a Structure
0 L: 9 – 11
D: 0.4 – 0.6
S: 0.5 – 0.6
Tubes (10%) + filled spheres
(90%)
7 S: 0.5 – 0.7
Filled spheres
16 S: 0.5 – 0.7
Spheres (filled + hollow)
25 L: 3.25 – 4.0
D: 0.75 – 0.80
S: 0.25 – 0.33
Tubes (30%) + filled spheres
(70%)
28 L: 1.67 – 5
D: 0.33 – 0.45
S: 0.33 – 0.44
Tubes (70%) + filled spheres
(30%)
33 L: 2 - 7
D: 0.33 – 0.5
S: 0.33 – 0.67
Tubes (75%)+ filled spheres
(25%)
aL = length of tube, D = outer diameter of tube, S = diameter of sphere
b% in brackets gives an estimate of the amount of material formed as determined by TEM

77
-5 0 5 10 15 20 25 30 35-10
0
10
20
30
40
50
60
70
80
-10
0
10
20
30
40
50
60
70
80
Num
ber o
f tub
es (%
)
% NH3
Number of tubes (%) Average length
Ave
rage
Len
gth
(µm
)
Figure 3.5. The effect of % NH3 to water in NH4OH on the amount (▫) and
average length (●) of tubes formed.

78
Figure 3.6. TEM image of the mixture of hollow and filled spheres obtained
when 16% NH3 (aq) concentration is used (black arrows show hollow
spheres).
Table 3.3 shows that the formation of nanotubes seems to be sensitive to the
amount of water present during the reaction. Nanotubes only form when the
percentage of water is 1.1% or less. When ethanol is the only solvent used
about 70% of silica is found in tubular form. Spherical particles (Figure 3.7)
become smaller as more water is used. This indicates the influence of water
on the reactant solution and ‘bulk template’ formation as ammonia gets
diluted.
5 5 µm
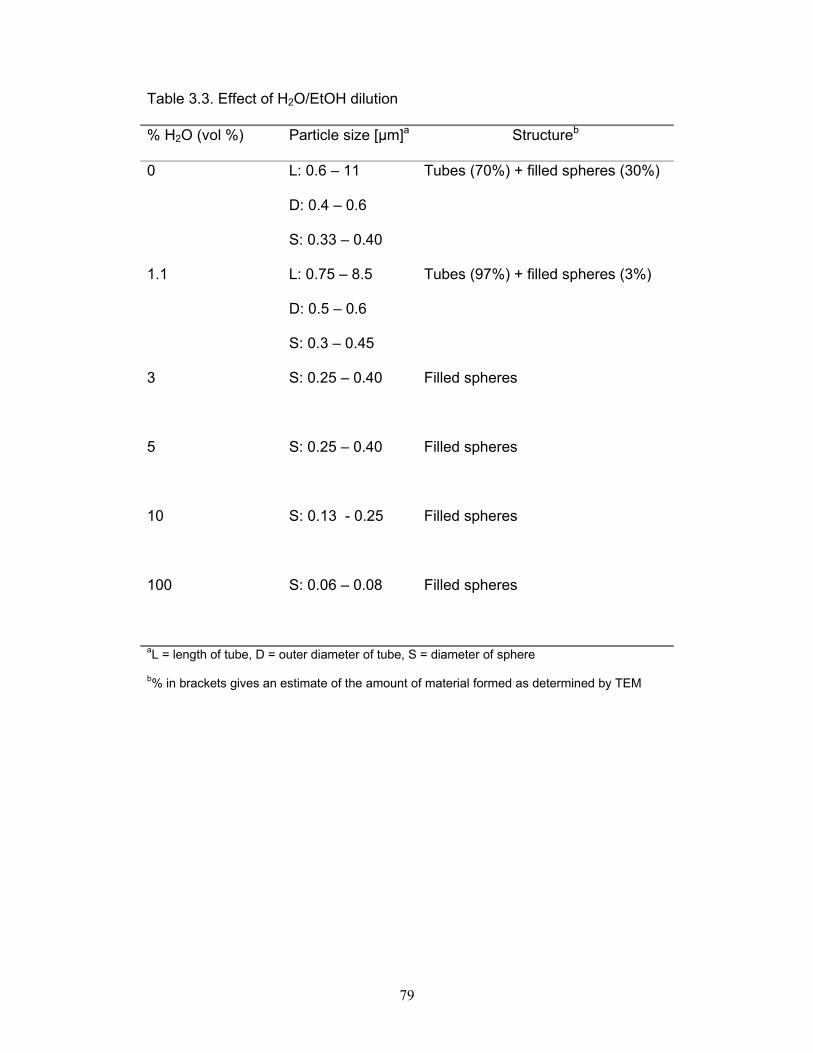
79
Table 3.3. Effect of H2O/EtOH dilution
% H2O (vol %) Particle size [µm]a Structureb
0 L: 0.6 – 11
D: 0.4 – 0.6
S: 0.33 – 0.40
Tubes (70%) + filled spheres (30%)
1.1 L: 0.75 – 8.5
D: 0.5 – 0.6
S: 0.3 – 0.45
Tubes (97%) + filled spheres (3%)
3 S: 0.25 – 0.40
Filled spheres
5 S: 0.25 – 0.40
Filled spheres
10 S: 0.13 - 0.25
Filled spheres
100 S: 0.06 – 0.08
Filled spheres
aL = length of tube, D = outer diameter of tube, S = diameter of sphere
b% in brackets gives an estimate of the amount of material formed as determined by TEM

80
Figure 3.7. TEM image of spherical particles (filled) obtained when 5% of
water is used.
Table 3.4 and Figure 3.8 show that the time taken before adding ammonium
hydroxide to gel the solution has an effect on the yield and length of the tubes
formed. The yield of tubes decreases as more time is taken before adding
ammonium hydroxide but the length of tubes increases as the time is
increased. This is because when the time before addition of ammonium
hydroxide is increased during the synthesis, the silica has more time to self-
assemble around the template prior to gelation.
The tubes that form after 6 hours are hollow inside but closed at the ends
(Figure 3.9). After 12 hours silica fragments start to form instead of tubes
(Figure 3.10). This occurs presumably because the silica framework that
initially forms before NH4OH is added has not completely hydrolysed or
22 2 µm

81
condensed (i.e. has not completely formed Si-O-Si bonds). The underlying
silica structure is hence ‘chemically’ active. This result reveals the importance
of obtaining appropriate condensation reactions for formation of the silica
structure.
Table 3.4. Effect of varying time before the addition of NH4OH
Time [hrs] Particle size [µm]a Structureb
0.25 L: 8.5 – 9.5
D: 1 - 2
S: 0.2 – 0.4
Tubes (80%) + filled spheres (20%)
0.5 L: 0.75 – 8.5
D: 0.5 – 0.6
S: 0.2 – 0.4
Tubes (75%) + filled spheres (25%)
1.5 L: 2.8 – 15
D: 0.6 – 0.9
S: 0.2 – 0.45
Tubes (68%)+ filled spheres (32%)
6 L: 17 - 20
D: 0.75 – 0.85
S: 0.75 – 0.85
Hollow tubes (40%)+ filled spheres
(60%)
12 - Fragments
24 - Fragments
aL = length of tube, D = outer diameter of tube, S = diameter of sphere
b% in brackets gives an estimate of the amount of material formed as determined by TEM

82
0 2 4 6 8 10 12
0
20
40
60
80
-10
0
10
20
30
40
50
60
70
80
Num
ber o
f tub
es (%
)
Time (h)
Number of tubes (%) Average length
A
vera
ge L
engt
h (µ
m)
Figure 3.8. Effect of time before the addition of NH4OH on the amount (∆) and
average length (●) of tubes formed.

83
Figure 3.9. TEM image of a hollow tube obtained after 6 hours.

84
Figure 3.10. TEM image of silica fragments obtained after 12 hours.
Table 3.5 shows that stirring influences the formation and amount of tubes
formed. More tubes are formed under stirred conditions and the tubes are also
longer than the ones formed under non-stirred conditions. Table 3.6 and
Figure 3.11 show that the yield of tubes increases as the stirring rate
increases and the yield of tubes is at a maximum at 200 rpm. However; at 300
rpm no tubes are formed. Therefore the effect of stirring has two outcomes;
break-up of the assembled template or increase of TEOS diffusion to the
template. The interplay between these two effects is thus subtle and has to be
determined for every system.
5 µm

85
Table 3.5. Effect of adding NH4OH under both static and stirring conditions
(rapid addition)
Non-stirring Stirring
Sample Particle sizea
[µm]
Structureb Particle sizea
[µm]
Structureb
15 min L: 10 - 13
D: 1 – 1.5
Tubes (80%)
L: 7 - 60
D: 0.5 – 0.7
Tubes (95%)
aL = length of tube, D = diameter of tube, S = diameter of sphere
b% in brackets gives an estimate of the amount of material formed as determined by TEM
Table 3.6. Effect of stirring rate on the amount of tubes that form
Stirring rate (rpm) Tubes formed (%)b
0 70
100 80
200 97
300 0
b% in brackets gives an estimate of the amount of material formed as determined by TEM

86
0 50 100 150 200 250 300
0
20
40
60
80
100
Num
ber o
f tub
es (%
)
Stirring rate (rpm)
Figure 3.11. Effect of stirring rate on the number of tubes formed.
The solvent also plays a role in the formation of nanotubes and this is shown
in Table 3.7. A high yield of 97% is obtained when ethanol/water (1.1%)
solvent is used. The Table shows that when ethanol is used 70% of the silica
is in tubular form whereas when water alone is used only spheres are
obtained. Spherical particles are obtained when methanol is used while 10%
of the tubes are formed when iso-propanol is used. The use of different
solvents affects the pH of the reactant solution and this influences the
tube/sphere formation.

87
Table 3.7. Effect of solvent on structure and number of tubes formed
Solvent Particle size (µm)a Structureb
Ethanol L: 0.6 - 11
D: 0.4 – 0.6
S: 0.2 – 0.45
Tubes (70%) + filled spheres (30%)
H2O/EtOH L: 0.75 – 8.5
D: 0.5 – 0.6
S: 0.3 – 0.5
Tubes (97%) + filled spheres (3%)
Water S: 0.06 – 0.08 Spheres
Methanol S: 0.13 – 0.24 Spheres
Iso-propanol L: 1.7 – 2.4
D: 0.6 – 0.8
S: 0.2 – 0.7
Tubes (10%) + filled spheres (90%)
aL = length of tube, D = diameter of tube, S = diameter of sphere
b% in brackets gives an estimate of the amount of material formed as determined by TEM
The average BET surface area of all the synthesized materials was about 47
m2/g. The nitrogen adsorption-desorption isotherm of SiO2 (ethanol/water, 0
ºC) (Figure 3.12) shows a type IV isotherm with a H4 hysteresis loop,
indicating the existence of narrow slit-like pores in the material. The isotherm
shows that the sample is mesoporous with some contribution of micropores.
The t-plot diagram shows that the microporous volume represented 38% of
the total porous volume. The BJH pore size distribution reveals pores that
range from 1.7 – 3.1 nm in diameter (Figure 3.13). The peak at 1.7 nm is due

88
to the micropores that are present in the silica and the peaks at 2.4 and 2.6
nm are due to the mesopores that occur within the silica nanotube walls.
The powder XRD data reveals that the silicas produced are amorphous. The
XRD and IR results are similar to materials obtained when using tartaric acid
(see Chapter 2, Figures 2.15 and 2.16).
0.0 0.2 0.4 0.6 0.8 1.0
1
2
3
4
5
6
7
Volu
me
Ads
orbe
d (c
m3 /g
) STP
Relative Pressure (P/Po)
Desorption Adsorption
Figure 3.12. N2 adsorption-desorption isotherm of SiO2 (ethanol/water, 0 ºC).

89
Figure 3.13. BJH pore size distribution plot (adsorption mode).
The TGA curve (Figure 3.14) shows that the silica materials obtained are
thermally stable and even at 900 °C only 22% of the original weight is lost.

90
0 200 400 600 800 100075
80
85
90
95
100
Der
ivat
ive
%W
eigh
t (%
/min
)
% W
eigh
t
Temperature [°C]
-0.8
-0.6
-0.4
-0.2
0.0
Figure 3.14. TGA curve of silica obtained at 0 °C.
Mechanism of formation
Our study reveals that the morphology of the final silica materials relies on the
self-assembly of the template and the interaction between the inorganic silica
precursors and the aggregates. The self-assembly of the template is highly
influenced by synthesis conditions. Sphere formation is a competitive reaction
to tube formation. Sphere shaped templates are formed under certain
synthesis conditions (e.g. at 75 °C) while rod-like templates are formed are
favoured under certain synthesis conditions (e.g. low temperatures). Thus the
template ions (ammonium citrate ions) can form two types of templates
depending on the conditions. The formation of rod-like crystals (as found in
chapter 2 and by others14) leads to the formation of tubular silica materials.

91
In line with our study in the previous chapter and by others14 our data are
consistent with the following:
iv) formation of rod-like or sphere-like crystals (from template
molecules) by a slow aggregation process,
v) interaction of the template with the TEOS,
vi) condensation/hydrolysis of the TEOS.
Our data do not establish whether a coil like growth of the silica occurs in
the reaction.14 (Refer to Appendix 2 for coil-like growth)
Comparison of citric acid with DL-tartaric acid
DL-Tartaric acid influences the formation of longer and more uniform tubes
compared to citric acid. Tubes that are formed in DL-tartaric acid are hollow
and open ended; however the ones formed in citric acid are a mixture of filled
and hollow but closed tubes. Hollow spheres are exclusively formed when
citric acid is used under certain conditions while only filled spheres are formed
when DL-tartaric acid is used. The surface areas for the silica formed from
DL-tartaric acid are lower that the areas obtained from citric acid.
Hence it appears that the template also plays a role in the formation of various
silica morphologies. This can be attributed to the fact that crystals formed for
each template are slightly different. (The size of the molecule, orientation of
the hydroxyl groups and inter-molecular H-bonding etc. contribute to this).
Both templates can be used depending on the morphology required since
they are relatively inexpensive with comparable prices. (100 g of citric acid
cost about R 140 while 100 g of DL-tartaric acid cost R 130)

92
3.4 Conclusions
The study reveals that synthesis conditions influence the formation of
particular silica morphologies. It is thus important to carefully control these
synthesis conditions. Temperature, water/ethanol dilution, stirring rate and
solvent play a large role in structure formation. The formation of tubes is
enhanced at lower temperatures relative to elevated temperatures. This effect
can be related to diffusion and stability of the template. Only hollow spheres
are formed at 70 °C. The formation of tubes is sensitive to the amount of
water (water/ethanol dilution) present during the reaction. More tubes were
formed under stirred conditions and the tubes were also longer than the ones
formed under non-stirred conditions.
Pore size measurements indicate the existence of mesopores and some
micropores in the formed silica materials. The powder XRD data reveals that
the silicas produced are amorphous. The IR spectra of the calcined silica
materials is typical for silica derived from TEOS as reported in the literature.
TGA data shows that the silica materials obtained are thermally stable.

93
3.5 References
1. S. Mann, S.L. Burkett, S.A. Davis, C.E. Fowler, N.H. Mandelson,
S.D. Sims, D. Walsh and N.T. Whilton, Chem. Mater., 9, 2300,
(1997).
2. C.G. Göltner, S. Henke, M.C. Weisenberger and M. Antonietti,
Angeur. Chem. Int. Ed., 37, 613, (1998).
3. D. Zhao, J. Feng, Q. Huo, N. Melosh, G.U. Fredrickson, B.F.
Chmelka and G.D. Stucky, Science, 279, 548, (1998).
4. A. Imhof and D.J. Pine, Nature, 389, 948, (1997).
5. M. Antonietti, B. Berton, C.G. Göltner and H.P. Hentze, Adv. Mater.,
10, 154, (1998).
6. S.A. Davis, S.L. Burkett, N.H. Mandelson and S. Mann, Nature,
385, 420, (1997).
7. S. Baral and P. Schoen, Chem. Mater., 5, 145, (1992).
8. W. Shenton, T. Douglas, M. Young, G. Stubbs and S. Mann, Adv.
Mater., 11, 253, (1999).
9. Y. Ono, K. Nakashima, M. Sano, Y. Kanckiyo, K. Inoue, J. Iiojo and
S. Shinkai, Chem. Commun., 1477, (1989).
10. H. Nakamura and Y. Matsui, J. Am. Chem. Soc., 117, 2651, (1995).
11. L. Wang, S. Tomura, F. Ohashi, M. Maeda, M. Suzuki and K.
Inukai, J. Mater. Chem., 11, 1465, (2001).
12. E.P. Barret, L.G. Joyner and P.P. Halenda, J. Am. Chem. Soc., 73,
373, (1951).
13. W.D. Harkins and G. Jura, J. Chem. Phys., 11, 431, (1943).

94
14. F. Kleitz, F. Marlow, G.D. Stucky and F. Schüth, Chem. Mater., 13,
3587, (2001).
95
CHAPTER FOUR
TEMPLATES CONTAINING COOH AND/OR OH
GROUPS FOR THE PREPARATION OF SILICA
MATERIALS*
4.1 Introduction
Since the exciting discovery of the novel M41S family of molecular sieves by
the scientists at Mobil Corporation,1,2 the synthesis and application of
mesoporous materials have been studied extensively.3-7 Many synthetic
routes and strategies have been developed to yield a wide diversity of
materials of various framework, chemical composition and pore structures.
Recently, there have been reports of mesoporous materials with various
particle shapes such as fibers, spheres, ropes, discoids, toroids, hollow tubes,
hollow spheres and dodecahedra having being synthesized.8-17 So far, most of
these materials were synthesized using templates for directing the formation
of mesopores, which relied on the self-assembly of the templates and the
interaction between the inorganic precursors and the aggregates.18
*To be submitted for publication
96
The templates that have been used to date are surfactants, organogelators,
hydroxy carboxylic acids, as well as porous or fibrous materials such as
carbon nanotubes and membranes. Of all the templates that have been used,
hydroxy carboxylic acids seem to be the desired choice because of the low
cost and environmental friendliness of the materials.
In this study we have used mucic and tartronic acids (simple hydroxy
carboxylic acids) as structural modifiers for the formation of silica tubes and
spheres for the first time. We have also used simple carbohydrates (mostly
sugars) as templates for the formation of silica materials. Sugars are
environmentally friendly (biodegradable) and come from a cheap, renewable
and widely available resource: carbohydrates. The structures of the templates
used in this study are shown in Figure 4.1.

97
CO2H
CO2H
OHH
CO2H
CO2H
H
OHH
OHH
OHH
HO
CH2OH
CHO
H OH
HOHOHH
OH
H
CO2H
CH2OH
OH
H OH
OH
HHO
H
H
TARTRONIC ACID MUCIC ACID GLUCOSE GLUCONIC ACID
CH2OH
CH2OH
OH
OH
HH
H
HHO
HO
COO Ca
COO Ca
OHHOH
H
HOHH
OH
CO2H
COO K
OH
HOH
H
H
OHH
OHCO2H
CO2H
H
CO2HH
H
H
H
D-SORBITOL CALCIUM D-GLUCARATED-SACCHARIC ACIDMONOPOTASSIUM SALT
TRICABALLYLICACID
O
OHCH2 C C C C C O
CO2H
CO2H
H
Br
CO2H
CO2H
OH
H
H
H H
Br
DIBROMO-SUCCINICACID
MALIC ACID
OH H OH OH
H O
ASCORBIC ACID
SUCROSE
C C
CO2H CO2H
H H
MALEIC ACID
HO
H
H OH
H
O
CH2OH
H
OHH
CH2OH
OH H
HOHOH
CH2OH
Figure 4.1. Structures of all templates used.

98
4.2 Experimental
4.2.1 Preparation
Ethanol, butanol, diethyl ether and ethylmethyl ketone (Saarchem), water,
tetraethyl orthosilicate (TEOS); (Aldrich), templates (i.e. mucic acid, tartronic
acid, glucose, ascorbic acid, gluconic acid, dibromo-succinic acid, maleic acid,
DL-malic acid, calcium D-glucarate, D-saccharic acid monopotassium salt,
tricaballylic acid, D-sorbitol and sucrose) from different suppliers and
ammonium hydroxide (Fluka) were used as chemical sources.
The synthesis procedure followed a standard approach. The template (0.2 g)
was dissolved in a mixture of 50 ml solvent and 0.6 ml water. To this mixture
was added TEOS (7.3 g). The solution was left to stand for 30 minutes and
during this time a silica sol formed. Finally 20 ml of NH4OH (28% NH3
solution) was added to the sol to form a gel. The gel was aged for 2 hours and
then dried in an oven at 100 ºC. The products were calcined at 550 ºC for 4
hours. The silica was synthesized at three different temperatures, 0 ºC, room
temperature and 75 ºC. The reactions were performed under both stirred and
non-stirred conditions.
4.2.2 Characterization
The materials were characterised using the same techniques as those
described in chapters two and three (sections 2.2.2 and 3.2.2).

99
4.3 Use of Mucic and Tartronic Acids as Templates
4.3.1 Solvent Effects
a) Mucic Acid
Table 4.1 shows the effect of using mucic acid as a template, at room
temperature, on the structure of the silica material formed using different
solvents. The table shows that spherical structures are generated in ethanol
and butanol while fragmented tubes are formed in diethyl ether and ethyl
methyl ketone (EMK). This shows that beside the template, the solvent also
plays an important role in determining the resulting morphology of the silica,
presumably due to the different polarity of the solvents. This is consistent with
what was seen in the previous chapters i.e. changing or altering synthesis
conditions such as solvent changes the resulting silica morphology.
The properties of a solvent that contribute to its ability to stabilise ions by
solvation are not fully understood but are related to the polarity of the solvent.
Solvent polarity is usually expressed in terms of dielectric constants, ε, which
measure the ability of a solvent to act as an insulator of electric charges.19
Solvents of low dielectric constant such as hydrocarbons are non-polar,
whereas solvents of high dielectric constant such as water are polar. Table
4.2 lists the dielectric constants of solvents used (water is listed for
comparison purposes). The results in Table 4.1 show that tube formation is
mainly favoured when mucic acid is used with a non-polar solvent (diethyl
ether).

100
Table 4.1. Effect of solvent on the particle size and structure of silica at 25 ºCa
Solvent Particle size
[µm]b
Structurec
Ethanol S: 0.33 – 0.67 Spheres
Butanol S: 0.33 – 0.50 Spheres
Diethyl ether L: 1.13 – 3.51
D: 0.22 – 0.41
S: 0.11 – 0.33
Fragmented tubes (10%) + spheres
(90%)
Ethyl methyl
ketone
L: 1.25 – 2.54
D: 0.13 – 0.19
S: 0.13 – 0.18
Fragmented tubes (2%) + spheres
(98%)
aPrepared at 25 °C under a non-stirring condition with mucic acid as a template
bL = length of tube, D = outer diameter of tube, S = diameter of sphere
c% in brackets gives an estimate of the amount of material formed as determined by
TEM
Table 4.2. Dielectric constants of solvents used15
Solvent Dielectric constant
Water 80.4
Ethanol 25.3
Butanol 17.3
Diethyl ether 4.3
Ethyl methyl ketone 18.6

101
Table 4.3 shows the effect of solvent dilution, at room temperature, on the
structure of silicas. The table shows that when a small amount of water (1.1%,
vol %) is added to the solvent without changing other synthesis conditions the
particle sizes for the silica produced in ethanol and butanol tend to differ only
slightly. However in diethyl ether more dramatic structural changes were
noted. In general the addition of small amounts of water to a solvent has a
modest effect on the morphology and particle size of the silica.
Table 4.3. Effect of solvent dilution (1.1% water, vol %) on the morphology of
silica at 25 ºCa
Solvent Particle size [µm]b Structurec
Ethanol S: 0.33 – 0.67 Spheres
Ethanol-water S: 0.25 – 0.63 Spheres
Butanol S: 0.33 – 0.50 Spheres
Butanol-water 0.17 – 0.67 Spheres
Diethyl ether L: 1.13 – 3.51
D: 0.22 – 0.41
S: 0.11 – 0.33
Tubes (5%) + fragments (95%)
Diethyl ether-water S: 0.40 – 0.65 Spheres (4%) + fragments (96%)
aPrepared at 25 °C under a non-stirring condition with mucic acid as a template
bL = length of tube, D = outer diameter of tube, S = diameter of sphere
c% in brackets gives an estimate of the amount of material formed as determined by
TEM

102
b) Tartronic Acid
Table 4.4 shows the effect of using different solvents on the structure and
particle size of the silica when using tartronic acid as a template. Tube
formation is favoured when ethanol and diethyl ether are used, but not with
EMK. However, the tubes formed when diethyl ether was used as a solvent
are fragmented.
It is interesting to note that when tartronic acid is used as a template, tube
formation is favoured in both a slightly polar (ethanol) and non-polar (diethyl
ether) solvent. Hence it appears that besides synthesis conditions such as
solvents, the template still plays a critical role in determining the final structure
of the silica.

103
Table 4.4. Effect of solvent on the morphology of the silica at 25 ºCa
Solvent Particle size
[µm]b
Structurec
Ethanol L: 1.5 – 1.75
D: 0.75 – 0.92
S: 0.6– 0.85
Tubes (70%) + spheres (30%)
Diethyl ether L: 0.63 – 0.88
D: 0.13 – 0.63
S: 0.10 – 0.52
Fragmented tubes (95%) + spheres
(5%)
Ethyl methyl
ketone
S: 0.15 – 0.32 Spheres
aPrepared at 25 °C under a non-stirring condition with tartronic acid as a template
bL = length of tube, D = outer diameter of tube, S = diameter of sphere
c% in brackets gives an estimate of the amount of material formed as determined by
TEM
4.3.2 Temperature Effects
a) Mucic Acid
Table 4.5 shows that tube formation is favoured at lower temperatures when
diethyl ether and EMK are used as solvents. When ethanol is used spheres
are formed at all temperatures with the particle size remaining almost the
same. Spheres that are formed at 75 °C are smaller than the ones formed at
25 °C. The yield of the tubes is higher at lower temperatures and the tubes
are longer. This is because at lower temperatures there is little/less mobility of
template and TEOS. Under these conditions the template crystals and TEOS
are stable and assemble into tubes or rod-like structures.

104
Table 4.5. Effect of temperature on the morphology of silica when using
various solvents
Solvent Temperature
[ºC]
Particle size
[µm]a
Structureb
Ethanol 0 ºC S: 0.22 – 0.35 Spheres
25 ºC S: 0.33 – 0.67 Spheres
75 ºC S: 0.20 – 0.33 Spheres
Diethyl ether 0 ºC L: 1.24 – 4.33
D: 0.22 – 0.39
S: 0.13 – 0.30
Fragmented tubes
(90%) + spheres
(10%)
25 ºC L: 1.13 – 3.51
D: 0.22 – 0.41
S: 0.11 – 0.33
Fragmented tubes
(10%) + spheres
(90%)
75 ºC - Fragments
Ethyl methyl
ketone
0 ºC L: 1.25 – 5.0
D: 0.13 – 0.24
S: 0.13 – 0.20
Fragmented tubes
(20%) + spheres
(80%)
25 ºC L: 1.25 – 2.54
D: 0.13 – 0.19
S: 0.13 – 0.18
Fragmented tubes
(2%) + spheres (98%)
75 ºC S: 0.10 – 0.16 Spheres
aL = length of tube, D = outer diameter of tube, S = diameter of sphere b% in brackets gives an estimate of the amount of material formed as determined by TEM
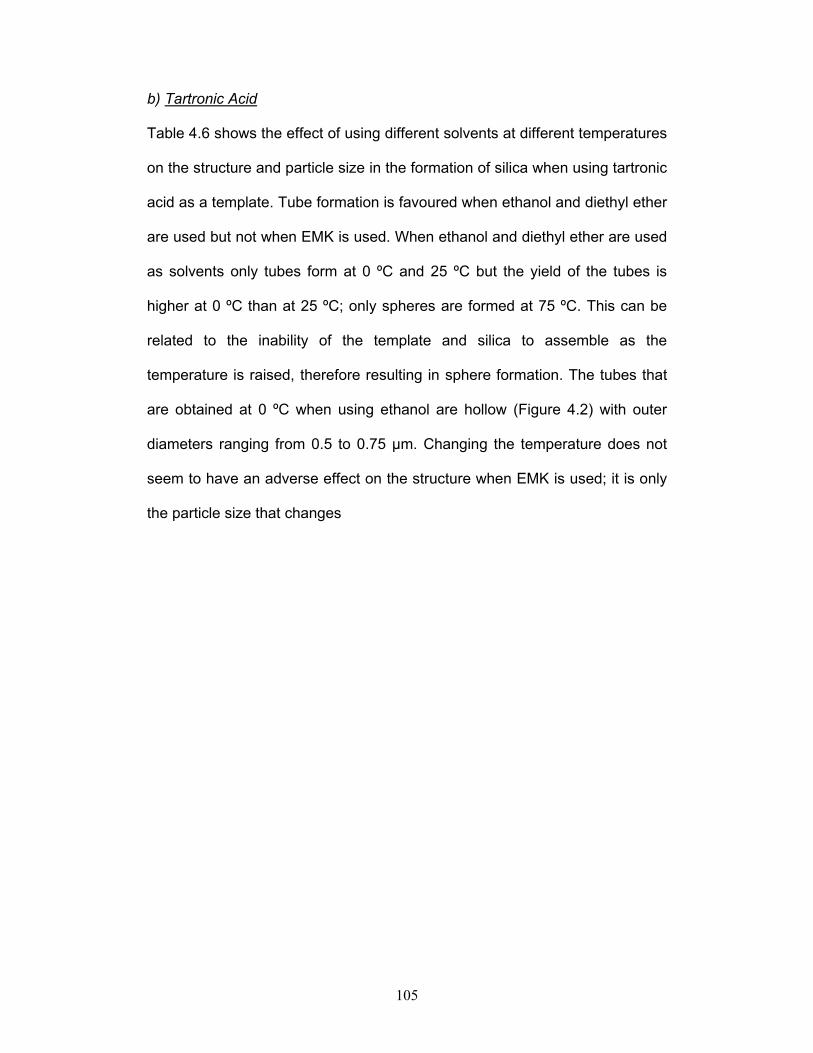
105
b) Tartronic Acid
Table 4.6 shows the effect of using different solvents at different temperatures
on the structure and particle size in the formation of silica when using tartronic
acid as a template. Tube formation is favoured when ethanol and diethyl ether
are used but not when EMK is used. When ethanol and diethyl ether are used
as solvents only tubes form at 0 ºC and 25 ºC but the yield of the tubes is
higher at 0 ºC than at 25 ºC; only spheres are formed at 75 ºC. This can be
related to the inability of the template and silica to assemble as the
temperature is raised, therefore resulting in sphere formation. The tubes that
are obtained at 0 ºC when using ethanol are hollow (Figure 4.2) with outer
diameters ranging from 0.5 to 0.75 µm. Changing the temperature does not
seem to have an adverse effect on the structure when EMK is used; it is only
the particle size that changes

106
Table 4.6. Effect of temperature on the structure and particle size of the silica
when using different solvents
Solvent Temperature
[ºC]
Particle size
[µm]a
Structureb
Ethanol 0 ºC L: 1.0 – 1.80
D: 0.5 – 0.75
S: 0.4 – 0.68
Hollow tubes (90%) +
Spheres (10%)
25 ºC L: 1.5 – 1.75
D: 0.75 – 0.92
S: 0.6 – 0.85
Fragmented tubes (70%) +
spheres (30%)
75 ºC S: 0.13 – 0.75 Spheres
Diethyl ether 0 ºC L: 5.0 – 7.0
D: 0.63 – 0.67
S: 0.10 – 0.48
Fragmented tubes (95%) +
spheres (5%)
25 ºC L: 0.63 – 0.88
D: 0.13 – 0.63
S: 0.10 – 0.52
Fragmented tubes (10%) +
spheres (90%)
75 ºC S: 0.10 – 0.22 Spheres
Ethyl methyl
ketone
0 ºC S: 0.17 – 0.25 Spheres
25 ºC S: 0.23 – 0.40 Spheres
75 ºC S: 0.15 – 0.38 Spheres
aL = length of tube, D = outer diameter of tube, S = diameter of sphere
b% in brackets gives an estimate of the amount of material formed as determined by
TEM

107
Figure 4.2 TEM image of SiO2 obtained at 0 ºC when ethanol is used as a
solvent.
4.3.3 Stirring vs Non-stirring Conditions
Stirring enhances the formation of tubes for all solvents used (Tables 4.7a and
b) regardless of the template used. This is because when the diffusion rate is
increased molecules move and assemble more easily. The nature and type of
solvent also influences the morphology of the silica materials.
0.5 µm
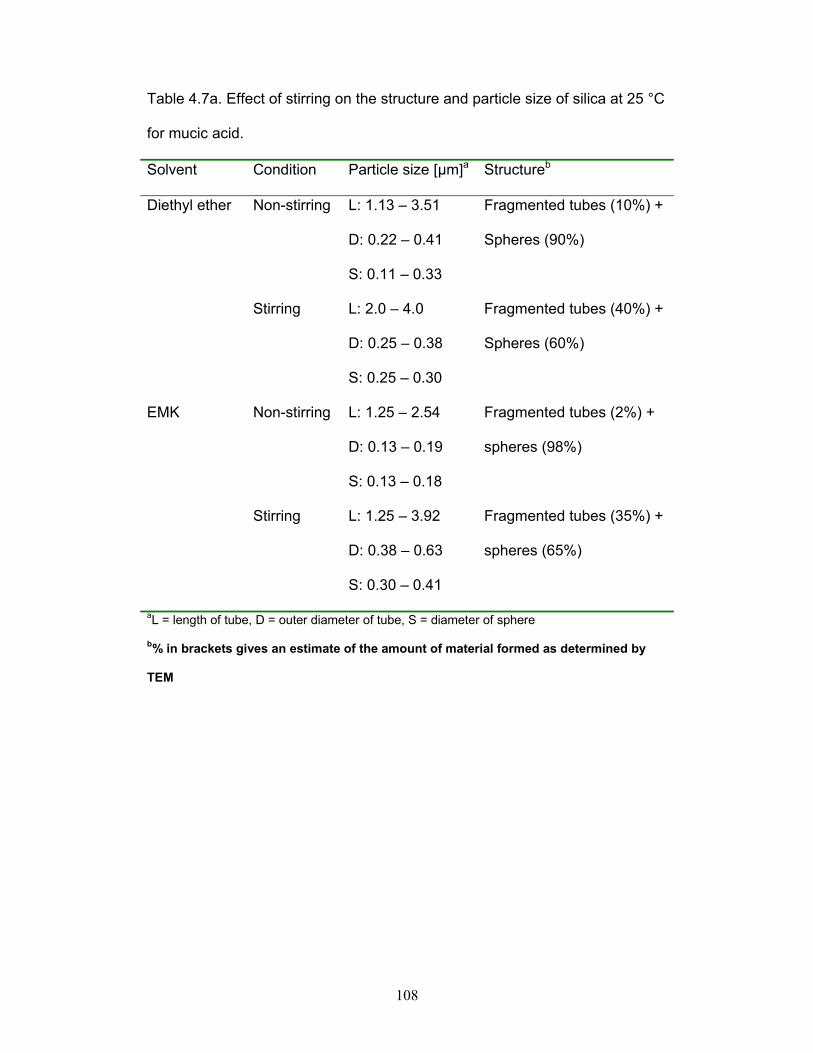
108
Table 4.7a. Effect of stirring on the structure and particle size of silica at 25 °C
for mucic acid.
Solvent Condition Particle size [µm]a Structureb
Diethyl ether Non-stirring L: 1.13 – 3.51
D: 0.22 – 0.41
S: 0.11 – 0.33
Fragmented tubes (10%) +
Spheres (90%)
Stirring L: 2.0 – 4.0
D: 0.25 – 0.38
S: 0.25 – 0.30
Fragmented tubes (40%) +
Spheres (60%)
EMK Non-stirring L: 1.25 – 2.54
D: 0.13 – 0.19
S: 0.13 – 0.18
Fragmented tubes (2%) +
spheres (98%)
Stirring L: 1.25 – 3.92
D: 0.38 – 0.63
S: 0.30 – 0.41
Fragmented tubes (35%) +
spheres (65%)
aL = length of tube, D = outer diameter of tube, S = diameter of sphere
b% in brackets gives an estimate of the amount of material formed as determined by
TEM
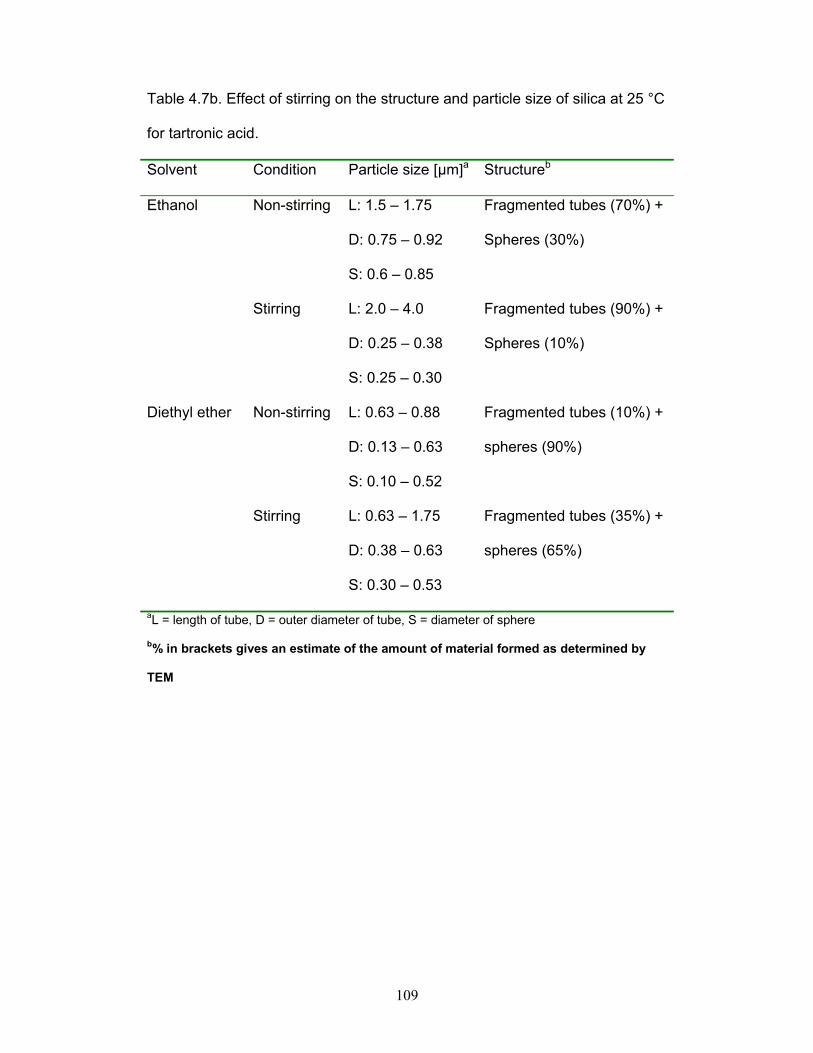
109
Table 4.7b. Effect of stirring on the structure and particle size of silica at 25 °C
for tartronic acid.
Solvent Condition Particle size [µm]a Structureb
Ethanol Non-stirring L: 1.5 – 1.75
D: 0.75 – 0.92
S: 0.6 – 0.85
Fragmented tubes (70%) +
Spheres (30%)
Stirring L: 2.0 – 4.0
D: 0.25 – 0.38
S: 0.25 – 0.30
Fragmented tubes (90%) +
Spheres (10%)
Diethyl ether Non-stirring L: 0.63 – 0.88
D: 0.13 – 0.63
S: 0.10 – 0.52
Fragmented tubes (10%) +
spheres (90%)
Stirring L: 0.63 – 1.75
D: 0.38 – 0.63
S: 0.30 – 0.53
Fragmented tubes (35%) +
spheres (65%)
aL = length of tube, D = outer diameter of tube, S = diameter of sphere
b% in brackets gives an estimate of the amount of material formed as determined by
TEM

110
4.3.4 Surface Area and Pore Analysis
Table 4.8 shows the effect of solvent and temperature on the surface area of
the silica materials obtained. When diethyl ether was used as a solvent and
mucic acid used as a template, the product formed gave high surface areas
compared to those given when ethanol and EMK were used as solvents under
the same synthesis conditions. The surface area that was obtained when
tartronic acid was used in all solvents, was very low < 20 m2/g. In general the
materials formed from tartronic acid as a template have lower surface areas
compared to the mucic acid derived ones. The textures were also different.
The tartronic acid derived silica was fluffy and light, while the mucic acid
derived silica was dense and crystal like.

111
Table 4.8. Summary of BET surface area results*
Template Solvent Temperature
[ºC]
BET Surface
Area [m2/g]
Tartronic acid Ethanol 0 8.5
25 5.3
75 10.1
Diethyl ether 0
25
75
9.7
15.6
19.4
Ethylmethyl
ketone
0 8.7
25 11.9
75 18.4
Mucic acid
Ethanol
Diethyl ether
0
25
75
0
198.4
188.2
163.5
268.1
25
75
263.5
187.7
Ethylmethyl
ketone
0 180.3
25 179.1
75 106.7
* Calcined at 550 ºC for 4 hours

112
The pore analyses of the materials obtained when using mucic acid and
diethyl ether; and tartronic acid and ethanol were carried out because the
materials gave tubes and/or spheres at certain temperatures. The nitrogen
adsorption-desorption isotherm of SiO2 synthesised from mucic acid (diethyl
ether, 25 ºC) (Figure 4.3) shows a type IV isotherm with a H2 hysteresis loop,
indicating the presence of mesopores with an interconnected network of pores
of different shapes and sizes.20 The BJH pore size distribution (Figure 4.4)
also reveals that the material is mesoporous with an average pore diameter of
3.5 nm. TEM showed the material to consist mostly of spheres and some
fragmented tubes (10%).
0.0 0.2 0.4 0.6 0.8 1.0
20
40
60
80
100
120
140
160
180
Vol
ume
Ads
orbe
d (c
m3 /g
) STP
Realative Pressure (P/Po)
Adsorption Desorption
Figure 4.3. Nitrogen adsorption-desorption isotherm of SiO2 synthesised from
mucic acid (diethyl ether, 25 ºC).

113
Figure 4.4. BJH pore size distribution for SiO2 synthesised from mucic acid
(diethyl ether, 25 ºC), desorption mode.
The nitrogen adsorption-desorption isotherm of SiO2 formed from mucic acid
(diethyl ether, 75 ºC) (Figure 4.5) also shows a type IV isotherm with a H2
hysteresis loop, indicating the presence of mesopores with an interconnected
network of pores of different shapes and sizes.20 The BJH pore size
distribution for the this sample (Figure 4.6) reveals a bimodal pore size
distribution in the material: one with an average pore diameter of 3.3 nm and
the other with a pore diameter of 4.4 nm. These different pore sizes can be
attributed to different mesopores within the amorphous fragmented
nanoparticles. TEM also showed that the material consisted of fragments with

114
different shapes and sizes. Altering synthesis conditions, in this case
temperature, affected the morphology of the material, which in turn affected
the pore size distribution.
0.0 0.2 0.4 0.6 0.8 1.00
20
40
60
80
100
120
140
160
Vol
ume
Ads
orbe
d (c
m3 /g
) STP
Relative Pressure (P/Po)
Adsorption Desorption
Figure 4.5. Nitrogen adsorption-desorption isotherm of SiO2 synthesised from
mucic acid (diethyl ether, 75 ºC).

115
Figure 4.6. BJH pore size distribution for SiO2 formed from mucic acid (diethyl
ether, 75 ºC), desorption mode.
The nitrogen adsorption-desorption isotherm of the sample formed from
tartronic acid (ethanol, 25 ºC) (Figure 4.7) shows a Type IV isotherm with a
H4 hysteresis loop, indicating the existence of narrow slit-like pores in the
material. The BJH pore size distribution of the sample reveals that the pores
range from 1.7 – 2.4 nm (Figure 4.8). The peak at 1.7 nm is due to the
micropores that are present in the silica and the peak at 2.4 nm is due to the
mesopores that occur within the silica nanotube walls.13 The t-plot diagram
showed that the microporous volume represented 46% of the total porous
volume. TEM showed the material to consist of mostly fragmented tubes with
some spheres.
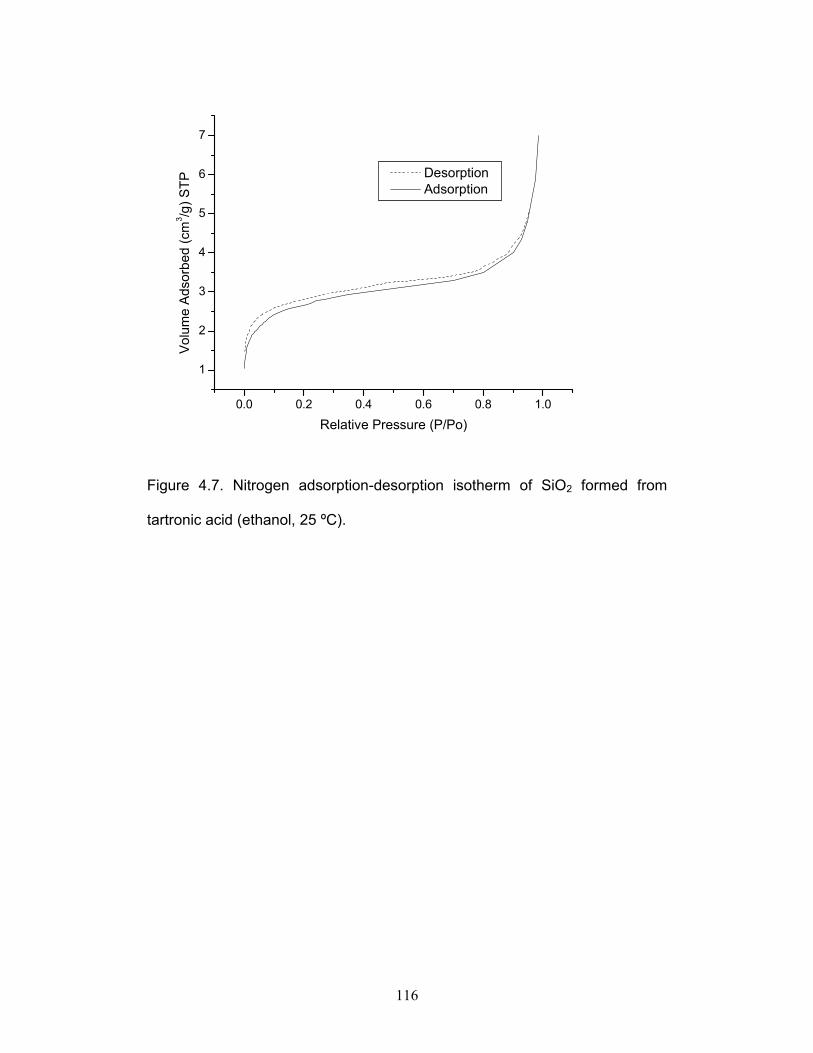
116
0.0 0.2 0.4 0.6 0.8 1.0
1
2
3
4
5
6
7
Volu
me
Ads
orbe
d (c
m3 /g
) STP
Relative Pressure (P/Po)
Desorption Adsorption
Figure 4.7. Nitrogen adsorption-desorption isotherm of SiO2 formed from
tartronic acid (ethanol, 25 ºC).

117
Figure 4.8 BJH pore size distribution for SiO2 synthesised from tartronic acid
(ethanol, 25 ºC).
The nitrogen adsorption-desorption isotherm of SiO2 formed from tartronic
acid, (ethanol, 75 ºC) also shows a Type IV isotherm with a H4 hysteresis
loop, indicating the presence of not so well defined narrow slit-like mesopores
in the material.20 The BJH pore size distribution of the sample reveals that the
pores range from 1.7 – 2.5 nm (Figure 4.10). The peak at 1.7 nm is due to the
micropores that are present in the silica and the peak at 2.5 nm is due to the
mesopores that occur in the silica. The t-plot diagram showed that the
microporous volume represented 54% of the total porous volume. TEM
showed the material to be only consisting of spheres.

118
0.0 0.2 0.4 0.6 0.8 1.00
1
2
3
4
5
6
Vol
ume
Ads
orbe
d (c
m3 /g
) STP
Relative Pressure (P/Po)
Desorption Adsorption
Figure 4.9. Nitrogen adsorption-desorption isotherm of SiO2 formed from
tartronic acid, ethanol, 75 ºC).

119
Figure 4.10. BJH pore size distribution plot for SiO2 synthesised from tartronic
acid (ethanol, 75 ºC), adsorption mode.
Table 4.9 gives a comprehensive summary of the results. From these results
one can conclude that mucic acid tends to influence the formation of materials
with mesopores while tartronic acid influences the formation of materials with
a combination of mesopores and micropores, hence the surface areas
obtained with tartronic acid are lower.

120
Table 4.9. Tabular summary of results discussed in this section.
Sample Structurea Types of pores Surface Area
(m2/g)
Mucic, diethyl
ether, 25 °C
Fragmented
tubes (10%) +
spheres (90%)
Meso pores 263
Mucic, diethyl
ether, 75 °C
Fragments Meso pores 187.7
Tartronic,
ethanol, 25 °C
Fragmented
tubes (70%) +
spheres (30%)
Meso + micro
pores
5.3
Tartronic,
ethanol, 75 °C
Spheres Meso + micro
pores
10.1
a% in brackets gives an estimate of the amount of material formed as determined by
TEM
4.3.5 Thermal Analysis
The TGA data below (Tables 4.8 and 4.9) show that the silica materials
obtained are moderately stable. Only about 16% of the original weight is lost
when the samples are heated to 900 ºC. These losses are attributed to the
loss in moisture and template respectively in the samples.

121
Table 4.10. TGA data of the material obtained when using mucic acid as a
template and diethyl ether as a solvent.
Temperature
(°C)
1st weight
loss
temperatu
re (°C)
% Weight
lost at 1st
temperature
2nd weight
loss
temperature
(°C)
% Weight
lost at 2nd
temperature
Total %
weight
loss at
900 °C
(%)
0 115 9.8 303 4.8 14.4
25 120 10 310 4.8 14.8
75 112 12 271 5 17.0
Table 4.11. TGA data of the material obtained when using tartronic acid as a
template and ethanol as a solvent.
Temperature
(°C)
1st weight
loss
temperature
(°C)
% Weight
lost at 1st
temperature
2nd weight
loss
temperature
(°C)
% Weight
lost at 2nd
temperature
Total
%
weight
loss at
900
°C
(%)
0 133 6.6 290 12.5 19.1
25 126 9.6 320 15.5 25.1
75 120 8.5 302 13.6 18.2

122
4.4 Use of Sugars as Templates
The reason that these templates were used is that it was seen in the previous
chapters of this thesis that simple organic acids such as DL-tartaric, citric and
tartronic acids acted as templates during the formation of silica nanotubes.
Matsui et al12 suggested that the hydrogen bonding that existed in these
molecules played an important role in the reaction mechanism. However a
recent article by Miyaji et al21 suggests that needle-like ammonium DL-tartrate
crystals which form almost simultaneously with polycondensed silica when
NH3 aq. is added, play the role of template. Hence it appears that NH3 aq.
plays a dual role during the synthesis, first as a source of template crystals,
and then as a basic catalyst for silica hydrolysis and polycondensation. (It is
important to note that it is only the template that was varied, not the synthesis
conditions. The synthesis in this study was carried out at room temperature
without any stirring with ethanol as a solvent).
Table 4.12 shows results obtained when carbohydrates, mostly sugars, were
used as templates. (See Figure 4.1 for the chemical structures of templates
used). In all cases the silica materials obtained had spherical morphology
(Figure 4.12) but had different sizes and surface areas. The particle sizes
ranged from 0.003 to 3 µm and the surface areas ranged from 3.6 to 61.7
m2/g.
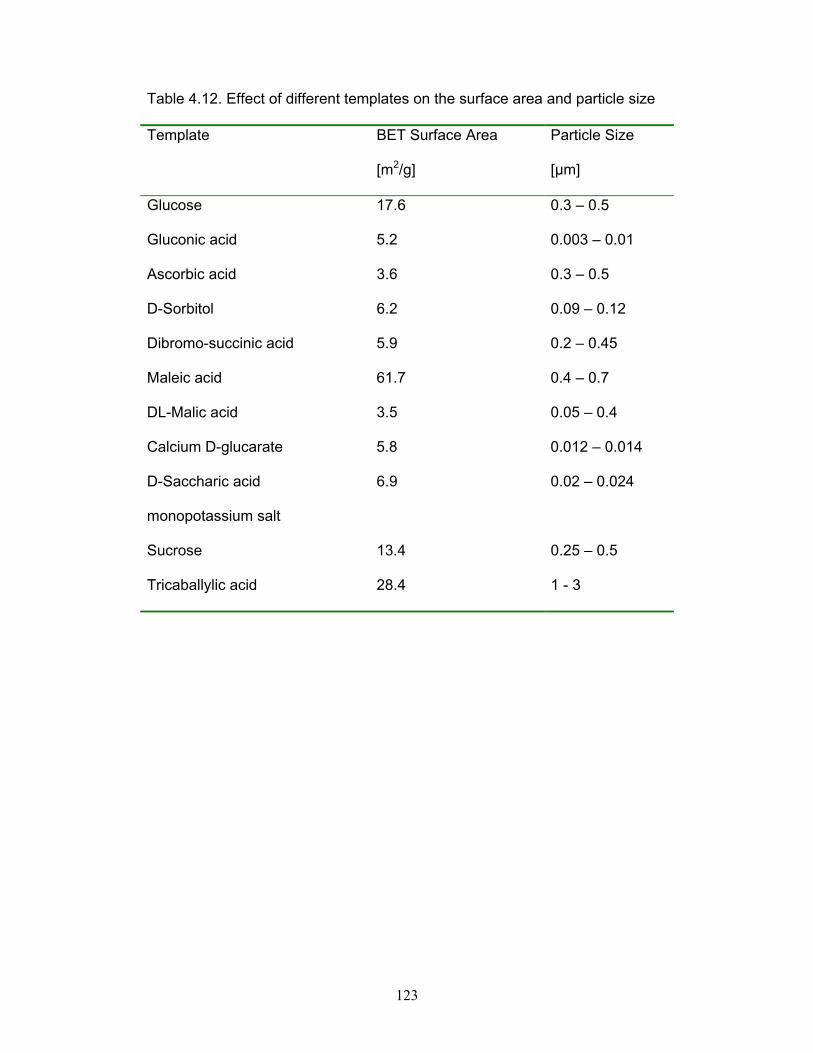
123
Table 4.12. Effect of different templates on the surface area and particle size
Template BET Surface Area
[m2/g]
Particle Size
[µm]
Glucose 17.6 0.3 – 0.5
Gluconic acid 5.2 0.003 – 0.01
Ascorbic acid 3.6 0.3 – 0.5
D-Sorbitol 6.2 0.09 – 0.12
Dibromo-succinic acid 5.9 0.2 – 0.45
Maleic acid 61.7 0.4 – 0.7
DL-Malic acid 3.5 0.05 – 0.4
Calcium D-glucarate 5.8 0.012 – 0.014
D-Saccharic acid
monopotassium salt
6.9 0.02 – 0.024
Sucrose 13.4 0.25 – 0.5
Tricaballylic acid 28.4 1 - 3

124
Figure 4.11. SEM image showing the spherical particles obtained when using
glucose as a template.
Gluconic acid, D-sorbitol, calcium D-glucarate and D-saccharic acid
monopotassium salt gave particles that are very small (in the nano-scale).
These particle sizes are much smaller than the ones that are normally
obtained by the sol-gel method. A classical example is that of silica materials
obtained by Stöber and co-workers where their particle size was in the range
0.05 - 2 µm.22 On the other hand glucose, ascorbic acid (commonly known as
vitamin C), dibromo-succinic acid, maleic acid, DL-malic acid, sucrose
(common sugar) and tricarballyic acid gave bigger particles (in the micro-
scale).
The results show that all the materials obtained from the templates used in
this section have a spherical morphology. These templates are unlike the

125
ones that were used in earlier studies, i.e. DL-tartaric, citric, mucic and
tartronic acids, which generated a combination of tubes and spheres at room
temperature.
It is possible that tubes did not form here because NH3 aq. was added after
TEOS addition and so the silica hydrolysed and polycondensed before the
template crystals could be formed. It is also possible that the NH3 solution that
was added was not in excess and hence there were not enough template
crystals formed and hence the hydrolysis and condensation proceeded
without template formation. The unique combination of hydroxyl groups and
carboxylic acid groups that is found in DL-tartaric, citric, mucic and tartronic
acids, is not found in sugars (refer to chemical structures in Figures 2.1, 3.1
and 4.1) and that might play a role in assisting with the rapid formation of
template crystals before the hydrolysis and polycondensation of the silica.
The N2 adsorption-desorption isotherms of the silicas produced from these
templates all showed Type IV isotherms with H4 hysteresis loops (e.g. data
for glucose is shown in Figure 4.12), indicating the presence of not so well
defined narrow mesopores in the materials.20 The t-plot diagrams showed that
the microporous volume represented about 50% of the total porous volume in
these materials.

126
0.0 0.2 0.4 0.6 0.8 1.0
1
2
3
4
5
6
7
Volu
me
Ads
orbe
d (c
m3 /g
) STP
Relative Pressure (P/Po)
Desorption Adsorption
Figure 4.12. N2 adsorption-desorption isotherm of SiO2 that was obtained
when glucose was used as a template.
Powder XRD diffraction patterns for all the silica materials obtained show that
only one broad peak appears between 23 – 24º, indicating that the silica
framework is amorphous (see Fig. 4.13).
The IR spectra (Figure 4.14) of these materials showed the absorption bands
to be typical of the silica derived from TEOS as reported in the literature.23,24 A
broad band around 3414 cm-1 is caused by the O-H stretching vibration mode
of the adsorbed water molecules, whose bending vibration mode is
responsible for the band recorded at 1627 cm-1. The intense peak at 1098 cm-
1 is due to the Si-O-R stretching vibration (υ1) of ethoxy groups directly

127
bonded to silicon while the peaks at 805 and 445 cm-1 are caused by the
SiOH bending bands υ2 and υ3 modes respectively.
Figure 4.13. Powder XRD pattern of silica produced when sucrose was used
as a template.

128
Figure 4.14. IR spectrum of a silica material formed from sucrose (recorded in
KBr).
4.5 Conclusions
In this study it was also shown that the template together with synthesis
conditions affect the resulting morphology of the silica. Mucic acid influences
the formation of silica materials with high surface areas, mesopores and a
morphology that reveals fragmented tubes. Tartronic acid influences the
formation of hollow tube materials with low surface areas and a combination
of micro- and mesopores. The yield of the tubes was higher at lower
temperatures for both templates. When sugars were used only spherical
particles were obtained and some sugars gave particle sizes that are smaller
than the ones that are normally obtained by the sol-gel method. Therefore it
appears that a combination of both COOH and OH groups are needed in a
template in order to obtain tubular structures.

129
4.6 References
1. C.T. Kresge, M.E. Leonowicz, W.J. Roth, J.C Vartuli and J.S. Beck,
Nature, 359, 710, (1992).
2. J.S. Beck, J.C Vartuli, W.J. Roth, M.E. Leonowicz, C.T. Kresge, K.D.
Schmitt, C.T.W. Chu, D.H. Olson, E.W. Sheppard, S.B. McCullen, J.B.
Higgins and J.L. Schlenker, J. Am. Chem. Soc., 114, 10834, (1992).
3. J.Y. Ying, C.P. Mehnert and M.S. Wong, Angew. Chem. Int. Ed., 38,
56, (1999).
4. N.K. Raman, M.T. Anderson and C.J. Brinker, Chem. Mater., 8, 1682,
(1996).
5. A. Corma, Chem. Rev., 97, 2373, (1997).
6. U. Ciesla and F. Schuth, Micro. Meso. Mater., 27, 131, (1999).
7. S. Biz, M.L. Occelli, Catal. Rev. Sci. Eng., 40, 329, (1998).
8. P.J. Bruinsma, A.Y. Kim, J. Liu and S. Baskaran, Chem. Mater., 9,
2507, (1997).
9. S.S. Park, C.H. Lee, J.H. Cheon and D.H. Park, J. Mater. Chem., 11,
Advance Article, (2001).
10. (a) M. Trau, N. Yao, E. Kim, Y. Xia, G.M. Whitesides and I.A. Aksay,
Nature, 390, 674, (1997). (b) H. Yang, N. Coombs and G.A. Ozin, Adv.
Mater., 9, 811, (1997).
11. S. Oliver, A. Kuperman, N. Coombs, A. Lough and G.A. Ozin, Nature,
1995, 378, 47, (1995).
12. H. Nakamura and Y. Matsui, J. Am. Chem. Soc., 117, 2651, (1995); (b)
H. Nakamura and Y. Matsui, Adv. Mater., 7, 871, (1995).

130
13. L. Wang, S. Tomura, F. Ohashi, M. Maeda, M. Suzuki and K. Inukai, J.
Mater. Chem., 11, 1465, (2001).
14. Y. Zhang, Y. Bando, K. Wada and K. Kurashima, J. Mater. Sci. Lett.,
18, 1911, (1999).
15. L. Sudheendra and A.R. Raju, Bull. Mater. Sci., 22, 1025, (1999).
16. F. Miyaji, S.A. Davis, J.P.H. Charmant and S. Mann, Chem. Mater., 11,
3021, (1999).
17. C.E. Fowler, D. Khushalani and S. Mann, J. Mater. Chem., 11, 1968,
(2001).
18. J.B. Pang, K.Y. Qiu and Y. Wei, J. Non-Cryst. Solids, 283, 101, (2001).
19. J. McMurry, Organic Chemistry, 3rd edition, (Brooks/Cole Publishing
Company, Pacific Grove, California, 1992).
20. W.C. Conner, S. Christensen, H. Topsøe, M. Ferrero and A. Pullen in
Characterization of Porous Solids III (Eds: J. Rouquerol, F. Rodriguez-
Reinoso, K.S.W. Sing, K.K. Unger), Elsevier, Amsterdam, 151-160,
(1994).
21. F. Miyaji, Y. Tatematsu and Y. Suyama, J. Cer. Soc Japan, 109(11),
924-928, (2001).
22. W. Stöber, A. Fink and E. Bohn, J. Coll. Int. Sci., 26, 62, (1968).
23. D.L. Wood and E.M. Rabinovich, Appl. Spectrosc., 43, 263, (1989).
24. H. Izutsu, F. Mizukami, Y. Kiyozuma and K. Maeda, J. Mater. Chem.,
7(8), 1519 – 1525, (1997).

131
PART II
THE APPLICATION OF NOVEL
SILICA MATERIALS IN THE
FISCHER-TROPSCH SYNTHESIS

132
CHAPTER FIVE
THE FISCHER-TROPSCH SYNTHESIS: AN OVERVIEW
5.1 Introduction
The Fischer-Tropsch (F-T) synthesis is a method for the production of liquid
hydrocarbons from synthesis gas (CO and H2) [derived from either coal or
natural gas] 1. It can hence be considered as an alternative to crude oil for the
production of both liquid fuels (gasoline and diesel) and chemicals (in
particular, 1-alkenes).2
The F-T synthesis was first discovered by Fischer and Tropsch in 1923 when
it was found that carbon monoxide and hydrogen reacted at high pressure in
the presence of alkalised iron catalysts to yield higher hydrocarbons.3 The F-T
synthesis has since this time been utilised at an industrial level and some
economically viable projects are in existence. The three plants run by Sasol in
South Africa4 and the Shell F-T process in Malaysia5,6 are examples.
There is an abundance of literature on various aspects of the F-T synthesis.
Consequently no attempt has been made in this chapter to give a
comprehensive literature review of the F-T synthesis reaction. Instead, a
general overview of the F-T synthesis will be given which concentrates on the
effect that various metals, supports and promoters have on the catalytic
properties of the F-T catalysts. Particular emphasis will be placed on studies
133
entailing iron as a catalyst, since this is the metal that has been studied in this
thesis.
5.2 The Fischer-Tropsch Synthesis
The F-T synthesis is a surface-catalysed polymerisation process that uses
CH2 monomers, formed by the hydrogenation of adsorbed CO, to produce
hydrocarbons with a broad range of chain length and functionality.7 The major
overall reactions encountered in the synthesis are shown below:8,9
Product forming reactions
Olefins
2nH2 + nCO → CnH2n + nH2O (5.1)
Paraffins
(2n + 1) H2 + nCO → CnH2n+2 + nH2O (5.2)
Alcohols
2nH2 + nCO → CnH2n+2O + (n – 1) H2O (5.3)
Side reactions
Water-gas shift
H2O + CO → CO2 + H2 (5.4)
Surface carbonaceous material
(x + (y/2)) H2 + xCO → CxHy + xH2O (5.5)

134
Boudouard disproportionation
CO + CO → CO2 + C (5.6)
Catalyst oxidation-reduction
a. yH2O + xM MxOy + yH2 (5.7)
b. yCO2 + xM MxOy + yCO (5.8)
Bulk carbide formation
yC + xM → MxCy (5.9)
Equations 5.1 - 5.3 provide a simplistic view of the synthesis of alkanes,
alkenes and alcohols. The water-gas shift reaction (equation 5.4) and the
Boudouard reaction (equation 5.6) [which results in the deposition of carbon]
are the main side reactions.1
The F-T synthesis is considered to be a chain polymerisation reaction and
thus the product spectrum can be described by a chain polymerisation kinetic
model.10 The equation describing the model proposed by Anderson, Schulz
and Flory (ASF model) which explains the product spectrum is shown in
equation 5.10.1
Wn/n = (1-α)2 αn-1 (5.10)
where n is the carbon number, Wn is the weight fraction of product containing
n atoms and α is the chain growth probability. Equation 5.10 can be rewritten
to give equation 5.11 which can be used to determine the chain growth
probability for a given product spectrum.

135
ln (Wn/n) = ln (1-α)2 + (n-1)lnα (5.11)
Note that α is defined in terms of the rate of chain propagation (rp) and chain
termination (rt) as shown in equation 5.12.11
α = rp/(rt + rp) (5.12)
The value of α typically lies between 0 and 1 with a higher value indicating a
greater selectivity towards waxy products.
The products from the F-T synthesis may vary depending on the catalyst
formulation and process conditions.12 Typical product distributions for low
temperature F-T (LTFT) and high temperature F-T (HTFT) are shown in Table
5.1. The product slates follow the Schultz-Flory distributions with, for LTFT,
alpha values ranging up to 0.95 or higher for LTFT reactions.
Table 5.1. Selectivity (carbon basis) of Sasol processes12
Product LTFT HTFT
CH4 4 7
C2 to C4 olefins 4 24
C2 to C4 paraffins 4 6
Gasoline 18 36
Middle distillate 19 12
Heavy oils and waxes 48 9
Water soluble oxygenates 3 6

136
5.3 Process Reactors
There are a number of commercial reactors that are currently used for the F-T
reaction. The types of reactors used can be divided into two categories, those
used for high temperature F-T (HTFT) and those used for low temperature F-T
(LTFT) reactions. The LTFT process is geared to high wax production and the
HTFT process is geared mainly for the production of alkenes and
gasoline.13,14
Originally, tubular fixed bed reactors (TFBR) were used for LTFT (Figure 5.1
(A)) at Sasol. These are the ARGE reactors that were commissioned at Sasol
in 1955.4 These reactors had various disadvantages; high pressure drops,
difficulty in replacing spent catalyst and temperature profiles in the reactors
were all disadvantages that could not be avoided.4
Consequently in 1993 a different type of LTFT reactor was commissioned
(Figure 5.1 (C)), the Sasol slurry bed reactor (SSBR).4 It consists of a shell
with cooling coils. The catalyst is suspended in a wax medium through which
the feed gas is bubbled. The reactant molecules diffuse through the liquid
phase to the catalyst particles. The products would then either diffuse back
into the bubbles and be removed as a gaseous product (light hydrocarbons
and water) or remain in the slurry and be removed as a wax (heavy
hydrocarbon products).
The SSBR has a number of advantages over the TFBR. The temperature
control is much better due to the well mixed state of the reactor, the pressure

137
drop is lower, the catalyst can be added and removed online, scale up is
relatively easy, and less capital is required for the SSBR.4,15 Low temperature
operation of the reactors facilitates wax production and thus high quality diesel
fuel5 whilst low molecular weight alkenes are favoured by high temperature
operation. Consequently the slurry reactor can be used for the synthesis of
gasoline from coal.16 Due to the promise shown by the slurry reactor, a lot of
research has been performed using slurry reactors. The research ranges from
the modelling of the slurry reactor,17,18 to catalyst testing,19-22 testing different
starting media in the reactor23 and kinetic studies.24-28
Figure 5.1. Various F-T reactors. (A) Multi-tubular ARGE fixed-bed, (B)
Circulating fluidised synthol, (C) Fixed fluidised or slurry phase14

138
The reactors used for HTFT are the circulating fluidised bed (CFB) reactors.
Sasol operates Synthol reactors at Sasol 2 and 3 (now called Sasol Synfuels)
which are of the fluidised bed type.13 These are shown in Figure 5.1 (B). The
feed gas enters the bottom of the reactor where it entrains a stream of
catalyst. The catalyst and feed gas move into the reactor zone and then to the
hopper section where the product and the catalyst disengage. The product
leaves from the top of the reactor whilst the catalyst gets recycled to the
bottom of the reactor. Due to the nature of the reactor, it is possible to replace
the old catalyst online. The reactor temperature is controlled by means of heat
exchangers in the reactor.
In 1990, Sasol commissioned a fixed fluidised bed (FFB) reactor (Figure 5.1
(C)), the Sasol Advanced Synthol (SAS) reactor for HTFT15. The reactor
consists of a vessel with a gas distributor, a fluidised bed containing the
catalyst, cooling coils in the bed and a cyclone or filter system to remove the
catalyst from the product. This reactor is a lot simpler to run than the
conventional CFB reactors with the FFB reactor being a lot less complex and
smaller than the traditional circulating fluidised bed reactors. The FFB reactor
was found to give high oil selectivities and higher conversions than that
obtained for an equivalent CFB reactor.8
5.4 Fischer-Tropsch Catalysts
The most common catalysts for CO hydrogenation (F-T synthesis) are group 8
– 10 elements: in particular iron, cobalt, ruthenium and nickel. Historically, iron
has been the catalyst of choice in industrial applications due to its low cost.8

139
Of late, cobalt has been shown to be a good catalyst for the F-T reaction as it
displays greater stability than iron5 and can be used at lower temperatures
and pressures.29,30 Cobalt based catalysts provide the best compromise
between performance and cost for the synthesis of hydrocarbons.7 However,
the choice of catalyst is largely dictated by the synthesis gas feed
composition, i.e., by the raw material used for synthesis gas production. Due
to the high water-gas-shift (WGS) activity of the iron catalyst, it is the preferred
choice for F-T synthesis with coal-derived syngas (H2/CO = 0.5 – 0.7).31 (Iron
catalysts are currently being utilised in the commercial operations at Sasol
because Sasol obtains most of the syngas used from coal since large coal
reserves are available in South Africa). For natural gas derived syngas
(H2/CO = 1.6 – 2.2) and high single pass conversions, the cobalt based
catalyst is the preferred catalyst.31
The research presented in this thesis has concentrated on the use of iron
catalysts. Some current literature on the use of Fe catalysts will hence be
reviewed. A brief mention of Co, Ru, Ni, and other metals that have been used
to catalyse the F-T synthesis, will also be given, below.
5.4.1 Iron32
Iron catalysts have been used extensively for the F-T synthesis and are
currently the catalysts utilised in the commercial operations at Sasol and
PetroSA (old name was Mossgas) in South Africa.33 The iron catalyst permits
the production of olefinic products when operated in either the low or high
alpha mode.34

140
F-T iron catalysts need alkali promotion to attain high activity and stability (e.g.
~ 0.5 wt.% K2O). Addition of Cu for metal reduction promotion, addition of
SiO2 and Al2O3 for structural promotion and even manganese can be applied
to Fe catalysts for selectivity control (e.g. high olefinicity). The working catalyst
is only obtained after reduction of the iron oxide with hydrogen, CO or syngas.
In the initial period of synthesis several iron carbide phases and elemental
carbon are formed35-40 while iron oxides are still present in addition to some
metallic iron.41 With iron catalysts two directions of selectivity have been
pursued.
One direction has aimed at a low molecular weight olefinic hydrocarbon
mixtures produced in an entrained phase or fluid bed process (Sasol Synthol
Process). Due to the relatively high reaction temperature (~ 340 ºC), the
average molecular weight of the product is so low that no liquid product phase
occurs under reaction conditions. The catalyst particles moving around in the
reactor are small (dp ~100µm)38 and carbon deposition on the catalyst does
not disturb the reactor operation. Thus a catalyst with low porosity and with
small pore diameters as obtained from fused magnetite (plus promoters) after
reduction with hydrogen is used.
The second direction in iron catalyst development has aimed at high catalyst
activity to be generated at low reaction temperatures (~ 230 °C) where most
of the hydrocarbon product is in the liquid phase under reaction conditions.
Typically, such catalysts are prepared by precipitation from nitrate solutions. A
high content of carrier or support provides mechanical strength and wide

141
pores for easy mass transfer of the reactants with the liquid product filling the
pores. The main product fraction then is paraffin wax, which is refined at
Sasol,41 or selectively hydrocracked to a high quality diesel fuel.
Thus iron catalysts are very flexible. Selective F-T synthesis of linear terminal
olefins only seems possible with iron catalysts. Alkalised iron F-T catalysts
exhibit water-gas shift activity (in contrast to cobalt catalysts). This is a
favourable feature for F-T synthesis with CO-rich syngas; as obtained from
high temperature coal- or heavy-oil-gasification, through partial oxidation
(H2/CO molar ratio < 1). However, it is undesirable for F-T synthesis with
hydrogen-rich syngas as produced from natural gas.
5.4.2 Cobalt
Cobalt catalysts yield mainly straight-chain hydrocarbons. Water is the
principal oxygenate formed with alcohol production being rare.5 Water-gas-
shift activity over cobalt is low, unlike over iron catalysts where it is
considerable.
The classical cobalt catalysts used in the first German industrial plants had
very low activity.35 One way that is used to improve the activity is to add small
amounts of a second metal such as Pt or Re42-45 to cobalt. Also due to its
cost, cobalt is typically used in the form of a supported catalyst. A number of
different supports have been used and these supports have different effects
on the CO hydrogenation activity and hydrocarbon selectivity. In this thesis
however, no experimental work was performed using a cobalt catalyst, and it

142
is therefore outside the scope of this study to review the use of cobalt
catalysts in detail. The reader is referred to a number of reviews on the role of
cobalt catalysts in the F-T reaction such as references 46 and 47.
5.4.3 Ruthenium32
Ruthenium as a F-T catalyst is of scientific interest. It is the most active
working catalyst and can be used at low reaction temperatures. It produces
the highest molecular weight hydrocarbons. It acts as a F-T catalyst as a pure
metal, without any promoters, thus providing the simplest catalytic system for
F-T synthesis. Mechanistic conclusions are thus easier to achieve – much
easier than e.g. with iron as the catalyst. Like with nickel, the selectivity
changes to mainly methane at elevated temperatures. The high price of
ruthenium and the limited world resource exclude industrial application.
Systematic F-T studies with ruthenium catalysts contribute substantially to the
further exploration of the fundamentals of F-T synthesis.
5.4.4 Nickel
Nickel is generally regarded as a methanation catalyst with its use in the F-T
synthesis being limited.5 Nickel has been shown to be active for the
methanation of synthesis gas both as an alloy48 and as a supported catalyst;
typically the support used is SiO249 or Al2O3.50 There has been limited work
reported using nickel as a F-T catalyst. Nickel has been shown to be active for
F-T synthesis when supported on TiO2,51 SiO2 or Al2O3.52,53

143
5.4.5 Other F-T Catalysts
Vannice54 determined the specific activity of a number of group 8 – 10 metals
and found that they could be ranked in the order: Ru > Fe > Ni > Co > Rh >
Pd > Pt. These measurements were performed between 240 ºC and 280 ºC
and at atmospheric pressure. From this list it is obvious as to why most
attention has been given to ruthenium, iron, nickel and cobalt as catalysts.
There has been much interest in bimetallic catalysts of late. A major objective
has been to find metals that combine to form bimetallic clusters such that the
metals are intimately connected both electronically and geometrically and the
resultant activity is greater than the sum of the two metal components.55 Most
of the group 8 – 10 metals mentioned earlier have been used in various
combinations in both supported and un-supported bimetallic systems. Iron
bimetallic systems have elicited the most interest due to its industrial
significance.56–61 Cobalt has also been used in a number of studies entailing
bimetallic catalysts. Reference 46 has an excellent review of the cobalt based
bimetallic catalysts.
5.5 Promoter Effects
The Fischer-Tropsch reaction is known to give a very large product
distribution described by the Anderson-Schulz-Flory model.62 It is possible to
alter this distribution for F-T catalysts to favour certain areas of the product
spectrum through the use of promoters. A promoter is regarded as a
component of the catalyst that does not take part in the catalytic reaction but
changes the catalytic properties the catalyst.

144
Promoter chemistry could be said to contribute in two major ways to catalysis.
Firstly a promoter could improve catalyst structural63 features such as by
enhancing the catalyst surface area while maintaining its stability in a catalytic
reaction. A structural promoter also acts as a barrier64 or spacer between
active metal crystallites, inhibiting sintering or crystallite growth. Typical
structural promoters used in F-T catalysis include SiO2, Al2O3, MnO and TiO2.
In many cases an increase is found in BET surface area as a function of
increasing levels of promoter content.38
The second way in which promoters affect catalysts is electronic in nature.
This occurs as a result of a change in the electronic environment of the
catalyst surface. This could lead to enhanced reactant gas–active site
interactions which could lead to bonding destabilization of the reactant gas.
This type of promotion is chemical65 in nature, and the promoter is referred to
as a ‘chemical promoter’. Chemical promoters also have the ability to increase
catalyst reduction levels. For example the Ruhrchemie66 precipitated iron
catalyst is promoted with Cu, which decreases the temperature of the iron
reduction. The increased reduction level results in an activity enhancement
and a shift in the product selectivity of the catalyst.
The presence of promoters, notably alkali metals on transition metal surfaces
alters the binding energy as well as the sticking probability of the reactant
molecules.67 For iron-based catalysts the probability of chain growth increases
with alkali promotion in the order Li, Na, K and Rb.68 Because of the high price
of Rb, potassium salts are generally used in practice.

145
Potassium and copper have been used as promoters in this study; therefore
they will be discussed in detail.
5.5.1 Potassium68
Potassium has long being used as a promoter for iron catalysts. It provides an
increase in the alkene yield and a decrease in the fraction of methane that is
produced.69,41 Potassium can also increase the catalytic activity for FTS and
WGS reactions.70
Dry reported the effect of potassium on iron catalysts utilized in a fixed bed
and a fluidised bed reactor that operated at different temperatures.41
According to Dry, the low temperature FTS catalytic activity decreased as the
loading of potassium increased but the high temperature reaction showed the
opposite effect. As shown in Figure 5.2, at 200 °C, the relative catalyst activity
decreased from 64 to 29 when the relative K2O content increased from 0 to
2.6. At 330 °C, the catalytic activities first increased and then stabilized at a
certain level as the relative K2O content was increased above 2 - 3. For use at
high temperature conditions, Figure 5.2 indicates that the catalytic activity can
be enhanced by potassium when its loading was lower than 3 relative to Fe,
but a further increase in K2O loading does not enhance the iron catalytic
activity.

146
Figure 5.2. Potassium effect on relative activity (drawn from data in ref. 41)
The influence of potassium on iron catalysts has also been investigated by
other researchers (e.g. references 71 – 73). It is believed that strong bases of
Group I metals have significant effects on both FTS activity and product
selectivity. Bell and co-workers found that potassium enhances the adsorption
of CO but decreases the adsorption of H2; therefore, potassium decreases
olefin hydrogenation.74,75 As the most effective promoter, potassium salts are
widely used in iron catalysts; however, the readiness to form an alkali
compound with common catalyst supports, or structural promoters such as
alumina or silica, complicates the situation. Although, potassium enhanced the
FTS activity and heavy product fraction, high potassium loadings may cover
too large of a fraction of the surface of the iron catalyst, resulting in a limited
promotion effect or even a decrease in FTS conversions. In a study by Davis
and co-workers,68 a potassium loading resulting in a K/Fe atomic ratio of
147
greater than 5 failed to further enhance the CO conversion. Bonzel and
Kerbs76 claimed that potassium lowered the methane formation rate and
increased the carbon deposition rate. It was also found that the deposited
carbon was covered by potassium compounds rather than carbon sitting on
top of the promoter. Huang and Xue Xue Bao71 studied potassium promoted
iron catalysts with X-ray photoelectron spectroscopy (XPS) and found that
two-thirds of the catalyst surface was covered by K2O and SiO2. Wang and
Xue Xue Bao72 applied the temperature programmed (TPR) technique to
study the effects of potassium. They suggested that potassium facilitates the
desorption process of carbon monoxide and strengthens the Fe-C bond.
Thus, potassium enhanced the selectivity of long chain products, i.e. it
resulted in a high-alpha product distribution.
The effects of potassium on the behaviour of iron catalysts are summarized
below.9 The presence of potassium leads to:
1. Higher α, resulting in an increase in the average molecular weight
(chain length) of hydrocarbon products (i.e. decrease in production of
methane and light gases).
2. Increased olefin/paraffin ratio in the hydrocarbon product.
3. Increased activity for the WGS reaction.
4. Increased catalyst deactivation rate resulting from a higher carbon
deposition on the catalyst.
5. Increased FTS activity at low potassium concentrations, followed by a
decrease at higher levels of promotion.

148
5.5.2 Copper
Copper is widely used as a promoter for iron FTS catalysts. It is introduced
into the catalyst material as a promoter to facilitate the reduction of the
precursor to an active catalyst. Copper nitrate is added in the requisite
proportion to the ferric nitrate solution prior to precipitation in the approximate
proportion 100Fe/ 3Cu.41
Copper is a more effective promoter than potassium in increasing the rate of
FTS, whereas the opposite applies to the WGS activity.70 Copper facilitates
the reduction of iron and thus decreases the time required to achieve steady
state in FT synthesis. The average molecular weight of the product
hydrocarbons is increased in the presence of copper, although copper is less
effective than potassium in this respect.16 Copper can also minimize the
sintering of iron catalysts by lowering the reduction temperature.41
The precipitated iron catalyst developed by Ruhrchemie and used in the fixed
bed reactors at Sasol contains about 5% wt. copper.76 Dry41 states that the
role of copper is to enhance the rate of reduction, allowing lower reduction
temperatures and yielding catalysts with a higher activity than monometallic
iron catalysts. Shah and Perrotta30 have found that Fe-Cu catalysts afford the
formation of a higher amount of C5+ (hydrocarbons containing more than five
carbon atoms) than does a pure iron catalyst. Anderson77 and Wachs et al.78
concluded that the presence of copper does not alter the activity and
selectivity of an iron catalyst. On the other hand, a number of patents have
been published claiming that copper markedly enhances the selectivity for
149
oxygenated products.79 Anderson77 and others80 have found that the presence
of copper lowers the rate of carbon formation on iron. According to Dry41
however, studies at Sasol have not confirmed this conclusion. Wachs et al.78
have also found that the rate of carbon formation is not affected by the
presence of copper (or other group 12 metals such as silver). These authors
proposed that this arose as a result of a poor contact between the respective
metals during the Fischer-Tropsch reaction.
According to a study on the effect copper on the F-T synthesis by Wielers and
co-workers76 the following conclusions can be made about iron catalysts
containing copper:
1. Fe-Cu catalysts containing a small amount of Cu exhibit a markedly
higher activity in the F-T reaction than monometallic Fe catalysts. This
is due to the fact that copper markedly enhances the reducibility of the
iron ions and as a result a higher degree of iron reduction is obtained in
the catalysts containing Cu. However, with increasing copper content
the activity decreases as expected.
2. In a broad compositional range, the selectivity is not affected by the
presence of copper. At high copper levels (> 60 wt.%) the selectivity for
CO2, CH4 and paraffins (at the expense of olefins) increases. This can
be explained by assuming that with increasing copper content side
reactions such as the WGS (producing CO2) and hydrogenation
reactions (favouring production of methane and parrafins) become
more pronounced.

150
5.6 Support Effects
The choice of support can have a considerable effect on the final activity and
selectivity of the catalysts due to interactions between the support and the
active metal.81 Generally a support with a high surface area is used to
maximise the dispersion of the metal and reduce the costs. Typically inorganic
oxides such as alumina, silica, titania, zirconia and magnesia have been
used.82 Zeolites have also been investigated as supports for F-T catalysts.6
Silica seems to be the best support for Fe-based catalysts, at least in terms of
activity and wax production.6 Alumina, partly because of its amphoteric nature,
provides a variety of interesting features especially in the isomerisation of
straight chain hydrocarbons. However in an alkali environment both silica and
alumina, although endowed with high surface areas (100 – 1000 m2/g) suffer
significant deterioration.83 Titania-supported catalysts on the other hand can
deliver relatively high hydrogenation activities due to strong-metal support
interactions.83-86
Silica is not generally used as frequently as alumina as a support, but it has
been found to be useful in some cases in which alumina cannot be used.87
For example, it is more resistant to acidic media88 than alumina and it is more
sensitive to pressure changes than alumina. This review will focus mainly on
silica since it is the support that was used in this study.
Silica is a structural promoter added to maintain the surface area16,89-90 and it
can also have a chemical effect on the catalyst properties or modify the

151
texture of the catalyst.89,91-93 The presence of silica may lead to the following
effects:16
1. Reduction in the bulk concentration of iron in the catalyst, which may
hinder mass transfer of gas to liquid as solids loadings are increased to
maintain metal concentrations.
2. Possible increase in the concentration of active metal sites by
maintaining higher metal dispersions.
3. Influence as a structural promoter in improving the aging characteristics
of the catalyst.
Egiebor and Cooper94 conducted a study of a precipitated iron catalyst on the
influence of a silica support in the F-T reaction on the selectivity to 1-olefins,
internal olefins and branched hydrocarbons in the gasoline range (C5-C11
hydrocarbons) of a precipitated iron catalyst. They found that the 1-olefin and
branched hydrocarbon selectivities decreased whereas the internal olefin
selectivity increased with an increase in the silica content of the catalyst. On
the other hand, the aromatic and alcohol contents of the products remained
relatively constant for all three catalysts tested (100Fe/ 4.2Cu/ 6.7K/ xSiO2) in
parts per weight, where x = 21, 50 or 73). Bukur and co-workers100 also
undertook a study to determine the effects of silica and alumina as binders
(supports) and process conditions on the activity and product selectivity of
precipitated iron catalysts. They found that the addition of silica or alumina to
the precipitated unsupported iron catalyst (100Fe/ 5Cu/ 4.2K) influenced the
catalyst’s activity, stability and selectivity during the Fischer-Tropsch
synthesis. The specific activity decreased with increasing support content;

152
however, the catalyst stability improved with the addition of silica. Product
selectivities also changed markedly with increasing silica content of the
catalyst, whereas no significant changes were observed with the alumina-
containing catalyst. The total olefin content and the fraction of branched
hydrocarbons both decreased, whereas the fraction of internal olefins
increased with an increase in the silica content of the catalyst. These
observations by Burkur and co-workers reflected the expected trends arising
from the reduction of surface basicity of the catalyst with increasing silica
content and were in agreement with the results obtained in previous studies
with similar catalysts.41,94
Reuel and Bartholomew96 showed that the support could significantly
influence the extent of reduction, morphology, adsorption and
activity/selectivity properties of the active phase, especially in well-dispersed
catalysts. Yoshoka et al97 using silica gel as a support for iron, reported that
the support has no influence on the oxidation state of iron, but it did influence
the degree of dispersion. These workers found that in a silica gel sample,
both the surface area and the pore volume increased when the iron
concentration was increased. These interesting results suggest that the iron
dispersion is not only affected by the surface area of the support, but also by
the pore structure of the support. Vanhove et al.98 also observed that the
chain length of hydrocarbons was related to the mean pore diameter of the
supports in Co/Al2O3 catalysts. Thus the porosity of supports for chain growth
and reactive products diffusion seems to be very important in the F-T
synthesis. However, the non-uniform pore size distribution of supports such

153
as alumina, silica, titania and zirconia, etc., might lead to a wide distribution of
hydrocarbon products.99
Recently there have been a considerable number of papers and reviews
dealing with the synthesis and characterization of highly uniform mesoporous
materials, particularly the hexagonal pore silica-based MCM-41.100-102 The so-
called M41S materials possess a periodic framework of regular mesopores,
whose size depends on the alkyl chain length of the organic template and
suitable adjustment of the preparation procedure, and is generally ca. 2 and 4
nm. The obtained materials possess interesting physical properties that make
them potentially attractive as supports or catalysts. [They usually have high
surface areas (~1000 m2/g), uniform pore size with average pore dimensions
between 1.5 and 10 nm and high thermal and hydrothermal stability]99,103.
Indeed the use of periodic mesoporous silicas as F-T supports has recently
been explored.99,103-107 The use of MCM-41 as metal catalyst support has
resulted in several cases in significant improvements compared to
conventional commercial catalyst due to superior dispersion of the active
metals105-107. Goodwin and co-workers103 showed that MCM-41 supported
cobalt catalysts have higher activities on a gram catalyst basis for F-T
synthesis at 220 °C and 1 atm than conventional silica-supported ones.
Pillared clays which are bi-dimensional porous materials108 and zeolites5,109-
110 such as ZSM-5 have also been used as supports. These materials also
have interesting characteristics when compared with conventional supports.

154
5.7 Fischer-Tropsch Mechanism and Kinetics5
The F-T synthesis has long been recognised as a polymerisation reaction with
the steps
i) reactant adsorption
ii) chain initiation
iii) chain growth
iv) chain termination
v) product desorption
vi) re-adsorption and further reaction
being the key sequence of events in the reaction.
While most of the mechanistic proposals still remain within the original four
classes put forward over the decades, namely; the surface carbide, enolic
intermediate, CO-insertion and alkoxy intermediate mechanisms,31 recent
investigators have proposed some useful generalisations which have given
rise to important ‘hybrid’ mechanisms capable of explaining the full
hydrocarbon product distribution and also the formation of alcohols, aldehydes
and acids.111 Wojciechowski112 has inferred that any F-T mechanism must
have the following characteristics:
1. Adsorption of all species on the catalyst surface onto one set of sites
resulting in the decomposition of H2 and CO to hydrogen atoms,
adsorbed C and O respectively. The interaction between these surface
species leads to the formation of CHx, OH, etc.
155
2. The monomeric species for oligomerisation is the CH2 unit and its
formation from adsorbed C and H is the rate-determining step for CO
hydrogenation kinetics.
3. The growing chain on the surface is immobile except for C1 – C4
species. Chain growth proceeds only from a monomer situated near
the growing chain. This monomer can either be formed next to the
chain or migrate via surface diffusion among an appropriate set of
sites.
4. Surface chain growth can produce spontaneous 1 – 2 shift attachments
leading to branched hydrocarbons.
5. The termination event and hence product type is determined by the
type of occupant on the site adjacent to a growing chain. This occupant
may be an appropriate species such as a hydrogen atom, adsorbed
OH or even an empty site. If, however, termination occurs after the
growing chain has undergone one or more successive 1 – 2 shifts,
internal functional groups will arise yielding β-alkenes, 2-alcohols, etc.
6. All classical distributions consist of product species that are primary
and each has its own chain length distribution on the Anderson-Schulz-
Flory (ASF) plot. This distribution is the property of a co-location
grouping of growth, monomer and termination sites which constitute a
‘growth location’ for that molecular species. The locations are stable in
composition and continue to produce only one type of molecule at a
given set of reaction conditions.

156
7. System temperature, total pressure and the H2/CO ratio are
fundamental governing factors which affect both kinetics and product
distribution.
Analysis of the F-T product distribution shows that Anderson-Schulz-Flory
(ASF) polymerisation kinetics are followed (Figure 5.3), in agreement with a
reaction involving stepwise polymerisation of C1 units. It is generally agreed
today that the C1 units are surface methylenes (>CH2), formed by the
hydrogenation of dissociated CO.113 Fischer and Tropsch were the first to
propose the involvement of surface methylene.114 This concept was later
developed by Pettit and Biloen and their collaborators who proposed an “alkyl
mechanism” (Figure 5.4) in which the chains grow by the insertion of a surface
methylene into the M-C bond of a surface alkyl, and terminate by a β-hydride
elimination from the surface alkyl to release the 1-alkene product.115-117
However, this theory has a number of shortcomings: For example, it cannot
easily account for the formation of small amounts of branched chain products
or for the formation of anomalously low amounts of C2 products. The β-
hydride elimination step is also unexpected under such strongly
hydrogenating conditions. Maitlis and co-workers,118,119 and others120,121 have
felt that the “alkyl mechanism” has significant inadequacies that require a
modification.

157
Figure 5.3. Anderson-Schulz-Flory plot of the formation of hydrocarbons from
CO hydrogenation, where W is the weight fraction of products having n carbon
atoms.
Figure 5.4. Schematic of the alkyl mechanism for the polymerisation of
surface methylenes to surface alkyls.85

158
Maitlis and co-workers have used the ideas of organometallic chemistry and
homogeneous catalysis derived from model systems, combined with the
results of experiments using 13CH2=13CH2-X (X = H, Br, etc) compounds as
probes to investigate the heterogeneously catalysed hydrogenation of CO
over metal catalysts. From these studies they proposed the “alkenyl
mechanism” for the F-T reaction, in which chain growth is initiated by a vinyl +
methylene coupling, proceeds by alkenyl + methylene coupling, and
terminates via hydrogenation of the alkenyl to yield the 1-alkene.122 This
mechanism, shown in Figure 5.5, has a number of advantages over the alkyl
mechanism, since it can explain the formation of branched products (for
example, by allyl isomerisation); the low amount of C2 products (the
mechanism for the formation of the C2 initiator is different from the subsequent
chain growth steps); and the release of 1-alkenes as primary products (by a
favourable hydrogenation reaction). Some of this work has been reviewed
recently.123 Labelling probe studies also suggest that oxygenates such as
ethanol arise from CO but not via methylenes in F-T reactions.

159
Figure 5.5. The alkenyl mechanism for the stepwise polymerisation
methylenes in the Fischer-Tropsch reaction.122
However, even the mechanistic proposal made by Maitlis has been
controversial.124,125
5.8 Aims of This Study
Fe/Cu/K2O/SiO2 catalysts have been used as commercial catalysts in the
Fischer-Tropsch reaction because silica was found to be the best support in
terms of both activity and selectivity.5,41,126 So far the studies that have been
carried out on these catalysts used relate to silica prepared by traditional
procedures.
Recently it has been reported in the literature that silica with various shapes
and sizes (e.g. spherical, tubular, porous and non-porous, mesoporous, etc.)
can be synthesized. Indeed the first part of this thesis described the synthesis

160
of these types of silicas. In this thesis we have thus investigated the effect of
silica type (i.e. hollow nanotubes, hollow and closed spheres) and content on
the activity and selectivity of Fe/Cu/K2O/SiO2 catalysts. The size and
geometry of the support are expected to influence the final distribution of the
catalyst, which in turn will affect the activity and selectivity of the catalyst.

161
5.9 References
1. C.H. Bartholomew, New Trends in CO Activation, Studies in Surface
Science and Catalysis, No. 64, (Elsevier Science Publishers,
Amsterdam, 1991), 158.
2. M.E. Dry, Appl. Catal. A: General, 189, 185, (1999).
3. F. Fischer and H. Tropsch, Brennst. Chem., 4, 276, (1923).
4. B. Jager and R. Espinoza, Catalysis Today, 23, 17, (1995).
5. A. A. Adesina, Appl. Catal. A: General, 138, 345, (1996).
6. J. Eilers, S.A. Posthuma and S.T. Sie, Catalysis Letters, 7, 253, (1997).
7. E. Iglesia, Appl. Catal. A: General, 161, 59, (1997).
8. M.E. Dry, Catalysis Today, 6, 183, (1990).
9. R.D. Srivastava, V. U. Rao, G. Cinquegrane and G.J. Stiegel,
Hydrocarbon Processing, 59, Feb, (1990).
10. H.G. Stenger and C.F. Askonas, Ind. Eng. Chem. Fundam., 25, 410,
(1986).
11. X. Zhang and P. Biloen, J. Catal., 98, 468, (1986).
12. B. Jager, Natural Gas Convention V, Studies in Surface Science and
Catalysis, vol. 119, (Elsevier Science Publishers, Amsterdam, 1998), 26
13. M.E. Dry, Appl. Catal. A: General, 138, 319, (1996).
14. B. Jager, Natural Gas Convention IV, Studies in Surface Science and
Catalysis, vol. 107, (Elsevier Science Publishers, Amsterdam, 1997),
219.
15. B. Jager, M.E. Dry, T. Shingles and A.P. Steynberg, Catal. Lett., 7, 293,
(1990).

162
16. V.U.S. Rao, G.J. Stiegel, G. Cinquegrane and R.D. Srivastava, Fuel
Proc. Tech., 30, 83 - 96, (1992).
17. S. C. Saxena, Cat. Rev. Sci. Eng., 37, 227, (1999).
18. J.R. Turner and P.L. Mills, Chem. Eng. Sci., 45, 2317, (1990).
19. J.R. Inga and B.I. Morsi, Energy and Fuels, 10, 566, (1996).
20. C.N. Satterfield and G.A. Huff, J. Catal., 73, 187, (1982).
21. G.A. Huff and C.N. Satterfield, Ind. Eng. Chem. Fundam., 21, 479,
(1982).
22. D.B. Bukur, L. Nowicki and X. Lang, Chem. Eng. Sci., 49, 4615, (1994).
23. R.J. Gormley, M.F. Zarochak, P.W. Deffenbaugh and K.R.P.M. Rao,
Appl. Catal. A: General, 161, 263, (1997).
24. G.A. Huff and C.N. Satterfield, Ind. Eng. Chem. Process Des. Dev., 23,
696, (1984).
25. I.C. Yates and C.N. Satterfield, Energy and Fuels, 5, 168, (1991).
26. W.H. Zimmerman and D.B. Burkur, Can. J. Chem. Eng., 68, 292,
(1990).
27. W.H. Zimmerman, D.B. Burkur and S. Ledakowicz, Chem. Eng. Sci.,
47, 2707, (1992).
28. H.P. Withers, K.F. Eliezer and J.W. Mitchell, Ind. Eng. Chem. Res., 29,
1807, (1990).
29. R.B. Anderson, The Fischer-Tropsch Synthesis, (Academic Press, New
York, 1984), 103.
30. Y.T. Shah and A.J. Perotta, Ind. Eng. Chem. Prod. Res. Dev., 15, 123,
(1976).
31. D.B. Bukur, and X. Lang, Ind. Eng. Chem. Res., 38, 3270, (1999).

163
32. H. Schulz, Appl. Catal. A: General, 186, 6 – 7, (1999).
33. M.E. Dry, CHEMTECH, 22, 744, (1982).
34. V.U.S. Rao, G.J. Stiegel, A.C. Bose and G.J. Cinquegrane, Prepr. Pap.-
Am. Chem. Soc. Div. Fuel Chem., 37, 184, (1982).
35. H.H. Storch, N. Golumbic and R.B. Anderson, The Fischer-Tropsch and
Related Synthesis, (Wiley, New York, 1951).
36. C.D. Frohning, H. Kölbel, M. Ralek, W. Rottig, F. Schnur and H. Schulz,
in J. Falbe (Ed.), Chemierohstoffe aus Kohle, (Georg Thieme Verlag,
Stuttgart, 1977), 219.
37. H. Schulz, G. Schaub, M. Claeys and T. Riedel, Appl. Catal. A: General,
186, 215, (1999).
38. J.W. Niemantsverdriet, A.M. van der Kraan, W.L. van Dijk and H.S. van
der Braan, J. Phys. Chem., 54, 3363, (1980).
39. C.N. Satterfield, R.T. Hanlon, S.E. Tung, Z. Zou and G.C.
Papaefthymiou, Ind. Eng. Chem. Prod. Res. Dev., 25, 401, (1986).
40. O.G. Malan, J.D. Louw and L.C. Ferreira, Brennstoff-Chem., 42, 209,
(1961).
41. M.E. Dry, in J.R. Anderson and M. Boudart (Eds.), Catalysis Science
and Technology IV, (Springer, Berlin, 1981), 159 - 255.
42. S. Vada, A. Hoff, E. Adnanes, D. Schanke and A. Holmen, Topics
Catal., 2, 155, (1995).
43. D. Schanke, S. Vada, E.A. Blekkan, A.-M. Hilmen, A. Hoff and A.
Holmen, J. Catal., 155, 40, (1995).
44. S. Eri, J.G. Goodwin, G. Marcelin and T. Riis, US Patent 4801573,
(1989).

164
45. S. Eri, G. Marcelin and J.G. Goodwin, WO 90/07377, (1990).
46. T. Chronis, A Fischer-Tropsch Study of Co/Ru Catalysts, PhD Thesis,
University of the Witwatersrand, Johannesburg, (1999).
47. J.G. Price, An Investigation into Novel Bimetallic Catalysts For Use in
the Fischer-Tropsch Reaction, PhD Thesis, University of the
Witwatersrand, Johannesburg, (1994).
48. H. Habazaki, M. Yamasaki, B. Zhang, A. Kawashima, S. Kohno, T.
Takai and K. Hashimoto, Appl. Catal. A:General, 172, 131, (1998).
49. C. Louis, Z.X. Cheng and M. Che, J. Phys. Chem., 97, 5703, (1993).
50. S.L. Chen, H.L. Zhang, J. Hu, C. Contescu and J.A. Schwarz, Appl.
Catal., 73, 289, (1991).
51. S. Ho, J.M. Cruz, M. Houalla and D.M. Hercules, J. Catal., 135, 173,
(1992).
52. C.H. Bartholomew, R.B. Pannell and J.L. Butler, J. Catal, 65, 335,
(1980).
53. Y. Huang and J.A. Schwarz, Appl. Catal., 32, 59, (1987).
54. M.A. Vannice, J. Catal., 37, 449, (1975).
55. J.H. Sinfelt and J.A. Cusumano, Advanced Materials in Catalysis, in J.J.
Burton and R.L. Garten, eds., (Academic Press, New York, 1977).
56. D.J. Duvenhage, The Preparation, Characterisation and Evaluation of
Titania Supported Fe:Co Bimetallic Catalysts for the Hydrogenation of
CO, PhD Thesis, University of the Witwatersrand, Johannesburg,
(1994).
57. J.B. Butt, L.H. Schwartz, M. Baerns and R. Malessa, Ind. Eng. Chem.
Prod. Res. Dev, 23, 51, (1984).

165
58. Z. Liu, Y. Li, J. Zhou abd B. Zhang, J. Chem. Soc. Faraday Trans., 91,
3255, (1995).
59. L. Guczi, Z. Schay, K. Matusek and I. Bogyay, Appl. Catal., 22, 289,
(1986).
60. F. Stoop and and K. van der Wiele, Appl. Catal., 23, 289, (1986).
61. T. Ishahara, K. Eguchi and H. Arai, Appl. Catal, 30, 225, (1987).
62. C.H. Bartholomew, Edited by Guczi, New Trends in CO Activation,
Studies in Surface Science and Catalysis, Vol. 64, Ch. 5, 158, (1991).
63. P. Forzatti, G. Buzzi-Ferraris, M. Morbidelli and S. Carrá, Int. Chem.
Eng., 24(1), 60, (1984).
64. J. Oudar, Chem. Ind., 20, 62, (1985).
65. M.E. Dry, J.A.K. du Plessis and G.M. Leuteritz, J. Catal., 6, 194, (1966).
66. J.T. Richardson, Principles of Catalyst Development, eds. M.V. Twigg
and M.S. Spencer, (Plenum Press, New York, 1989).
67. G. Broyden, T.N. Rhodin, C.F. Brucker, R. Benbow and Z. Hurych, Surf.
Sci., 59, 593, (1976).
68. M. Luo, R.J. O’Brien, S. Bao and B.H. Davis, Appl. Catal., 239, 111 –
120, (2003).
69. R.J. O’Brien, L. Xu, R.L. Spicer and B. Davis, in: Proceedings of the
Symposium on Syngas Convesrion to High Value Chemicals Presented
at the 211th ACS Annual Meeting, New Orleans, 24 – 29 March 1996,
pp. 252/253.
70. D.B. Bukur, D. Mukesh and S.A. Patel, Ind. Eng. Chem. Res., 29, 194,
(1990).

166
71. Z.E. Huang, Journal of Fuel Chemistry and Technology (in Chinese), 18,
143, (1990).
72. X.Z. Wang, Journal of Fuel Chemistry and Technology (in Chinese), 18,
137, (1990).
73. D.B. Bukur, L. Nowichi, X. Lang, Energy Fuels, 9, 620, (1995).
74. H. Arakawa, A.T. Bell, IEC Proc. Des. Dev., 22, 97, (1986).
75. A.D. Ronald, A. T. Bell, J. Catal., 97, 121, (1986).
76. A.F.H. Wielers, G.W. Koebrugge and J.W. Geus, J. Catal., 121, 376,
(1990).
77. R.B. Anderson, in Catalysis, (P. H. Emmett, Editor), Vol. 4, p. 1,
(Reinhold, Baltimore, 1956).
78. I.E. Wachs, D.J. Dwyer and E. Eglesia, Appl. Catal., 12, 201, (1984).
79. Deutsches Patentschrift 923127, (1955), Deutsches Patentschrift
937706, (1956).
80. US Patent 644.313, (1975).
81. M.A. Vannice, Cat. Today, 12, 255, (1992).
82. G.S. Sewell, E. van Steen and C.T. O’Connor, Catalysis Letters, 37,
255, (1996).
83. S. Bessell, Appl. Catal. A: General, 96, 253, (1993).
84. H. Brumberger, J. Catal., 92, 199, (1985).
85. Y.C. Liu, G. L. Griffin, S.S. Chan and I.E. Wachs, J. Catal., 94, 108,
(1985).
86. M.S. Spencer, J. Catal., 93, 261, (1985).
87. G.L. Haller, et al., J. Catal., 84, 477, (1983).

167
88. C. Satterfield, Heterogeneous Catalysis in Practice, (McGraw Hill, New
York, 1980), 93.
89. M.E. Dry, in: B.E. Leach (Editor), Applied Industrial Catalysis, vol. 2,
(Academic Press, New York, 1983), 167.
90. C.D. Frohning, in: J. Falbe (Editor), New Synthesis with Carbon
Monoxide, (Springer-Verlag, New York, 1980), 353.
91. C. Li, Effect of potassium and copper promoters on reduction behaviour
of precipitated iron catalysts, PhD Thesis, Texas A&M University,
(1988).
92. J.L. Rankins and C.H. Bartholomew, J. Catal., 100, 533, (1986).
93. J.A. Dalmon, R. Dutartre, G.A.C.R. Martin, Acad. Sci., Ser. C 287, 557,
(1978).
94. N.O. Egiebor and W.C. Cooper, Can. J. Chem. Eng., 63, 81 – 85,
(1985).
95. D.B. Bukur, X. Lang, D. Mukesh, W.H. Zimmerman, M.P. Rosynek and
C. Li, Ind. Eng. Chem. Res., 29, 1588 – 1599, (1990).
96. R.C. Reuel and C.H. Bartholomew, J. Catal., 85, 78, (1984).
97. T. Yoshoka, J. Koezuka and H. Ikoma, J. Catal., 16, 264, (1970).
98. D. Vanhove, Z. Zhang, L. Makambo and M. Blanchard, Appl. Catal., 9,
327, (1984).
99. D. Yin, W. Li, W. Yang, H. Xiang, Y. Sun, B. Zhong and S. Peng,
Micropor. Mesopor. Mater., 47, 16, (2001).
100. C. T. Kresge, M.E. Leonnowicz, W.J. Roth, J.C. Varuli and J.S. Beck,
Nature, 359, 710, (1992).

168
101. J.S. Beck, J.C. Vartuli, W.J. Roth, M.E. Leonnowicz, C.T. Kresge, K.D.
Schmitt, C.T. Chu, D.H. Oslon, E.W. Sheppard, S.B. McCullen, J.B.
Higginsand J.L. Schlemker, J. Am. Chem. Soc., 114, 10834, (1992).
102. X.S. Zhao, G.Q. Lu and G.J. Miller, Ind. Eng. Chem. Res., 35, 2075,
(1996).
103. J. Panpranot, J.G. Goodwin and A. Sayari, J. Catal., 211, 530, (2002).
104. J. Panpranot, J.G. Goodwin and A. Sayari, Catal. Today, 269, (2002).
105. A. Corma, V. Martines and V. Soria, J. Catal., 169, 480, (1997).
106. C. Song and K.M. Reddy, Appl. Catal. A, 176, 1, (1999).
107. F. Schuth, A. Wingen and J. Sauer, Microporous Mesoporuos Mater., 44
- 45, 465, (2001).
108. K. Sapag, S. Rojas, M. López Granados, J.L.G. Fierro and S.
Mendioroz, J. Molecular Catal. A: Chem., 167, 81 – 89, (2001).
109. N.O. Egiebor, W.C. Cooper and B.W. Wojciechowski, Appl. Catal., 55,
47, (1989).
110. S. Bessell, Appl. Catal. A, 126, 235, (1995).
111. A.T. Bell, Cat. Rev. Sci. Eng., 23 (1 & 2), 203, (1981).
112. B.W. Wojciechowski, Cat. Rev. Sci. Eng., 30(4), 629, (1988).
113. M.P. Kamisky, N. Winograd, G.L.Geoffroy and M.A. Vannice, J. Am
Chem. Soc., 108, 1315, (1986).
114. F. Fischer and H. Tropsch, Brennstoff Chem., 7, 97, (1926).
115. P. Biloen, J.N. Helle and W.M.H Bennet, J. Catal., 58, 95, (1979).
116. R.C. Brady III and R.J. Pettit, J. Am. Chem. Soc., 102, 6181, (1981).
117. R.C. Brady III and R.J. Pettit, J. Am. Chem. Soc.,103, 1287, (1881).
169
118. H.C. Long, M.L. Turner, P. Fornasiero, J. Kăspar, M. Graziani and P.M.
Maitlis, J. Catal., 167, 172-179, (1997).
119. P.M. Maitlis, R. Quyoum, H.C. Long and M.L. Turner, Appl. Catal. A:
General, 186, 363-374, (1999).
120. L.E. McCandlish, J. Catal., 83, 362, (1983).
121. R.W. Joyner, Catal. Lett., 1, 307, (1988).
122. M.L. Turner, H.C. Long, A. Shenton, P.K. Byers and P.M. Maitlis, Chem.
Eur. J., 1, 549, (1995).
123. P.M. Maitlis, H.C. Long, R. Quyoum, M.L. Turner and Z. Q. Wang, J.
Chem. Soc., Chem. Commun., 1, (1996).
124. B. Shi and B.H. Davis, Catal. Today, 58, 255 – 261, (2000).
125. S.B. Ndlovu, N.S. Phala, M. Hearshaw-Timme, P. Beagly, J.R. Moss, M.
Claeys and E. van Steen, Catal. Today, 71, 343 – 349, (2002).
126. D.B. Bukur, L. Mukesh and X. Lang, Chem. Eng. Sci., 49, 4615, (1990).

170
CHAPTER SIX
EXPERIMENTAL METHOD
6.1 Introduction
The Fischer-Tropsch (F-T) reaction system is possibly one of the most
complex reaction systems that can be studied due to the large number of
products that are formed. It is known that a large variety of factors influence
both the activity and selectivity of catalysts in this system. There are a large
number of experimental techniques that may be used to examine both the
catalysts and their activity in the F-T system.
The catalysts prepared in this study were tested in a plug flow reactor system.
Various techniques were used to characterize the catalysts and to correlate
and quantify the physical properties with the observed catalyst selectivities
and activities.
This chapter describes both the synthesis and characterization of a series of
silica-supported iron catalysts.

171
6.2 Materials and Chemicals Used
The chemicals and gases that were used for the synthesis and
characterisation of the catalysts are detailed below.
6.2.1 Support
The silica supports used in this study were synthesized by the templated sol-
gel method that was described in the first part of this thesis. The hollow
spheres were obtained when citric acid was used as a template (at 70 ºC)
while the hollow nanotubes were obtained when DL-tartaric acid was used as
a template at 0 ºC. Stöber/closed spheres were obtained when no template
was used.
A Ruhrchemie1 catalyst, where the silica source was produced from
potassium silicate, was studied to permit comparison of the new catalysts with
a known catalyst standard.
6.2.2 Metals
Ferric nitrate (Fe(NO3)3.9H2O, Saarchem), cupric nitrate (Cu(NO3)2
Saarchem) and potassium nitrate (KNO3, ACE chemicals) were used as
sources of iron, copper and potassium respectively. The precipitating agent
used was anhydrous sodium carbonate (Na2CO3, Labchem).
6.2.3 Gases
All the gases used were supplied by African Oxygen (AFROX). The gases
used for the BET surface area determination and catalyst reduction prior to

172
the F-T synthesis were Ultra High Purity (UHP) grade gases (>99.997%
purity). The synthesis gas used in the reactor experimental runs was a pre-
mixed gas (from Afrox) with a composition of 10 % Ar, 30% CO and 60% H2.
Dry air, UHP hydrogen and wet CO2 (for cooling the column to –30 ºC) were
used in the gas chromatograph (G.C).
6.3 Catalyst Preparation
In preparing the precipitate, 300 ml of 0.716 M Fe(NO3)3.9H2O and 100 ml of
0.0314 M Cu(NO3)2 (both at 80 ºC) were added to a vigorously strirred
solution containing 600 ml Na2CO3 (0.7 M solution) also at 80 ºC. The
precipitation was stopped at pH 6.9. The experimental set-up is shown in
Figure 6.1. After aging, the precipitate was washed by successive
centrifugation steps, the pellet being re-suspended in deionised water
between washings. The washing was stopped once the conductivity of the
supernatant was less than 200 µS (a Siemens conductometer was used). The
iron-copper slurry was then mixed with the SiO2-KNO3* slurry. In the case of
the Ruhrchemie catalyst an appropriate amount of dilute potassium silicate
solution was added to an iron-copper paste. The catalysts were dried
overnight at 120 ºC in a fan oven. After drying, the resulting solids were
crushed and sieved and particles between 850 – 1180 µm were collected.
*The types of silica used were hollow spheres, hollow nanotubes and
Stöber/closed spheres.

173
The catalysts were prepared such that at the end the nominal compositions
were:
(i) 9% SiO2/ 83% Fe/ 4% Cu/ 4% K
(ii) 18% SiO2/ 74% Fe/ 4% Cu/ 4% K
(iii) 27% SiO2/ 65% Fe/ 4% Cu/ 4% K
Figure 6.1. Experimental set-up used for the precipitation of the iron catalyst.2

174
6.4 Reactor System
The catalysts were evaluated for F-T activity in three plug flow reactors. The
products were analysed using a shared on-line G.C. (C1 – C9) together with
an off-line G.C. (C7 – C30).
The plug flow reactor (PFR) system is shown in Figure 6.2 and is similar to
that used by Duvenhage.3 A series of on/off valves are used to feed air,
hydrogen or synthesis gas to the system. The pressure of the system was set
using the feed gas regulators.
A Pressure regulator; B Manifold; C Shut-off valve; D Manifold; E Gas mixing; F Flow indicator; K1 Wax knockout
(120 ˚C); K2 Liquid knockout (25 ˚C); N Needle valve; P Pressure indicator; S Selection valve; T1 Valve box at 170
˚C; T2 Product lines at 170 ˚C; V1 10 port valve; V2 6 port valve
Figure 6.2. The plug flow reactor system configuration.3

175
The three plug flow reactors were run in parallel with the supply gases being
split in a manifold that directed the gases to each reactor. In addition, a
bypass line was present that bypassed syngas through a solenoid valve that
allowed the analysis of the feed.
The plug flow reactor design is shown in Figure 6.3 and is similar to that
described by Snel.4 In the reactor, there are three zones, the pre-heating zone
where the gas is heated to the reaction temperature, the reactor bed and the
region below the catalyst bed. The feed gas entered through the top of the
reactor and then flowed through the catalyst bed.
Figure 6.3. The plug flow reactor.5

176
Two knockout pots were placed below the reactor bed. The first, kept at
approximately 150 °C, was used to collect the wax fraction. The second, kept
at ambient temperature, was used to collect the water and liquid oil fraction.
A needle valve was installed after the knockout pots and was used to control
the volumetric flow through the reactor and also to maintain a backpressure in
the system. The flow-rate through the reactor was measured using soap
bubble meters. Two solenoid valves were placed in the line after this valve.
The solenoid valves were run in such a way that when the one was open the
other was closed. In this way, the gaseous product from the reactor was
directed either to the G.C. for analysis or vented to atmosphere. These valves
were connected to the timers that automated the sampling of the gaseous
sample. Each sample was analysed individually and the system automatically
cycled between the reactors and the feed. All the lines used in the system
were 1/4” or 1/8” stainless steel tubing and the fittings used were Swagelok
stainless steel fittings. The on/off valves were SS Valco valves with viton seals
and the needle valves were Whitey valves. The selection valves were Usko
solenoid valves.
All the lines after the reactors were heated at 150 ºC using a heating tape.
The reactors were heated using heating jackets. RKC Rex-C100 P.I.D.
controllers were used to control all the heating elements. The controlling
thermocouples were placed between the tape and the line for the gas lines,
and inside the catalyst bed for the reactors.

177
6.5 Fischer-Tropsch Synthesis
The catalysts were first calcined at 400 ºC for 16 hours in an oven (i.e. ex-
situ). They were pressed and crushed to sizes between 1180 – 850 µm. In all
cases 2 ml of catalyst was loaded into each plug flow reactor. The system was
pressurised and left for a few hours. If a pressure drop was observed, a leak
in the system was indicated which was then rectified. The catalyst was then
reduced in UHP hydrogen at 400 ºC and a GHSV of 500 hr-1, at 1 bar for 16
hours.
After reduction, the reactors were cooled to 250 °C, checked for leaks and the
synthesis gas was introduced to the system at a GHSV of 400 hr-1 and a
pressure of 8 bar. Synthesis was performed for a stabilisation period of 120
hours after which the mass balance period was started. The mass balance
had a duration of approximately 120 hours. Throughout this period, the
selectivity and conversion analysis was performed as described in the product
analysis section.
6.5.1 Product Analysis
The analysis of the product spectrum was divided into two parts. The first part
entailed the on-line analysis of the gaseous product and the second part
entailed the off-line analysis of liquid and wax samples.
The vapour product from each reactor was sequentially analysed. The
samples were directed to the dedicated G.C. as described earlier. The product
streams to be analysed were sampled and directed to the relevant column

178
using the sample valve configuration similar to that described by Duvenhage3.
A ten-port valve fed the sample to the Thermal Conductivity detector (TCD)
side of the analysis whilst a six-port valve was used to feed the sample to the
Flame Ionisation Detector (FID) side of the system. A TCD detector connected
to a 2 m carbosieve IIS column was used to simultaneously analyse the
sample for argon, carbon monoxide and carbon dioxide. A typical TCD trace is
shown in Figure 6.4. A FID connected to a 2 m PPQ column was used to
analyse the hydrocarbons from the vapour product (from C1 up to C9). A
typical product trace is shown in Figure 6.5.
During the mass balance period the PPQ column was replaced with a 25 m
SPB1 megabore capillary column. This column allowed the separation of
paraffin and olefin fractions and permitted the determination of the paraffin to
olefin ratios when the G.C. was operated in cryogenic mode (starting
temperature -30 ºC). A G.C. trace is shown in Figure 6.6.

179
Figure 6.4. A typical spectrum using a TCD and a Carbosieve IIS column.
Figure 6.5. The hydrocarbon separation using a Porapak Q column.

180
Figure 6.6. The separation obtained using a BP1 Megabore capillary column.
The actuated 6 port and 10 port valves were controlled using a Varian Sp
4200 integrator and the data was collected using the same integrator.
The off-line analysis of the wax and liquid fractions was performed in a G.C.
equipped with a SPB5 column connected to a FID.
6.5.2 Mass Balance Calculations
The calculations used to determine the mass balance are similar to those
used by Nijs et al.,6 Duvenhage3, Price5 and Chronis.7 The mass balance was
performed on carbon and the analysis was carried out as follows:

181
The TCD and FID data for the gaseous products were converted to data that
gave the composition by mole of the product. A calibration gas containing
hydrogen, carbon monoxide, carbon dioxide, methane, ethane and ethylene
was used to calibrate the TCD and FID data. Response factors were obtained
from Deitz8 and converted to allow calculation of molar compositions for the
different components using the method described by Scanlon.9 The equation
then used to determine the molar composition is given below:
XHC,i = AHC,i RFi XC2,cal (6.1)
AC2,cal
where XHC,I is the mole fraction of the ith hydrocarbon, XC2,cal is the mole
fraction of the C2 hydrocarbon in the calibration gas, AHC,I is the area of the ith
hydrocarbon, AC2,cal is the area of the relevant C2 hydrocarbon and RFi is the
response factor of the ith hydrocarbon. The area from a G.C. trace, for ethane
in the calibration gas was used to calibrate for alkanes and similarly that of
ethene in the calibration gas was used to calibrate for the olefins.
This molar composition thus obtained could then be used to determine the
number of carbon atoms in the vapour product stream. The masses of product
for the wax and liquid fraction were determined in the same way and added to
the gaseous product breakdown to give the product spectrum for a catalytic
reaction. The response factors of the liquid and wax stream components were
taken to be one. The mass fraction of each component is thus determined by

182
dividing its peak area by the total of all the peak areas combined. In this way
the number of carbon atoms in the two off-line streams could be determined.
The carbon monoxide conversion was determined using equation 6.2.
Conversion = COin – (COout x Arin/Arout)
x 100% (6.2)
COin
where COin is the area of the CO peak in the feed, COout is the area of the CO
peak in the gaseous product stream, Arin is the area of the argon peak in the
feed and Arout is the area of the argon peak in the product stream.
As no mass flow controllers were used, the gas flow into the reactor had to be
determined by a mass balance of argon. The equation to determine the flow-
rate into the reactor in terms of the outlet flow-rate is present in the equation
6.3.
Fin = Fout x Arout/Arin (6.3)
where Fin and Fout are the gas flow-rates into and out of the reactor in ml/s.
Once the composition of all streams, both on-line and off-line, had been
determined, it was a relatively simple task to determine the mass balance on
carbon. Additional information required for this task was the composition and

183
flow of the inlet stream as well as the flow of the product stream and the total
time for the mass balance was determined using equation 6.4.
% Mole Balance = (MCO,in – MC,vap – MC,oil – MC,wax – MCO,out – MCO2)
MCO,in (6.4)
where M refers to the total moles of carbon atoms in that category for the
mass balance period. CO in the subscript refers to carbon monoxide, C to
carbon and CO2 to carbon dioxide.
Carbon atoms that enter the reactor must equal the sum of carbon atoms
(reactant and product) that exit from the reactor. Inaccuracy in the mass
balance is expected so a mass balance of 100 ± 5% was deemed as
acceptable.
The product distributions were calculated using equation 6.5. which
represents the selectivity of the reaction to a specific component.
Si = mi/∑mn (6.5)
where Si is the mass fraction of component i and mi is the mass of component
i.
The Schulz-Flory parameter was obtained by performing a least squares fit on
a Schulz-Flory plot of the gaseous product. Equation 6.6 was fitted with the
exponential of the slope giving the required parameter.

184
ln(Wn/n) = nln(α) + ln((1 – α)2/ α) (6.6)
where Wn is the mass fraction of the hydrocarbon with n carbon units and α is
the Shultz-Flory parameter.
The olefinity of products was defined by the olefin to paraffin ratio:
[(molefin)/molefin + mparaffin)] x 100 (6.7)
for carbon numbers greater than two.
6.6 Catalyst Characterization
6.6.1 BET Surface Area Measurement
The BET surface area of the catalysts was measured using an ASAP 2010
Porosimeter. The sample was degassed overnight at 120 °C under vacuum
prior to analysis. The surface area was then determined at liquid nitrogen
temperature.9
6.6.2 Temperature Programmed Reduction (TPR)
The TPR apparatus used was the same as that used by Duvenhage.2 The
catalyst (50 mg) was loaded into a quartz U tube that was heated using a
furnace. Initially, the catalyst was heated in a nitrogen atmosphere at 150 °C
for half an hour. This was done to remove H2O from the catalyst. The catalyst
was then heated to 800 °C at 10 °C per minute under flowing hydrogen (5%
185
H2/N2 mixture) in a quartz U-tube. The various reduction steps were recorded
using a low temperature dual filament thermal conductivity detector.
6.6.3 Transmission Electron Microscopy
Transmission electron microscopy images were observed with JEOL-100S
and JEOL-2010 electron microscopes. Samples for TEM analysis were
prepared by sonicating about 1 mg sample into 1 ml ethanol for at least 4
minutes. A few drops of the suspension were added to a holey Cu grid coated
with a carbon film (made in the Wits Electron Microscope Unit or purchased
from Ted Pella Inc, USA).
6.6.4 Mössbauer Spectroscopy
The Mössbauer experiments were performed with a 50 mCi 57Co source in a
rhodium matrix. The analyses were performed at approximately 25 ºC with the
catalysts still in the wax medium to prevent re-oxidation. The data was
analysed using a least-square fitting routine that models the spectra as a
combination of quadruple doublets and sextuplets based on a Lorentzian line-
shape profile. The spectral components were identified based on their
isomeric shift (IS), quadruple splitting (QS) and hyperfine magnetic field (Bhf).
The isomeric shift values are reported relative to metallic iron (α-Fe) and the
iron content of each phase is determined from their relative peak areas,
assuming that these phases have similar recoil free fraction (f).

186
6.7 References
1. C.D. Frohning, Fischer-Tropsch-Synthese, Chemierohstoffe aus Kohle,
(J. Falbe, ed.), Stuttgart:Thieme, (1977).
2. K.L. Revombo, The Synthesis, Characterization and Catalytic
Behaviour of Precipitated Iron Catalysts Containing Sulphur, MSc
Dissertation, University of the Witwatersrand, Johannesburg, (2001).
3. D.J. Duvenhage, The Preparation, Characterisation and Evaluation of
Titania Supported Fe:Co Bimetallic Catalysts for the Hydrogenation of
CO, PhD Thesis, University of the Witwatersrand, Johannesburg,
(1994).
4. R. Snel, Chemica Scripta, 20, 99, (1982).
5. J.G. Price, An Investigation into Novel Bimetallic Catalysts For Use in
the Fischer-Tropsch Reaction, PhD Thesis, University of the
Witwatersrand, Johannesburg, (1994).
6. H.H. Nijs and P. A. Jacobs, J. Chronm. Sci., 19 (1), 40, (1981).
7. T. Chronis, A Fischer-Tropsch Study of Co/Ru Catalysts, PhD Thesis,
University of the Witwatersrand, Johannesburg, (1999).
8. W.A. Deitz, J. Gas Chrom., Feb, 62, (1967).
9. J.T. Scanlon and D.E. Willis., J. Chrom. Sci., 23, 333, (1985).
10. G. Leofanti, M. Padovan, G. Tozolla and B. Venturelli, Cat. Today, 41,
207, (1998).

187
CHAPTER SEVEN
SILICA WITH VARIOUS MORPHOLOGIES AS A
BINDER / SUPPORT FOR IRON FISCHER-TROPSCH
CATALYSTS
7.1 Introduction
Fischer-Tropsch synthesis (FTS) is recognized as a viable route for the
conversion of syngas (derived from coal or natural gas) to liquid fuels and
chemicals.1 The use of an iron-based catalyst is attractive due to its FTS
activity as well as its water-gas shift reactivity, which helps make up the deficit
H2 in the syngas from modern energy efficient coal gasifiers.2 One major
limitation relating to iron-based catalysts is that they tend to undergo attrition
during use.3 Therefore a catalyst support/binder is an essential structural
additive for iron-based FTS catalysts to improve catalyst attrition resistance
and the aging characteristics of the catalyst. The support may also have
significant effects on the catalyst activity and selectivity due to strong metal-
support interactions.4,5
Fe/Cu/K2O/SiO2 catalysts have been used as commercial catalysts in the
Fischer-Tropsch reaction. Silica was used as it is reported to be the best
support in terms of both activity and selectivity.4,5 Also from the studies that

188
have been carried out, it is believed that the addition of silica improves the
stability of the catalysts because it stabilises the iron crystallites during
synthesis and also reduces the surface basicity of the catalysts. (A detailed
description of the role of silica in silica supported catalysts is given in Chapter
5). So far the studies that have been carried out on these catalysts relate to
silica in the amorphous spherical form.2,5-13 (Conventional or traditional silica
supports are known to have a spherical shape).
The effect of support and its porosity on F-T reaction rate and hydrocarbon
selectivities still remains unclear. Mass transport limitations for carbon
monoxide and hydrocarbons in the catalyst pores, pore filling and
condensation of heavier hydrocarbons, different adsorption properties of metal
particles located in narrow and wide pores are often employed to explain the
effect of pore size on F-T reaction rates and selectivities.14 Anderson et al.15
for example, attributed the observed increase in methane selectivity with
decreasing average pore diameter to mass transport phenomenon. It was
suggested that the greater rate of diffusion of hydrogen inside pores filled with
liquid products compared to that of carbon monoxide caused an increase in
H2/CO ratio in catalyst pores, and thus, a shift toward formation of lighter
hydrocarbons. Lapszewicz et al.16 showed that variation of product distribution
as a function of catalyst pore diameter could be the result of changing
adsorption patterns of hydrogen and carbon monoxide rather than mass
transfer phenomenon. Vanhove et al.17 found that textural properties of cobalt
catalysts supported by alumina could modify the chain length of
hydrocarbons. The effect was assigned to different residence times of

189
hydrocarbons in alumina pores due to pore condensation and filling. Ernst et
al.18 studied the F-T activity and selectivity of Co/SiO2 catalysts prepared by a
pseudo sol-gel technique in acid and base media. The activity for CO
hydrogenation was found to increase with the specific surface area, and the
selectivity for heavy hydrocarbons was favoured in the case of a catalyst with
the pore diameter of a support less than 4 nm. Thus, even for the same kind
of support, the surface properties and pore size were crucial for the chain
growth and product distribution in F-T synthesis.
Since traditional mesoporous silica materials are irregularly spaced and their
pore sizes are broadly distributed, it is rather difficult to establish in which
pores Fischer-Tropsch synthesis takes place. Moreover, at F-T reaction
conditions the products, wax and carbon deposits could easily block a part of
the catalyst pores making them unavailable for reacting molecules. Recently it
has been reported in the literature that silica with various shapes and sizes
(e.g. spherical, tubular, porous and non-porous, mesoporous, etc.) can be
synthesized.19 (Indeed the first part of this thesis described the synthesis of
these types of silica). These new types of silicas can be considered as model
supports, which allow the effect of pore size and shape on catalytic behaviour
of supported catalysts to be studied.
This chapter looks at the effect of silica type (i.e. hollow nanotubes, hollow
and closed spheres) and Fe content on Fe/Cu/K2O/SiO2 catalyst activity and
selectivity. It is expected that the size and geometry of the support will
influence the final distribution of the catalyst, which in turn will affect the

190
activity and selectivity of the catalyst. The role of silica interactions will be
studied by keeping the Cu and K loading constant and by only varying the Si
(and Fe) content. A Ruhrchemie catalyst was also studied to permit
comparison of the new catalysts with a known catalyst standard.
7.2 Experimental Procedure
7.2.1 Catalyst Synthesis
• The silica support/binder was first prepared by the templated sol-gel
method. (Synthesis with DL-tartaric acid at 0 °C gave hollow nanotubes
while synthesis with citric acid at 75 °C gave hollow spheres and
synthesis without any template gave closed (Stöber) spheres). The
reader is referred to Chapters 2 and 3 for a detailed description of the
preparation method.
• Then Fe(NO3)3.9H2O and Cu(NO3)2 were precipitated at 80 °C, with
sodium carbonate as a precipitating agent. A detailed catalyst
preparation method is given in Chapter 6.
• The Fe-Cu slurry was mixed with a SiO2-KNO3* slurry. In the case of
the Ruhrchemie catalyst an appropriate amount of dilute potassium
silicate solution was added to an iron-copper paste.
• The resulting mixture was dried in an oven, and then calcined at 400
°C for 16 hours.
• The catalysts were pressed, crushed and sieved and the sizes between
850 and 1180 µm were collected.
*The types of silica used were hollow spheres, hollow nanotubes and Stöber/closed spheres.

191
The catalysts were prepared such that at the end the nominal compositions
for each of the catalyst types were:
(i) 9% SiO2/ 83% Fe/ 4% Cu/ 4% K
(ii) 18% SiO2/ 74% Fe/ 4% Cu/ 4% K
(iii) 27% SiO2/ 65% Fe/ 4% Cu/ 4% K
Throughout the chapter the 12 catalysts will be abbreviated for simplicity as
follows:
• 9% SiO2 (Ruhrchemie)/ 83% Fe/ 4% Cu/ 4% K – 9Ruhr
• 9% SiO2 (Nanotubes)/ 83% Fe/ 4% Cu/ 4% K – 9Nano
• 9% SiO2 (Stöber spheres)/ 83% Fe/ 4% Cu/ 4% K – 9Stob
• 9% SiO2 (Hollow spheres)/ 83% Fe/ 4% Cu/ 4% K – 9Holo
• 18% SiO2 (Ruhrchemie)/ 74% Fe/ 4% Cu/ 4% K – 18Ruhr
• 18% SiO2 (Nanotubes)/ 74% Fe/ 4% Cu/ 4% K – 18Nano
• 18% SiO2 (Stöber spheres)/ 74% Fe/ 4% Cu/ 4% K – 18Stob
• 18% SiO2 (Hollow spheres)/ 74% Fe/ 4% Cu/ 4% K – 18Holo
• 27% SiO2 (Ruhrchemie)/ 65% Fe/ 4% Cu/ 4% K – 27Ruhr
• 27% SiO2 (Nanotubes)/ 65% Fe/ 4% Cu/ 4% K – 27Nano
• 27% SiO2 (Stöber spheres)/ 65% Fe/ 4% Cu/ 4% K – 27Stob
• 27% SiO2 (Hollow spheres)/ 65% Fe/ 4% Cu/ 4% K – 27Holo
7.2.2 Catalyst Characterization
The catalysts were characterized using BET surface area analysis,
Temperature Programmed Reduction (TPR), Mössbauer Spectroscopy and
Transmission Electron Microscopy (TEM) as described in Chapter 6.
192
7.2.3 Catalyst Evaluation
The catalysts were evaluated for F-T activity in a system of three stainless
steel plug flow reactors (see Chapter 6 for details). A 2 ml (~1.5 g) charge of
catalyst was loaded and tested in each of the reactors.
The catalysts were reduced in flowing hydrogen at 400 °C for 16 hours at a
GHSV of 500 h-1 and a pressure of 1 bar. After reduction, the system was
allowed to cool to 250 °C and the synthesis gas (60% H2, 30% CO, 10% Ar)
was introduced at a pressure of 8 bar. The GHSV was set at 400 h-1. The gas
flowrates were controlled using needle valves. The GHSV tended to vary by
around 10%. The catalysts were initially allowed to achieve steady state over
a period of 120 h followed by a 100 – 120 h mass balance period. The data
recorded was analysed as described in Chapter 6.
7.3 Results and Discussion
7.3.1 BET Surface Area Analysis
The determination of surface area is considered to be an important
requirement in catalyst characterization, although the catalytic activity may
only be indirectly related to this “total” surface area.20 In addition it is usually
necessary to specify the pore structure since this may control the transport of
the reactants and products of a catalytic reaction in this case the Fischer-
Tropsch reaction.
The BET surface areas of as-prepared and calcined samples are listed in
Table 7.1. As expected the surface areas of all the catalyst samples

193
decreased after calcination. This is caused by the collapse of pore structure
due to removal of water of hydration from the highly porous FeOOH/Fe2O3
structure. The pore volume and diameter did not change substantially after
calcination. The introduction of SiO2 to the pores of the precipitate provided a
rigid matrix that helped to prevent complete collapse of the original pore
structure, during thermal treatment. (In general, the addition of silica to iron FT
catalysts is known to improve the stability of the porous iron oxide / hydroxide
network)5
The Ruhrchemie catalyst was found to have the highest surface area
compared to the other catalysts (i.e. catalysts supported on nanotubes, Stöber
spheres and hollow spheres). The catalysts with the composition of 18% SiO2
had the highest surface areas in each category of silica used. In general a
catalyst with a high surface area is a better catalyst because the metal is
better dispersed onto the support. It is thus expected that the 18% silica
catalyst for each silica type will perform better than the other catalysts.
From the observed surface area results, a proposed model explaining the
structure of the catalysts is shown by pictures in Figures 7.1 a, b and c. In the
9% SiO2 catalysts the iron particles are not well dispersed and hence pore
blockage occurs which results in lower surface areas than in the other
catalysts. The 18% SiO2 catalysts have higher surface areas because the iron
particles are well dispersed onto the supports and therefore not blocking the
pores. It would have been expected that the 27% SiO2 catalysts will have

194
higher surface areas than the 18% SiO2 catalysts but that was not observed in
the data.
Iron particles also contribute to the total surface area and if the iron particles
are small they will have a larger effect on the surface area compared to when
the particles are big.
a)
b)
c)
Figure 7.1. The proposed structure of a) 9% SiO2, b) 18% SiO2, c) 27% SiO2
catalysts

195
Table 7.1. BET results of catalysts
As prepared Calcined* Sample
BET
Surface
Area
(m2/g)
Pore
Volume
(cm3/g)
Pore
Diameter
(nm)
BET
Surface
Area
(m2/g)
Pore
Volume
(cm3/g)
Pore
Diameter
(nm)
9Ruhr 130.4 0.42 10.2 106.7 0.45 14.3
9Stob 40.1 0.09 7.8 19.9 0.11 9.3
9Holo 43.7 0.10 8.7 22.9 0.14 11.2
9Nano 30.6 0.08 11.5 17.1 0.10 16.4
18Ruhr 179.2 0.48 8.5 142.6 0.51 12.3
18Stob 128.9 0.19 4.9 99.5 0.22 6.7
18Holo 86.5 0.10 5.3 56.2 0.15 7.9
18Nano 75.3 0.11 6.8 45.8 0.15 9.0
27Ruhr 161.3 0.41 8.1 128.8 0.45 11.6
27Stob 56.4 0.24 5.2 28.8 0.29 6.9
27Holo 39.7 0.16 4.3 17.5 0.20 5.4
27Nano 29.8 0.17 4.9 15.6 0.20 6.6
*Calcined at 400 °C for 16 hours

196
7.3.2 Temperature Programmed Reduction (TPR) Study
TPR is a powerful tool to trace the reduction of the oxide phases, it also
provides information about the metal dispersion and metal-support interaction.
For bulk oxides an increase in Tm (temperature at maximum) is expected with
increasing particle size, whereas for supported metal oxides reduction may be
hindered or promoted depending on the nature of the interaction between the
oxide and support.21
The reduction of bulk hematite (α-Fe2O3) proceeds via magnetite (Fe3O4) and
wustite (FeO) to metallic iron.22,23 However, the formation of FeO is not
observed, because wustite is metastable below 570 °C22-24 at which
temperature disproportionation into Fe3O4 and Fe proceeds. With supported
iron catalysts the purely divalent state of iron can be stabilised well below the
critical temperature by interaction with the support due to the formation of
mixed oxides. For iron catalysts supported on SiO2 the formation of ferrous
silicates has also been reported.23,25-28
Figures 7.2 (a – d) show the TPR profiles of the catalysts after calcination (in
air) at 400 °C. Figure 7.2a shows that all the Ruhrchemie catalysts (i.e. 9%
SiO2, 18% SiO2 and 27% SiO2) reduce in two steps. The first peak at 300 –
400 °C corresponds to the reduction of Fe2O3 → Fe3O4, and the second peak
with the maximum around 530 – 580 °C corresponds to the reduction of Fe3O4
to metallic iron.2,10,19 These curves are similar to what others have reported in
the literature.2,10,18,22-24 The small shoulder that is visible on the left side of the
first peaks results from reduction of the copper promoter (CuO → Cu) which

197
subsequently facilitates the onset and increases the rate of iron reduction.
(The reduction profile of copper on silica is shown in Figure 7.3) According to
the nucleation theory, the reduction of oxide accelerates as the first metal
nuclei are formed.29 The lower reduction temperature required for copper
oxide compared to iron oxide leads to the formation of nucleation sites in
metallic copper at temperatures where metallic iron would not normally be
formed. This increase in the number of nucleation sites accelerates the
subsequent reduction of iron oxide.
Figures 7.2 b, c and d show that the reduction profiles of the 18% silicas (i.e.
nanotubes, hollow spheres, Stöber spheres) are slightly different from the
other catalysts. The first peak relates to the transitions of CuO → Cu and
Fe2O3 → Fe3O4 that occur at slightly lower temperatures i.e. the temperature
for the onset of reduction is 200 °C compared to 340 °C, which implies that
the CuO is well mixed with the Fe2O3 phase, compared to the other catalysts.
Since the 18% silicas reduce much earlier, they are expected to reduce to a
greater extent than other catalysts during an isothermal reduction in the
reactor prior to the FT reaction. The third peak that is observed for the 18%
silicas at around 630 °C, which can be associated with the occurrence of
metal-support interactions, is not expected to be observed during the
isothermal reduction. Only the TPR reducibility of 30 – 450 °C is important
since it correlates with the reducibility of the catalyst during the optimum
standard reaction procedure. This reducibility is related to the amount of
active Fe0 available for catalysing FTS after standard reduction. The broad

198
peaks that represent the Fe3O4 → α-Fe phase transformation indicate that this
is a slow process (more difficult step), which is consistent with the literature.6
a)
0 200 400 600 800
Ruhrchemie (9% SiO2)
538
357
Temperature [°C]
TCD
Res
pons
e (a
rbitr
ary
units
)
568
Ruhrchemie (18% SiO2)
577
354
365
Ruhrchemie (27% SiO2)

199
b)
0 200 400 600 800
9% Nanotubes606
434
Temperature [°C]
TCD
Res
pons
e (a
rbitr
ary
units
)
748578289
18% Nanotubes
606
433
27% Nanotubes
c)
0 200 400 600 800
9% Hollow Spheres632
407
Temperature [°C]
TCD
Res
pons
e (a
rbitr
ary
units
) 611314
18% Hollow Spheres
581
423
27% Hollow Spheres

200
d)
0 200 400 600 800
9% Stober Spheres
636
434
Temperature [°C]
695578302
18% Stober Spheres
553
416
383
27% Stober Spheres
TCD
Res
pons
e (a
rbitr
ary
units
)
Figure 7.2. TPR profiles of catalysts a) Ruhrchemies, b) Nanotubes, c) Hollow
spheres, d) Stöber spheres

201
Figure 7.3. TPR profile of copper supported on silica*.
* In this case Stöber spheres were used. It was found that the reduction of
copper is relatively unaffected by the amount and type of support used. Carniti
and co-workers30 also observed this.

202
7.3.3 Transmission Electron Microscopy (TEM) Study
TEM images of catalysts after calcination (prior to the FT synthesis) are
shown in Figures 7.4 – 7.11. The images are mostly of the 18% SiO2 catalysts
because the BET surface area measurements and TPR study showed that
their surface areas were higher than that of other catalysts (which implies
better dispersion of iron onto the supports) and also they reduced much easier
(Tonset lower by 130 °C) compared to other catalysts (except the 18Ruhr
catalyst). The images of 9Ruhr, 9Nano, 9Stob and 9Holo are included for
comparison purposes.
The images in Figure 7.4 and Figure 7.8 show that in both the 9% and 18%
Ruhrchemie catalysts, the iron phase is well mixed with the support. [The
darker regions in the images are where the iron species are located.2 In the
TPR study the reduction profiles of the catalysts showed that the copper is
intimately mixed with the iron, it is therefore very difficult to see it in a TEM
image unless an EDX is done]
In the nanotube supported catalysts (both 9% and 18%) some of the iron is
outside the tubes while much of it is inside the tubes (Figures 7.5 and 7.9). (A
XPS study was done to confirm this). The iron that is inside the tubes is well
dispersed while that which is outside the tubes is in the form of clusters that
are not well dispersed.
The Stöber sphere supported catalysts are different because the images
(Figures 7.7 and 7.11) show that the iron is not well mixed with the support. In

203
the 9Stob catalyst iron islands (not in contact with the support) are seen all
over the sample while the iron clusters in the 18Stob catalyst are slightly
dispersed onto the support.
The hollow sphere supported catalysts are the most interesting because the
iron phase is well dispersed in the 18Holo catalyst (Figure 7.6), but not well
mixed with the support in the 9Holo catalyst (Figure 7.10). Furthermore the
images in Figures 7.6 a and c show that some hollow spheres have broken
up. Figure 7.6c shows that in some regions of the catalyst the hollow sphere
structure has collapsed completely. This means that some hollow sphere
structures collapsed during the calcination process which was not expected.
In the first part of the thesis it was found that the synthesized silicas (i.e.
nanotubes, hollow spheres, etc) are thermally stable up to 900 °C. It could be
that even though the silica material itself is stable, some hollow sphere
structure collapses during the heat treatment because the walls of the
structures are not thick enough (this was observed in Figures 7.6 and 7.10).
This was not the case with the nanotubes because the TEM images show that
their tube walls are very thick.
The hollow sphere supported catalysts are therefore not expected to be good
catalysts because when some of the support structure has collapsed, it
becomes very easy for the iron to sinter and therefore become ineffective.
However the Ruhrchemie and nanotube supported catalysts are expected to

204
show some reasonable F-T activity because the iron is well dispersed onto the
support, therefore more iron will be exposed to the reaction.
Figure 7.4. TEM images of the 18Ruhr catalyst.
a)
Nanotube
Fe phase inside nanotube
Fe cluster outside nanotube
Fe and SiO2 well mixed
Fe well dispersed on SiO2
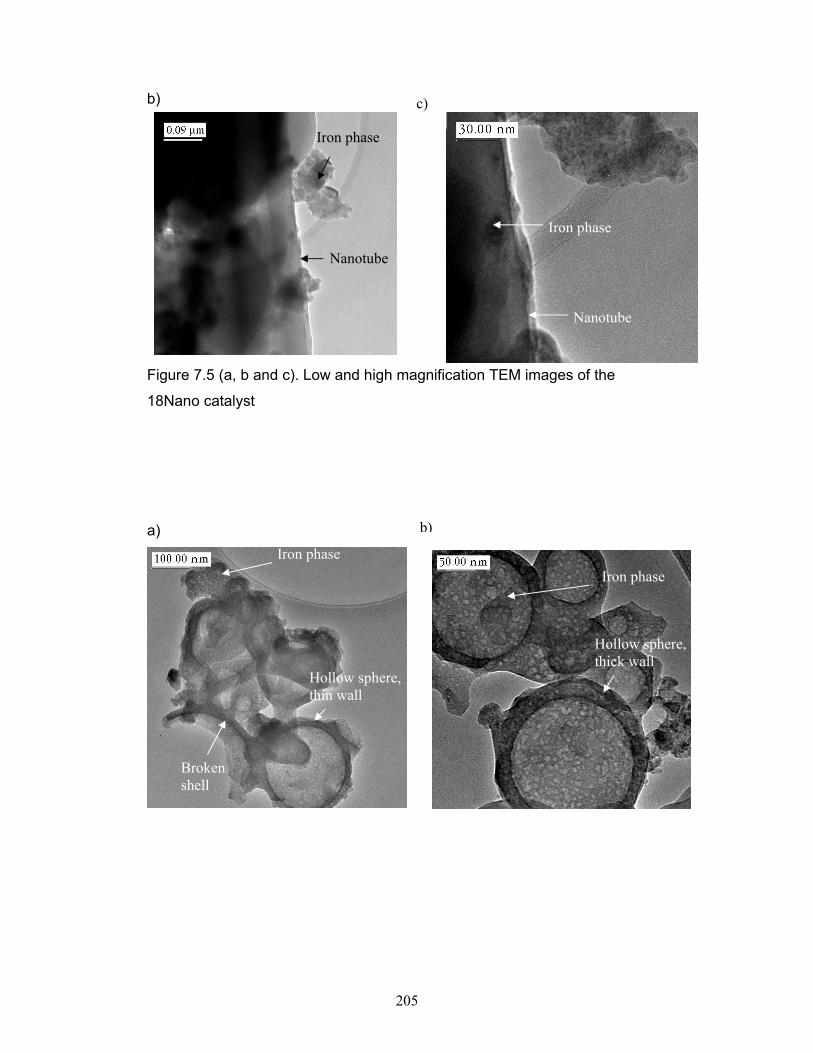
205
b)
Figure 7.5 (a, b and c). Low and high magnification TEM images of the
18Nano catalyst
a)
Nanotube
Iron phase
b)
c)
Broken shell
Iron phase
Hollow sphere, thin wall
Hollow sphere, thick wall
Iron phase
Nanotube
Iron phase

206
c)
Figure 7.6 (a, b and c). TEM images of the 18Holo catalyst.
Figure 7.7. TEM images of the 18Stob catalyst.
Iron Phase
Sphere
Iron phase
Sphere
Fe phase
Hollow sphere, thin wall

207
Figure 7.8. TEM image of 9Ruhr catalyst.
Figure 7.9. TEM images of the 9Nano catalyst.
Sp
Nanotube
Iron Phase
Nanotube, thick wall
Iron phase, both inside & outside nanotube
Fe and SiO2 well mixed

208
a) b)
Figure 7.10. a) TEM image of 9Holo catalyst, b) TEM image showing some
broken hollow spheres.
Figure 7.11. Low and high magnification TEM images of the 9Stob catalyst.
Stober
Sphere
Iron Phase
Iron phase
Iron phase
Sphere
Hollow sphere, thick wall
Broken shell
Hollow sphere, thin wall
Iron phase
209
7.3.4 Reactor Study
Catalyst activity and stability, measured by CO conversion as a function of
time on stream, are shown in Figure 7.12. It is well known from the literature
that at a fixed set of process conditions, the CO conversion can be used to
evaluate FTS activity i.e. higher conversion implies higher catalyst activity.5
The results in Figure 7.12 show that the Ruhrchemie catalyst was the most
active catalyst, followed by the catalyst supported on nanotubes, Stöber
spheres and hollow spheres respectively. Catalysts containing 18% silica
showed the best activity compared to the 9% and 27% silica catalysts. Indeed
the characterisation studies that were carried out prior to FTS showed that
1) the TPR profiles of the 18% silicas were different from the others i.e. Tonset
was lower which meant that they reduced easier and/or their extents of
reduction were higher, 2) their surface areas were slightly higher which
implied that the iron was better dispersed on the supports compared to the
other catalysts.
The 18Ruhr and 18Nano catalysts had high activities (which were almost
similar) because in both catalysts the iron was well dispersed onto the
supports which resulted in more metal being exposed to the surface and also
more metal being reduced. The Ruhrchemie catalysts had higher activities in
all catalyst categories used (i.e. 9%, 18% and 27%) because the iron was well
mixed onto the support. Whereas with the nanotube supported catalysts only
the 18Nano catalyst had a high metal dispersion (TEM studies showed this).
The observed increase in activity with increasing dispersion and degree of

210
reduction in our study is in agreement with what was observed in other iron FT
studies.13,31,32.
The 9% silica catalysts had more iron but showed lower activities, this could
be due to the fact that they were not reduced to a larger extent or that their
metal dispersions were lower compared to the 18% catalysts.
The catalyst activity normally decreases with increasing amounts of silica
because of high support to metal ratios.7 This could explain why the catalysts
with a composition of 27% SiO2 with the exception of 27Ruhr showed very low
activities. Possible explanations for the decrease in catalyst activity with the
increasing support content are 1) a lower degree of reduction and 2) a
reduction in the effective potassium content of the catalyst. The latter is due to
a reaction between potassium and silica,12,33 to form less basic silicate, or to
decreased Fe/K contact on the matrix with more silica.
The 27% silica catalysts are very stable even though the 27Nano, 27Stob and
27Holo had very low activities. The increase in stability with addition of silica
support may be the result of stabilization of iron crystallites during synthesis
and/ or interaction between the potassium and silica. The latter decreases the
surface basicity of the catalyst and thus reduces the rate of carbon deposition.
Bukur and co-workers7 also found that the FTS activity decreased with
increasing amount of SiO2, however Egiebor and Cooper11 found that the
activity changed only slightly as the support concentration increased. The
differences in trends (activity versus support concentration) in Egiebor and

211
Cooper’s study and the present study together with Burkur’s one may be due
to the differences in methods of catalyst preparation, activation procedures
and process conditions employed in the different studies.
a)
0 50 100 150 200 250 300 3504
6
8
10
12
14
16
18
20
22
Con
vers
ion
(%)
Time On Stream (h)
9% SiO2 (Ruhrchemie) 9% Nanotubes 9% Stober Spheres 9% Hollow Spheres

212
b)
0 50 100 150 200 250 300 35068
101214161820222426283032343638
Con
vers
ion
(%)
Time On Stream (h)
18% SiO2 (Ruhrchemie) 18% Nanotubes 18% Stober Spheres 18% Hollow Spheres
c)
0 50 100 150 200 250 300 350
5
10
15
20
25
30
35
Time On Stream (h)
Con
vers
ion
(%)
27% SiO2 (Ruhrchemie) 27% Nanotubes 27% Stober Spheres 27% Hollow Spheres
Figure 7.12. Effect of support type and content on catalyst activity and
stability: a) 9% SiO2, b) 18% SiO2, c) 27% SiO2

213
A summary of the activity and selectivity data is shown in Table 7.2. It appears
that the support type did not have a marked effect on the product selectivities
(hydrocarbon product distribution, olefin selectivities and CO conversion to
CO2), as no trend could be derived from the results. The graph with all the
hydrocarbon selectivities is shown in Figure 7.13. Lack of observable
differences in methane (except 18Nano catalyst) and higher hydrocarbon
selectivities indicated that the increased activity in the 18Ruhr and 18Nano
catalysts was not due to an electronic iron-support effect. It was more likely a
result of increased iron dispersion.
Figure 7.14 shows a plot of the olefin to paraffin ratios of catalysts. The
18Nano and 18Ruhr catalysts formed more C4 and C5 olefins than other
catalysts. Previous studies4,5,9 have shown that olefins are produced as
primary products of Fischer-Tropsch synthesis over iron catalysts. Paraffins
are also formed directly but to a lesser extent. It is then conceivable that the
high percentage of paraffinic hydrocarbons observed with the other catalysts
(other than 18Nano and 18Ruhr) arises from the hydrogenation of olefins
The α values for all the catalysts were high which relate to the observation
that mostly high molecular weight products were formed. This is because in
low temperature F-T (250 °C was used in the study) higher hydrocarbon
products are predominantly formed. Also the potassium that was added to the
catalysts increases the chain length of the hydrocarbon products. The effect of
potassium on hydrocarbon selectivities observed in the present study is in

214
agreement with the results obtained in several earlier studies with a variety of
iron catalysts.4,7,8,9
The ratio of CO2 production to total CO consumption represents a measure of
the water-gas shift (WGS) activity, and is listed in Table 7.2. The use of
different supports did not have a marked effect on the WGS activity, as no
trends could be derived for the catalysts, although the 18Nano catalyst
showed the lowest WGS activity. This may be attributed to potassium that is
present in the catalysts. Potassium is known to promote the rate of WGS
reaction.7-10 Thus the catalyst behaviour, with respect to the WGS activity,
was largely determined by the potassium content rather than differences
arising from the use of different supports.

215
Table 7.2. Summary of reactor study data
Sample 9Ruhr 9Nano 9Holo 9Stob 18Ruhr 18Nano 18Holo 18Stob 27Ruhr 27Nano 27Holo 27StobTime on stream (h) 336 336 336 336 336 336 336 336 336 336 336 336 CO Conversion (%) 18.8 11.3 5.2 10.2 35.1 36.3 11.8 24.1 30.4 5.4 3.7 4.4 rco* (Specific activity) 1.73 0.88 0.47 0.61 8.75 5.34 0.85 1.92 0.76 0.45 0.33 0.41 Extent of WGS 0.63 0.86 0.81 0.68 0.75 0.31 0.38 0.65 0.82 0.45 0.69 0.64 Hydrocarbon selectivity (%)
C1 3.8 4.2 2.4 3.8 4.8 10.4 4.5 4.0 4.2 5.1 6.2 3.9 C2 - C5 9.4 9.5 12.2 10.1 8.9 15.1 9.4 9.5 8.6 14.5 16.3 10.8 C6 – C10 11.8 27.0 21.4 24.3 15.4 16.2 11.8 11.5 12.0 16.7 19.3 18.4 C11 – C15 11.9 24.8 23.4 25.9 34.4 28.5 28.2 12.3 50.0 29.3 25.7 30.2 C16+ 63.1 35.2 40.6 35.9 36.5 29.9 46.1 62.6 24.4 34.4 32.5 36.7 Olefin / paraffin ratio C3=/C3 0.46 0.26 0.44 0.21 0.71 - - 0.30 - 0.21 0.19 0.25 C4=/C4 0.16 0.34 0.51 0.35 0.63 0.85 0.26 0.22 0.63 0.53 0.24 0.33 C5=/C5 0.17 0.29 0.24 0.32 0.70 0.74 0.39 0.23 0.60 0.65 0.28 0.31 C6=/C6 0.54 0.48 0.23 0.51 0.19 0.16 0.52 0.55 0.18 0.39 0.31 0.52 C7=/C7 0.59 0.31 0.39 0.40 - 0.21 0.37 0.57 - 0.30 - 0.44 α value 0.88 0.79 0.82 0.72 0.88 0.70 0.84 0.89 0.81 0.80 0.75 0.84 * rco = mmol CO reacted / g/ s

216
C1 C2 - C5 C6 - C10 C11 - C15 C16+0
10
20
30
40
50
60
Sel
ectiv
ity (%
)
9Ru 9Nano 9Holo 9Stob 18Ru 18Nano 18Holo 18Stob 27Ru 27Nano 27Holo 27Stob
Figure 7.13. Selectivities of catalysts
C3=/C3 C4=/C4 C5=/C5 C6=/C6 C7=/C70.0
0.1
0.2
0.3
0.4
0.5
0.6
0.7
0.8
0.9
Ole
fin /
Para
ffin
ratio
9Ru 9Nano 9Holo 9Stob 18Ru 18Nano 18Holo 18Stob 27Ru 27Nano 27Holo 27Stob
Figure 7.14. Olefin to paraffin ratios of catalysts

217
7.3.5 Mössbauer Spectroscopy
After 336 hours on stream when the catalysts were still fairly stable and
active, they were taken out of the reactor in order to do Mössbauer
spectroscopy analyses. Mössbauer spectroscopy was used as a bulk
characterisation technique to identify the phases that are present in the
‘working’ catalysts, so as to relate the nature of the working catalyst with the
active phase(s) responsible for F-T synthesis.6,10,34
Currently there is disagreement or confusion on this relationship caused by
the fact that the reduction of the iron catalyst in hydrogen may lead to a zero-
valent iron state, but upon exposure to a synthesis gas the metallic iron is
rapidly converted to a carbide phase or a mixture of carbides.4,10,35-37 Further
at high syngas conversions, the reaction mixture becomes oxidizing and
magnetite is also formed.4,10,38-40 Therefore during FT synthesis the bulk iron
may be distributed among several phases: e.g. carbides, oxides and metallic
iron.
Numerous studies have been published concerning correlations between
phases present in the iron catalyst and its reaction behaviour, as summarised,
for example by Satterfield et al40 and Dweyer and Hardenbergh.41 However
there is no clear consensus as to which of the phases is responsible for
catalyst activity. Several models have been proposed and the two which are
most frequently cited are the carbide model35,36,42 and the competition
model.43 In the carbide model iron is not considered to be active for the F-T
synthesis, but the surface carbides with their underlying iron carbide bulk

218
structure are, whereas in the competition model iron atoms at the surface are
considered as the active sites. In the latter model both bulk carbidation and F-
T synthesis (hydrocarbon formation) have a common surface carbidic
precursor. In addition to these two postulates concerning the nature of the
active phase, Teichner and co-workers44,45 proposed that magnetite (Fe3O4) is
the active phase in F-T synthesis. Validity of the latter proposal was
questioned,31 but some evidence in its support has also been presented.46-48
The hyperfine interaction parameters of selected catalysts* are listed in Table
7.3. The results showed that the two most active catalysts i.e. the 18Ruhr and
18Nano catalysts had different phase compositions. The 18Ruhr catalyst had
an iron phase composition of χ' – Fe2.5C and superparamagnetic iron oxides
or carbides. [Superparamagnetic behaviour is normally observed for
crystallites that are less than 7 nm in size.49 Low-temperature measurements
are however needed in order to determine the nature of the iron phases in the
small particles exhibiting superparamagnetic behaviour]. The 18Nano catalyst
consisted of χ' – Fe2.5C, α – Fe, Fe3O4 and superparamagnetic iron oxides or
carbides. The 18Stob catalysts also consisted of χ' – Fe2.5C, α – Fe, Fe3O4
and superparamagnetic iron oxides or carbides.
*The 18% SiO2 catalysts were studied by Mössbauer spectroscopy because they showed
better conversions and activity. 9Ruhr and 9Holo were also studied for comparison with the
same support/binder type as they have a different Si/Fe ratio.

219
This finding supports the hypothesis that carbide formation is a requirement
for active F-T catalysts. It also suggests that metallic iron is necessary for
carbiding to occur, hence the need for a reduction pretreatment. The
presence of Fe3O4 in used catalysts has been reported previously.4,39,49,50 It
has been suggested that the water vapour formed during FTS is responsible
for the oxidation of metallic iron and/or carbides to Fe3O4.4,39
The 18Holo catalyst which was the least active catalyst in the 18% SiO2
category was the only one found to have the ε’ – Fe2.2C phase together with
the χ' – Fe2.5C and some superparamagnetic iron oxides or carbides. The
9Holo catalyst which was even less active than the 18Holo catalyst did not
have the ε’ – Fe2.2C in its composition (it is also interesting to note that both
the 18Ruhr and 9Ruhr catalysts did not have any α – Fe or Fe3O4). The
absence of the ε’ – Fe2.2C in the 9Holo catalyst and some presence of
unidentified superparamagnetic iron species in the catalysts make it very
difficult to conclude which iron carbide or phase contributes to the high activity
of the catalysts. It could be that the ε’ – Fe2.2C is formed first and then
converted to χ' – Fe2.5C during the F-T reaction via the reaction 2.5Fe2.2C →
2.2Fe2.5C + 0.3C (in agreement with what Jung51 suggested), and that in the
18Holo catalyst the transformation was not yet complete after 336 hours on
line.
Therefore, in order for a conclusive argument to be reached low temperature
Mössbauer must in future studies be done so that all the iron species are
identified.

220
Table 7.3. Hyperfine interaction parameters of the Fe based catalysts
Sample Id IS (mms-
1)Fe QS (mms-
1) BHF (T) % Fe Phase
18Ruhr 0.20 0.19 0.30 0.87 0.35
0.02 0.11 0.02 2.38 0.88
21.1 17.5 9.4 - -
48.6
5.2 46.2
χ' – Fe2.5C
Fe2+ Fe3+
18Nano 0.23 0.19 0.26 0.0
0.64 0.29 0.87 0.32
0.09 0.14 0.02 0.05 -0.04 0.03 2.37 0.86
21.2 17.7 10.2 33.5 45.5 48.7
- -
51.9
3.8 29.3
2.6
12.4
χ' – Fe2.5C
α – Fe Fe3O4
Fe2+ Fe3+
18Stob 0.22 0.19 0.11 0.03 0.73 0.22 0.87 0.33
0.07 0.10 0.02 -0.14 0.02 0.0
2.40 0.84
21.2 17.8 10.8 33.7 45.6 47.6
- -
62.2
3.8 12.6
3.7
17.7
χ' – Fe2.5C
α – Fe Fe3O4
Fe2+ Fe3+
18Holo 0.27 0.23 0.26 0.17 0.72 0.33
0.04 0.04 0.02 0.02 2.13 0.94
21.7 17.4 10.9 18.9
- -
57.0
12.7 2.6
15.4
χ' – Fe2.5C
ε’ – Fe2.2C Fe2+ Fe3+
9Ruhr 0.25 0.19 0.32 0.87 0.34
0.04 0.13 0.02 2.25 0.88
21.4 17.6 10.7
- -
40.2
6.1 53.7
χ' – Fe2.5C
Fe2+ Fe3+
9Holo 0.27 0.16 0.29 0.0
0.85 0.15 0.87 0.35
0.04 0.12 0.02 0.05 -0.08 0.20 2.34 0.74
21.6 18.2 9.8
33.0 45.5 47.8
- -
53.0
2.4 4.1
8.4
31.2
χ' – Fe2.5C
α – Fe Fe3O4
Fe2+ Fe3+
221
7.4 Conclusions
Characterisation studies together with F-T reactivity data showed that the use
of silica with various morphologies as supports/binders for the iron catalysts
does not have an effect on the catalyst selectivity and that the activity of the
metal is largely influenced by the metal dispersion and degree of reduction of
the catalysts. From the new supports/binders that were used, silica nanotubes
seem to have a big potential in being used as supports because the metal
becomes well enclosed and dispersed inside the nanotubes. The WGS
activity was largely influenced by the potassium that is present in the samples
and not the support type.
Mössbauer spectroscopy showed that some active catalysts contained χ' –
Fe2.5C and some unidentified superparamagnetic iron species while other
catalysts also contained α – Fe and Fe3O4 in addition to χ' – Fe2.5C and some
unidentified superparamagnetic iron species. Therefore low temperature
Mössbauer must be done so that all the iron species are identified and a
conclusive argument is reached on the exact composition of an active
catalyst.

222
7.5 References
1. A.K. Datye, Y. Jin, L. Mansker, R.T. Motjope, T. Dlamini and N.J.
Coville, Stud. Surf. Catal., 130, 306, (2000).
2. Y. Jin and A.K. Datye, J. Catal., 196, 8-17, (2000).
3. M.D. Mehul, D.S. Kalakkad, K.E. Coulter, S.D. Köhler, M.S. Harrington,
N.B. Jackson, A.G. Sault and A.K. Datye, J. Catal., 156, 185-207,
(1995).
4. M.E. Dry, The Fischer-Tropsch Synthesis in Catalysis Science and
Technology 1, J.R. Anderson, M. Boudart, Eds., Spring and Verlag:
New York, 159-255, (1981).
5. D.G. Burkur, X. Lang, D. Mukesh, W.H. Zimmermann, M.P. Rosynek
and C. Li, Ind., Eng., Chem., Res., 29, 1588-1599, (1990).
6. D.G. Burkur, K. Okabe, M.P. Rosynek, C. Li, D. Wang, K.R.P.M. Rao
and G.P. Huffman, J. Catal., 155, 355, (1995).
7. D.G. Burkur, D. Mukesh and S.A. Patel, Ind. Eng. Chem. Res., 29, 194
– 204, (1990).
8. R.B. Anderson, B. Seligman, J.F. Schultz and M.A. Elliot, Ind. Eng.
Chem., 44, 391 – 397, (1952).
9. H. Arakawa and A.T. Bell, Ind, Eng, Chem, Process Des, Dev., 22, 97
– 103, (1983).
10. D.G. Burkur, M. Koranne, X. Lang, K.R.P.M. Rao and G.P. Huffman,
Appl. Catal., 126, 85 – 113, (1995).
11. N.O. Egiebor and W.C. Cooper, Can. J. Chem. Eng., 63, 81 – 85,
(1985).
12. G.B. McVicker and M.A. Vannice, J. Catal., 63, 25 – 34, (1980).

223
13. F.J. Berry, L. Liwu, L. Dongbai, W. Chengyu, T. Renyuan and Z. Su,
Appl. Catal., 27, 195 – 205, (1986).
14. A.Y. Khodakov, A. Griboval-Constant, R. Bechara and V.L.
Zholobenko, J. Catal., 206, 230, (2002).
15. R.B. Anderson, W.K. Hall, A. Krieg and B.J. Seligman, J. Am. Chem.
Soc., 71, 183, (1949).
16. J.A. Lapszewics, H.J. Loeh and J.R. Chipperfield, J. Chem. Soc.,
Chem. Commun., 913, (1993).
17. D. Vanhove, Z. Zhang, L. Makambo and M. Blanchard, Appl. Catal., 9,
327, (1984).
18. B. Ernst, S. Libs, P. Chaumette and A. Kiennemann, Appl. Catal. A,
186, 145, (1999).
19. (a) F. Miyaji, S.A. Davis, J.P.H. Charmant and S. Mann, Chem. Mater.,
11, 3021, (1999). (b) M. Trau, N. Yao, E. Kim, Y. Xia, G.M. Whitesides
and I.A. Aksay, Nature, 390, 674, (1997). (c) H. Yang, N. Coombs and
G.A. Ozin, Adv. Mater., 9, 811, (1997).
20. J. Haber, Pure Appl. Chem., 63, 1227, (1991).
21. D.A.M. Monti and A. Baiker, J. Catal., 83, 323, (1983).
22. A.J.H.M. Kock, H.M. Fortuin and J.W. Geus, J. Catal., 96, 261, (1985).
23. X. Gao, J. Shen, Y. Hsia and Y. Chen, J. Chem. Soc. Faraday Trans.,
89 (7), 1079, (1993).
24. M.V. Cagnoli, S.G. Marchetti, N.G. Gallegos, A.M. Alvarez, R.C.
Mercader and A.A. Yeramian, J. Catal., 123, 21, (1989).
25. A.F.H. Wielers, A.H.J.M. Kock, C.E.C.A. Hop, J.W. Geus and A.M. van
der Kraan, J. Catal., 117, 1, (1989).
224
26. Y.Y. Huang and J.R. Anderson, J. Catal., 40, 143, (1975).
27. M.C. Hobson Jr and H.M. Gager, J. Colloid Interface Sci., 34 (3), 357,
(1970).
28. S. Yuen, Y. Chen, J.E. Kubsh, J.A. Dumesic, N. Topsoe and H.
Topsoe, J. Phys. Chem., 86, 3022, (1982).
29. R.J. Madon and W.F. Taylor, J. Catal., 69, 32, (1981).
30. P. Carniti, A. Gervasini, V.H. Modica and N. Ravasio, Appl. Catal. B,
28, 179, (2000).
31. R.A. Dictor and A. Bell, J. Catal., 97, 121, (1986).
32. R. Snel, J. Mol. Catal., 53, 129 – 141, (1989).
33. M.E. Dry and G.J. Oosthuizen, J. Catal., 11, 18 – 24, (1968).
34. L.D. Mansker, Y. Jin, D.B. Burkur and A.K. Datye, Appl. Catal., 186,
277 – 296, (1999).
35. J.A. Amelse, J.B. Butt and L.J. Schwartz, J. Phys. Chem., 82, 558,
(1978).
36. G.B. Raupp and W.N. Delgass, J. Catal., 58, 348, (1979).
37. H. Jung and W.J. Thomson, J. Catal., 134, 654, (1992).
38. R.B. Anderson, in P.H. Emmett (Ed.), Catalysis, Vol. 4, Van Nostrand-
Reinhold, New York, 29, (1956).
39. R.B. Anderson, The Fischer-Tropsch Synthesis, Academic Press,
Orlando, FL, (1984).
40. C.N. Satterfield, R.T. Hanlon, S.E. Tung, Z. Zou and G.C.
Papaefthymiou, Ind. Eng. Chem. Prod. Dev., 25, 407, (1986).
41. D.J. Dweyer and J.H. Hardenbergh, J. Catal., 87, 66, (1984).
42. G.B. Raupp and W.N. Delgass, J. Catal., 58, 361, (1979).

225
43. J.W. Niemantsverdriet and A.M. van der Kraan, J. Catal., 72, 385,
(1981).
44. J.P. Reymond, P. Meriadeau and S.J. Teichner, J. Catal., 75, 39,
(1982).
45. F. Blanchard, J.P. Reymond, B. Pommier and S.J. Teichner, J. Mol.
Catal., 17, 171, (1982).
46. J.B. Butt, Catal. Lett., 7, 61, (1990).
47. S. Soled, E. Iglesia and R.A. Fiato, Catal. Lett., 7, 271, (1990).
48. C.S. Kuivila, P.C. Stair and J.B. Butt, J. Catal., 118, 299, (1989).
49. T.R. Motjope, Effect of preparation variables on precipitated catalysts
for Fischer-Tropsch synthesis using Mössbauer spectroscopy, MSc
Dissertation, University of the Witwatersrand, Johannesburg, (2000).
50. E.S. Lox, G.B. Marin, E. de Grave and P. Bussiere, Appl. Catal., 40,
197 – 218, (1988).
51. H. Jung and W.J. Thomson, J. Catal., 139, 375, (1993).

226
CHAPTER EIGHT
CONCLUSIONS
PART I
The sol-gel method is a method for preparing inorganic materials from
molecular precursors. It not only allows the preparation of known materials in
a novel way but also of materials with unusual compositions and properties. In
particular, the template directed sol-gel synthesis of organized inorganic
matter offers a new and wide-ranging approach to the synthesis of useful
materials with controlled architecture and porosity across a range of length
scales.
The studies that were carried out in this thesis evaluated the effect of
templates and synthesis conditions on the properties and structures (nano-
and micro) of silica materials that are obtained by the templated sol-gel
method.
Five types of morphologies were found in the silica materials obtained with
different templates and they were categorised as hollow tubes, filled tubes,
hollow spheres, solid spheres and amorphous material. The studies that were
carried out with various templates revealed that the self-assembly of the
template is highly influenced by synthesis conditions. Sphere formation was

227
found to be a competitive reaction to tube formation. Sphere shaped
templates are formed under certain synthesis conditions (e.g. at 75 °C) while
rod-like templates are favoured under certain synthesis conditions (e.g. low
temperatures). The formation of rod-like crystals leads to the formation of
tubular silica materials while sphere shaped templates lead to the formation of
spheres.
The studies with DL-tartaric acid as a template revealed that synthesis
conditions (temperature, NH4OH concentration, water/ethanol concentration,
time before NH4OH addition, static versus stirred conditions, stirring rate and
solvent) all have an effect on the microstructure of the silica and influence the
formation of particular silica morphologies. Indeed, the effects observed are
those expected from diffusion and kinetic/thermodynamic considerations.
Of all the synthesis conditions investigated, temperature, stirring and reaction
time had the largest effect on the silica structure. These factors have a direct
bearing on template formation. The formation of silica tubes is enhanced at
lower temperatures rather than at elevated ones and this can be due to the
fact that at a lower temperature molecules (reagents, template) diffuse more
slowly and thus have enough time to self-assemble.
Studies with citric acid also revealed that synthesis conditions (i.e.
temperature, NH4OH concentration, water/ethanol concentration, time before
NH4OH addition, static versus stirred conditions, stirring rate and solvent)
influence the formation of particular silica morphologies. It is thus important to

228
carefully control these synthesis conditions. Temperature, water/ethanol
dilution and stirring rate played a large role in structure formation. The
formation of tubes was enhanced at lower temperatures (< 50 °C). This effect
can be related to diffusion and stability of the template. Only hollow spheres
were obtained at 75 °C. This could arise from the fact that at that temperature
some evaporation of ammonia occurs leading to the presence of less
ammonium citrate template crystals for tube formation.
For both DL-tartaric acid and citric acid the formation of tubes appeared to be
sensitive to the amount of water (water/ethanol dilution) present in the
reaction mixture. More tubes were formed under stirred conditions and the
tubes were also longer than the ones formed under non-stirred conditions.
DL-tartaric acid influenced the formation of longer and more uniform tubes
compared to citric acid. Tubes that are formed in DL-tartaric acid are hollow
and open ended; however the ones formed in citric acid are a mixture of filled
and hollow but closed tubes. Hollow spheres are exclusively formed when
citric acid is used at 75 °C while only filled spheres are formed when DL-
tartaric acid is used. The surface areas for the silica formed from DL-tartaric
acid are lower than the areas obtained from citric acid. Hence it appears that
the template also plays a role in the formation of various silica morphologies.
This can be attributed to the fact that crystals formed for each template are
slightly different. (The size of the molecule, orientation of the hydroxyl groups
and inter-molecular H-bonding etc. contribute to this).

229
The nitrogen adsorption-desorption isotherms of silica materials obtained from
both templates showed that the materials were mesoporous with some
microporosity present in them. The formation of fragmented tubes is believed
to be caused by the fact that the reactions are carried out in basic media and
formed silica tubes can react with excess OHֿ ions thereby causing the tubes
to lose their smooth shape as the silica is dissolved away from the tube
surface. Furthermore, the dissolved silica can re-precipitate on the tubes and
spheres to generate the amorphous materials observed by TEM and SEM.
The studies with mucic and tartronic acid also showed that the template
together with synthesis conditions (such as solvent, temperature and stirring)
affect the resulting silica morphology. Mucic acid influenced the formation of
silica materials with high surface areas, mesopores and a morphology that
reveals fragmented tubes. Tartronic acid influenced the formation of hollow
tube materials with low surface areas and a combination of micro- and
mesopores. The yield of the tubes was higher at lower temperatures for both
templates.
When sugars were used only spherical particles were obtained and some
sugars gave SiO2 particle sizes that are smaller than the ones that are
normally obtained by the sol-gel method. Therefore it appears that a
combination of both COOH and OH groups are needed in a template in order
to obtain tubular structures.

230
TEM and SEM have shown that by using different templates, the particle size
and structure of the silica are altered at the nanoscale level. Other properties
that are highly influenced by variation of templates and conditions are texture,
surface area and the material’s thermal decomposition. Hence it is possible to
‘design’ silica materials with specific properties, Table 8.1 gives a summary of
how this can be achieved.
Table 8.1 Summary of types of silicas and properties that can be obtained by
using different templates and synthesis conditions.*
Template Synthesis
condition
Structure Particle sizea
[µm]
Surface
area
[m2/g]
Types of
pores
DL-tartaric
acid
0°C,
ethanol
Hollow
tubes
L: 100 – 250
D: 0.2 – 0.6
25 Meso +
micropores
Citric acid 75°C,
ethanol
Hollow
spheres
S: 0.17 – 0.20 47 Meso +
micropores
Glucose 25°C,
ethanol
Solid
spheres
S: 0.3 – 0.5 17 Meso +
micropores
Mucic acid 75°C,
diethyl
ether
Fragments - 188 Mesopores
Mucic acid 25°C,
diethyl
ether
Fragmented
tubes +
spheres
L: 1.13 – 3.51
D: 0.22 – 0.41
S: 0.11 – 0.33
263
Mesopores
Gluconic
acid
25°C,
ethanol
Solid
spheres
S:0.003 – 0.01 5 Meso +
micropores aL = length of tube, D = outer diameter of tube, S = diameter of sphere * Only selected cases were chosen from the thesis chapters

231
PART II
The inherent preparative advantages offered by the sol-gel method have
prompted its use for the synthesis of many oxidic catalytic supports notably
silica and alumina.
The use of silica with various morphologies as supports/binders for an iron
Fischer-Tropsch catalyst was evaluated. The various silica morphologies were
found to affect the physico-chemical properties and activities of the catalysts
but not the catalyst selectivities .
The Ruhrchemie catalysts had a much higher surface area than the other
catalysts. (i.e. catalysts supported on nanotubes, Stöber spheres and hollow
spheres). The 18% SiO2 catalysts had higher surface areas than the 9% SiO2
and 27% SiO2 catalysts. This can be due to the fact that the metal was better
dispersed onto the support/binder in 18% SiO2 and Ruhrchemie catalysts.
The Ruhrchemie catalyst was the most active catalyst followed by the catalyst
supported on silica nanotubes, Stöber spheres and hollow spheres
respectively. Catalysts containing 18% silica showed the best activity
compared to the 9% and 27% silica catalysts. Possible explanations of this
are: 1) the TPR profiles of the 18% silicas were different from the others i.e.
Tonset was lower which meant that they reduced easier and/or their extents of
reduction were higher, 2) their surface areas were slightly higher.

232
The activity was found to be high in the catalysts that had high metal
dispersions such as the Ruhrchemie catalysts and the 18% nanotube catalyst.
The lack of observable differences in the selectivities of the catalysts indicated
that that the Fe-silica interaction was not the dominant factor in determining
the selectivity.
The product distribution and WGS activity were largely influenced by the
potassium that is present in the samples and not the support type.
Mössbauer spectroscopy was used as a bulk characterisation technique to
identify the phases that are present in the ‘working’ catalysts, so as to relate
the nature of the working catalyst with the active phase(s) responsible for F-T
synthesis. Mössbauer spectroscopy showed that some active catalysts
contained χ' – Fe2.5C and some unidentified superparamagnetic iron species
while other catalysts also contained α – Fe and Fe3O4 in addition to χ' – Fe2.5C
and some unidentified superparamagnetic iron species. Therefore, in order for
a conclusive argument to be reached, low temperature Mössbauer studies
must be done so that all the iron species are identified and the exact
compositions of the active catalysts are known. The findings support the
hypothesis that carbide formation is a requirement for active F-T catalysts. It
also suggests that metallic iron is necessary for carbiding to occur, hence the
need for a reduction pre-treatment.
The studies that were carried out in the thesis showed that from the list of new
supports/binders that were used, silica nanotubes seem to have a remarkable

233
potential for use as supports. It appears that as the metal becomes enclosed
and dispersed inside the nanotubes the activity of the nanotube supported
catalyst becomes comparable to that of a standard Ruhrchemie catalyst.

234
APPENDIX 1
Mechanism for the formation of silica nanotubes in the presence of
laurylamine hydrochloride as a template. This has been proposed by Adachi
and co-workers (Ref. 19 in chapter 2).
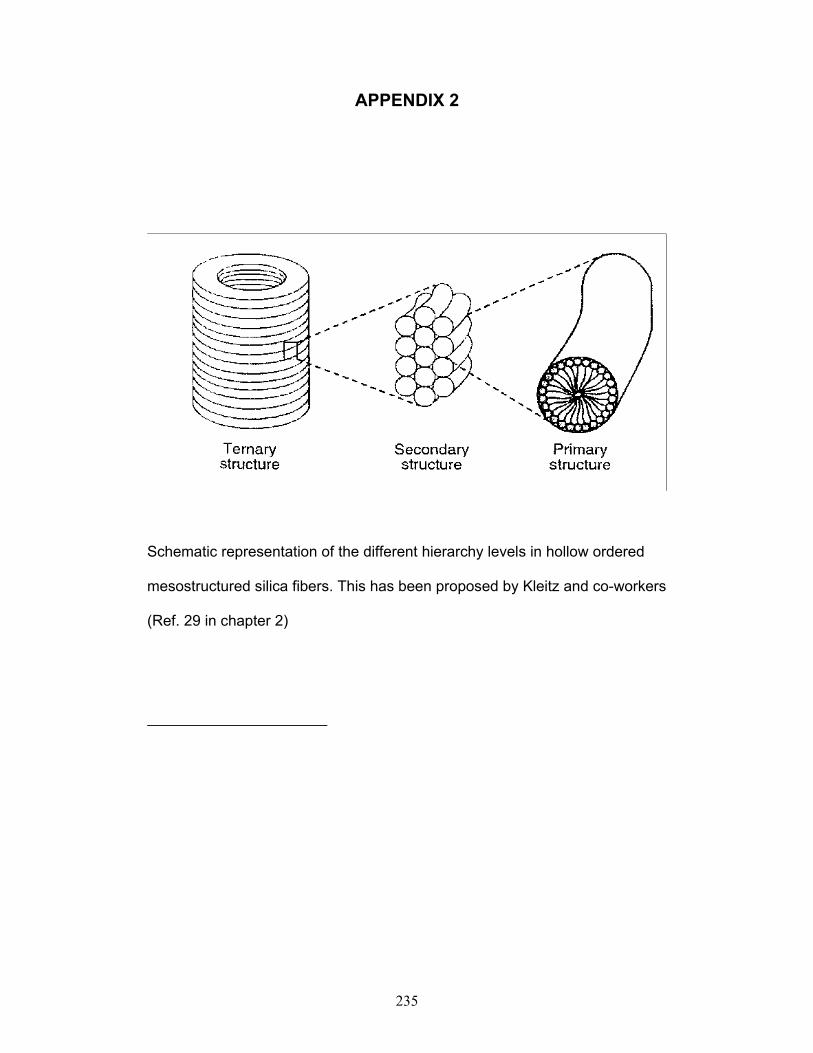
235
APPENDIX 2
Schematic representation of the different hierarchy levels in hollow ordered
mesostructured silica fibers. This has been proposed by Kleitz and co-workers
(Ref. 29 in chapter 2)