synthesis, growth and characterization of...
TRANSCRIPT
19
CHAPTER - 2
SYNTHESIS, GROWTH AND CHARACTERIZATION OF ACETOPHENONE THIOSEMICARBAZONE AND BENZALDEHYDE
THIOSEMICARBAZONE MONOHYDRATE SINGLE CRYSTALS
2.1 INTRODUCTION
Progress in the area of non-linear optics depends upon the development
of new materials. When compared with the inorganic materials, organic and
semiorganic materials have been attracting a great deal of attention, as they
have large optical susceptibilities, inherent ultra fast response time and good
optical properties (Dhanuskodi and Mary 2003, Prasad and Williams 1991,
Vijayan et al. 2003a, 2003b). Organic molecules containing electron
conjugation systems asymmetrized by the electron donor and acceptor groups
are highly polarizable entities for nonlinear optical (NLO) applications (Tansuri
et al. 2004). The donor/acceptor groups of benzene derivatives can produce
high molecular nonlinearity. Recently there has been considerable interest in
the co-ordination chemistry of aryl hydrazones such as semicarbazones,
thiosemicarbazones and guanyl hydrazones because of their importance for
drug design (Beraldo and Gambino 2004) organocatalysis and for the
preparation of hetero cyclic rings (Bondock et al. 2007). Further extensive
electron delocalization reported in these types of structures helps the
thiosemicarbazone complexes to acquire second harmonic generation (SHG)
efficiency (Domiano et al. 1969, Andreetti et al. 1970, Muharrem and Namik
2005a, 2005b). Single crystals of acetophenone thiosemicarbazone (APTSC) and
benzaldehyde thiosemicarbazone (BTSC) are the potential organic nonlinear
optical materials, which belongs to the ketone and aldehyde group of
compounds respectively.
Three dimensional crystal structure of APTSC was determined by single
crystal X-ray diffraction study. APTSC crystallizes in the orthorhombic space
group Pbca (Santhakumari et al. 2010). The cell parameter values are
a=15.429(3) Å, b=7.127(7) Å, c=8.340(7) Å. Crystal structure of APTSC is
stabilized by N―H…S interamolecular hydrogen bonds and the molecule is
nearly planer. Sheng-Jiu Gu and Kai-Mei Zhu (2008) have reported on the three
dimensional crystal and molecular structure of benzaldehyde thiosemicarbazone
20
(BTSC) monohydrate. The cell parameter values are a=6.1685(10) Å,
b=7.6733(12)Å, c=21.131(2)Å. The crystal belongs to the well known
noncentrosymmetric orthorhompic system with space group P212121.
To the complete comprehensive knowledge of authors there is no report
available on the growth and characterization of these compounds. Hence, the
results of synthesis, growth, crystal structure and characterizations of APTSC
and BTSC are presented in section A and section B respectively this chapter.
Section A
Growth and characterization of acetophenone thiosemicarbazone
(APTSC) single crystals
2.2 Experimental
2.2.1 Synthesis, solubility and growth of APTSC
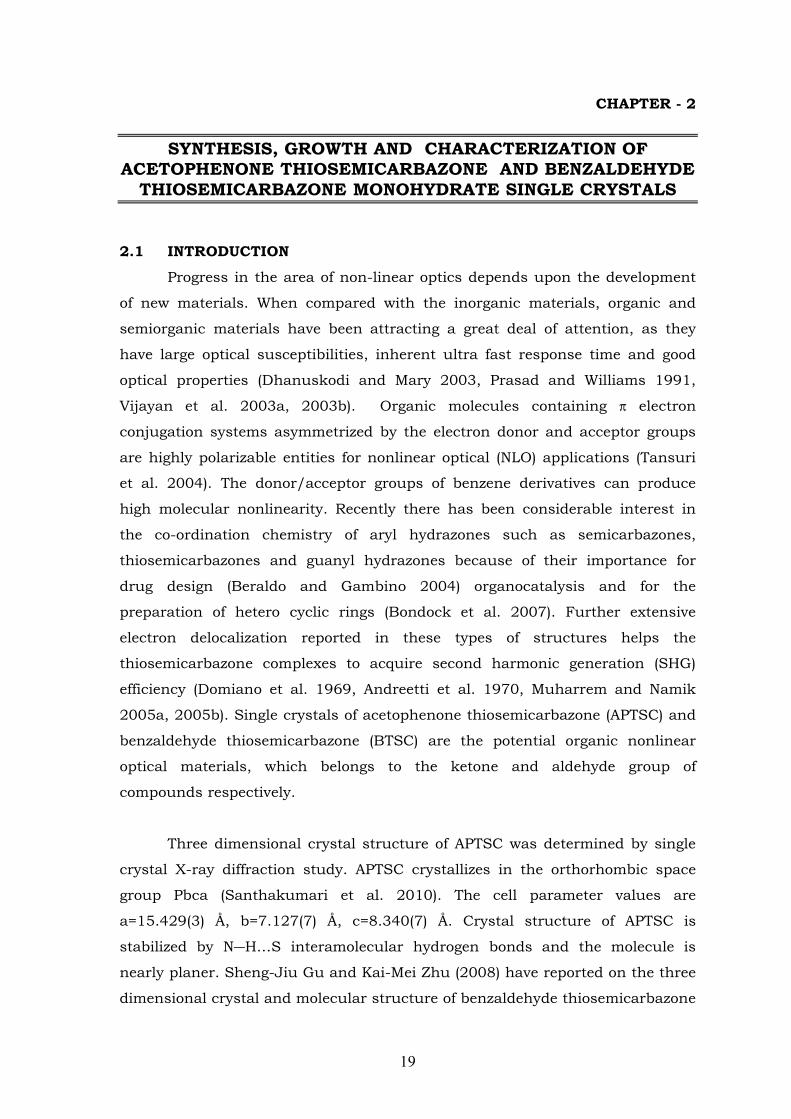
APTSC was synthesized by reacting analytical grade acetophenone
(C8H8O) and thiosemicarbazide (CH5N3S) in 1:1 molar ratio in the distilled
water. The prepared solution was stirred well using magnetic stirrer and
if the solution appeared to be turbid, methanol/ethanol was added
further and gently warmed until a clear solution was obtained. The
APTSC compound was synthesized according to the chemical reaction
depicted in the scheme.
Scheme. The reaction mechanism of APTSC
21
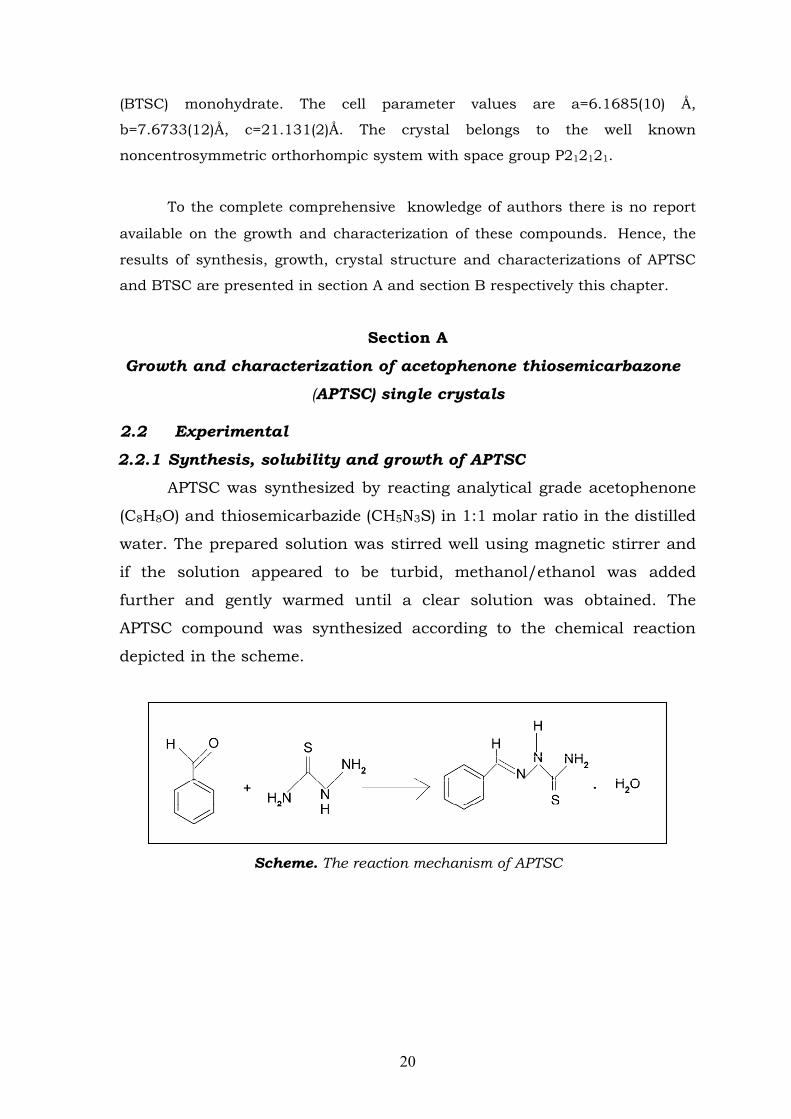
Studies on the solubility at various temperatures showed that APTSC
has relatively high solubility in ethanol compared to that of in methanol
(Fig. 2.1). Hence ethanol was chosen as the solvent in the present work.
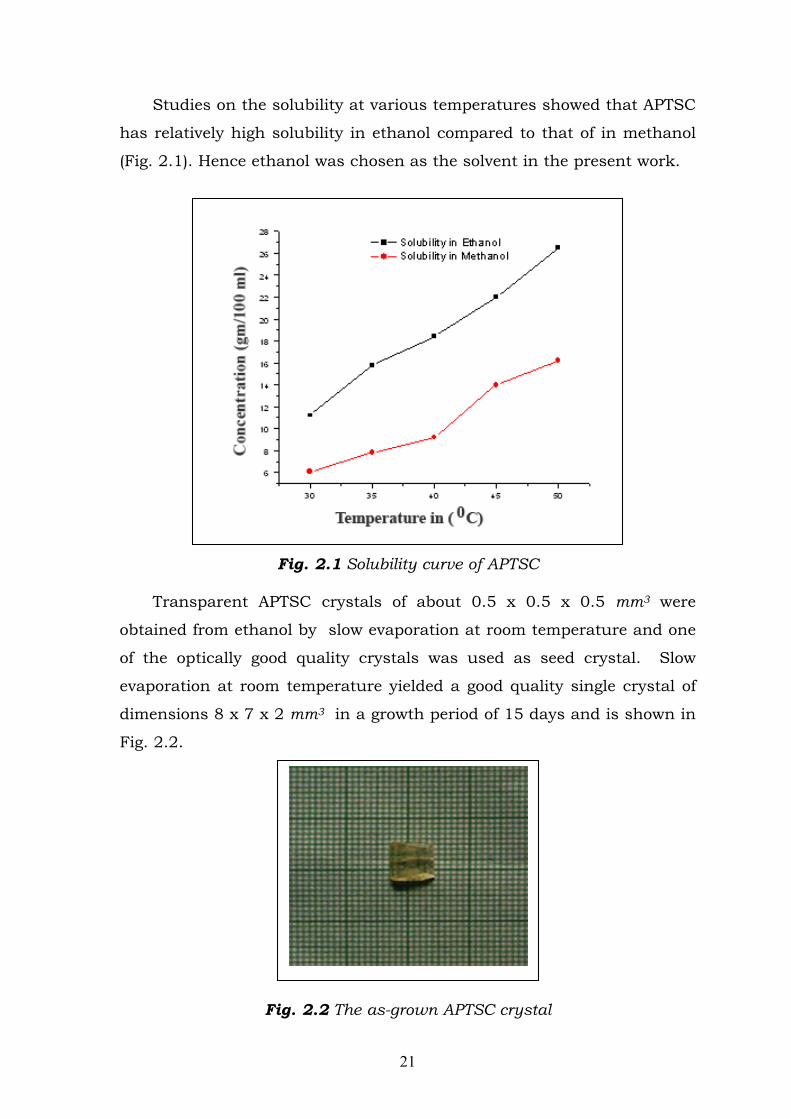
Fig. 2.1 Solubility curve of APTSC Transparent APTSC crystals of about 0.5 x 0.5 x 0.5 mm3 were
obtained from ethanol by slow evaporation at room temperature and one
of the optically good quality crystals was used as seed crystal. Slow
evaporation at room temperature yielded a good quality single crystal of
dimensions 8 x 7 x 2 mm3 in a growth period of 15 days and is shown in
Fig. 2.2.
Fig. 2.2 The as-grown APTSC crystal

22
2.3 FTIR and laser Raman spectral analyses of APTSC
FTIR and Laser Raman spectral analyses were carried out to
characterize the functional groups of the APTSC crystal molecules. FTIR
spectrum was recorded for the purified sample using Perkin Elmer
Paragon-500 by KBr pellet technique between 400 cm-1 and 4000 cm-1
and is shown in Fig. 2.3. The band obtained at 1589 cm-1 is due to the
formation of imine group (C═N) between ketone and amine (Silverstein
and Webster 1998). A weak absorption, observed at 2958 cm-1 is due to
C―H stretching. The peak at 3402 cm-1 is due to NH2 asymmetric
stretching and an absorption peak at about 3140 cm-1 is due to NH
stretching. The band appeared at 1497 cm-1 confirms the C═C stretching
frequency. As mono substituted benzenes show C―H deformation
vibration in the region 710-690 cm-1 (Sharma 2000), the presence of C―H
deformation is evident from the vibration at 685 cm-1.
Fig. 2.3 FTIR spectrum of APTSC crystal

23
The peak observed at 841 cm-1 is due to the out-of-plane aromatic
C―H bond. The C═S stretch of the thiosemicarbazide moiety is observerd
at 1093 cm-1. Absence of characteristic ketone band between 1725-1705
cm-1 (C═O stretching) indicates that there is no ketone group in the final
product (Kemp 1991). The laser Raman spectrum (Fig. 2.4) was recorded
using Raman System, R-3000, solid state laser (532 nm with green light)
in the range of 100-3600 cm-1. In laser Raman spectrum C―H stretching
and C―H deformation (out of plane) vibrations are observed at 2795 cm-1
and 857 cm-1 respectively.
Fig. 2.4 Laser Raman spectrum of APTSC crystal
24
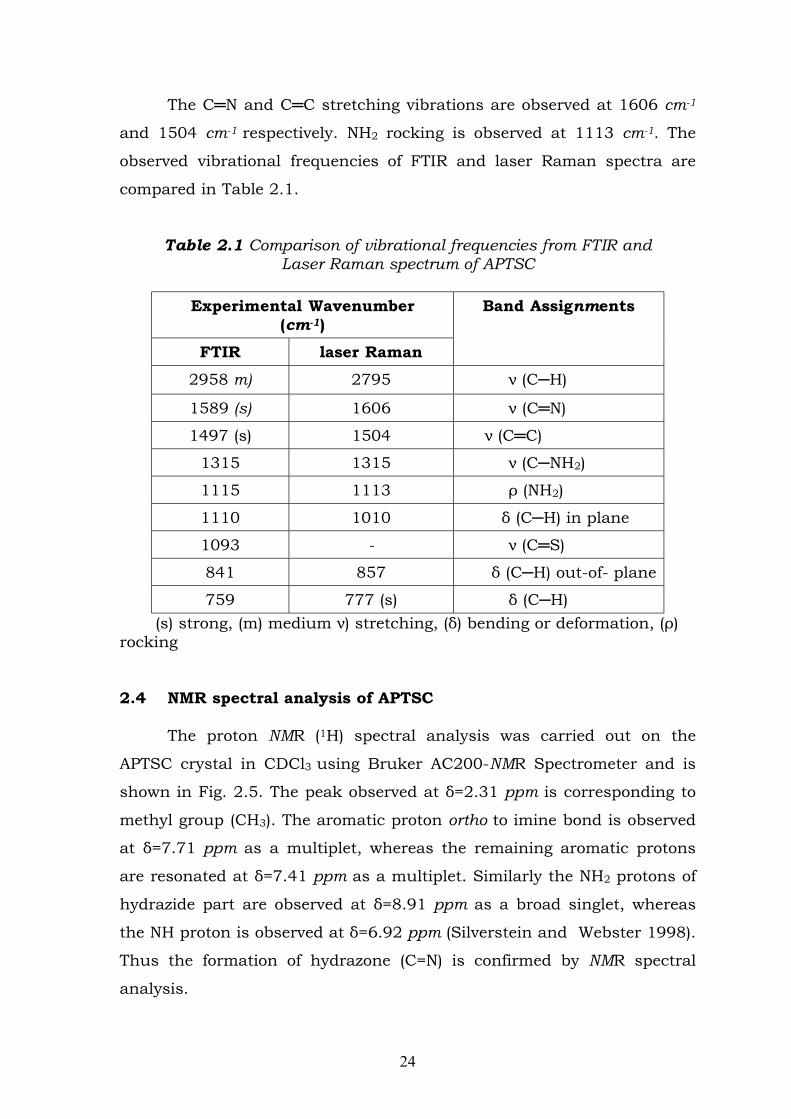
The C═N and C═C stretching vibrations are observed at 1606 cm-1
and 1504 cm-1 respectively. NH2 rocking is observed at 1113 cm-1. The
observed vibrational frequencies of FTIR and laser Raman spectra are
compared in Table 2.1.
Table 2.1 Comparison of vibrational frequencies from FTIR and Laser Raman spectrum of APTSC
Experimental Wavenumber (cm-1)
Band Assignments
FTIR laser Raman
2958 m) 2795 ν (C─H)
1589 (s) 1606 ν (C═N)
1497 (s) 1504 ν (C═C)
1315 1315 ν (C─NH2)
1115 1113 ρ (NH2)
1110 1010 δ (C─H) in plane
1093 - ν (C═S)
841 857 δ (C─H) out-of- plane
759 777 (s) δ (C─H)
(s) strong, (m) medium ν) stretching, (δ) bending or deformation, (ρ) rocking
2.4 NMR spectral analysis of APTSC
The proton NMR (1H) spectral analysis was carried out on the
APTSC crystal in CDCl3 using Bruker AC200-NMR Spectrometer and is
shown in Fig. 2.5. The peak observed at δ=2.31 ppm is corresponding to
methyl group (CH3). The aromatic proton ortho to imine bond is observed
at δ=7.71 ppm as a multiplet, whereas the remaining aromatic protons
are resonated at δ=7.41 ppm as a multiplet. Similarly the NH2 protons of
hydrazide part are observed at δ=8.91 ppm as a broad singlet, whereas
the NH proton is observed at δ=6.92 ppm (Silverstein and Webster 1998).
Thus the formation of hydrazone (C=N) is confirmed by NMR spectral
analysis.

25
Fig. 2.5 1H NMR spectrum of APTSC crystal
2.5 Single crystal and powder XRD studies of APTSC
The intensity data were collected at 298 K on a SADABS (Bruker,
2000) system using MoKα graphite monochromated radiation
(λ = 0.71073 Å). The molecular structure of the crystal APTSC (C9H11N3S)
was refined by the least squares method using anisotrophic thermal
parameters: R=5.1%. The crystal structure was refined by full matrix
least squares with SHELX 97 (Sheldrik 1997) program ortep drawing was
performed with ORTEP3 program (Farrujia 1999).
The compound APTSC crystallizes in orthorhombic system of Pbca.
The parameter values calculated are a=15.429(3)Å, b=7.127(7)Å,
c=8.340(7)Å, and Z=8. The molecule is nearly planar. The structure is
stabilized by N―H…S intermolecular hydrogen bonds. The molecular
structure of the APTSC together with the atom labeling scheme and the
26
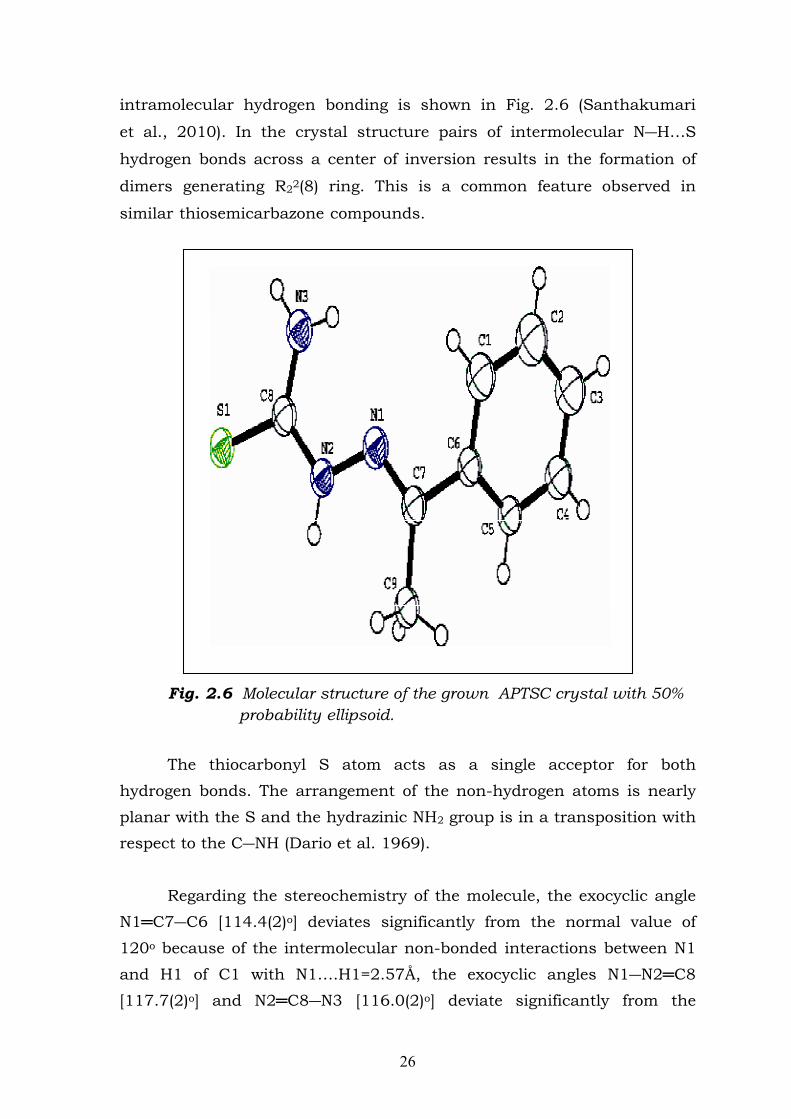
intramolecular hydrogen bonding is shown in Fig. 2.6 (Santhakumari
et al., 2010). In the crystal structure pairs of intermolecular N―H…S
hydrogen bonds across a center of inversion results in the formation of
dimers generating R22(8) ring. This is a common feature observed in
similar thiosemicarbazone compounds.
Fig. 2.6 Molecular structure of the grown APTSC crystal with 50% probability ellipsoid.
The thiocarbonyl S atom acts as a single acceptor for both
hydrogen bonds. The arrangement of the non-hydrogen atoms is nearly
planar with the S and the hydrazinic NH2 group is in a transposition with
respect to the C―NH (Dario et al. 1969).
Regarding the stereochemistry of the molecule, the exocyclic angle
N1═C7―C6 [114.4(2)o] deviates significantly from the normal value of
120o because of the intermolecular non-bonded interactions between N1
and H1 of C1 with N1….H1=2.57Å, the exocyclic angles N1―N2═C8
[117.7(2)o] and N2═C8―N3 [116.0(2)o] deviate significantly from the

27
normal value of 120o. This may be due to the intramolecular (Vasuki et
al. 2002a) non-bonded interaction between N1 and H3A of N3
[N1…H3A=2.19Å]. The (C1―C6) benzene ring and the S1/N2/N3/C8
fragment are planar with the maximum deviation of 0.01(3) Å for C5 atom
from the least square plane. The widening of the exocyclic angle
N1═C7═C9 [125.8(2)o] from the normal value of 120o may be due to the
steric repulsion (Vasuki et al. 2002b and Vasuki et al. 2008) between
atoms H2A of N2 and H9A of C9 [H2A…H9A=2.15Å]. The widening of the
exocyclic angle N2―C8―S1 [123.3(2)] from 120o may be due to the non-
bonding intermolecular interactions of S1 with N2 and N3 of the
neighbouring molecules. The dihedral angle between the two planes is
34.4 (14)o. The C1―C6―C7―N1 and C5―C6―C7―N1 torsion angles are
28.4 (8)o and (146.4 (6)o) respectively. In the crystal structure, molecules
are linked by N2―H2A…S1, N3―H3B…S1 and C9―H9A…S1 hydrogen
bonds and form an infinite molecular hydrogen bond chain of APTSC
expanding along the b-axis as shown in Fig. 2.7. The recorded data are
stacked in Table 2.2.
Fig. 2.7 Projection of the crystal structure of APTSC along the b-axis. Dashed lines show the N―H…S and C―H…S interactions
28
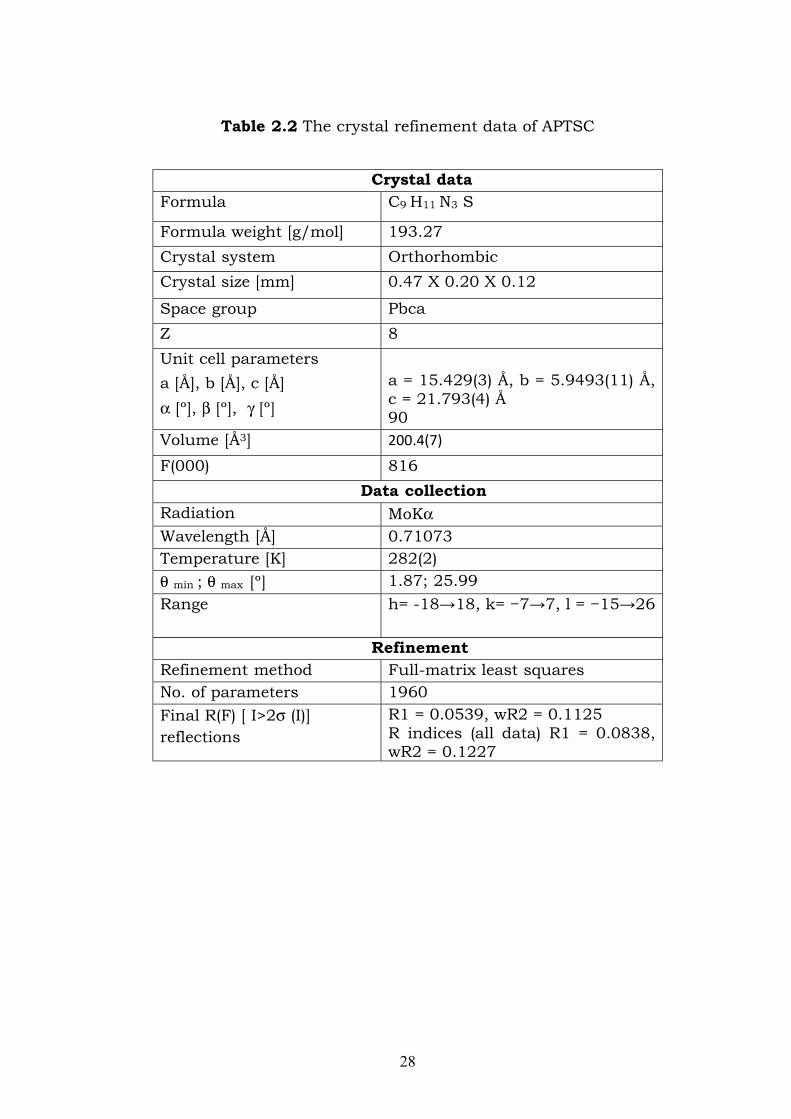
Table 2.2 The crystal refinement data of APTSC
Crystal data Formula C9 H11 N3 S
Formula weight [g/mol] 193.27
Crystal system Orthorhombic
Crystal size [mm] 0.47 X 0.20 X 0.12
Space group Pbca
Z 8
Unit cell parameters
a [Å], b [Å], c [Å]
α [º], β [º], γ [º]
a = 15.429(3) Å, b = 5.9493(11) Å, c = 21.793(4) Å 90
Volume [Å3] 200.4(7)
F(000) 816
Data collection Radiation MoKα Wavelength [Å] 0.71073 Temperature [K] 282(2) θ min ; θ max [º] 1.87; 25.99
Range
h= -18→18, k= −7→7, l = −15→26
Refinement Refinement method Full-matrix least squares No. of parameters 1960
Final R(F) [ I>2σ (I)] reflections
R1 = 0.0539, wR2 = 0.1125 R indices (all data) R1 = 0.0838, wR2 = 0.1227
29
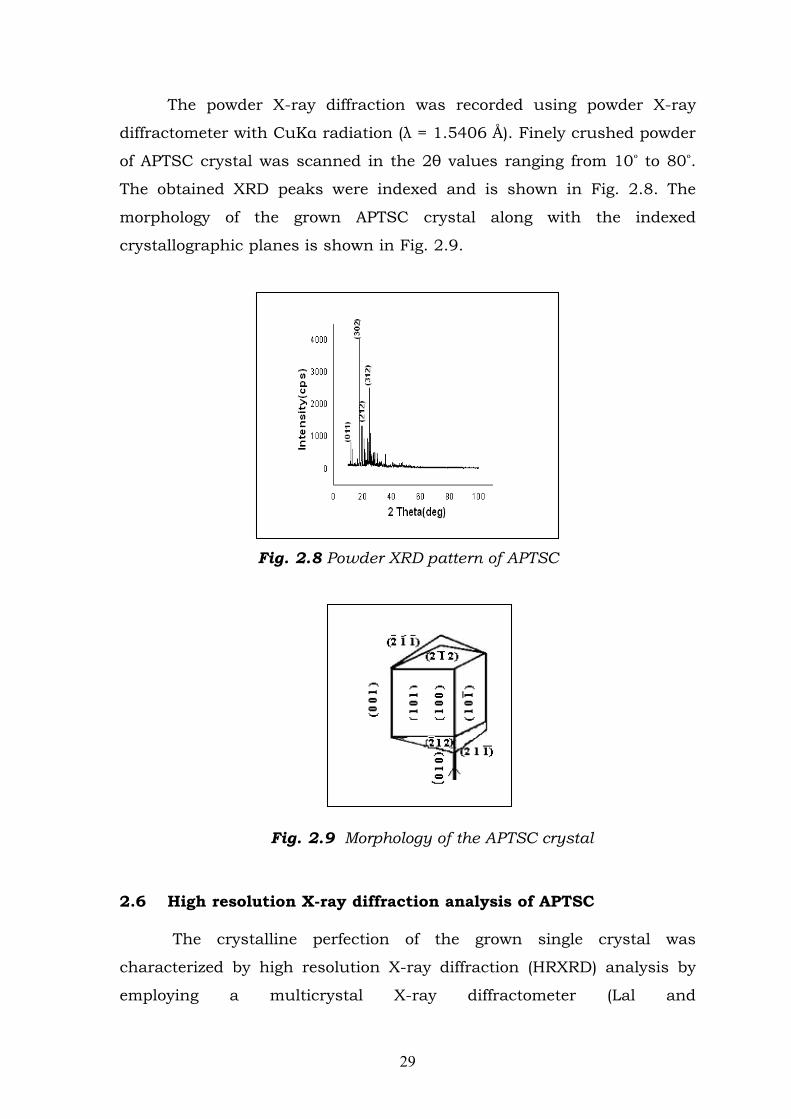
The powder X-ray diffraction was recorded using powder X-ray
diffractometer with CuKα radiation (λ = 1.5406 Å). Finely crushed powder
of APTSC crystal was scanned in the 2θ values ranging from 10º to 80º.
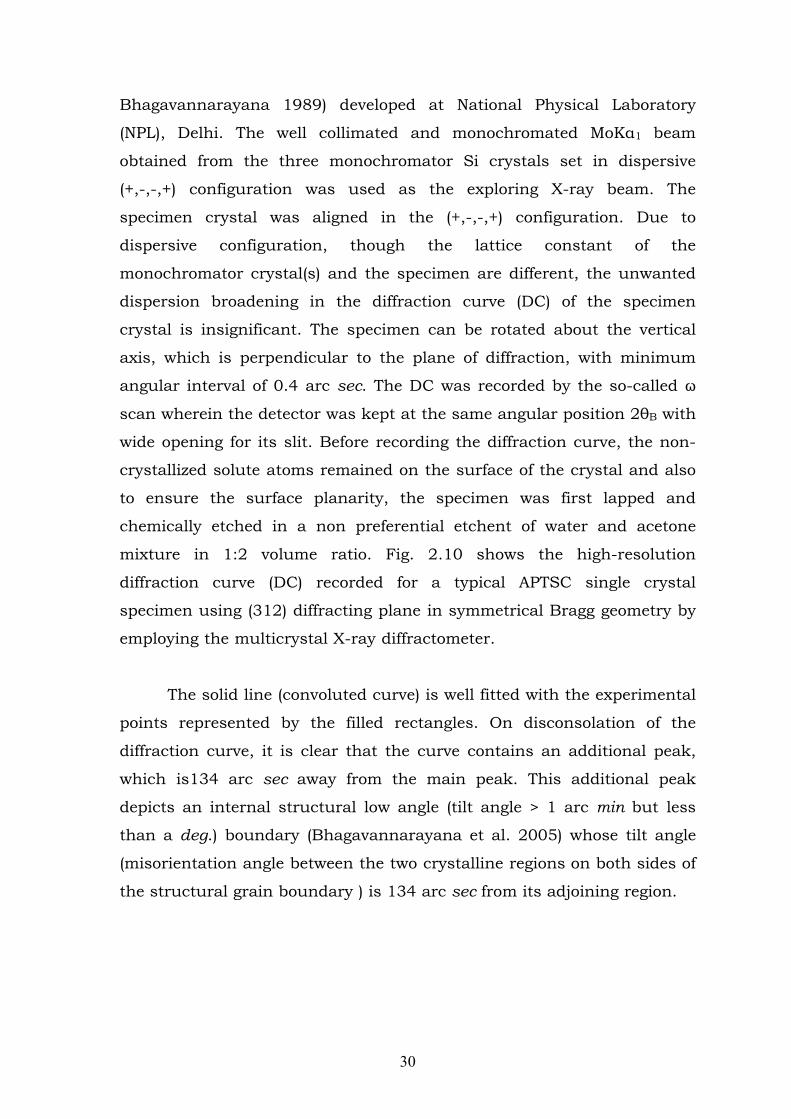
The obtained XRD peaks were indexed and is shown in Fig. 2.8. The
morphology of the grown APTSC crystal along with the indexed
crystallographic planes is shown in Fig. 2.9.
Fig. 2.8 Powder XRD pattern of APTSC
Fig. 2.9 Morphology of the APTSC crystal 2.6 High resolution X-ray diffraction analysis of APTSC
The crystalline perfection of the grown single crystal was
characterized by high resolution X-ray diffraction (HRXRD) analysis by
employing a multicrystal X-ray diffractometer (Lal and
30
Bhagavannarayana 1989) developed at National Physical Laboratory
(NPL), Delhi. The well collimated and monochromated MoKα1 beam
obtained from the three monochromator Si crystals set in dispersive
(+,-,-,+) configuration was used as the exploring X-ray beam. The
specimen crystal was aligned in the (+,-,-,+) configuration. Due to
dispersive configuration, though the lattice constant of the
monochromator crystal(s) and the specimen are different, the unwanted
dispersion broadening in the diffraction curve (DC) of the specimen
crystal is insignificant. The specimen can be rotated about the vertical
axis, which is perpendicular to the plane of diffraction, with minimum
angular interval of 0.4 arc sec. The DC was recorded by the so-called ω
scan wherein the detector was kept at the same angular position 2θB with
wide opening for its slit. Before recording the diffraction curve, the non-
crystallized solute atoms remained on the surface of the crystal and also
to ensure the surface planarity, the specimen was first lapped and
chemically etched in a non preferential etchent of water and acetone
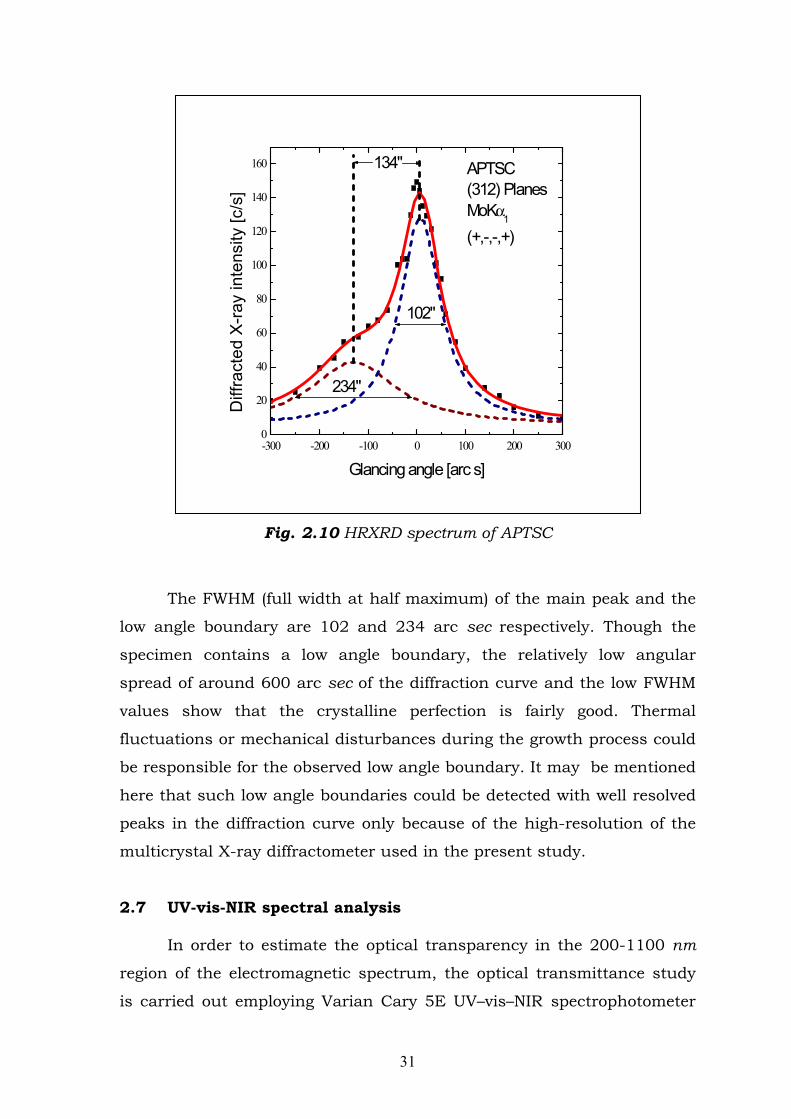
mixture in 1:2 volume ratio. Fig. 2.10 shows the high-resolution
diffraction curve (DC) recorded for a typical APTSC single crystal
specimen using (312) diffracting plane in symmetrical Bragg geometry by
employing the multicrystal X-ray diffractometer.
The solid line (convoluted curve) is well fitted with the experimental
points represented by the filled rectangles. On disconsolation of the
diffraction curve, it is clear that the curve contains an additional peak,
which is134 arc sec away from the main peak. This additional peak
depicts an internal structural low angle (tilt angle > 1 arc min but less
than a deg.) boundary (Bhagavannarayana et al. 2005) whose tilt angle
(misorientation angle between the two crystalline regions on both sides of
the structural grain boundary ) is 134 arc sec from its adjoining region.
31
Fig. 2.10 HRXRD spectrum of APTSC
The FWHM (full width at half maximum) of the main peak and the
low angle boundary are 102 and 234 arc sec respectively. Though the
specimen contains a low angle boundary, the relatively low angular
spread of around 600 arc sec of the diffraction curve and the low FWHM
values show that the crystalline perfection is fairly good. Thermal
fluctuations or mechanical disturbances during the growth process could
be responsible for the observed low angle boundary. It may be mentioned
here that such low angle boundaries could be detected with well resolved
peaks in the diffraction curve only because of the high-resolution of the
multicrystal X-ray diffractometer used in the present study.
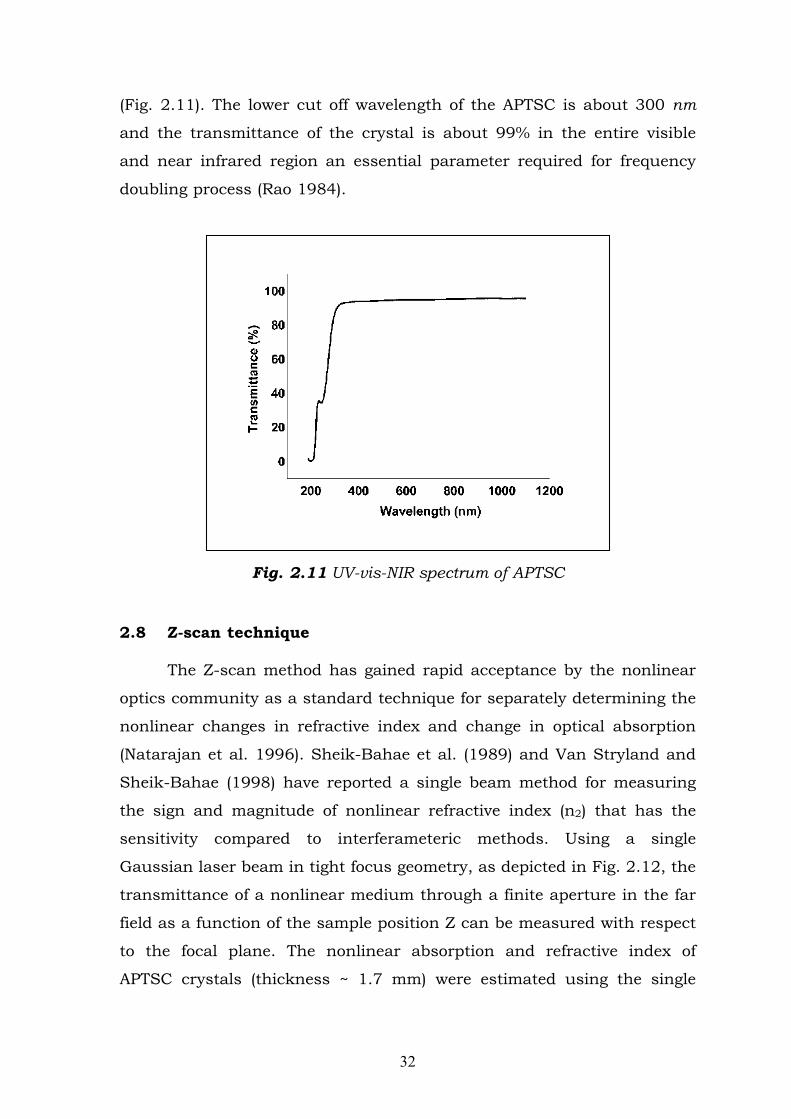
2.7 UV-vis-NIR spectral analysis
In order to estimate the optical transparency in the 200-1100 nm
region of the electromagnetic spectrum, the optical transmittance study
is carried out employing Varian Cary 5E UV–vis–NIR spectrophotometer
-300 -200 -100 0 100 200 3000
20
40
60
80
100
120
140
160 APTSC(312) PlanesMoKα
1
(+,-,-,+)
102"
234"
134"
Diff
ract
ed
X-r
ay
inte
nsi
ty [
c/s]
Glancing angle [arc s]
32
(Fig. 2.11). The lower cut off wavelength of the APTSC is about 300 nm
and the transmittance of the crystal is about 99% in the entire visible
and near infrared region an essential parameter required for frequency
doubling process (Rao 1984).
Fig. 2.11 UV-vis-NIR spectrum of APTSC 2.8 Z-scan technique
The Z-scan method has gained rapid acceptance by the nonlinear
optics community as a standard technique for separately determining the
nonlinear changes in refractive index and change in optical absorption
(Natarajan et al. 1996). Sheik-Bahae et al. (1989) and Van Stryland and
Sheik-Bahae (1998) have reported a single beam method for measuring
the sign and magnitude of nonlinear refractive index (n2) that has the
sensitivity compared to interferameteric methods. Using a single
Gaussian laser beam in tight focus geometry, as depicted in Fig. 2.12, the
transmittance of a nonlinear medium through a finite aperture in the far
field as a function of the sample position Z can be measured with respect
to the focal plane. The nonlinear absorption and refractive index of
APTSC crystals (thickness ~ 1.7 mm) were estimated using the single

33
beam Z-scan method with CW laser beam intensity of 35 mW and the
wavelength of 632.8 nm.
Fig. 2.12 Experimental setup for the Z-scan measurements
The study of nonlinear refraction by the Z-scan method depends on
the position (Z) of the thin samples under the investigation along a
focused Gaussian laser beam. The sample causes an additional focusing
or defocusing, depending on whether nonlinear refraction is positive or
negative. In the most reported experiments, 0.1 < S (transmittance) < 0.5
has been used for determining nonlinear refraction. Obviously, the linear
transmittance of the aperture S = 1 corresponds to the collection of all
transmitted light and therefore is insensitive to any nonlinear beam
distortion due to nonlinear refraction (Van Stryland and Sheik-Bahae
1998). Such a scheme, referred to as an “Open aperture” Z-scan, is
suited for measuring nonlinear absorption of the sample. Results
obtained from a open aperture Z-scan study for the grown APTSC are
presented in Fig. 2.13.
The nonlinear refractive index (n2) of the crystal was calculated
using the standard relations given below (Kanagasekaran et al. 2008).
(2.1)
where ΔTP-V is the difference between the normalized peak and valley
transmittance. ΔTP-V / Δφo is the on-axis phase shift at the focus. The
ΔTP-V = 0. 406 (1 - S)0.25 | Δφo |
34
nonlinear refractive index (n2) and nonlinear absorption coefficient (β) are
given by
02
o eff
nkI L
Δφ= (2.2)
Δβ =
o eff
2 2 TI L
(2.3)
where k is the wavenumber (k=2/λ) and Leff = [1–exp(-αL)]/α with
Io = P/(ωo2) defined as the peak intensity within the sample, where L is
the thickness of the sample and α is the linear absorption coefficient. The
ratio of the signals with and without the aperture accounts for the
nonlinear absorption and gives the information about purely nonlinear
refraction. The enhanced transmission near the focus is indicative of the
saturation of absorption at high intensity. Absorption saturation in the
sample enhances the peak and decreases the valley in the closed
aperture Z-scan. The focusing effect is attributed to a thermal
nonlinearity resulting from absorption of radiation at 632.8 nm. Localized
absorption of a tightly focused beam propagating through an absorbing
medium produces a spatial distribution of temperature in the crystal and
consequently, a spatial variation of the refractive index that act as a
thermal lens resulting in phase distortion of the propagating beam (Fig.
2.12). The nonlinear absorption property of the D--A type -electron
system can be related closely to the -electron conjugate degree and
delocalization capacity of the molecule. The three dimensional X-ray
crystal structure solution of this crystal showed that the torsion angles
C1―C6―C7―N1 and C5―C6―C7―N1, in these conjugated chains are
coplanar (Fig. 2.6). They are all favorable to nonlinear optical absorption,
especially to saturated absorption. The calculated value of nonlinear
refractive index (n2) of the APTSC crystal is 5.11 x 10⁻⁸ cm2/W and the

35
nonlinear absorption coefficient (β) estimated from the open Z-scan curve
is 0.1763 cm/W.
Fig. 2.13 Z-scan open spectrum of APTSC
2.9 Fluorescence studies of APTSC
Fluorescence may be expected generally in molecules that are
aromatic or contain multiple conjugated double bonds with a high degree
of resonance stability (Willard et al. 1986). Fluorescence finds wide
application in the branches of biochemical, medical and chemical
research fields for analyzing organic compounds. The excitation and
emission spectra for APTSC were recorded using Varian Carry Eclipse,
Fluorescence Spectrometer. The excitation wavelength was varied in the
range 200-400 nm (Fig. 2.14) and the sample was excited at 239 nm. The
emission spectrum (Fig. 2.15) was measured in the range 300-600 nm
and the emission peak was observed about 388 nm. Thus the results
indicate that APTSC crystal has the blue fluorescence emission.

36
Fig. 2.14 Excitation spectrum of APTSC
Fig. 2.15 Emission spectrum of APTSC
250 375 500 625 750
0
10
20
30
40
50
Wavelength (nm)
Inte
nsit
y (
A.U
)
200 240 280 320 360
0
50
100
150
200
Wavelength (nm)
Inte
ns
ity
(A
.U)
37
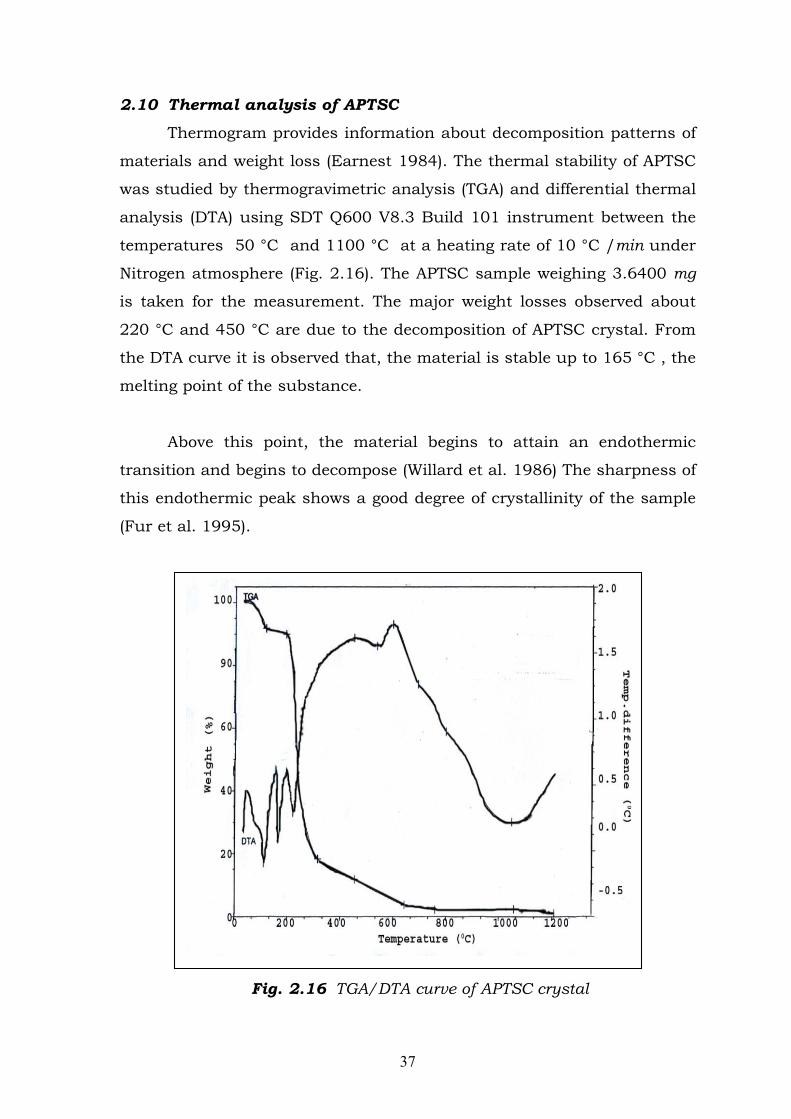
2.10 Thermal analysis of APTSC
Thermogram provides information about decomposition patterns of
materials and weight loss (Earnest 1984). The thermal stability of APTSC
was studied by thermogravimetric analysis (TGA) and differential thermal
analysis (DTA) using SDT Q600 V8.3 Build 101 instrument between the
temperatures 50 °C and 1100 °C at a heating rate of 10 °C /min under
Nitrogen atmosphere (Fig. 2.16). The APTSC sample weighing 3.6400 mg
is taken for the measurement. The major weight losses observed about
220 °C and 450 °C are due to the decomposition of APTSC crystal. From
the DTA curve it is observed that, the material is stable up to 165 °C , the
melting point of the substance.
Above this point, the material begins to attain an endothermic
transition and begins to decompose (Willard et al. 1986) The sharpness of
this endothermic peak shows a good degree of crystallinity of the sample
(Fur et al. 1995).
Fig. 2.16 TGA/DTA curve of APTSC crystal
38
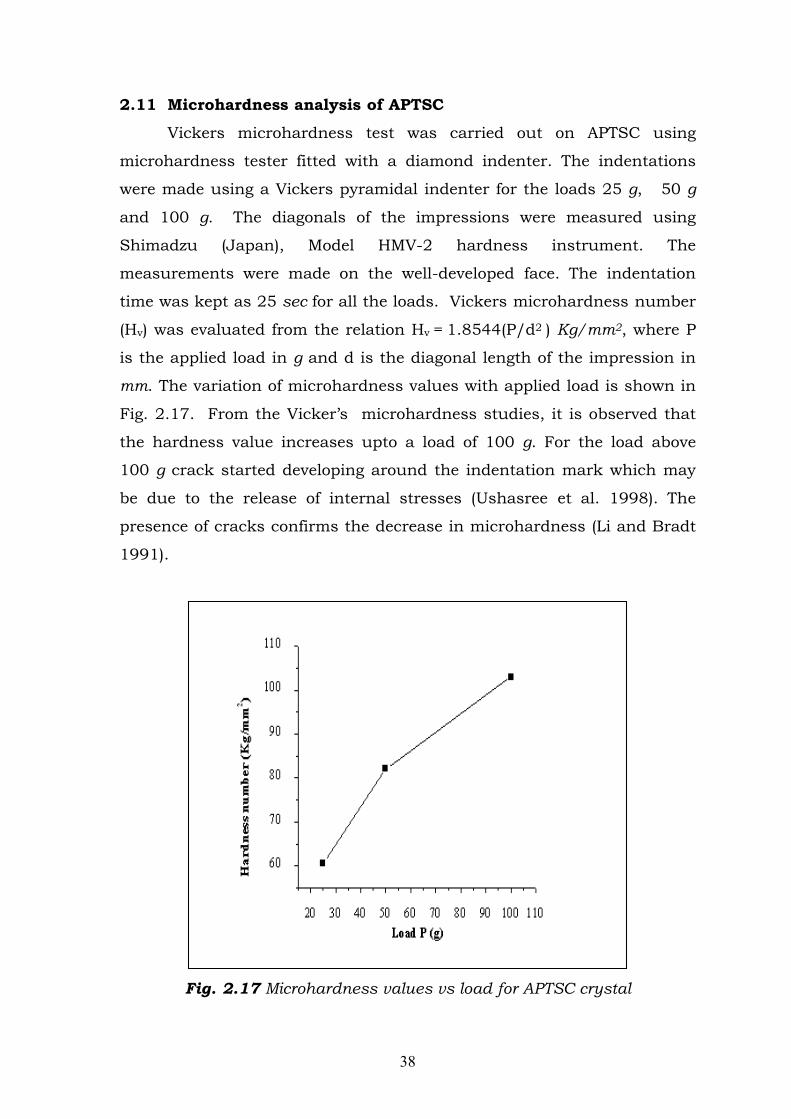
2.11 Microhardness analysis of APTSC
Vickers microhardness test was carried out on APTSC using
microhardness tester fitted with a diamond indenter. The indentations
were made using a Vickers pyramidal indenter for the loads 25 g, 50 g
and 100 g. The diagonals of the impressions were measured using
Shimadzu (Japan), Model HMV-2 hardness instrument. The
measurements were made on the well-developed face. The indentation
time was kept as 25 sec for all the loads. Vickers microhardness number
(Hv) was evaluated from the relation Hv = 1.8544(P/d2 ) Kg/mm2, where P
is the applied load in g and d is the diagonal length of the impression in
mm. The variation of microhardness values with applied load is shown in
Fig. 2.17. From the Vicker’s microhardness studies, it is observed that
the hardness value increases upto a load of 100 g. For the load above
100 g crack started developing around the indentation mark which may
be due to the release of internal stresses (Ushasree et al. 1998). The
presence of cracks confirms the decrease in microhardness (Li and Bradt
1991).
Fig. 2.17 Microhardness values vs load for APTSC crystal

39
Work hardening coefficient n, a measure of the strength of the
crystal is computed from the log P-log d plot (Fig. 2.18 ) and it is found to
be 3.01. Onitsch (1950) inferred that the value of n lies between 1 and
1.6 for hard materials and for soft materials it is above 1.6. Thus the
APTSC crystal comes under the soft material category.
Fig. 2.18 The plot of log P vs log d of APTSC

40
Section B
Growth and characterization of benzaldehyde thiosemicarbazone
monohydrate (BTSC) single crystals
2.12 Experimental
2.12.1 Synthesis, solubility and growth of BTSC single crystals
The BTSC was synthesized following the procedure given by
(Sheng-Jiu Gu and Kai-Mei Zhu 2008) by reacting benazaldehyde and
thiosemicarbazide in 100 ml flask in the presence of aqueous medium.
After refluxing it for 2 hrs at 100 °C the mixture was allowed to cool
slowly to room temperature which yeilded colourless crystalline powder
solid of the compound. The reaction is depicted in Scheme. Repeated
recrystallization of BTSC from ethanol was carried out to improve the
purity of the compound. As a first step towards crystallization, the
selection of suitable solvent is very definitive for the growth of good
quality single crystals (Sherwood 1998 and Holden and Singer 1960).
Scheme. The reaction mechanism of BTSC
The solubility of BTSC was determined at five different
temperatures, viz, 25, 30, 35, 40 and 45 °C. The solubility at 25 °C was
determined by dissolving the BTSC salt in 100 cc ethanol taken in an air-
tight container and placed in a water bath with continuous stirring. After
attaining the saturation the concentration of the solute was estimated
gravimetrically. The same procedure was repeated to estimate the
41
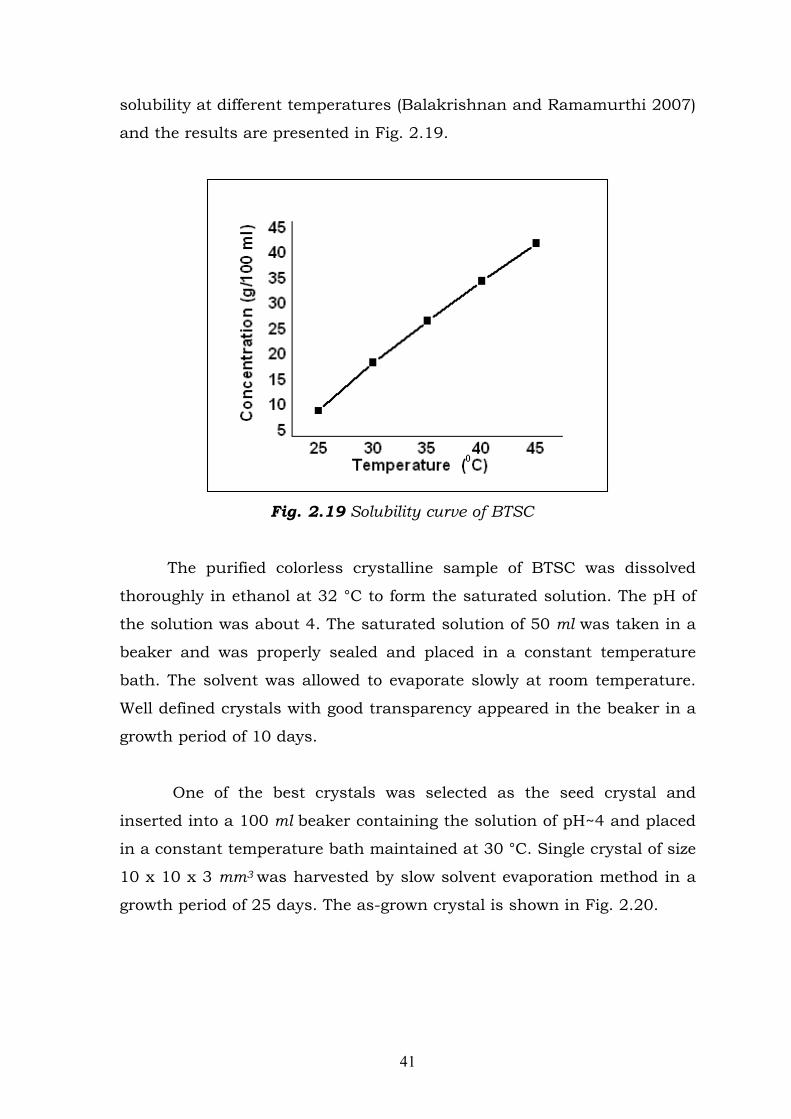
solubility at different temperatures (Balakrishnan and Ramamurthi 2007)
and the results are presented in Fig. 2.19.
Fig. 2.19 Solubility curve of BTSC
The purified colorless crystalline sample of BTSC was dissolved
thoroughly in ethanol at 32 °C to form the saturated solution. The pH of
the solution was about 4. The saturated solution of 50 ml was taken in a
beaker and was properly sealed and placed in a constant temperature
bath. The solvent was allowed to evaporate slowly at room temperature.
Well defined crystals with good transparency appeared in the beaker in a
growth period of 10 days.
One of the best crystals was selected as the seed crystal and
inserted into a 100 ml beaker containing the solution of pH~4 and placed
in a constant temperature bath maintained at 30 °C. Single crystal of size
10 x 10 x 3 mm3 was harvested by slow solvent evaporation method in a
growth period of 25 days. The as-grown crystal is shown in Fig. 2.20.

42
Fig. 2.20 The as-grown BTSC crystal
2.13 Single crystal X-ray diffraction studies of BTSC
The X-ray diffraction (XRD) data were collected using a computer-
controlled Enraf Nonius-CAD 4 single crystal X-ray diffractometer. Single
crystal of suitable size was selected for the X-ray diffraction analysis and
the unit cell parameters were determined using 25 reflections. XRD
results show that BTSC crystal belongs to the orthorhombic system and
the unit cell parameters obtained are in great agreement with the
reported values of Jiu Gu and Kai-Mei Zhu (2008) (Table 2.3). It has
been observed that BTSC crystal belongs to the most popular space
group of P212121. The crystal structure of BTSC is reported to be
stabilized by N―H…N intramolecular hydrogen bonds and contributes to
the molecular conformation. In addition water molecules are involved in
the intermolecular N―H…O and O―H…S hydrogen bonds, which link the
molecules into ribbons extended along the a-axis. Weak intermolecular
N―H…S hydrogen bonds link these ribbons into layers parallel to the ab
plane with phenyl rings pointing up and down (Sheng Jiu Gu and Kai-
Mei Zhu 2008).
43
Table 2.3 Unit cell parameters of BTSC
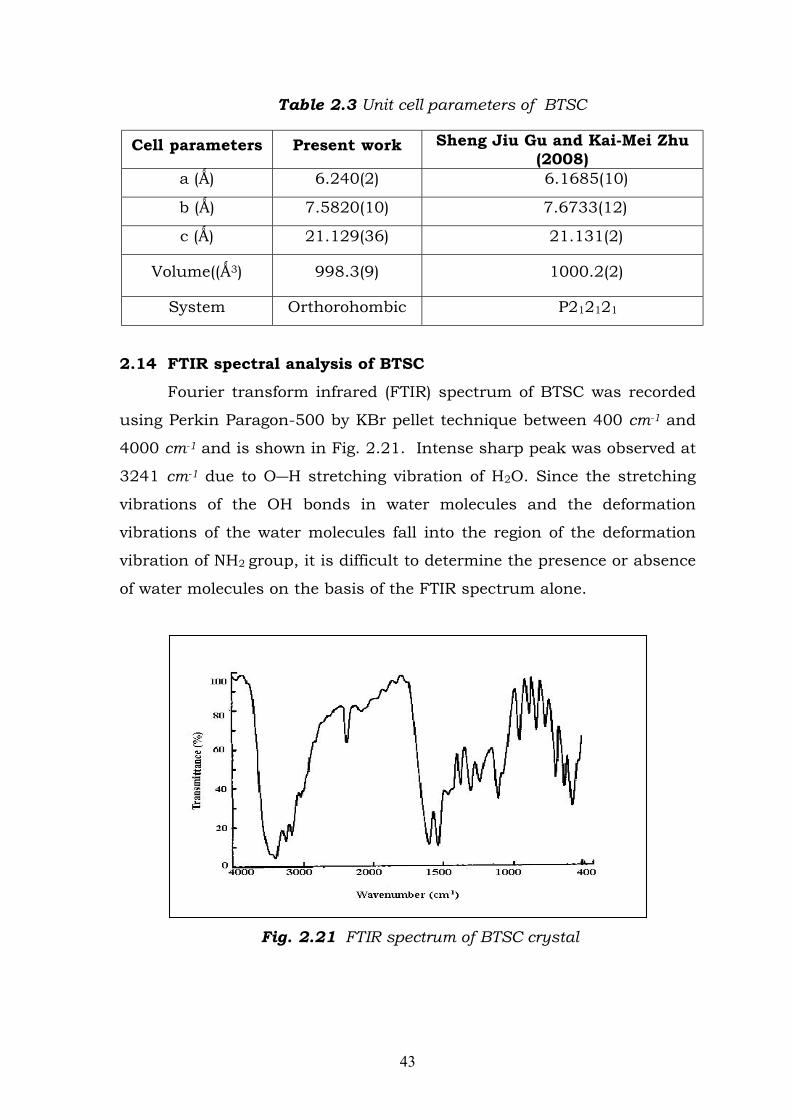
2.14 FTIR spectral analysis of BTSC
Fourier transform infrared (FTIR) spectrum of BTSC was recorded
using Perkin Paragon-500 by KBr pellet technique between 400 cm-1 and
4000 cm-1 and is shown in Fig. 2.21. Intense sharp peak was observed at
3241 cm-1 due to O―H stretching vibration of H2O. Since the stretching
vibrations of the OH bonds in water molecules and the deformation
vibrations of the water molecules fall into the region of the deformation
vibration of NH2 group, it is difficult to determine the presence or absence
of water molecules on the basis of the FTIR spectrum alone.
Fig. 2.21 FTIR spectrum of BTSC crystal
Cell parameters Present work Sheng Jiu Gu and Kai-Mei Zhu (2008)
a (Ǻ) 6.240(2) 6.1685(10)
b (Ǻ) 7.5820(10) 7.6733(12)
c (Ǻ) 21.129(36) 21.131(2)
Volume((Ǻ3) 998.3(9) 1000.2(2)
System Orthorohombic P212121
44
As expected, the peak corresponding to imine group (C═N) was
observed at 1595 cm-1, which confirms the formation of the imine bond
between aldehyde and hydrazide. The peaks lying below 1500 cm-1 could
be due to C═N and N―N stretching vibration. As it is very broad, nearly
all NH2 groups in the crystal are expected to be in hydrogen bonding
interaction with neighbouring groups. The C―H stretching absorption, a
weak absorption, is observed at 3026 cm-1 (Silverstein and Webster 1998
and Sankar et al. 2007). The C═C stretching (medium) absorption is
confirmed from the band at 1534 cm-1. The deformation vibrations of
NH2 group is confirmed from the band at 1365 cm-1. The C═S stretch of
thiosemicarbazide moiety is observed at 1100 cm-1.
Absence of characteristic aldehyde band at 2720 cm-1 indicates that
there is no aldehyde group in the final product (Willard et al. 1986). NH2
asymmetric stretching is confirmed at 3156 cm-1. The peak at 686 cm-1 is
due to the N―H out-of-plane bending. As mono substituted benzenes
show C―H deformation in the region 700-900 cm-1, the peaks at 868 cm-1
and 754 cm-1 are due to C―H deformations. Thus the FTIR spectrum
confirms the formation of BTSC.
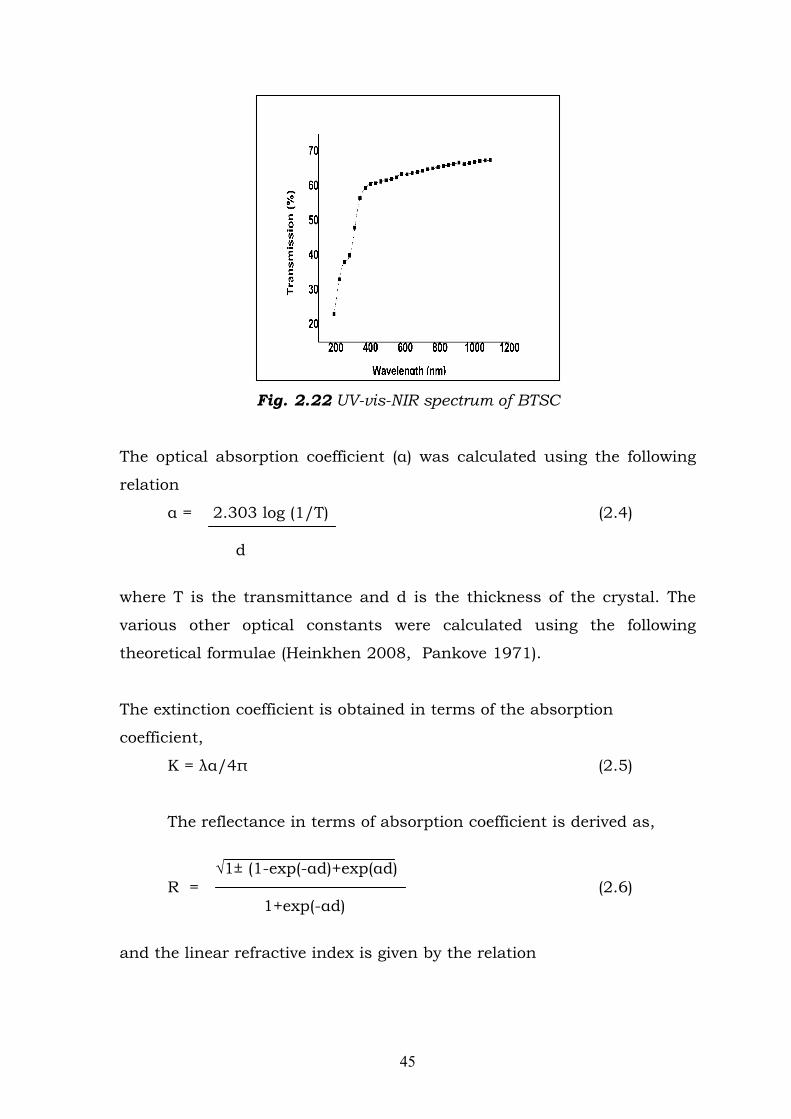
2.15 Linear and nonlinear optical properties
In order to estimate the optical transparency in the 200-1100 nm
region of the electromagnetic spectrum, the optical transmittance study
is carried out on the BTSC crystal of thickness ~2 mm employing Varian
Cary 5E UV–vis–NIR spectrophotometer (Fig. 2.22). The cutoff wavelength
of the BTSC is observed ~370 nm and the crystal is found to be
transparent in the region of ~400-1100 nm. The hump at 220 nm is due
to the electronic excitation of the aromatic compound containing sulfur
and nitrogen (Chatwal 2004).
45
Fig. 2.22 UV-vis-NIR spectrum of BTSC
The optical absorption coefficient (α) was calculated using the following
relation
α = 2.303 log (1/T) (2.4)
d
where T is the transmittance and d is the thickness of the crystal. The
various other optical constants were calculated using the following
theoretical formulae (Heinkhen 2008, Pankove 1971).
The extinction coefficient is obtained in terms of the absorption
coefficient,
K = λα/4π (2.5)
The reflectance in terms of absorption coefficient is derived as,
√1± (1-exp(-αd)+exp(αd)
R = (2.6) 1+exp(-αd)
and the linear refractive index is given by the relation
46
-(R+1) ± √(-3R +10R-3) (2.7)
n = 2(R-1)
The complex dielectric constant is related to the refractive index
and the extinction coefficient as
εc = εr + εi (2.8)
where the real (εr) and imaginary (εi) dielectric constant are given as
εr = n2 – K2 (2.9)
εi = 2nK (2.10)
The optical conductivity (σop ) is a measure of the frequency response of
the material when it is irradiated with light
σop = αnc/4π (2.11)
where c is the velocity of light. The electrical conductivity can also be
estimated by optical method using the relation
σe = 2λ σop / α (2.12)
The Z-scan is a simple and popular experimental technique to
measure the intensity dependent third order nonlinear susceptibility of
the materials. It allows the simultaneous measurement of both the
nonlinear refractive index and the nonlinear absorption coefficient. In
this method, the sample is translated in the Z-direction along the axis of
a focused Gaussian beam from the He-Ne laser at 632.8 nm and the far
field intensity is measured as a function of the sample position. The
schematic diagram of Z-scan technique is shown in Fig. 2.12. By properly
monitoring the transmittance change through a small aperture at the far
field position (closed aperture), one is able to determine the amplitude of
the phase shift. By moving the sample through the focus and without
47
placing an aperture at the detector (open aperture) one can measure the
intensity dependent absorption of the sample.
When both the methods (open and closed) are used for the
measurements, the ratio of the signals determines the nonlinear
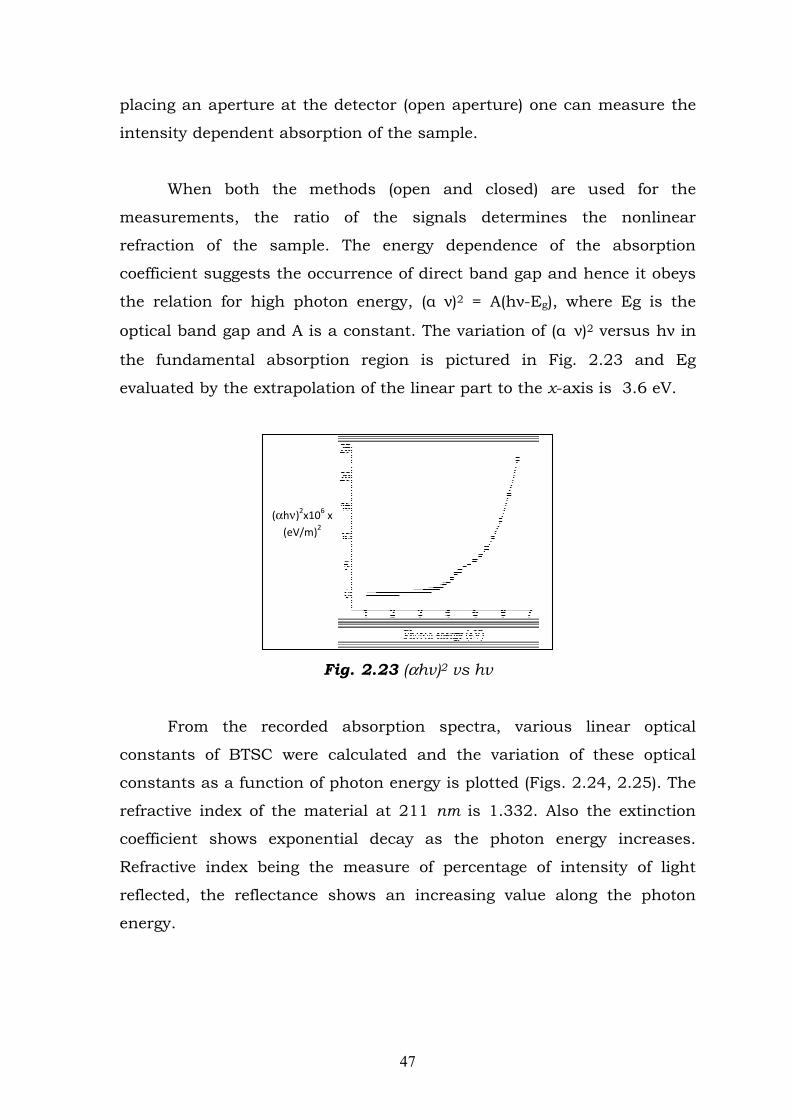
refraction of the sample. The energy dependence of the absorption
coefficient suggests the occurrence of direct band gap and hence it obeys
the relation for high photon energy, (α�ν)2 = A(hν-Eg), where Eg is the
optical band gap and A is a constant. The variation of (α�ν)2 versus hν in
the fundamental absorption region is pictured in Fig. 2.23 and Eg
evaluated by the extrapolation of the linear part to the x-axis is 3.6 eV.
Fig. 2.23 (αhν)2 vs hν
From the recorded absorption spectra, various linear optical
constants of BTSC were calculated and the variation of these optical
constants as a function of photon energy is plotted (Figs. 2.24, 2.25). The
refractive index of the material at 211 nm is 1.332. Also the extinction
coefficient shows exponential decay as the photon energy increases.
Refractive index being the measure of percentage of intensity of light
reflected, the reflectance shows an increasing value along the photon
energy.
(αhν)2x10⁶ x (eV/m)2

48
Fig. 2.24 Extinction coefficient as a function of photon energy
Fig. 2.25 Reflectance as a function of photon energy

49
From Figs. 2.24 and 2.25, it is clear that the extinction coefficient
and the reflectance depend upon the absorption coefficient. The internal
energy of the device depends on this absorption coefficient. The high
transmission and low reflectance of BTSC in the UV-Vis-NIR region reveal
that the material may be used in antireflection coating in solar thermal
devices and nonlinear optical applications. The low extinction value (10-3)
shows the semiconducting nature of the material (Pankove 1971). This
makes the material more prominent for device applications in information
processing and computing. The third order nonlinear refractive index and
the nonlinear absorption coefficient were evaluated by the Z-scan
measurements using the equations 2.1-2.3 described in section-A
(Chapter 2) and the results are shown in Figs. 2.26a and 2.26b
respectively.
Fig. 2.26a Z-scan open aperture
Open Curve
0
0.5
1
1.5
2
2.5
3
3.5
-15 -10 -5 0 5 10 15
Z-Position (mm)
Nor
mal
ised
Tra
nsm
itta
nce
50
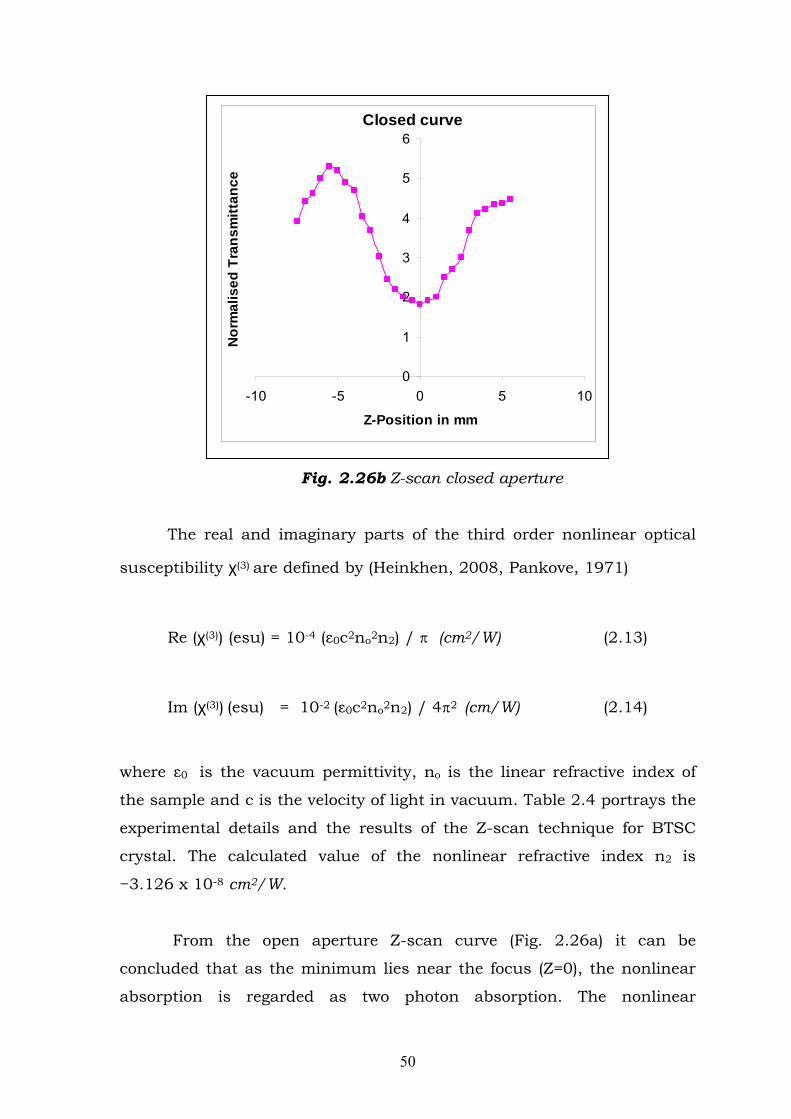
Fig. 2.26b Z-scan closed aperture
The real and imaginary parts of the third order nonlinear optical
susceptibility χ(3) are defined by (Heinkhen, 2008, Pankove, 1971)
Re (χ(3)) (esu) = 10-4 (ε0c2no2n2) / (cm2/W) (2.13)
Im (χ(3)) (esu) = 10-2 (ε0c2no2n2) / 42 (cm/W) (2.14)
where ε0 is the vacuum permittivity, no is the linear refractive index of
the sample and c is the velocity of light in vacuum. Table 2.4 portrays the
experimental details and the results of the Z-scan technique for BTSC
crystal. The calculated value of the nonlinear refractive index n2 is
−3.126 x 10⁻⁸ cm2/W.
From the open aperture Z-scan curve (Fig. 2.26a) it can be
concluded that as the minimum lies near the focus (Z=0), the nonlinear
absorption is regarded as two photon absorption. The nonlinear
Closed curve
0
1
2
3
4
5
6
-10 -5 0 5 10
Z-Position in mm
No
rma
lis
ed
Tra
ns
mit
tan
ce

51
absorption coefficient is found to be 4.076 x 10⁻³ cm/W. The third order
susceptibility of BTSC is 3.915 x 10⁻⁶ esu.
Table 2.4 Meaurement details and the results of the Z-scan
technique
2.16 Thermal analysis
Thermogram provides information about the thermal properties of
materials (Earnest 1984). The thermal stability of BTSC crystal was
studied by thermogravimetric analysis (TGA) and differential thermal
analysis (DTA) using SDT Q600 V8.3 Build 101 instrument between the
temperatures 50 °C and 1100 °C at a heating rate of 10 °C /min in
nitrogen atmosphere (Fig. 2.27). The BTSC sample weighing 1.745 mg
was taken for the measurement.
Laser beam wavelength 632.8 nm
Focal length of the lens 24 cm
Optical path length 175 cm
Beam radius of the aperture (ωa) 4 mm
Aperture radius (ra) 4 mm
Sample thickness (l) 1.7 mm
Beam radius (ωL) 3 mm
Effective thickness (Leff) 1.69 mm
Linear absorption efficient 0.625
Nonlinear refractive index(n2) −3.126 x 10⁻⁸ cm2/W
Nonlinear absorption coefficient (β) 4.076 x 10⁻³ cm/W
Real part of the third-order susceptibility [Re ( X 3 )]
3. 27 x 10-6 esu
Imaginary part of the third-order susceptibility [Im ( X 3 )]
2.15 x 10⁻⁶ esu
Third-order susceptibility ( X 3) 3.915 x 10⁻⁶ esu

52
There are three weight losses noted in the thermogram. The earlier
one is due to expulsion of water present in the crystal. The second and
third major weight loss is observed just above 220 °C and 400 °C. It is
due to decomposition of BTSC crystal. From the DTA curve it is observed
that, the material is stable up to 153 °C, the melting point of the
substance. The melting point, also measured directly using a GUNA
melting point apparatus, confirmed this value. Above this point, the
material begins to attain an endothermic transition and begins to
decompose (Willard et al 1986).
Fig. 2.27 TGA/DTA curves of BTSC
2.17 Nonlinear optical studies
Kurtz and Perry (1968) second harmonic generation test was
performed to estimate the NLO efficiency of powdered BTSC crystal. The
grown single crystal of BTSC was powdered with a uniform particle size
and then packed in a micro capillary of uniform bore and was illuminated

53
using Spectra Physics Quanta Ray DHS2: Nd:YAG laser using the first
harmonics output of 1064 nm with pulse width of 8 ns and repetition rate
10 Hz. The second harmonics signal, generated in the crystal was
confirmed from the emission of green radiation by the crystal. A sample
of potassium dihydrogen orthophosphate, also powdered to the same
particle size as the experimental sample, was used as a reference
material in the present measurement. The SHG radiations of 532 nm
green light was collected by a photomultiplier tube (PMT-Philips
Photonics-model 8563) after being monochromated (monochromator-
model Triax-550) to collect only the 532 nm radiation. The optical signal
incident on the PMT was converted into voltage output at the CRO
(Tektronix-TDS 3052B). The input laser energy incident on the powdered
sample was chosen to be 3.4 mJ. Thus the Powder SHG efficiency
obtained for BTSC is about 5.3 times that of potassium dihydrogen
orthophosphate crystal. This may be attributed to the existence of
intermolecular N―H…N and N―H…S hydrogen bonds and N―H…O and
O―H…S hydrogen bonds due to water molecules in BTSC, which link the
molecules into ribbons extended along the a-axis (Jiu Gu and Kai-Mei
Zhu 2008).
2.18 Microhardness studies
Measurement of hardness is a useful nondestructive testing
method to determine the hardness of the materials. The micro hardness
value correlates with other mechanical properties such as elastic
constants and yield strength. Vickers microhardness test was carried out
on BTSC single crystal using Vickers hardness tester fitted with
pyramidal indenter. Several trials of indentation (Mott 1956, Wyatt and
Hughes 1974, Tabor 1951, Neill 1967 and Smith and Sandland 1923)
were carried out on the prominent (0 1 1) face of the crystal and the
average diagonal length was calculated for an indentation time of 15 sec.
The Vickers hardness number is calculated using the relation
54
22
PH 1.8544 kg / mm
dν = (2.15)
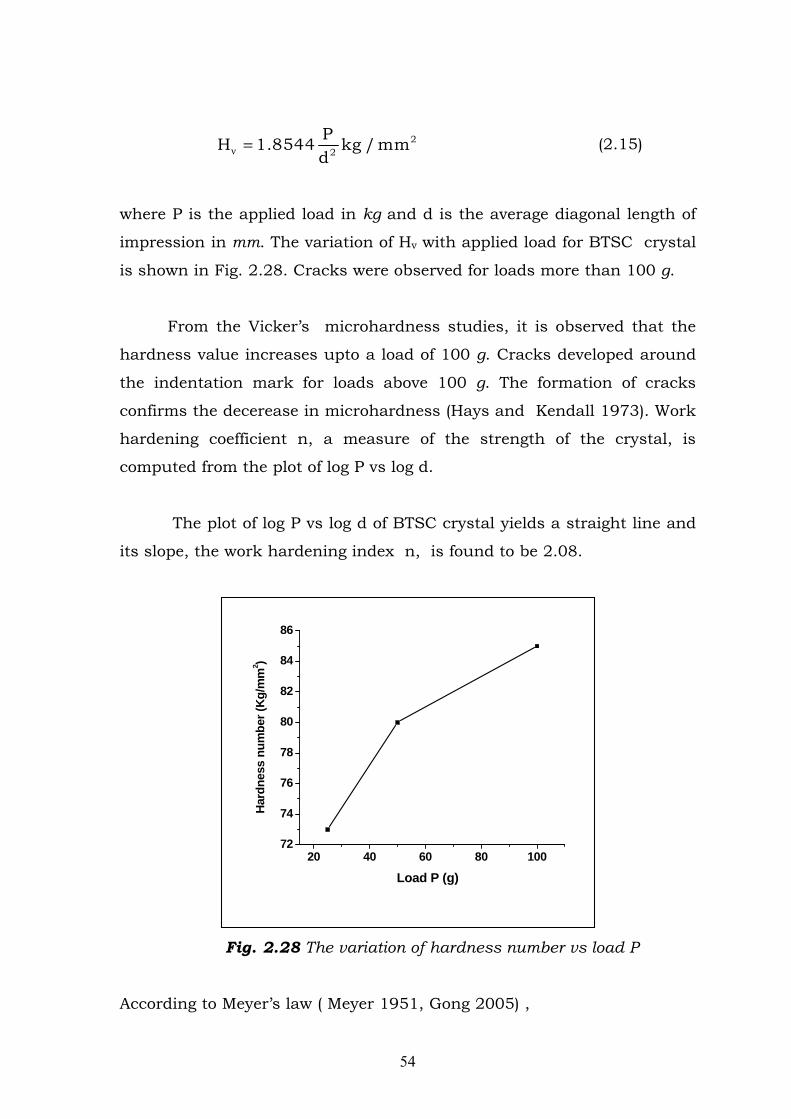
where P is the applied load in kg and d is the average diagonal length of
impression in mm. The variation of Hv with applied load for BTSC crystal
is shown in Fig. 2.28. Cracks were observed for loads more than 100 g.
From the Vicker’s microhardness studies, it is observed that the
hardness value increases upto a load of 100 g. Cracks developed around
the indentation mark for loads above 100 g. The formation of cracks
confirms the decerease in microhardness (Hays and Kendall 1973). Work
hardening coefficient n, a measure of the strength of the crystal, is
computed from the plot of log P vs log d.
The plot of log P vs log d of BTSC crystal yields a straight line and
its slope, the work hardening index n, is found to be 2.08.
Fig. 2.28 The variation of hardness number vs load P
According to Meyer’s law ( Meyer 1951, Gong 2005) ,
20 40 60 80 10072
74
76
78
80
82
84
86
Har
dn
ess
nu
mb
er (
Kg
/mm
2 )
Load P (g)

55
(2.16)
where K1 is the standard hardness found out from the P versus dn graph.
It is known that the material takes some time to revert to elastic mode
after the applied load is removed, so a correction x is applied to the
observed d value. Kick’s law may be modified as,
(2.17)
Simplifying eqns. (2.16) and (2.17) become
(2.18)
The slope of dn/2 verses d yields (K2/K1)1/2 and the intercept is a measure
of x.
The fracture toughness (Kc) is given by
Kc = P / (β × C3/2) (2.19)
where C is the crack length measured from the centre of the indentation
mark to the crack tip, P is the applied load and geometrical constant
β = 7 for Vicker’s indenter. The brittleness index (B) is given by
B = Hv / Kc (2.20)
The yield strength (σv) of the material can be derived using the
relation
}])n()n(.
[)]n({[.
H nVv
2
21251221
92−
−−−×−−=σ (2.21)
Onitsch (1950) inferred that for hard materials the value of n lies
between 1 and 1.6 and for soft materials it is above 1.6. Thus the BTSC
crystal comes under the soft materials category. The load dependent
ndKP 1
=
22 )( x
dK P + =
xKKdK Kd n 2/112
2/ 1 1 2
2/ )/()/ ( + =
56
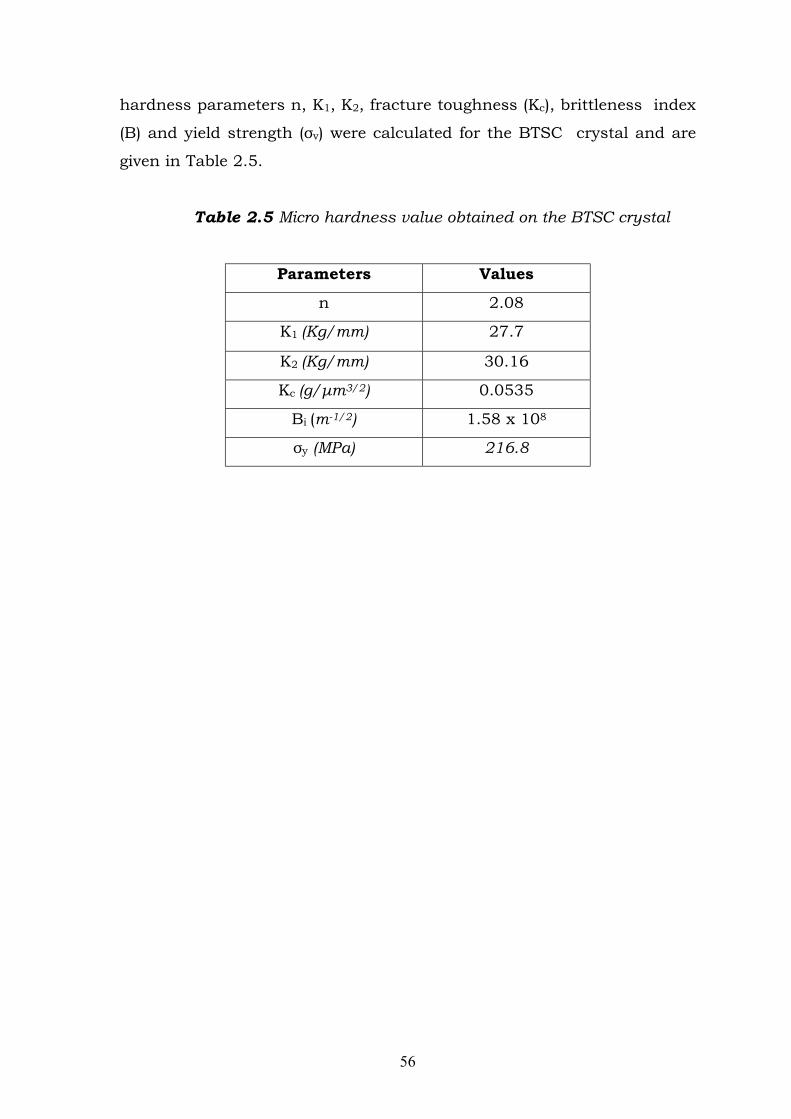
hardness parameters n, K1, K2, fracture toughness (Kc), brittleness index
(B) and yield strength (σv) were calculated for the BTSC crystal and are
given in Table 2.5.
Table 2.5 Micro hardness value obtained on the BTSC crystal
Parameters Values
n 2.08
K1 (Kg/mm) 27.7
K2 (Kg/mm) 30.16
Kc (g/μm3/2) 0.0535
Bi (m-1/2) 1.58 x 10⁸
σy (MPa) 216.8