synthesis of some novel surfactants based on di-oleamide ...used to evaluate their performance as...
TRANSCRIPT

International Journal of Science and Research (IJSR) ISSN (Online): 2319-7064
Index Copernicus Value (2013): 6.14 | Impact Factor (2013): 4.438
Volume 4 Issue 5, May 2015
www.ijsr.net Licensed Under Creative Commons Attribution CC BY
Synthesis of Some Novel Surfactants Based On Di-
Oleamide and Evaluation of Their Performance as
Corrosion Inhibitors for X-70 Under sweet and Sour
conditions
A. M. Al-Sabagh2, M. A. Migahed2, E. S. Gad1*, A. H. Halawa1, H. M. Abd EL-Bary1
1Chemistry Department, Faculty of Science, Al-Azhar University, Cairo, Egypt 2Egyptian Petroleum Research Institute (EPRI), Nasr City, Cairo 11727, Egypt
*Corresponding Author: E. S. Gad (e_said56@yahoo. com)
Abstract: The main objective of this work was to examine the corrosion inhibition ability of three novel surfactant molecules
synthesized fromN, N'- (azanediylbis (ethane-2, 1-diyl)) dioleamide which named (I, II and III). Their chemical structures were
confirmed using FTIR and 1HNMR spectroscopic methods. The surface active properties of the synthesized surfactants were calculated
from surface tension measurements. Potentiodynamic polarization and electrochemical impedance spectroscopy (EIS) techniques were
used to evaluate their performance as corrosion inhibitors for X-70 type tubing steel in deep oil wells formation water under sweet and
sour environment at 25oC. Polarization curves showed that by increasing theinhibitor concentration the corrosion current density was
decreased, and the prepared surfactants acted as mixed type inhibitors. But the cathodic effect is more pronounced. Data obtained from
EIS technique were analyzed to model the corrosion inhibition process through equivalent circuit (EC). Quantum chemical calculations
based on ab initio method were performed on I, II and III. The molecular structural parameters, such as the frontier molecular orbital
energy HOMO (highest occupied molecular orbital) and LUMO (lowest unoccupied molecular orbital), and the fraction of electrons
(∆N) transfer from inhibitor to carbon steel surface were calculated and discussed. Finally, the nature of the formed protective film was
analyzed by SEM and EDX techniques. The results showed that the selected surfactants have good efficiencies as corrosion inhibitors
for tubing steel in deep oil wells formation water under sweet and sour conditions.
Keywords: Surfactants based on di-Oleamide, corrosion inhibitors, deep oil wells formation water, X-70 tubing steel, potentiodynamic
polarization, EIS, SEM, EDX.
1. Introduction
Corrosion is a fundamental process playing an important
role in economics and safety, particularly for metals [1].
Carbon steel is widely used in many industrial applications
especially petroleum industry from production to refinery
and has remarkable economic and attractive materials for
engineering applications owing to its low cost, easy
availability and high mechanical strength. Many cases of
extensive corrosion have occurred in production tubing,
valves, and flow lines from the wellhead to the processing
equipment. The cost of replacing, repairing and
maintaining steel pipelines resulting from corrosion
processing oil field is extremely expensive and time-
consuming [2, 3]. The development of corrosion inhibitors
is based on organic compounds containing nitrogen,
oxygen, sulphur atoms, and multiple bonds in the
molecules that facilitate adsorption on the metal surface
[4,5]. Among them, the surfactant inhibitor has many
advantages such as high inhibition efficiency, low price,
low toxicity, easy productionand exhibit unique properties
due to their amphiphilic molecule [6–9]. The adsorption of
the surfactant on the metal surface can markedly change
the corrosion resisting property of the metal [10, 11], so
the study of the relationship between the adsorption and
corrosion inhibition is of great importance. These
compounds are often simultaneously affected by both
anodic and cathodic corrosion reactions; therefore, they
are sometimes referred to as mixed-type corrosion
inhibitors [12–14]. The water content accompanying the
oil production process has been found to be a significant
factor in the internal corrosion of steel pipelines because
the water contains many corrosive agents such as CO2,
H2S, organic acids and salts [15–21]. Both CO2 and H2S
behave like weak acids. As such, they are able to provide
oxidizing power and promote iron corrosion, establishing
equilibrium between oxidation (Fe / Fe+2) and reduction
reactions. The most common reduction reaction in acid
media is proton reduction (2H+ / H2). Carbon dioxide
present in sweet wells forms a weak carbonic acid
(H2CO3) solution in aqueous media which attack the steel
pipeline and forms iron carbonate (FeCO3) with the
evolution of H2 [22]. The mechanism of H2S contribution
was proposed by Shoesmith et al [23]. The corrosion
reaction of iron with H2S occurred mainly by a solid state
reaction, via the reaction:
Fe + H2S FeS + H2 (1)
To be effective, an inhibitor must displace water from the
metal surface, interact with anodic or cathodic reaction
sites to retard the oxidation and reduction corrosion
reaction, prevent transportation of water and corrosion
active species on the surface [24]. In fact, introducing of
Paper ID: SUB154153 1035
International Journal of Science and Research (IJSR) ISSN (Online): 2319-7064
Index Copernicus Value (2013): 6.14 | Impact Factor (2013): 4.438
Volume 4 Issue 5, May 2015
www.ijsr.net Licensed Under Creative Commons Attribution CC BY
ethylene oxides into surfactant molecule (ethoxylation)
increases the inhibitive effect of surfactant [25]. The
presence of these groups increases the solubility of
surfactant and hence the extent of its adsorption on the
metal surface increases and consequently its inhibitive
action improves. The adsorption of the surfactant on the
metal surface can markedly change the corrosion resisting
property of the metal [26,27], so the study of the
relationship between the adsorption and corrosion
inhibition is of great importance. Quantum chemical
calculations have been proved to be a very powerful tool
for studying the inhibition mechanism [28,29]. The present
study is aimed to synthesis one nonionic and two cationic
surfactants and evaluates their performance as corrosion
inhibitors for carbon steel in oil wells formation water
under sweet and sour environment. The choice of these
compounds was based on molecular structure
considerations that, these compounds contain hetero-atoms
such as N and O, which induce greater adsorption of the
inhibitor molecule onto the surface of carbon steel.
2. Experimental Method
2.1. Inhibitors
The three novel surfactants used in this study were
synthesized in three steps as follow:
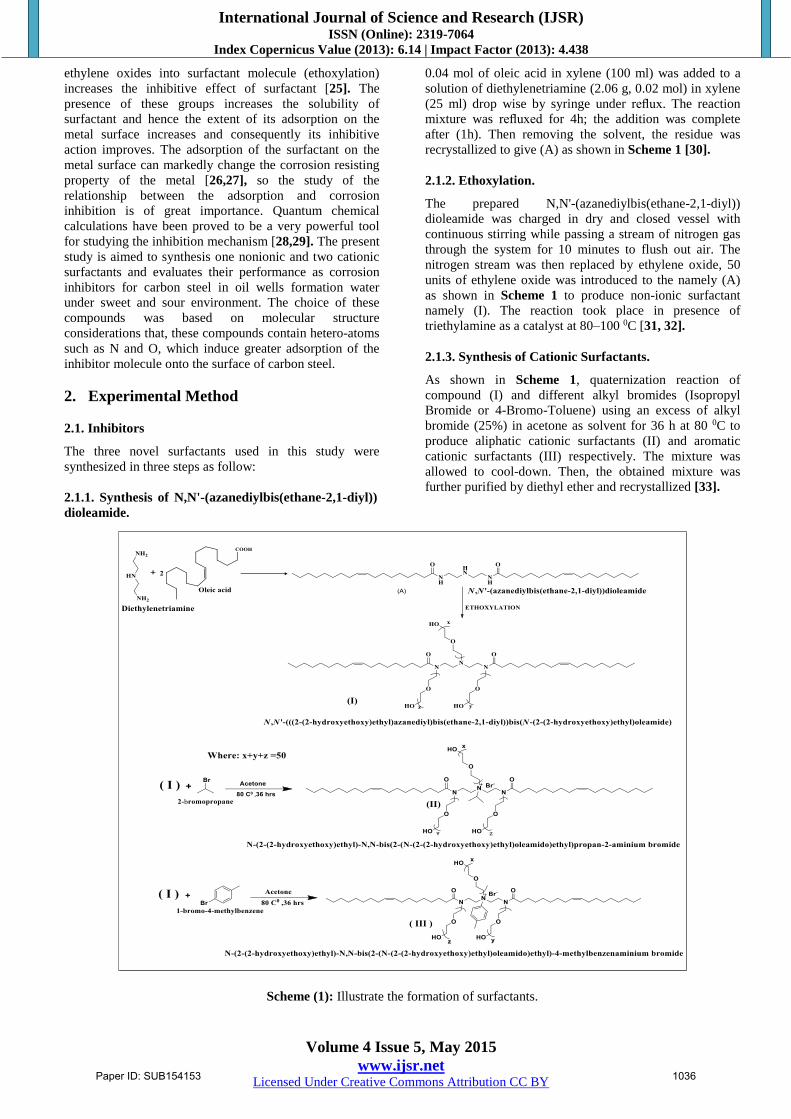
2.1.1. Synthesis of N,N'-(azanediylbis(ethane-2,1-diyl))
dioleamide.
0.04 mol of oleic acid in xylene (100 ml) was added to a
solution of diethylenetriamine (2.06 g, 0.02 mol) in xylene
(25 ml) drop wise by syringe under reflux. The reaction
mixture was refluxed for 4h; the addition was complete
after (1h). Then removing the solvent, the residue was
recrystallized to give (A) as shown in Scheme 1 [30].
2.1.2. Ethoxylation.
The prepared N,N'-(azanediylbis(ethane-2,1-diyl))
dioleamide was charged in dry and closed vessel with
continuous stirring while passing a stream of nitrogen gas
through the system for 10 minutes to flush out air. The
nitrogen stream was then replaced by ethylene oxide, 50
units of ethylene oxide was introduced to the namely (A)
as shown in Scheme 1 to produce non-ionic surfactant
namely (I). The reaction took place in presence of
triethylamine as a catalyst at 80–100 0C [31, 32].
2.1.3. Synthesis of Cationic Surfactants.
As shown in Scheme 1, quaternization reaction of
compound (I) and different alkyl bromides (Isopropyl
Bromide or 4-Bromo-Toluene) using an excess of alkyl
bromide (25%) in acetone as solvent for 36 h at 80 0C to
produce aliphatic cationic surfactants (II) and aromatic
cationic surfactants (III) respectively. The mixture was
allowed to cool-down. Then, the obtained mixture was
further purified by diethyl ether and recrystallized [33].
Scheme (1): Illustrate the formation of surfactants.
Paper ID: SUB154153 1036

International Journal of Science and Research (IJSR) ISSN (Online): 2319-7064
Index Copernicus Value (2013): 6.14 | Impact Factor (2013): 4.438
Volume 4 Issue 5, May 2015
www.ijsr.net Licensed Under Creative Commons Attribution CC BY
2.2. Steel Specimen
Tests were performed on a pipeline steel (X70) of the
following chemical composition (wt. %) : 0. 07% C, 0. 3%
Si, 1. 15% Mn, 0. 008% P, 0. 001%S, 0. 01% Ni, 0. 02%
Cr, 0. 01% Mo, 0. 02% Cu, appropriate content of (V, Nb,
Ti) and the remainder is Fe.
2.3. Solution Preparation
In the deep oil well formation waternaturally exists in the
reservoir rocks before drilling, the following constituents
[Na2S (0. 006M), Na2CO3 (0. 05M) and HCl (1%)] were
dissolved to prepare the test solution for the present work.
The main components usually present in the most oil field
water are inorganic compounds such as (sodium, calcium,
magnesium, chloride, bicarbonate, and sulphate) and
dissolved organic compounds. The chemical composition
and physical properties of the used oil wells formation
water are shown in Table 1.
2.4. Electrochemical Measurements
The electrochemical experiments were carried out in a
conventional three-electrode cell with a platinum counter
electrode (CE) and a saturated calomel electrode (SCE) as
a reference electrode. The working electrode (WE) was a
rod of API X70 steel pipeline embedded in glass holder
using epoxy resin so that the flat surface was the only
exposed surface in the electrode. The area of the working
exposure surface was 0.79 cm2. Before measurement, the
electrode was abraded and rinsed with distilled water then
immersed in a test solution at open circuit potential (OCP)
for 3hours until a steady state was reached. All
Electrochemical measurements were carried out using
Voltalab 80 (Tacussel-radiometer PG Z402) controlled by
Tacussel corrosion analysis software model (Volta master
4) at 250C.
2.4.1. Potentiodynamic Polarization Measurements
The potentiodynamic polarization measurements were
obtained by changing the electrode potential automatically
from -950 to -350 mV versus SCE with scan rate 2 mV s-1.
2.4.2. Electrochemical Impedance Spectroscopy (EIS)
EIS measurements were performed in the frequency range
between 100 kHz and 50 mHz using 10 steps per
frequency decade at open circuit potential after 3hours of
immersion time. AC signal with 20 mV amplitude peak to
peak was used to perturb the system. EIS diagrams are
given in Bode and Nyquist representations.
2.5. Surface Tension Measurement
The surface tension (γ) was measured using (Kruss K6
Tensiometer) type, a direct surface tension measurement
using ring method) at 25 0C for various concentrations of
the synthesized surfactants. All solutions were prepared in
double distilled water with a surface tension equal 72 mN
m-1 at 25 0C.
2. 6. Scanning Electron Microscopy
The surface examination was carried out using scanning
electron microscope (JEOL JSM-5410, Japan). The energy
of acceleration beam employed was 25 kV. All
micrographs were taken at a magnification power (X
1000).
2.8. Energy Dispersive Analysis of X-rays (EDX)
EDX system attached with a JEOL JSM-5410 scanning
electron microscope was used for elemental analysis or
chemical characterization of the film formed on carbon
steel surface before and after applying the synthesized
inhibitor (III).
2.9. Quantum Chemical Study
The molecular structures of the inhibitors undertaken have
been fully geometrically optimized via single point ab
initiomethod (3-21G basis set) using Austin model 1
(AM1) with hyperchem quantum chemistry software [34].
3. Results and Discussion
3.1. Confirmation of Chemical Structure of the
Prepared Inhibitors
3. 1. 1. FTIR Spectroscopy.
FTIR spectrum of N-(2-(2-hydroxyethoxy)ethyl)-N,N-
bis(2-(N-(2-(2-hydroxyethoxy) ethyl)oleamido)ethyl)-4-
methylbenzenaminium bromide as representative sample
Fig. 1 showed the following absorption bands:
1121 cm-1 (C–O band of the ethoxylated), 1377 cm-1 (C–
N+), 1657 cm-1 (C=O for amide group), 2854-2925 cm-1
(C–H aliphatic) and 3286 cm-1 (–OH group of ethoxylated
primary amine). The FTIR spectrum confirmed the
expected functional groups in the synthesized N-(2-(2-
hydroxyethoxy)ethyl)–N,N-bis(2-(N-(2-(2-hydroxyethoxy)
ethyl) oleamido) ethyl) -4-methylbenzenaminium bromide.
3.1.2. 1H NMR Spectroscopy.
1H NMR (DMSO-d6) spectrum of N-(2-(2-hydroxyethoxy)
ethyl)–N,N-bis(2-(N-(2-(2-hydroxyethoxy)ethyl)oleamido)
ethyl) -4-methylbenzenaminium bromide as representative
sample Fig. 2 showed different bands:
CH3- group at (a) 0.81 for terminal CH3- of oleic acid, (b)
2.4 for CH3- of tolyl group. The chemical shifts for CH2-
group at (a) 3.36 of the CH2–group in the first ethylene
oxide unit attached to 3° N, (b) 3.55 of the CH2– group of
repeated ethylene oxide units, (c) 1.2 of the CH2 –group in
the oleic acid, (d) 2.24 of the CH2–group in adjacent to
amide group and (e) 3.36 of the CH2–group in the ethylene
oxide unit attached to 4° N. The chemical shifts for CH-
group at 5.28 ppm. Finally 7.063-7.78 (m, 4H, Ar-H). The
data of 1H NMR spectra confirmed the expected hydrogen
proton distribution in the synthesized N-(2-(2-
hydroxyethoxy)ethyl)–N,N-bis(2-(N-(2-(2-hydroxyethoxy)
ethyl) oleamido) ethyl) -4-methylbenzenaminium bromide.
3.2. Polarization Measurements
Potentiodynamic polarization curves for API X70 steel
pipeline in deep oil wells formation water under CO2 and
Paper ID: SUB154153 1037

International Journal of Science and Research (IJSR) ISSN (Online): 2319-7064
Index Copernicus Value (2013): 6.14 | Impact Factor (2013): 4.438
Volume 4 Issue 5, May 2015
www.ijsr.net Licensed Under Creative Commons Attribution CC BY
H2S environments containing various concentrations of
inhibitor III as a representative sample at 250C are shown
in Fig. 3. The corrosion current density values were
estimated accurately by extrapolating both the cathodic
and anodic linear region back to the corrosion potential.
The degree of surface coverage (ɵ) and the inhibition
efficiency (ηp %) were calculated using the following
equations [35] :
ɵ= [1 – (I /i0) ] (2)
ηp % = [1 – (i /i0) ] x 100 (3)
where i0 and i are the corrosion current densities in the
absence and presence of the inhibitor, respectively. The
electrochemical corrosion parameters of corrosion current
densities (Icorr), corrosion potential (Ecorr), cathodic Tafel
slope (bc), anodic Tafel slope (ba) and the inhibition
efficiency (ηp%) as functions of inhibitors concentrations,
are given in Table 2. These parameters could be explained
as follows:
1. Icorr decreased with increasing the concentration of the
three synthesized inhibitors which indicated that these
compounds act as inhibitors, and the degree of
inhibition depends on the concentrations of inhibitor.
2. The presence of the prepared surfactants are slightly
shifted (Ecorr) to negative and positive direction, which
indicates that the synthesized compounds act as a
mixed-type inhibitor [35].
3. bc and ba is slightly changed upon addition of
inhibitors compared to blank, which implies that the
inhibitors molecules are blocked for both cathodic and
anodic sites resulting in an inhibition of the cathodic
and anodic reactions.
4. ηp % of three synthesized inhibitors were calculated
and listed in Table 2, which reveal that the inhibition
efficiency increases with increasing of the inhibitor
concentration up to 500 ppm. The order of inhibition
efficiency decreased as follows: III > II > I.
3.3. Electrochemical Impedance Measurements
In order to gain more information about the corrosion
inhibition phenomena, EIS measurements was carried out
for API X70 steel pipeline in deep oil wells formation
water under CO2 and H2S environments in the presence
and absence of the synthesized surfactants. Figs4, 5 show
a typical set of Nyquist plots and Bode plots of the effect
of the compound III as a representative sample in the
absence and presence of various concentrations at 25 0C.
Bode plots refer to the existence of an equivalent circuit.
The increase of absolute impedance at low frequencies in
Bode plot confirmed the higher protection with the
increasing of inhibitor concentration, which is related to
the adsorption of inhibitor on the carbon steel surface [36].
Various parameters such as the charge transfer resistance
(Rct), double layer capacitance (Cdl) and percentage
inhibition efficiency (ηI %) were calculated according to
the following equations and listed in Table 3 [37] :
Cdl = [ (1/2𝝅fmax.) (1/Rct) ] (4)
ηI % = [1- (Rct / Rct (inh) ] x 100 (5)
where Rct and Rct (inh) are the charge transfer resistance
values in the absence and presence of inhibitor,
respectively. For analysis of the obtained impedance
spectra, the equivalent circuit (EC) was obtained using EIS
analyzer as shown in Fig. 6 where (Cdl) is the double layer
capacitance (Rs) is the solution resistance, (Rf) is the film
resistance and (Cf) is the film capacitance. The obtained
results conform the formation of a good protective film of
the inhibitor molecules on carbon steel surface as indicated
by following:
1. Increasing the value of charge transfer resistance (Rct)
with increasing the concentration of the synthesized
surfactants indicating that the corrosion resistance of
the X70 steel pipeline samples is mainly controlled by
charge-transfer process.
2. Decreasing the value of double layer capacitance (Cdl)
with increasing inhibitor concentration. This is due to
the gradual replacement of water molecules in the
double layer by the adsorbed inhibitor molecules,
hence inhibiting the corrosion rate on carbon steel
surface by adsorption mechanism [38].
3. It was found that the values of film resistance (Rf)
were increased by increasing the inhibitor
concentrations, while (Cf) values were decreased.
4. ηI % of three synthesized inhibitors increased with
increasing inhibitor concentration up to 500 ppm. This
is due to increasing the surface coverage by the
inhibitor.
5. The corrosion inhibition efficiency of three
synthesized inhibitors decreased in the following
sequences: III > II > I.
3.4. Surface Active Properties Measurements
The CMC values of the synthesized surfactants were
determined at 25 0C from the change in the slope of the
plotted data of surface tension (γ) versus the natural
logarithm of the solute molar concentration (-ln C) as
shown in Fig. 7. The critical micelle concentration (CMC)
is the point in concentration at which it becomes
thermodynamically favorable for surfactant molecules in
solution to form aggregates (micelles) in order to minimize
interaction of either their head groups or their tail groups
with the solvent. For the under investigation surfactants
molecules in water, micellization is due to entropic
considerations. Water molecules in close proximity to the
hydrophobic group of the surfactant molecules take on a
certain ordered configuration, which is entropically
unfavorable. Once the surfactant concentration reaches a
certain level (CMC), the hydrophobic tail groups forming
surfactant micelles. Surface tension plots indicate that each
surfactant is molecularly dispersed at low concentration,
leading to a reduction in surface tension until certain
concentration is reached the surfactant molecules form
micelles, which are in equilibrium with the free surfactant
molecules. The CMC values were determined from Fig. 7
and listed in Table 4. It is obvious that the increase in
hydrophobic chain length (present in the three prepared
surfactants) decreases the values of the CMC [39]. The
organic character of the hydrophobic chains in the
surfactant molecules increases the repulsion between these
molecules and the aqueous phase. Also, hydrophobic
Paper ID: SUB154153 1038

International Journal of Science and Research (IJSR) ISSN (Online): 2319-7064
Index Copernicus Value (2013): 6.14 | Impact Factor (2013): 4.438
Volume 4 Issue 5, May 2015
www.ijsr.net Licensed Under Creative Commons Attribution CC BY
moieties on the head group (Isopropyl and Toluene) in
surfactant (II and III) respectively increase the repulsion
between the surfactant molecules and the aqueous phase.
Hence, the increase in repulsion between the surfactant
molecules and the aqueous phase increases the tendency of
the surfactant molecules toward adsorption at the air–water
interface. That causes fast saturation of the interface by the
adsorbed molecules. As a result, it is expected that
increasing the hydrophobic chain length will increase the
adsorption of the molecules at the interface and will also
increase the tendency of the molecules toward
micellization in the bulk of their solutions [40]. The
maximum surface excess concentration (Гmax) in mol/cm2
was calculated from the following relationship [41]:
max = - (1/RT) (dγ/d ln C) (6)
where: T is absolute temperature, R is universal gas
constant (R = 8.314 x 10⁷ ergs mol-1 K-1), and dγ/d InC is
surface activity. The Гmax values in Table 5 were used to
calculate the average minimum area per adsorbed
molecule at the aqueous–air interface at saturated
condition (Amin) using the following relationship [41]:
Amin. = 1016/ (NA. max) (7)
where: NA is “Avogadro’s number = 6.023 x 10²³
molecule/mole”
3. 5. Thermodynamic Parameters of Surface Tension
The ability for micellization processes depends on the
thermodynamic parameter (standard free energy, ∆Gmic.).
Most information on the free energy of micellization has
been obtained indirectly through the CMC [42]. The
∆Gmic. may be calculated by choosing the following
expression equation (8) :
∆Gmic = RT (1-α) ln CMC (8)
where R is the universal gas constant (R =8.314 J/mol. K),
T is the absolute temperature, α is the fraction of counter
ions bound by micelle in case of ionic surfactants (α=0 for
nonionic surfactants) and CMC is the critical micelle
concentration in mol/L. Many investigations deal with the
thermodynamics of surfactant adsorption at the interface
[43]. The thermodynamic parameters value of adsorption
∆Gads were calculated via the following equation (9):
∆Gads = ∆Gmic - 0.6023 ΠCMC Amin (9)
The free energy of micellization in Table 4 indicates that
the micellization process is spontaneous (∆Gmic< 0). The
data show also that, the negativity of ∆Gmic for surfactants
increased as follows (III < II < I) and this may be due to
the effect of hydrophobic moieties on the head group. This
behavior indicates that increasing the oxyethylene chain
length favors the micellization process. From the data
obtained, it was found that all ∆Gads values are negative
and they are more negative than ∆Gmic values. This
indicates that, the adsorption at the interface is associated
with a decrease in the free energy of the system i. e. the
adsorption process is more spontaneous. Also, this
indicates that, the studied surfactants favor adsorption than
micellization.
3. 6. Adsorption Isotherm
The adsorption of inhibitor molecules on metal surface is a
substitute process, in which the water molecules adsorbed
on the metal surface are replaced by inhibitor molecules.
In order to get a better understanding for the adsorption
mechanism, the Langmuir adsorption isotherm equation
was employed [44]:
Cinh/θ = 1/Kads. + Cinh (10)
Where ɵ is the surface coverage, which can be calculated
from the Polarization measurements, Cinh is the molar
concentration of the inhibitor and Kads is the standard
adsorption equilibrium constant for the
adsorption/desorption process. The plots of Cinh/ɵ versus
Cinh yielded a straight line with a slope near1 at 25 0C as
shown in Fig. 8. From the intercepts of the straight lines
on the Cinh/ɵ -axis, one can calculate Kads. This isotherm
clearly revealed that the adsorption of the synthesized
surfactants on the X70 steel pipeline surface obeyed the
Langmuir adsorption isotherm and the inhibitor molecules
are adsorbed on X70 steel pipeline surface forming a film,
which prevents the X70 steel pipeline from corrosion
induced by the medium. The values of Kads are given in
Table 5 and indicated that the synthesized inhibitors
possess strong adsorption ability onto the X70 steel
pipeline surface. The standard adsorption equilibrium
constant (Kads) are related to the standard free energy of
adsorption, ∆G0ads, as given by Eq. (11) [45]:
ΔG0ads = -RTln (55.5 Kads) (11)
The calculated free energy of adsorption (∆G0ads) is given
in Table 5. The negative values of ∆G0ads indicated that
the adsorption of the inhibitors on the metal surface is
spontaneous. Generally, values of ∆G0adsaround -20 kJ
mol-1 or lower are consistent with the electrostatic
interaction between charged molecules and the charged
metal surface (physisorption) [46] ; those around -40 kJ
mol-1 or higher involve charge sharing or transfer from
organic molecules to the metal surface to form a
coordinate type of metal bond (chemisorption) [44]. It can
be seen from Table 5 that, calculated ∆G0adsvalues
indicated that the adsorption mechanism of the prepared
surfactants on carbon steel in the deep oil well formation
water is (physical adsorption). The large values of
∆G0adsand its negative sign are usually characteristic of
strong interaction and a highly efficient adsorption.
3. 7. Scanning Electron Microscopy (SEM)
Fig. 9a shows SEM image of polished carbon steel
surface. The micrograph shows a characteristic inclusion,
which was probably an oxide inclusion [47]. Fig. 9b
shows SEM of the surface of carbon steel specimen after
immersion in formation water for three days in absence of
inhibitor, while Fig. 9c shows SEM of the surface of
another carbon steel specimen after immersion in
formation water for the same time interval in the presence
of 500 ppm of the inhibitor (III). The resulting scanning
Paper ID: SUB154153 1039

International Journal of Science and Research (IJSR) ISSN (Online): 2319-7064
Index Copernicus Value (2013): 6.14 | Impact Factor (2013): 4.438
Volume 4 Issue 5, May 2015
www.ijsr.net Licensed Under Creative Commons Attribution CC BY
electron micrographs reveal that, the surface was strongly
damaged in the absence of the inhibitor, but in the
presence of 500 ppm of the inhibitor (III), there is less
damage in the surface. This confirms the observed high
inhibition efficiency of the inhibitor (III) at this
concentration.
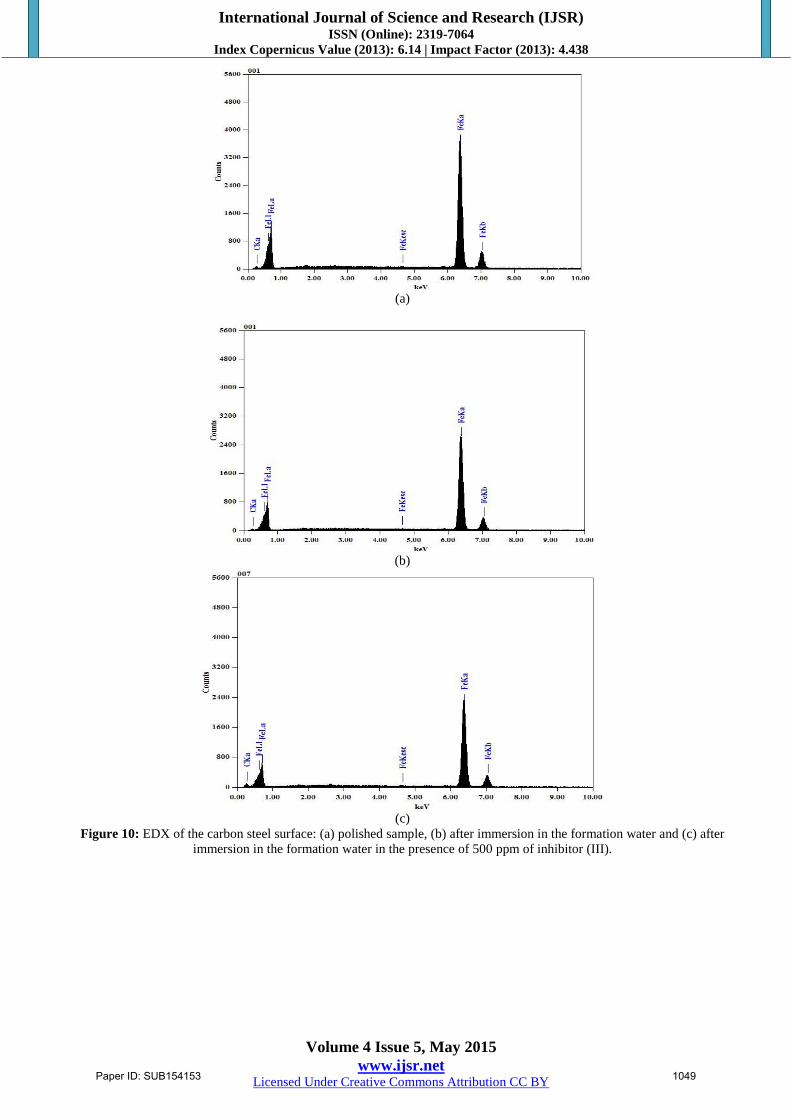
3. 8. Energy Dispersive Analysis of X-rays (EDX)
The EDX spectrum in Fig. 10a shows the characteristic
peaks of some of the elements constituting the polished
carbon steel surface. The spectrum of the polished carbon
steel surface after immersion in the formation water in the
absence and presence of inhibitor (III) for three days is
shown in Figs. 10b and 10c respectively. The spectrum of
Fig. 10c shows that the Fe peak is considerably decreased
relative to the samples in Figs. 10a and 10b. This
decreasing of the Fe band is indicated that strongly
adherent protective film of inhibitor (III) formed on the
polished carbon steel surface, which leads to a high degree
of inhibition efficiency [48]. Therefore, the EDX and SEM
examinations of the carbon steel surface support the results
obtained from the chemical and electrochemical methods
that the synthesized surfactant inhibitors are a good
inhibitor for the carbon steel in the oil wells formation
water.
3. 9. Quantum Chemical Calculations
The effectiveness of an inhibitor can be related to its
spatial molecular structure, as well as with their molecular
electronic structure [49]. Also there are certain quantum
chemical parameters that can be related to the interactions
of metal-inhibitor. Among these, we can mention the
energy of the HOMO, which is often associated with the
capacity of a molecule to donate electrons. Therefore, an
increase in the values of EHOMO can facilitate the
adsorption and therefore the inhibition efficiency, by
indicating the disposition of the molecule to donate orbital
electrons to an appropriate acceptor with empty molecular
orbitals. In the same way, low values of the energy gap ∆E
= ELUMO-EHOMO will render good inhibition efficiencies,
because the energy needed to remove an electron from the
last occupied orbital will be low [50]. Similarly, low
values of the dipole moment µ will favor the accumulation
of inhibitor molecules on the metallic surface [51].
Geometric structures and electronic properties of (I, II and
III) used as corrosion inhibitors were calculated by ab
initio method with 3-21G** basis set. The quantum
chemical parameters such as the energy of the highest
occupied molecular orbital (EHOMO, eV), the energy of the
lowest unoccupied molecular orbital (ELUMO, eV), the
energy gap (∆E=ELUMO-EHOMO, eV), the dipole moment (µ,
Debye), logP (lipophilicity) and the number of transferred
electrons (∆N) were calculated and listed in Table 6, and
the fully optimized minimum energy geometrical
configuration of the inhibitors is shown in Fig. 11. The
linear correlation between EHOMO energy level and the
corrosion inhibition efficiency of the inhibitors proved
that, the higher the HOMO energy of the inhibitor (less
negative values), the greater the trend of offering electrons
to the unoccupied d orbital of the metal and the higher the
corrosion inhibition efficiency for steel X70in deep oil
wells formation water under CO2 and H2S environments.
In addition, the lower the LUMO energy, the easier the
acceptance of electrons from the metal surface. In other
words, the inhibition efficiency increases if the compound
can donate electrons from its HOMO to the LUMO of the
metal, whereby chelation on the metal surface occurs.
Also, as the energy gap (∆E) decreases, the efficiency of
the inhibitor is improved. The order of increasing the
values of EHOMO and decreasing the values of ELUMO and
the energy gap (∆E) with increasing the inhibition
efficiency of I, II and III. From Fig. 11, it is clear that, for
I and II the geometric structure of these inhibitors is tri
angle look like structure which make good I. E. It can be
observed that for III (built on aromatic alkyl halide) the
benzene ring, has larger electric density coming from the
pz orbital of П bond. Low values of the dipole moment
will favor the accumulation of inhibitor molecules on the
metallic surface thus increasing the inhibition
effectiveness [51]. The lowest value of dipole moment was
obtained by I (3.45), II (8.052) and III (8.058). According
to Lukovits’s study [52], if the value of ∆N < 3.6, the
inhibition efficiency increased with increasing electron
donating ability of inhibitor at the metal surface. The
values of (∆N) showed in Table 6 represent the number of
electronic charges that will be exchanged between the
surface and the adsorbed species.
4. Conclusion
The conclusion of this work can be stated in the following
points:
1. Three surfactants based on N, N'- (azanediylbis
(ethane-2, 1-diyl)) dioleamide which named (I, II, and
III) were synthesized and purified. The chemical
structure of these compounds was confirmed by 1H
NMR and FT-IR, and their surface properties were
determined.
2. The prepared surfactants were examined as corrosion
inhibitors. From all measurements performed, the
prepared surfactants are good inhibitors for the
corrosion of carbon steel in formation water. High
inhibition efficiencies are observed around their
CMCs, and the inhibition efficiency increases with
increasing of inhibitor concentrations up to 500 ppm.
The order of inhibition efficiency decreased as follows
III > II > I.
3. Aromatic alkyl halide is the optimum to get the
quaternary ammonium salts and have good inhibition
efficiency.
4. The potentiodynamic polarization curves indicated
that the inhibitors inhibit both anodic metal
dissolution and cathodic hydrogen evolution reactions
and acted as mixed type inhibitors in the test solution.
5. The adsorption of the inhibitor molecules on the metal
surface from the test solution obeys Langmuir’s
adsorption isotherm. The adsorption process is
spontaneous and act as physical adsorption.
Paper ID: SUB154153 1040

International Journal of Science and Research (IJSR) ISSN (Online): 2319-7064
Index Copernicus Value (2013): 6.14 | Impact Factor (2013): 4.438
Volume 4 Issue 5, May 2015
www.ijsr.net Licensed Under Creative Commons Attribution CC BY
References
[1] G. Trabanelli, Corrosion 47 (1991) 410.
[2] M. A. Hegazy, M. Abdallah, H. Ahmed, Corrosion
Science 52 (2010) 2897.
[3] A. Hernández-Espejel, M. A. Domínguez-Crespo, R.
Cabrera-Sierra, C. Rodríguez-Meneses, E. M. Arce-
Estrada, Corrosion Science 52 (2010) 2258.
[4] DemetOzkır, KadriyeKayakırılmaz, EmelBayol, A.
Ali Gurten, FatmaKandemirli, Corrosion Science 56
(2012) 143.
[5] S. Safak, B. Duran, A. Yurt, G. Turkoglu, Corrosion
Science 54 (2012) 251.
[6] A. M. Al-Sabagh, N. Gh. Kandile, N. M. Nasser, M.
R. Mishrif, Amira E. El-Tabey, Egyptian Journal of
Petroleum 22 (2013) 351.
[7] Ahmed A. Farag, M. R. Noor El-Din, Corrosion
Science 64 (2012) 174.
[8] S. M. Shaban, A. Saied, S. M. Tawfik, A. Abd-Elaal,
I. Aiad, Journal of Industrial and Engineering
Chemistry 19 (2013) 2004.
[9] M. A. Migahed, M. M. Attya, S. M. Rashwan, M. Abd
El-Raouf, A. M. Al-Sabagh, Egyptian Journal of
Petroleum 22 (2013) 149.
[10] E. E. Ebenso, P. C. Okafor, U. J. Ekpe, Anti-
Corrosion Method M 37 (2003) 381.
[11] G. Bereket, A. Pinarbasi, C. Ogretir, Anti-Corrosion
Method M 51 (2004) 282.
[12] M. A. Migahed, A. M. Al-Sabagh, E. G. Zaki, H. A.
Mostafa and A. S. Fouda. Elixir Corrosion & Dye 77
(2014) 28958.
[13] A. Popova, M. Christov, S. Raicheva, E. Sokolova,
CorrosionScience 46 (2004) 1333.
[14] D. Zhang, Zh. An, Q. Pan, L. Gao, G. Zhou,
Corrosion Science 48 (2006) 1437.
[15] M. A. Migahed, Progress in Organic Coatings54
(2005) 91.
[16] J. W. Graves, E. H. Sullivan, Material Protection 5
(1996) 33.
[17] N. Muthukumar, S. Maruthamuthu, N. Palaniswamy,
Colloids andSurfaces B: Biointerfaces 53 (2006) 260.
[18] X. Jiang, Y. G. Zheng, W. Ke, Corrosion Science 47
(2005) 2636.
[19] F. G. Liua, M. Du, J. Zhanga, M. Qiua, Corrosion
Science 51 (2009) 102.
[20] D. Hardie, E. A. Charles, A. H. Lopez, Corrosion
Science 48 (2006) 4378.
[21] Y. F. Cheng, International Journal of Hydrogen
Energy 32 (2007) 1269.
[22] B. Brown, S. R. Parakala, S. Nesic, NACE
International Corrosion Conference and Expo, 2004.
[23] D. W. Shoesmith, P. Taylor, M. G. Bailey, D. G.
Owen, Journal of ElectrochemicalSociety 127 (1980)
1007.
[24] I. B. Obot, S. A. Umoren, N. O. Obi-Egbedi, Journal
of Material and Environmental Science2 (2011) 60.
[25] A. A. Farag, M. R. Noor El-Din. Corrosion Science
64 (2012) 174.
[26] M. Motamedi, A. R. Tehrani-Bagha, M. Mahdavian.
Corrosion Science 70 (2013) 46.
[27] M. M. Osman, A. M. A. Omar, A. M. Sabagh,
Material Chemistry and Physics 50 (1997) 271.
[28] A. M. Al-Sabagh, N. Gh. Kandil, O. Ramadan, N. M.
Amer, R. Mansour, E. A. Khamis Egyptian Journal of
Petroleum 20 (2011) 47.
[29] G. Bereket, E. Hur, C. Og˘retir, Journal of Molecular
Structure578 (2002) 79.
[30] W. Yinqiu, P. R. Herrington, JAOCS 74 (1997) 1.
[31] Y. Ohshiro, M. Ochiai, and S. Komori, Journal of
Electrochemical Society 64 (1961) 114.
[32] A. M. Al-Sabagh, M. A. Migahed and H. S. Awad,
Corrosion Science 48 (2006) 813.
[33] R. G. Andrew, M. M. Michael, M. P. Rama, Journal
of Dispersion Science and Technology 27 (2006) 731.
[34] M. A. Migahed, H. M. Mohamed, A. M. Al-Sabagh,
Material Chemistry and Physics 80 (2003) 169.
[35] C. Cao, Corrosion Science 38 (1996) 2073.
[36] M. A. Hegazy, Ali M. Hasan, M. M. Emara, Mostafa
F. Bakr, Ahmed H. Youssef, Corrosion Science 65
(2012) 67.
[37] K. F. Khaled, Applied Surface Science 252 (2006)
4120.
[38] M. A. Migahed, M. M. Attya, M. Abd El-raouf, E.
Khamis, T. A. Ali and A. M. Al-Sabagh, International
Journal of Electrochemical Science 10 (2015) 1343.
[39] R. Oda, I. Hucb, J. Sauveur, Chemical Communi-
cations 56 (1997) 2105.
[40] N. A. Negm, Journal of Surfactants and Detergent 10
(2007) 87.
[41] S. M. Hamid and D. C. Sherrington, Journal of British
Polymer 16 (1984) 39.
[42] M. J. Rosen, Surfactants and Interfacial Phenomena,
John Wileyand Son Inc. , New York, 2004.
[43] A. M. Al-Sabagh, D. R. K. Harding, N. G. Kandile, A.
M. Badawi, A. E. El-Tabey, Journal of Dispersion
Science and Technology 30 (2009) 472.
[44] A. Doner, R. Solmaz, M. Ozcan, G. Kardas, Corrosion
Science 53 (2011) 2902.
[45] G. E. Badr, Corrosion Science 51 (2009) 2529.
[46] B. G. Ateya, B. E. El-Anadouli, F. M. A. El-Nizamy,
Corrosion Science24 (1984) 497.
[47] ASTM E 45-87, vol. 11, ASTM, Philadelphia, PA,
(1980) 125.
[48] M. A. Amin, Journal of Applied Electrochemistry 36
(2006) 215.
[49] H. Ashassi-Sorkhabi, B. Shaabani, D. Seifzadeh,
ElectrochemicaActa 50 (2005) 3446.
[50] N. Khalil, ElectrochimicaActa 48 (2003) 2635.
[51] P. Molymeux, C. T. Rhodes, J. Swarbrick, Trans.
Faraday Soc. 61 (1965) 1043.
[52] I. Ahamad, R. Prasad, M. A. Quraishi, Corrosion
Science 52 (2010) 933.
Paper ID: SUB154153 1041

International Journal of Science and Research (IJSR) ISSN (Online): 2319-7064
Index Copernicus Value (2013): 6.14 | Impact Factor (2013): 4.438
Volume 4 Issue 5, May 2015
www.ijsr.net Licensed Under Creative Commons Attribution CC BY
List of Tables
Table 1: Physical properties and chemical composition of deep oil well formation water used in this investigation.
Property Unit Value
Density g/cm3 1.206
Salinity as NaCl ppm 303567
Resistivity Ω. m 0.017
PH 6.380000
Ionic species Value (ppm)
Sulfate 600
Chloride 183980
Sodium 43760
Iron 683
Strontium 94
Calcium 57720
Magnesium 12
Barium 7
Lead 372
Potassium 10930
Zinc 374
Table 2: Data obtained from potentiodynamic polarization measurements of carbon steel X70 immersed in deep oil well
formation water in the absence and presence of various concentrations of the inhibitors (I, II and III) at 298K
ηP
(%) ɵ
RP
(KΩcm2)
ba
(mV)
bc
(mV)
Icorr,
(µAcm2)
Ecorr
(mV)
Conc.
(ppm) Inhibitor
- - 0.26 105.1 -169.1 223 -602.2 - blank
57.6 0.576 0.62 182.2 -251.2 94.6 -645.5 100
Inhibitor I
63 0.63 0.52 166.6 -179.2 71.9 -652.3 200
69.4 0.694 0.77 190.5 -242 68.3 -668.3 300
73.3 0.733 0.52 152.8 -148.5 59.5 -643.2 400
77.9 0.779 0.7 163.2 -161.5 49.2 -665 500
59 0.59 0.42 137.8 -159.6 91.4 -656.3 100
Inhibitor II
65.2 0.652 0.59 200.4 -194.8 72.7 -651.3 200
70.2 0.702 0.66 169.7 -194.7 66.4 -663.8 300
73.4 0.734 0.9 155.2 -244.4 59.3 -664.9 400
78.4 0.784 0.64 114.5 -167.8 48.2 -719.5 500
59.3 0.593 0.57 175.8 -224.6 90.7 -657.7 100
Inhibitor III
67.4 0.674 0.51 173 -160.6 77.7 -656.1 200
71 0.71 0.66 155 -181.8 64.7 -663.2 300
73.4 0.734 0.61 139.8 -161 59.3 -707.6 400
78.9 0.789 0.6 127.4 -138 47 -678. 4 500
Paper ID: SUB154153 1042

International Journal of Science and Research (IJSR) ISSN (Online): 2319-7064
Index Copernicus Value (2013): 6.14 | Impact Factor (2013): 4.438
Volume 4 Issue 5, May 2015
www.ijsr.net Licensed Under Creative Commons Attribution CC BY
Table 3: Data obtained from electrochemical impedance spectroscopy (EIS) measurements of carbon steel in the test solution
in the absence and presence of various concentrations of the inhibitors (I, II and III) at 298K.
ηI
(%)
Rct
(Ω cm2) n
Cdl x10-4
(µFcm-2)
Rf
(Ω cm2) n
Cf x10-5
(µFcm-2)
Rs
(Ω cm2)
Conc.
(ppm) Inhibitor
- 166.4 0.8 16.41 13.17 0.8 2.4 3.9 - blank
50.32 334.94 0.61 14.01 21.36 0.94 3.76 4.33 100
Inhibitor I
54.67 367.12 0.57 13.69 22.60 0.91 4.72 4.98 200
58.86 404.46 0.63 13.12 36.09 0.73 17.2 5.96 300
62.53 444.08 0.82 12 41.75 0.83 20.8 6.42 400
72.11 596.58 1.15 10.8 5.47 0.42 17.9 7.82 500
50.5 336.18 0.58 23 2.02 0.86 6.61 4.39 100
Inhibitor II
54.68 367.20 0.55 21.76 18.05 0.92 4.19 4.58 200
58.94 405.23 0.61 16.67 29.20 0.82 5.21 5.94 300
63.67 458.06 0.37 14.6 4.19 1.18 1.24 5.77 400
72.42 603.29 0.58 13 35.44 0.78 10.7 6.19 500
50.55 336.50 0.60 24.82 21.99 0.88 5.27 6.85 100
Inhibitor III
54.76 367.78 0.48 17.44 17.19 0.89 3.36 4.58 200
59.53 411.12 0.59 15.66 28.42 0.88 6.27 5.38 300
64.83 473.12 0.48 13.55 6.67 1.09 2.31 4.63 400
73.66 631.64 1.07 11.8 2.24 0.32 51.36 7.26 500
Table 4: Surface active properties of the investigated surfactants at 298K.
Inhibitors CMCx10-4
(mol L-1)
CMC
(mNm-1)
CMC
(mNm-1) Max x1010
(mol cm-2)
Amin
(A0 2)
∆Gmic.
(kJ mol-1)
∆Gads.
(kJ mol-1)
I 2 39. 3 33 1. 70 97. 7 -21. 1 -23. 05
II 2. 1 37. 67 34. 63 1. 70 97. 7 -20. 98 -23. 02
III 1. 9 37 35. 3 1. 70 97. 9 -21. 23 -23. 31
Table 5: Adsorption parameter of three inhibitors on carbon steel in test solution at 298K.
Inhibitors R2 Kads. x104
(M-1)
∆Gads.
(KJ mol-1)
I 0. 995 4. 07 -14. 9
II 0. 996 4. 69 -15. 0
III 0. 996 5. 38 -15. 2
Table 6: Calculated quantum chemical parameters of studied inhibitors.
Inhibitors EHOMO
(eV)
ELUMO
(eV)
ΔE
(eV)
µ
(debye) LogP
The number of transferred
electrons, ΔN
I -8. 00 0. 788 8. 788 3. 45 8. 34 0. 386
II -9. 741 0. 217 9. 958 8. 052 10. 09 0. 224
III -2. 238 0. 203 2. 441 8. 058 11. 46 0. 213
*The theoretical values of absolute electro negativity of iron (XFe), the absolute hardness of iron (ηFe) and the electronic
chemical potential of iron (µFe) are 7, 0 and -7 eV/mol, respectively.
Paper ID: SUB154153 1043

International Journal of Science and Research (IJSR) ISSN (Online): 2319-7064
Index Copernicus Value (2013): 6.14 | Impact Factor (2013): 4.438
Volume 4 Issue 5, May 2015
www.ijsr.net Licensed Under Creative Commons Attribution CC BY
List of Figures
Figure 1: FTIR spectrum of inhibitor (III).
Figure 2: 1H NMR spectrum of inhibitor (III).
Paper ID: SUB154153 1044

International Journal of Science and Research (IJSR) ISSN (Online): 2319-7064
Index Copernicus Value (2013): 6.14 | Impact Factor (2013): 4.438
Volume 4 Issue 5, May 2015
www.ijsr.net Licensed Under Creative Commons Attribution CC BY
P o te n t ia l (m V v s . S C E )
-9 0 0 -8 0 0 -7 0 0 -6 0 0 -5 0 0 -4 0 0 -3 0 0
Lo
g I
(m
A/c
m2
)
- 4
-3
-2
-1
0
1
2
B la n k
1 0 0 p pm
2 0 0 p pm
3 0 0 p pm
4 0 0 p pm
5 0 0 p pm
Figure 3: Potentiodynamic polarization curves (E – log I relationship) of carbon steel in the test solution in the absence and
presence of different concentrations of inhibitor (III) at 298K.
Figure 4: Nyquist plots for carbon steel in the test solution in the absence and presence of different concentrations of
inhibitors (III).
Paper ID: SUB154153 1045

International Journal of Science and Research (IJSR) ISSN (Online): 2319-7064
Index Copernicus Value (2013): 6.14 | Impact Factor (2013): 4.438
Volume 4 Issue 5, May 2015
www.ijsr.net Licensed Under Creative Commons Attribution CC BY
Figure 5: Bode plots for the carbon steel in the test solution in the absence and presence of various concentrations
of inhibitor (III).
Figure 6: Equivalent circuit used to model impedance data of carbon steel in oil well formation water under CO2
and H2S environments.
-50
-40
-30
-20
-10
0
10
200
0.5
1
1.5
2
2.5
3
-2 -1 0 1 2 3 4 5 6
Ph
ase
[d
egre
e]
log Z
[K
oh
m.c
m²]
log Frequency [Hz]
Blank 100 ppm 200 ppm
300 ppm 400 ppm 500 ppm
Paper ID: SUB154153 1046

International Journal of Science and Research (IJSR) ISSN (Online): 2319-7064
Index Copernicus Value (2013): 6.14 | Impact Factor (2013): 4.438
Volume 4 Issue 5, May 2015
www.ijsr.net Licensed Under Creative Commons Attribution CC BY
Figure 7: Surface tension (γ) vs. log C at different concentrations of the inhibitor (I, II and III) at 298K.
Figure 8: Langmuir isotherms for the adsorption of the prepared surfactants on carbon steel surface in test
solution at 298K.
30
35
40
45
50
55
60
65
70
46810121416
III II I
-ln C , (mole/L)
Su
rfa
cete
nsi
on
, γ
(mN
/m)
CMC
Slope = 1.1647
R² = 0.9948
Slope = 1.1747
R² = 0.9955
Slope = 1.1784
R² = 0.9958
0
5
10
15
20
25
0 5 10 15 20
-I
-II
-III
Cin
h/ɵ
x1
0-5
Cinh(M) x10-5
Paper ID: SUB154153 1047

International Journal of Science and Research (IJSR) ISSN (Online): 2319-7064
Index Copernicus Value (2013): 6.14 | Impact Factor (2013): 4.438
Volume 4 Issue 5, May 2015
www.ijsr.net Licensed Under Creative Commons Attribution CC BY
(a)
(b)
(c)
Figure 9: SEM of the carbon steel surface: (a) polished sample, (b) after immersion in the formation water and (c) after
immersion in the formation water in the presence of 500 ppm of compound III.
Paper ID: SUB154153 1048
International Journal of Science and Research (IJSR) ISSN (Online): 2319-7064
Index Copernicus Value (2013): 6.14 | Impact Factor (2013): 4.438
Volume 4 Issue 5, May 2015
www.ijsr.net Licensed Under Creative Commons Attribution CC BY
(a)
(b)
(c)
Figure 10: EDX of the carbon steel surface: (a) polished sample, (b) after immersion in the formation water and (c) after
immersion in the formation water in the presence of 500 ppm of inhibitor (III).
Paper ID: SUB154153 1049

International Journal of Science and Research (IJSR) ISSN (Online): 2319-7064
Index Copernicus Value (2013): 6.14 | Impact Factor (2013): 4.438
Volume 4 Issue 5, May 2015
www.ijsr.net Licensed Under Creative Commons Attribution CC BY
Figure 10: Molecular structure and HOMO–LUMO of compounds I, II and III.
Paper ID: SUB154153 1050