synthesis quality report adult education survey 4 list of figures page figure 3-1 average amount...
TRANSCRIPT

EUROPEAN COMMISSION EUROSTAT Directorate F: Social Statistics and Information Society Unit F-4: Education, science and culture statistics
Synthesis Quality Report
Adult Education Survey
December 2010

2 2
Table of contents Page
1 Introduction ................................................................................................................................5
2 Policy framework of the AES .................................................................................................6
3 Quality assessment of the pilot AES ................................................................................. 10
3.1 Relevance.............................................................................................................................................. 10
3.2 Accuracy................................................................................................................................................ 11
3.2.1 Sampling Errors...................................................................................................................... 12
3.2.2 Non-Sampling Errors............................................................................................................ 17
3.3 Timeliness and Punctuality ........................................................................................................... 26
3.4 Accessibility and Clarity.................................................................................................................. 27
3.5 Comparability and Coherence ...................................................................................................... 27
3.5.1 Comparability / Deviations from the AES recommendations .............................. 27
3.5.2 Coherence ................................................................................................................................. 28
3.6 Overall Assessment........................................................................................................................... 36
4 Implementation and cross country comparability in the pilot AES...................... 37
5 Recommendations for the next AES................................................................................. 43

3 3
List of tables Page
Table 3-1. Users of AES data..................................................................................................................... 11
Table 3-2. Confidence Intervals1 for participation in the three types of learning in the
pilot AES................................................................................................................................................... 12
Table 3-3. Average amount paid for all expenses related to all formal / non-formal
education activities – Estimates and Coefficients of Variation........................................... 14
Table 3-4. Average number of hours spent in all formal / non-formal education activities
- Estimates and Coefficients of Variation .................................................................................... 15
Table 3-5. Sampling frames in the pilot AES...................................................................................... 17
Table 3-6. Gross sample, non-eligible and eligible elements in the sampling frame ......... 19
Table 3-7. Problematic modules and/or questions in the AES................................................... 21
Table 3-8. Timeline of the pilot AES...................................................................................................... 26
Table 9. Participation in formal/regular education for age group 25-34 by data source
(as a % of the population aged 25-34). ........................................................................................ 29
Table 10. Participation in non-formal education and training by type of survey (as a % of
the population aged 25-64). ............................................................................................................. 30
Table 11. Participation in non formal education and training by type of activity (as a % of
the population participating in non-formal learning activity, age 25-64), AES-2007.32
Table 12. Participation in non-formal education and training by type of guided on the job
training, as a % of the population participating in non-formal learning activity, age
25-64, AES-2006. .................................................................................................................................. 33
Table 13. Participation in non formal education and training by data source as a % of the
population aged 25-64. ...................................................................................................................... 34
Table 5-1. Target population in the pilot AES (number of individuals).................................. 49
Table 5-2. Non-response and types of non-response in the pilot AES..................................... 50

4 4
List of figures Page
Figure 3-1 Average amount paid for all expenses related to all formal / non-formal
education activities - Coefficients of variation.......................................................................... 15
Figure 3-2 Average number of hours spent in all formal / non-formal education activities
- Coefficients of Variation.................................................................................................................. 16
Figure 3-3. Eligibility fractions (%)....................................................................................................... 18
Figure 3-4. Response rates in the pilot AES ....................................................................................... 25
Figure 4-1. Participation rate in formal and non-formal education and training, 2007... 38
Figure 4-2. Share of job-related activities in non-formal education and training,
respondents from 25 to 34 years, 35 to 54 years and 55 to 64 years (%), 2007........ 39
Figure 4-3. Reasons for participation in non-formal education and training (%), 2007 . 40
Figure 4-4. Non-participation rate in education and training by sex (%), 2007 ................. 41
Figure 4-5. Type of obstacles in participation for respondents who did not participate
but wanted to (%), 2007.................................................................................................................... 42

5 5
1 Introduction
The present document is a synthesis report on the evaluation of the first Adult
Education Survey (AES). It provides valuable information on the implementation of the
survey at national level and presents an assessment of the data quality.
The AES was carried out in the period 2005 – 2008 in almost all EU Member States,
except for Ireland and Luxembourg, and also in Norway, Switzerland and the two EU
Candidate countries (Croatia and Turkey). At European level, it was the first
implementation of the survey while some countries had again carried out the survey in
the past at national level. A model questionnaire and a classification of activities were
proposed in order to facilitate the implementation of the survey and ensure the
production of qualitative statistics. Additionally, the data validation was made using
standardised tools and a standard template was used for the quality reporting at
national level.
The report is organised in four chapters. Following the Introduction, Chapter 2 presents
the policy background information on which the planning and design of the AES was
based. Chapter 3 presents the quality assessment of the pilot AES in terms of the five ESS
quality dimensions. In the assessment of coherence we also include a comparison study
with the LFS ad-hoc module on Life Long Learning, carried out in 2003. This study was
prepared by Eurostat and it is incorporated here to complement the quality assessment
of the AES. Chapter 4 summarises the problems encountered in the implementation of
the pilot AES and provides data comparisons for certain AES variables. Finally, Chapter 5
presents the recommendations for the next round of the AES.

6 6
2 Policy framework of the AES
Lifelong learning holds a high profile in the Lisbon strategy and more precisely in the
“Education and Training 2010” work programme. The following phrases are associated
with this programme:
“In a knowledge society individuals must update and complement their knowledge,
competencies and skills throughout life to maximise their personal development and to
maintain and improve their position in the labour market.”
“By 2010, the European Union average level of participation in Lifelong Learning, should
be at least 12.5% of the adult working age population (25-64 age group).”
Since 2000, the European Commission and the European Council has produced a series
of policy documents related to ‘Lifelong Learning’. Among these documents the most
important was the European Commission Communication "Making a European area of
lifelong learning a reality" released in November 2001. This Communication stressed the
importance of lifelong learning for satisfying the following objectives:
o personal fulfillment
o active citizenship
o social inclusion
o employability/adaptability.
Additionally, the Commission staff working paper complementing the Communication,
entitled "Lifelong Learning Practice and Indicators" (SEC(2001)1939, 28.11.2001)
proposed the Adult Education Survey as a source that would improve the information or
fill information gaps for fulfilling the above broad objectives.
In June 2003, the Task Force on Adult Education Survey prepared a paper whose
purpose was to define the policy framework and the related information needs of the
Adult Education Survey. Its structure is based on the Commission Communication on
lifelong learning, putting the learner in the centre of the learning process and proposed
the following priorities for action:
(1) Valuing learning: it refers to the process of recognising participation in and
outcomes of (formal, non-formal or informal) learning so as to raise awareness of
its intrinsic worth and to reward learning. Focus is on the identification,
assessment and recognition of non-formal and informal learning as well as on the
transfer and mutual recognition of formal certificates and diplomas.
(2) Information, guidance and counseling: by means of facilitating access to learning
through the availability of quality guidance services.
(3) Investing time and money in learning: by means of ensuring sufficient investment
in education and training. This can be achieved by continuing public funding for
the adult and higher education sectors along with an increasing private
investment.

7 7
(4) Bringing learning and learners closer together: this can be achieved by developing
learning communities, cities and regions, local learning centres and enabling
workplaces to become learning organisations.
(5) Basic skills: improving basic skills (reading, writing and mathematics, IT and
language skills, as well as social skills) will allow people and especially the early-
school leavers to engage in further learning as a basis for personal fulfilment,
active citizenship and employability.
(6) Innovative pedagogy: addresses the shift in emphasis from knowledge acquisition
to competence development and the new roles for teachers and learners that this
implies.
Policy needs for statistical information about adult education This section refers to the policy requests/user needs in the area of adult education (AE).
The outcome is a list of policy relevant indicators that can be obtained from the
individual through a dedicated, harmonised, household-based lifelong learning survey
such as the Adult Education Survey.
In the specific paragraph on indicators the Commission Communication stresses:
“Comparable information and statistical measures are essential to the development and
implementation of coherent and comprehensive lifelong learning strategies. Statistics and
indicators already form an essential part of existing initiatives in the field of lifelong
learning with a view to monitoring progress both in achieving identified targets and in
implementing policy objectives”,
and that:
“The development of a limited number of new indicators will be based on the learner-
centred approach in relation to formal, non-formal and informal learning. In particular,
this work will aim to fill the gaps on several aspects of lifelong learning, by proposing
quantitative information collections directly from learners. It will also promote the
development of qualitative information sources, in particular in the fields of assessment
and recognition; information, guidance and counseling; and training of teachers and
trainers. This work will complement the development of indicators on lifelong learning
related to employability, adaptability and social inclusion, in the context of the European
Employment Strategy and the European Social Agenda”.
Adult Education (AE) policy indicators
A survey on AE may provide information on various indicators that could be used to
develop relevant policies. We present below a list of indicators grouped under each of
the six priority areas for action:
• Valuing learning: The relevant needs for statistical information about AE are
related to respondent’s participation in formal and non-formal learning activities, the
recognition of learning, his attitude towards learning as well as obstacles in
participation. An indicative list of the following indicators can be obtained:

8 8
Participation in formal/non-formal learning activities by provider and field of
learning, by training setting (during and outside working hours), by reasons for
participation (job-related, non-job related)
Courses started and successfully completed by field, reasons for dropping out,
certification of education and training by type of learning, opinion on usefulness of
learning
Benefits of learning
Obstacles in participation (reasons for non participation)
• Information, guidance and counseling: The needs for statistical information about
AE are related to respondent’s awareness of learning provision, sources of
information, benefits from counseling and guidance and level of satisfaction with
guidance offered. An indicative list of indicators can be the following:
Source of information and guidance (learning centres, governmental, employer etc)
by frequency of use, by benefits obtained and by level of satisfaction
Reason for using guidance/counseling services
• Investing time and money in learning: The relevant needs for statistical
information are related to volume and intensity in different types of learning (formal,
non-formal, informal), financing of learning, time spent in education and training,
outcomes of learning as well as participation in learning in another country. An
indicative list of indicators is the following:
Volume of participation (time spent in learning) by type of learning activity (formal,
non-formal and informal learning), by time of training (during working time, during
leisure time)
Source of financing (learner, government, employer etc)
Outcomes of learning by type of learners (participants and non-participants)
Participation in cultural/social activities by type of activity, by subject area, by
volume of activity, by type of provider
Participation in learning in another country by country involved, by outcomes (level
of satisfaction, number of foreign certificates obtained)
• Bringing learning and learners closer together: the relevant needs for statistical
information are related to respondent’s access to education and training, citizenship,
equal opportunities, social cohesion and self fulfillment as well as level of satisfaction
on the quality of provisions and of educators. An indicative list of indicators would be
the following:

9 9
Access to information about learning possibilities by knowledge of learning
possibilities, by provision of financial support, by time of training (during working or
leisure hours)
Access to the acquisition of general and civic skills for the less privileged
Level of satisfaction on the quality of learning provision by diversification of supply
and by effectiveness of teaching
• Basic skills (key competences): the relevant needs for statistical information are
related to respondent’s literacy, numeracy and foreign language skills, ICT skills,
cultural awareness, career management skills, interpersonal and social skills,
entrepreneurship, science and technology as well as skills acquired at the workplace
or in social/cultural environment. An indicative of policy relevant indicators can be the
following:
Self perceived level of basic skills by type of skill (literacy, numeracy, foreign
language, ICT use etc)
Self perceived level of management, interpersonal and social skills
Use of acquired skills by type of setting (at the workplace or in social/cultural
environment)
• Innovative pedagogy: The related information needs are respondent’s learning
preferences and learning strategies. An indicative list of indicators is the following:
Participation in learning activities by type of learning preferences (theory/practice,
taught/non-taught, alone/in groups etc)
Participation in learning activities by type of learning strategies (memorization and
relating material to what is already known, learning by doing, listening,
audio/video/computer assisted learning)

10 10
3 Quality assessment of the pilot AES
This chapter presents the quality assessment of the pilot AES based on the national
quality reports submitted to Eurostat. It provides an evaluation of the quality of AES and
highlights the main strengths and weaknesses of the survey.
The assessment is based on 23 quality reports received by the following countries:
Austria, Belgium, Bulgaria, Cyprus, Czech Republic, Germany, Estonia, Greece, Spain,
Finland, France, Croatia, Hungary, Italy, Lithuania, Latvia, Netherlands, Norway, Poland,
Sweden, Slovenia, Slovakia and the United Kingdom.
3.1 Relevance
The first AES was a pilot survey covering a number of variables related to different types
of learning of adults across Europe. Lifelong learning is considered to be an interesting
subject at both European and national level. One of its main objectives is to provide
valuable input for the evaluation of the current status and the further development of
national policies in this field. In addition, AES data are useful for the planning of research
projects that could strengthen adult learning.
The AES in all the participating countries focused on the following parameters:
o Participation in different types of learning (formal/non-formal/informal
learning), including breakdown by field of learning
o Non-participation and obstacles to participation in training
o Share of the job related non-formal education and training
o Volume of instruction hours spent on formal/non-formal learning
o Employer financing and costs of learning in formal/non-formal education
o Module on language and ICT skills of the population
o Module on social and cultural participation of the population
All variables included in the AES manual were used with the exception of a few countries
that omitted the questions on participation in political and religious activities. In some
cases, there were also additional questions of interest at national level.
The main domains for which countries estimated parameters were sex, age groups, main
current labour status and highest level of education completed. Some countries also
included other domains, like the degree of urbanisation, the region, the occupation, the
breakdown into national/non-nationals and the parental educational level.
With reference to the users of AES data we distinguish three classes, as it is shown in
Table 3-1.

11 11
Table 3-1. Users of AES data
Classification of user Description of user
European level The European Parliament, Council and Commission
Multi-national organisations OECD, ILO, IMF, UN
National Government, Ministries of Education,
Employment, Economics and National Institutions
Employers associations, trade unions, social partners
Media of all kinds
National level
Universities, researchers and students
Countries reported that the guidelines proposed in the AES manual were thoroughly
discussed with the main users aiming at the development of a high quality questionnaire
at national level. With reference to the variables covered in the questionnaire, users
expressed their interest in better estimation of the number of persons participating in
educational activities, the average time spent on these activities as well as the reasons
for not participating.
No user satisfaction survey was carried out, and thus, there is no information on this
aspect. Most countries perceive that at this time there is no sufficient feedback received
by users. Therefore, their plans for improving / changing the survey are only limited to
minor changes in the implementation. However, it is mentioned that the comparability
of collection procedures over time should be considered.
3.2 Accuracy
In the pilot AES countries used different sampling designs. The most common method
was a two or three stage stratified sampling. The following designs were reported:
- Simple random sampling (Latvia and Slovakia)
- Stratified random sampling (Austria, Belgium, Cyprus, Estonia, Finland, Hungary,
Sweden and the United Kingdom)
- Multi-stage stratified sampling (Bulgaria, Croatia, Czech Republic, France,
Germany, Greece, Italy, Latvia, Netherlands, Norway, Poland, Slovenia and Spain)
We also mention that in four countries (France, Greece, Hungary and the Netherlands)
the selection of the sample was made within the national LFS following the procedure
implemented for that survey.
The variables used for the stratification of the population were mainly age, sex, region
and degree of urbanisation. The sampling units were either the individuals or the
households / dwellings in random sampling and in cases of multi-stage designs the
households were used as primary sampling units in which the selection of individuals
was randomly made.

12 12
The target population for the AES was all individuals aged 25 to 64 years old who were
permanent residents in the country and lived in private households. Some countries also
covered additional age groups for their national AES. These countries were Estonia (20
to 64), Finland (18 to 64), France (15 to 64, 15 to 24 having completed their initial
education), Germany (19 to 80) and Norway (22 to 66).
Table 5-1 in the Appendix of this document presents the target population (expressed in
number of individuals) in each country broken down in three age groups, where
available.
3.2.1 Sampling Errors
Table 3-2 presents the estimates and confidence limits for participation rates in formal,
non-formal and informal education. The calculations of intervals presented in the table
are made on the basis of the AES microdata provided to Eurostat (assumption simple
random sample) and are therefore not taken from the quality reports.
Overall, participation rates in 'Formal Education' activities are low, starting from 2.3%
in Greece and reaching 15% in the United Kingdom on average. Participation rates
reported in 'Non-Formal Education' are larger than those reported for ‘Formal
Education’ in all countries. High participation rates are also reported in 'Informal
Education'. With regard to the confidence intervals of the estimates, we notice that in
most countries the standard deviation for the estimates of 'Formal Education' is below 1
showing that the figures provided are accurate enough. Standard deviations are
somehow larger for the estimates of the other two types, indicating more uncertainty in
the estimated figures. The greatest standard deviations have been reported by Latvia,
Norway and the United Kingdom.
Table 3-2. Confidence Intervals1 for participation in the three types of learning in the pilot AES
Participation rate (%)
Country Formal education
Non-Formal
education
Informal
education
Austria 4.2 ± 0.6 39.4 ± 1.4 75.7 ± 1.2
Belgium 12.5 ± 0.9 33.5 ± 1.3 34.9 ± 1.3
Bulgaria 2.7 ± 0.4 35.2 ± 1.3 28.0 ± 1.2
Croatia 4.5 ± 0.7 18.4 ± 1.4 44.6 ± 1.8
Cyprus 2.9 ± 0.5 39.5 ± 1.4 63.6 ± 1.4
Czech
Republic 3.9 ± 0.4 35.3 ± 1.0 54.7 ± 1.0
Estonia 5.0 ± 0.7 40.2 ± 1.6 44.8 ± 1.6
Finland 10.2 ± 0.9 51.2 ± 1.5 54.6 ± 1.5
France 1.7 ± 0.2 34.1 ± 0.7 63.8 ± 0.8
Germany 5.2 ± 0.5 43.1 ± 1.2 52.4 ± 1.2
Greece 2.3 ± 0.4 12.7 ± 0.8 20.7 ± 1.0

13 13
Participation rate (%)
Country Formal education
Non-Formal
education
Informal
education
Hungary 2.5 ± 0.4 6.8 ± 0.6 26.2 ± 1.0
Italy 4.4 ± 0.2 20.2 ± 0.5 41.2 ± 0.6
Latvia 5.4 ± 0.9 30.7 ± 1.9 53.9 ± 2.0
Lithuania 6.3 ± 0.8 30.9 ± 1.5 45.3 ± 1.6
Netherlands 6.8 ± 0.9 42.1 ± 1.7 _ 2
Norway 9.9 ± 1.1 50.6 ± 1.8 72.3 ± 1.6
Poland 5.5 ± 0.3 18.6 ± 0.5 25.4 ± 0.5
Slovakia 6.1 ± 0.7 41.2 ± 1.4 84.1 ± 1.0
Slovenia 8.7 ± 0.9 36.1 ± 1.6 62.0 ± 1.5
Spain 5.9 ± 0.4 27.2 ± 0.7 28.0 ± 0.7
Sweden 12.7 ± 1.1 69.4 ± 1.5 76.0 ± 1.4
United
Kingdom 15.1 ± 1.2 40.3 ± 1.6 53.7 ± 1.6
1. 95% confidence intervals.
2. The Netherlands used new variables for informal learning, which were totally different from those
suggested in the Model Questionnaire
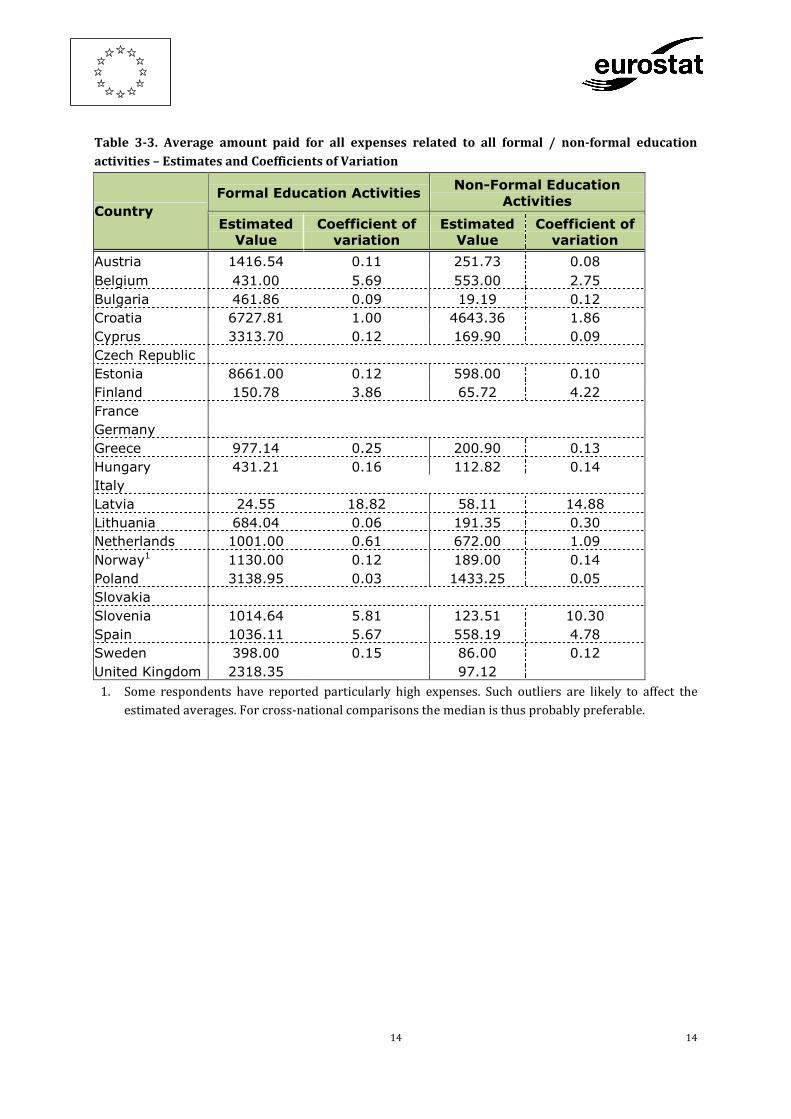
Another indicator of sampling errors is the coefficient of variation (CV). This is defined
as the ratio of the sampling variance of an estimate to its mean.
CV= (Square root of the estimate of the sampling variance) / (Estimated value)
The higher the CV, the greater is the variance of the estimate resulting in high sampling
errors. We present below the estimates and the respective CVs for two variables in the
AES: “Average amount paid by a participant for all the expenses related to Formal and
Non-Formal education activities" and "Average number of hours that were spent by a
participant in all activities of Formal and Non-Formal education".
Table 3-3 presents the estimated values of the "Average amount paid by a participant for
all the expenses related to Formal and Non-Formal education activities". For each
estimate the coefficient of variation is also provided. Coefficients of variation are also
graphically displayed in Figure 3-1. In most countries CVs are quite small (less than 1)
indicating that the variance of estimated values is low. Notable exceptions are Latvia,
Belgium, Finland, Slovenia and Spain where CVs are high for both types of learning.
14 14
Table 3-3. Average amount paid for all expenses related to all formal / non-formal education
activities – Estimates and Coefficients of Variation
Formal Education Activities Non-Formal Education
Activities Country
Estimated
Value
Coefficient of
variation
Estimated
Value
Coefficient of
variation
Austria 1416.54 0.11 251.73 0.08
Belgium 431.00 5.69 553.00 2.75
Bulgaria 461.86 0.09 19.19 0.12
Croatia 6727.81 1.00 4643.36 1.86
Cyprus 3313.70 0.12 169.90 0.09
Czech Republic
Estonia 8661.00 0.12 598.00 0.10
Finland 150.78 3.86 65.72 4.22
France
Germany
Greece 977.14 0.25 200.90 0.13
Hungary 431.21 0.16 112.82 0.14
Italy
Latvia 24.55 18.82 58.11 14.88
Lithuania 684.04 0.06 191.35 0.30
Netherlands 1001.00 0.61 672.00 1.09
Norway1 1130.00 0.12 189.00 0.14
Poland 3138.95 0.03 1433.25 0.05
Slovakia
Slovenia 1014.64 5.81 123.51 10.30
Spain 1036.11 5.67 558.19 4.78
Sweden 398.00 0.15 86.00 0.12
United Kingdom 2318.35 97.12
1. Some respondents have reported particularly high expenses. Such outliers are likely to affect the
estimated averages. For cross-national comparisons the median is thus probably preferable.

15 15
Figure 3-1 Average amount paid for all expenses related to all formal / non-formal education
activities - Coefficients of variation
Table 3-4 and Figure 3-2 present coefficients of variation for the variable "Average
number of hours that were spent by a participant in all activities of Formal and Non-
Formal education". Conclusions are very similar to those drawn for the previous
variable. Overall coefficients of variation are small, with the exceptions of Latvia,
Belgium, Slovenia and Spain.
Table 3-4. Average number of hours spent in all formal / non-formal education activities -
Estimates and Coefficients of Variation
Formal Education Activities Non-Formal Education
Activities Country
Estimated
Value
Coefficient of
variation
Estimated
Value
Coefficient of
variation
Austria 446.71 0.09 83.91 0.03
Belgium 230.00 4.98 114.00 3.83
Bulgaria 582.85 0.05 44.17 0.07
Croatia 251.87 0.93 106.90 1.79
Cyprus 480.90 0.11 56.10 0.04
Czech Republic 380.00 0.09 49.00 0.04
Estonia 443.00 0.08 47.00 0.05
Finland 362.67 1.21 85.82 2.01
France 103.00
Germany
Greece 278.36 0.11 82.94 0.08
Hungary 486.82 0.13 110.25 0.09

16 16
Formal Education Activities Non-Formal Education
Activities Country
Estimated
Value
Coefficient of
variation
Estimated
Value
Coefficient of
variation
Italy 367.00 47.70
Latvia 27.64 16.25 76.52 7.14
Lithuania 358.98 0.06 69.20 0.05
Netherlands 81.00 1.72
Norway 364.00 0.07 78.00 0.05
Poland 416.21 0.03 79.82 0.03
Slovakia
Slovenia 282.03 6.52 48.21 4.64
Spain 412.53 3.71 111.52 3.20
Sweden 524.00 0.05 54.00 0.04
United Kingdom 124.60 41.00
Figure 3-2 Average number of hours spent in all formal / non-formal education activities -
Coefficients of Variation
Finally, as regards data weighting, all countries used data on gender and age in the
weighting process. The following variables were also used as calibration variables: place
of residence (rural/urban area), region (according to NUTS II level), education level,
employment status, and in only few cases nationality (Belgium and Germany),
household size (Belgium) and country of birth (Sweden). Data used for weighting were
mainly taken either from the national LFS or the national population register.

17 17
3.2.2 Non-Sampling Errors
3.2.2.1 Coverage Errors
Coverage errors (or frame errors) are due to divergences between the target population
and the frame population. Their existence depends largely on the quality of the sampling
frame used for the selection of the sample. In the pilot AES countries used various
sampling frames. These are presented in Table 3-5 below.
Most of the countries used a population register, while six countries used the national
data from the latest population Census. The United Kingdom used the Postcode address
file.
Table 3-5. Sampling frames in the pilot AES
Country Sampling Frame
Austria Central Register of Residents
Belgium National Register
Bulgaria Population Census 2001 Register
Croatia Data Base of individual data collected during the Census 2001
Cyprus 2001 census of population and Electricity Authority of Cyprus
Czech Republic Czech census enumeration unit register
Estonia The Population Register
Finland Population database maintained by Statistics Finland
France Population Census 1999
Germany The population register
Greece 2001 census
Hungary 2001 Population and Housing Census
Italy Public register of households
Latvia Central Statistical Bureau of Latvia (CSB) Address Register
Lithuania The Population Register
Netherlands Municipal basic registration of population data
Norway Central Population Register
Poland Register of Domestic Territorial Division
Slovakia Slovak total population, state to 31st December 2005
Slovenia Central Population Register
Spain Spain Official Population Register
Sweden Swedish total population register (TPR)
United Kingdom Postcode address file

18 18
As regards the quality of the sampling frames, some countries mentioned as drawback
the existence of time lag between the starting date of the survey and the date of last
update of the sampling frame. This was more apparent in countries that used their
national census as sampling frames. In these cases, sampling frames may include
persons who have moved, died, migrated, etc. or households that have been pulled
down, temporarily inhabited or converted into non-housing premises since the census
took place.
Countries invented different approaches to overcome problems related to the difficulties
to reach members of the sampling frame. Bulgaria for instance chose to create a bigger
sample to make allowance for ineligible units and ensure the adequacy of the sampling
units. Lithuania reports the use of the nearest birthday rule for replacing persons that
were not longer accessible. Table 3-6 shows the gross sample, the non-eligible and
eligible elements found in the sampling frame. The percentages of eligible elements over
gross sample are presented in Figure 3-3. High percentages are indicative of satisfactory
quality of the sampling frame. Eligibility fractions of households are over 90% for 12
countries out of the 17 countries that have provided this information, while eligibility
fractions for individuals are overall lower, with only 3 countries out of the 11 that
provided this information to reach a fraction over 90%. The lowest eligibility rate has
been reported by Greece, where almost half of the individuals were not eligible for
sampling units.
Figure 3-3. Eligibility fractions (%)

19
Table 3-6. Gross sample, non-eligible and eligible elements in the sampling frame
Number of households Number of individuals
Country Gross
Sample
Ineligible:
Out-of
Scope
Other
Ineligible
Eligible
elements
Gross
Sample
Ineligible:
Out-of
Scope
Other
Ineligible
Eligible
elements
Austria 8500 84 212 8204
Belgium 15000 0 7 14993
Bulgaria 3990 197 326 3467
Croatia 5000 90 898 4012 5000 90 898 4012
Cyprus 7240 294 599 6347
Czech Republic 7800 834 354 6612 11730 846 0 10884
Estonia 5341 141 5200 5341 141 5200
Finland 6442 0 54 6388
France 16197
Germany 17738 958 178 16602
Greece 7704 1579 1915 4210
Hungary 7924 0 0 7924
Italy 24611 5874 369 18368 62474 22721 937 38816
Latvia 4611 8 773 3830
Lithuania 5000 0 527 4473
Netherlands 5440 0 0 5440
Norway 4500 0 71 4429
Poland 25061 4432 1382 19247
Slovakia 5001 0 0 5001
Slovenia 7200 0 161 7039
Spain 20649 29 358 20262 20649 7 946 19696
Sweden 5000 0 78 4922
United
Kingdom 11130 1511 983 8636 11130 1511 983 8636

20
3.2.2.2 Measurement Errors
For most countries AES was a stand-alone survey. In four countries, France, Greece,
Hungary and the Netherlands, the AES was an ad-hoc module of the national LFS. Italy
carried out the AES as part of "Citizens and their leisure survey".
As regards the data collection method, it was recommended to carry out CAPI
interviews. This was applied by six countries and partly by five countries. The method
used in each country is shown in the table below.
Table 3-1. Data collection method in the pilot AES
Data collection method Country
PAPI Austria, Bulgaria, Croatia, Czech Republic, Greece, Hungary,
Italy, Latvia, Lithuania, Poland, Spain
CATI + CAPI Norway, Slovakia, Slovenia, Sweden
CAPI + PAPI Netherlands
PAPI + web survey Belgium
CAPI Cyprus, Estonia, Finland, France, Germany, United Kingdom
A factor that may cause measurement errors is proxy interviews. In these interviews the
information collected for the respondent is taken from another person that answers the
questionnaire instead of the respondent. Allowing proxies can reduce costs since the
interviewer may collect the data right away rather schedule a return trip to speak to
every person in the household. On the other hand, interviewing through a proxy can lead
to inaccurate responses and thus, is not recommended.
Proxy interviews were not allowed in most of the countries. Exceptions were five
countries that reported the following proxy rates: Greece (22.9%), Italy (10%), the
Netherlands (allowed only in CAPI, 22%), Poland (15.6%) and Slovenia (allowed only in
CAPI - no estimation given on proxy rate).
Problems with the definitions and implementation of the CLA concepts
Most countries stressed the difficulty in distinguishing among the concepts of formal,
non-formal and informal learning, the difficulty in understanding the concept of the
guided on-the-job training as well as problems in defining certain types of education
activities such as astrology, yoga, tango (dance) etc.
Although no proposed solutions were required for this section, some countries provided
relevant suggestions that were implemented at national level, e.g. the inclusion of
seminars and workshops in informal learning for the British survey.

21
Some of the suggested solutions were more general focusing on the training of the
interviewers and particularly giving emphasis in studying the fields of education and
training before the interview takes place, while some others were more specific, e.g.
splitting the question on informal learning into two questions as it occurs in the British
questionnaire.
Problematic modules and variables
At first, countries carried out a pilot testing of the survey questionnaire in order to see
the reaction of respondents to the AES survey and identify the points that would need
improvement before the fieldwork. This pilot testing indicated various problems with
the modules and variables of the AES. These mainly concerned difficulty in
distinguishing informal learning from studying, guided on-the-job training from training
that was part of the job, difficulty in remembering self-study time, number of non-formal
activities as well as difficulties in reporting obstacles.
Table 3-7 summarises the problems reported in each section of the questionnaire and in
the survey design as a whole.
Table 3-7. Problematic modules and/or questions in the AES
Section Problematic modules and/or
questions Country
Parental education Hungary, Spain Background
Information Citizenship Latvia
Number of instruction hours in
formal education
Austria, Belgium, Croatia, Latvia,
Poland, Slovenia
Level of formal education Belgium
Cost of formal education activities Belgium Formal
education Distinguishing costs of exam fees,
tuition etc. from the cost of books,
technical study means etc.
Norway
Number of instruction hours in non-
formal education
Austria, Belgium, Bulgaria, Croatia,
Finland, Latvia, Poland, Slovenia,
Spain
Certificate of a non-formal activity in
education and training Austria, Cyprus
Number of non-formal education
activities Greece
Distinguish between guided on the
job training and learning from a
colleague
Latvia, Lithuania
Field of the third randomly selected
activity Sweden
Guided on-the-job training from
other forms of planned learning
activities at work:
Norway
Separating guided on-the-job training
from random learning at work Norway
Non-formal
education
Type of non-formal education
activities Greece

22
Section Problematic modules and/or
questions Country
Cost of non-formal education
activities Belgium
Number of travel hours Bulgaria, Latvia, Poland, Spain
Number of time spent at home Poland, Spain
Number of homework hours Bulgaria, Latvia
Provider of non-formal education
activity Cyprus, The Netherlands
Difficulty remembering self-study
time Lithuania
Distinguishing costs of exam fees,
tuition etc. from the cost of books,
technical study means etc.
Norway
Informal
education Informal learning Finland, Spain, Sweden
Obstacles in participation in
education
Austria, Finland, Hungary, Italy,
Slovakia, Cyprus
Use of ICT Austria
Language skills Norway
Level of knowledge of foreign
languages Poland
Level of computer use (literacy) Poland
Modules
Attitudes towards learning Hungary, Spain
Fields of education and training
(post-coding) Austria
Long and complex questionnaire Austria, Bulgaria, Croatia, Czech
Republic, Slovakia, Spain, Sweden
Long reference period: remembering
problems
Bulgaria, Croatia, Czech Republic,
The Netherlands, Slovakia, Spain,
Sweden
Distinction between formal, non-
formal and informal learning
(definition)
Belgium
Face-to-face method of interviewing Croatia
Implementation in a PAPI survey Italy
Post coding of the ISCO/NACE/ISCED Cyprus
Distinguishing between non-formal
and informal learning Latvia
PAPI questionnaire (The choice of
learning activities i.e. three out of
ten)
The Netherlands
Field of education or training Norway
Coding with alphanumeric codes Slovakia
Duration of interview Spain
Others
Access to information about learning
possibilities Spain

23
Several countries proposed specific solutions to such problems which, apart from the
training of the interviewers, involved the questioning of fewer than three formal/non-
formal activities, the exclusion and/or modification of specific modules/questions, the
provision of more detailed explanatory notes to the interviewers/respondents, the
introduction of techniques for calculation of the volume of participation, etc.
3.2.2.3 Processing Errors
Countries applied various checking rules during the data validation to check for
inconsistencies, wrong values, etc. It is mentioned that in countries that carried out the
survey with CAPI method, many consistency and validation errors were avoided during
the interview or eliminated during post data collection process. In many cases,
validation was carried out by running the XTNet-Edit Lite programme recommended by
Eurostat. Overall, most errors were detected in the section of obstacles in participation
in education and training and in the coding of the fields in formal, non-formal education
and training as well as in informal learning.
Open questions in the AES
Many countries included open questions in their questionnaires. These questions
concerned the following variables:
○ Country of birth (except for Estonia),
○ Highest level of education or training successfully completed,
○ Level of education higher than mentioned before but abandoned,
○ Economic activity,
○ Occupation now and one year ago,
○ Parental education and occupation,
○ Level and field of formal education,
○ Field and provider of non-formal activity,
○ Field of informal learning activity,
○ Reasons for not participating
○ Most important subjects learned by informal learning
○ Language knowledge (mother tongue, languages that respondent knows the best).
Questions including response "other"
Countries indicated the questions for which the category “other” was often chosen by
respondents. The variable with the highest rate of respondents answering “other”
referred to the reasons for not participating in training. Countries reported that there
were significant numbers of other reasons that were not included in the list provided in
the questionnaire. The most common reason was connected to the lack of time due to
job-related responsibilities. The variable “Training conflicted with your work schedule",
which may be considered relevant to the above reason, was found too specific and thus,
was not identified by the respondents. Other reasons for not participating concerned
family responsibilities and health/age status.

24
Another variable where the category “other” was often indicated concerned the provider
of the “Non-Formal” activity. Respondents often found it difficult to assign the provider
to the categories offered. According to Germany, this problem will not be solved by
additional categories because the existing categories are fairly abstract and cannot
easily be assigned to concrete providers.
Finally, the list of language codes to be used in the micro data sent to Eurostat should be
extended. The reason is that currently too many important languages end up in the
"other" category.
3.2.2.4 Non-response Errors
Non-response is the failure of a survey to collect data on all survey variables, from all the
population units designated for data collection in a sample or complete enumeration.
The difference between the statistics computed from the collected data and those that
would be computed if there were no missing values is the non-response error.
There are two types of non-response, unit and item non-response. The first occurs when
not all individuals of the gross sample (i.e. the initial sample drawn from the reference
sampling frame) participate in the survey and are thus not included in the net sample.
Item non-response occurs when a respondent provides some, but not all, of the
requested information, or if the reported information is not useable.
Unit non-response
The reasons for unit non-response are mainly:
○ Non-contact: No one was home or the postal survey was never sent back. High
number of non-contacts is caused by the poor quality of sampling frame since for a
large number of persons the address provided in the Population Register is
incorrect.
○ Refusal: Selected household or individual was contacted but refused to take part in
the survey.
○ Inability to Response: Selected household or individual was unable to participate
due to language barriers or cognitive or physical incapacity to respond.
○ Rejected interviews: The selected household/individual did take part but the
survey form cannot be used due to poor quality or very high item non-response.
Table 5-2 in the Appendix of this document presents the number of non-response units
by type of non-response. “Non-contact” and “Refusal” appear to be the main reasons for
unit-non-response. Notable exception is the Czech Republic where most of the non-
response cases concerned rejected interviews.
Figure 3-4 shows the response rates in the pilot AES for households and individuals.

25
Figure 3-4. Response rates in the pilot AES
Response rate in six countries (Bulgaria, Czech Republic, Greece, Spain, Hungary and
Lithuania) exceeds 80% for both households and individuals. The highest rate (95%) is
reported in Spain (for households) and Hungary (for individuals). On the other hand,
Belgium and the United Kingdom have the lowest response rates which are close to 30%
and 40% respectively.
Minimising unit non-response
Countries made significant efforts to minimise unit non-response and thus, improve the
quality of the survey. The most common measures taken in this direction were the
following:
(1) Training of interviewers: rigorous training of interviewers, repeated emphasis on
the importance of high response rates in courses and briefings, frequent feedback
to interviewers about their own performance and that of the survey, continuous
support and progress chasing of interviewers from operations staff, an interviewer
payment scheme rewarding high response rates, extra time of fieldwork in case of
low response rates.

26
(2) Contact with respondents before the interview: the selected individuals were
contacted by mail/phone/visits. Respondents were informed about the purpose of
the survey, the mode of interview and how they could prepare themselves for it,
confidentiality issues and the users of AES statistics. By contacting respondents,
the time of the interview was also arranged.
(3) Numerous visits to respondents before reporting them as non-contact.
3.3 Timeliness and Punctuality
Table 3-8 shows the timeline of the pilot AES. Only few countries indicated information
about deviations between real and planned dates of the AES preparation. In most cases
there were no deviations. Only Hungary, Latvia, Norway and Slovakia reported
difference of maximum 2-4 months mainly as a result of human resources problems.
Table 3-8. Timeline of the pilot AES
Country Pilot testing Fieldwork Processing Data delivery
to Eurostat
Austria 02-03/2007 04-11/2007 12/2007-05/2008 28/07/2008
Belgium 10-11/2007 02-06/2008 05-10/2008 01/2009
Bulgaria 05/2007 11-12/2007 02-05/2008 05-06/2008
Croatia 10/2007 12/2007 01-10/2008 11/2008
Cyprus 11-12/2005 09-12/2006 09/2006-06/2007 07/2007
Czech Republic 10/2007 01-03/2008 04-07/2008 07/2008
Estonia 10-11/2006 09-12/2007 01-04/2008 22/04/2008
Finland 06/2005 03-08/2006 04/2006-07/2007 31/05/2007
France 06-10/2005 01/2006-01/2007 02/2007-02/2008 02/2008
Germany 01/2007 03-07/2007 07/2007-04/2008 09/04/2008
Greece 03/2007 10-12/2007 10/2007-02/2008 21/02/2008
Hungary 04-05/2006 07-09/2006 10/2006-05/2007 05/2007
Italy no pilot testing 05-08/2006 09/2006-07/2007 07/2007
Latvia 02-03/2007 05-06/2007 07-08/2007 30/08/2007
Lithuania no pilot testing 03-04/2006 05-10/2006 10/11/2006
Netherlands - 02-04/2008 05-08/2008 03/2009
Norway 02-03/2007 05-08/2007 07-11/2007 03/2008
Poland 05/2006 10-12/2006 10/2006-05/2007 12/07/2007

27
Country Pilot testing Fieldwork Processing Data delivery
to Eurostat
Slovakia 02-03/2007 08-09/2007 10-12/2007 12/2007
Slovenia 10/2006 09-12/2007 01/2008-01/2009 06/2009
Spain 03/2006 02-04/2007 06-10/2007 11-12/2007
Sweden 05/2005 10/2005-03/2006 01-12/2006 01/2007
United
Kingdom 08/2005 10/2005-02/2006 12/2005-04/2006 07/2008
3.4 Accessibility and Clarity
Almost all of the countries have published or plan to publish basic results and key
methodological information on websites of national statistical institutes. Access to AES
microdata is possible for all interested researchers upon request. In addition,
methodological information and instruction to users is also available. Finland and Latvia
considered also the organisation of seminars and demo sessions that would inform
users about AES and the outcomes of the survey.
Most countries provided additional information along with the national quality report.
This information mainly included the AES results predefined by Eurostat, the national
questionnaire and the instructions given to interviewers.
3.5 Comparability and Coherence
3.5.1 Comparability / Deviations from the AES recommendations
Differences between national survey design and AES recommendations were reported
by several countries. Greece, Hungary, Italy, Latvia, Lithuania, Poland and Slovakia used
for data collection the face-to-face interviews with PAPI questionnaire as an
interviewing method instead of the recommended CAPI. Norway and Sweden collected
AES data by mixed CATI and CAPI method. Finally, the AES in France included a lot of
open coded variables that required post-coding.
As regards the reference period, most countries followed the AES recommendations and
defined this to be last 12 months prior to the date of the interview. This applied to most
variables in the AES questionnaire. Notable exception is the Netherlands, where the
reference period for Formal education activities was 4 weeks prior to the interview,
since these data were obtained from the LFS. For questions related to parental
education and occupation, the reference period was the time when the respondent was
young teenager (around 14 years old). In addition, some background variables refer to
the situation at the date of the interview.

28
3.5.2 Coherence
The pilot AES may be compared with the Long Life Learning module (LLL), carried out
in 2003, as part of the Labour Force Survey. We present below a comparison study
between the AES and the LFS prepared by Eurostat in 2009.
Main conclusions
Analyses of the AES results from the first 18 countries indicate systematically higher
rates of participation in almost all the countries in the AES than the LLL-2003 and the
LFS 2006. Difference in participation rates seems to be higher in non-formal than in
formal education and training. Countries with high participation rates have
comparatively lower differences in participation between AES and LLL-2003. Countries
with high levels of participation in the LLL-2003 also had high levels of participation in
the AES and countries with low participation in LLL-2003 were among countries with
low participation rates in the AES.
Looking at the metadata information of the two surveys we can find explanations on the
reported differences. The AES surveys were in many countries stand-alone surveys,
proxies were not allowed in most cases, questions were well structured, survey
variables were defined and interviewers better trained. Apart from this there is also a
reference period difference between the AES and the LFS. The AES and the LLL-2003
have 12 months reference periods while the LFS has 4 weeks reference period.
One of the factors that has been analysed is the coverage of non-formal activities in the
AES and the LFS. The AES covered: private lessons or courses, distance/open learning,
seminars/workshops and guided on the job training. AES activities were dominated by
private course/lessons but a considerable proportion took part in guided on-the-job-
training.
Guided on the job training is not specified in LFS and the AES data have been analysed to
determine the impact of guided on the job training on the participation rates in AES.
Results show lower participation rates in the AES when guided on the job training is
excluded. The generated rates/results are similar to the LLL-2003 (same reference
period) in a number of countries though significant differences still exist for other
countries.
Conclusion from the analyses of the available data indicates that results of the AES are
higher than results from other surveys in lifelong learning mainly because of the
differences in reference periods and the coverage of learning activities particularly
guided on the job- training. The AES also have courses with short duration that would
not have been included in the LFS. The minimum duration for formal education in the
UOE1 and LFS is one semester or half-year of studies. There is no such minimum
duration in the AES.
1 UOE stands for UNESCO Institute of Statistics/OECD/Eurostat data collection on education systems
29
Explanatory notes on differences between the AES and the LFS
Information from the data available so far shows systematic higher rates of participation
in education in the AES compared with other similar surveys including the 2003 LFS ad
hoc module, the LFS structural indicator, and data from the UOE. The differences appear
not only aggregated levels but also within variables and sub-groups. Data from the Adult
Education survey cannot be directly compared with other life long learning data from
the LFS and ad hoc modules. There are significant methodological differences that
account for the disparity in participation rates.
In the following sections we compare the data from the LFS 2006 (including the ad-hoc
module of 2003), the AES and the UOE 2006 for formal and non-formal education.
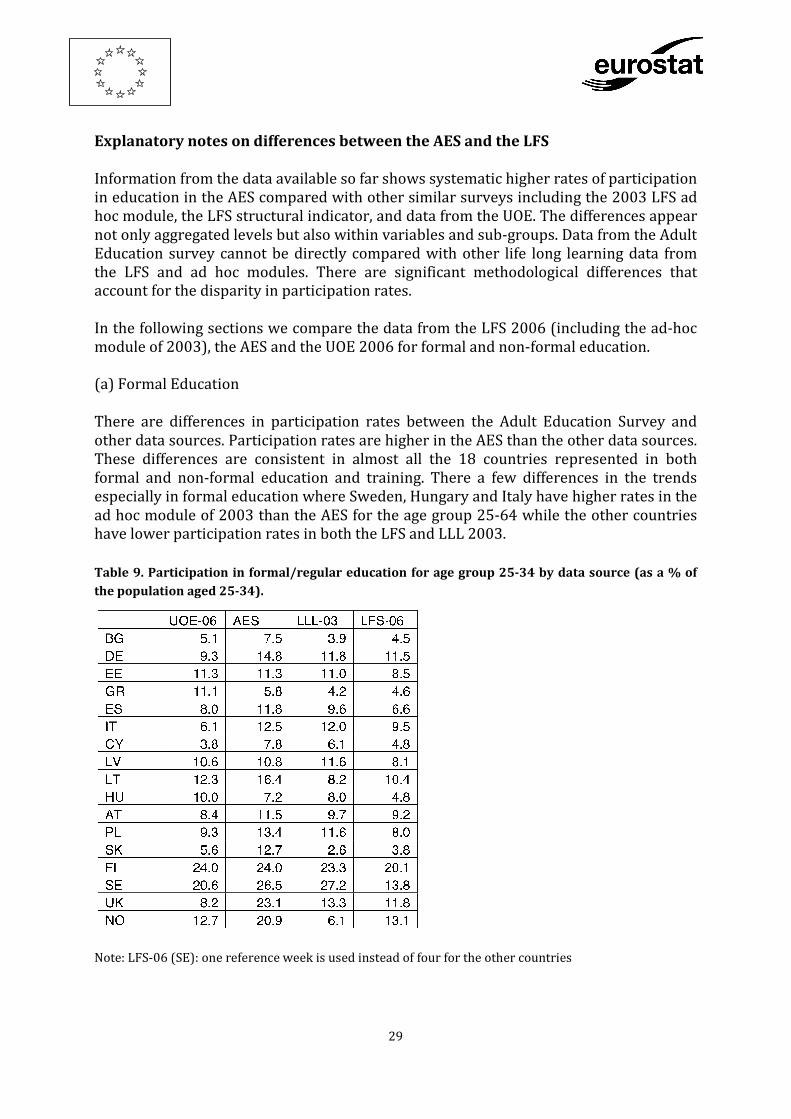
(a) Formal Education
There are differences in participation rates between the Adult Education Survey and
other data sources. Participation rates are higher in the AES than the other data sources.
These differences are consistent in almost all the 18 countries represented in both
formal and non-formal education and training. There a few differences in the trends
especially in formal education where Sweden, Hungary and Italy have higher rates in the
ad hoc module of 2003 than the AES for the age group 25-64 while the other countries
have lower participation rates in both the LFS and LLL 2003.
Table 9. Participation in formal/regular education for age group 25-34 by data source (as a % of
the population aged 25-34).
Note: LFS-06 (SE): one reference week is used instead of four for the other countries

30
There are a few significant cases in age group 25-34 where other sources or surveys
have higher participation rates than AES. In Hungary both the UOE and LLL-2003 are
higher than AES, in Latvia LLL-2003 rates are higher than AES, in Greece the UOE rates
are higher and in Estonia the rates for AES and UOE are the same. Estonia is also the
country with the most even distribution of participation rates in all the 3 data sources.
(b) Non-Formal Education
Participation in non-formal education and training has the same trend as formal
education in terms of difference in participation rates in the AES and the LLL-2003
though the differences are much higher. There are systematically higher rates of
participation in all the countries in the AES than the LLL-2003 and the LFS 2006 with a
shorter reference period (4 weeks). Countries with high participation rates like UK,
Norway, Finland and Sweden seem to have comparatively lower differences in
participation between AES and LLL-2003.
Table 10. Participation in non-formal education and training by type of survey (as a % of the
population aged 25-64).
It is important to note however that countries with high levels of participation in the
LLL- 2003 also had high levels of participation in the AES and countries with low
participation in LLL-2003 were among countries with low participation rates in the AES.

31
Possible explanatory factors
(a) Characteristics of the surveys
In an attempt to find the differences between the participation rates in AES and other
surveys and data sources, we begin first by comments offered by the National Statistical
Institutes in the quality reports. All the countries acknowledge the differences and
consistently higher rates of participation in the Adult Education Survey. The NSIs
concentrated their explanations on mainly structural factors like the interview methods,
type of survey, proxy answers, training of interviewers, questionnaire, definitions of
variables and types of learning activities, reference periods. According to the quality
reports part of the explanation for the high AES participation rates can be accounted for
by the fact that most of the AES surveys were stand- alone surveys, proxies were not
allowed in most cases, questions were well structured, variables were defined and
interviewers better trained.
These factors can however not explain or provide all the answers for the differences in
rates of participation. A second way of trying to find possible causes is looking at the
coverage of the learning activities in the Adult Education Survey and the Labour Force
Survey.
(b) Coverage of Learning Activities
In this section we would attempt to look at the coverage of learning activities in both the
Adult Education Survey and the Labour Force. The definition of formal education and
training is basically the same and expected to cover the same types of formal learning
activities. The duration of these activities would however be significant in mapping out
the differences in the two types of surveys. The main focus here will be to determine
whether the AES has a comparatively high share of short duration courses (5-10 hours
duration).
For non-formal activities, guided on the job training has been identified as one of the
factors that need further investigation and analysis in explaining the differences in
coverage between the two surveys.
Non-formal education and training activities:
Non-formal education and training activities in the AES are categorised into the
following types of activities:
� Private lessons or course
� Distance education
� Seminars/workshops
� Guided on the job training
The next table shows the participation rate among the non-formal education and
training participants by type of activity.

32
Table 11. Participation in non-formal education and training by type of activity (as a % of the
population participating in non-formal learning activity, age 25-64), AES-2007.
The next table shows the participation in non-formal education and training by type of
activity. The reference population consist of the total participants in non-formal
education and training and not of the full target population of the AES. The results show
that a large share of the participants took part in private lessons and
seminar/workshops. Almost 90% of participants in UK had private lessons or courses
and this is closely followed by Finland, Sweden, Austria, France and Germany.
Seminars and workshops is the second largest category and here Sweden Latvia and
Austria dominate with participation rates above 50% each. A considerable proportion is
found in the category of guided on the job training especially in Slovakia, Bulgaria and
Poland.
Distance and open learning/education has the lowest values but a distinction from the
trend is UK where a quarter of all participants in non-formal education took part in at
least one open/distance learning activity.
Guided on the job training
Participants in non-formal education and training can be categorised by the type of
guided on the job training. The three main categories are those who took part in only
guided on the job training, those who did not take part in guided on the job training and
the rest whose activities are both guided on the job training and other activities.
33
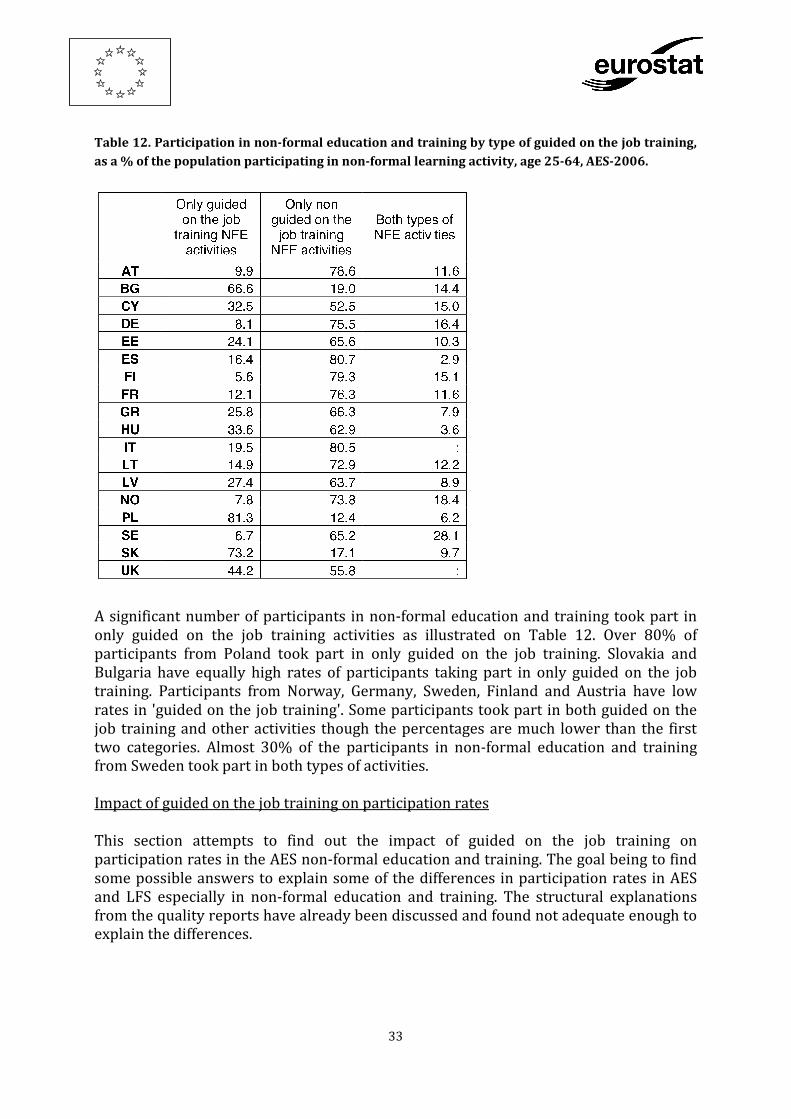
Table 12. Participation in non-formal education and training by type of guided on the job training,
as a % of the population participating in non-formal learning activity, age 25-64, AES-2006.
A significant number of participants in non-formal education and training took part in
only guided on the job training activities as illustrated on Table 12. Over 80% of
participants from Poland took part in only guided on the job training. Slovakia and
Bulgaria have equally high rates of participants taking part in only guided on the job
training. Participants from Norway, Germany, Sweden, Finland and Austria have low
rates in 'guided on the job training'. Some participants took part in both guided on the
job training and other activities though the percentages are much lower than the first
two categories. Almost 30% of the participants in non-formal education and training
from Sweden took part in both types of activities.
Impact of guided on the job training on participation rates
This section attempts to find out the impact of guided on the job training on
participation rates in the AES non-formal education and training. The goal being to find
some possible answers to explain some of the differences in participation rates in AES
and LFS especially in non-formal education and training. The structural explanations
from the quality reports have already been discussed and found not adequate enough to
explain the differences.

34
The coverage especially the impact of guided on the job training therefore is important
in the search for answers. One of such attempts consist in separating guided on the job
training from the population of the non formal participants to ascertain participation
levels. This new level will be compared to participation rates from other sources like the
LLL-03 and LFS-06.
Earlier tables presented illustrate the differences between the various sources of data
on non-formal education and training. The AES, the LFS ad hoc module 2003 (with 12
months reference) period, as well as LFS 2006 (4 weeks reference period).
Table 13. Participation in non-formal education and training by data source as a % of the
population aged 25-64.
Table 13 shows participation in non-formal education and training by the various
sources of data. The second category (AES_adjusted) is AES rates without guided on the
job training. It is evident from the table that differences still exist between the AES and
the other sources of data. The AES rates without guided on the job training is however
lower and much closer to the LFS 2003 ad hoc module rates.
Some countries have much closer rates for the two surveys when guided on the job rates
are excluded. Cyprus (20.7, 20.6), Finland (40.6, 41.3), Hungary (4.2, 4.8), Sweden (45.3,
48), Norway (37.4, 32.9).
Excluding guided on the job training gives a much lower participation rates for AES and
more comparable with the LFS especially the 2003 ad hoc module. This however does
not explain all the differences but gives us a good start in understanding the differences
between the two surveys.

35
(c) Other Factors
Other factors would have to be investigated and analysed to get other explanations for
the differences. Among others are the duration and intensity of activities (short, long
courses) and distribution of job-related and non job-related participation between the
two surveys. The fields of education will also be looked into.
(d) Concluding Remarks
Conclusion from the analyses of the available data indicates that results of the AES are
higher than results from other surveys in lifelong learning mainly because of the
differences in reference periods and the coverage of learning activities particularly
guided on the job- training. The AES also have courses with short duration that would
not have been included in the LFS. The minimum duration for formal education in the
UOE and LFS is one semester or half-year of studies. There is no such minimum duration
in the AES.

36
3.6 Overall Assessment
Adult Education Survey provides valuable information on the different types of learning
that is intended to be used for the further development of national and European
policies in this field. The first implementation of the survey highlighted the importance
of the AES data, as most of the information provided is not available in other sources.
Most countries regard the overall quality of the pilot AES as good. Satisfactory
timeliness, efficient data accessibility to users as well as comparability of national
figures between countries are considered to be the most important strengths of the
survey.
Countries perceive the accuracy of the AES as good but also identify room for further
improvement. Most countries report low sampling errors and sampling frames used for
the survey are in most cases of satisfactory quality. However, countries identify that the
main drawback of sampling frames is the time gaps between the last update of the
registers / date of census and the starting date of the survey. Response rates are high
but some countries expressed their concerns about the decline in response rates
compared to previous implementations of their national surveys.
The main weakness of the AES is the long questionnaire. Many countries consider that
there are too many variables included in the questionnaire that result in high response
burden. In addition, some of the survey concepts are confusing and thus, there is the
need for better definitions and detailed guidelines on the survey variables. Also, some
questions could be reformed and more categories could be added in order to avoid
misunderstandings and item non-responses.
Moreover, the reference period recommended for most of the variables in the AES is
considered to be long. Many countries reported that it was very difficult for respondents
to recall all the activities they participated in the last twelve months and in the detail
required by the AES questionnaire (fields of training, number of hours, providers, etc.).

37
4 Implementation and cross country comparability in
the pilot AES
Eurostat developed a model questionnaire and a manual with guidelines in order to
facilitate countries in the implementation of the survey. The manual consists of the
following sections:
o Description and explanatory notes (comments) of the variables and questions to be
included in the AES together with their hierarchy - AES questionnaire
o Glossary
o Examples of possible flowcharts for some of the variables and/or questions
o Precision requirements for selected indicators
o Code book with the appropriate annexes for coding some of the variables
o Checking rules for the data which should be delivered
o Results of some cognitive tests and pilots
Most countries followed the EU recommendations and provided a harmonised dataset.
However, almost all countries reported problems in the implementation of the pilot AES.
These problems mainly concerned difficulties in the interpretation of the survey
concepts and the definitions of certain variables, including the categories provided for
the variables of the questionnaire.
Detailed discussion of such problems as reported by countries has been provided in
sections ‘Measurement Errors’ and ‘Processing Errors’ of Chapter 3. In summary we discuss
the key issues below.
A factor that may cause measurement errors is proxy interviews, since interviewing
through a proxy can lead to inaccurate responses. Exceptionally high was the percentage
of proxy interviews in Greece, Italy, the Netherlands, Poland and Slovenia. With regard
to problematic modules and problematic variables identified by the countries, these
mainly concerned difficulty in distinguishing informal learning from studying, guided
on-the-job training from training that was part of the job, difficulty in remembering self-
study time, number of non-formal activities as well as difficulties in reporting obstacles.
Most countries stressed the difficulty in distinguishing among the concepts of formal,
non-formal and informal learning, the difficulty in understanding the concept of the
guided on-the-job training as well as problems in defining certain types of education
activities such as astrology, yoga, tango (dance) etc.
Most processing errors were detected in the section of obstacles in participation in
education and training and in the coding of the fields in formal, non-formal education
and training as well as in informal learning.

38
Main results from the pilot AES
In the following paragraphs we present some figures with results from the pilot AES for
key survey variables. This data comparison is used to highlight differences in the
provided data between countries that participated in the first AES and examine the
possibility that these differences could be explained by the wrong interpretations of the
survey concepts / variables or other problems in the survey implementation. Along with
the presentation of data we discuss about possible reasons for the atypical patterns.
The following AES variables are presented in the figures below:
- Participation rate in formal and non-formal education and training
- Job related activities in non-formal education and training by age group
- Reasons for participation in non-formal education and training (the three most
frequesnt reasons reported)
- Non-participation rate in education and training by sex
- Type of obstacles in participation, for respondents who did not participate but
wanted to participate (the three most frequent obstacles reported)
Figure 4-1. Participation rate in formal and non-formal education and training, 2007

39
Comparison of national figures in Figure 4-1 gives an indication that the concept of
formal education is more clearly understood by the majority of the countries contrary to
the concept of non-formal education. While participation rates in formal education for
all countries are close to the EU27 average (6.2%), for participation rates in non-formal
education we observe greater fluctuations from the EU average (31.5%): maximum
percentage reported by Sweden (69.4%) and smallest by Romania (4.7%). These results
could possibly be explained by the difficulties that most countries have reported in
distinguishing among the concepts of formal and non-formal (and informal) learning
and in particular difficulties with the non-formal related questions (Table 3-7).
In the following figure (Figure 4-2) we display the distribution of job-related activities in
non-formal education and training by age group. The question on the job-related
activities in non-formal education and training did not concern guided on-the-job
training. In most countries percentages are higher for the smaller age groups, i.e. 25 – 34
and 35 – 54, compared to the older age group of 55 – 64. This finding is quite sensible
since the younger workforce is usually more motivated than the older one to look for
job-related training opportunities that will help them become better in their job and
improve their career prospects, start their own business, meet new people, etc. This
pattern is however not apparent for a number of countries, like Bulgaria, Czech
Republic, Latvia, Lithuania and Croatia, with the older age group achieving equally big or
larger percentages with the 35 – 54 age group. This finding could possibly be explained
by possible misunderstanding of the concepts ‘job-related activities’ and ‘on-the-job
training’. It is also possible that discrepancies could be attributed to cultural
particularities in these countries.
Figure 4-2. Share of job-related activities in non-formal education and training, respondents from
25 to 34 years, 35 to 54 years and 55 to 64 years (%), 2007

40
With regard to the reasons for participation in non-formal education and training
(Figure 4-3) three are the most popular reasons: ‘To do job better and/or improve
career prospects’ (median value 67.8%), ‘To increase knowledge/skills on an interesting
subject’ (median value 45.9%) and ‘To get knowledge/skills useful in everyday life’
(median value 38.2%). The radar diagram below confirms that this is the order in most
of the countries, with the exceptions of Denmark, Greece, Cyprus, Portugal and the
United Kingdom. It is also worth mentioning the particularities of the United Kingdom
and Slovakia: in the United Kingdom, the share of ‘other reasons’ than those listed in the
relevant question is considerably high (86.1%) while in Slovakia the majority of
respondents (66.1%) participated in non-formal education because they are said to be
obliged to participate.
Figure 4-3. Reasons for participation in non-formal education and training (%), 2007
Note. In this chart we present the three most frequent reasons for participation in non-formal education
and training. Please note that percentages do not sum up to 100% because this was a multiple-answer
question.

41
No apparent trend has been observed for non-participation rates in education and
training between males and females. Although non-participation rates for females are on
average somehow greater than those for males, the difference is very small for the EU
total (1.5% relative difference). Exceptionally large are differences in absolute terms for
five countries: Estonia (18.4%), Latvia (21.5%), Lithuania (16.3%), Finland (32%) and
Sweden (22.2%). It is also impressive that for those countries non-participation rates for
males are higher than those for females. It is also worth mentioning that Greece,
Hungary, Romania and Turkey report considerably high (more than 80%) non-
participation rates.
Figure 4-4. Non-participation rate in education and training by sex (%), 2007
With regard to obtacles in participation in education and training, with which module
six countries (Austria, Finland, Hungary, Italy, Slovakia, Cyprus) have reported
difficulties and problems (see Table 3-7), three are the most commonly reported
obstacles: ‘Training conflicted with the work schedule’ (median value 36.8%),
‘Respondent did not have time because of family responsibilities’ (median value 36.6%)
and ‘Training was too expensive or respondent could not afford it’ (median value
34.2%). Median values reveal that there is no apparent trend in the order of obstacles

42
that respondents have reported. This is also evident in the radar graph in Figure 4-5.
Please also note the particularities of the United Kingdom and Slovakia. The United
Kingdom has reported a very high percentage (56.5%) of other types of obstacles not
listed in the respective question, while for Slovakia most respondents (56.8%) did not
have the prerequisites for participation in such programmes.
Figure 4-5. Type of obstacles in participation for respondents who did not participate but wanted
to (%), 2007
Note. In this chart we present the three most frequent types of obstacles for which respondents did not
participate in education and training although they wanted to participate. Please note that percentages do
not sum up to 100% because this was a multiple-answer question.

43
5 Recommendations for the next AES
With a view to improving the design of the next AES, Eurostat organised various
meetings of the AES working groups in which the shortcomings of the pilot were further
discussed. In addition, there were numerous written consultations with countries
through which they could propose changes in the methodology and the AES technical
documents. These actions resulted in the establishment of recommendations / solutions
that could be applied in future rounds.
We summarise below the suggestions proposed for the improvement of the next AES,
reported from both the users of AES data and the countries participating in the survey.
Most of the recommendations refer to the AES standard questionnaire. As it is already
mentioned in Chapter 3, the questionnaire of the pilot AES was considered to be too
long. The lengthy questionnaire and the difficulties that have been reported in the
interpretation of the survey concepts have resulted in measurement errors that should
be reduced in future rounds.
Topics / Variables to be excluded
The following suggestions aim at the reduction of the length of the questionnaire. They
refer to variables that could be excluded from the model questionnaire because they are
regarded less important for analysis:
o The background questions of labour market situation/status one year before the
survey could be simplified by asking for example the respondents whether the
situation has changed/improved compared with one year before.
o Parent's labour market status could similarly be reduced by excluding the two
questions related to the parent's main occupation.
o Selection of the number of detailed activities should be reduced to one and criteria
should be discussed to replace a random choice, like level of importance to
respondent, volume or duration of activities.
o Obstacles to participation should be separately asked for two instead of four
groups of respondents (i.e. those who took part and those who did not take part in
education and training activities)
It should also be mentioned that apart from the exclusion of some survey variables, most
partners supported the approach of integrating the different social surveys, like the AES,
LFS, and CVTS, to complement each other and thereby avoiding double or overlapping
data collection.
Topics / Variables to be improved
The following list presents variables, already included in the model questionnaire that
could be further improved. The proposed changes concern better definitions of the
survey variables, different formulations of the questions, rephrasing and additions of
follow-up questions that could ensure clarity and comparability of the survey data.

44
o More precise definitions of formal, non-formal education and training and informal
learning.
o Overall consistent terminology in the standard questionnaire. It is recommended
to use the terminology in the sense of EQF (European Quality Framework) concept
like learning, learning outcomes, knowledge, skills and competences.
o Improvement of the educational variables to also include orientation (general and
vocational education and training)
o Tools (computer, internet) and methods (distance learning) used in formal
education should be reconsidered. Most formal educational programmes use these
tools.
o Questions on the types of non-formal education and training should be improved
to ensure clarity and comparability. Translations of these questions should also be
carefully monitored to ensure all countries get the same understanding of the
requirements.
o The present fields of learning in formal education are important but not detailed
enough. For non-formal education, all the fields of classification are not very
relevant.
o Access to information questions should be extended to include 'information,
guidance and counselling services'.
o The level of detail regarding 'income' is insufficient for analysis and should be
extended or improved.
Regarding the improvements proposed in the AES model questionnaire, we present
below some remarks on specific variables / questions, presented separately for each
section of the questionnaire.
(1) Information on the individual
BG10V Orientation of the highest level of education attained
Recommended changes: Restricting the variable to ISCED 2- 4.
BG14V Orientation of the education and training you did not complete
Recommended changes: Restricting the variable to ISCED 2- 4.
SF3V Main occupation of father
Recommended changes: Rewording of the question – "What is the current or last
occupation of your father". This is to incorporate respondents whose fathers/guardians
are deceased or no longer active in the labour market.
SF4V Main occupation of mother
Recommended changes: Rewording of the question – "What is the current or last
occupation of your mother". This is to incorporate respondents whose
mothers/guardians are deceased or no longer active in the labour market.

45
(2) Participation in Education and Training
Eurostat proposes that detailed information should be collected for only ONE activity (the
most recent activity).
FED1V During the last 12 months, that is since <month, year> have you been a
student or apprentice in formal education (full time / part time)?
Recommended changes: Additional question or restructuring the current question to
distinguish between initial and further education
FED3XV Orientation of the most recent education and training
Recommended changes: Restricting the variable to ISCED 4.
FED6XQ Main method of learning in your most recent formal education or
learning activity
Recommended changes: Rewording of the question – "Which of the following forms of
learning and media for learning were used in your most recent formal education or
learning activity (multiple responses)". Restructuring the classifications to avoid
overlapping of the IT related forms of learning. Better wording for the traditional
methods of teaching.
(3) Non-formal education
NFE1
During the last 12 months have you participated in any of the following
activities with the intention to improve your knowledge or skills in any
area (including hobbies)?
NFE1aV Private lessons or courses
NFE1bV Courses, workshops and seminars
NFE1cV Guided on the job training
Recommended changes: Adding a new category to distinguish between courses and
workshops/seminars. The new suggested categories could be the following:
1. Private lessons - 2. Courses - 3. Workshops and seminars - 4. Guided on the job
training
Detailed information concerning selected activities
Recommended changes: Selection of 3 detailed activities.

46
NFE7YV
Does this activity lead to a certificate required (compulsory) by
employer or professional body for the execution of current or planned
activity as employer or employee?
Recommended changes: Introduction of a general introductory question before NFE7.
This question could be formulated as - "Is there a certificate at the end of the training
activity or just a confirmation of attendance" with the following possible answers: 1.
Activity leads to certificate - 2. Only confirmation of attendance - 3. None of the above.
Then, question NFE7YV will be formulated as - "If the activity leads to a certificate, is it
required by employer or professional body for the execution of current or planned
activity as employer or employee" with possible answers 1. Required by employer - 2.
Required by professional body - 3. None of the above.
NFE18YQ Main method of learning in the selected activity
Recommended changes: Rewording of the question – "Which of the following forms of
learning and media for learning were used in <<the name of the activity>> (multiple
responses). Restructuring the classifications to avoid overlapping of the IT related forms
of learning. Better wording for the traditional methods of teaching.
NFE21YV Are you satisfied with the education / training received for <<the
name of the activity>>?
NFE21YQ If no what are the reasons?
Recommended changes: Restructuring of the reasons - NFE21YQ with predefined
categories: 1. Relevance/usefulness - 2. Level of training too low - 3. Level of training too
high - 4. Quality of teaching - 5. Organisation of training (location, materials, classrooms
etc) - 6. Other reasons.
(4) Obstacles to participation in education and training
Recommended changes: Detailed question on obstacles to categories 3 and 4
OB408Q Your health or age
Recommended changes: Additional category to separate age and health

47
(5) Informal learning
INF8 Please list the 3 subjects you taught yourself using those methods
Recommended changes: Change of the wording - "Please list up to 3 subjects you taught
yourself using those methods".
(6) Access to information about learning possibilities
ILP2V From which source did you access information?(mark all that apply)
Recommended changes: Additional category - on line/telephone guidance services
(7) Cultural participation
CA1V
In the last 12 months have you attended any of the following: live
performances (plays, concerts, operas, and ballet and dance
performances), cinema, cultural sites or live sports events?
Recommended changes: A new question separating the various activities in CA1V could
be used - "In the last 12 months have you attended any of the following: 1. Live
performances (plays, concerts, operas, ballet and dance) - 2. Cinema - 3. Cultural sites -
4. Live sports events.
Suggested Topics / Areas to be included
Finally, we present a list of new topics that could be included in the AES model
questionnaire.
o Instead of excluding the modules, it could be considered to include a few questions
covering ICT, language, cultural and social participation.
o Specific suggestions for the adult literacy were provided including questions on
problems with writing and reading at home and work, mathematics problems in
daily life at home an work. Others include the need for more literacy skills and
need to improve reading writing and mathematics skills
o Actions to be taken to facilitate participation, especially in non-formal learning
activities. The policy question is how to make it more attractive, also for those who
declare they did not want more training. This group could hide potential
discouraged participants, and includes 50% of respondents. The question about
obstacles can give an idea of main problems, but it is just a proxy of what could
actually increase participation.

48
o Reasons for dropping out of formal education and not completing non-formal
learning. One main strategic goal of EU policy in education and training is
decreasing early school leaving. Deeper knowledge about perceived obstacles to
the completion educational programmes and non-formal courses could highlight
possible strategies to contrast the phenomenon.
o Outcomes of the learning activity. Outcomes can be considered under two
integrating points of view: in terms of external results of the learning activity
(higher salary, better job opportunities, new job for unemployed) or in terms of
personal opinions (fulfilment of expectations). Here, the distinctions between job
oriented training and other kinds of learning activities would be essential.
o Guidance. It could be better covered expanding the item in "Access to information"
in order to cover a wider range of possibilities as far as choice of course and
support during the course are concerned.
o Recognition. It would be relevant in terms of outcome of the learning activity. It
could be also a tool to monitor the overall effect of programmes for
recognition/certification of skills and competencies acquired through non-formal
or informal learning that have been launched in some EU countries.
o Specific item for the question on "Employment characteristics of the main job". An
item aiming at identifying whether the respondent manage or supervise other
employees could be added.

49
Appendix A
Table 5-1. Target population in the pilot AES (number of individuals)
Target Population
Country Sex 25 - 34 yrs 35 - 49 yrs 50 - 64 yrs Total
Austria Total 1,080,000 2,022,000 1,460,000 4,562,000
Belgium Total 5,652,513
Bulgaria Total 1,141,657 2,127,477 1,026,089 4,295,223
Male 583,553 1,058,997 477,562 2,120,112
Female 558,104 1,068,480 548,527 2,175,111
Croatia Total 2,365,740
Cyprus Total 422,469
Czech Republic Total 6,045,009
Estonia Total 705,976
Finland Total 646,555 2,203,151 2,849,706
Male 331,399 1,105,203 1,436,602
Female 315,156 1,097,948 1,413,104
France Total 31,500,000
Germany Total 45,227,984
Greece Total 6,050,927
Hungary Total 5,567,176
Italy Total 32,657,000
Latvia Total 319,598 492,509 402,315 1,214,422
Male 161,902 239,102 176,995 577,999
Female 157,696 253,407 225,320 636,423
Lithuania Total 1,795,078
Netherlands Total 9,020,870
Norway Total 2,510,364
Poland Total 20,633,817
Slovakia Total 3,006,599
Slovenia Total 305,870 856,358 1,162,228
Male 159,609 434,882 594,491
Female 146,261 421,476 567,737
Spain Total 25,507,487
Sweden Total 4,793,653
United Kingdom Total 31,141,000

50
Table 5-2. Non-response and types of non-response in the pilot AES
Non-Response Non-Contact Refusal Inability to
Response
Rejected
Interviews Other
Country
House
holds
Individ
uals
Househ
olds
Individ
uals
Househ
olds
Individ
uals
House
holds
Individ
uals
House
holds
Individ
uals
Househ
olds Individuals
Austria 3529 2083 1006 71 272 97
Belgium 10143 9867 74 56 76 70
Bulgaria 642 333 307 0 0 2
Croatia 923 923 359 359 364 364 31 31 14 14 155 155
Cyprus 1537 1179 302 56 0 0
Czech Republic 730 1341 343 11 387 1330
Estonia 1615 1615 930 930 654 654 31 31
Finland 2226 563 1570 93 0 0
France
Germany 7555 3360 3765 430
Greece 661 428 233
Hungary 430
Italy 4320 10969 1906 4840 1602 4067 0 0 0 0 812 2062
Latvia 1516 961 321 20 0 214
Lithuania 777 273 445 11 0 48
Netherlands 2114 1346 754 14
Norway 1411 412 879 120 0 0
Poland 5992 795 3317 20 1860
Slovakia
Slovenia 909 1338 114 0 486
Spain 1007 1334 776 683 224 611 7 40
Sweden 1290 810 353 114 13 0
United Kingdom 5108 5108 739 739 3817 3817 445 445 13 13 94 94

51