synthesis, structure, and photophysical properties of ... · 1,2,4-triazole ligands jing-lin...
TRANSCRIPT

S1
Electronic Supplementary Information (ESI)
Synthesis, structure, and photophysical properties of copper(I)
triphenylphosphine complexes with functionalized 3-(2′-pyrimidinyl)-
1,2,4-triazole ligands
Jing-Lin Chen,*abe Xue-Hua Zeng,a Yan-Sheng Luo,a Wan-Man Wang,a Li-Hua He,a Sui-Jun Liu,a
He-Rui Wen,a Shuping Huang,*c Li Liu*d and Wai-Yeung Wong*b
a School of Metallurgy and Chemical Engineering, Jiangxi University of Science and Technology,
Ganzhou 341000, P.R. China
b Department of Applied Biology and Chemical Technology, The Hong Kong Polytechnic University.
Hung Hom, Hong Kong, P.R. China
c College of Chemistry, Fuzhou University, Fuzhou 350116, P.R. China
d Hubei Collaborative Innovation Center for Advanced Organic Chemical Materials, Ministry of
Education Key Laboratory for the Synthesis and Application of Organic Functional Molecules,
School of Chemistry and Chemical Engineering, Hubei University, Wuhan 430062, P.R. China.
e Beijing Synchrotron Radiation Facility, Institute of High Energy Physics, Chinese Academy of
Sciences, Beijing 100049, P.R. China. *Authors to whom correspondence should be addressed. E-mail: [email protected] (J.-L. Chen); [email protected] (W.-Y. Wong);
[email protected] (S. Huang); [email protected] (L. Liu)
Electronic Supplementary Material (ESI) for Dalton Transactions.This journal is © The Royal Society of Chemistry 2017

S2
Fig. S1 1H NMR spectrum of 1 in CD2Cl2.
Fig. S2 1H NMR spectrum of 2 in CD2Cl2.

S3
Fig. S3 1H NMR spectrum of 3 in CD2Cl2.
Fig. S4 1H NMR spectrum of 4 in CD2Cl2.

S4
Fig. S5 31P NMR spectrum of 1 in CD2Cl2.
Fig. S6 31P NMR spectrum of 2 in CD2Cl2.

S5
Fig. S7 31P NMR spectrum of 3 in CD2Cl2.
Fig. S8 31P NMR spectrum of 4 in CD2Cl2.

Fig. S9 1H NMR s
S6
spectra of 3 in CD2Cl2 at 218 K.

F
Fig. S10
Fig. S11 1
31P NMR s
1H NMR sp
S7
spectrum of
ectrum of 2
f 3 in CD2Cl
2 in DMSO-
l2 at 218 K.
-d6 at 298 K
K.

Fig. SS12 Variabble-temperaature 31P NM
S8
MR spectra of 2 in DMMSO-d6 fromm 298 K to 3358 K.

Fig. S13 Variable-temperrature 31P N
S9
NMR spectraa of 4 in CDD2Cl2 from 2298 K to 2118 K.

Fig. S14
Fig. S15
S10
ESI-MS of
ESI-MS of
f complex 1
f complex 2
.
.

Fig. S16
Fig. S17
S11
ESI-MS of
ESI-MS of
f complex 3
f complex 4

Fig. S1
Fig. S
18 TGA cu
S19 The P
S12
urves of com
PXRD patte
mplexes 1‒
ern of comp
4 in N2.
plex 1.

Fig. S
Fig. S
S20 The P
S21 The P
S13
PXRD patte
PXRD patte
ern of comp
ern of comp
plex 2.
plex 3.
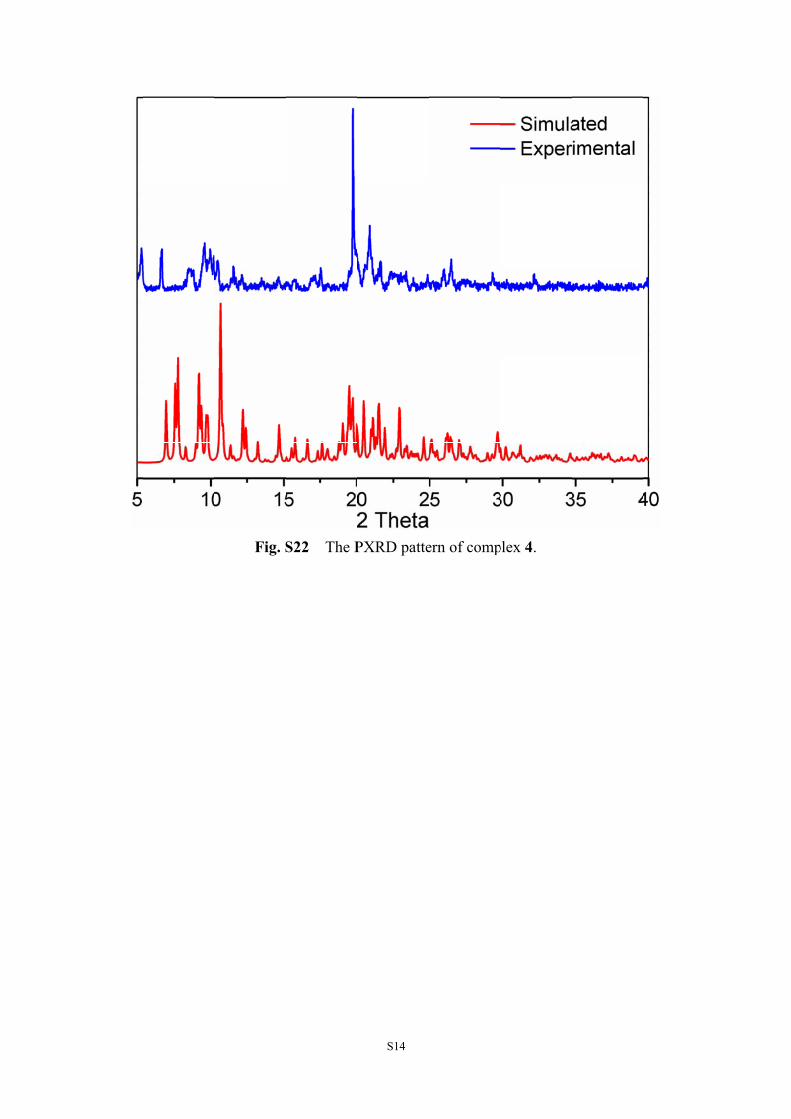
Fig. S
S22 The P
S14
PXRD patteern of compplex 4.

S15
4
3
2
1
HOMO LUMO
Fig. S23 Plots of the frontier molecular orbitals involved in the lowest triplet excited state of complexes 1‒4 based on the T1-optimized structure in CH2Cl2 media calculated by TD-DFT method at the PBE1PBE level (isovalue = 0.02).

S16
Fig. S24 IR spectrum of complex 1.
Fig. S25 IR spectrum of complex 2.
3852.68
3734.92
3431.86
2925.12
1645.74
1570.18
1433.26
1092.11
807.37
748.74
697.17
622.45
510.78
500100015002000250030003500
Wavenumber cm-1
80
85
90
95
100
Transmittance [%]
3852.20
3731.72
3442.51
3055.01
2924.37
2359.02
1634.06
1577.74
1476.86
1434.32
1386.98
1310.42
1100.23
1017.73
808.05
746.04
696.35
622.91
513.06
500100015002000250030003500
Wavenumber cm-1
92
94
96
98
100
Transmittance [%]
S17
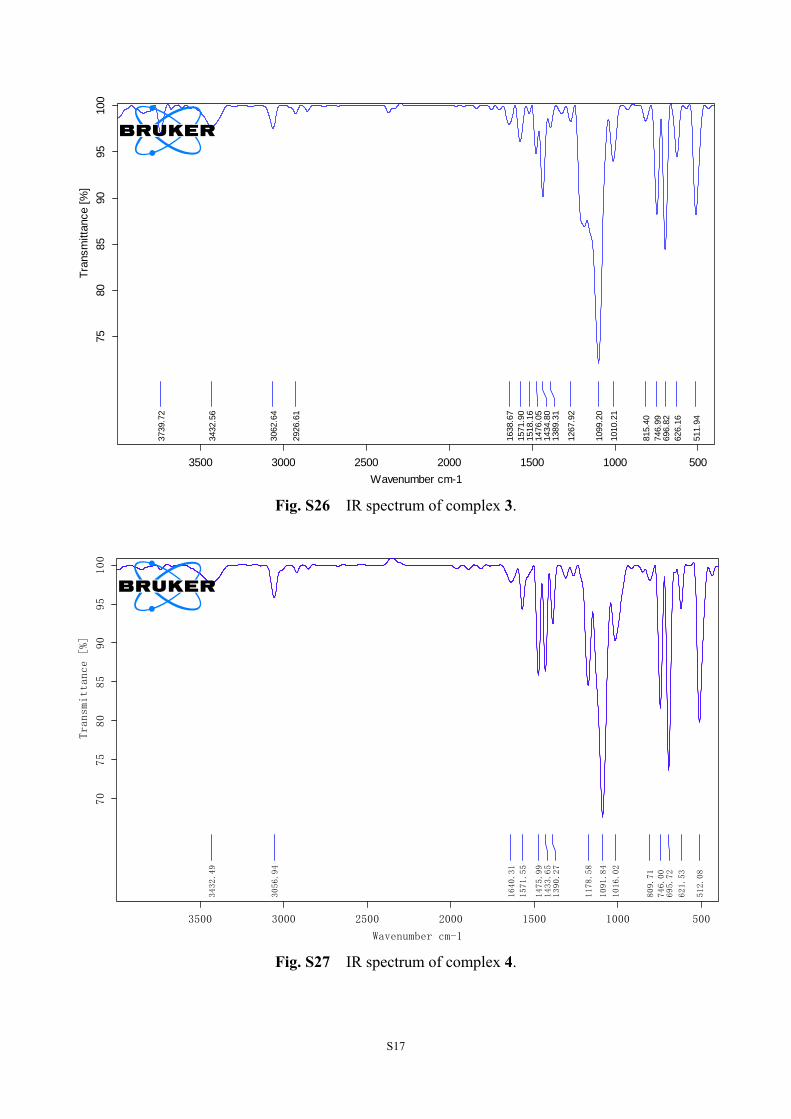
Fig. S26 IR spectrum of complex 3.
Fig. S27 IR spectrum of complex 4.
3739
.72
3432
.56
3062
.64
2926
.61
1638
.67
1571
.90
1518
.16
1476
.05
1434
.80
1389
.31
1267
.92
1099
.20
1010
.21
815.
4074
6.99
696.
8262
6.16
511.
94
500100015002000250030003500Wavenumber cm-1
7580
8590
9510
0Tr
ansm
ittan
ce [%
]
3432.49
3056.94
1640.31
1571.55
1475.99
1433.65
1390.27
1178.58
1091.84
1016.02
809.71
746.00
695.72
621.53
512.08
500100015002000250030003500
Wavenumber cm-1
70
75
80
85
90
95
100
Transmittance [%]
S18
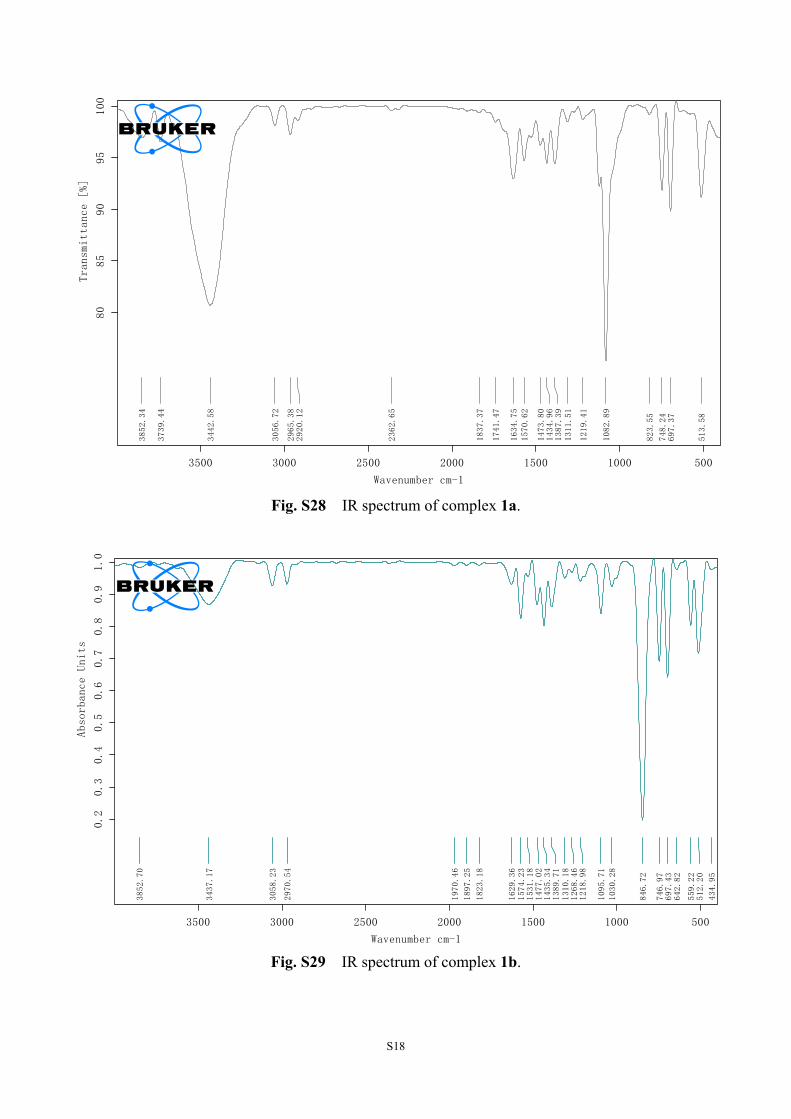
Fig. S28 IR spectrum of complex 1a.
Fig. S29 IR spectrum of complex 1b.
3852.34
3739.44
3442.58
3056.72
2965.38
2920.12
2362.65
1837.37
1741.47
1634.75
1570.62
1473.80
1434.96
1387.39
1311.51
1219.41
1082.89
823.55
748.24
697.37
513.58
500100015002000250030003500
Wavenumber cm-1
80
85
90
95
100
Transmittance [%]
3852.70
3437.17
3058.23
2970.54
1970.46
1897.25
1823.18
1629.36
1574.23
1531.18
1477.02
1435.34
1389.71
1310.18
1268.46
1218.98
1095.71
1030.28
846.72
746.97
697.43
642.82
559.22
512.20
434.95
500100015002000250030003500
Wavenumber cm-1
0.2
0.3
0.4
0.5
0.6
0.7
0.8
0.9
1.0
Absorbance Units

S19
Table S1 Partial molecular orbital compositions (%) by SCPA approach (C-squared population analysis proposed by Ros and Schuit) for 1‒4 based on the S0-optimized structures in CH2Cl2 media calculated by TD-DFT method at the PBE1PBE level Orbital Energy
(eV) HOMO-LUMO
Gap (eV) MO Contribution (%)
Cu P Ph bpmtzH or fpmtzH 1 HOMO
LUMO -6.50 -2.06
4.44 35.12 0.76
19.68 0.00
41.27 1.51
3.93 97.73
2 HOMO LUMO
-6.75 -2.85
3.90 31.97 1.51
18.21 0.62
45.89 1.66
3.93 96.21
3 HOMO LUMO
-6.56 -2.67
3.89 32.35 0.96
18.69 0.23
46.16 0.87
2.80 97.94
4 HOMO LUMO
-6.30 -2.03
4.27 36.80 1.40
20.22 0.39
36.67 3.17
6.31 95.04
Table S2 Partial molecular orbital compositions (%) by SCPA approach (C-squared population analysis proposed by Ros and Schuit) for 1–4 based on the T1-optimized structures in CH2Cl2 media calculated by TD-DFT method at the PBE1PBE level Orbital Energy
(eV) HOMO-LUMO
Gap (eV) MO Contribution (%) Cu P Ph bpmtzH or fpmtzH
1 HOMO LUMO
-5.85 -2.60
3.25 37.67 2.20
20.09 0.32
31.11 1.64
11.13 95.84
2 HOMO LUMO
-5.98 -3.36
2.62 35.64 0.04
22.45 1.97
29.6 5.8
12.31 92.19
3 HOMO LUMO
-5.82 -3.15
2.67 34.37 2.39
24.13 1.33
30.25 1.39
11.25 94.89
4 HOMO LUMO
-5.54 -2.53
3.01 41.01 0.11
21.37 1.76
22.51 5.37
15.11 92.76